Analysis of Environmental Carrying Capacity with Emergy Perspective of Jeju Island


1
Graduate School of International Agricultural Technology, Seoul National University, Pyeongchang 25354, Korea
2
Institute of Green Bio Science Technology, Seoul National University, Pyeongchang 25354, Korea
*
Author to whom correspondence should be addressed.
Sustainability 2018, 10(5), 1681; https://doi.org/10.3390/su10051681
Submission received: 22 March 2018
/
Revised: 17 May 2018
/
Accepted: 17 May 2018
/
Published: 22 May 2018
Abstract
:Jeju Island experienced an approximately 42% increase in energy consumption from 2006 to 2015 and the demand for energy consumption is expected to continue to increase. Thus, Jeju Island is planning a project entitled “Carbon Free Island by 2030” to promote sustainable development and is required to estimate the environmental carrying capacity for future energy demand changes. The purpose of this study was to calculate the emergy inherent in Jeju Island’s energy, materials, and information in 2015 using the emergy analysis method and local characteristics. In addition, this study aimed to estimate the emergy indices to evaluate the environmental carrying capacity for sustainable development in 2005, 2015, and 2030 considering the future energy demand. This study’s outputs provide the environmental carrying capacity with emergy indices, such as the percent renewable (%Renew), emergy yield ratio (EYR), environmental loading ratio (ELR), sustainability index (SI), and carrying capacity of the population (CCP) for social and economic activities on Jeju Island, which are expected to be saturated. These findings show regions with heavy tourism require development strategies, including the concept of environmental carrying capacity.
1. Introduction
The energy industry has a significant effect on the economic development of cities and nations, which is inevitably accompanied by an increase in energy consumption [1]. However, it is difficult to respond to the rapidly increasing energy demand because energy is difficult to store [2]. To resolve this issue, the Korean government has attempted to cope with the growing energy demand by implementing various energy policies. These policies can be implemented without adversely affecting the economy, but the outcomes of the policies may differ depending on the analysis period and the characteristics of the target [3]. Therefore, it is important to consider economic development to reduce waste and efficiently use resources. In addition, energy production facilities should be constructed to increase the amount of available energy. Due to air pollution and global warming caused by the use of fossil energy, the sustainability of Jeju Island’s development is threatened [2].
The growth of the gross regional domestic product (GRDP) of Jeju Island has increased from 1.9% to 5.3% from 2006 to 2015, whereas the GDP growth rate of South Korea decreased from 4.9% to 2.8% during that same period [4]. This rapid growth of Jeju Island has required considerable energy consumption, with the final energy consumption of Jeju Island increasing by 42% from 920,000 tonnage of oil equivalent (toe) to 1,310,000 toe during the same period. To address the environmental problems caused by this increase in energy consumption, renewable energy production also increased by 1100% from 30,000 toe in 2006 to 350,000 toe in 2015 [5]. This increase in energy demand will lead to an increase in the use of fossil fuels, which can pose a threat to the sustainable development of Jeju Island. To promote sustainable development, Jeju Island is striving to conduct a program called “Carbon Free Island by 2030” by implementing a smart grid, replacing combustion engines with electric cars, and generating electricity as 100% renewable energy [6]. It is necessary to assess quantitatively whether such efforts can actually achieve sustainable development, however.
The environmental carrying capacity can show a degree of sustainable development. Environmental carrying capacity is the limit of human activities that the environment can endure [7,8]. It also refers to the capacity of the interdependent and mutual promotion of sustainable growth in the economy and in society as a whole, as well as the capacity to satisfy the needs of present and future generations [9]. Several tools can calculate the environmental carrying capacity, including emergy analysis, ecological footprint analysis, and the Onishi model. The ecological footprint is a method of converting the resources required for economic activities into land area, while the Onishi model is a method to analyze the supply and demand of the environment-related sector. Emergy analysis is an ecological approach to assessing the environmental burden and sustainability inherent in energy, materials, and information [10,11,12]. We chose the emergy analysis method to assess sustainable development by taking advantage of changes in energy demand and flow on Jeju Island.
Numerous studies have estimated the environmental carrying capacity of various nations by using emergy analysis [10,13,14,15]. Zhang et al. [13] and Liu et al. [10] used emergy analysis to evaluate the sustainability of the Zengcheng, region taking into account all economic factors [10,13]. Chen et al. [14] performed an emergy analysis for Yunnan Province in China to develop a policy proposal for the sustainable development of the province [14]. However, unlike Yunnan Province and Zengcheng, where electricity can be generated, Jeju Island received 39% of its electricity from the mainland in 2016 by using a high voltage direct current (HVDC) system [16]. Hossaini and Hewage [15] sought to understand the flow of energy, materials, and money using emergy analysis [15], but they did not consider the tourism industry, which accounts for nearly 26% of Jeju Island’s total industrial sector [6]; tourism is, therefore, an essential factor in analyzing energy flow. The characteristics of Jeju Island are unique in South Korea in terms of the island’s electricity supply and tourism industry development, so it is necessary to estimate the environmental carrying capacity of Jeju Island by including both electricity supply and tourism in the emergy analysis.
The purpose of this study was to calculate the emergy inherent in the energy, materials, and information of Jeju Island in 2015 based on the emergy analysis method and local characteristics. Another objective was to evaluate the environmental carrying capacity for the sustainable development of Jeju Island through a comparative analysis between 2005 (past) and 2030 (future), considering the future energy demand.
2. Materials and Methods
2.1. Research Area and Data Sources
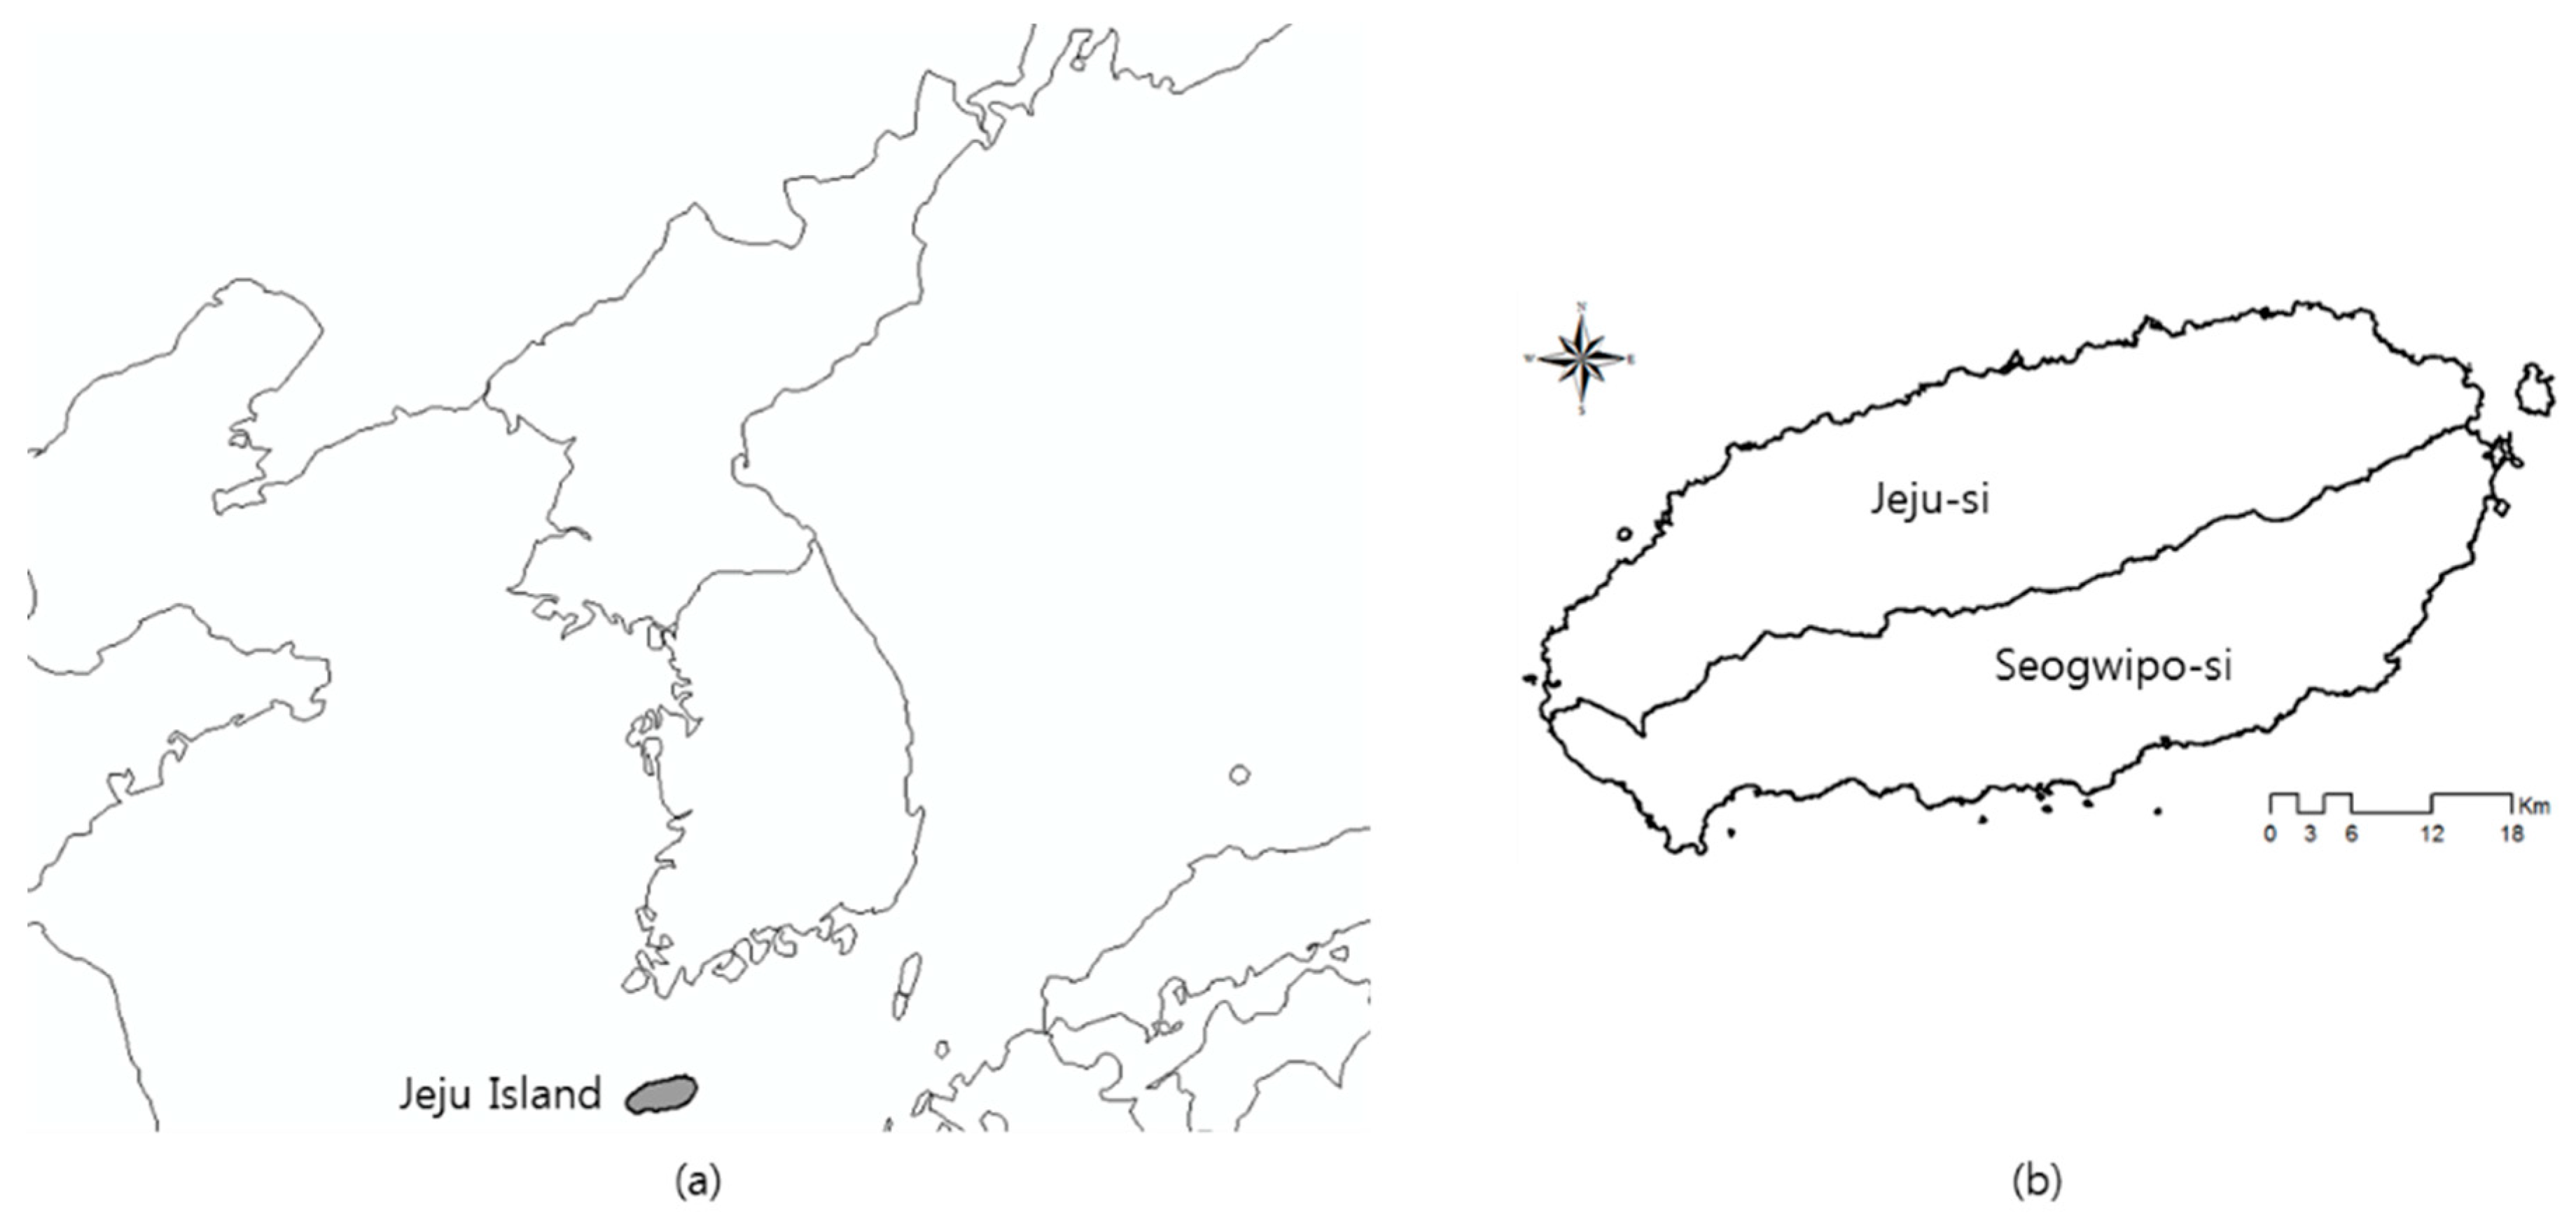
Jeju Island, which is the largest island in South Korea, is located in the southwestern part of the Korean peninsula and has an area of 1833.2 km2 (Figure 1). The island’s abundant tourism resources, such as its landscape and ecological diversity, have led to the island being included as a bio-limited conservation area in 2002, listed among the world natural heritage sites in 2007, and added as one of the new seven wonders of nature in 2011. Due to industrial development and tourism, roughly 14.75 million people traveled to Jeju Island in 2017; the population of the island is around 680,000, meaning that the number of travelers to the island accounted for around 2300% of the population that year [16].
Statistical data are obtained from various yearbooks, such as the yearbook of regional energy statistics of Korea [17], the statistical yearbook of maritime affairs and fisheries [18], and the statistical yearbook of food, agriculture, forestry, and fisheries [18]. These data include natural energy, regional production (water resources, agriculture, forestry, fisheries), and population. The Korea international trade association provides the trade data [19].
2.2. Emergy Analysis
An emergy analysis is defined as the sum of the available energy by converting all elements (energy, materials, and information) that serve as inputs into the direct and indirect production of a particular good or service [12]. This method differs from an economic evaluation method, which determines the value of goods and services based on consumers’ willingness to pay. The emergy analysis also includes a valuation of the production point that includes all factors that contribute to the production of goods and services [20].
Energy quality is also a characteristic of an emergy analysis [12]. Different forms of energy cannot be compared simply by their different types, characteristics, and scales, but emergy analysis allows for comparing the relative ability of each type of energy to show the overall flow of energy in the system. The unit energy value (UEV) is a factor that converts the difference in energy capability to the same comparable indicator. The UEV can be described as the amount of energy required to convert one type of energy into another. It can be divided into the energy conversion degree, the material conversion degree, and the emulsion ratio based on the object that must be converted [20]. Solar energy is primarily used as an energy source in an emergy analysis. In this case, emergy can be referred to as solar emergy and UEV as solar transformity [12]. It allows us to transfer the resource inputs (sun, agricultural production, topsoil losses, fuels etc.) into solar emjoules (sej) [21]. Solar emergy is a quantitative indicator that uses different types of energy units to represent the relative energy quality. The environmental carrying capacity is calculated by summing the total solar emergy required across all direct and indirect material and energy inputs used in the production of goods and services.
Emergy is composed of renewable energy (RE), nonrenewable source (NR) use from within a system, indigenous renewable energy (IR), imports (IM), and exports (EX). Table 1 lists the items for each sector in detail. Emergy is calculated as:
where EMSM is the total of emergy consumed by a region or country in a year; EMRE is the emergy of the RE category; EMNR is the emergy of the NR category; EMIR is the emergy of the IR category; EMIM is the emergy of the IM category; and EMEX is the emergy of the EX category.
To calculate the emergy of each category, the emergy of the items in the category is estimated as:
The emergy (sej) of an item is estimated as the solar transformity (sej/J) and the energy (J) inherent in energy, materials, and information. This information comes from the flow of products or services required in people’s lives, and occurs in the circumstances in which a product or service is moved and converted into energy.
In the case of RE, emergy was calculated using the annual climatological reports and statistical data based on four items (sun, wind, rain, and waves).
The NR sector includes two items—soil organic matter loss and water depletion—which are considered unsustainable resources because of their slow regeneration [20]. Water depletion was excluded from the emergy evaluation, however, since Jeju Island experienced the largest amount of precipitation to date in 2015 (Jeju-si: 1728.3 mm; Gosan: 1546.4 mm; Seongsan: 2542.2 mm; Seogwipo-si: 2618.1 mm), so the emergy of water was estimated to be negative. Other non-renewable energy sources, such as the production of coal, metal minerals, and non-metallic minerals, are often calculated as well; however, they were excluded from the emergy evaluation due to no production on Jeju Island.
The IR related to the economic activities of Jeju Island is the emergy based on renewable energy. The items of the IR category were selected by considering the resource depletion caused by the development of the tourism industry. Four items were chosen to reflect the decline of agricultural products, the decrease of fishery products caused by overfishing, the depletion of water resources due to population growth, and the reduction of roundwood production from tourism resource development.
The nine and six items are evaluated from the IM and EX categories, respectively. Among the items of IM, the electricity use and tourism items were added to the IM category as indicators of the regional characteristics of Jeju Island. Unlike other regions, Jeju Island has chosen to source its electricity through HVDC with the mainland rather than through power generation in order to preserve the clean, natural environment and because of difficulties in providing fuel. Thus, the lack of electricity was supplied by HVDC from the South Korean mainland, largely coming from Haenam and Jindo of Jeon-nam, at 39% [16]. Although the electricity use item is generally assigned to the IR category, it was added to the IM category because it was considered a characteristic of Jeju Island in this study.
With regard to tourism, Jeju Island is a significant tourist destination, and tourism-related income is a major contributor to the regional development of the island. According to the Jeju Statistical Yearbook, the tourism industry on Jeju Island accounted for about 26% of the GRDP in 2015, which was quite influential compared to the other sectors including agriculture, forestry, and fishery (11.6%) and construction (10.2%) [16]. The tourism industry has grown steadily since 1960, but recent trends have shown increasing diversification of the tourism industry due to improved income levels and living standards. The development of sustainable tourism and various eco-tourism prospects could make the tourism industry more active and, thus, the tourism item was added to the IM category to investigate the effect of the Jeju Island tourism industry on emergy.
2.3. Emergy Indices
Emergy indices are used to evaluate an energy flow system and to understand the sustainability of development. Emergy indices include the percent renewable (%Renew), emergy yield ratio (EYR), environmental loading ratio (ELR), sustainability index (SI), and carrying capacity of the population (CCP). Detailed estimation equations are as follows:
where R is a permanent emergy (which is the same as the emergy of RE shown in Table 1, R); N is nonpermanent emergy (the same as the emergy of NR in Table 1, N); F is nonpermanent purchased emergy (the emergy of IM except tourism, F); and P2L is used goods and services emergy (the same as the emergy of tourism, P2L) [22].
%Renew represents the ratio of renewable emergy from the total emergy. This index is a key factor in determining sustainable development potential when considering the long-term development of a country or region. EYR is defined as the ratio of the emergy (R + N + F) flowing into an area divided by the nonpermanent purchased emergy. This index is an indicator of the efficiency and productivity of regional systems. ELR represents the degree of the environmental load on the local ecosystem. This is also mainly used as an indicator of the impact of human economic and social activities on the surrounding environment. SI represents the degree of sustainability of the system based on current environmental conditions and economic activities. CCP is an indicator of the extent to which social and economic activities are sustainable. This is calculated using the ratio of permanent emergy and used emergy (R + N + F + P2L), the population, and the value 8, which represents the level of economic development in developed countries to determine whether human economic and social activities are within the capacity of the ecosystem [22].
3. Results
3.1. Emergy Evaluation of Jeju Island in 2015
The emergy of Jeju Island, based on the energy of the category items in 2015, was evaluated as shown in Table 2. In this study, the base energy was set as the solar energy to compare the energy of different resources. The total emergy of Jeju Island was 2.79 × 10²² sej/year in 2015.
Each category was estimated as RE 2.43 × 10²¹ sej/year, IR 1.08 × 10²¹ sej/year, NR 1.98 × 10¹⁹ sej/year, IM 1.75 × 10²² sej/year, and EX 1.76 × 10²⁰ sej/year.
The emergy in RE refers to the amount of emergy in the wave item which was calculated using the coastline’s length and the wave energy density of Jeju Island. Each item is closely related because renewable energy is basically powered by solar energy. Therefore, duplicate calculation errors can occur [6]. The emergy of RE was selected as the item with the highest amount of emergy [23,24]. The sun item represents the renewable energy source that provided the largest amount of energy (1.33 × 10¹⁹ J/year) needed for Jeju Island in 2015. This amount corresponded to about 279 times the energy of the wave item; however, after examining the contribution of emergy, it was found that the contribution of the rain, wind, and sun items was less than the contribution of the wave item, which had the highest emergy in RE (2.43 × 10²¹ sej/year). Therefore, if simple comparisons are made without considering the difference between the different types of energy, the value of the actual energy contribution to the region cannot be evaluated properly [6].
In the case of IR, the emergy of the electricity use item, which accounted for about 81% of IR, showed the highest value (8.76 × 10²⁰ sej/year). The emergy contribution for IR showed a decreasing order from the water extraction (1.84 × 10²⁰ sej/year) to the fisheries production item (7.12 × 10¹⁴ sej/year). For NR (1.98 × 10¹⁹ sej/year), only the topsoil losses item was calculated. This category accounted for 0.01% of total emergy, which was the smallest portion.
The emergy of IM, which accounted for the largest share of total emergy, was 1.75 × 10²² sej/year and was estimated to account for about 88% of total emergy. The emergy of the tourism item accounted for 89% (1.56 × 10²² sej/year) of IM, which was the highest contribution. The contribution showed a decreasing order from the livestock, meat, fish item (8.67 × 10²⁰ sej/year) to the electricity use item (4.93 × 10²⁰ sej/year). The energy (revenue) generated by the tourism item was 4.10 × 10⁹ $/year, the third lowest in IM; however, it was estimated that the emergy of the tourism item was the highest among the items because it had the highest UEV (3.81 × 10¹²).
For EX, the livestock, meat, fish item had an emergy volume of 1.25 × 10²⁰ sej/year, which accounted for about 71% of EX. The contribution decreased in the order of the plastics and synthetic rubber item (1.54 × 10¹⁹ sej/year) and the machinery and transportation equipment item (1.30 × 10¹⁹ sej/year).
3.2. Comparison Emergy Evaluations in 2005, 2015, and 2030
The results of the emergy evaluations of Jeju Island in 2005, 2015, and 2030 are shown in Table 3. The emergy of Jeju Island in 2005 was estimated based on statistics and calculations. In addition, the aim was to predict the emergy of Jeju Island in 2030, which is when the Carbon Free Island 2030 project will be completed. It was estimated as 2.43 × 10²¹ sej/year for 2005, 2015, and 2030 because there is no time series data for wave energy density.
The emergy of IR was estimated as 5.33 × 10²⁰ sej/year and 6.01 × 10²¹ sej/year in 2005 and 2030, respectively. In 2005 and 2015, the electricity use item, which excluded 40% and 36% of the supply from the land by HVDC, respectively, was the largest contributor to emergy for IR, and this contribution will also be the largest contributor though generating electricity as 100% renewable energy will be achieved in 2030. The emergy of NR, which included only the topsoil losses item, was estimated as 1.91 × 10¹⁹ sej/year in 2005 and 2.09 × 10¹⁹ sej/year in 2030, which is about 6% higher than in 2015.
The emergy of EX was estimated as 1.64 × 10²⁰ sej/year (1% of the total emergy) in 2005, but it was predicted to be 1.72 × 10²² sej/year (19% of the total emergy) in 2030, which is about 100 times higher than in 2015. The plastics and synthetic rubber production industries on Jeju Island increase the exports of these items, so the emergy of these industries is predicted to increase to 1.25 × 10²² sej/year, which would be the largest contributor to EX in 2030.
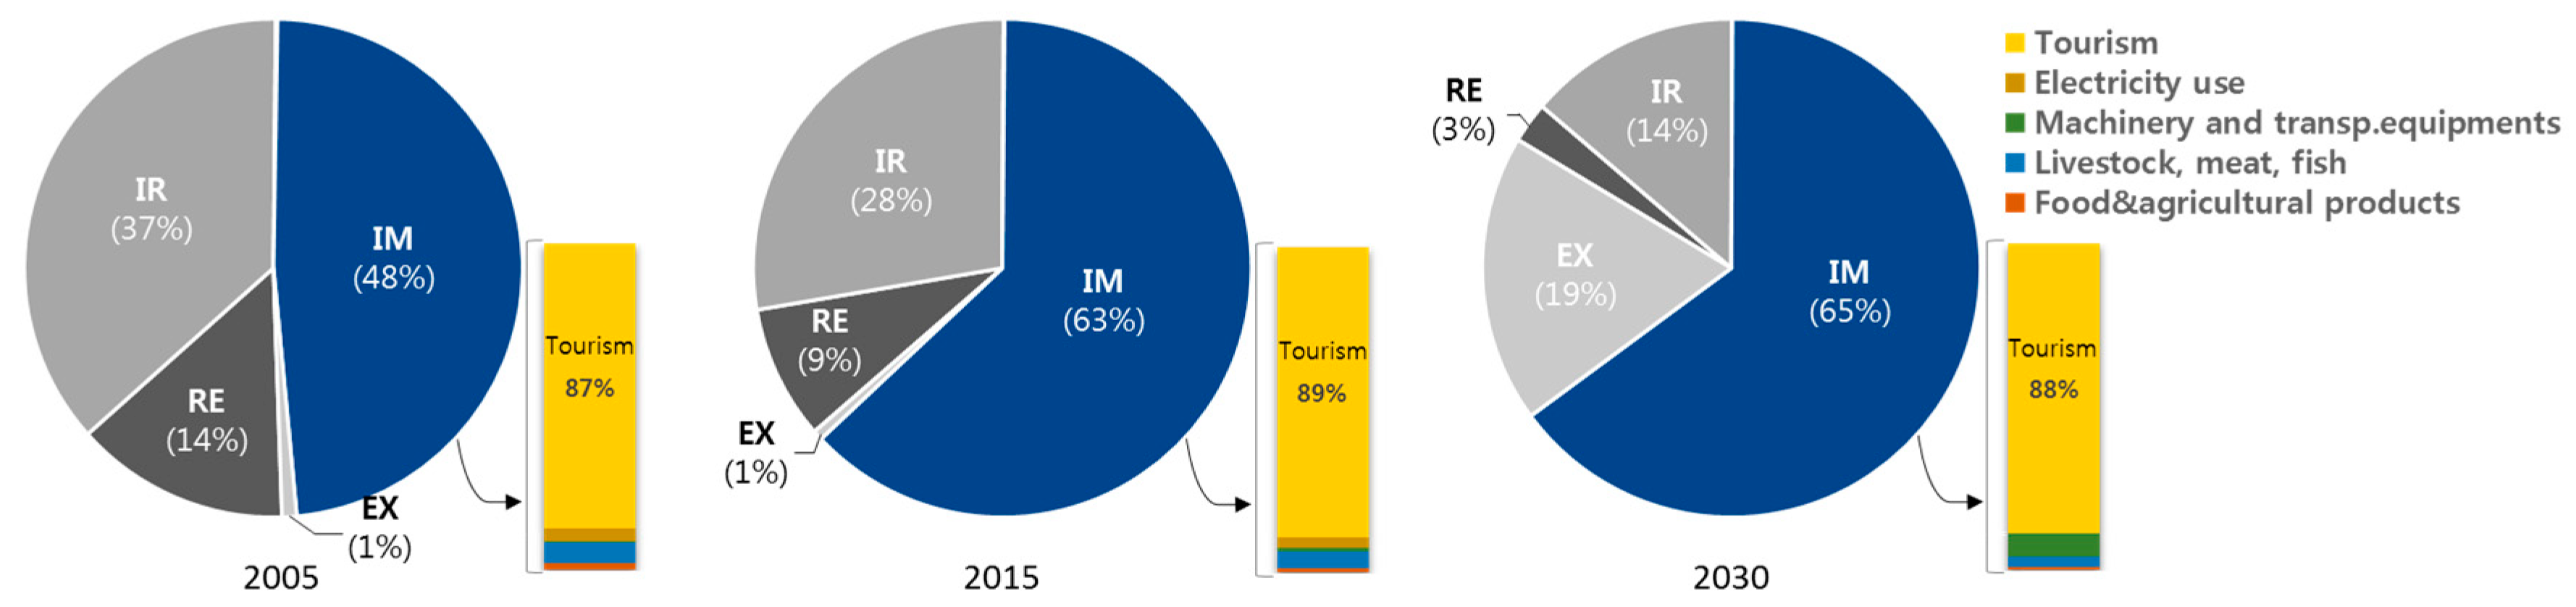
The emergy of IM in 2005 was roughly 52% lower than in 2015; the corresponding amount of emergy in 2030 is predicted to be roughly 224% higher than in 2015. The proportion of IM of total emergy was 48%, 63%, and 65% in 2005, 2015, and 2030, respectively.
The IM category accounts for a large share of the total emergy in Jeju Island (Figure 2). Especially, the emergy of the tourism item in IM accounted for 87% (7.26 × 10²¹ sej/year). In addition, the emergy of tourism item in 2030, which was estimated based on the trend of tourism imports on Jeju Island, was calculated as 5.28 × 10²² sej/year and is expected to account for 88% of IM. Although the change of the tourism proportion for 2030 is only 1% more than in 2005 or 2015, the rate was still the highest, which affected the emergy of IM. Tourism not only increases tourism income, but also affects the imports necessary to satisfy tourism, which can bring about an increase in the emergy of IM, as well as causing negative consequences to emergy indices. Thus, the change in tourism emergy is considered the bottom line of the environmental carrying capacity on Jeju Island. The electricity item was excluded from IM because it was used in the calculation of IR in the emergy analysis table for 2030.
3.3. Sustainability Evaluations of Jeju Island in 2005, 2015, and 2030
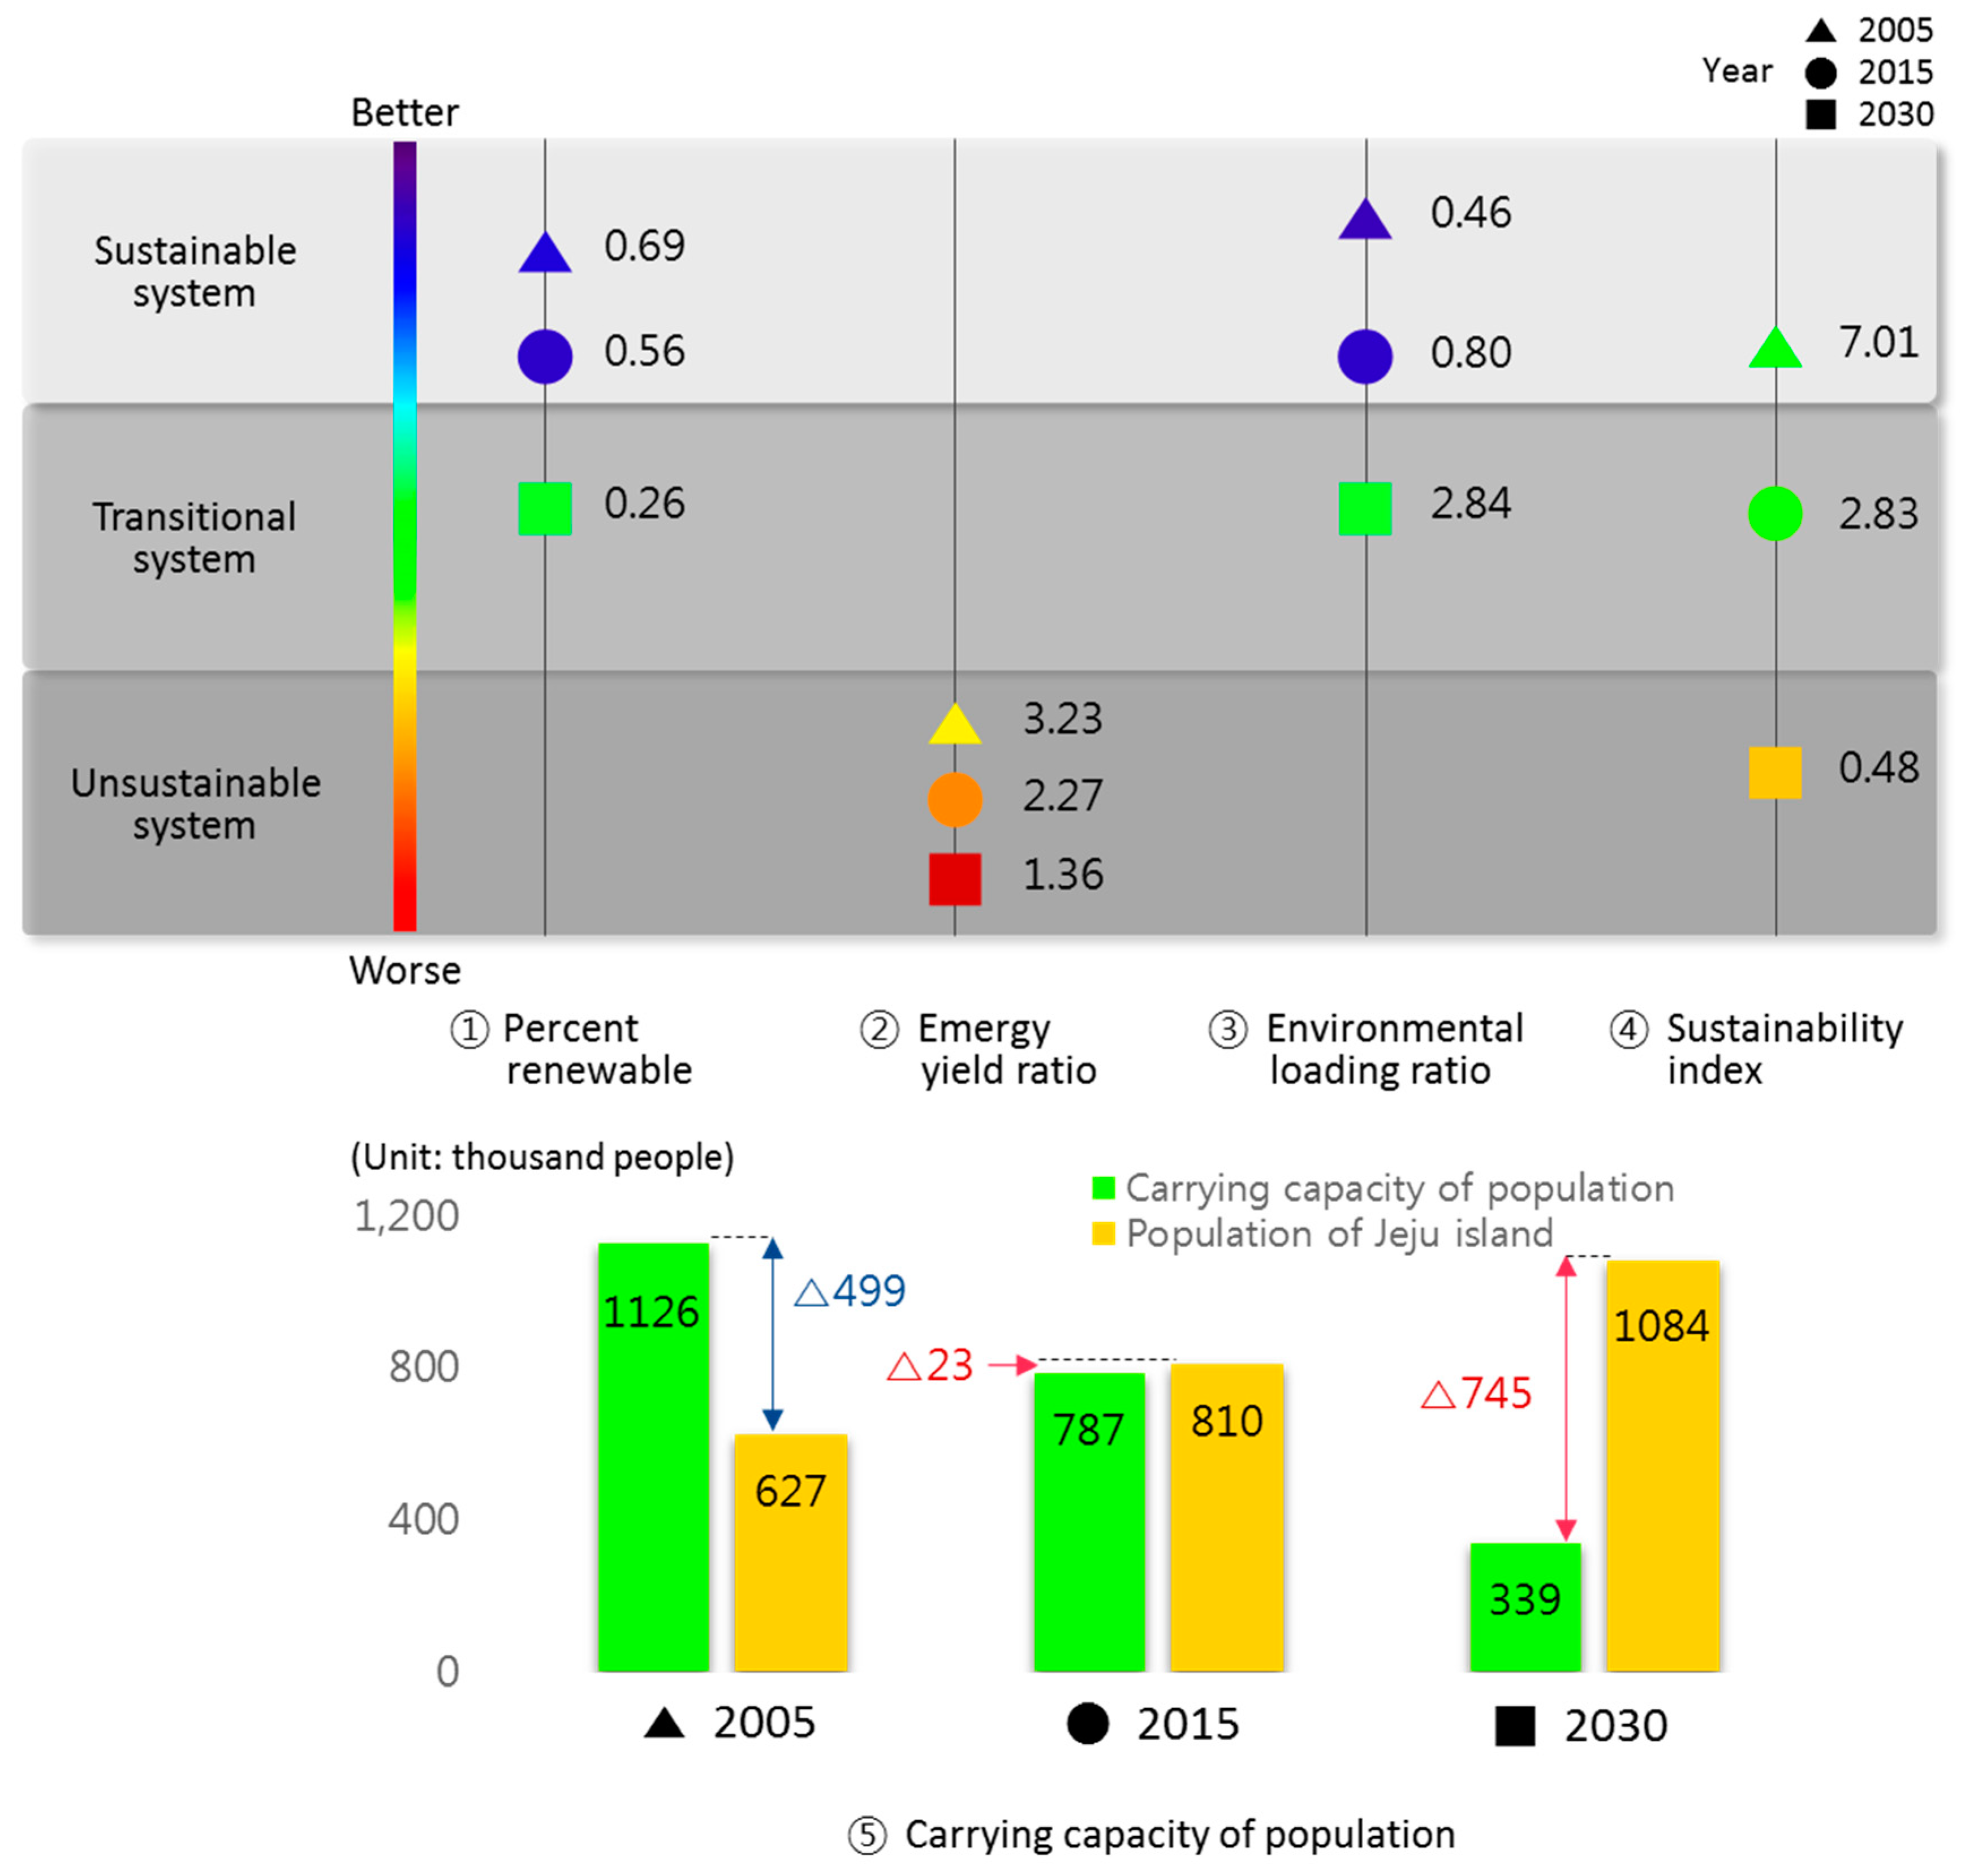
The environmental carrying capacity for the sustainable development of Jeju Island was evaluated based on the estimated emergy indices, including the percent renewable (%Renew), emergy yield ratio (EYR), environmental loading ratio (ELR), sustainability index (SI), and carrying capacity of the population (CCP). These indices are supposed to be compared across indicators. The results of the indices were grouped into three types of systems and divided into sustainable system, transitional system, and unsustainable system [32].
The results of Jeju Island’s emergy indices and changes are presented in Figure 3. %Renew will likely move from a sustainable system to an unsustainable system from 2005 to 2030, and this trend is also apparent across the other indicators. EYR represents the unsustainable system in 2005 with it progressively getting worse by 2030. ELR has been in the sustainable system from 2005 to 2015, but because the system shows signs of deterioration, it is expected to enter the transitional system by 2030. The economic and social activities occurring on Jeju Island appear to be increasing the burden on the natural environment. SI also showed a sustainable system in 2005, but deteriorates to a transitional system in 2015, and is expected to become an unsustainable system by 2030. We can conclude that the sustainability of Jeju Island has decreased. As for CCP, the capacity was available in 2005 relative to the resident population on Jeju Island, although CCP also shows signs of deterioration and is expected to be serious by 2030.
The results of the evaluation of the emergy characteristics on Jeju Island using emergy indices in 2030 are as follows: First, the long-term development of Jeju Island’s economy and society will be hindered. Second, the characteristics that depend on the external economy are expected to be intensive. Third, the CCP needed to sustain the economic and social activities is decreasing, and the sustainable development of Jeju Island will be jeopardized. A comprehensive analysis of the indices, such as %Renew, EYR, ELR, SI, and CCP, showed that the environmental carrying capacity of Jeju Island is anticipated to become saturated.
4. Conclusions
The present study was conducted to estimate the emergy of Jeju Island in 2015 and to evaluate the environmental carrying capacity for the sustainable development of Jeju Island through an emergy comparison of 2005, 2015, and 2030.
The emergy results in 2015 were as follows: RE 2.43 × 10²¹ sej/year, IR 7.74 × 10²¹ sej/year, NR 1.98 × 10¹⁹ sej/year, IM 1.75 × 10²² sej/year, and EX 1.76 × 10²⁰ sej/year. In particular, the emergy of IM accounted for roughly 88% of total emergy, which was the largest portion. In addition, the tourism item had the highest emergy contribution among all items, with an emergy of 1.56 × 10²² sej/year. The most influential category of total emergy was IM based on an emergy comparison for Jeju Island in 2005, 2015, and 2030. The environmental carrying capacity of Jeju Island was evaluated by considering the changes in future energy demand based on the analyzed emergy. As a result, tourism income was indicated to have increased due to an increase in the number of tourists, which has led to a surge in the emergy of the tourism item (P2L). With an increase in residents and tourists, the emergy of IM could also increase because additional external resources would be required. No emergy indicators showed optimistic results, suggesting that the sustainable development of Jeju Island will be jeopardized and that the environmental carrying capacity will become saturated.
This study has investigated the potential to supply all electricity using renewable energy on Jeju Island by 2030; however, the energy required for a renewable energy infrastructure was not analyzed. It is possible that the influx of the external resources might increase the emergy of the IM category and could lead to worse consequences. In addition, it is important to emphasize that excluding the possibility of supplying electricity using HVDC after 2030 limits the interpretations. If electricity is imported into Jeju Island in 2030, this electricity importation could increase the emergy of the IM category, which is important in estimating the island’s environmental carrying capacity.
These findings are of considerable importance because they suggest that tourism-oriented regions, such as Jeju Island, require development strategies that include the concept of environmental carrying capacity. Regions that see heavy tourism require resources to satisfy the entire population, including tourists. Doing so inevitably increases the amount of energy that is brought in, however, which could hinder sustainable development. An analysis of the environmental carrying capacity using emergy analysis will reveal and improve the vulnerabilities that could hinder sustainable development, thus having the potential to enhance sustainability. However, because the environmental carrying capacity of Jeju Island shows better results than those of South Korea as a whole, from Kim and Chang’s work [6], we can, therefore, expect opportunities to enhance Jeju Island’s environmental carrying capacity in the future by improving the sustainable development of the island.
Author Contributions
C.J. designed, conducted the study, analyzed the data, and wrote the manuscript. C.K. planned specific analysis methods. S.K. reviewed and reformatted the overall paper. K.S. developed the concept, supervised the project, and provided various materials and methods related to the research. All authors have read and approved the final manuscript.
Acknowledgments
The financial support from Jeju Green Environment Center (JGEC, Korea) is gratefully acknowledged.
Conflicts of Interest
The authors declare no conflict of interest.
References
- Halicioglu, F. An econometric study of CO2 emissions, energy consumption, income and foreign trade in turkey. Energy Policy 2009, 37, 1156–1164. [Google Scholar] [CrossRef] [Green Version]
- Cho, J. National economic effects of electricity sector: Using input-output analysis. GRI Rev. 2011, 13, 115–132. [Google Scholar]
- Mo, S.; Kim, C. Dynamic causal relationships between energy consumption and economic growth. Environ. Resour. Econ. Rev. 2003, 12, 327–346. [Google Scholar]
- Statistics Korea. Korea Statistical Yearbook; Statistics Korea: Seoul, Korea, 2016; Available online: http://english.seoul.go.kr/online-publication-%EF%BD%A22016-seoul-statistical-yearbook%EF%BD%A3/ (accessed on 20 May 2018).
- Ministry of Trade, Industry and Energy. Yearbook of Regional Energy Statistics of Korea; Ministry of Trade, Industry and Energy: Seoul, Korea, 2016. [Google Scholar]
- Kim, N.; Chang, Y. A study on the estimation of environmental carrying capacity and sustainability in national land using the emergy synthesis. J. Environ. Impact Assess. 2016, 25, 141–154. [Google Scholar] [CrossRef]
- Pamungkas, P.; Sulistyono, A.; Siswanto, V.K. Poteran carrying capacity for small island development. Procedia-Soc. Behav. Sci. 2016, 227, 761–769. [Google Scholar] [CrossRef]
- Swiader, M.; Szewranski, S.; Kazak, J.K. Foodshed as an example of preliminary research for conducting environmental carrying capacity analysis. Sustainability 2018, 10, 882. [Google Scholar] [CrossRef]
- Wang, W.; Zeng, W. Optimizing the regional industrial structure based on the environmental carrying capacity: An inexact fuzzy multi-objective programming model. Sustainability 2013, 5, 5391–5415. [Google Scholar] [CrossRef]
- Liu, W.; Zhan, J.; Li, Z.; Jia, S.; Zhang, F.; Li, Y. Eco-efficiency evaluation of regional circular economy: A case study in Zengcheng, Guangzhou. Sustainability 2018, 10, 453. [Google Scholar] [CrossRef]
- Pang, M.; Zhang, L.; Ulgiati, S.; Wang, C. Ecological impacts of small hydropower in china: Insights from an emergy analysis of a case plant. Energy Policy 2015, 76, 112–122. [Google Scholar] [CrossRef]
- Odum, H.T. Environmental Accounting: Emergy and Environmental Decision Making; Wiley: New York, NY, USA, 1996. [Google Scholar]
- Zhang, J.; Wang, Y.; Wang, C.; Wang, R.; Li, F. Quantifying the emergy flow of an urban complex and the ecological services of a satellite town: A case study of Zengcheng, China. J. Clean. Prod. 2017, 163, S267–S276. [Google Scholar] [CrossRef]
- Chen, W.; Zhong, S.; Geng, Y.; Chen, Y.; Cui, X.; Wu, Q.; Pan, H.; Wu, R.; Sun, L.; Tian, X. Emergy based sustainability evaluation for Yunnan province, china. J. Clean. Prod. 2017, 162, 1388–1397. [Google Scholar] [CrossRef]
- Hossaini, N.; Hewage, K. Emergy accounting for regional studies: Case study of Canada and its provinces. J. Environ. Manag. 2013, 118, 177–185. [Google Scholar] [CrossRef] [PubMed]
- Jeju Special Self-Governing Provincial Government. Jeju Statistical Yearbook; Jeju Special Self-Governing Provincial Government: Jeju, Korea, 2016.
- Korea Energy Economics Institute (KEEI). Yearbook of Regional Energy Statistics; Korea Energy Economics Institute (KEEI): Seoul, Korea, 2016. [Google Scholar]
- Ministry of Oceans and Fisheries (MOF). The Statistical Yearbook of Maritime Affairs and Fisheries; Ministry of Oceans and Fisheries (MOF): Seoul, Korea, 2016. [Google Scholar]
- Korea International Trade Association (KITA), 2017. Available online: http://stat.kita.net/stat/kts/prod/ProdItemImpExpList.screen?s_prod_code=69&s_prod_name (accessed on 20 May 2018).
- Kang, D. Emergy evaluation of the Korean economy and environment: Implications for the valuation of marine ecosystem services. J. Korean Soc. Mar. Environ. Energy 2015, 18, 102–115. [Google Scholar] [CrossRef]
- Asamoah, E.F.; Zhang, L.X.; Liang, S.; Pang, M.Y.; Tang, S.J. Emergy perspectives on the environmental performance and sustainability of small-scale gold production systems in ghana. Sustainability 2017, 9, 2034. [Google Scholar] [CrossRef]
- Brown, M.T.; McClanahan, T.R. Emergy analysis perspectives of Thailand and Mekong River dam proposals. Ecol. Model. 1996, 91, 105–130. [Google Scholar] [CrossRef]
- Yang, L.; Kong, F.-L.; Xi, M.; Li, Y.; Wang, S. Environmental economic value calculation and sustainability assessment for constructed rapid infiltration system based on emergy analysis. J. Clean. Prod. 2017, 167, 582–588. [Google Scholar] [CrossRef]
- Zuo, P.; Wan, S.W.; Qin, P.; Du, J.; Wang, H. A comparison of the sustainability of original and constructed wetlands in Yancheng biosphere reserve, china: Implications from emergy evaluation. Environ. Sci. Policy 2004, 7, 329–343. [Google Scholar] [CrossRef]
- Odum, H.; Brown, M.; Brandt-Williams, S. Folio# 1: Introduction and global budget. In Handbook of Emergy Evaluation: A Compendium of Data for Emergy Computation Issued in a Series of Folios; Center for Environmental Policy, Univ. of Florida: Gainesville, FL, USA, 2000. [Google Scholar]
- Buenfil, A.A. Emergy Evaluation of Water. PhD Thesis, Univ. of Florida, Gainesville, FL, USA, 2001; p. 248. [Google Scholar]
- Romitelli, M.S. Emergy analysis of the new Bolivia-Brazil gas pipeline. In Emergy Synthesis: Theory and Application of the Emergy Methodology; Brown, M.T., Ed.; Center of Environmental Policy, Univ. of Florida: Gainesville, FL, USA, 2000; pp. 53–69. [Google Scholar]
- Brown, M.T.; Ulgiati, S. Understanding the global economic crisis: A biophysical perspective. Ecol. Model. 2011, 223, 4–13. [Google Scholar] [CrossRef]
- Liu, G.Y.; Yang, Z.F.; Chen, B.; Ulgiati, S. Monitoring trends of urban development and environmental impact of Beijing, 1999–2006. Sci. Total Environ. 2011, 409, 3295–3308. [Google Scholar] [CrossRef] [PubMed]
- Cohen, M.J.; Sweeney, S.; Brown, M.T. Computing the unit emergy value of crustal elements. Emergy Synth. 2007, 4, 16.11–16.12. [Google Scholar]
- Ascione, M.; Campanella, L.; Cherubini, F.; Ulgiati, S. Environmental driving forces of urban growth and development: An emergy-based assessment of the city of Rome, Italy. Landsc. Urban Plan. 2009, 93, 238–249. [Google Scholar] [CrossRef]
- Brown, M.T.; Ulgiati, S. Emergy-based indices and ratios to evaluate sustainability: Monitoring economies and technology toward environmentally sound innovation. Ecol. Eng. 1997, 9, 51–69. [Google Scholar] [CrossRef]
- Cao, K.; Feng, X. Distribution of emergy indices and its application. Energy Fuels 2007, 21, 1717–1723. [Google Scholar] [CrossRef]
Figure 1.
(a) The location of South Korea relative to Jeju Island and (b) a map of Jeju Island.

Figure 2.
The total emergy and import composition of Jeju Island in 2005, 2015, and 2030. The total emergy is categorized as renewable energy (RE), indigenous renewable energy (IR), nonrenewable source use from within system (NR), imports (IM), and exports (EX). However, NR is excluded from the figure since the proportion was 0.11% (2005), 0.07% (2015), and 0.02% (2030), which is less than 1%. The bar graph shows the composition of IM which accounts for the largest portion of the total emergy. Fuels, plastics and synthetic rubber, chemicals, and finished products items are eliminated considering the proportion of IM.

Figure 3.
The five emergy indices analysis considering system stability for 2005, 2015, and 2030. The five emergy indices consist of percent renewable (%Renew), emergy yield ratio (EYR), environmental loading ratio (ELR), sustainability index (SI), and carrying capacity of the population (CCP). The ELR, unlike other indices, shows that the smaller the number, the better the system. The following shows the range of each index: ① %Renew: unsustainable system (<0.2), transitional system (0.2–0.5), sustainable system (>0.5); ② EYR: unsustainable system (<4), transitional system (4–15), sustainable system (>15); ③ ELR: sustainable system (<2), transitional system (2–10), unsustainable system (>10); and ④ SI: unsustainable system (<1), transitional system (1–5), and sustainable system (>5) [14,33]. Unlike other indices, the higher the number of ELR, the worse it is.


Table 1.
Categories and items for emergy evaluation.
| Emergy Category | Item |
|---|---|
| Renewable Energy (RE) | Sun, wind, rain (chemical potential), waves |
| Indigenous Renewable Energy (IR) | Agricultural production, fishery production, water extraction, forest extraction, electricity use |
| Nonrenewable Source use from within a System (NR) | Topsoil losses |
| Imports (IM) | Fuels; food and agricultural products; livestock, meat, and fish; plastics and synthetic rubber; chemicals; finished products; machinery and transportation equipment; electricity use; tourism |
| Exports (EX) | Food and agricultural products; livestock, meat, and fish; plastics and synthetic rubber; chemicals; finished products; machinery and transportation equipment |
Table 2.
The emergy evaluations of Jeju Island in 2015.
| No. | Item | Flow | Unit | UEV | UEV Source a | Emergy (sej/year) % c |
|---|---|---|---|---|---|---|
| Renewable energy | ||||||
| 1 | Sun | 1.33 × 10¹⁹ | J/year | 1 | 1 | 1.33 × 10¹⁹ |
| 2 | Wind | 1.55 × 10¹⁶ | J/year | 2.45 × 10³ | 1 | 3.80 × 10¹⁹ |
| 3 | Rain, chemical potential | 1.93 × 10¹⁶ | J/year | 3.05 × 10⁴ | 1 | 5.89 × 10²⁰ |
| 4 | Wave | 4.76 × 10¹⁶ | J/year | 5.10 × 10⁴ | 1 | 2.43 × 10²¹ |
| max b | 2.43 × 10²¹ | |||||
| Indigenous renewable energy | ||||||
| 5 | Fisheries production | 2.12 × 10⁸ | J/year | 3.36 × 10⁶ | 2 | 7.12 × 10¹⁴ (0.0001%) |
| 6 | Agricultural production | 8.99 × 10⁹ | J/year | 3.36 × 10⁵ | 2 | 3.02 × 10¹⁵ (0.0003%) |
| 7 | Water extraction | 7.69 × 10¹⁴ | J/year | varies d | 1, 3 | 1.84 × 10²⁰ (17%) |
| 8 | Electricity use | 3.06 × 10¹⁵ | J/year | 2.86 × 10⁵ | 4 | 8.76 × 10²⁰ (81%) |
| 9 | Forest extraction | 9.82 × 10¹⁴ | J/year | 2.21 × 10⁴ | 5 | 2.17 × 10¹⁹ (2%) |
| sum | 1.08 × 10²¹ | |||||
| Nonrenewable sources from within system | ||||||
| 10 | Topsoil losses | 1.61 × 10¹⁵ | J/year | 1.23 × 10⁴ | 6 | 1.98 × 10¹⁹ (100%) |
| sum | 1.98 × 10¹⁹ | |||||
| Imports | ||||||
| 11 | Fuels | 1.62 × 10¹³ | J/year | 8.36 × 10⁴ | 7 | 1.35 × 10¹⁸ (0.01%) |
| 12 | Food & agricultural products | 1.41 × 10¹⁵ | J/year | 1.52 × 10⁵ | 8 | 2.14 × 10²⁰ (1%) |
| 13 | Livestock, meat, fish | 3.02 × 10¹⁴ | J/year | 2.87 × 10⁶ | 8 | 8.67 × 10²⁰ (5%) |
| 14 | Plastics and synthetic rubber | 1.31 × 10⁷ | g/year | 1.40 × 10¹⁰ | 8 | 1.84 × 10¹⁷ (0.001%) |
| 15 | Chemicals | 3.30 × 10⁹ | mixed | 4.20 × 10⁹ | 8 | 1.39 × 10¹⁹ (0.1%) |
| 16 | Finished products | 1.81 × 10¹⁰ | mixed | 3.89 × 10⁹ | 8 | 7.03 × 10¹⁹ (0.4%) |
| 17 | Machinery and transp. equipment | 1.19 × 10¹⁰ | g/year | 2.22 × 10¹⁰ | 8 | 2.65 × 10²⁰ (2%) |
| 18 | Electricity | 1.72 × 10¹⁵ | J/year | 2.86 × 10⁵ | 4 | 4.93 × 10²⁰ (3%) |
| 19 | Tourism | 4.10 × 10⁹ | $/year | 3.81 × 10¹² | 9 | 1.56 × 10²² (89%) |
| sum | 1.75 × 10²² | |||||
| Exports | ||||||
| 20 | Food and agricultural products | 8.56 × 10¹³ | J/year | 1.31 × 10⁵ | 8 | 1.12 × 10¹⁹ (6%) |
| 21 | Livestock, meat, fish | 1.44 × 10¹³ | J/year | 8.71 × 10⁶ | 8 | 1.25 × 10²⁰ (71%) |
| 22 | Plastics and synthetic rubber | 1.20 × 10⁹ | g/year | 1.29 × 10¹⁰ | 8 | 1.54 × 10¹⁹ (9%) |
| 23 | Chemicals | 7.50 × 10⁷ | mixed | 4.71 × 10⁹ | 8 | 3.53 × 10¹⁷ (0.2%) |
| 24 | Finished products | 1.38 × 10⁹ | mixed | 7.75 × 10⁹ | 8 | 1.07 × 10¹⁹ (6%) |
| 25 | Machinery and transp. equipment | 5.87 × 10⁸ | g/year | 2.22 × 10¹⁰ | 5 | 1.30 × 10¹⁹ (7%) |
| sum | 1.76 × 10²⁰ | |||||
a UEV sources: (1) Odum et al. [25], (2) Brown and McClanahan [22], (3) Buenfil [26], (4) Odum [12], (5) Romitelli [27] (6) Brown and Ulgiati [28], (7) Liu et al. [29], (8) Cohen et al. [30], (9) Ascione et al. [31]. b The sum of the renewable resources is determined by the largest value among the items to avoid a duplicate calculation. c These percentages show the portion in each category. In the category of renewable energy, there is no portion due to using the maximum emergy of the renewable energy category. d Water extraction can be divided into surface water and groundwater. The UEVs of surface water and groundwater are 8.14 × 10⁴, and 2.45 × 10⁵.
Table 3.
The emergy evaluations of Jeju Island in 2005, 2015, and 2030.
| Item | 2005 | 2015 | 2030 | 2015/2005 | 2030/2015 |
|---|---|---|---|---|---|
| Renewable energy | |||||
| Sun | 1.46 × 10¹⁹ | 1.33 × 10¹⁹ | 1.16 × 10¹⁹ | 0.91 | 0.87 |
| Wind | 6.47 × 10¹⁹ | 3.80 × 10¹⁹ | 1.77 × 10¹⁹ | 0.59 | 0.47 |
| Rain, chemical potential | 4.30 × 10²⁰ | 5.89 × 10²⁰ | 9.56 × 10²⁰ | 1.37 | 1.62 |
| Wave | 2.43 × 10²¹ | 2.43 × 10²¹ | 2.43 × 10²¹ | 1.00 | 1.00 |
| max | 2.43 × 10²¹ | 2.43 × 10²¹ | 2.43 × 10²¹ | 1.00 | 1.00 |
| Indigenous renewable energy | |||||
| Fisheries production | 5.91 × 10¹⁴ | 7.12 × 10¹⁴ | 9.46 × 10¹⁴ | 1.20 | 1.33 |
| Agricultural production | 2.90 × 10¹⁵ | 3.02 × 10¹⁵ | 3.21 × 10¹⁵ | 1.04 | 1.06 |
| Water extraction | 5.30 × 10¹⁹ | 1.84 × 10²⁰ | 1.43 × 10²¹ | 3.47 | 7.77 |
| Electricity use | 4.78 × 10²⁰ | 8.76 × 10²⁰ | 3.20 × 10²¹ | 1.83 | 3.65 |
| Forest extraction | 2.01 × 10¹⁸ | 2.17 × 10¹⁹ | 1.38 × 10²¹ | 10.81 | 63.78 |
| sum | 5.33 × 10²⁰ | 1.08 × 10²¹ | 6.01 × 10²¹ | 2.03 | 5.56 |
| Nonrenewable sources from within system | |||||
| Topsoil losses | 1.91 × 10¹⁹ | 1.98 × 10¹⁹ | 2.09 × 10¹⁹ | 1.04 | 1.06 |
| sum | 1.91 × 10¹⁹ | 1.98 × 10¹⁹ | 2.09 × 10¹⁹ | 1.04 | 1.06 |
| Imports | |||||
| Fuels | 2.88 × 10¹⁷ | 1.35 × 10¹⁸ | 1.80 × 10¹⁹ | 4.69 | 13.33 |
| Food and agricultural products | 1.77 × 10²⁰ | 2.14 × 10²⁰ | 2.86 × 10²⁰ | 1.21 | 1.34 |
| Livestock, meat, fish | 5.02 × 10²⁰ | 8.67 × 10²⁰ | 2.04 × 10²¹ | 1.73 | 2.35 |
| Plastics and synthetic rubber | 5.51 × 10¹⁸ | 1.84 × 10¹⁷ | 3.17 × 10¹⁵ | 0.03 | 0.02 |
| Chemicals | 6.57 × 10¹⁸ | 1.39 × 10¹⁹ | 4.58 × 10¹⁹ | 2.21 | 3.29 |
| Finished products | 3.82 × 10¹⁹ | 7.03 × 10¹⁹ | 1.84 × 10²⁰ | 1.84 | 2.62 |
| Machinery and transp. equipment | 5.09 × 10¹⁹ | 2.65 × 10²⁰ | 4.28 × 10²¹ | 5.21 | 16.15 |
| Electricity | 3.17 × 10²⁰ | 4.93 × 10²⁰ | 0 | 1.56 | 0 |
| Tourism | 7.26 × 10²¹ | 1.56 × 10²² | 5.28 × 10²² | 2.15 | 3.38 |
| sum | 8.36 × 10²¹ | 1.75 × 10²² | 5.96 × 10²² | 2.09 | 3.41 |
| Exports | |||||
| Food & agricultural products | 1.14 × 10¹⁹ | 1.12 × 10¹⁹ | 1.09 × 10¹⁹ | 0.98 | 0.97 |
| Livestock, meat, fish | 1.36 × 10²⁰ | 1.25 × 10²⁰ | 1.10 × 10²⁰ | 0.92 | 0.88 |
| Plastics and synthetic rubber | 3.87 × 10¹⁷ | 1.54 × 10¹⁹ | 1.25 × 10²² | 39.79 | 811.69 |
| Chemicals | 1.79 × 10¹⁷ | 3.53 × 10¹⁷ | 1.03 × 10¹⁸ | 1.97 | 2.92 |
| Finished products | 3.71 × 10¹⁷ | 1.07 × 10¹⁹ | 4.60 × 10²¹ | 28.84 | 429.91 |
| Machinery and transp. equipment | 1.56 × 10¹⁹ | 1.30 × 10¹⁹ | 9.93 × 10¹⁸ | 0.83 | 0.76 |
| sum | 1.64 × 10²⁰ | 1.76 × 10²⁰ | 1.72 × 10²² | 1.07 | 97.73 |
© 2018 by the authors. Licensee MDPI, Basel, Switzerland. This article is an open access article distributed under the terms and conditions of the Creative Commons Attribution (CC BY) license (http://creativecommons.org/licenses/by/4.0/).
Share and Cite
MDPI and ACS Style
Jung, C.; Kim, C.; Kim, S.; Suh, K. Analysis of Environmental Carrying Capacity with Emergy Perspective of Jeju Island. Sustainability 2018, 10, 1681. https://doi.org/10.3390/su10051681
AMA Style
Jung C, Kim C, Kim S, Suh K. Analysis of Environmental Carrying Capacity with Emergy Perspective of Jeju Island. Sustainability. 2018; 10(5):1681. https://doi.org/10.3390/su10051681
Chicago/Turabian StyleJung, Chanhoon, Chanwoo Kim, Solhee Kim, and Kyo Suh. 2018. "Analysis of Environmental Carrying Capacity with Emergy Perspective of Jeju Island" Sustainability 10, no. 5: 1681. https://doi.org/10.3390/su10051681
Note that from the first issue of 2016, this journal uses article numbers instead of page numbers. See further details here.