Classification of Economic Regions with Regards to Selected Factors Characterizing the Construction Industry


Department of Construction Technology and Management, Faculty of Civil Engineering, Wroclaw University of Science and Technology, 50-370 Wrocław, Poland
*
Author to whom correspondence should be addressed.
Sustainability 2018, 10(5), 1637; https://doi.org/10.3390/su10051637
Submission received: 27 April 2018
/
Revised: 15 May 2018
/
Accepted: 16 May 2018
/
Published: 18 May 2018
(This article belongs to the Special Issue Sustainability in Construction Engineering)
Abstract
:This article presents the methodology for classifying economic regions with regards to selected factors that characterize a region, such as: the economic structure of the region and share of individual sectors in the economy; employment; the dynamics of the development of individual sectors expressed as an increase or decrease in production value; population density, and the level of occupational safety. Cluster analysis, which is a method of multidimensional statistical analysis available in Statistica software, was used to solve the task. The proposed methodology was used to group Polish voivodeships with regards to the speed of economic development and occupational safety in the construction industry. Data published by the Central Statistical Office was used for this purpose, such as the value of construction and assembly production, the number of people employed in the construction industry, the population of an individual region, and the number of people injured in occupational accidents.
1. Introduction
On the basis of published indicators of economic development [1,2], it can be stated that individual regions of the world are economically developed to a different extent. An inherent attribute of every economic activity is the phenomenon of the accident rate, and one of the most accident-prone sections of the economy is the construction industry [3,4]. When analyzing construction statistics, it can be noticed that the values of indicators that characterize the construction industry in developed countries are definitely higher than in developing countries, while the values of indicators characterizing occupational safety in developed countries are significantly lower than those in developing countries. The same differentiation can be observed between the internal economic regions of countries [5].
In scientific and engineering research, the problem of identifying objects with similar characteristics is very common. When carrying out such research, it is essential to properly classify objects that are described by many features into appropriate groups. Based on an analysis of the subject literature, it should be stated that the problem of classifying objects that are described by specific features often occurs in various areas of scientific research. Authors of such works use various methods of mathematical statistics, and various supporting tools with regards to this problem. Based on our own research, it was found that no attempt has been made to classify economic regions regarding the prevalence of accidents in the construction industry.
It was also found that the use of different mathematical tools to solve the same task very often leads to different final results. These observations gave an impetus to undertake research that aimed to fill the identified research gap by:
- proposing our own universal methodology for the classification of economic regions that are characterized by different factors
- applying the developed methodology for the classification of Polish regions with regards to selected factors that characterize the construction industry within the aspect of occupational safety and economic development.
A method of multidimensional statistical analysis—cluster analysis, which is available in Statistica software—was used to solve the task. It involves segmenting the data set into subsets, in order to distinguish homogeneous objects in an analyzed set [6,7].
The article was organized in the following way: Section 2 presents a review of literature related to the topic of the article, and also the justification of undertaking the research topic; Section 3 presents and discusses the proposed methodology for the classification of economic regions with regards to selected factors that characterize the construction industry; Section 4 contains an example illustrating the application of the developed methodology for the classification of Polish voivodeships; and finally, Section 5 contains conclusions from the authors’ research.
2. Literature Review—Application of Data Classification Methods in Scientific Research
Conducting scientific research requires the processing and analyzing of large amounts of data. In some scientific disciplines, this may complicate or make it impossible to properly investigate phenomena, which may result in situations in which information relevant to researchers remains invisible. In this case, it is necessary to properly organize the observed data into structures, or to group it into categories [6,7]. Methods of multidimensional statistical analysis, including cluster analysis, are helpful for solving such research problems. The concept of cluster analysis was introduced in [8], and covers various classification algorithms for data exploration. The final effect of the calculations carried out using the above algorithms is the allocation of the analyzed data to appropriate groups, in which the individual elements show mutual similarities. It gives an opportunity to capture structures that in the real world create the analyzed data, and also to reduce them to a level that allows them to be properly analyzed.
Data grouping methods are used in many fields of science, including medicine, social sciences, agricultural and technical sciences, as well as economics. In the publication of Hartigan [9], many examples of the use of taxononic methods can be found, and for their fundamental application the author considers the development of the classification of animals and plants that had already been done in the times of Aristotle, and then later by Linnaeus.
In addition, the author gives a number of examples of the use of classification methods in: archaeology, anthropology, phytosociology, psychology, and psychiatry, as well as in other fields. In economic sciences, classification methods are used, for, among others: determining the market structure, determining a product’s position on the market, identifying test markets, market segmentation, classifying sectors due to financial conditions, classification of the labour market, and spatio-temporal analyses [10,11].
One of the most often-used methods of data grouping is cluster analysis. For example, in [12], cluster analysis was used to segment the real estate market. The calculations were based on a non-hierarchical method, and Euclidean distance was used to determine the similarity between objects. In turn, in [13], the real estate investment environment was divided into 5 levels in 17 cities in China using cluster analysis. The classification was based on 25 indicators that influence construction investments and characterize: the economic environment, the market environment, the infrastructure environment, and the social environment of an investment. The analysis of the results indicated significant regional differences in the real estate investment environment. The results of the conducted analysis were the basis for the development of strategies and remedial measures that aimed at equalizing the existing differences.
In [14,15], various methods used in the classification of objects were widely described. In [14], the hierarchical Ward method, the non-hierarchical method of K-means and fuzzy clustering were used to identify groups of objects on the real estate market. In turn, in [15], cluster analysis was used to analyze the real estate market in combination with factor analyses. The advantages and disadvantages of the used methods were demonstrated.
References [16,17] show that cluster analysis is a good tool for grouping areas and regions of a given country. For example, in [16], this method was used to develop groups of Polish voivodeships that are characterized with a similar level of development in terms of transport infrastructure. Statistical data obtained from the Central Statistical Office was used in the analysis. Another example of the grouping of voivodeships in Poland is [17], in which voivodeships were classified based on the similarity of the state of higher education.
Grouping methods are also used in issues related to occupational safety in the construction industry. In [18], the authors carried out an analysis of accidents in the construction industry in Hong Kong using Principal component analysis and cluster analysis. The results of the research allowed the most probable accident situations to be identified. As a result of the conducted calculations, it was found that the largest number of accidents occurs in the private sector. The tools that were used, and the results obtained using them, are a good starting point for the analysis of accidents in the construction industry around the world. A similar study can be found in [19], in which an analysis of accidents related to electrical and mechanical work was carried out. In these studies, a two-stage cluster analysis was used. The obtained results allowed the knowledge gap regarding the causes of accidents related to electrical and mechanical works to be filled, as well as preventive measures to be defined and promoted.
Defining accident patterns at work in the Polish construction industry was the subject of [20]. The author carried out an analysis of the features of a construction site in order to determine the most probable circumstances of the occurrence of accidents. The research was carried out on the basis of data obtained from the register of the Regional Labour Inspectorate in Cracow.
The review of the literature shows that the problem of classifying objects to groups of similar objects occurs in many areas of science. Invaluable tools in such studies are methods of multidimensional statistical analyses, including cluster analysis. Based on the review of the literature, no scientific studies were found regarding the classification of economic regions with regards to selected features that characterize the construction industry. Such classification may be necessary for conducting research in which knowledge from similar sources is required. Due to the above, the authors of the article attempted to develop a universal methodology for classifying economic regions. This classification is based upon selected factors that characterize the construction industry in a region.
3. Proposed Research Methodology
The subject of the research is the classification of the set of economic regions V with regards to selected factors that characterize the construction industry regarding aspects of economic development and occupational safety.
Based on a literature review, previous research on factors causing hazards in the construction industry [21] and the authors’ own experience, it was stated that the basic factors that characterize economic regions are: the economic structure of a region, thus the share of individual sectors of the economy in the entire economy; the dynamics of development of individual sectors of the economy expressed as an increase or decrease in production value; employment in individual sectors of the economy; and, population density in a region and also the level of occupational safety in sectors of the economy.
Therefore, each economic region can be described by the vector of factors :
where:
—the factor taken for analysis ().
The set of economic regions V is characterized by the following matrix of factors:
where:
—the economic region (),
—the factor taken for analysis ().
In mathematical analyses, knowledge about numerical values of indicators that describe particular factors is important. Thus, the set of economic regions V is characterized by a two-dimensional matrix of indicators, which takes the following form:
The values of indicators adopted for calculations often differ by a measuring unit or scale, which may negatively affect the grouping [6]. In order to deal with this, all numerical data should be subjected to standardization; the choice of the appropriate standardization formula depends on the type of data [22]. In the proposed methodology, a standardization of variables was adopted as one of the standardization methods, according to the following formula:
where:
—the values of indicators after standardization,
—the values of unstandardized indicators,
—the average value in the analysed set of objects,
—the standard deviation of the value of indicator.
The effect of standardization is the creation of a set of parameters that describe the analyzed set of economic regions , which are written in the form of a two-dimensional matrix. In this matrix, each row contains values of all the parameters that are related to one region, whereas each column contains the data of one parameter for all the regions. This matrix is described by the following formula:
The calculated parameters form the basis for grouping economic regions with the use of cluster analysis. Cluster analysis is one of the methods of data exploration, the main idea of which is to group the analyzed objects in such a way that, in a given group, there are objects which are deemed to be “similar” to each other, and also “dissimilar” to objects from other groups [6,7]. The criterion for assessing the affiliation of an object to a given group is the measure of similarity. The function, which is inverse to the measure of “similarity”, and thus the function of “dissimilarity” of objects that is a measure of the distance between them, is used for practical considerations. This means that if the distance between object and is greater than the distance between objects and , and therefore:
then object is more “dissimilar” to object than to object . Consequently, this leads to a situation where objects and can create a cluster because they are more “similar” to each other. Various distance measures that are used in cluster analysis. Geometric distance in the multidimensional space—the Euclidean distance [6], was used to solve the discussed issue. The general formula of the Euclidean distance takes the following form:
where:
—the assessed objects, i.e., economic regions a and , where , and ,
—the designated parameter values for economic regions and , where , and .
In the analyzed task, objects are the individual economic regions . For grouping objects, the use of hierarchical and agglomeration grouping techniques is proposed. The agglomeration technique, which is the most often used in research [6], involves the gradual connection of objects, which together constitute separate clusters, into new clusters until all objects form one cluster. Each connection of two clusters is called a step. An important issue when determining the appropriate distance between clusters, apart from the choice of the above-mentioned distance measure, is to determine the method of merging objects. Different methods of merging objects were analyzed, including methods in which the distance between specific locations of clusters is determined (e.g., between a given object or center of gravity of a cluster), and also methods that use variance analysis—e.g., the Ward’s method [23]. Based on the conducted analyses, it was found that the most unambiguous results are achieved using the Ward method, the main advantage of which is the grouping of objects in a way that allows clusters with a similar number of objects to be formed. This eliminates the so-called “chain-linking” effect, and the newly created clusters are characterized by the smallest possible diversity between their individual elements. In the developed methodology, the method of merging objects using the Ward method was adopted.
The result of hierarchical cluster analysis is a tree-shaped graph—the so-called dendrogram. It shows in which step the objects connect with each other. However, it does not give an unambiguous answer for the correct number of clusters. This number depends on the place where the branches of the tree are cut off on the chart. Due to this, an important issue is to correctly determine the place of the cut-off. According to [6], there is no objective rule of how to do it. There are only supportive methods, such as the method of graphical dendrogram analysis that involves the examination of the distance between successive bonds, the method using the Grabinski meter [24] or the Mojen rule [25]. The developed methodology involves the method of graphical dendrogram analysis.
After selecting the appropriate place of cutting off the branches on the dendrogram, the clusters should be identified, and on their basis, the final classification of the analyzed economic regions and their assessment and ranking should be made. The developed methodology for this classification is shown in Figure 1.
The proposed methodology was developed on the basis of previous experience and analyses carried out by the authors. The final elements used for its construction, such as the data standardization method, Euclidean distance, the grouping of objects using the hierarchical method, and also the binding of objects using the Ward method, resulted from the analysis of the results of many previous attempts that aimed to develop a universal and accurate methodology. The authors of the article believe that the proposed methodology is a good and well thought-out tool for grouping economic regions, and can be used to classify whole countries, regions of a given country and other territorial units, as well as economic facilities, e.g., enterprises. The grouping can be conducted with regards to various classification criteria, including criteria related to occupational safety in the construction industry. The necessary condition for an appropriate calculation is a substantive identification of factors that characterize regions or economic objects within the analyzed aspect, and also the obtaining of reliable numerical data on them. The results of the conducted classification may otherwise be subject to error.
4. Application of the Proposed Methodology Using the Classification of Polish Voivodeships as an Example
The proposed methodology was used to group Polish voivodeships. The classification was based on data published by the Central Statistical Office [5]. The following indicators were adopted to describe the voivodeships: the value of construction and assembly production (), the number of people employed in the construction industry (), the population of a given region (), and the number of people injured in occupational accidents (). The calculations include data for the period from 2008 to 2016 that was obtained for 16 Polish voivodeships. Therefore, the number of analyzed indicators for individual voivodeships amounted to 36; some of them are shown in Table 1.
The obtained values of indicators were standardized. The effect of this action was the creation of parameters , constituting a set of normalized indicators which were the basis for classification. Some of the data obtained after standardization is presented in Table 2.
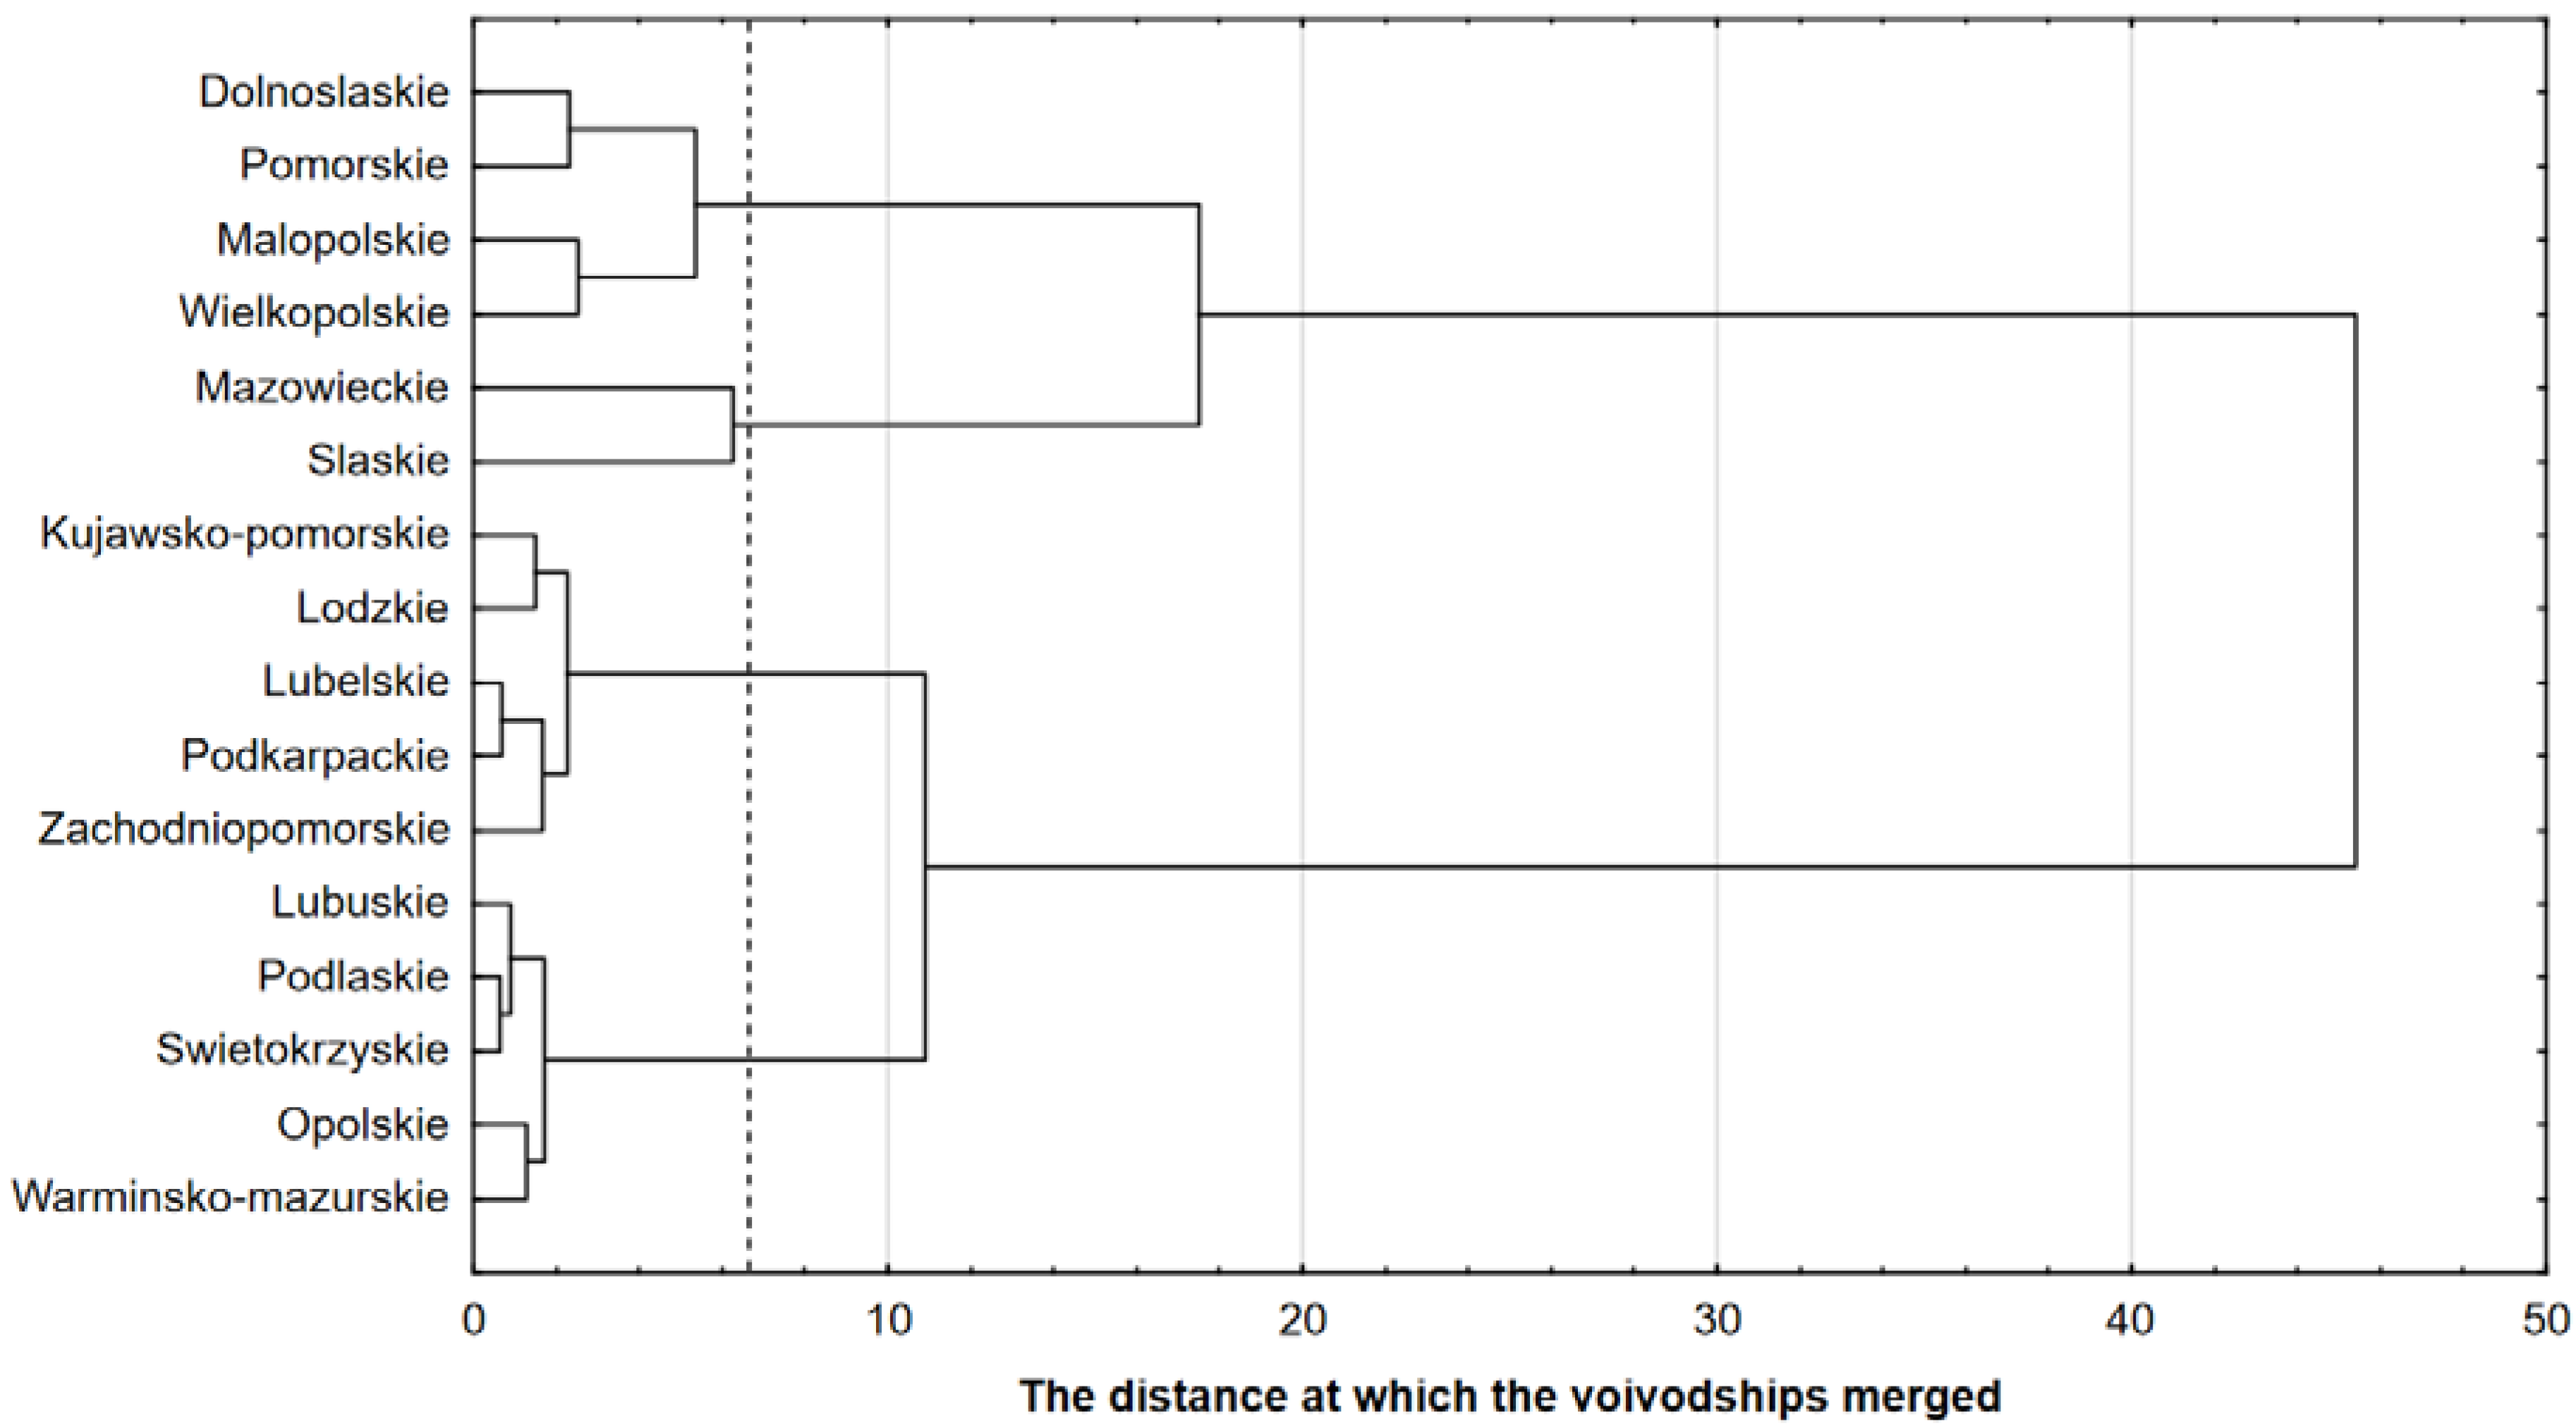
After conducting the calculations using Statistica software, the dendrogram shown in Figure 2 was obtained. When analyzing the dendrogram, it can be noted that some voivodeships very quickly create clear clusters. It was proposed to cut off the branch of the dendrogram at the place marked with a dashed line in Figure 2. With such a cut, four groups of voivodeships were obtained, in which each voivodeship has a similar level of the development of the construction industry and occupational safety. The identified groups of voivodeships are given in Table 3.
Based on the analysis of the obtained results, four clusters were distinguished, which include 2 to 5 voivodeships. Cluster I consists of the voivodeships Dolnoslaskie, Pomorskie, Malopolskie and Wielkopolskie; cluster II is formed from the voivodeships Mazowieckie and Slaskie; cluster III consists of the voivodeships Kujawsko-Pomorskie, Lodzkie, Lubelskie, Podkarpackie and Zachodniopomorskie; while cluster IV includes the voivodeships Lubuskie, Podlaskie, Swietokrzyskie, Opolskie and Warminsko-Mazurskie.
A very fast creation of connections between voivodeships in clusters III and IV was observed. These clusters include the voivodeships most similar to each other in terms of construction and assembly production, the number of people injured in occupational accidents, the number of people employed in the construction industry, and the population living in the voivodeship. The merging distance in the case of cluster III is equal to 2.26, while in the case of cluster IV is equal to 1.73
The most different voivodeships from all of the others are Mazowieckie and Slaskie. They form one cluster; however, the distance at which the merging between them occurred is equal to 6.25, and is more than twice as high as in the case of clusters III and IV. In turn, a comparable level of similarity between pairs of voivodeships can be observed in cluster I, namely: Dolnoslaskie and Pomorskie, and also Malopolskie and Wielkopolskie. The merging distance in both pairs is equal to 2.31 and 2.53, respectively. However, the merging distance of these two pairs is equal to 5.38.
5. Conclusions
The following conclusions were made on the basis of our research and analyses:
- The proposed methodology for classifying objects is of universal character and can be used to group countries, regions of a given country and other territorial units, as well as economic facilities, e.g., enterprises. The grouping can be conducted with regards to various classification criteria, including criteria related to occupational safety in the construction industry. The necessary condition for an appropriate calculation is a substantive identification of factors that characterize regions or economic objects within the analyzed aspect, and also the obtaining of reliable numerical data on them.
- The basis of the proposed methodology is a method of multidimensional analysis of statistical data, namely cluster analysis. Specific solutions include data standardization, a measure of similarity in the form of Euclidean distance, grouping objects using the hierarchical method, and binding objects using the Ward method.
- The developed methodology was used to classify Polish voivodeships with regards to factors that characterize the rate of economic development in the construction industry and the level of occupational safety. The conducted calculations and analysis of the results allowed the following conclusions to be formulated:
- The qualitative and quantitative structure of statistical data, which was the basis for the classification of voivodeships, allowed four distinct clusters consisting from two to five voivodeships to be separated. Voivodeships included in a cluster are characterized with a similar level of occupational safety in the construction industry.
- The isolated clusters are characterized by different levels of similarity, which is confirmed by the values of the merging distance measure for individual clusters. Cluster ranking with regards to the similarity of the voivodeships that form clusters is as follows:
- cluster IV consists of the voivodeships Lubuskie, Podlaskie, Swietokrzyskie, Opolskie and Warminsko-Mazurskie,
- cluster III consists of the voivodeships Kujawsko-Pomorskie, Lodzkie, Lubelskie, Podkarpackie and Zachodniopomorskie,
- cluster I consists of the voivodeships Dolnoslaskie, Pomorskie, Malopolskie and Wielkopolskie,
- cluster II consists of the voivodeships Mazowieckie and Slaskie.
- The very big similarity between voivodeships located in clusters III and IV means that voivodeships included in these clusters are characterized by a similar level of construction and assembly production value, occupational safety, the number of people employed in the construction industry, and the number of people living in the voivodeship.
- The Mazowieckie and Slaskie are atypical voivodeships. They are the most different when compared with the others. Although they form one cluster, the distance at which the merging between them occurs is relatively large when compared to the merging distance in the other clusters.
- The proposed methodology can be applied in both the area of scientific research and engineering practice. The results of tests and analyses obtained using this methodology can be the basis for classifying and comparing objects and determining their rankings. The correct classification of objects (which are described by many factors) into groups can be important in determining the characteristics of a given community, making an assessment, or looking for dependencies that apply to this community. The practical aspect of the proposed methodology is connected to the possibility of formulating conclusions, which could be important at a higher management level.
- In the research conducted by the authors, information about voivodeships belonging to the same cluster will be used to possess statistical data from these voivodeships, which in turn will be used for the construction of multifactorial linear regression models for predicting indicators describing the level of occupational safety in the construction industry in the group of voivodeships. Mathematical models, which were developed in this way, will be more accurate when compared to the general model that was built for the whole of Poland. The creation of separate mathematical models for individual voivodeships is impossible, due to the insufficient amount of reliable statistical data that can be used to construct them.
Author Contributions
Formal analysis, T.N.; Methodology, B.H. and T.N.; Project administration, B.H.; Software, T.N.; Supervision, B.H.
Funding
This research was funded by NCBiR within the framework of the Programme for Applied Research grant number PBS3/A2/19/2015.
Acknowledgments
The article is the result of the implementation by the authors of research project No. 244388 “Model of the assessment of risk of the occurrence of building catastrophes, accidents and dangerous events at workplaces with the use of scaffolding”.
Conflicts of Interest
The authors declare no conflict of interest.
References
- Central Statistical Office in Katowice. Indicators of the Sustainable Development of Poland 2015; Central Statistical Office in Katowice, Silesian Center for Regional Research: Katowice, Poland, 2015; ISBN 978-83-89641-54-0.
- Eurostat. Eurostat Regional Yearbook 2017 Edition; Publications office of the European Union: Luxembourg, 2017; ISBN 978-92-79-71616-4. [Google Scholar]
- International Labour Organization. Safety and Health at Work: A Vision for Sustainable Prevention. In Proceedings of the 20th World Congress on Safety and Health at Work 2014, Global Forum for Prevention, Frankfurt, Germany, 24–27 August 2014. [Google Scholar]
- Hoła, B.; Szóstak, M. Analysis of the state of the accident rate in the construction industry in European Union countries. Arch. Civil Eng. 2015, 61, 19–34. [Google Scholar] [CrossRef]
- Central Statistical Office. Statistical Yearbook 2008–2016; Department of Statistical Publishing: Warsaw, Poland, 2009–2017.
- Stanisz, A. A Simple Statistic Course with the Use of STATISTICA PL on the Basis of Medical Examples, Volume 3: Multivariate Analysis; StatSoft: Cracow, Poland, 2007; ISBN 978-83-88724-19-0. [Google Scholar]
- Wierzchoń, S.; Kłopotek, M. Algorithms of Cluster Analysis; Publishing House of WNT: Warsaw, Poland, 2015; ISBN 978-83-7926-261-8. [Google Scholar]
- Tryon, R.C. Cluster Analysis: Correlation Profile and Orthometric (Factor) Analysis for the Isolation of Unities in Mind and Personality; Edwards Brothers: Ann Arbor, MI, USA, 1939. [Google Scholar]
- Hartigan, J.A. Clustering Algorithms; Wiley: New York, NY, USA, 1975. [Google Scholar]
- Tkaczynski, A. Segmentation Using Two-Step Cluster Analysis. In Segmentation in Social Marketing; Springer: Singapore, 2017; pp. 109–125. [Google Scholar]
- Markowska, M.; Sokołowski, A.; Strahl, D.; Sobolewski, M. Dynamic classification of regions of the European Union at the NUTS 2 level with regards to sensitivity to the economic crisis in the area of the labour market. HSS 2015, 22, 37–50. [Google Scholar]
- Napoli, G.; Giuffrida, S.; Valenti, A. Forms and functions of the real estate market of Palermo (Italy). Science and knowledge in the cluster analysis approach. Green Energy Technol. 2017, 191–202. [Google Scholar] [CrossRef]
- Wang, W.; Yang, J.; Gong, X. The Regional Real Estate Investment Environment Research Based on Prime Component Analysis: The Case of Shandong. In ICCREM 2017: Real Estate and Urbanization—Proceedings of the International Conference on Construction and Real Estate Management; ASCE: Reston, VA, US, 2017; pp. 217–224. [Google Scholar]
- Gabrielli, L.; Giuffrida, S.; Trovato, M.R. Gaps and overlaps of urban housing sub-market: Hard clustering and fuzzy clustering approaches. Green Energy Technol. 2017, 203–219. [Google Scholar] [CrossRef]
- Wang, N.; Li, H.-M.; Tan, X.; Zhong, X.-R. Development evaluation of real estate industry in China’s major cities based on factor and cluster analysis. Xi’an Jianzhu Keji Daxue Xuebao. J. Xi’an Univ. Archit. Technol. 2010, 42, 590–594. [Google Scholar]
- Migała-Warchoł, A.; Sobolewski, M. Evaluation of voivodeships diversification in Poland according to transport infrastructure indications. Quant. Methods Econ. 2013, 14, 89–98. [Google Scholar]
- Zalewska, E. Application of cluster analysis and methods of linear ordering in the assessment of Polish higher education. Sci. Works Wroclaw Univ. Econ. 2017, 469, 234–242. [Google Scholar]
- Chiang, Y.-H.; Wong, F.K.-W.; Liang, S. Fatal Construction Accidents in Hong Kong. J. Constr. Eng. Manag. 2018, 144. [Google Scholar] [CrossRef]
- Wong, F.K.; Chan, A.P.; Wong, A.K.; Hon, C.K.; Choi, T.N. Accidents of Electrical and Mechanical Works for Public Sector Projects in Hong Kong. Int. J. Environ. Res. Public Health 2018, 15, 485. [Google Scholar] [CrossRef] [PubMed]
- Drozd, W. Identification and profiling the pattern of construction accidents with the cluster analysis. Mater. Bud. 2017, 101–102. [Google Scholar] [CrossRef]
- Hoła, B.; Nowobilski, T.; Szer, I.; Szer, J. Identification of factors affecting the accident rate in the construction industry. Procedia Eng. 2017, 11. [Google Scholar] [CrossRef]
- Jarocka, M. Selection of the normalization formula in the comparative analysis of multi-feature objects. Econ. Manag. 2015, 113–126. [Google Scholar] [CrossRef]
- Ward, J.H., Jr. Hierarchical Grouping to Optimize an Objective Function. J. Am. Stat. Assoc. 1963, 58, 236–244. [Google Scholar] [CrossRef]
- Grabiński, T. Methods of Taxononometry; Cracow University of Economics: Cracow, Poland, 2007. [Google Scholar]
- Mojena, R. Hierarchical grouping methods and stopping rulet: An evaluation. Comput. J. 1977, 20, 359–363. [Google Scholar] [CrossRef]
Figure 1.
The developed methodology for classifying economic regions.

Figure 2.
Dendrogram—a graph showing the connection of individual voivodeships in the subsequent calculation steps.
Figure 2.
Dendrogram—a graph showing the connection of individual voivodeships in the subsequent calculation steps.


Table 1.
Values of selected indicators.
| Economic Indicators | ||||||||||||
|---|---|---|---|---|---|---|---|---|---|---|---|---|
| Value of Construction and Assembly Production | Number of People Employed in the Construction Industry | Population of a Given Region | Number of People Injured in Occupational Accidents | |||||||||
| 2008 | … | 2016 | 2008 | … | 2016 | 2008 | … | 2016 | 2008 | … | 2016 | |
| 1 | 14,568.1 | … | 13,721.2 | 68,874 | … | 65,039 | 2,877,059 | … | 2,903,710 | 892 | … | 413 |
| 2 | 5288.9 | … | 6216.6 | 43,952 | … | 42,918 | 2,067,918 | … | 2,083,927 | 607 | … | 269 |
| … | … | … | … | … | … | … | … | … | … | … | … | … |
| 16 | 7325.1 | … | 9104.0 | 39,288 | … | 35,483 | 1,692,957 | … | 1,708,174 | 362 | … | 144 |
—year , —voivodeship .
Table 2.
Values of selected parameters.
| Parameters | ||||||||||||
|---|---|---|---|---|---|---|---|---|---|---|---|---|
| Value of Construction and Assembly Production | Number of People Employed in the Construction Industry | Population of a Given Region | Number of People Injured in Occupational Accidents | |||||||||
| 2008 | … | 2016 | 2008 | … | 2016 | 2008 | … | 2016 | 2008 | … | 2016 | |
| 1 | 0.734 | … | 0.394 | 0.481 | … | 0.291 | 0.397 | … | 0.395 | 0.534 | … | 0.288 |
| 2 | −0.537 | … | −0.504 | −0.264 | … | −0.323 | −0.254 | … | −0.251 | −0.110 | … | −0.294 |
| … | … | … | … | … | … | … | … | … | … | … | … | … |
| 16 | −0.258 | … | −0.158 | −0.403 | … | −0.530 | −0.555 | … | −0.546 | −0.664 | … | −0.798 |
—year , —voivodeship .
Table 3.
The obtained groups of voivodeships, which are characterized by a similar speed of construction industry development and a similar level of occupational safety.
Table 3.
The obtained groups of voivodeships, which are characterized by a similar speed of construction industry development and a similar level of occupational safety.
| Cluster | Voivodeships | The Distance at Which the Voivodeships Merged |
|---|---|---|
| I | Dolnoslaskie, Pomorskie, Malopolskie, Wielkopolskie | 5.38 |
| II | Mazowieckie, Slaskie | 6.25 |
| III | Kujawsko-Pomorskie, Lodzkie, Lubelskie, Podkarpackie, Zachodniopomorskie | 2.26 |
| IV | Lubuskie, Podlaskie, Swietokrzyskie, Opolskie, Warminsko-Mazurskie | 1.73 |
© 2018 by the authors. Licensee MDPI, Basel, Switzerland. This article is an open access article distributed under the terms and conditions of the Creative Commons Attribution (CC BY) license (http://creativecommons.org/licenses/by/4.0/).
Share and Cite
MDPI and ACS Style
Hoła, B.; Nowobilski, T. Classification of Economic Regions with Regards to Selected Factors Characterizing the Construction Industry. Sustainability 2018, 10, 1637. https://doi.org/10.3390/su10051637
AMA Style
Hoła B, Nowobilski T. Classification of Economic Regions with Regards to Selected Factors Characterizing the Construction Industry. Sustainability. 2018; 10(5):1637. https://doi.org/10.3390/su10051637
Chicago/Turabian StyleHoła, Bożena, and Tomasz Nowobilski. 2018. "Classification of Economic Regions with Regards to Selected Factors Characterizing the Construction Industry" Sustainability 10, no. 5: 1637. https://doi.org/10.3390/su10051637
Note that from the first issue of 2016, this journal uses article numbers instead of page numbers. See further details here.