Quantitative Analysis of the Determinants Influencing Urban Expansion: A Case Study in Beijing, China


School of Information Engineering, China University of Geosciences, Beijing 100083, China
*
Author to whom correspondence should be addressed.
Sustainability 2018, 10(5), 1630; https://doi.org/10.3390/su10051630
Submission received: 18 April 2018
/
Revised: 13 May 2018
/
Accepted: 14 May 2018
/
Published: 18 May 2018
(This article belongs to the Special Issue Spatial Analysis of Urbanization towards Urban Sustainability)
Abstract
:A quantitative analysis of spatial influencing factors on urban sprawl can offer better support for urban planning and management. There are many concerns regarding the influence of each factor. However, a quantitative analysis to detect the interactions between factors is limited because of the complexity of the urban systems, especially the role of planning. Additionally, spatial heterogeneity is often overlooked. This study aims to improve and strengthen the knowledge in this field through a spatial statistical method known as GeoDetector. A new spatial quantification of urban expansion was presented in this study and the spatio-temporal characteristics and mechanism of urban growth in Beijing from 2010 to 2015 were also analyzed. The results show that urban expansion presents spatial heterogeneity with different grid cells, and the optimal scale was 4500 m. At this scale, urban expansion in Beijing linearly expands along the traffic trunk. In addition, urban expansion in Beijing is jointly influenced by socioeconomic, geographical, and policy factors. Population density has had the greatest influence on urban expansion from 2010 to 2015, and policy factors rank first. The impact of economic factors on urban growth is gradually weakening. It is important for urban geographical research to further plans and guide urban development.
1. Introduction
The 2014 revision of World Urbanization Prospects notes that there is an increasing number of people living in urban areas and that the urban population will increase by 2.5 billion by 2050 [1]. According to future projections, the urban population will increase in China, India, and Nigeria. In March 2014, China launched the “national new urbanization plan (2014–2020)” [2], which proposes to develop a harmonious relationship between “man” and “nature”. The urban development boundary of the plan is a significant component of new urbanization trends of China, and is an important way to alleviate the current blight of the “urban disease”. Revealing the characteristics, pattern, and mechanism of urban expansion has become a scientific problem for researchers. Analysis on this topic is also the key to simulating and predicting urban expansion. For example, for some cellular automaton(CA)-based models and other urban growth models, predictable drivers usually form the basis of the model and can be used as input parameters to establish CA transition rules or calculate urban development potential [3,4].
Urban expansion is a complex spatial behavior that is shaped by socioeconomic, geographical, and government constraints [5,6,7,8]. The two most influential factors for urban expansion are demographics and the economy [9,10]. Socioeconomic factors are considered to be the core driving force for urban growth, specifically disposable income per citizen, secondary and tertiary industries, and real estate investment [11,12]. In addition, geographical factors such as distance and topology variables are important to urban expansion [13,14,15]. The influence of policy on urban expansion cannot be ignored, and urban planning is trying to guide the scale, speed, and direction of urban expansion [16,17,18]. There are many ways to explore and identify the influencing factors of urban growth, including logistic regression(LR) [16,19,20,21], bivariate regression(BR) [22,23], multiple linear regression (MLR) [6,24,25], analytic hierarchy process(AHP) [26], and adaptive Monte Carlo (aMC) [27].
However, few empirical analyses of the influencing factors on urban expansion take the interactions between any two factors into account. There are obvious interactions among individual socioeconomic attributes, and some urban geography studies also show that these interactions are important in the study of human behavior [28,29,30]. An existing study has confirmed that the simulation of urban expansion can be improved by considering the interaction among driving forces [28]. In addition, few previous studies take spatial heterogeneity into consideration. However, to understand various features of urban expansion in different areas, spatial heterogeneity needs to be measured. GeoDetector is a spatial statistical method used to detect spatial differentiation and reveal the driving forces [31].
The urbanization of China has an important feature, namely, that the driving force of the government factors is greater than the natural evolution of the market. Government behaviors are important in the urbanization process. Urban planning, as one of the most powerful means of government, promotes, guides, and regulates the process of urban expansion. However, most existing research analyses of policy factors are only qualitative, and the quantitative analysis of the impact of policies on urban expansion is not taken into consideration [32].
In the current research, remote sensing images of extracted urban land and grid cells of six different sizes were used to calculate the urban expansion ratio (defined in Section 2.3.1) for each unit. A spatial statistical method called GeoDetector was applied to different grid cells to explore the optimal scale. The optimal size of the grid cells was used to investigate the time-spatial revolution of urban areas and its influencing factors over the last five years, and the driving mechanisms of urban expansion were also explored at this level. The interaction between any two factors and the role of policy factors was emphasized.
2. Materials and Methods
2.1. Study Area
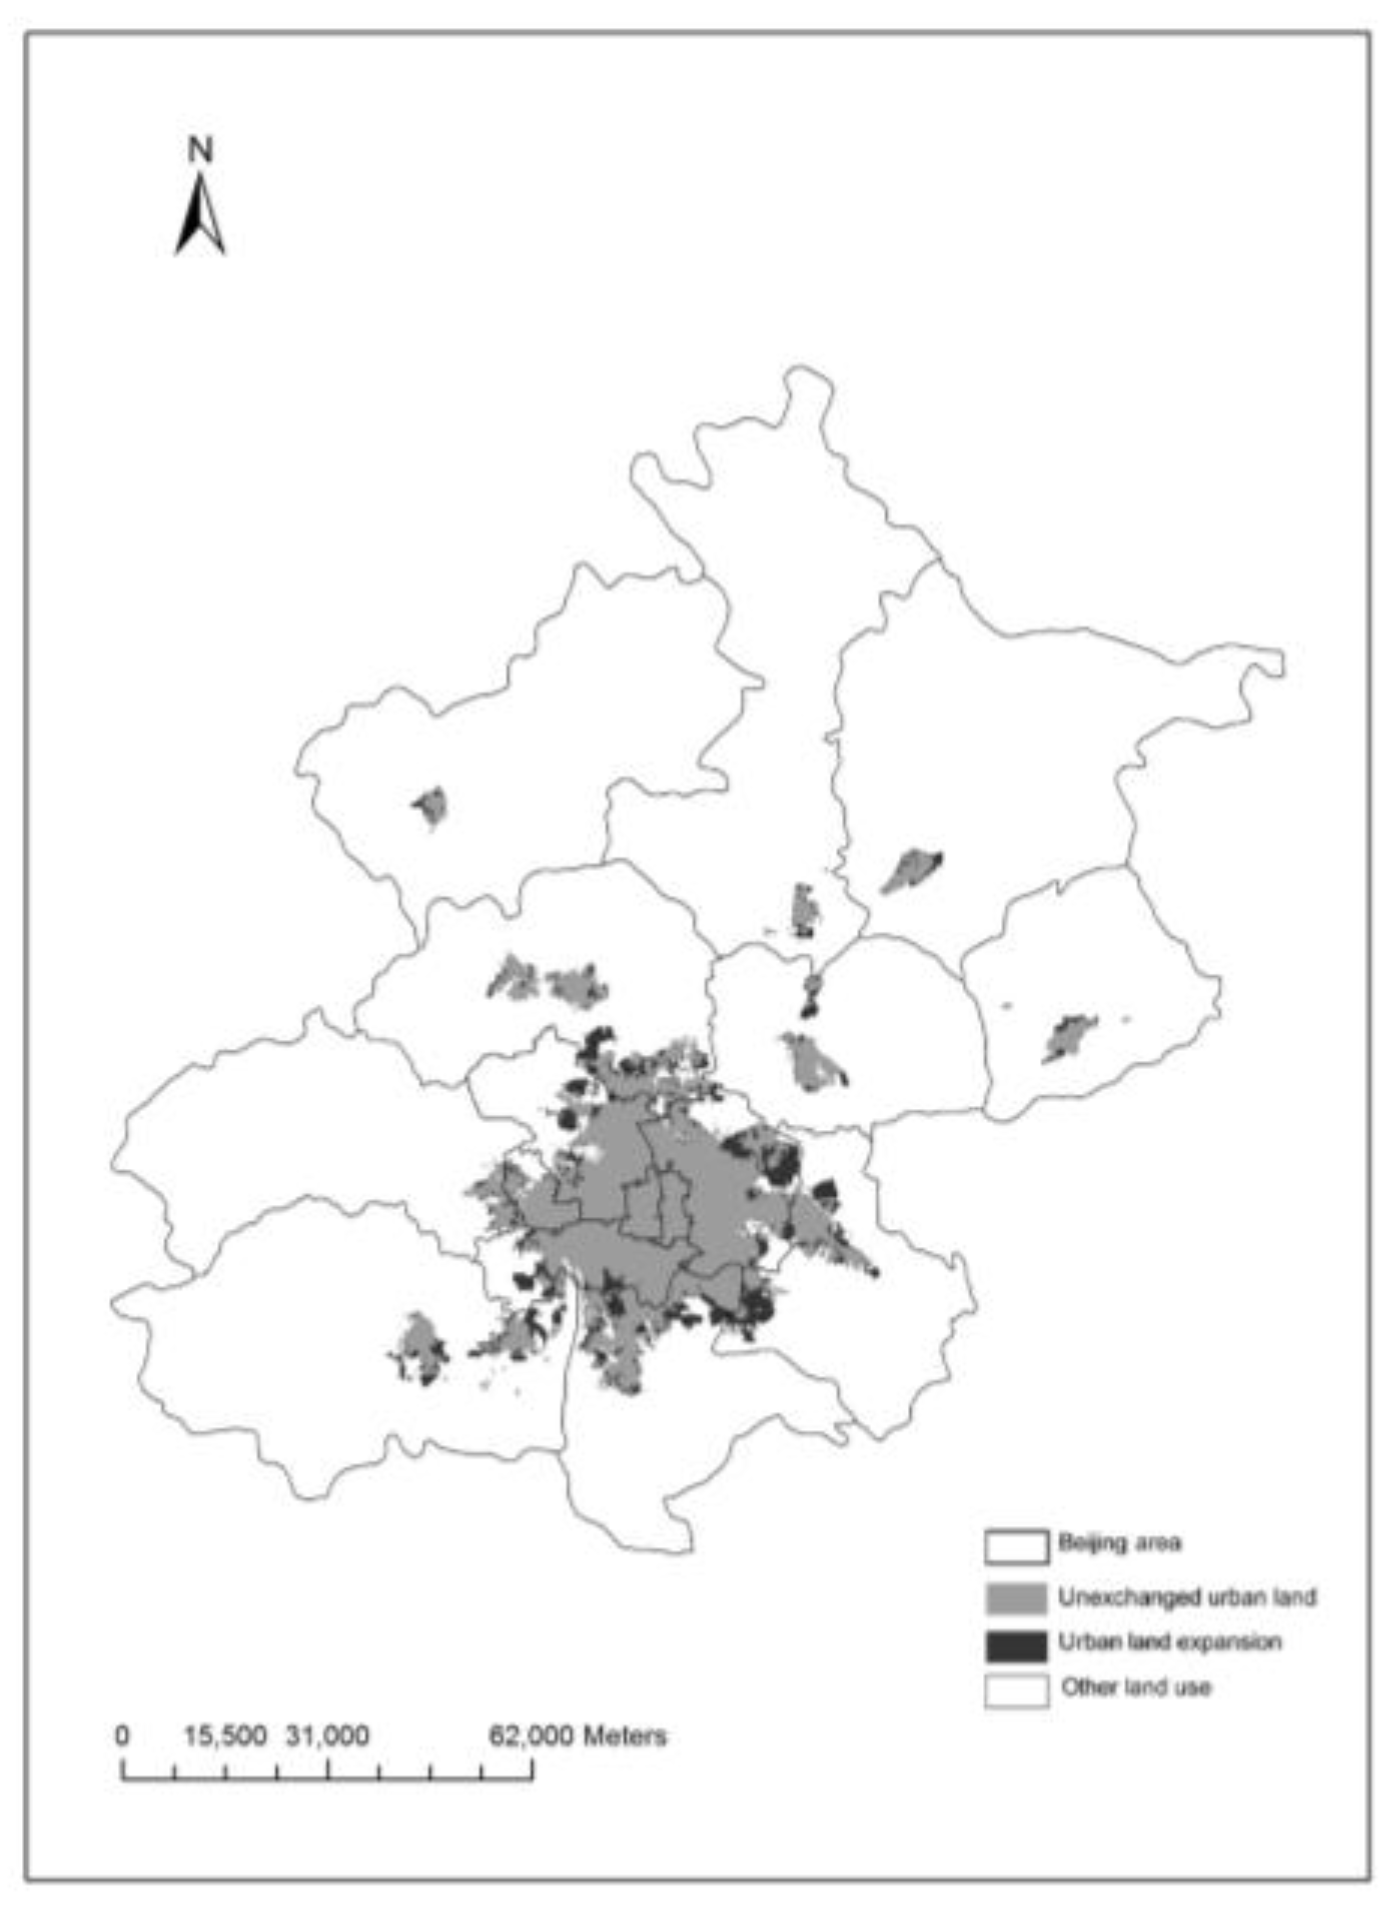
The entire Beijing area, China’s capital, featuring rapid population growth, was selected as the study area (as seen in Figure 1). Beijing is in northeast China (E 115.7°–117.4°, N 39.4°–41.6°) and covers 16,410.54 total square km2. In recent years, the population and economics of Beijing have grown rapidly. Urban expansion is also occurring at an incredible speed with this trend, which is typical in Chinese cities and has important research value. The urban population raised from 16.79 million in 2010 to 18.78 million in 2015. With rapid socioeconomic development, urban expansion increased. The urban land area in Beijing grew from 12,187 km2 to 16,412 km2 during the same period.
2.2. Potential Driving Forces and Data Sources
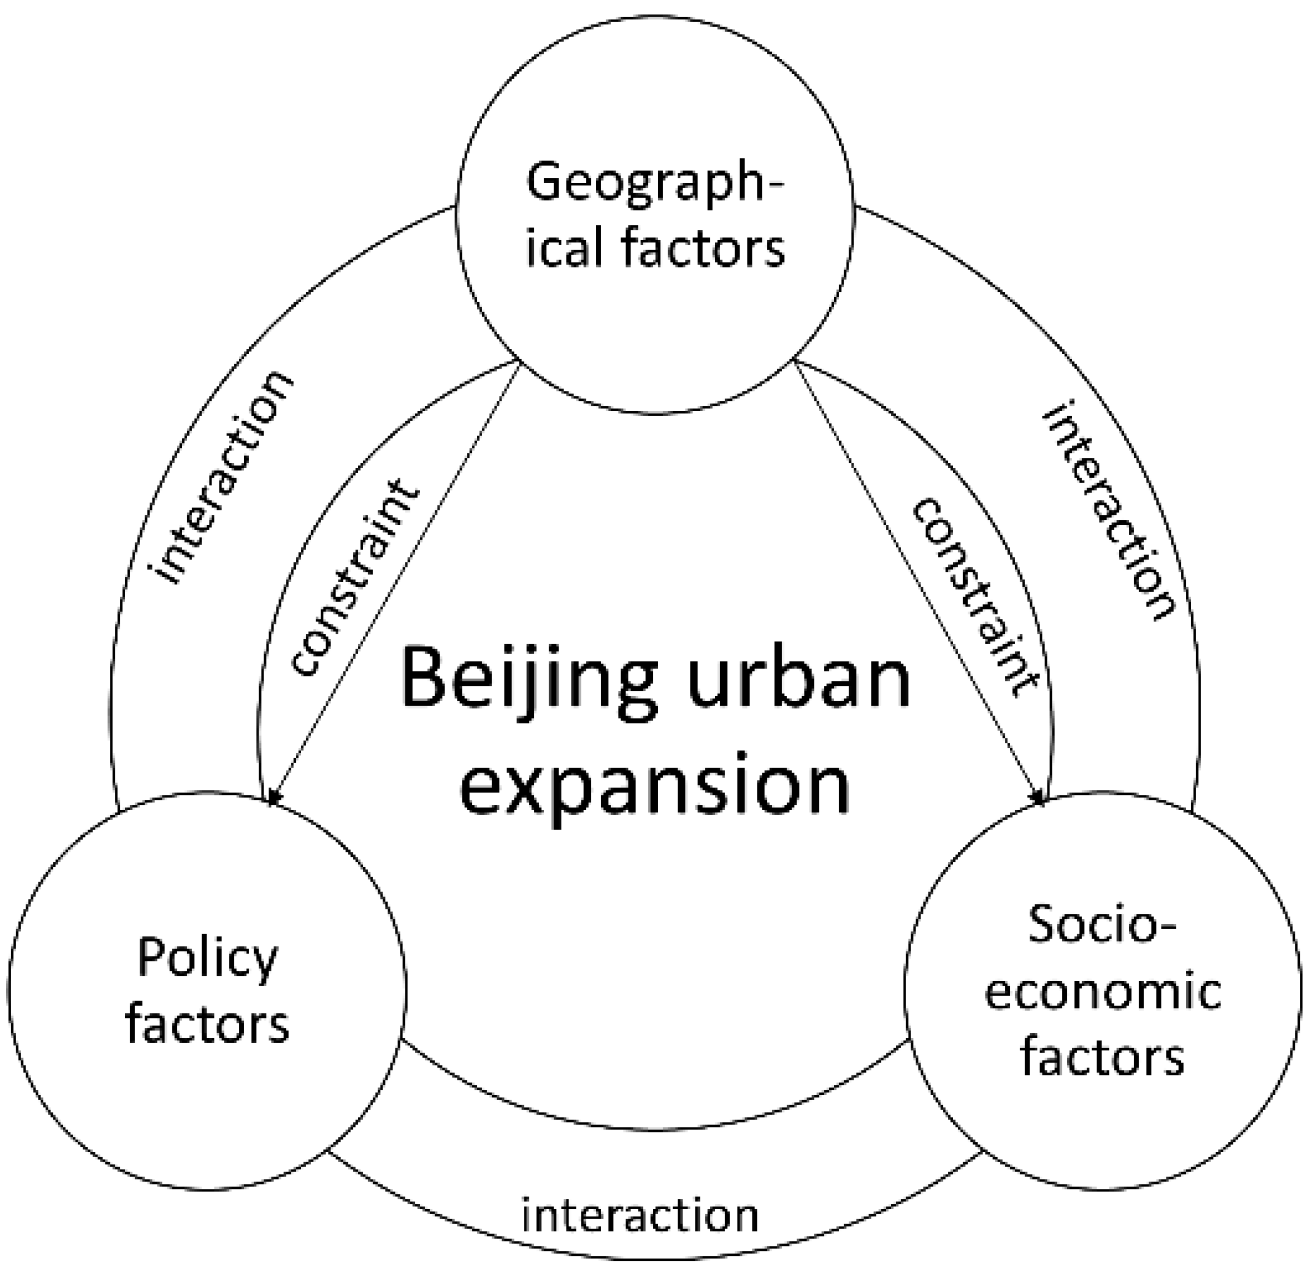
The driving forces of urban expansion in Beijing are complicated and diversiform. Through the research on the driving forces of urban space, three driving forces—socioeconomic, geographical environment, and policy guidance forces—are identified (Figure 2). The interaction among these three factors simultaneously affects urban expansion. Thirteen potential geographical, socioeconomic, and policy factors were selected in GeoDetector based on the literature review and the available data (Table 1). In China, a city master plan has proved to be a catalyst for urban growth. It features three guiding elements: land for new development, land for public facilities, and transportation [33]. Therefore, four factors are selected as proxies for urban planning: newly developed land, urban population density, distance to primary and middle schools, and distance to primary roads.
This study involved the vector data of land use for 2010 and 2015 in Beijing, which were obtained from Landsat 4–5 TM and Landsat7 ETM remote sensing images through a supervised classification and revision [34]. The spatial variable data of the influencing factors were obtained from the China Electronic Map (1:250,000) of 2012, and a digital elevation model (DEM) was taken from ASTER GDEM (NASA accessed on 03 November 2016). The economic and social data used in the research came from the Beijing Statistical Yearbook and the Beijing Regional Statistical Yearbook [35,36]. For socioeconomic factors, we derived the raster data by interpolation through ArcGIS 10.3. For point and polyline data, we used the ‘Euclidean distance’ in ArcGIS 10.3.
2.3. Methods
2.3.1. Measuring Urban Expansion
There are some indices that quantify the scale and extent of urban expansion. For instance, sprawl is often measured by the urban expansion intensity [37,38], or sometimes urban growth is replaced with urban population growth [39]. However, these indices do not show the real spatial pattern of urban expansion. Additionally, the dependent variable data required by GeoDectector are spatial data, so we proposed a new spatial expression method that can match the urban expansion and its grid cell driving forces. Different from other urban studies, to facilitate a quantitative analysis, the land use types were binarized using ArcGIS 10.3. Through this progression, we can derive a new binary map in which the urban areas are assigned the value 1, and other areas are assigned the value 0. Additionally, 6 different square grids were used to overlay the entire city of Beijing, with cell lengths of 3 km, 3.5 km, 4 km, 4.5 km, 5 km, and 5.5 km. The standard grid data and urban growth area of each grid were generated and the urban expansion ratio was calculated as follows:
where N (km2) is the area of each net (N = 3 × 3, 3.5 × 3.5, 4 × 4, 4.5 × 4.5, 5 × 5, and 5.5 × 5.5), and the urban growth area (km2) is the area of urban growth in each net, which was derived through ‘Clip’ in ArcGIS 10.3. This quantitative method offers a better spatial expression for urban expansion.
2.3.2. Modeling Using GeoDetector
GeoDetector is a spatial statistical method for detecting and analyzing spatial variation [40] and has been gradually applied to study regional economies, regional planning, land use, ecological environments, and so forth. [41,42,43,44]. Three detectors (factor, risk, and interaction detectors) were used in this study, excluding the ecological detector. This study tested the applicability of GeoDetector to analyze the mechanism of urban expansion. GeoDetector is an effective statistical method for urban growth analysis. Compared with other methods, GeoDetector can detect the relationships between factors and geographical phenomena can be extracted in the absence of any assumptions and limitations on the explanatory and response variables. Another advantage is the detection of the interaction of two factors on the dependent variable, especially for a complex urban system. In the study, the dependent variable is urban expansion ratio and the independent variables are urban expansion driving forces. Independent variables were derived by discretization due to the type data required by GeoDetector. GeoDetector is developed based on the following principles, through Excel and R language.
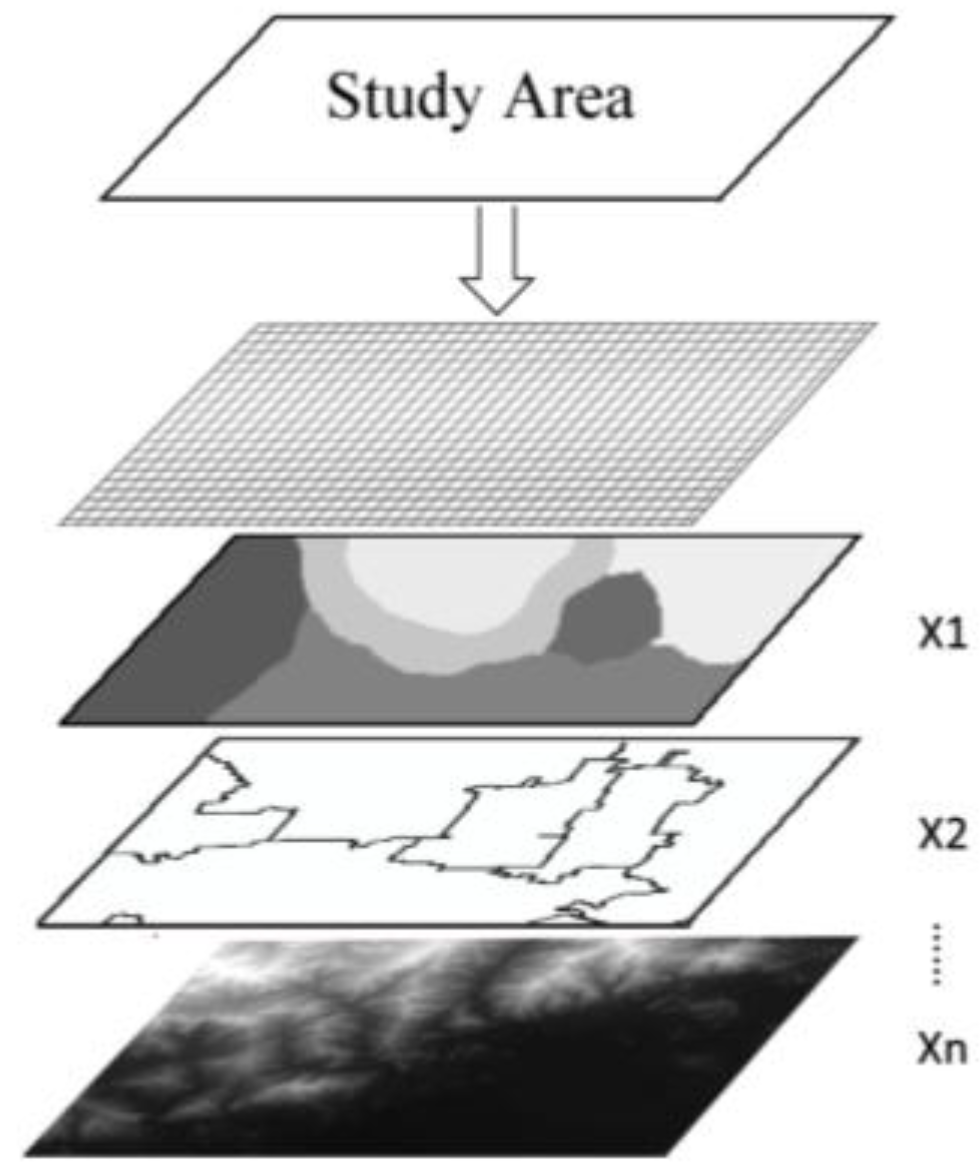
The factor detector can detect the spatial heterogeneity of the urban expansion ratio (Y) and determine the power (PD value) of the influence factors (Xn) on the urban expansion ratio. As shown in Figure 3, 13 independent variables were generated in 6 different sizes mentioned above, and the independent variables and dependent variable were related through the grid cell. The PD value was defined as
where i = 1, ..., n denotes the dependent variable (Y) or strata of X, that is, the classification of X (as seen in Table 2). N and denote the number of cells in the entire area and the variance of the urban expansion ratio in the study area, respectively. and are the sample number and the variance of the urban expansion ratio of n strata. PD ∈ [0, 1] is 1 if urban expansion is completely controlled by the determinant and 0 if the factor is totally irrelevant to urban expansion. Thus, PD represents the degree of interpretation of the influence factors on urban expansion.
The risk detector determines whether there is a significant difference between the mean values of the two classes by using a t-test. When the t value is larger, the urban area expands more rapidly.
where denotes the urban expansion ratio in classes i, is the grid number in the same subarea and Var is the variance.
The interaction detector identifies the two factors’ interaction, for example, whether the interactions between two factors X1 and X2 will increase or decrease the explanatory force for dependent variable Y or whether the effect of these factors on Y is independent. First, we calculate the PD values of two factors X1 and X2, and then calculate the PD value when we overlay the two factors; thus, a new overlay of X1 ∩ X2 that combines the attributes of X1 and X2 is created (as shown in Figure 3). The overlaying factors can be implemented in ArcGIS 10.3. The interaction can be defined as follows:
- Enhance:
- Bi-enhance:
- Enhance, nonlinear-:
- Weaken:
- Weaken, uni-enhance:
- Weaken, nonlinear-:
- Independent:
2.3.3. GeoDetector Modifiable Areal Unit Problem (MAUP)
The MAUP occurs when the analysis results vary according to the definition of the basic area unit [45]. The MAUP usually involves two components: a scale effect caused by different aggregations across scales and a zoning effect caused by different zoning alternatives [46,47]. The problem that occurs in the geographical data is “modifiable” or “arbitrary” [45] and leads to the subjective arbitrariness problem of area unit selection, which will impact the spatial analysis results. The MAUP has proven its existence in geography and other fields and has been a considerable concern in linear regression analyses and ecological studies, for example, References [46,48,49]. GeoDetector is a spatial statistical method that uses grid cells as a data source. Thus, the use of GeoDetector inevitably involves the MAUP. However, few studies have considered the MAUP when applying GeoDetector. In this study, each factor was divided into the same number of classes. Additionally, the scale and zoning effect on the impact of GeoDetector’s modeling results were quantitatively evaluated.
For the scale effect, six spatial scales were obtained through the urban expansion ratio. Simultaneously, six scale transformations were conducted at 3 km, 3.5 km, 4 km, 4.5 km, 5 km, and 5.5 km, with the resulting number of grid cells as 1984, 1483, 1144, 924, 755 and 634, respectively. The optimal GeoDetector scale was found by analyzing the PD values and their rankings, the scale which had a higher PD value and a relatively stable state was selected.
For the zoning effect, the impact of the different factor classification methods was compared. According to the usual methods of dividing factors, three methods were used in this study: the natural-break method, the quantile method, and the manual method with experience. According to the results of the scale analysis, GeoDetector modeling is based on different zoning schemes at the optimal scale. A horizontal comparison among the different zoning methods was performed.
3. Results and Analysis
3.1. GeoDetector MAUP
The number of classes was set to five for each factor when testing the GeoDetector MAUP. The socioeconomic data were divided by administrative region, which resulted in only 16 units. More classifications will lead to data scattering, and fewer classifications will not reflect the spatial heterogeneity.
We analyzed the scale effects by testing the PD values and rankings of the 13 factors at 6 different sizes (Figure 4). The PD values showed fluctuation with increasing grid size. As the grid size changed, the rankings of different factors also changed. The factors were ranked in a relatively stable way when the grid was 4 km × 4 km and 4.5 km × 4.5 km. Relatively speaking, the grid which was 3 km, 3.5 km, and 5.5 km fluctuate greatly. Additionally, the PD values at 4.5 km × 4.5 km were relatively larger than the 4 km grid size. Thus, 4.5 km was selected as the optimal GeoDetector scale in this study.
When testing the zoning effect, different classification methods resulted in different PD values, and there was no trend for the observed changes. However, previous studies have shown two methods that could be used in a geographic detector when the quantitative variables are classified; these methods are optimal classification algorithms and professional knowledge [31]. Additionally, random classification cannot express the actual relationship between the geographical phenomena and the factors [50], so, the quantile method was not used in the study. Both the natural-break method and the manual method were used in this study. The natural-break method was used to classify the socioeconomic data and was implemented in ArcGIS 10.3. The natural-break method is a natural grouping based on data. It can identify the classification, and group the similar values in the most appropriate way. This method is suitable for socioeconomic data, and the differences between the classes can be maximized. Geographical factors and policy factors have certain spatial distribution characteristics or have certain classification criteria, the classification of these factors is based on previous professional knowledge and data distribution.
3.2. Spatial Structural Evolution of Urban Expansion in Beijing
The existing urban expansion index cannot describe spatial forms, such as urban expansion speed and urban expansion intensity. This paper proposes an urban expansion ratio index to analyze the spatial variation of urban expansion. This index can be displayed more intuitively for the distribution pattern. The urban expansion ratio was calculated by using a 4500 m scale as the optimal grid (Figure 5).
Regarding dynamic changes from 2010 to 2015, the urban areas in Beijing experienced gradual expansion. With a large area of rural land being occupied, the need for cultivated land protection and the pressure on the ecological environment increases. Through the combination of the urban expansion ratio map (Figure 5) and the administrative zoning map, the Dongcheng and Xicheng Districts, which house the core functions of the capital, have reached a saturated state and can no longer be expanded, as seen from the urban expansion ratio value of zero in both districts. The grid cells in the Chaoyang, Fengtai, Shijingshan, and Haidian Districts show high urban expansion ratio values, indicating rapid urban land expansion. The ratios for grid cells in Tongzhou and Daxing Districts which are located near existing urban areas are relatively high, perhaps because of the call for the development of the surrounding satellite towns in “Beijing Master Plan (2004–2020)”. Urban expansion in Beijing can be summarized as an axial urbanization progress that has followed a circular shape between the central and peripheral secondary centers.
3.3. Analysis of the Determinants of Urban Expansion in Beijing
3.3.1. Which Determinants Are Responsible for Beijing’s Urban Expansion?
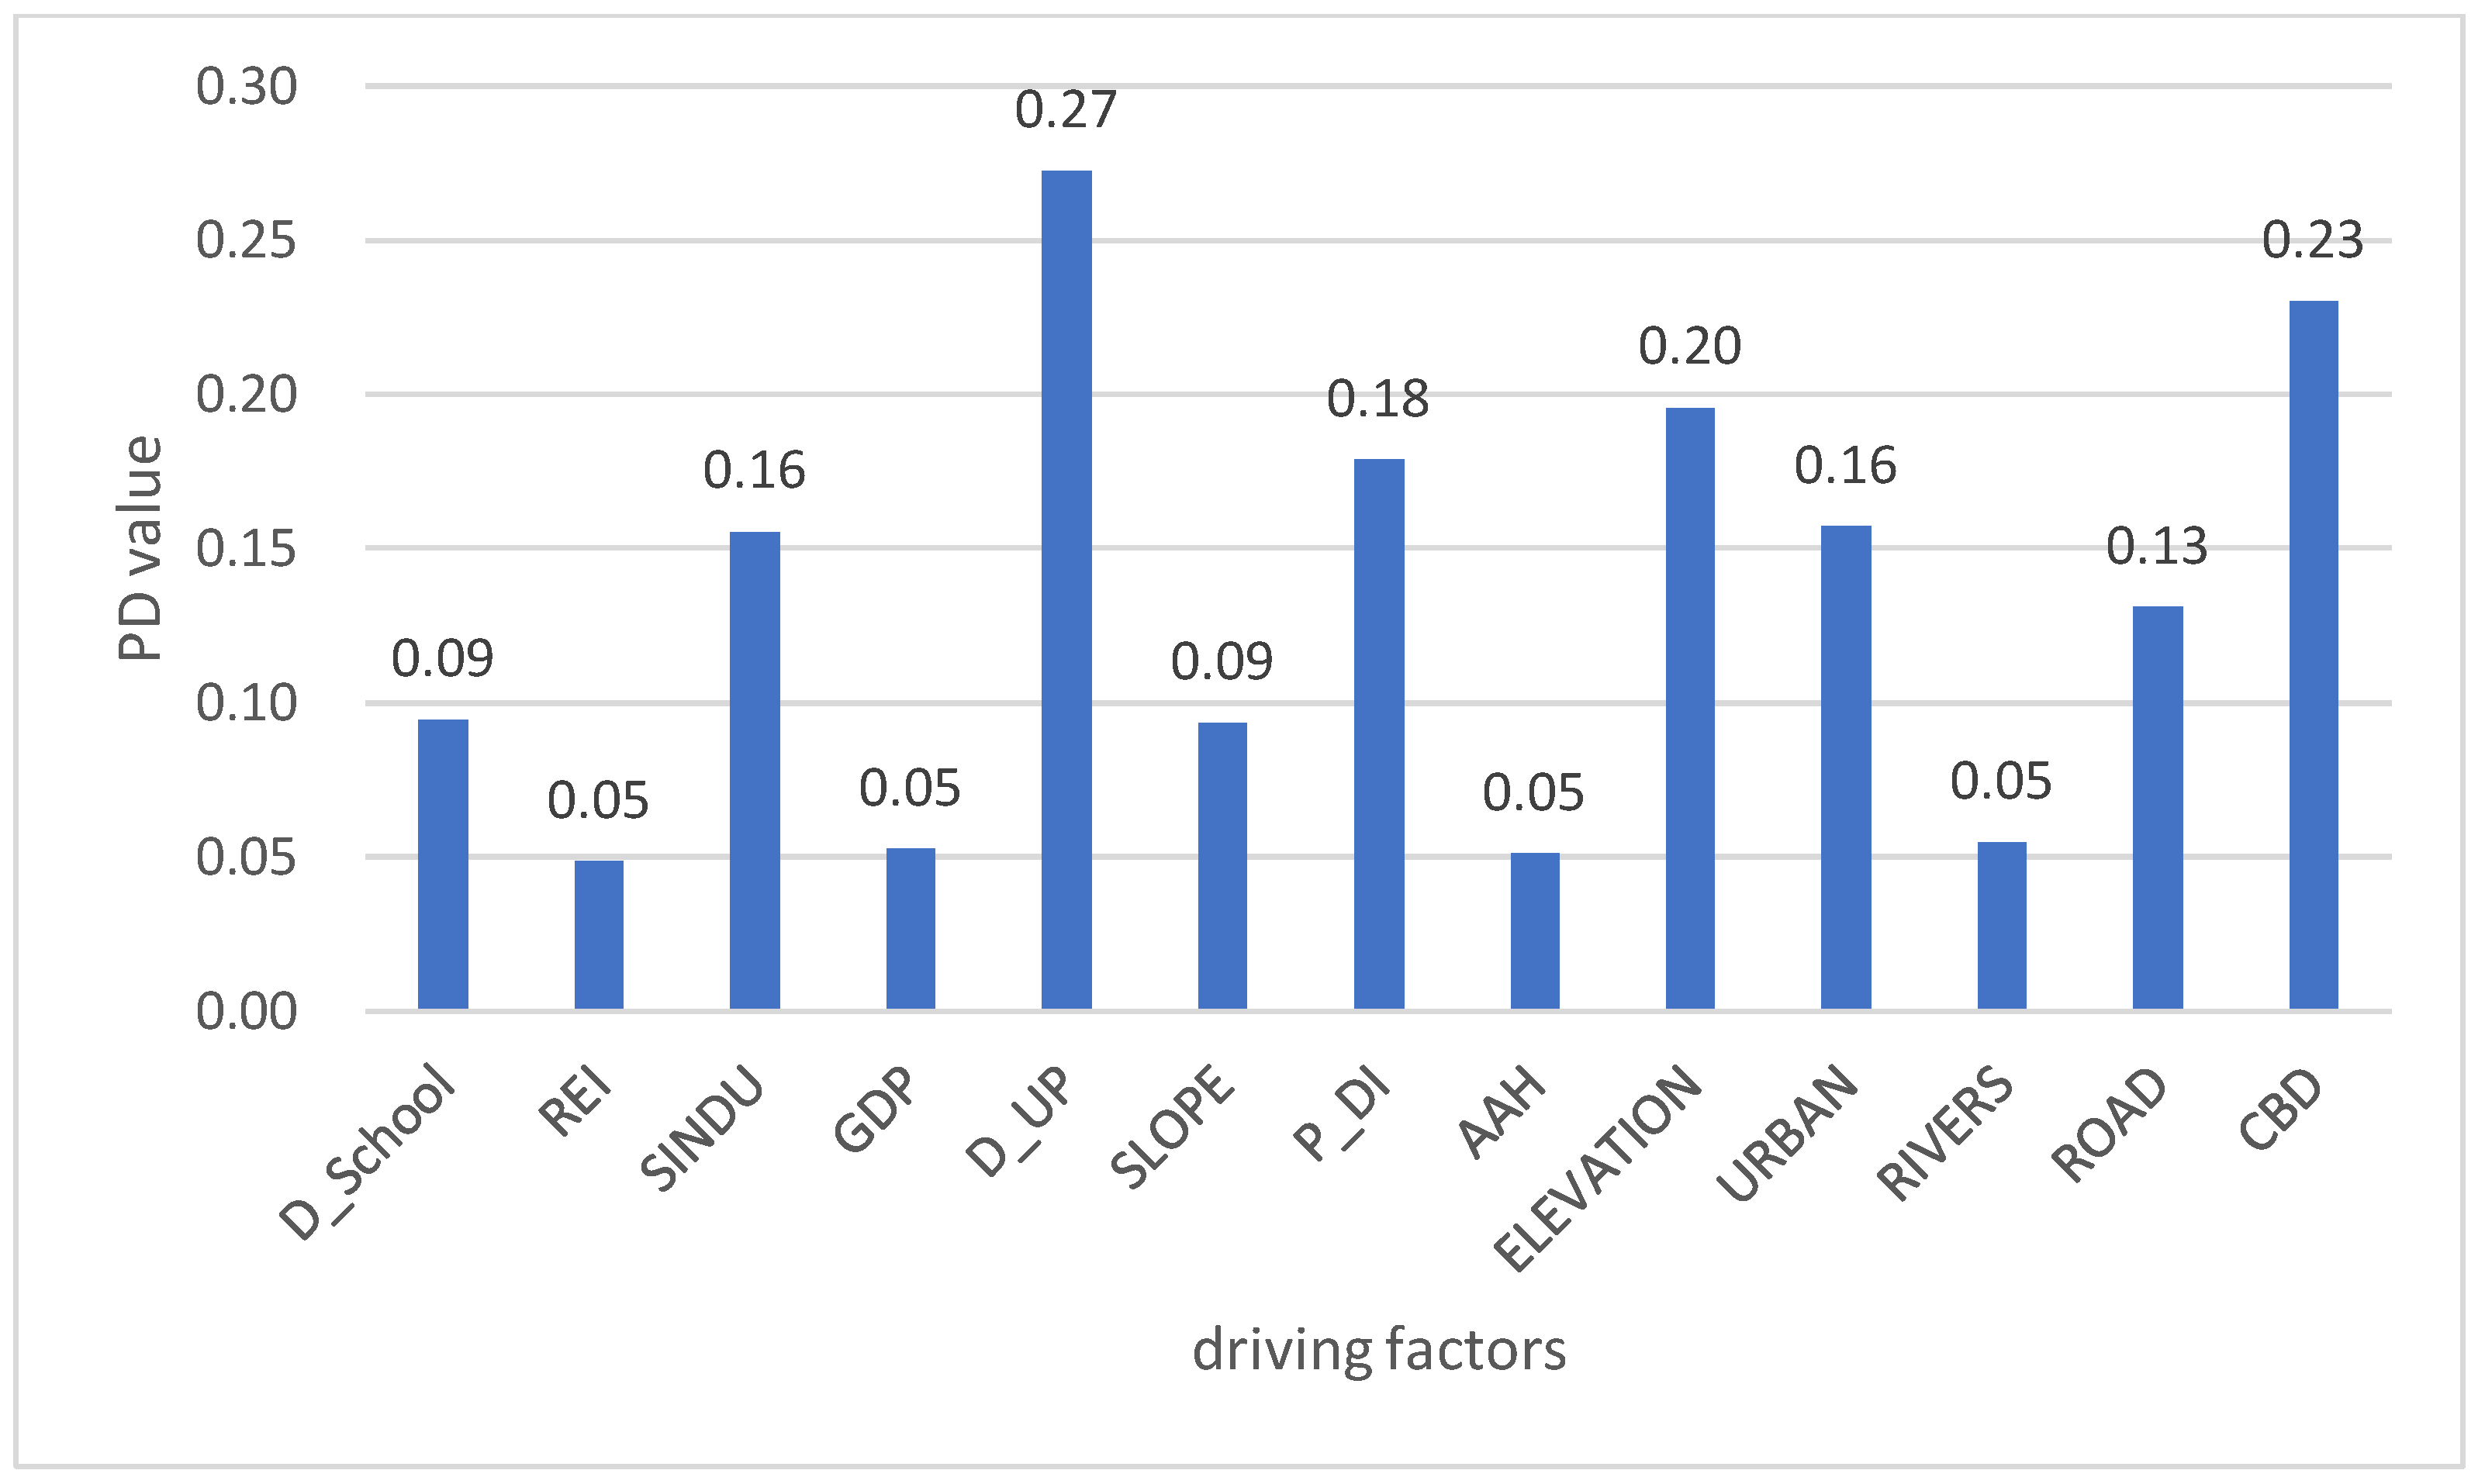
The PD value calculated by the factor detector represents the relative importance of the driving forces of urban expansion. As shown in Figure 6, the following factors are sorted according to their impact on urban expansion: D_UP > CBD > ELEVATION > P_DI > URBAN > SINDU > ROAD > D_School > SLOPE > RIVER > GDP > AAH > REI (see Table 1 for the specific explanations of these factors). The change in urban population density had the greatest influence at 0.27. To a certain extent, the urban population can reflect not only the size of the population that participated in industrial activities but also housing, transportation, and other needs in urban areas. Thus, the growth of urban population can directly affect the growth of urban land. The distance to the city center, which had a PD value of 0.23, also had a significant impact on urban growth. For undeveloped land, areas closer to the city center are more easily developed because of their economic, and human resources and facilities. Additionally, part of the reason for this significant effect is that when an area is closer to the city center, it is more influenced by urban planning.
3.3.2. What Is the Relative Importance of Urban Expansion for Each Determinant Stratum?
The risk detector reveals the urban expansion ratio of each factor in different sub-regions, that is, classes. The changes between 2010 and 2015 were used as the input data of the model for some factors that cannot reveal their own characteristics. Here, the geographical factors were chosen for discussion. Notably, different geographical factors and the urban expansion in Beijing have a strong correlation (Table 2). For example, when an area is closer to the main road, the impact of urban expansion is more obvious. In Beijing, a low elevation, a low slope, a location far from rivers, and easy access to transportation are the most attractive factors for residents. It is worth mentioning that a larger distance from rivers is more attractive because, considering the water pollution and convenient infrastructures in Beijing, people have convenient living conditions without being near the water source.
3.3.3. Whether the Driving Forces of Urban Expansion Are Independent of or Dependent on One Another?
The interaction detector was used to determine whether two urban expansion determinants operate independently. A total of 78 pairs were calculated for the interactions between any two of thirteen factors. The findings are tabulated in Table 3. Interactions between pairs of the factors drive one another. In addition, when the SINDU and CBD factors interact, the influence reaches a maximum value of 0.44. This finding means that the internal differences in urban expansion will be reduced under the control of any two factors. The influences of factors were significantly enhanced after the interaction, which also indicates that urban sprawl is the result of socioeconomic, geographical, and policy interactions.
4. Discussion
Urban expansion and its driving forces in Beijing from 2010 to 2015 were examined in this study. Through a quantitative expression of urban expansion and the GeoDetector modeling method, we found that geographical, socioeconomic, and policy factors jointly affect urban expansion. In addition, in contrast to previous studies, the driving forces are also different because of a different historical stage. Existing studies have shown that demographic factors have played an important role in the process of Beijing’s urban expansion [51,52,53]. We also found that population density has had the greatest impact on urban expansion in Beijing. E. Saarinen’s ‘Theory of Organic Decentralization’ refers to the impact of the population on urban space. Overall, with the natural growth of urban population and the rural population moving to urban areas, the urban industry inevitably expands to satisfy enough employment, resulting in the expansion of urban land. A growth in population directly drives urban expansion not only for Beijing. This study shows that the urban area in Beijing is gradually decreasing, with an increasing distance to the center, which is similar to the results that were obtained from another study [15]. In the 1960s, William Alonso introduced the “bid rent theory” based on the agricultural location theory and used it to research urban location. He posits that the central urban area is the most attractive for all types of land use under the conditions of a perfect market. The geographical advantage of a central urban area is that it attracts many commercial and financial service industries. This attraction causes the building volume fraction and coverage rate to increase significantly and the intensity of central urban land use is enhanced, which results in the expansion of a three-dimensional urban space.
Some studies prove that the economy is the fundamental driver of urban expansion in Beijing [11,54]. However, the results of the PD values in this study show that the impact of geographical factors on urban growth is greater than the impact of economic factors, which may be because when economic development reaches a certain level, it has a little impact on urban expansion. According to the data in this study, CBD and geographical factors had significant impacts on the urban growth in Beijing over the past five years. Regarding Beijing’s terrain, the proportion of mountainous areas is high, accounting for 62 percent of the total area, and the remaining plain areas that are suitable for urban construction are only approximately 2200 km2 [55]. Therefore, the development space in Beijing is compressed into the region between the Third Ring Road and the Fifth Ring Road, the eastern and southern plain areas. This limitation is due to the impact of Beijing’s terrain and geomorphology.
The results of the study emphasize the significance of policies in accelerating urban expansion, such as new urban land and urban population. For example, the PD values indicate that policy factors generally have a higher impact than other factors, and this result is consistent with some existing findings [16,17,18]. This result indirectly shows that the factors we chose as proxies of policies support our hypothesis of the importance of policy factors. Therefore, the policy factors cannot be ignored and the government’s influence on urban space has been subtle in Beijing’s previous urban planning. Urban planning is attempting to guide the scale, speed, and direction of urban expansion, and it has made a considerable effect to a certain extent.
We not only analyzed which factors had a greater impact on urban sprawl, but also detected which class of each factor is more influential. We found that lower elevation, lower slope, a farther location from rivers, and easier access to transportation were more attractive in Beijing. An interesting phenomenon was found: areas farther from the rivers are more attractive to urban residents, which is different from previous studies of other areas, especially not in China [56,57,58]. This result may be because there are few rivers in Beijing’s urban areas. Compared with rivers, people are more willing to choose convenient transportation and facilities. Another reason may be that the surrounding environment near rivers in Beijing is not very good.
The interaction detector analysis emphasizes the influence of the interactions between any two determinants on urban expansion. The role of the factors is not a “component” but a common effect of the “resultant force”, and none of these factors have a decisive role in urban expansion. The driving mechanism that created the resultant force promoted urban expansion in Beijing.
The study demonstrates the universality of GeoDetector by taking Beijing as the research area. However, the selection of influencing factors and the classification of each factor can be further studied. GeoDetector also has some limitations, for example, the independent variable can only be type data, so different classification methods will have different effects on the outcome. Additionally, the maximum line capacity of GeoDetector is 32,767, so it cannot handle a larger amount of data.
5. Conclusions
New urbanization has become a new strategy in China, and the improvement in the quality of urbanization is sought. Studies on the driving forces of urban expansion are an important tool for managing urban expansion. Exploring the mechanism of urban expansion contributes to increasing the accuracy of simulating sustainable urban expansion. Generally, it is impossible to analyze the effects of geographical and socioeconomic factors on urban growth at spatial scales, especially policy factors. The mechanism of urban expansion is better explained with GeoDetector, which provides a new perspective on and a new method for the study of urbanization. Additionally, GeoDetector also provides effective support for urban planners. Our conclusions are summarized as follows.
The MAUP of GeoDetector, which was missing in previous research, was explored. Moreover, this study demonstrated the necessity to explore the MAUP before applying GeoDetector. The optimal scale for GeoDetector in Beijing is 4500 m. Through the spatial expression of urban expansion, it is concluded that Beijing’s urban space is continuously expanding and that the central and peripheral center areas are linearly expanding along the trunk line. However, urban expansion in the suburbs is less significant.
From the set of factors we selected, the influences on urban expansion in Beijing are mainly the following 8 factors in order: D_UP > CBD > ELEVATION > P_DI > URBAN > SINDU > ROAD > D_School. Population density has the most influence on urban expansion, and traffic infrastructure will drive urban growth to a great extent. Therefore, policy factors cannot be neglected.
The effect of any two factors on urban expansion is greater than one factor, which indicates that there is the typical “bucket effect” between urban expansion and its driving forces [59]. That is, any change in the factors may affect changes in the urban space. Therefore, socioeconomic, geographical, and policy factors together restrict, advance, and impact urban expansion.
The spatial characteristics and mechanism of urban expansion were analyzed in this study. However, it is difficult to consider all elements, and only 13 factors were selected for the current research. Future studies may explore the impact on the urban expansion mechanism from multiple periods and different factors. When the mechanism is more accurate, the simulation and analysis of urban expansion will be improved.
Author Contributions
All authors contributed to the data extraction; Q.X. and C.Z. conducted the model building; Q.X. and X.Z. contributed the comparison and discussion, and all authors contributed to improving final manuscript.
Funding
The research was funded by [International S&T Cooperation Program of China] grant number [2015DFA01370], [National Natural Science Foundation of China] grant number [41601432], and [Beijing Natural Science Foundation] grant number [8174074].
Conflicts of Interest
The authors declare no conflict of interest.
References
- Department of Economic and Social Affairs. World Urbanization Prospects: The 2014 Revision. Available online: https://esa.un.org/unpd/wup/Publications/Files/WUP2014-Report.pdf (accessed on 11 March 2016).
- Development Planning Division, National Development and Reform Commission (NDRC), People´s Republic of China. National New Urbanization Plan (2014–2020). Available online: http://ghs.ndrc.gov.cn/zttp/xxczhjs/ghzc/201605/t20160505_800839.html (accessed on 27 April 2018).
- Clarke, K.C.; Gaydos, L.J. Loose-coupling a cellular automaton model and GIS: Long-term urban growth prediction for San Francisco and Washington/Baltimore. Int. J. Geogr. Inf. Sci. 1998, 12, 699–714. [Google Scholar] [CrossRef] [PubMed]
- Meentemeyer, R.K.; Tang, W.; Dorning, M.A.; Vogler, J.B.; Cunniffe, N.J.; Shoemaker, D.A. Futures: Multilevel simulations of emerging urban–rural landscape structure using a stochastic patch-growing algorithm. Ann. Assoc. Am. Geogr. 2013, 103, 785–807. [Google Scholar] [CrossRef]
- Jiang, L.; Deng, X.; Seto, K.C. Multi-level modeling of urban expansion and cultivated land conversion for urban hotspot counties in china. Landsc. Urban Plan. 2012, 108, 131–139. [Google Scholar] [CrossRef]
- Dewan, A.M.; Yamaguchi, Y. Land use and land cover change in Greater Dhaka, Bangladesh: Using remote sensing to promote sustainable urbanization. Appl. Geogr. 2009, 29, 390–401. [Google Scholar] [CrossRef]
- De la Luz Hernández-Flores, M.; Otazo-Sánchez, E.M.; Galeana-Pizaña, M.; Roldán-Cruz, E.I.; Razo-Zárate, R.; González-Ramírez, C.A.; Galindo-Castillo, E.; Gordillo-Martínez, A.J. Urban driving forces and megacity expansion threats. Study case in the Mexico City periphery. Habitat Int. 2017, 64, 109–122. [Google Scholar] [CrossRef]
- Estoque, R.C.; Murayama, Y. Landscape pattern and ecosystem service value changes: Implications for environmental sustainability planning for the rapidly urbanizing summer capital of the Philippines. Landsc. Urban Plan. 2013, 116, 60–72. [Google Scholar] [CrossRef]
- Liu, J.; Zhan, J.; Deng, X. Spatio-temporal patterns and driving forces of urban land expansion in China during the economic reform era. AMBIO 2005, 34, 450–455. [Google Scholar] [CrossRef] [PubMed]
- Xiao, J.; Shen, Y.; Ge, J.; Tateishi, R.; Tang, C.; Liang, Y.; Huang, Z. Evaluating urban expansion and land use change in Shijiazhuang, China, by using GIS and remote sensing. Landsc. Urban Plan. 2006, 75, 69–80. [Google Scholar] [CrossRef]
- Li, X.; Zhou, W.; Ouyang, Z. Forty years of urban expansion in Beijing: What is the relative importance of physical, socioeconomic, and neighborhood factors? Appl. Geogr. 2013, 38, 1–10. [Google Scholar] [CrossRef]
- Zhang, Y.; Gong, H.; Zhao, W.; Li, X. Analyzing the mechanism of land use change in Beijing city from 1990 to 2000. Resour. Sci. 2007, 29, 206–213. [Google Scholar]
- Zhang, Z.; Su, S.; Xiao, R.; Jiang, D.; Wu, J. Identifying determinants of urban growth from a multi-scale perspective: A case study of the urban agglomeration around Hangzhou Bay, China. Appl. Geogr. 2013, 45, 193–202. [Google Scholar] [CrossRef]
- Su, S.; Xiao, R.; Jiang, Z.; Zhang, Y. Characterizing landscape pattern and ecosystem service value changes for urbanization impacts at an eco-regional scale. Appl. Geogr. 2012, 34, 295–305. [Google Scholar] [CrossRef]
- Quan, Q.; Tian, G. A gradient analysis of spatiotemporal changes of urban landscape pattern in Beijing metropolitan region by GIS. Ecol. Sci. 2008, 27, 254–261. [Google Scholar]
- Long, Y.; Gu, Y.; Han, H. Spatiotemporal heterogeneity of urban planning implementation effectiveness: Evidence from five urban master plans of Beijing. Landsc. Urban Plan. 2012, 108, 103–111. [Google Scholar] [CrossRef]
- Daquan, H.; Jin, H.; Zhao, X. Determinants of land conversion to urban uses in Changping district, Beijing. Resour. Sci. 2014, 36, 454–462. [Google Scholar]
- He, C.; Shi, P.; Chen, J.; Xu, X. Process and mechanism of urbanization in Beijing area. Acta Geogr. Sin. 2002, 57, 363–371. [Google Scholar]
- Dendoncker, N.; Rounsevell, M.; Bogaert, P. Spatial analysis and modelling of land use distributions in Belgium. Comput. Environ. Urban Syst. 2007, 31, 188–205. [Google Scholar] [CrossRef]
- Dubovyk, O.; Sliuzas, R.; Flacke, J. Spatio-temporal modelling of informal settlement development in Sancaktepe district, Istanbul, Turkey. ISPRS J. Photogramm. Remote Sens. 2011, 66, 235–246. [Google Scholar] [CrossRef]
- Reilly, M.K.; O’Mara, M.P.; Seto, K.C. From Bangalore to the Bay Area: Comparing transportation and activity accessibility as drivers of urban growth. Landsc. Urban Plan. 2009, 92, 24–33. [Google Scholar] [CrossRef]
- Haregeweyn, N.; Fikadu, G.; Tsunekawa, A.; Tsubo, M.; Meshesha, D.T. The dynamics of urban expansion and its impacts on land use/land cover change and small-scale farmers living near the urban fringe: A case study of Bahir Dar, Ethiopia. Landsc. Urban Plan. 2012, 106, 149–157. [Google Scholar] [CrossRef]
- Wu, K.; Zhang, H. Land use dynamics, built-up land expansion patterns, and driving forces analysis of the fast-growing Hangzhou metropolitan area, eastern China (1978–2008). Appl. Geogr. 2012, 34, 137–145. [Google Scholar] [CrossRef]
- Müller, K.; Steinmeier, C.; Küchler, M. Urban growth along motorways in Switzerland. Landsc. Urban Plan. 2010, 98, 3–12. [Google Scholar] [CrossRef]
- Seto, K.C.; Fragkias, M.; Güneralp, B.; Reilly, M.K. A meta-analysis of global urban land expansion. PLoS ONE 2011, 6, e23777. [Google Scholar] [CrossRef] [PubMed]
- Thapa, R.B.; Murayama, Y. Drivers of urban growth in the Kathmandu valley, Nepal: Examining the efficacy of the analytic hierarchy process. Appl. Geogr. 2010, 30, 70–83. [Google Scholar] [CrossRef]
- Chen, J.; Gong, P.; He, C.; Luo, W.; Tamura, M.; Shi, P. Assessment of the urban development plan of Beijing by using a ca-based urban growth model. Photogramm. Eng. Remote Sens. 2002, 68, 1063–1072. [Google Scholar]
- Fang, S.; Gertner, G.Z.; Sun, Z.; Anderson, A.A. The impact of interactions in spatial simulation of the dynamics of urban sprawl. Landsc. Urban Plan. 2005, 73, 294–306. [Google Scholar] [CrossRef]
- Arsanjani, J.J.; Helbich, M.; de Noronha Vaz, E. Spatiotemporal simulation of urban growth patterns using agent-based modeling: The case of Tehran. Cities 2013, 32, 33–42. [Google Scholar] [CrossRef]
- Shao, J.A.; Wei, C.F.; Xie, D.T. An insight on drivers of land use change at regional scale. Chin. Geogr. Sci. 2006, 16, 176–182. [Google Scholar] [CrossRef]
- Wang, J.; Xu, C. Geodetector: Principle and prospective. Acta Geogr. Sin. 2017, 72, 116–134. [Google Scholar]
- Tian, L.; Li, Y.; Yan, Y.; Wang, B. Measuring urban sprawl and exploring the role planning plays: A Shanghai case study. Land Use Policy 2017, 67, 426–435. [Google Scholar] [CrossRef]
- Tian, L.; Shen, T. Evaluation of plan implementation in the transitional china: A case of Guangzhou city master plan. Cities 2011, 28, 11–27. [Google Scholar] [CrossRef]
- Geospatial Data Cloud. Landsat Serial Data. Available online: http://www.Gscloud.Cn (accessed on 8 March 2016).
- Beijing Municipal Bureau of Statistics. Beijing Statistical Yearbook. Available online: http://tjj.beijing.gov.cn/nj/main/2016-tjnj/zk/indexch.htm (accessed on 27 April 2018).
- Beijing Municipal Bureau of Statistics. Beijing Regional Statistical Yearbook. Available online: http://tjj.beijing.gov.cn/nj/qxnj/2016/zk/indexch.htm (accessed on 27 April 2018).
- Liu, M.; Wang, Y.; Dai, Z.; Li, Q. GIS-based urban land development intensity impact factors analysis. In Artificial Intelligence and Computational Intelligence; Springer: Berlin/Heidelberg, Germany, 2012; Volume 7530. [Google Scholar]
- Li, X.; Liang, C.; Shi, J.; Li, M. Spatiotemporal dynamics and urban land-use transformation in the rapid urbanization of the Shanghai metropolitan area in the 1980s–2000s. J. Environ. Inf. 2015, 20, 103–114. [Google Scholar] [CrossRef]
- Zhang, Z.; Liu, J.; Zhao, Y.; Qiu, A. Spatial patterns and driving forces of population urbanization in the Yangtze River economic zone. Sci. Surv. Mapp. 2016, 41, 94–100. [Google Scholar]
- Wang, J.; Hu, Y. Environmental health risk detection with geogdetector. Environ. Model. Softw. 2012, 33, 114–115. [Google Scholar] [CrossRef]
- Liu, Y.; Yang, R. Spatial characteristics and mechanisms of county level urbanization in China. Acta Geogr. Sin. 2012, 67, 1011–1020. [Google Scholar]
- Tan, J.; Zhang, P.; Lo, K.; Li, J.; Liu, S. The urban transition performance of resource-based cities in northeast China. Sustainability 2016, 8, 1022. [Google Scholar] [CrossRef]
- Wu, R.; Zhang, J.; Bao, Y.; Zhang, F. Geographical detector model for influencing factors of industrial sector carbon dioxide emissions in Inner Mongolia, China. Sustainability 2016, 8, 149. [Google Scholar] [CrossRef]
- Zhang, N.; Jing, Y.; Liu, C.; Li, Y.; Shen, J. A cellular automaton model for grasshopper population dynamics in Inner Mongolia steppe habitats. Ecol. Model. 2016, 329, 5–17. [Google Scholar] [CrossRef]
- Openshaw, S. Ecological fallacies and the analysis of areal census data. Environ. Plan. A 1984, 16, 17–31. [Google Scholar] [CrossRef] [PubMed]
- Fotheringham, A.S.; Wong, D.W. The modifiable areal unit problem in multivariate statistical analysis. Environ. Plan. A 1991, 23, 1025–1044. [Google Scholar] [CrossRef]
- Openshaw, S.; Taylor, P. A million or so correlation coefficients: Three experiments on the modifiable areal unit problem. In Statistical Methods in the Spatial Sciences; Routledge and Kegan Paul: London, UK, 1979; pp. 127–144. [Google Scholar]
- Clark, W.A.; Avery, K.L. The effects of data aggregation in statistical analysis. Geogr. Anal. 1976, 8, 428–438. [Google Scholar] [CrossRef]
- Swift, A.; Liu, L.; Uber, J. Reducing MAUP bias of correlation statistics between water quality and GI illness. Comput. Environ. Urban Syst. 2008, 32, 134–148. [Google Scholar] [CrossRef]
- Hu, Y.; Wang, J.; Li, X.; Ren, D.; Zhu, J. Geographical detector-based risk assessment of the under-five mortality in the 2008 Wenchuan earthquake, China. PLoS ONE 2011, 6, e21427. [Google Scholar] [CrossRef] [PubMed]
- Huang, Q.; He, C.; Shi, P.; Zhao, Y.; Yang, Y.; Liu, H. Understanding multi-scale urban expansion driving forces: In the case study of Beijing. Econ. Geogr. 2009, 29, 714–721. [Google Scholar]
- Li, L.; Sato, Y.; Zhu, H. Simulating spatial urban expansion based on a physical process. Landsc. Urban Plan. 2003, 64, 67–76. [Google Scholar] [CrossRef]
- He, C.; Okada, N.; Zhang, Q.; Shi, P.; Li, J. Modelling dynamic urban expansion processes incorporating a potential model with cellular automata. Landsc. Urban Plan. 2008, 86, 79–91. [Google Scholar] [CrossRef]
- Piao, Y.; Ma, K. Economic driving force of urban built-up area expansion in Beijing: 1978–2002. Nat. Resour. Econ. China 2006, 19, 34–37. [Google Scholar]
- Zhou, Y. On the suburbanization of Beijing. Chin. Geogr. Sci. 1997, 7, 208–219. [Google Scholar] [CrossRef]
- Li, Z.; Deng, X.; Wu, F.; Hasan, S.S. Scenario analysis for water resources in response to land use change in the middle and upper reaches of the heihe river basin. Sustainability 2015, 7, 3086–3108. [Google Scholar] [CrossRef]
- Ashfa, A.; Sirojuzilam, H.; Badaruddin, D.; Dwira, N. Modeling of urban growth in tsunami-prone city using logistic regression: Analysis of Banda Aceh, Indonesia. Appl. Geogr. 2015, 62, 237–246. [Google Scholar]
- Jun, L.; Dennis, W. Modeling spatial variations of urban growth patterns in Chinese cities: The case of Nanjing. Landsc. Urban Plan. 2009, 91, 51–64. [Google Scholar]
- Zhan, D.; Zhang, W.; Yu, J.; Meng, B.; Dang, Y. Analysis of influencing mechanism of residents’ livability satisfaction in Beijing using geographical detector. Prog. Geogr. 2015, 34, 966–975. [Google Scholar]
Figure 1.
The map of the study area in Beijing that shows the urban land use change from 2010 to 2015.
Figure 1.
The map of the study area in Beijing that shows the urban land use change from 2010 to 2015.

Figure 2.
The relationships among Beijing’s urban expansion factors.

Figure 3.
The principle of GeoDetector.

Figure 4.
(a) The scale effects on the PD values; (b) the scale effects on the factor rankings.
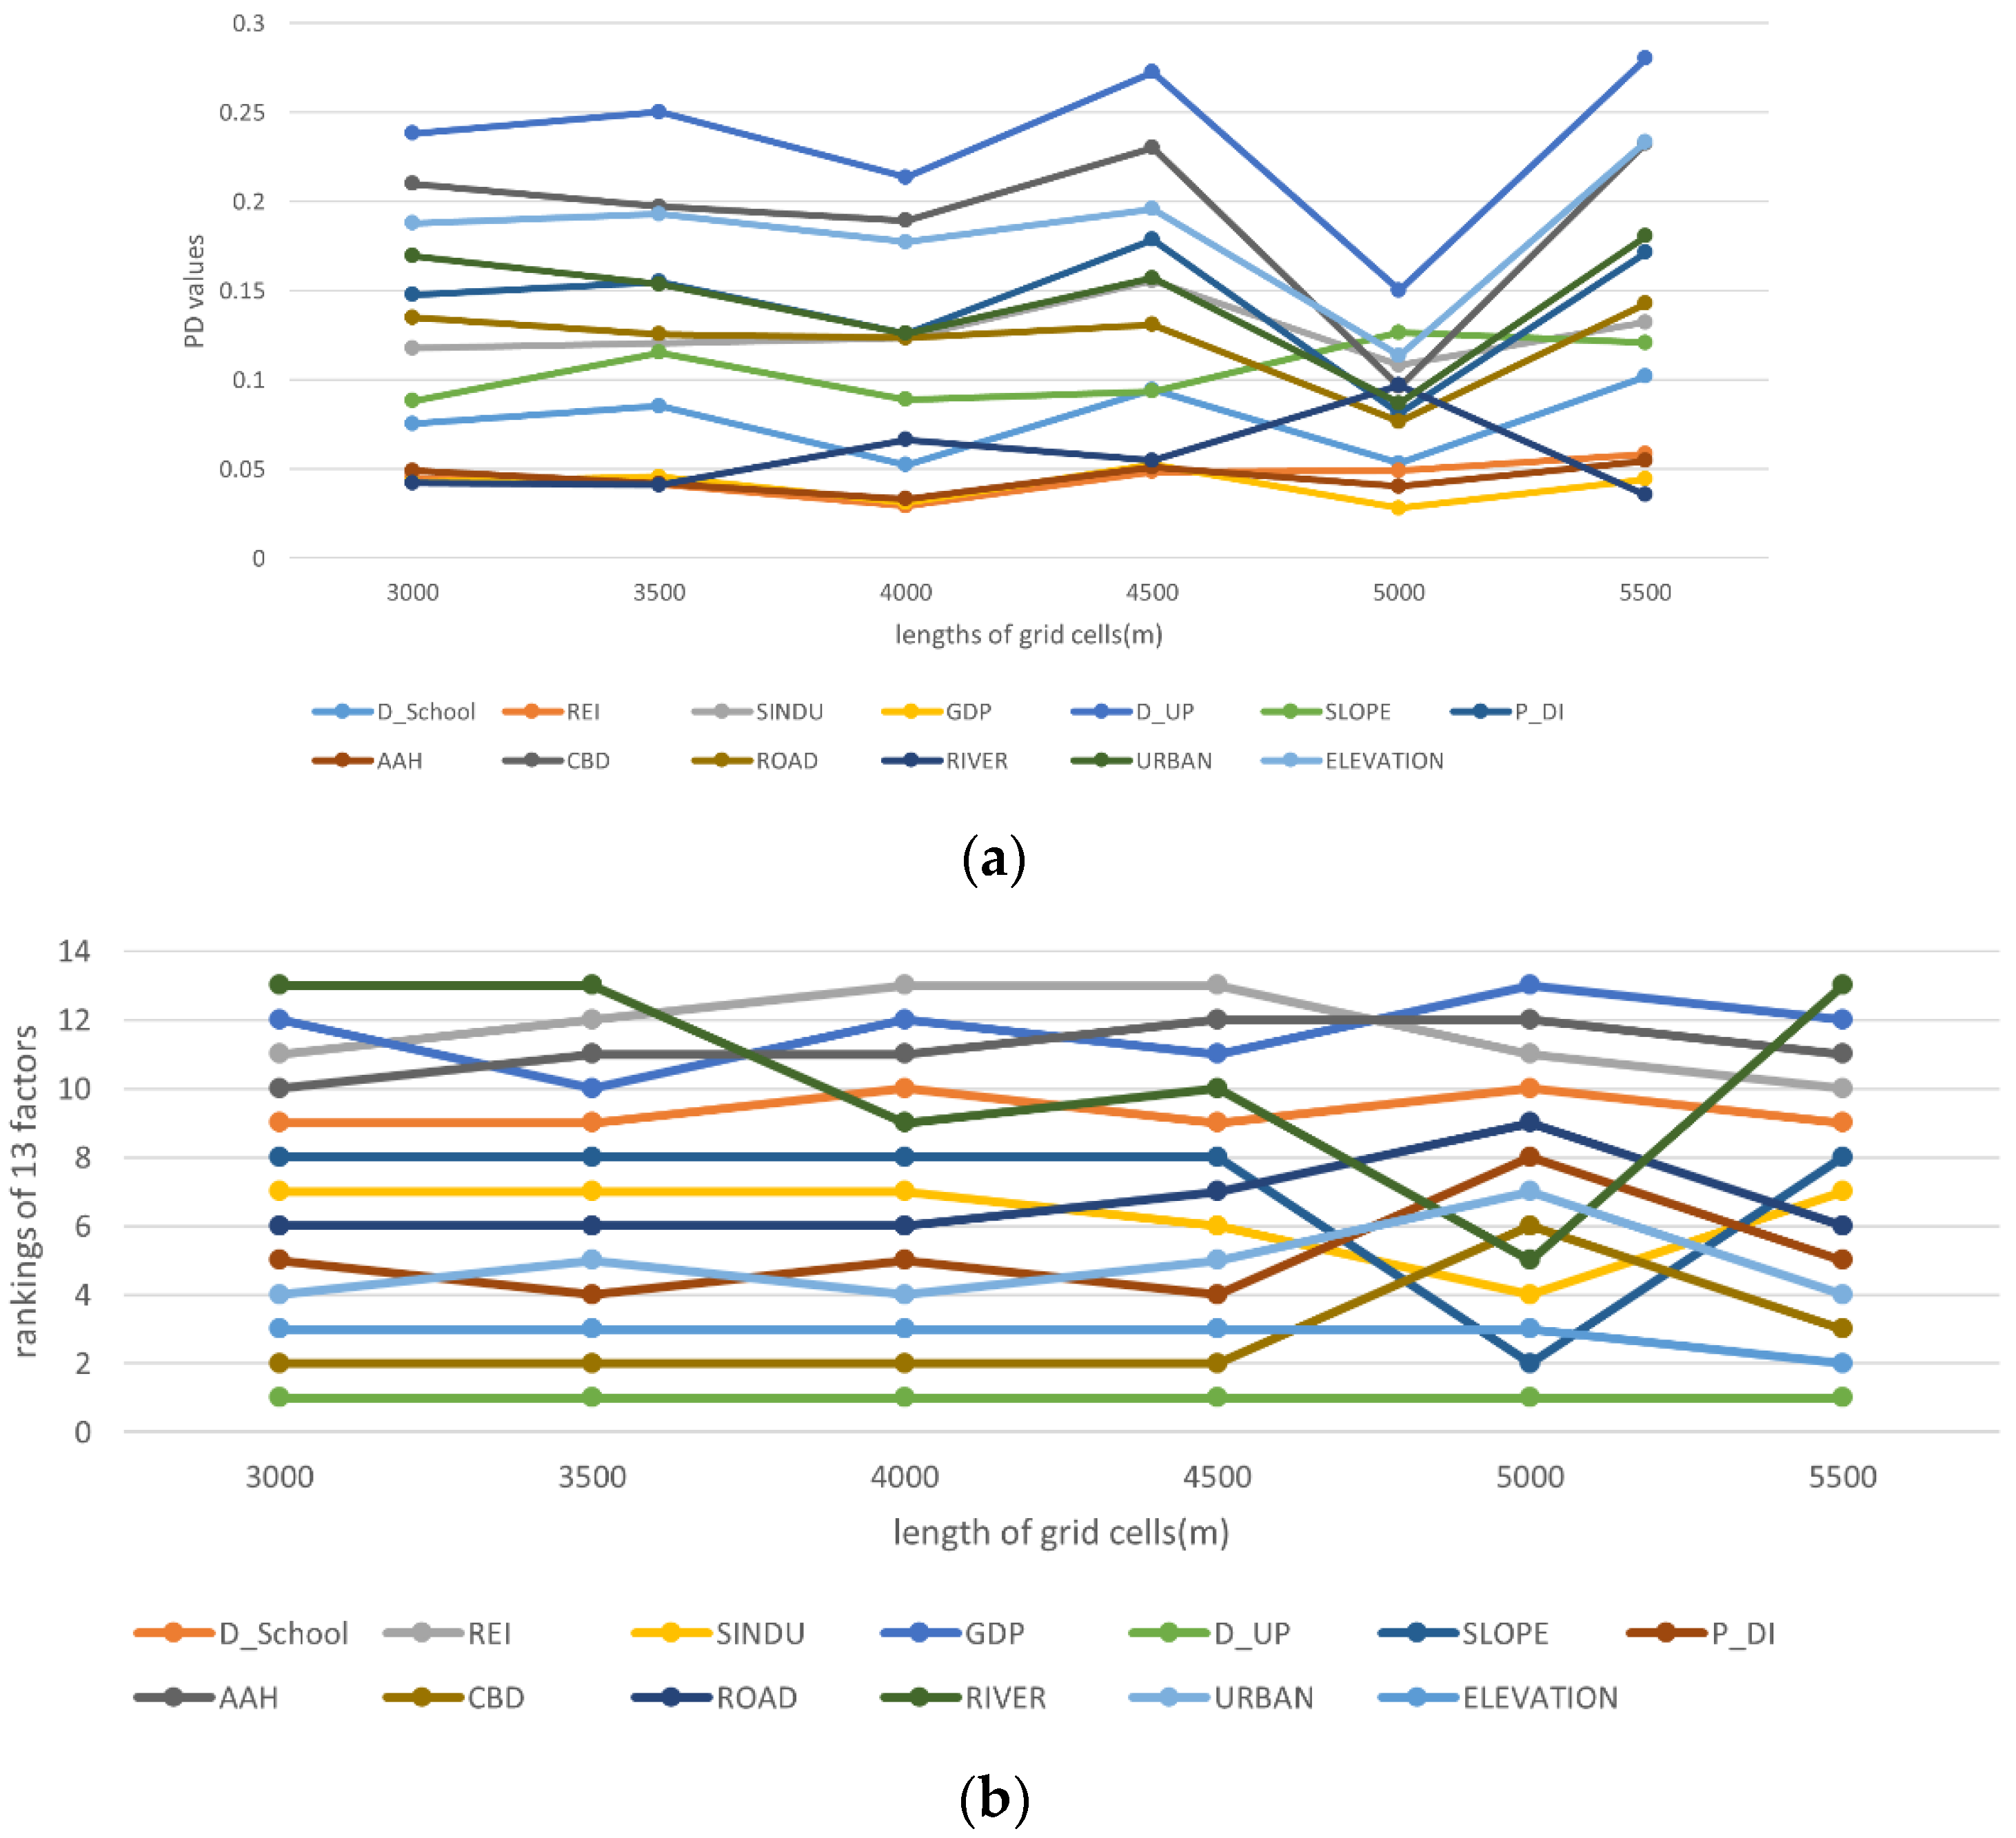
Figure 5.
The urban expansion ratio between 2010 and 2015 (4500 m × 4500 m).
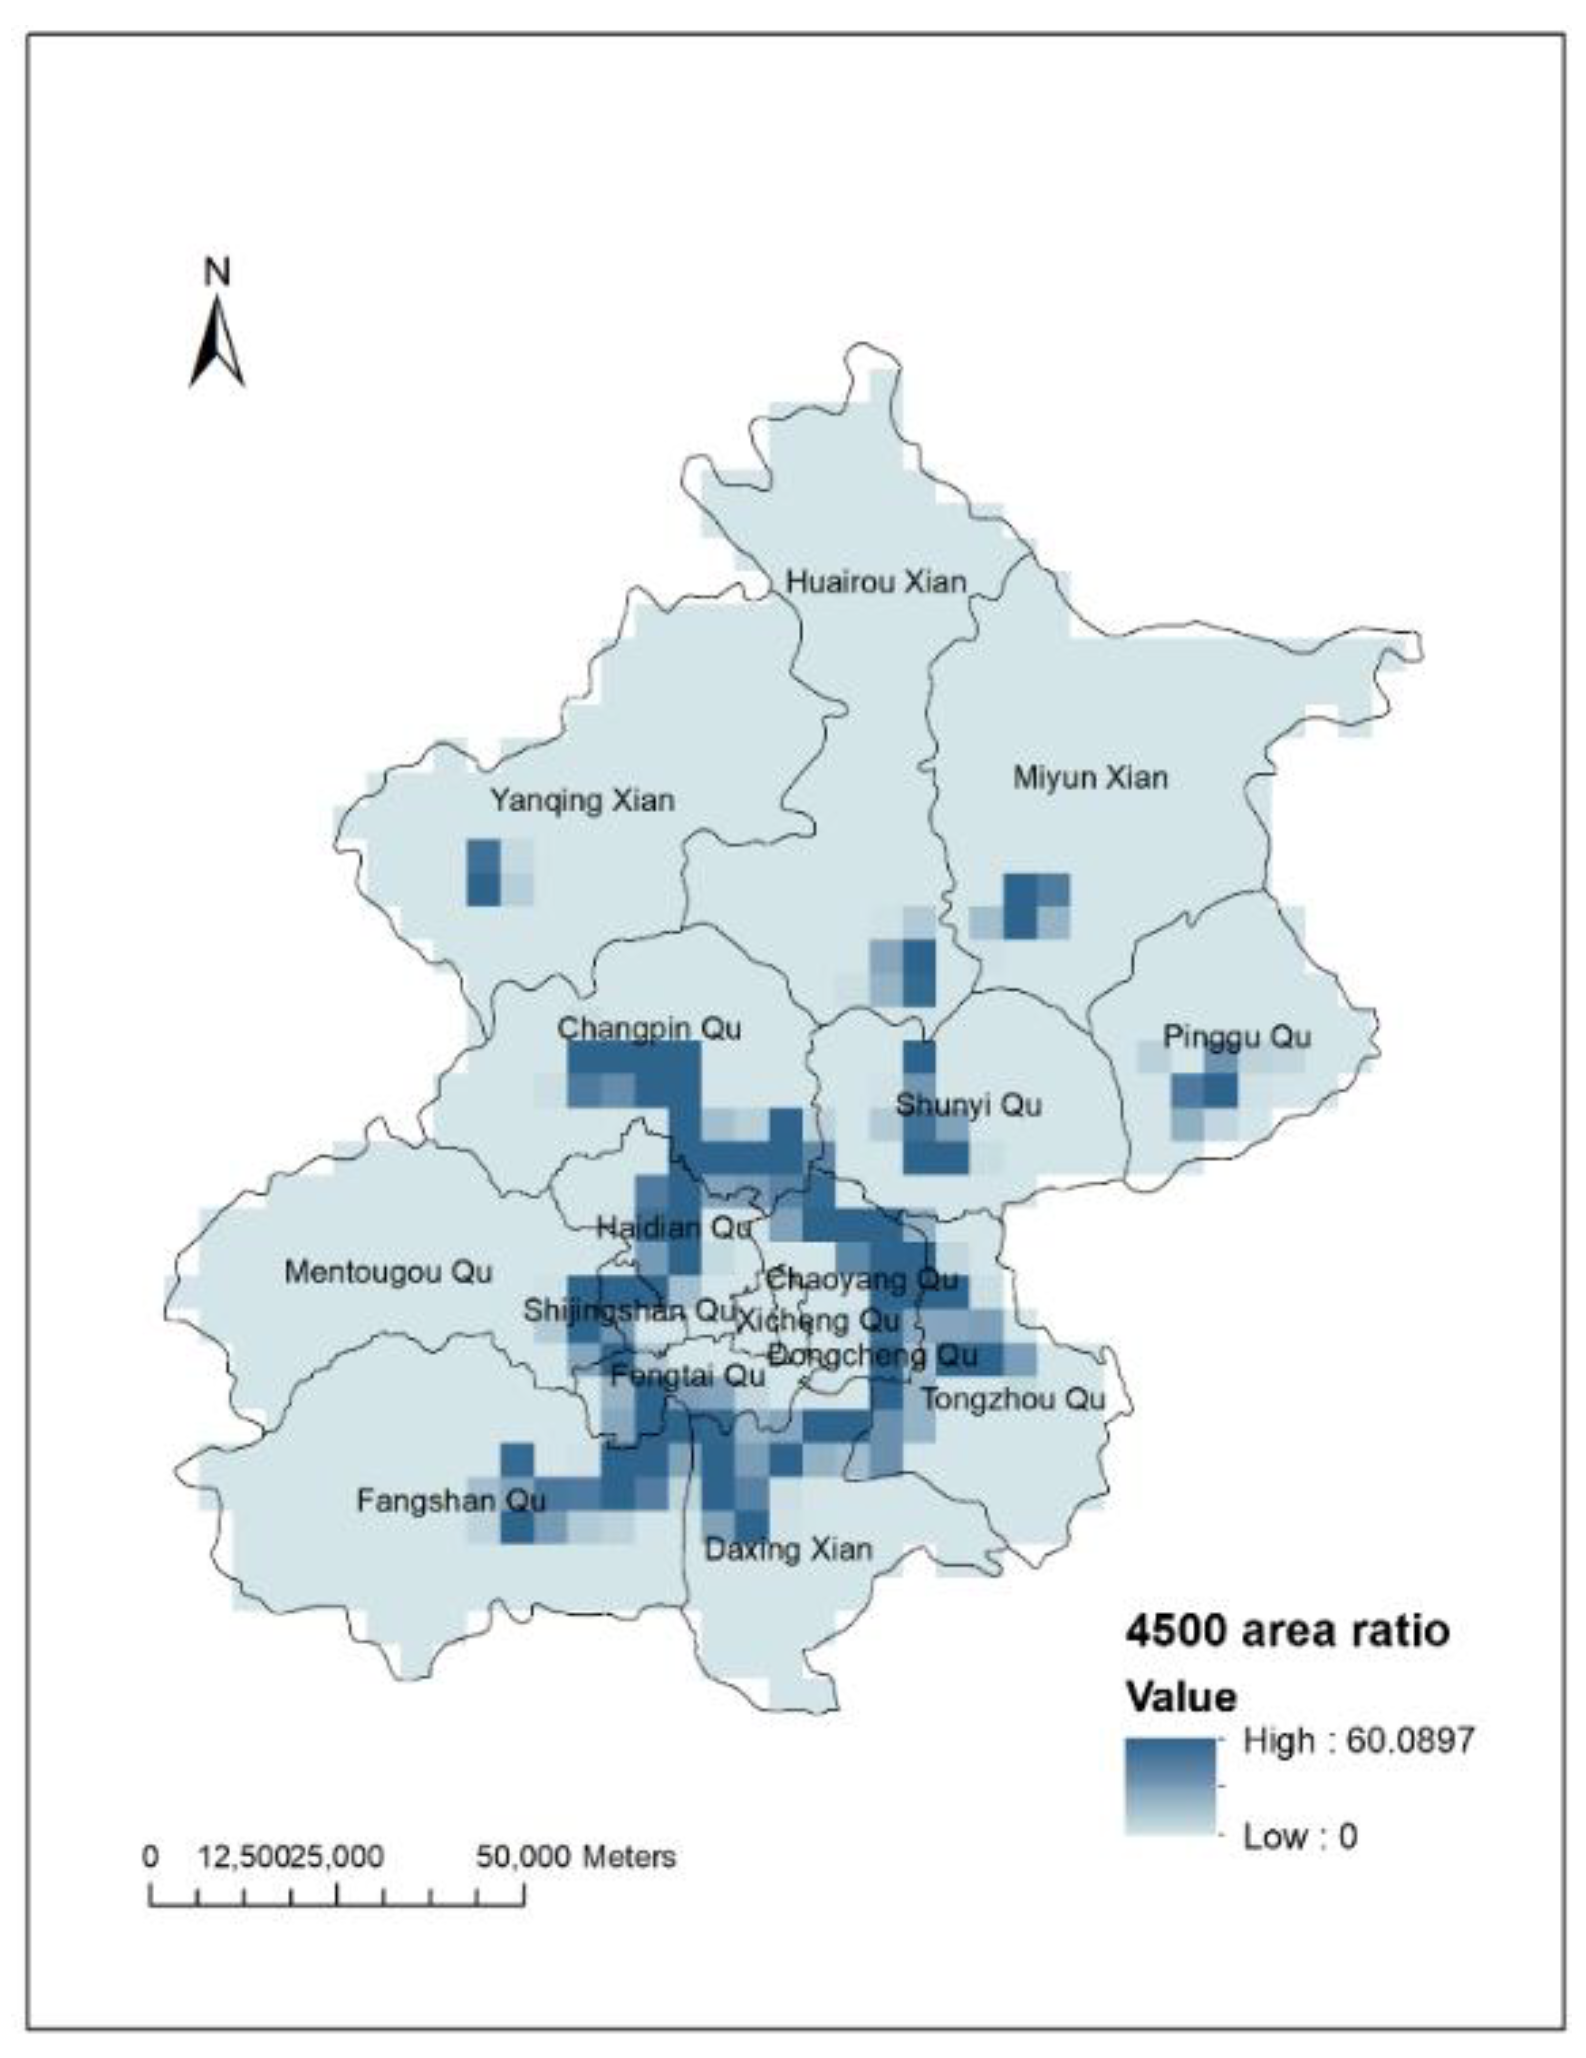
Figure 6.
The PD values of the factors of urban expansion.


Table 1.
The selected urban expansion drivers in GeoDetector.
| Category | Factors in GeoDetector | Abbreviation |
|---|---|---|
| Geographical factors | Elevation | Elevation |
| Slope | Slope | |
| Distance to rivers | River | |
| Distance to the CBD | CBD | |
| Socioeconomic factors | Change in the secondary industry in GDP between 2010 and 2015 | SINDU |
| Change in GDP between 2010 and 2015 | GDP | |
| Change in real estate investment between 2010 and 2015 | REI | |
| Change in disposable income per citizen between 2010 and 2015 | P_DI | |
| Change in area of housing construction between 2010 and 2015 | AAH | |
| Policy factors | Growth of urban land | Urban |
| Distance to primary roads | ROAD | |
| Change in urban population density between 2010 and 2015 | D_UP | |
| Distance to primary and middle school | D_School |
Table 2.
The urban expansion ratio of geographical factors.
| Factors | Classification | Average Urban Expansion Ratio |
|---|---|---|
| ELEVATION (m) | 0–200 | 10.64 |
| 200–500 | 0.26 | |
| 500–800 | 0.57 | |
| 800–1000 | 0.00 | |
| 1000–2283 | 0.00 | |
| SLOPE (degree) | 0–5 | 9.36 |
| 5–10 | 2.22 | |
| 10–15 | 0.44 | |
| 15–25 | 0.20 | |
| 25–68.89 | 0.05 | |
| RIVER (m) | 0–2 | 3.78 |
| 2–4 | 4.85 | |
| 4–8 | 6.27 | |
| 8–12 | 7.11 | |
| 12–20 | 11.10 | |
| ROAD (km) | 0–3 | 9.54 |
| 3–7 | 0.26 | |
| 7–12 | 0.00 | |
| 12–20 | 0.00 | |
| 20–35 | 0.00 | |
| CBD (km) | 0–20 | 12.41 |
| 20–40 | 8.34 | |
| 40–60 | 3.42 | |
| 60–80 | 1.15 | |
| 80–120 | 0.04 |
Table 3.
The interactions between the driving forces of urban expansion.
| Policy Factors | Socioeconomic Factors | Geographical Factors | |||||||||||
|---|---|---|---|---|---|---|---|---|---|---|---|---|---|
| URBAN | ROAD | D_School | D_UP | GDP | P_DI | SINDU | AAH | REI | ELEVATION | SLOPE | RIVER | CBD | |
| URBAN | |||||||||||||
| ROAD | 0.2476 | ||||||||||||
| D_School | 0.2574 ∥ | 0.2682 ∥ | |||||||||||
| D_UP | 0.3284 | 0.3008 | 0.3880 ∥ | ||||||||||
| GDP | 0.2469 ∥ | 0.2182 ∥ | 0.1394 | 0.3721 ∥ | |||||||||
| P_DI | 0.3014 | 0.2573 | 0.3391 ∥ | 0.3651 | 0.3058 ∥ | ||||||||
| SINDU | 0.2613 | 0.2880 | 0.2235 | 0.3541 | 0.3427 ∥ | 0.3216 | |||||||
| AAH | 0.2147 ∥ | 0.2252 ∥ | 0.1504 ∥ | 0.3558 ∥ | 0.1655 ∥ | 0.3278 ∥ | 0.1975 | ||||||
| REI | 0.1973 | 0.2091 ∥ | 0.1178 | 0.3146 | 0.0736 | 0.2594 ∥ | 0.1638 | 0.0614 | |||||
| ELEVATION | 0.2181 | 0.2738 | 0.2946 ∥ | 0.3404 | 0.2672 ∥ | 0.3215 | 0.2735 | 0.2333 | 0.2076 | ||||
| SLOPE | 0.2220 | 0.176 | 0.3202 ∥ | 0.3487 | 0.2914 ∥ | 0.3943 * | 0.3305 ∥ | 0.2900 ∥ | 0.2046 ∥ | 0.2592 | |||
| RIVER | 0.2480 ∥ | 0.1938 ∥ | 0.2083 ∥ | 0.2934 | 0.1891 ∥ | 0.2024 | 0.2503 ∥ | 0.2136 ∥ | 0.1578 ∥ | 0.2724 ∥ | 0.1689 ∥ | ||
| CBD | 0.3617 | 0.3278 | 0.3155 | 0.3919 * | 0.2792 | 0.3164 | 0.4359 *,∥ | 0.3083 ∥ | 0.2504 | 0.3905 | 0.3385 ∥ | 0.2769 | |
Notes: ‘∥’ denotes the nonlinear enhancement of X1 and X2 when ; all other interactions are bi-enhancing when ; ‘*’ represents a relatively large interaction.
© 2018 by the authors. Licensee MDPI, Basel, Switzerland. This article is an open access article distributed under the terms and conditions of the Creative Commons Attribution (CC BY) license (http://creativecommons.org/licenses/by/4.0/).
Share and Cite
MDPI and ACS Style
Xu, Q.; Zheng, X.; Zhang, C. Quantitative Analysis of the Determinants Influencing Urban Expansion: A Case Study in Beijing, China. Sustainability 2018, 10, 1630. https://doi.org/10.3390/su10051630
AMA Style
Xu Q, Zheng X, Zhang C. Quantitative Analysis of the Determinants Influencing Urban Expansion: A Case Study in Beijing, China. Sustainability. 2018; 10(5):1630. https://doi.org/10.3390/su10051630
Chicago/Turabian StyleXu, Qiurong, Xinqi Zheng, and Chunxiao Zhang. 2018. "Quantitative Analysis of the Determinants Influencing Urban Expansion: A Case Study in Beijing, China" Sustainability 10, no. 5: 1630. https://doi.org/10.3390/su10051630
Note that from the first issue of 2016, this journal uses article numbers instead of page numbers. See further details here.