1. Introduction
A project portfolio is a collection of projects that are managed coordinately to achieve an organization’s strategic objectives [
1,
2,
3]. However, portfolio success and achieving those objectives is affected by risk [
1]. Therefore, portfolio risk management can be remarkably effective in a portfolio’s alignment with strategic objectives. Furthermore, portfolio risk management improves organizational learning and prevents a risk of one project from occurring in other projects. Thus, even a project’s negative effects can have positive implications for a portfolio in the distant future [
4]. Moreover, the concept of sustainability, which nowadays is of growing importance, has risk management as one of its recognized ‘impact areas’ [
5]. Nevertheless, in the field of risk management, there are gaps to be filled before it can provide such benefits [
6].
Risk analysis is a crucial part of portfolio risk management. It provides information about the effects of choosing a project based on portfolio risk, and so facilitates making decisions about project selection. Furthermore, applying the concept of sustainability through risk analysis makes this concept a standard part of project-related decisions [
7]. However, most of today’s frameworks for portfolio risk analysis are not designed for achieving strategic objectives. Moreover, they are not written based on portfolio characteristics and are adapted from generic frameworks [
8].
Prior to risk analysis is risk identification, the first and the most critical activity in risk management [
1,
9], upon which the integration of sustainability depends [
5]. However, gaps in the literature call for the identification of portfolio risks, beyond single project risks [
9,
10]. Nowadays, understanding interdependencies between projects and their following implications have a considerable effect on making the right decisions [
11,
12,
13,
14,
15]. Therefore, in risk identification, the effect of interdependencies on portfolio risk also needs to be considered [
16].
This paper introduces a framework for portfolio risk analysis that addresses the aforementioned issues and contributes to a clearer and more sustainable decision-making process. The objectives of this paper are:
To identify portfolio risks, beyond single project risks: portfolio risks are put in three categories, (1) project risks; (2) portfolio-level risks (risks that are created specifically in the portfolio); and (3) project interdependency risks (risks that arise from interdependencies between projects). Risks of the second and the third categories are identified and then validated by experts.
To develop a model for analyzing portfolio risk, the cause–effect relationships and interdependencies between its components should be considered: for this purpose, using Bayesian networks, a graph of risks based on their cause–effect relationships is constructed and the probability of portfolio risk is calculated.
The data collected from a company active in the construction industry were used to evaluate the model. The model proved effective and could provide valuable information for project portfolio selection, which is a subject undergoing intense study in portfolio management [
17,
18,
19]. It could show how the decision to add or eliminate one or more specific projects affected the portfolio risk.
This paper is one of the first attempts to identify the aforementioned risks and to develop a framework based on Bayesian networks for analyzing portfolio risk. The proposed framework focuses on risks interrelations, portfolio management objectives, and portfolio success factors.
2. Literature Review
2.1. Risk Identification
Risk identification refers to a series of actions with the ultimate goal of sustainably detecting uncertain events or conditions that, if they occur, have positive or negative effects on one or more objectives [
20,
21]. Since project risks (first category) are well documented in the literature, this paper does not focus on identifying them and readers are referred to studies that have focused on construction risks [
22,
23,
24,
25].
Studies on the second and third risk categories are quite limited. Sanchez et al. [
8] presented, as far as we know, the only framework for identifying portfolio risks. Using this framework, the user had to find risks among numerous factors that could lead to making key decisions. Although Sanchez et al. considered some types of project interdependencies, outcome interdependency—to use the end result of one project in another one—[
26,
27], and accomplishment interdependency—the increase in a project’s probability of success as a result of undertaking another project—[
26,
28] were not mentioned in their framework.
2.2. Project Interdependencies
Gear and Cowie [
26] were the first to identify different types of project interdependencies. Later Killen and Kjaer [
27] presented a comprehensive categorization, in which they separated interdependencies from dependencies. In
Table 1, different types of project interdependencies are presented. It should be considered that in some cases different authors have used different names for them.
2.3. Bayesian Networks
Bayesian networks are directed acyclic graphs, where nodes correspond to random variables and arcs specify direct causal relations between the linked nodes [
31,
32,
33,
34]. A BN has conditional probability distributions for all possible combinations of variable values [
35], and each node comes with a conditional probability table (CPT). Therefore, despite most of simulation models, such as artificial neural networks (ANNs) that can be time-consuming due to high computational complexity [
36], a compiled BN model can quickly calculate a specific probability distribution. Hence, the user can combine expert knowledge with available data and update the CPTs and the associated results, as new evidence comes in [
31,
36,
37,
38] or new causal relations between the nodes become recognized.
2.4. Bayesian Networks in Risk Management
Bayesian networks contribute to risk analysis in different ways. BNs facilitate the “what–if” analysis and help to estimate how the elimination of one or some risks affects the others. Moreover, the visual representation of BN contributes to the identification of risk resources. Thus, it is an effective method for supporting strategic decisions [
27,
36,
37]. On the other hand, unlike ANNs that are praised for their objectivity [
39], constructing BN graphs and CPTs based on expert knowledge are criticized for subjectivity [
33]. However, it should be noted that “subjective” is not a synonym for “uninformative” [
40]. Furthermore, projects and portfolios are unique; therefore, gathering risk-related data from all of them may take a considerable amount of time and money [
38]. In developing countries like Iran, expert knowledge can remedy this deficiency [
40].
Bayesian networks have been applied to project risk management. Odimabo et al. [
41] proposed a methodology based on BNs to assess the risk of construction projects in developing countries. Hu et al. [
37] used BNs with causality constraints to develop a model for software project risk analysis. Vitabile et al. [
42] presented a BN-based model to measure risk and assess coastal sustainability, which can be used as a decision support system in coastal zone management. Woodberry et al. [
43] and Pollino et al. [
44] proposed a methodology for parameterization and evaluation of a BN to assess sustainability-related risks. Wang et al. [
45] proposed a model based on Bayesian networks to assess the risk of hazmat transportation. This model included seven risk factors and its qualitative part was organized using the adjacency matrix. Yet et al. [
38] presented a BN framework to compute costs, benefits, and return on investment (ROI) of a project, considering the effect of risk factors as one of the causal factors. A minor part of the model was assigned to risk factors and the model did not take into account the possible interdependency among these factors.
Fan and Yu [
33] introduced a BN-based procedure for software projects. This procedure applied a feedback loop to identify potential erroneous assumptions. Lee et al. [
46] proposed a BN-based scheme for managing the risk of engineering projects. In their model, the level of each risk was determined using Equation (1) and a risk matrix. Risk matrices provide qualitative categorization of risks and eliminate the quantitative information. So, in a situation where one has to choose between two risks, which are in the same qualitative category, there is no way to choose a risk based on the risk matrix, and the error probability would be 50% [
47]. In order to overcome this deficiency, Yousefi et al. [
48] used risk matrices along with an AHP (analytical hierarchy process) method to achieve a more precise ranking of project risks and to identify the most critical ones.
Despite the vast use of BNs in project risk management, their application in portfolio risk management has been quite limited. To the best of our knowledge, Du-juan and Pen’s [
49] paper was the only study that used BNs in portfolio risk management. They used BN structure learning to construct a network of interdependent portfolio projects’ risks. In their study, the effect of value and accomplishment outcome of project risks was explained. However, in order to simplify the calculation, value interaction was not considered in developing the network. Considering the clear advantages of BNs, in the remainder of this research BNs are used to develop a model for portfolio risk analysis.
3. Risk Identification
In this section, portfolio-level risks and project interdependency risks are identified and then validated by experts. Since this paper is one of the first studies to identify the aforementioned risks, a general approach was taken and the results can apply to different industries. Identifying these risks contributes to a more precise and sustainable risk analysis and makes managers aware of the consequences of their decisions.
3.1. Identification of Portfolio-Level Risks
The literature on portfolio-level risks is poor and incomplete [
8,
9]; however, to conduct this part of the study, we needed to find a valid and well-founded basis. According to the Standard for Portfolio Management, portfolio risk is an uncertain event or condition which, should it occur, may positively or negatively affect one or more project objectives and one or more portfolio success criteria [
1]. Based on this definition, it can be said that portfolio risk can cause consequences, such as an increase or decrease in the probability of meeting portfolio success criteria and achieving project objectives. Since portfolio success criteria and project objectives are well documented in previous studies, we chose them as the basis. Then, we tried to identify the causes (portfolio-level risks) by recognizing their consequences (failure to meet portfolio success criteria and to achieve project objectives).
Portfolio success criteria were recognized by studying: portfolio management objectives—since once they are achieved the portfolio is considered successful—and portfolio success factors, because their presence leads to meeting portfolio success criteria. The main portfolio management objectives, as described in detail in
Table 2, are: (1) portfolio value maximization; (2) strategic alignment; (3) portfolio balance; and (4) right number of projects [
50,
51]. It can also be deduced from the literature that the main portfolio success factors are relevant to stakeholders, organizational changes, information, and some of portfolio management knowledge areas. These factors are fully reported in
Table 3.
Then, based on
Table 2 and
Table 3, portfolio-level risks were proposed considering that: (1) if portfolio-level risk is considered as a threat and as the only factor that affects portfolio success criteria, then failure to meet these criteria indicates that this risk has happened; (2) hence, the probability of portfolio-level risk equals the probability of failure to meet the criteria.
For example,
achieving the objective of “strategic alignment” is a portfolio success criterion. Based on this, events or conditions like error in a project portfolio selection, external changes that lead to changing the organizational strategy, some projects’ lack of alignment with the new strategy, and a governance review board’s reluctance to kill projects off when they are no longer aligned with organizational strategy were proposed as portfolio-level risks because they keep us from achieving the aforementioned objective. These risks and other proposed portfolio-level risks are presented in
Table 4.
3.2. Identification of Project Interdependency Risks
Project interdependencies are praised for creating synergies and having a positive effect on portfolio success. However, the complexities that they create and their negative implications are less frequently discussed. In this section, risks that arise from these complexities are presented in
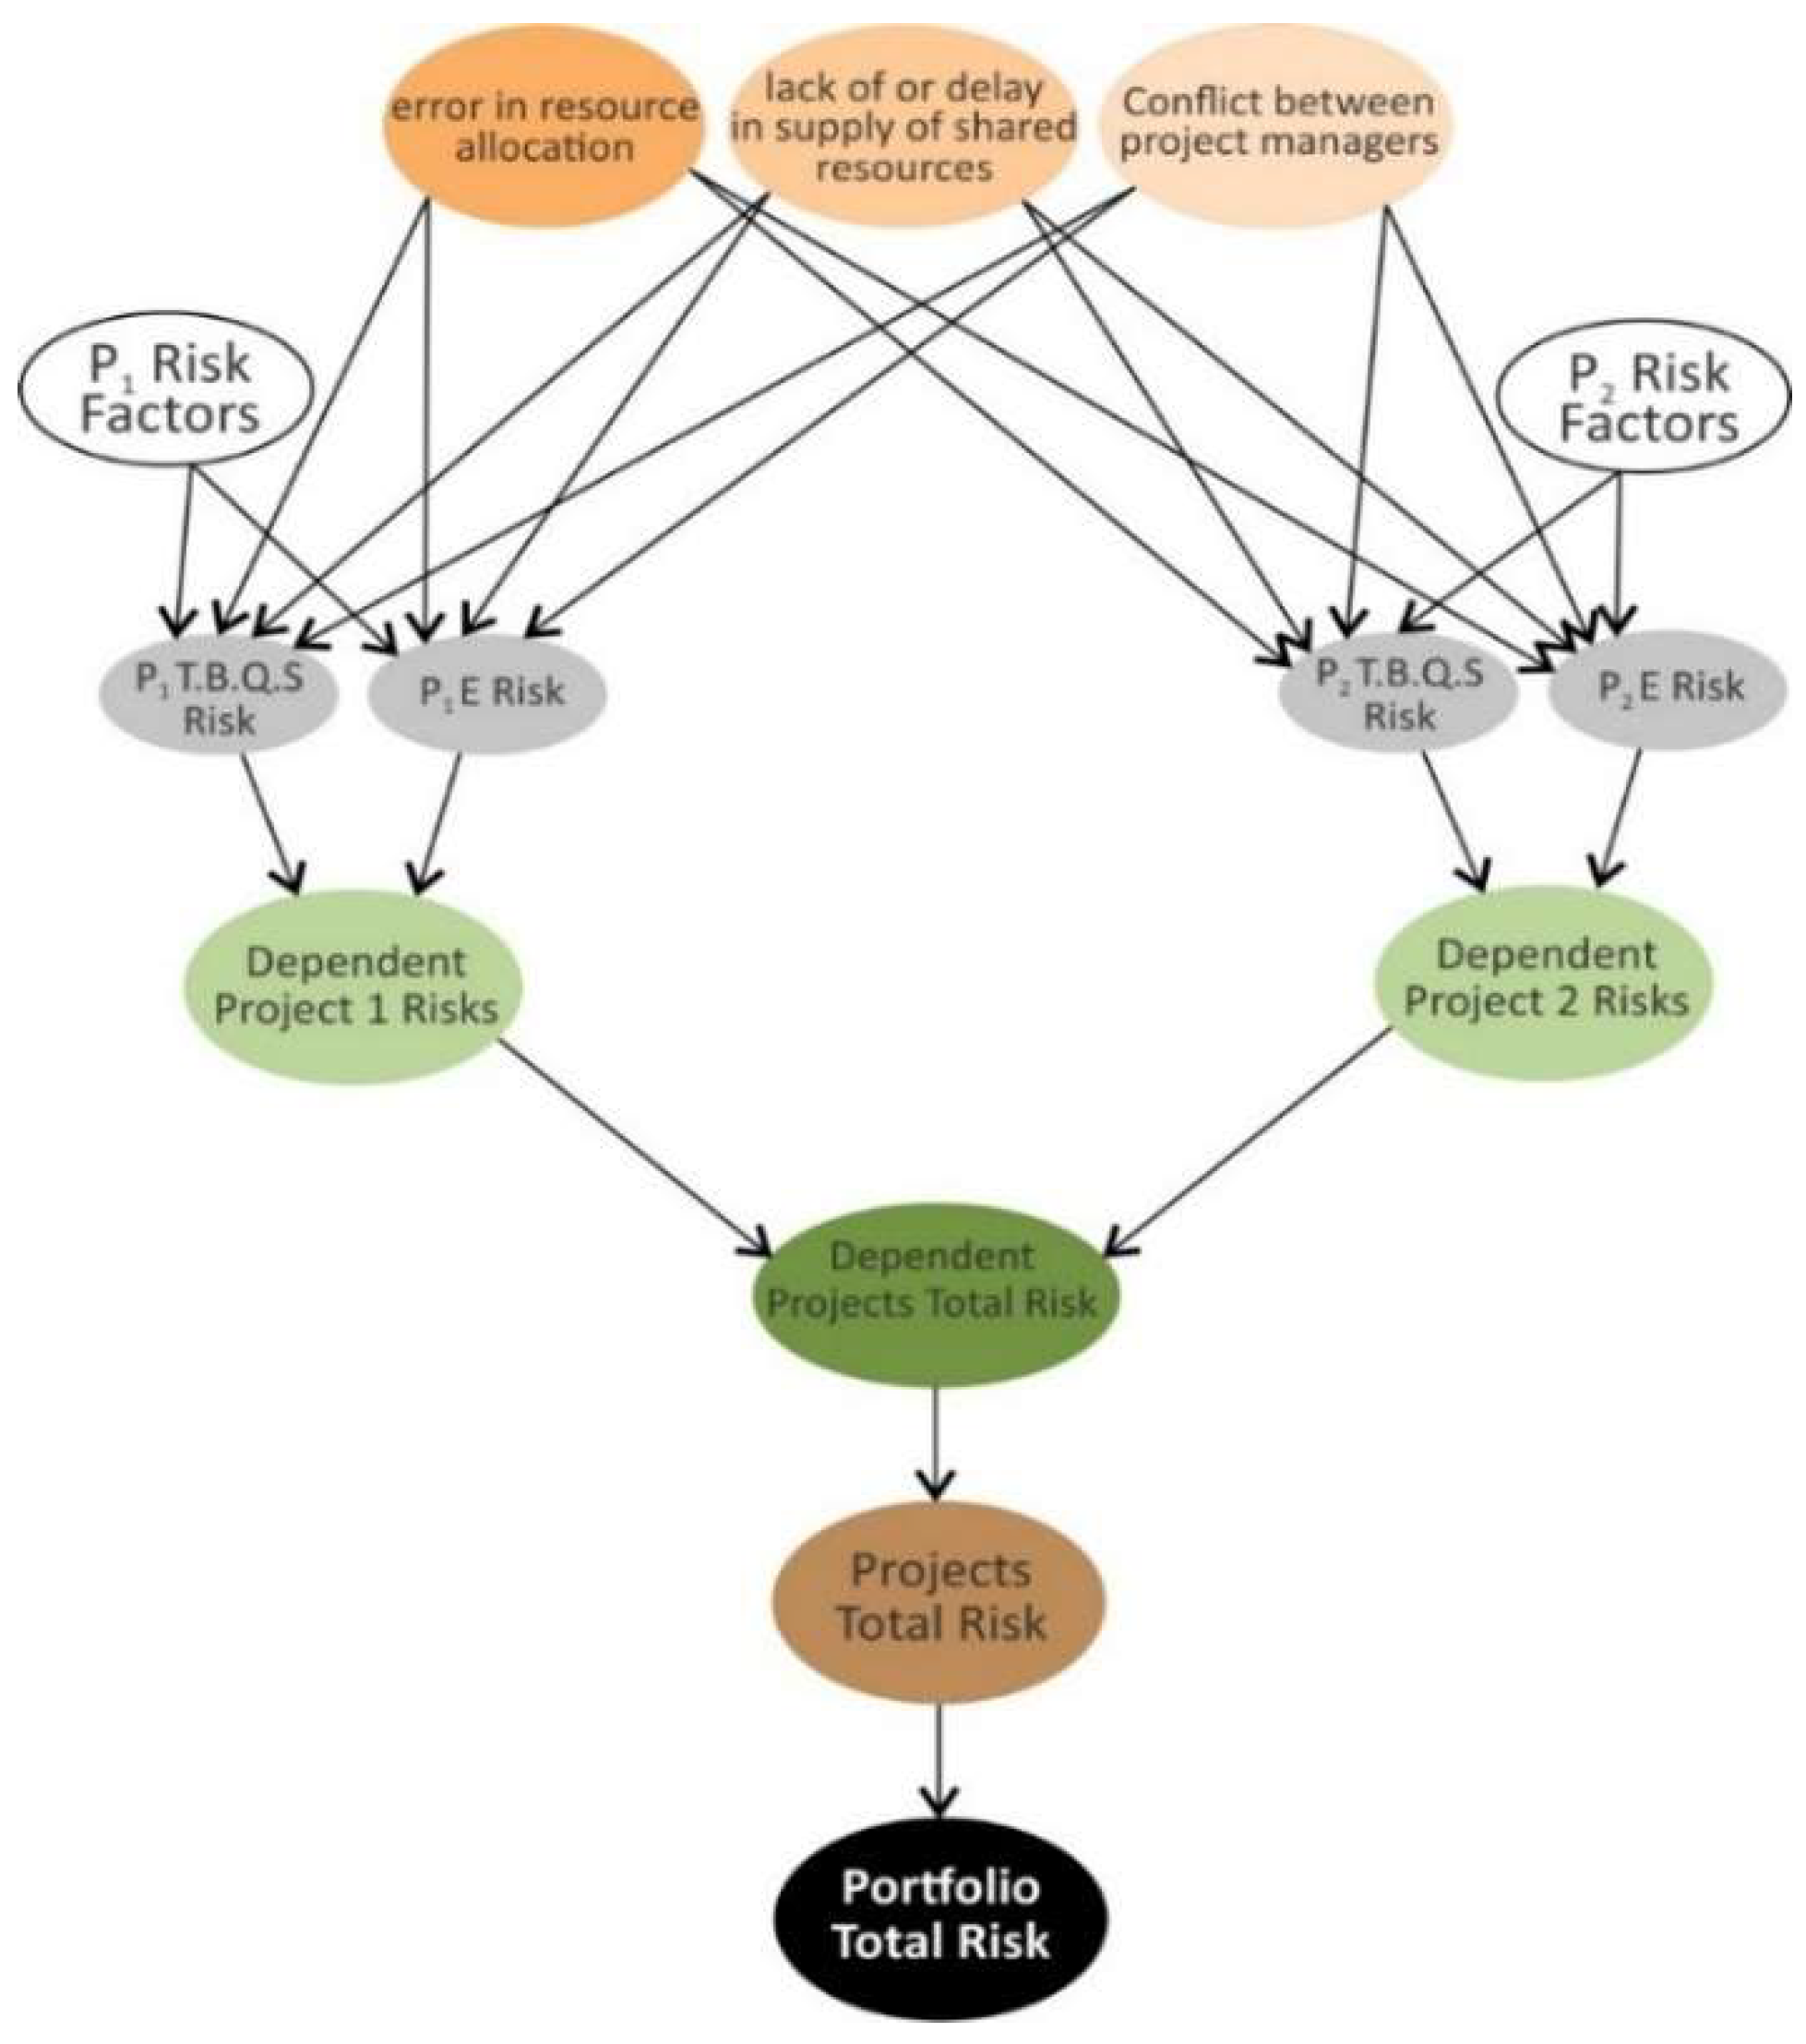
Table 5. For example, with regards to resource interdependency, projects are interrelated because of shared resources, and risks may arise from inappropriate management of these resources. Therefore,
lack of or delay in supply of shared resources, error in resource allocation, and
conflict between the managers of these projects are proposed as the project interdependency risks arising from resource interdependency.
3.3. Validity Estimation for Proposed Risks
In the next step, using 6-point Likert scale questions, experts were asked about the validity of the proposed risks. These experts were in the field of project, program or portfolio management. The questionnaire’s validity was estimated and supported as well using face validity, and its reliability was corroborated by Cronbach’s alpha measure, which was 0.7939. Then, using a content validity ratio (CVR) with the minimum of 0.33 for 35 experts [
61], 22 valid risks were distinguished, which are shown in
Table 6 and
Table 7.
Table 6 shows that from the portfolio-level risks category, risks related to strategic unalignment, lack of sharing of information and deficiencies in portfolio management are the most approved risks. It can also be deduced from
Table 7 that risks caused by resource interdependency are the most confirmed risks from the third category.
4. Portfolio Risk Analysis Model
4.1. Development of the Model
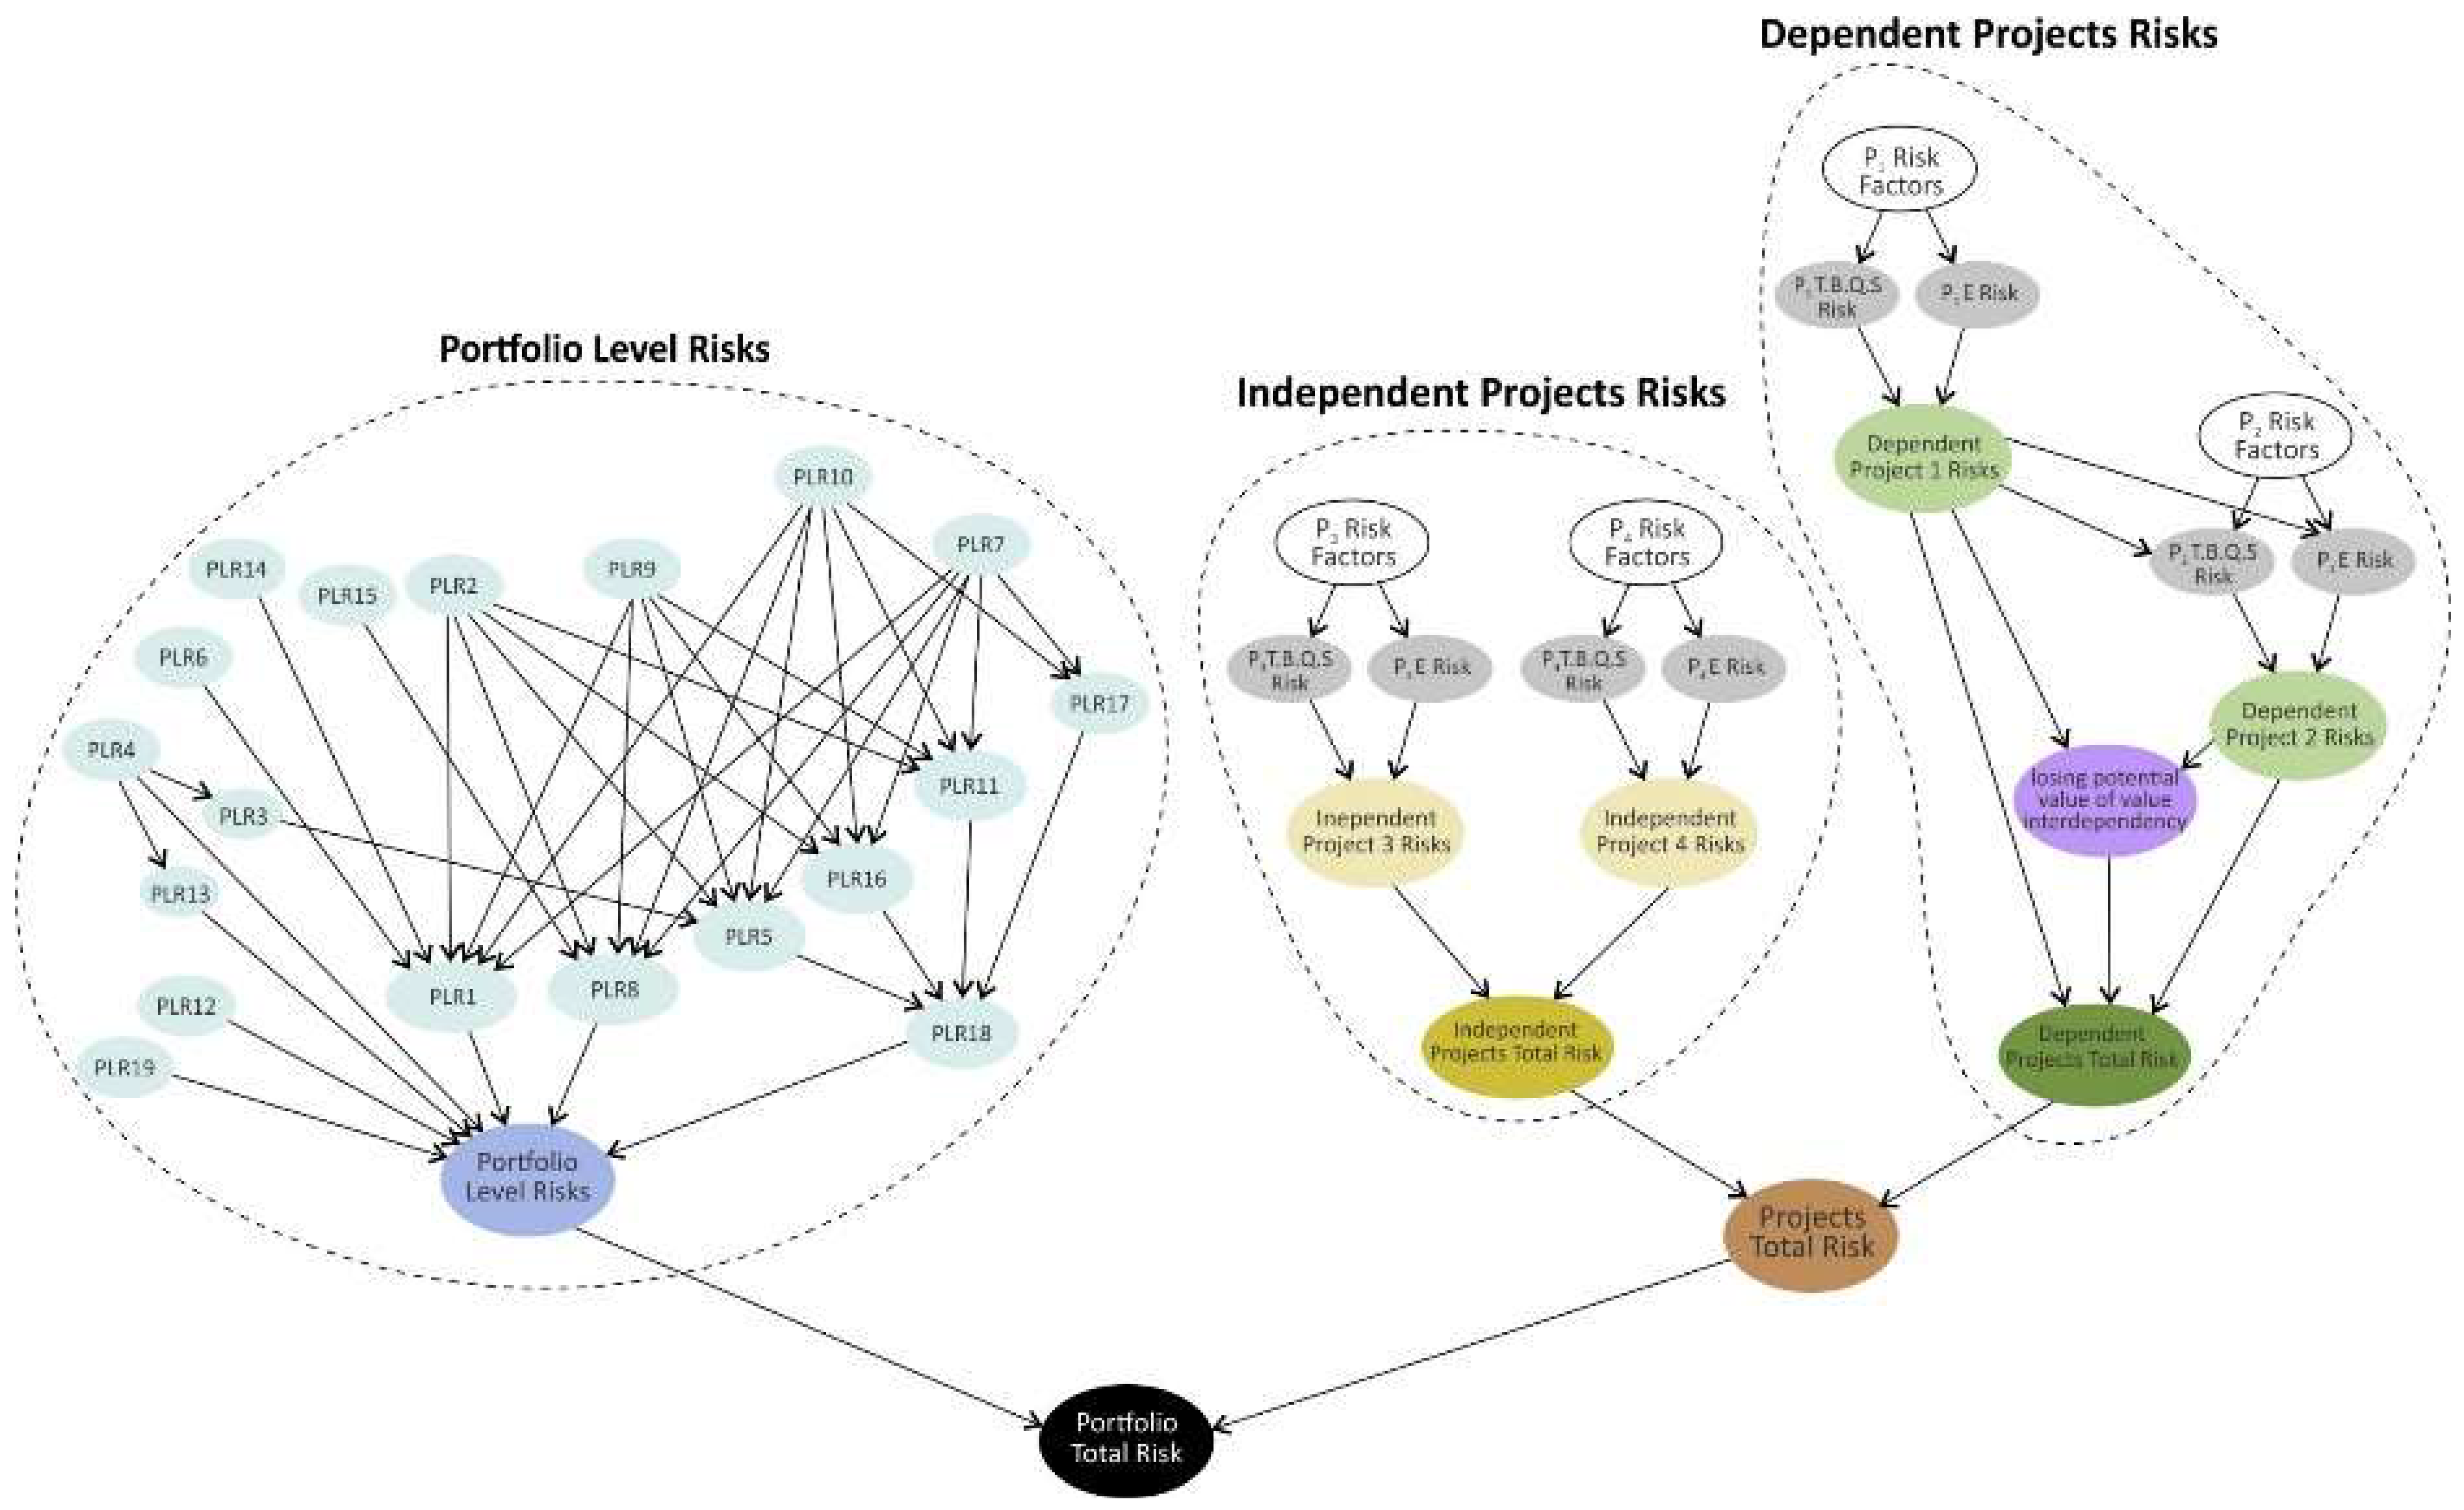
After identifying risks, the portfolio risk analysis model is developed. The model includes three types of risks within the portfolio. For analyzing these risks, their relationships must be visually represented. This is because their effect on portfolio risk is not always simple and direct, and sometimes they increase this effect by raising the probability of or creating other risks.
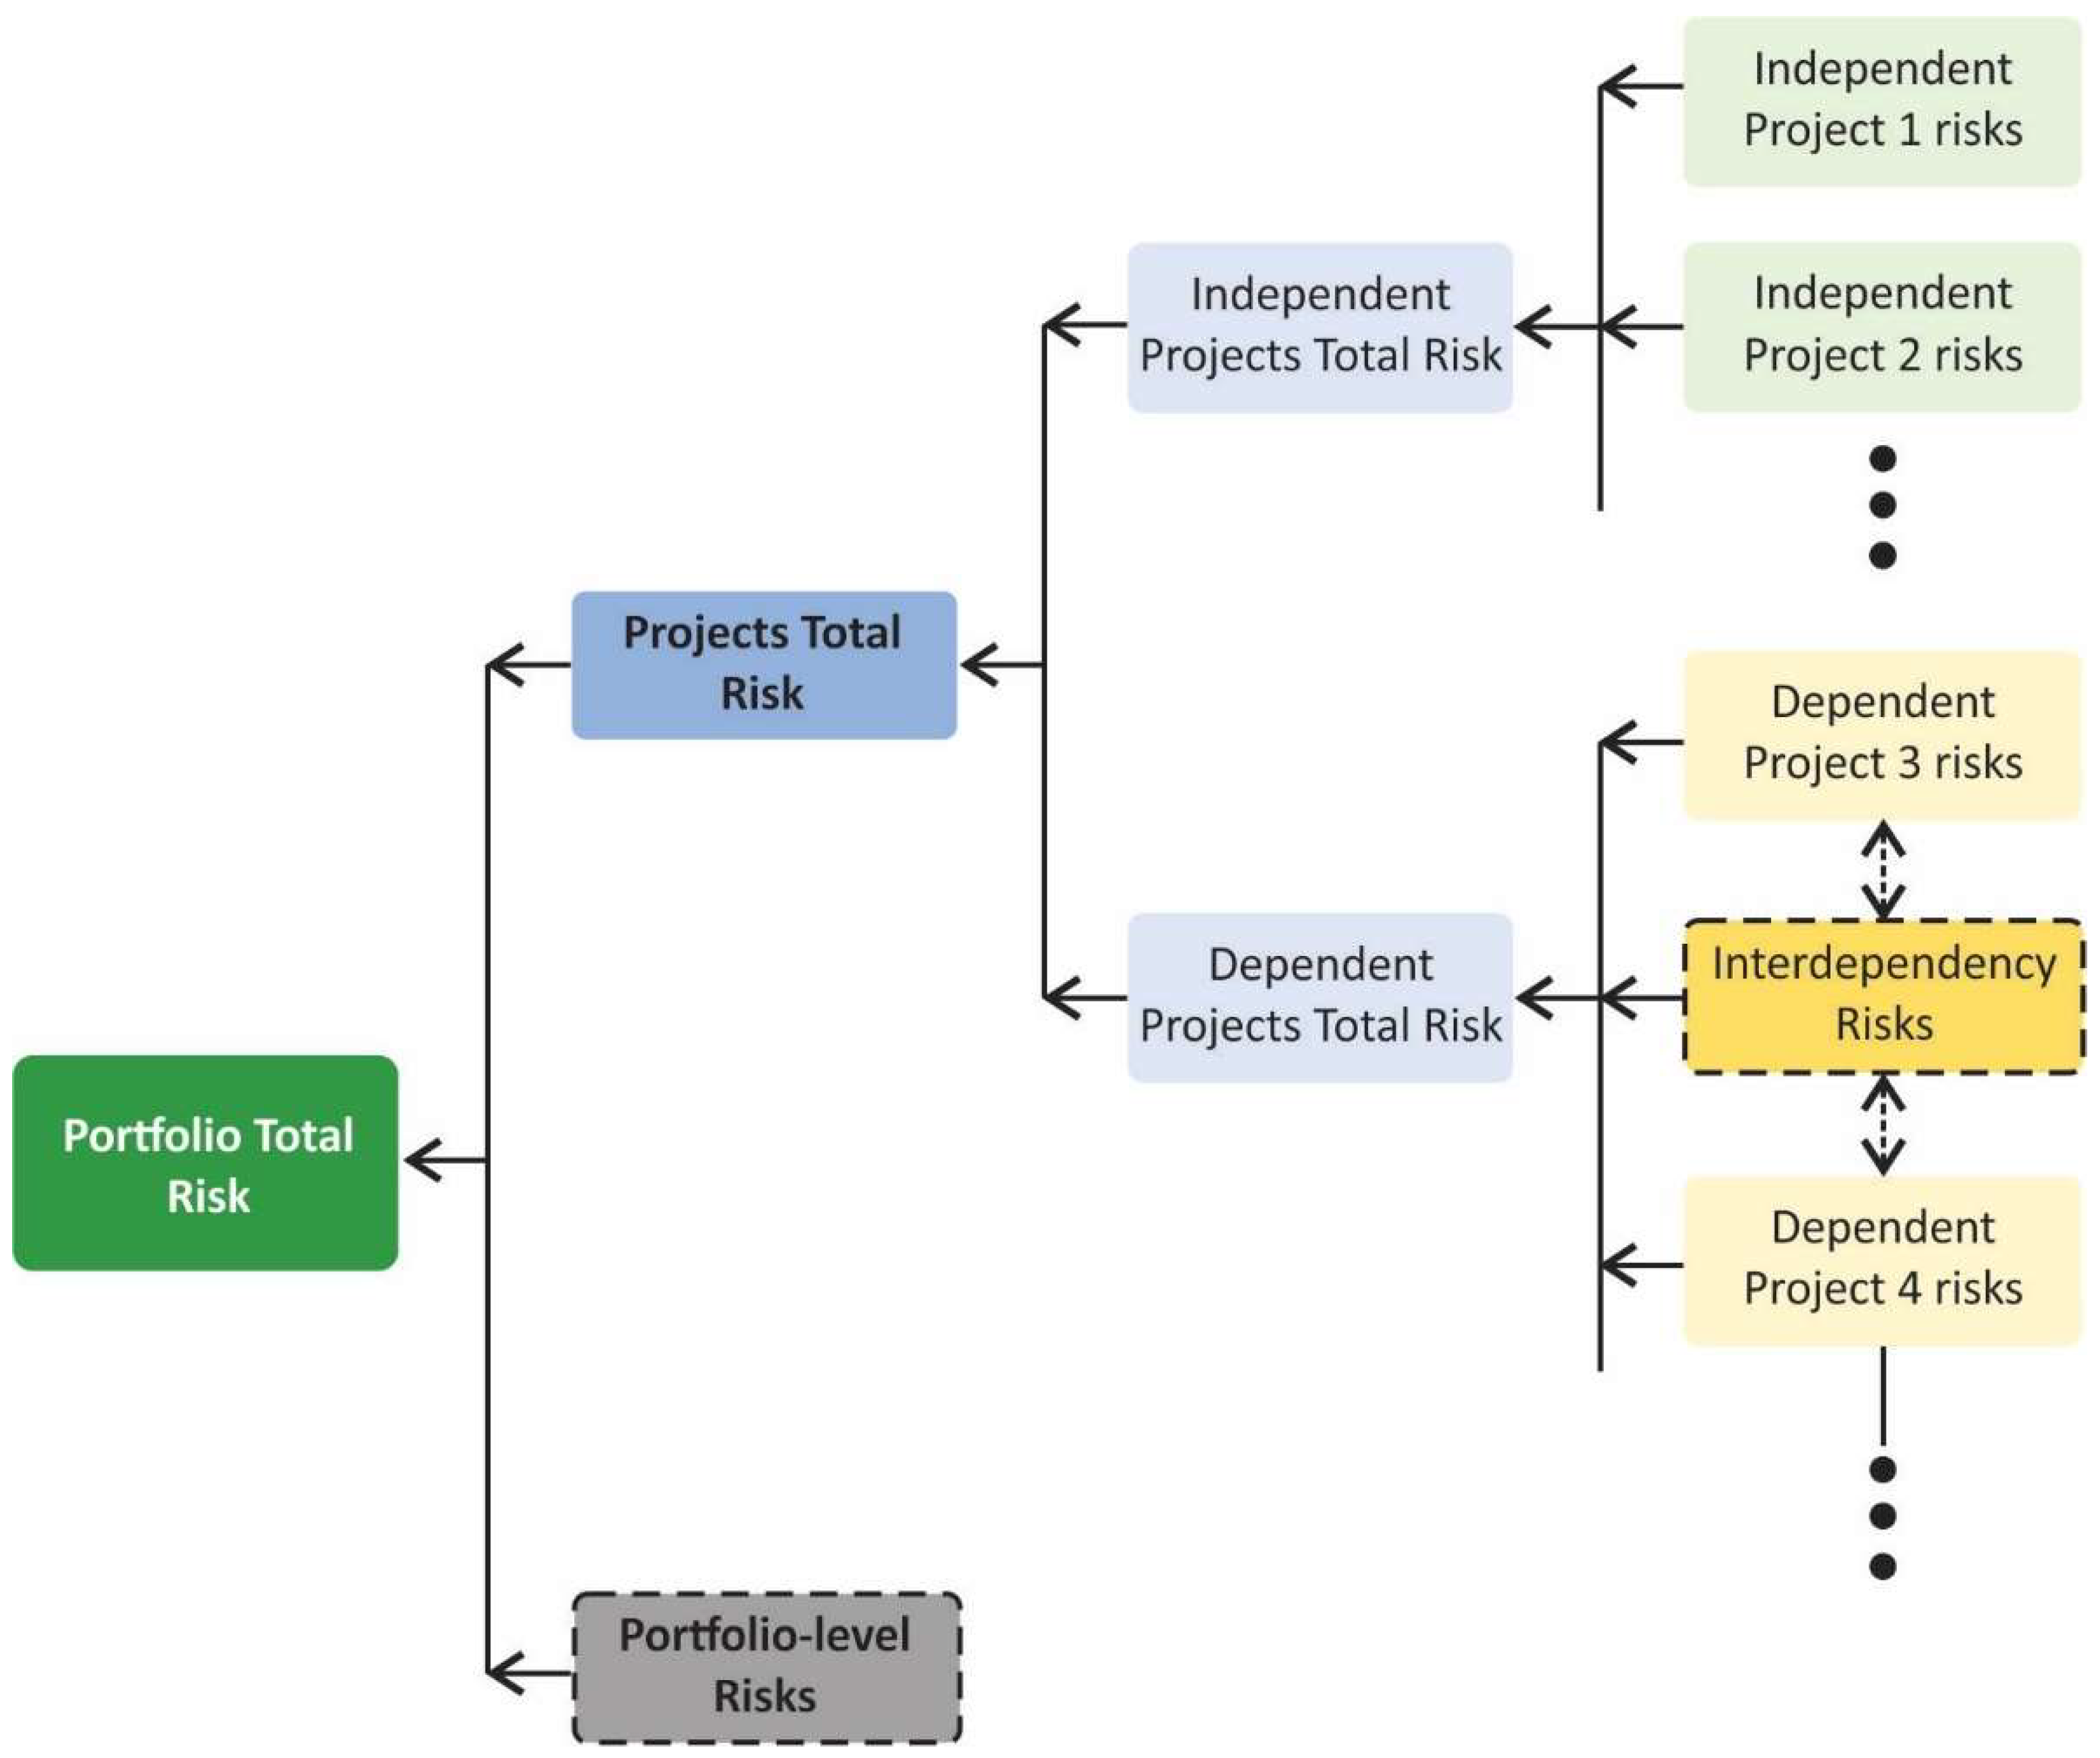
Despite these complexities, it is clear that these risks have cause–effect relationships with the portfolio total risk, because they all can be a reason for an increase in portfolio risk.
Figure 1 plainly shows these relationships, based on which the BN graph is constructed: “a project is a temporary endeavor undertaken to create a unique product, service, or result” [
1] and based on whether or not it has interdependency with other projects, its risk falls under the category of either dependent project risk or independent project risk. Dependent project risk is affected by each type of interdependency risk in a unique way, which is explained in the remainder of this section. In
Figure 1, one single box embodies all portfolio-level risks, which is also further expanded. At the end of this section all these risks are connected to construct a Bayesian network, in this network each node represents a risk and every arc specifies a cause–effect relationship.
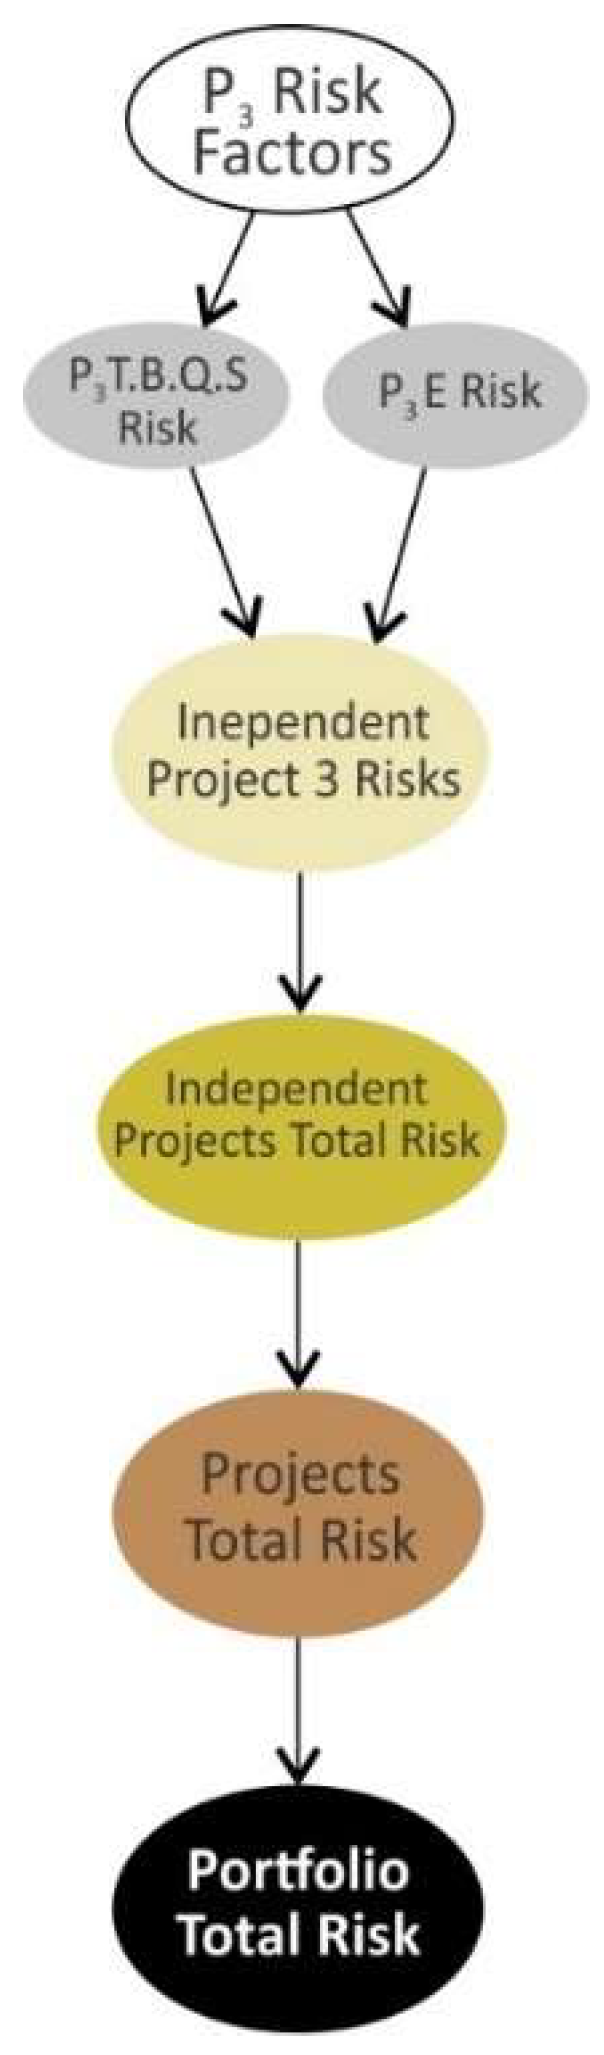
4.1.1. Risks of an Independent Project in a Bayesian Network
Since sustainably analyzing the risk of the portfolio is the main goal of this paper, project risk must be seen from a viewpoint that reveals its effects on the portfolio risk. Since for studying portfolio risks we focused on portfolio management objectives and portfolio success factors, in this section we stay in line with this approach too. In one of the portfolio objectives, that is value maximization, project success is mentioned and divided into two dimensions: (1) success of project in economic objective [
1,
51,
52]; and (2) success of project in time, budget, quality and customer satisfaction objectives [
53]. Therefore, we define project risk as an event or condition, which keeps us from achieving these objectives and as shown in
Figure 2, in the BN graph, we connect the node for project risk factors (P
n Risk Factors) to P
n E Risk (risk of not achieving the average success in economic objective) and P
n T.B.Q.S Risk (risk of not achieving the average success in time, cost, quality and customer satisfaction objectives).
4.1.2. Risks of Projects with Resource Interdependency in a Bayesian Network
In the BN, the risk of a dependent project is shown to be similar to an independent one, except with interdependency risks added to it. If two projects have resource interdependency, then risks arising from this interdependency pose threats to the success of both projects. Therefore, in the BN, these risks are connected to both of them, as shown in
Figure 3.
4.1.3. Risks of Projects with Outcome Dependency in a Bayesian Network
When project 1 is dependent on the outcome of project 2, if project 2’s success is at risk, then project 1’s success may be at risk too. Therefore, as shown in
Figure 4, the risk of project 2 is considered as a new risk for project 1.
4.1.4. Risks of Projects with Value Interdependency in a Bayesian Network
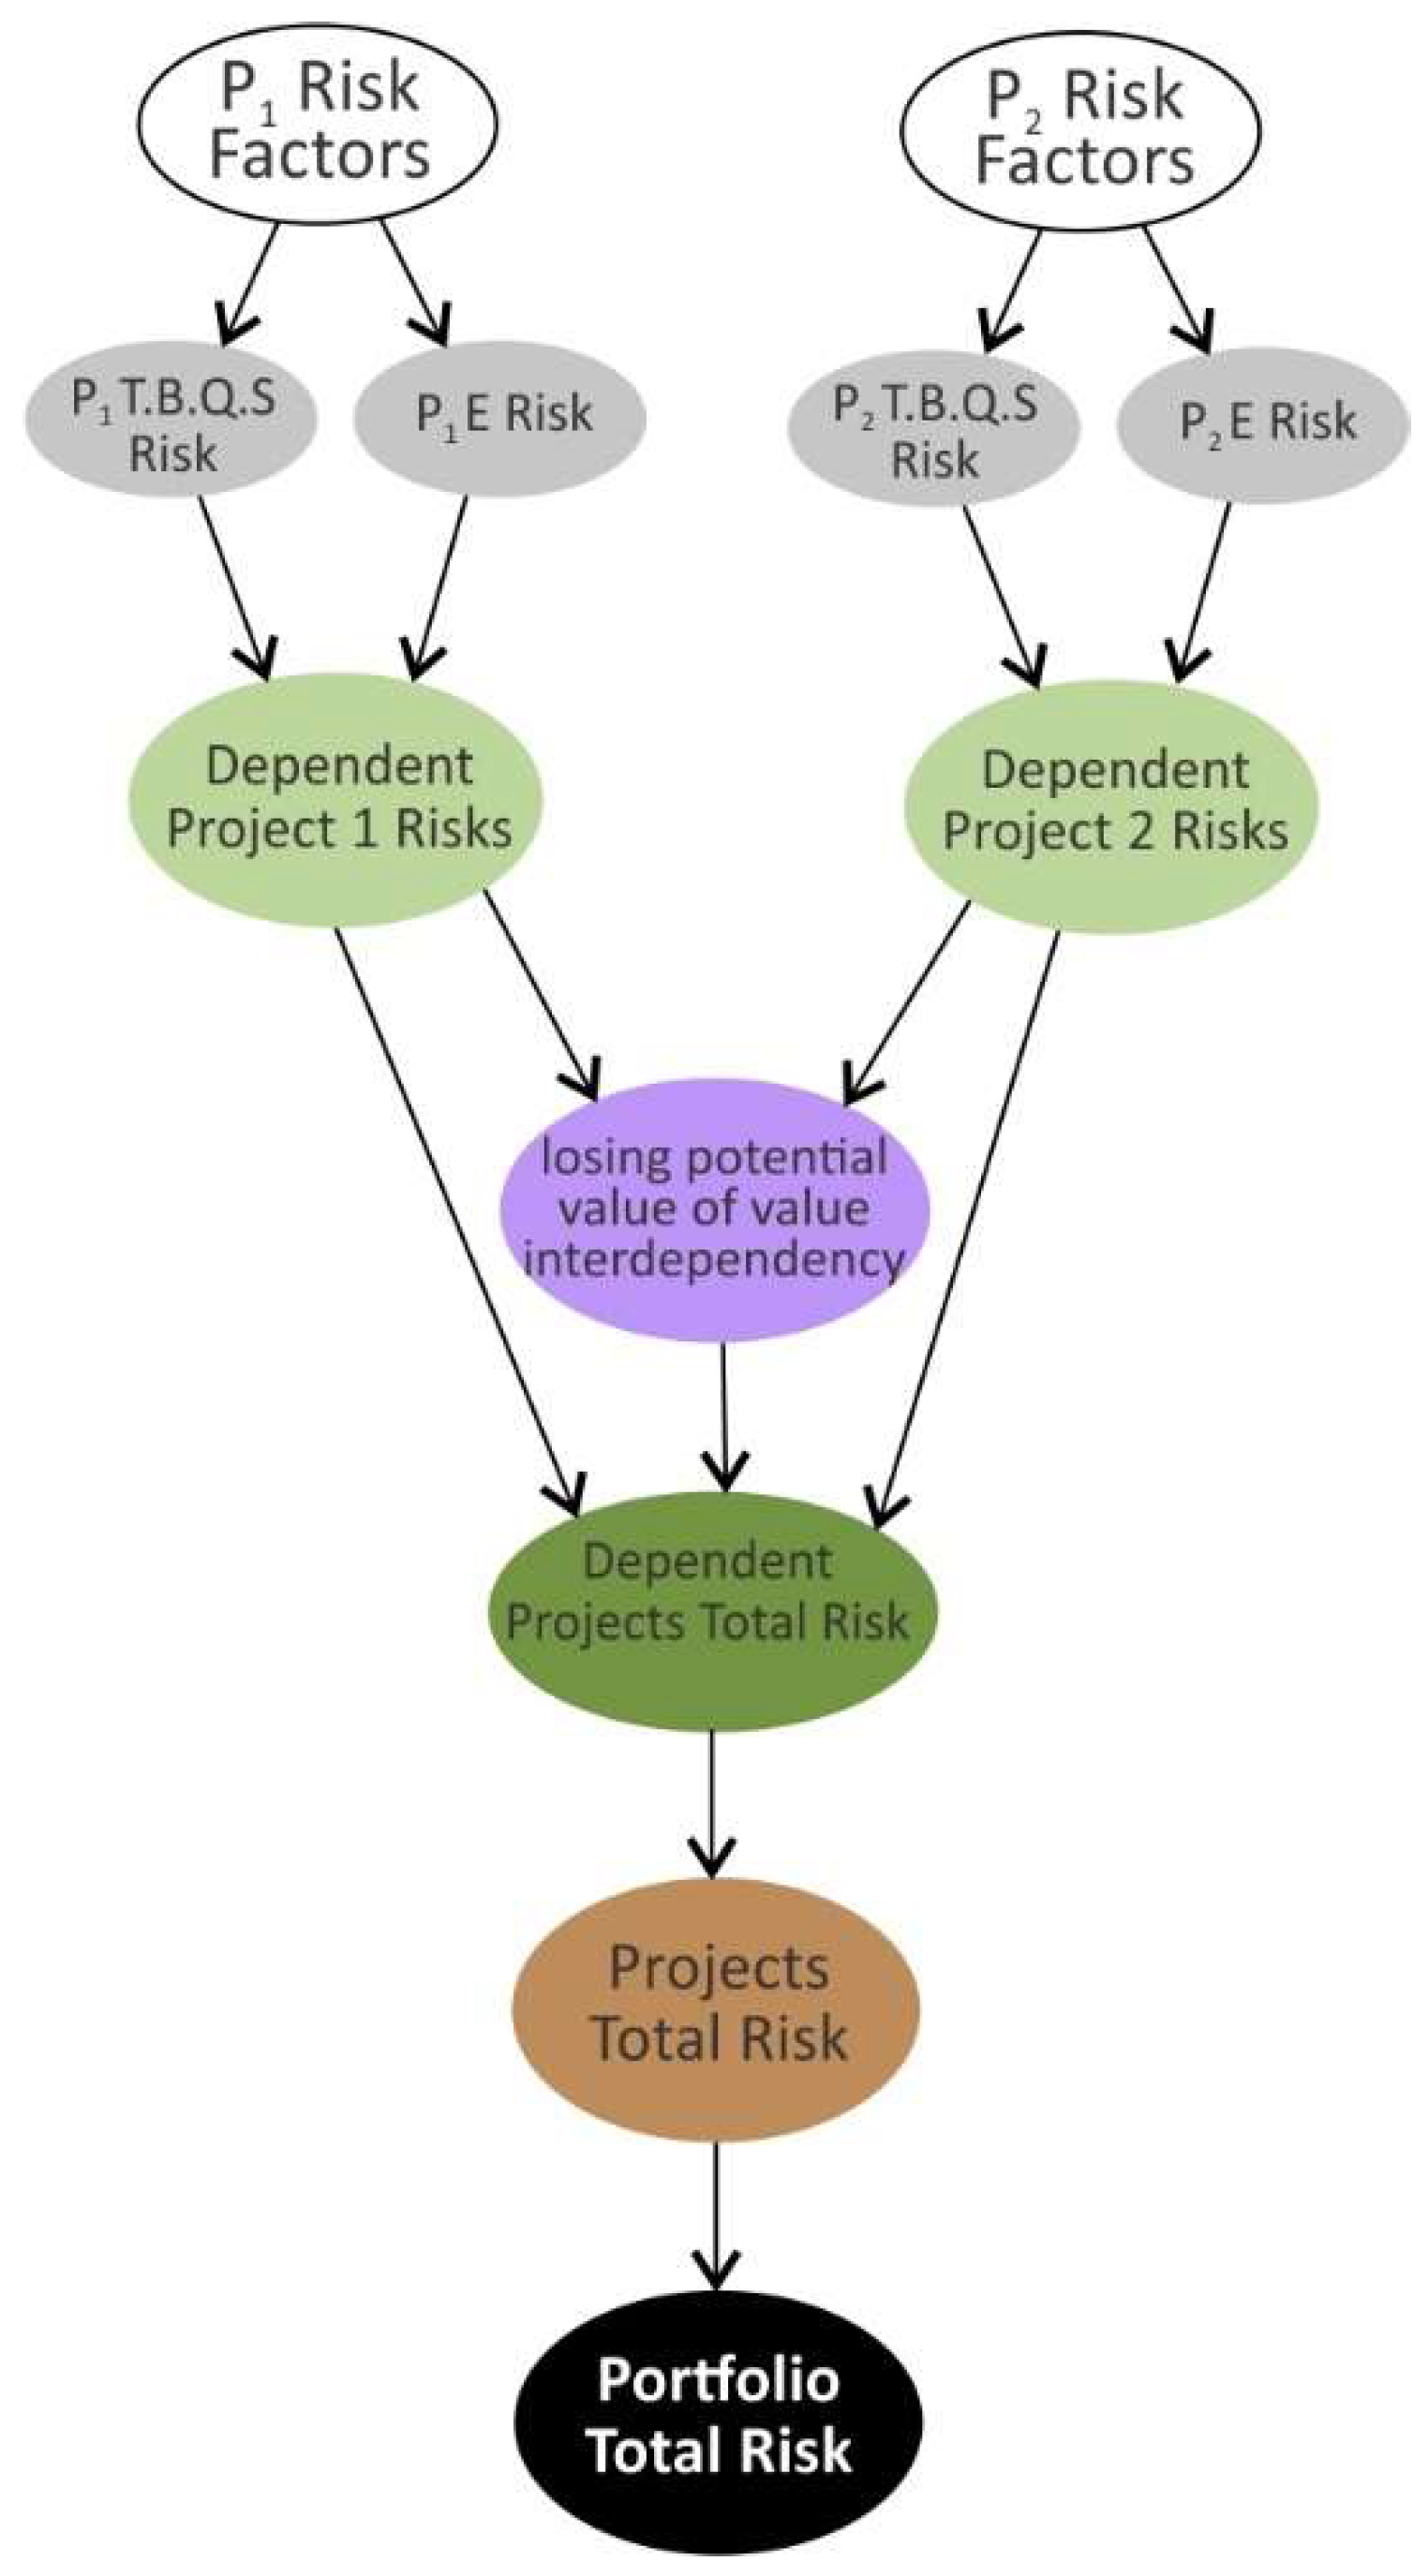
When two projects have value interdependency, if one of them is at risk, then the potential value of this interdependency and consequently the success of both projects will be at risk. Thus, as shown in
Figure 5, a new risk called “losing potential value of value interdependency” is added to the BN. The risks of dependent projects 1 and 2 are assigned as its parent nodes and it has an effect on the total risk of dependent projects.
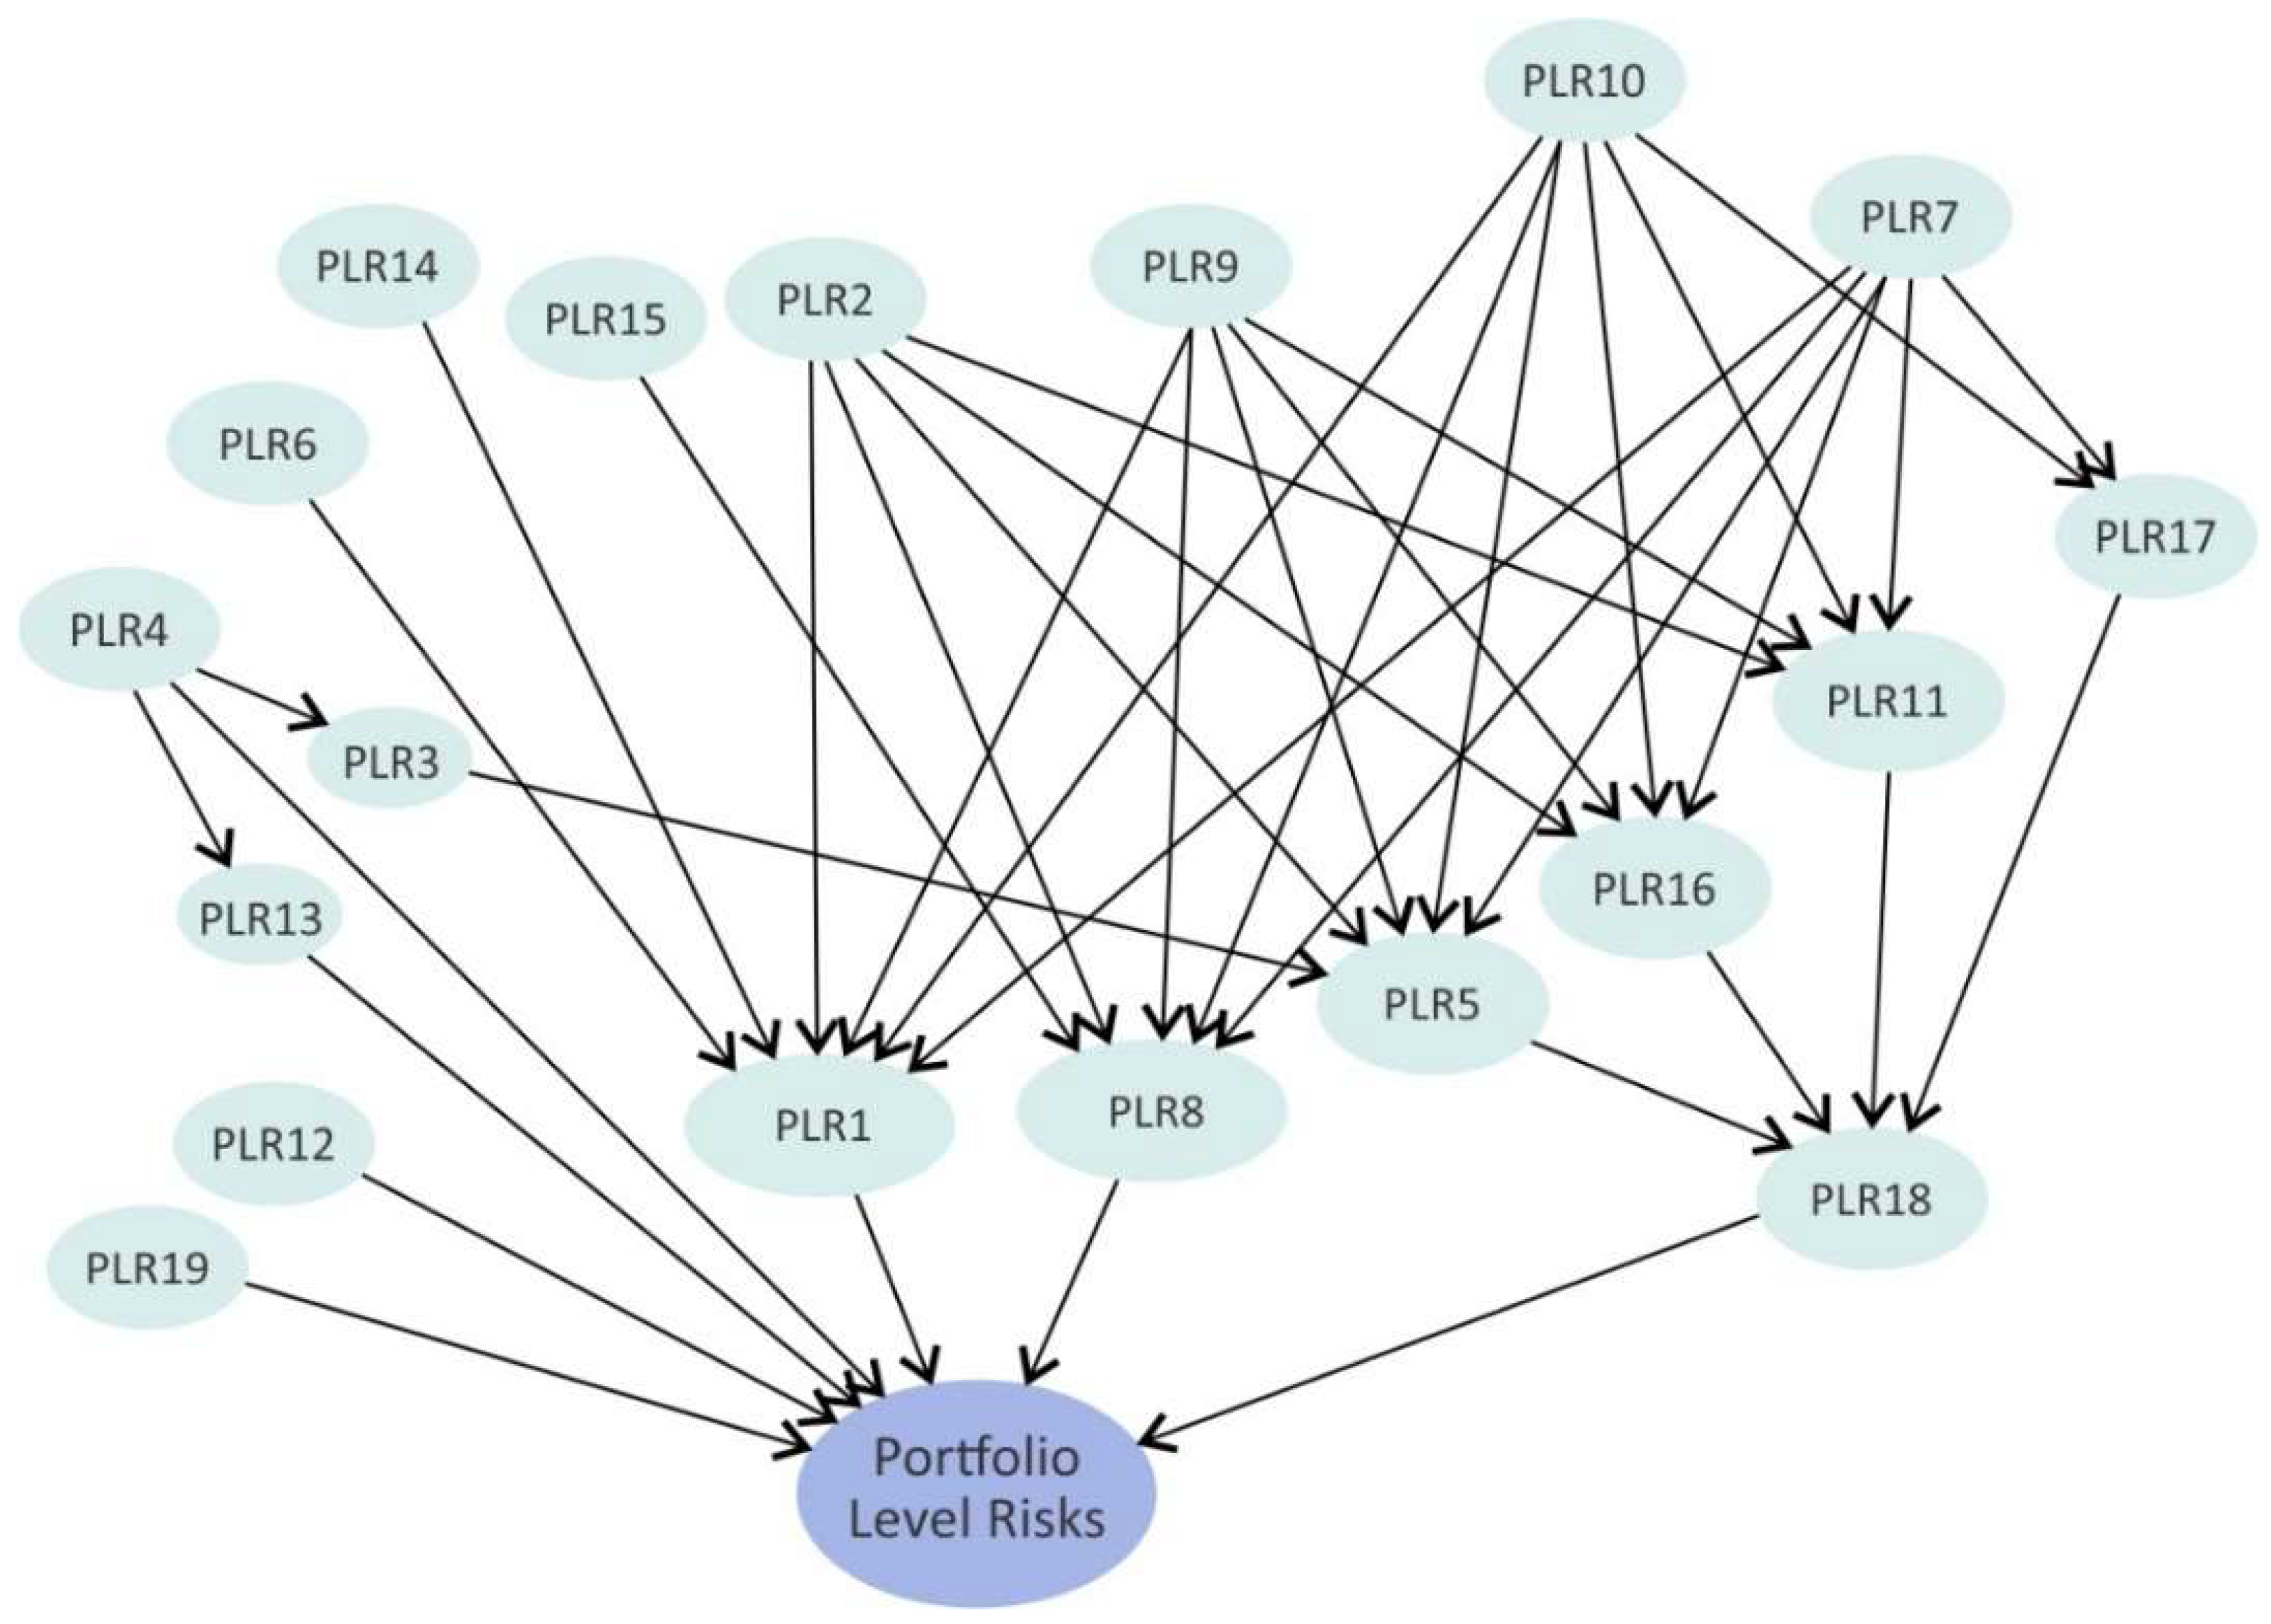
4.1.5. Portfolio-Level Risks in a Bayesian Network
Apart from portfolio-level risks’ effect on portfolio total risk, they have cause–effect relationships with each other as well. Based on field research and expert consultation, these relationships are constructed in a BN that is shown in
Figure 6. In addition to the risks shown in
Table 6, two nodes are added to the BN for having a more precise and clear analysis: “portfolio imbalance” (PLR18) that specifies the total imbalance of the portfolio as a consequence of different imbalance risks, and “other risks” (PLR19) that represent all portfolio-level risks that are not mentioned in this model.
“Top manager’s interference in governance review board’s decisions” (PLR7) and “governance review board’s incompetency” (PLR11), by having six child nodes, are the most important causes (parent nodes) among portfolio risks.
“Inaccuracy and lack of quality in information” (PLR9) and “lack of sharing or transparency in information” (PLR2), by having five child nodes, are on the next level of important causes (parent nodes) among portfolio risks.
“Choosing projects that are unaligned with strategic objectives of the organization” (PLR1), having six parent nodes, is the most important consequence among portfolio risks.
“Choosing too many projects for the available resources” (PLR8) and “portfolio’s imbalance in terms of high-risk project versus low-risk ones” (PLR5), by having five parent nodes, are on the next level of important consequences among portfolio risks.
These points can contribute to portfolio risk management success by facilitating the recognition of: (1) “upstream” risks with numerous child nodes, since by managing them the occurrence of many “downstream” risks can be prevented; (2) “downstream” risks with numerous parent nodes, because the probability of their occurrence may be higher than other risks [
62].
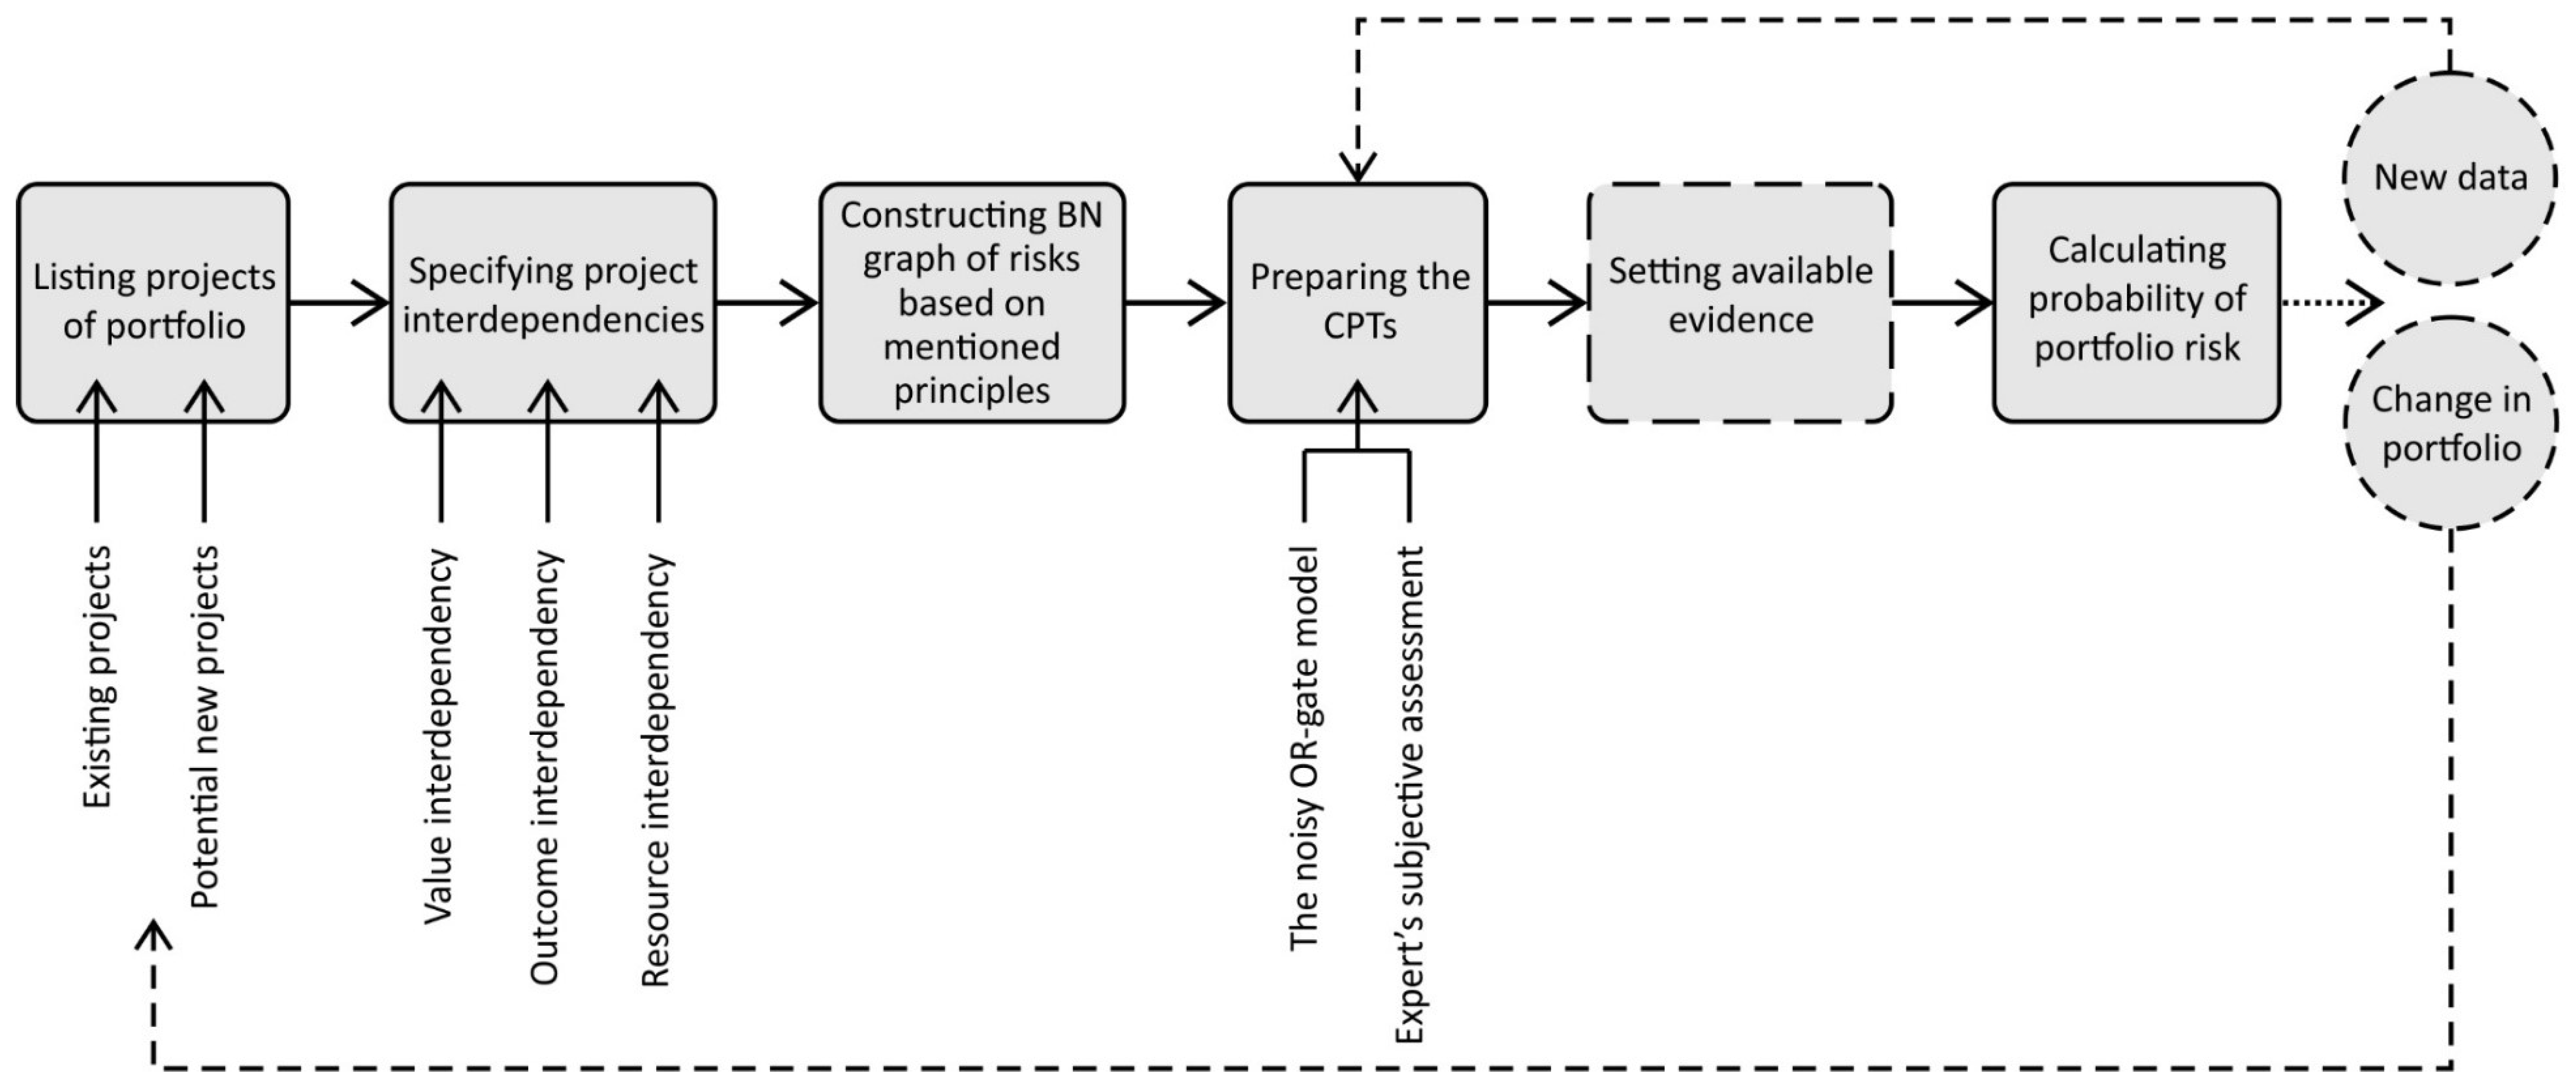
4.1.6. Compiled Bayesian Network for Portfolio Risk Analysis
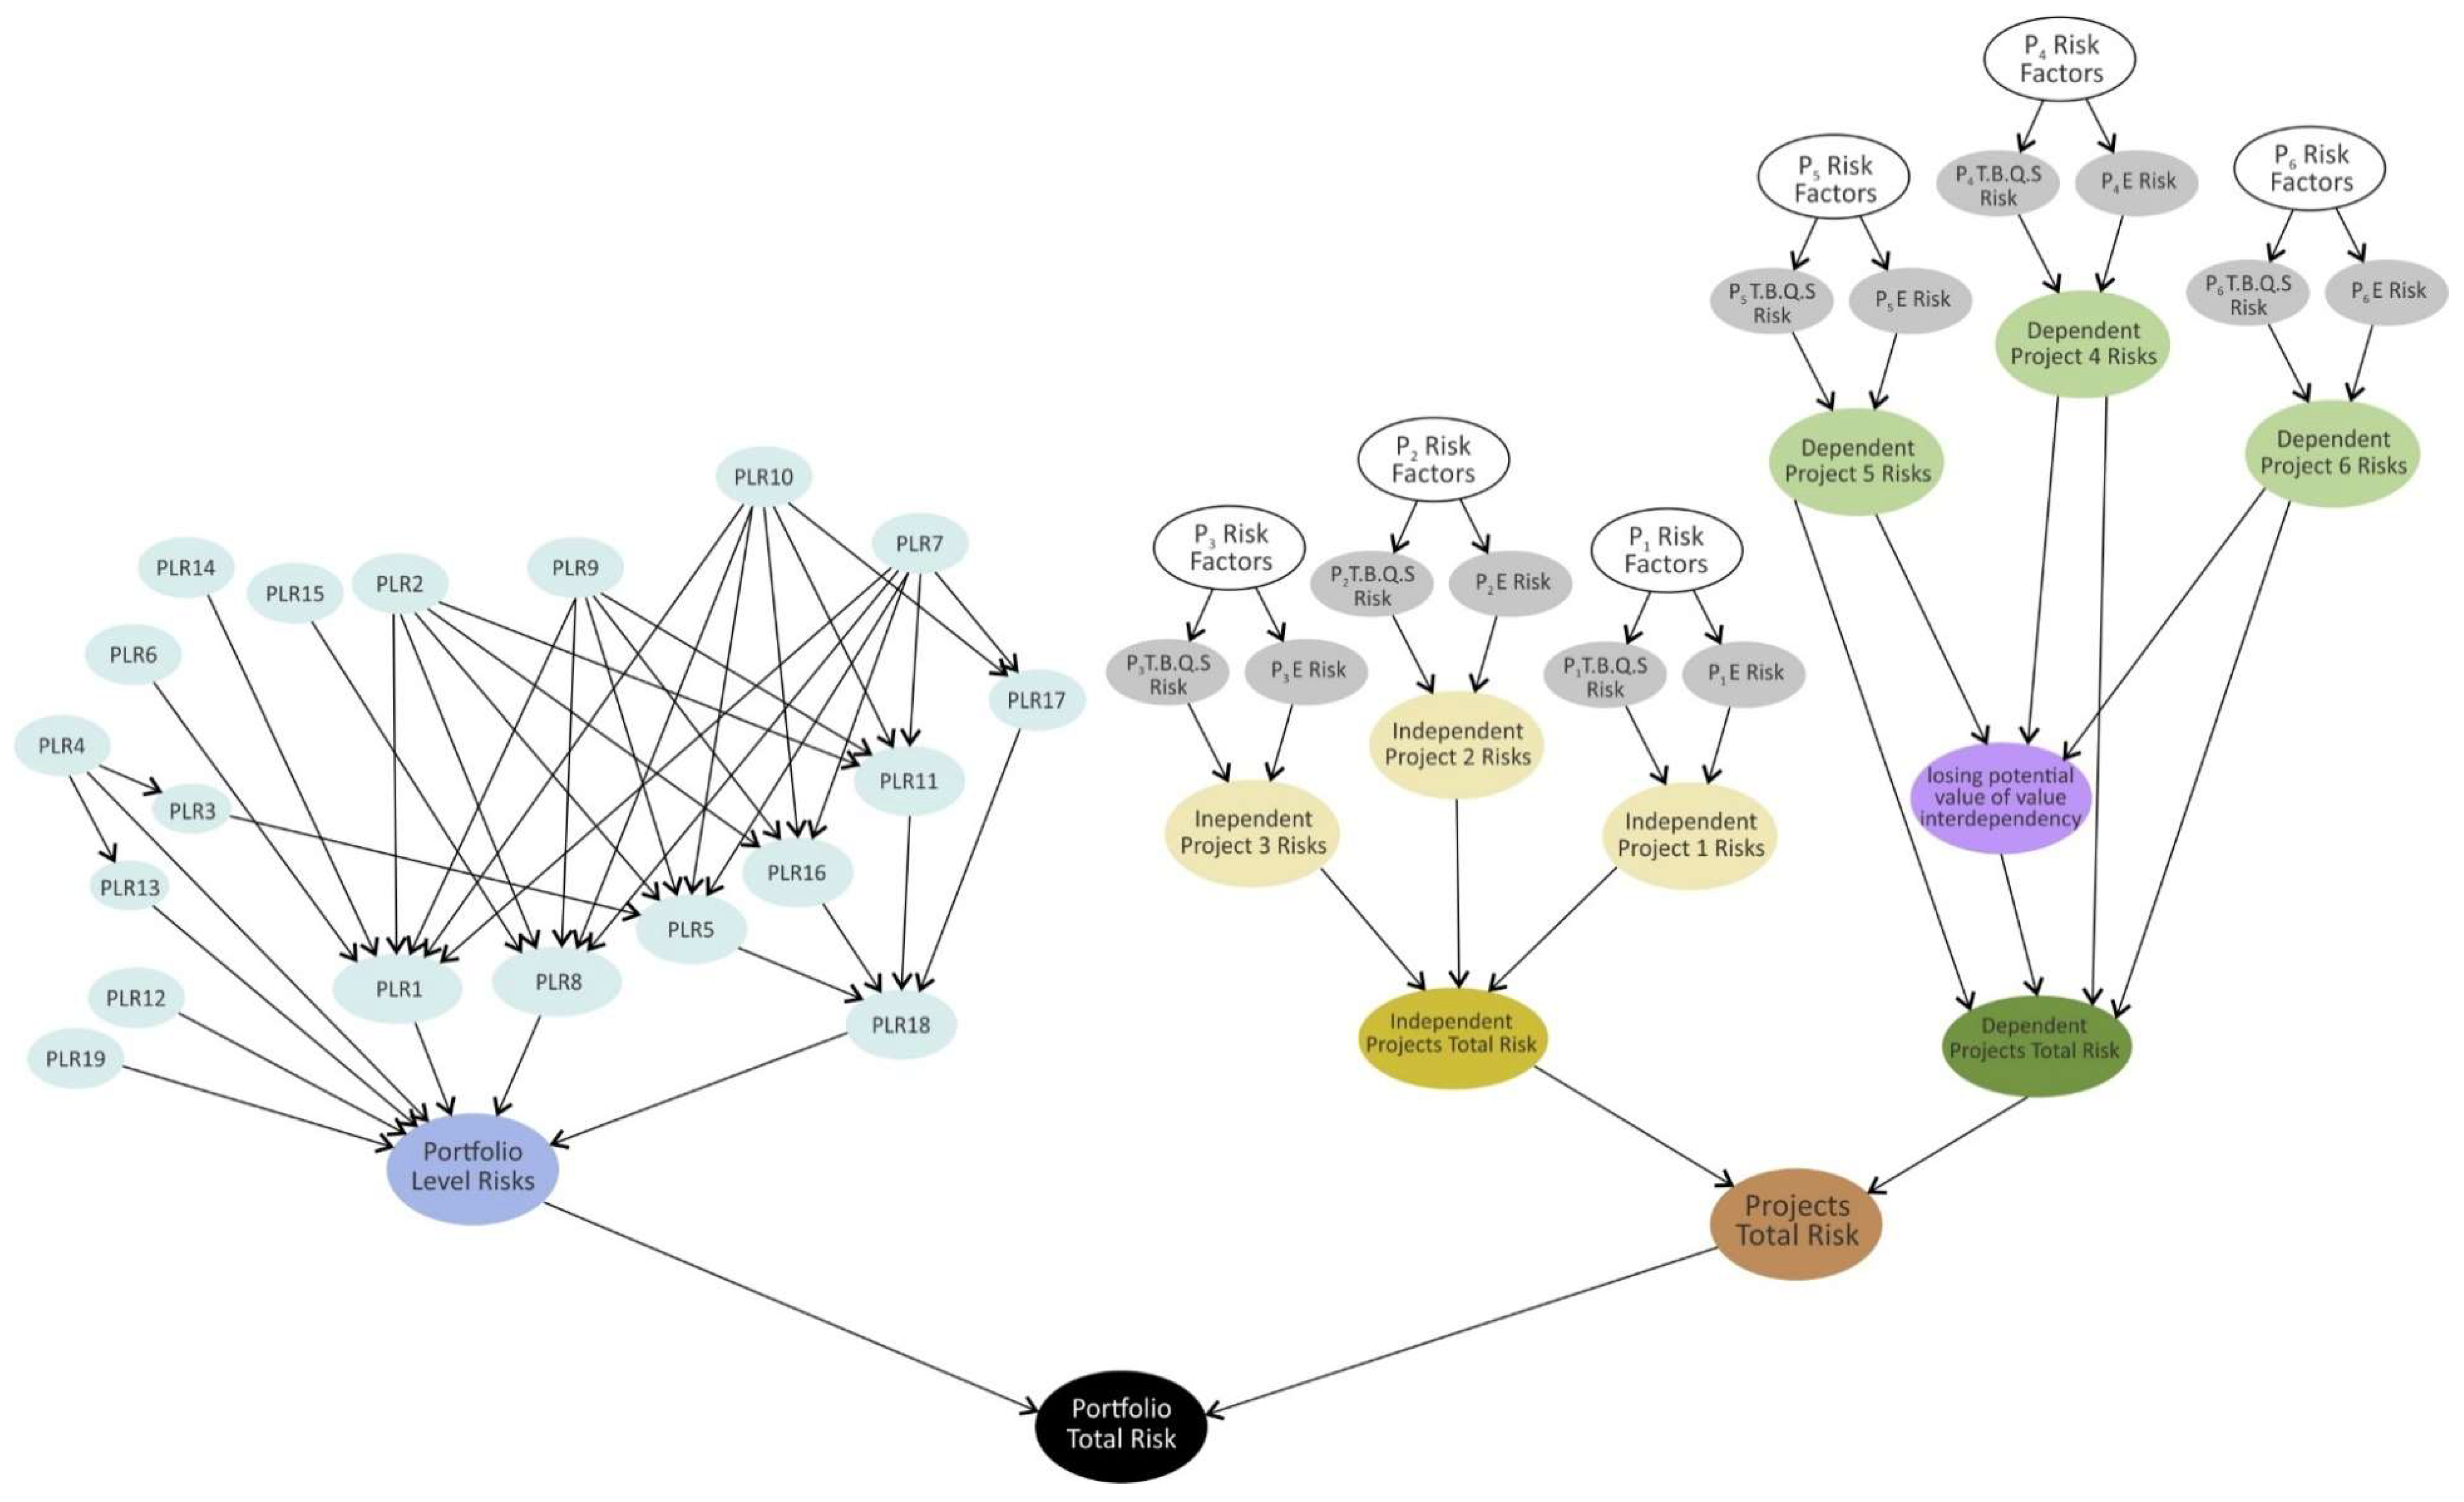
By putting the previously explained parts of the network together, the qualitative part of the BN for portfolio risk analysis is constructed.
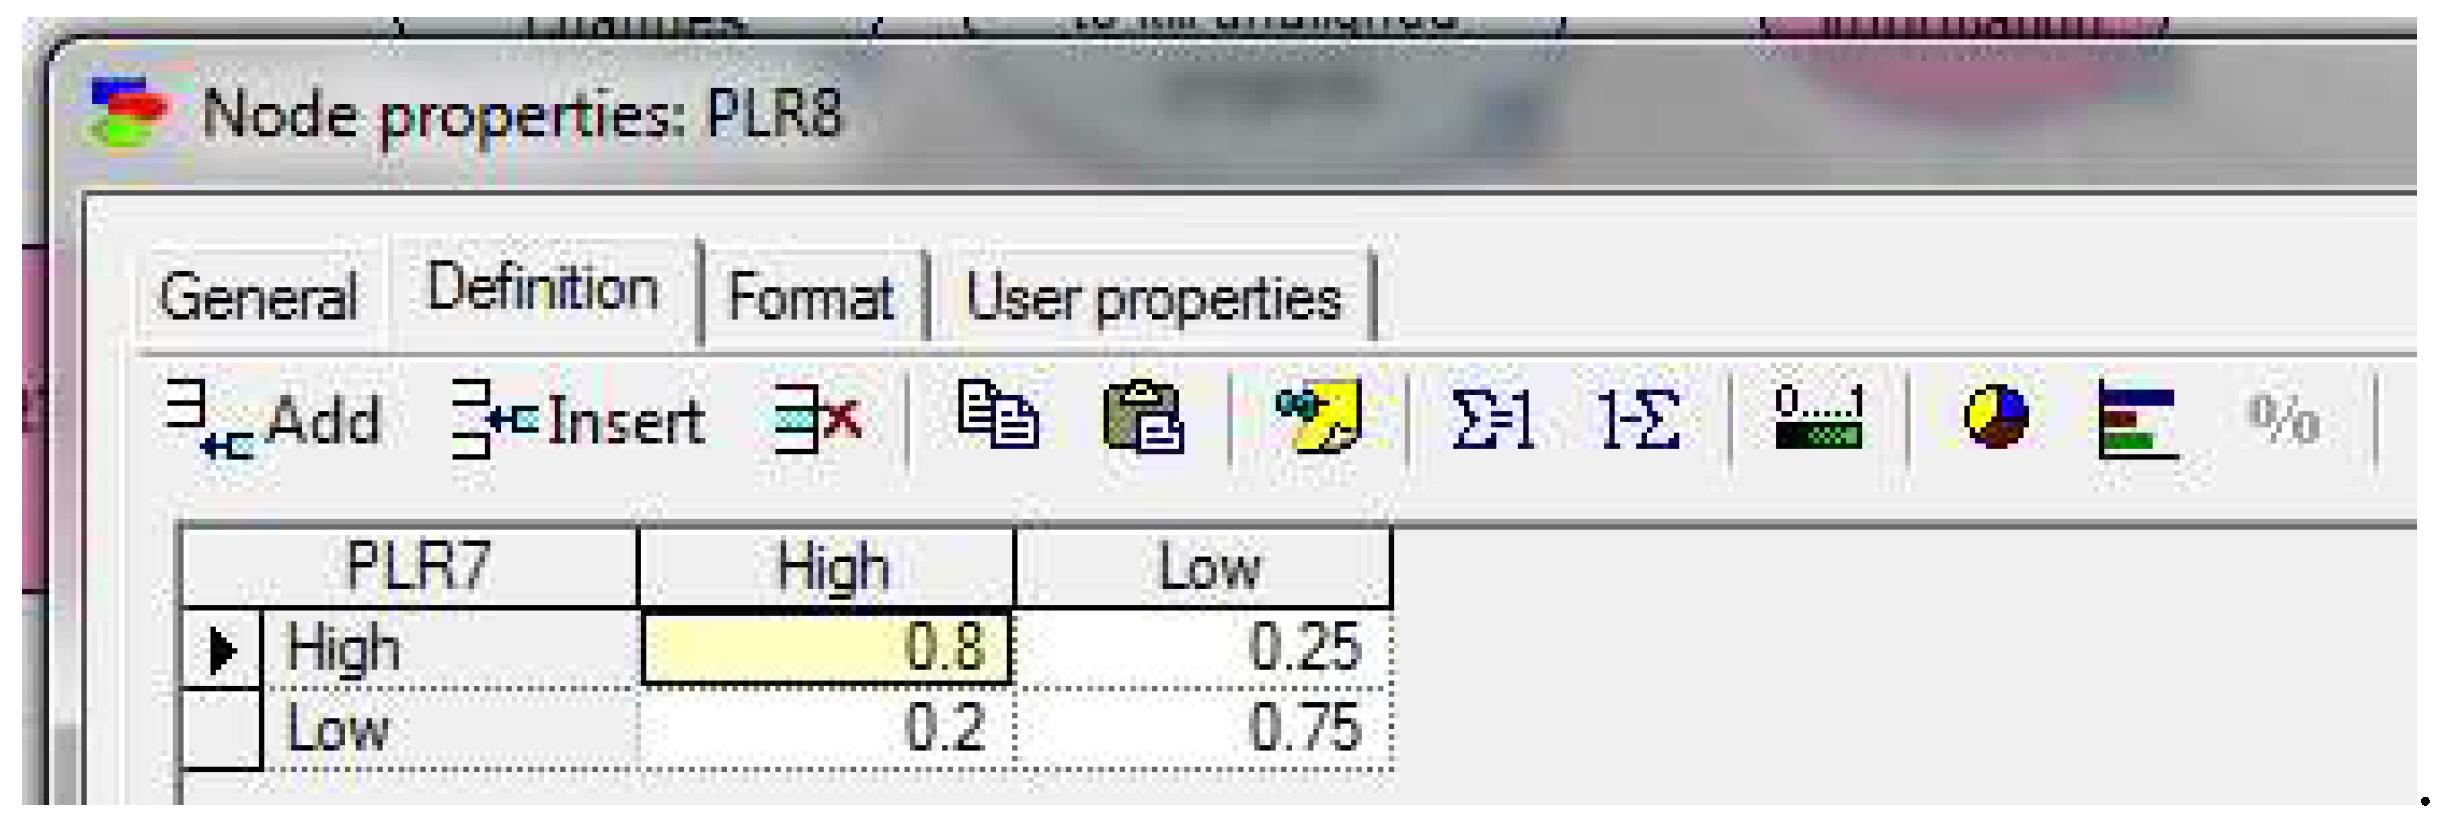
Figure 7 shows this part for a portfolio that has two independent projects and two projects with outcome dependency and value interdependency. Afterward, the quantitative part is assigned to the BN. This part includes the conditional probabilities of nodes, which are binary variables and can take either the low or the high state. Constructing the quantitative part begins with assigning the probability of root nodes (nodes with no parents). Then, based on the cause–effect relationships, other nodes are associated with conditional probability tables (CPTs). As an example,
Figure 8 shows the CPT of PLR8, which has PLR7 as its only parent.
In this model, numbers for CPTs are elicited from expert’s subjective assessments. However, it cannot be neglected that a node like PLR16 with 6 parent nodes requires 2
7 = 128 conditional probabilities to complete its CPT. Commenting on these numbers, which may have slight differences, while keeping the structure of reasoning in mind, could be a complicated and time-consuming task for the expert. These cases can be handled by Pearl’s noisy OR-gate [
32] that reduces the number of required conditional probabilities to the number of a node’s parents.
The noisy OR-gate is based on two assumptions: (1) accountability and (2) exception independence [
32]. With regard to the subject of the paper, the first assumption requires that a risk R be presumed LOW (i.e., P(R = HIGH) = 0) if all of its causes are LOW. The second assumption asserts that if a risk R is a consequence of either one of two risks r1 and r2, then the mechanism that may inhibit R being high because of r1’s high status (I1 inhibitory mechanism) is independent of I2. Considering these two assumptions to be true, using Equation (2), the numbers for a node’s CPT can be calculated.
Hi represents the subset of risk parents of a node that are HIGH and
qi denote the probability that the
i-th inhibitor is active. If
n is the only parent of
x that is HIGH, x will be HIGH if
qn is not active. Thus, we have:
The left part of Equation (3) is the number that the expert specifies for the noisy OR-gate model.
Table 8 shows the typical CPT of node
x, while
Table 9 and
Table 10 show that CPT, using the noisy OR-gate model.
After constructing the BN graph of risks, the network and the conditional probabilities are inserted as inputs to GeNIe [
63], which is a software used for Bayesian network analysis. Then, for a more accurate analysis, if available, the evidence suggesting whether a risk is in the high state or the low state is set in the software. Finally, based on the risk graph and the CPTs associated with it, the probability of total portfolio risk is calculated.
Figure 9 shows the procedure of portfolio risk analysis in this model.
4.2. Evaluation of the Model
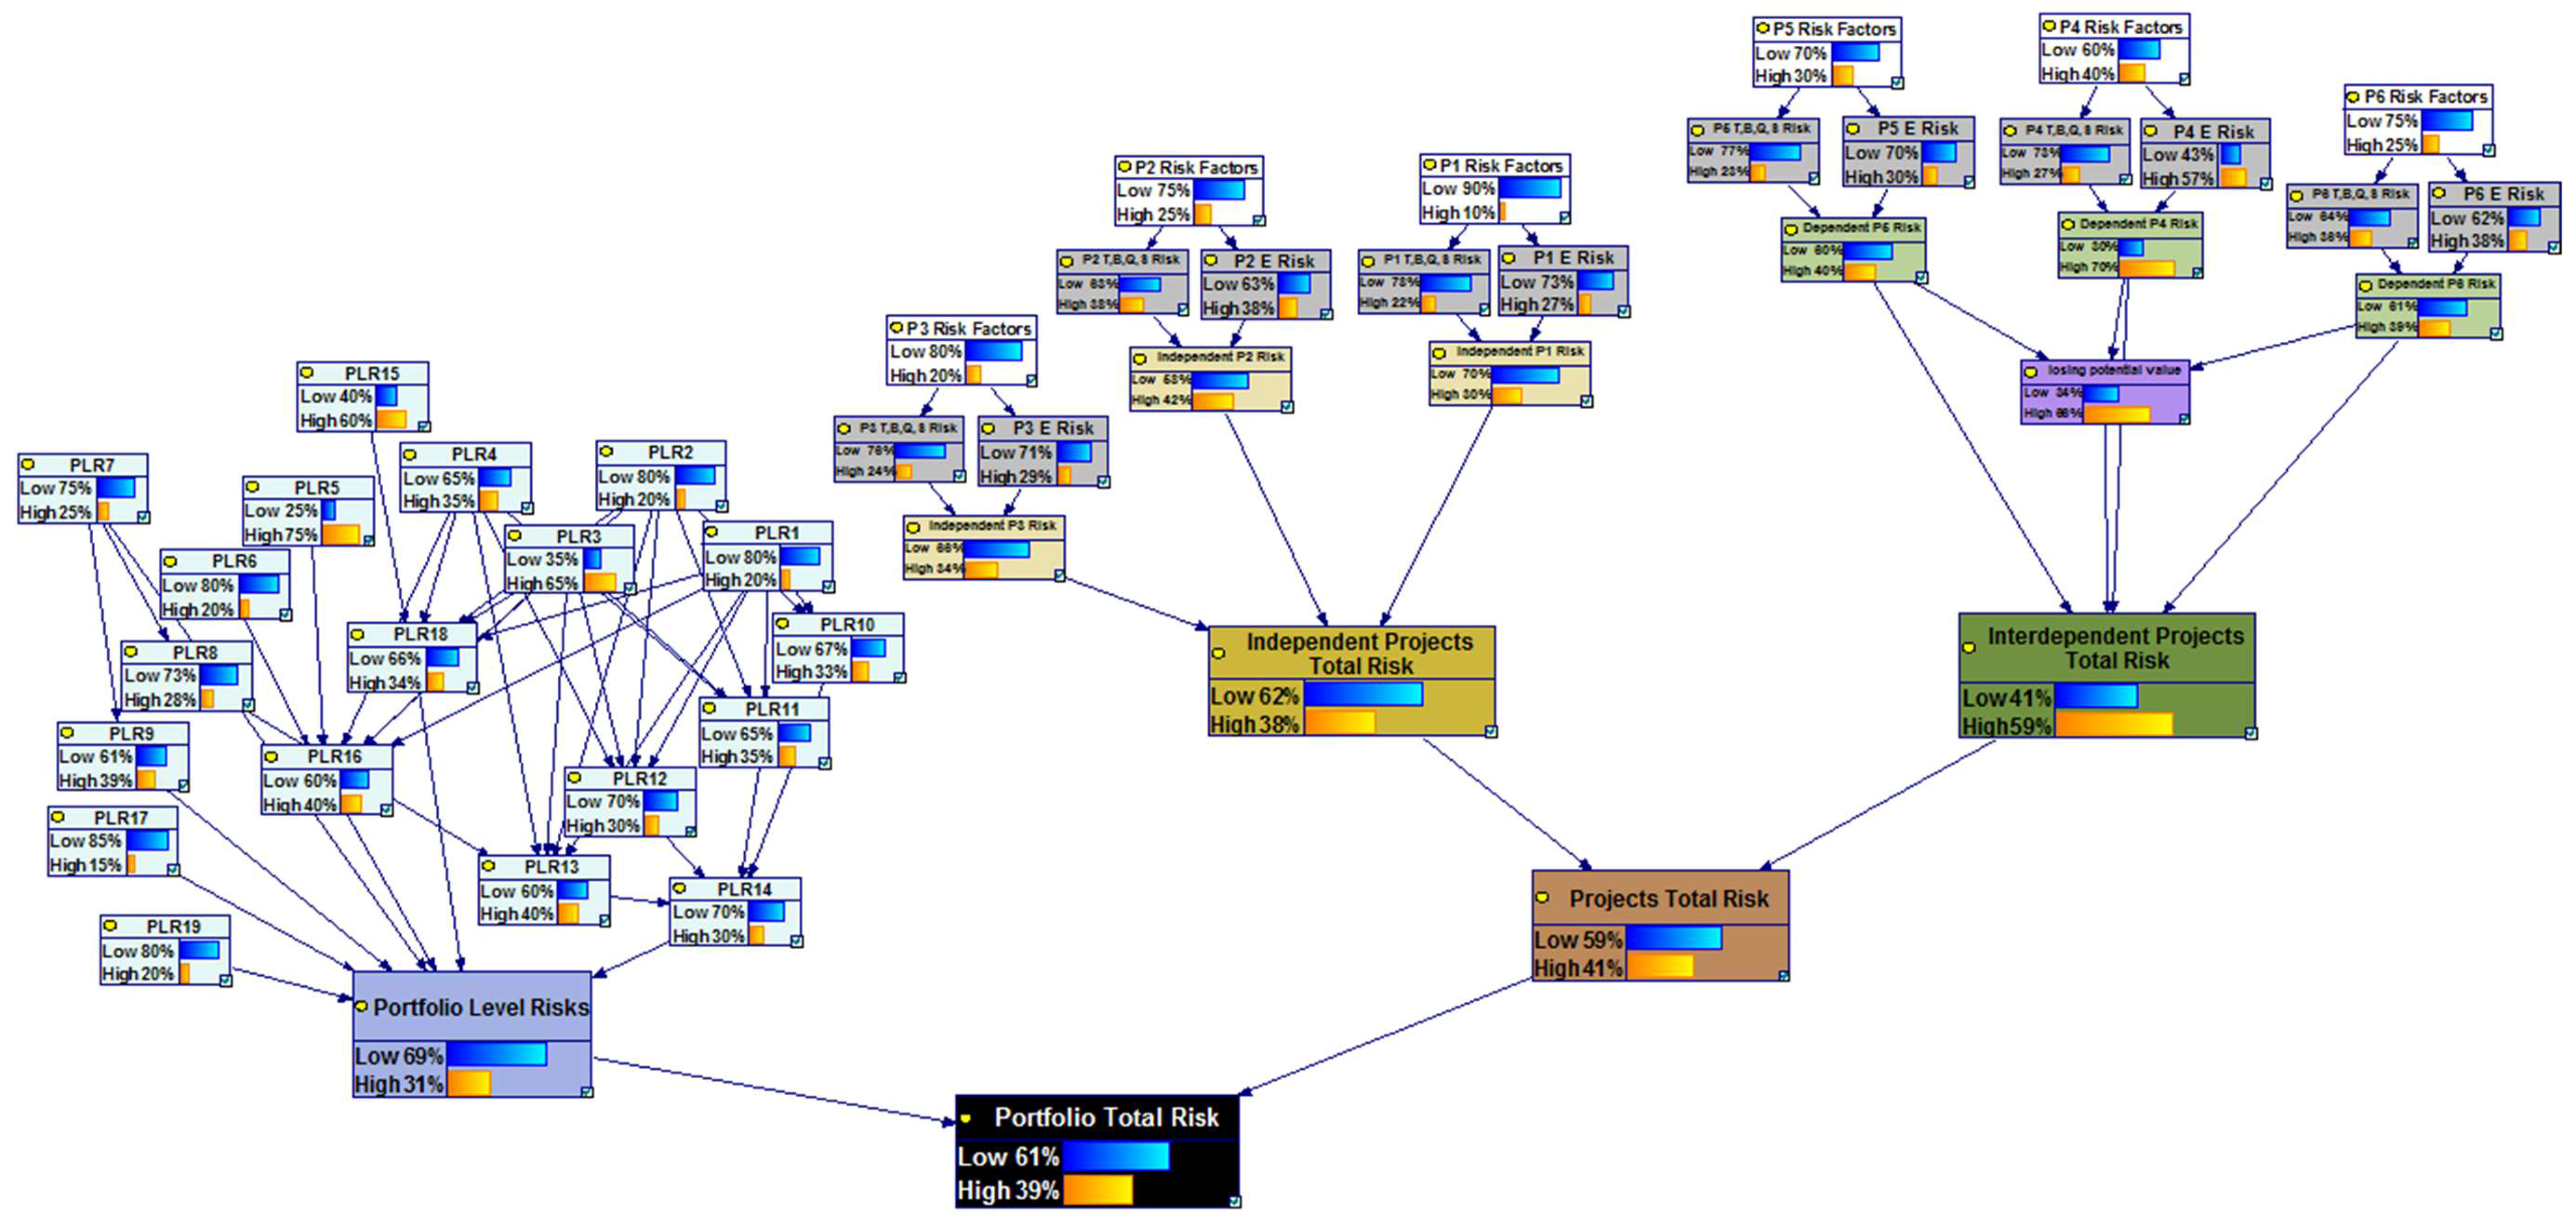
Evaluation of the model’s performance and practicality was assessed with real data and in the real portfolio environment. A portfolio from a subsidiary of a Swedish company, located in Iran and active in the construction industry, was chosen to be analyzed. The company had around 50 employees and an operating profit of 8.7%. It has provided consultancy and engineering services and has seven years of experience. Its portfolio included six projects: three independent projects (projects 1 to 3) and three projects with value interdependency (projects 4 to 6). Project 4 was the greatest project, area-wise, that they had ever had and it was going to be delivered in partnership with another company. Furthermore, adding another independent project to the portfolio was under review. A part of project 4 was implemented by another firm but it was suspended after the contract’s termination.
First, the probability of portfolio risk was calculated considering the six existing projects. To do so, the risk graph was constructed based on the principles mentioned (
Figure 10) and the CPTs were completed with the CEO’s assessments. Finally, the model showed the result as presented in
Figure 11, from which it can be deduced that:
Project 4, which had value interdependency and was being implemented through partnership with another company, had the highest risk probability of 70% among all projects. Since the company had no experience of a project at this scale and based on the interviews with the CEO, aspects of their partnership were not quite clarified, this probability of risk is not surprising.
PLR14 and PLR15, with probabilities of 75% and 60%, respectively, were the highest portfolio-level risks. This is because the board of directors believed that project termination involved a very complex and time-consuming legal process, and was damaging for the company’s reputation. Therefore, they avoided killing off a project, even when it did not reflect the organizational strategy, or its required resources were hardly available.
The probability of high portfolio total risk was 39%. Furthermore, a look at its parent and grandparent nodes showed that the dependent projects’ total risk with the probability of 59% was the highest risk among them. This piece of information could contribute to more effective risk-response planning since the model revealed that reducing the risk of dependent projects would have a considerable effect on portfolio risk reduction.
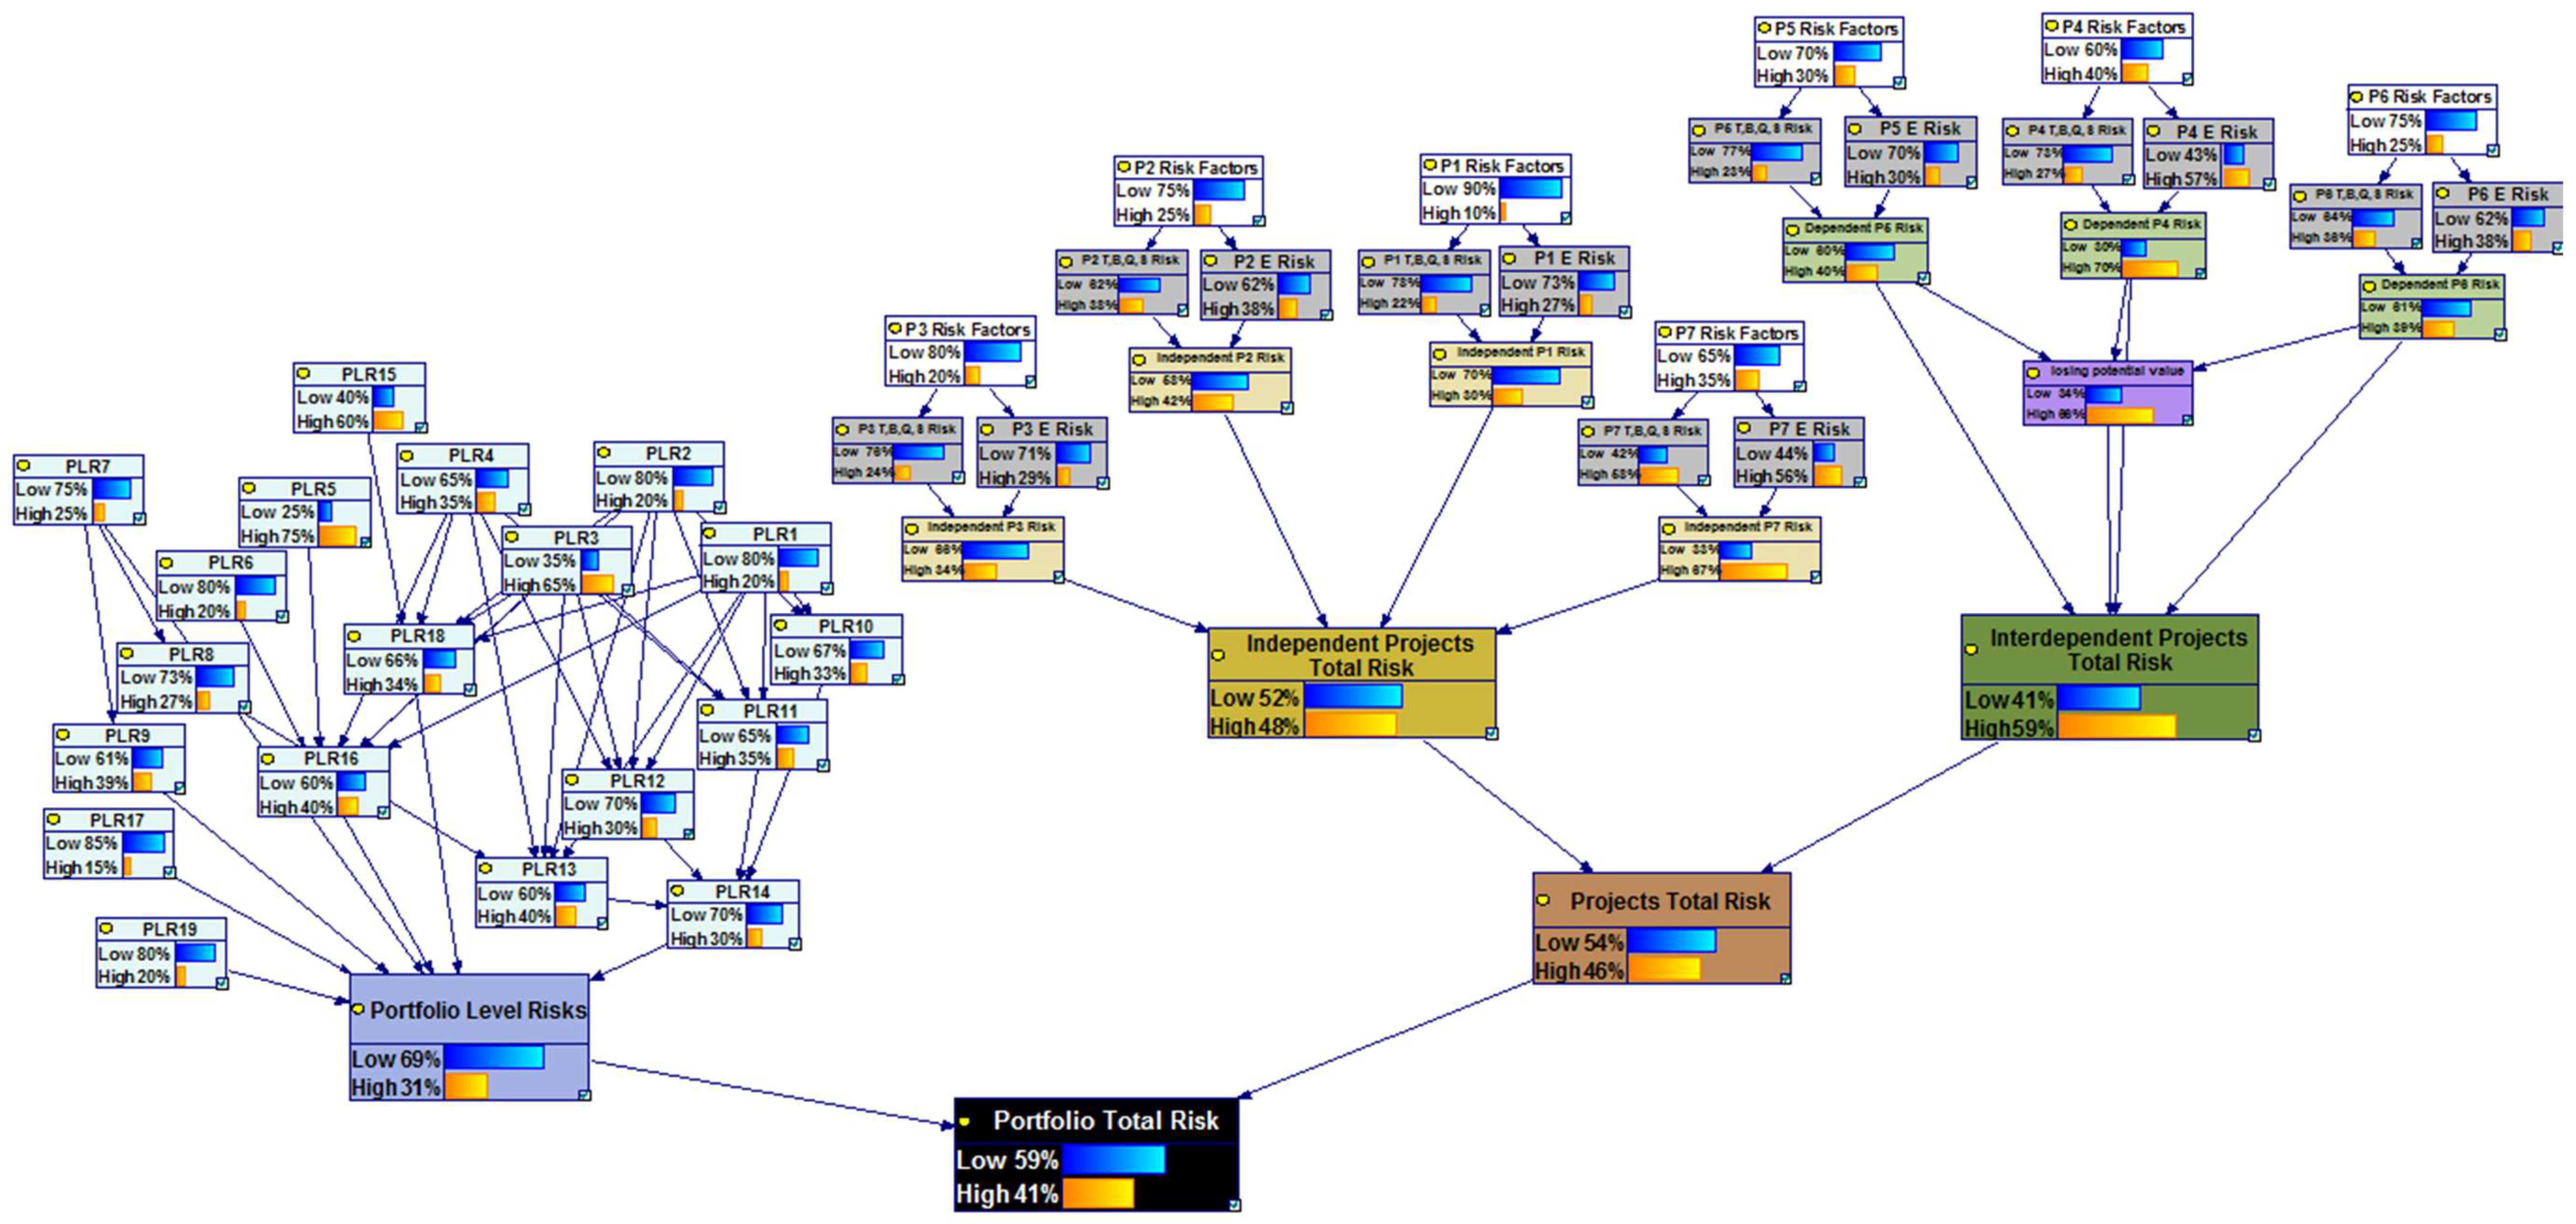
Afterwards, the fourth independent project was added to the BN and the following steps were taken for re-analyzing the network:
Probabilities and conditional probabilities for the four new nodes, which this project added to the BN, were inserted as inputs to the tables.
The CPT of independent projects total risk which by adding this project had a new parent, was reassessed.
Those portfolio-level risks that could change because of adding a new project were re-assessed as well; especially risks concerned with portfolio’s imbalance (PLR5, PLR10, PLR16, and PLR17), lack of resources (PLR8), strategic unalignment (PLR1) and lack of clarity in stakeholders’ roles (PLR13).
The network was then updated and showed the result presented in
Figure 12. The model revealed that by adding this project to the portfolio, the total risk of independent projects would increase from 38% to 48% but the portfolio total risk would increase only by 2%. This is while, based on the CEO’s assessment, the new project would not affect the portfolio-level risks. Therefore, the slight change in portfolio total risk could mean that the effect of independent projects on portfolio risk was minor. Thus, from the portfolio risk management point of view, although selecting the fourth independent project increased the portfolio total risk, the project only marginally affected this risk.
5. Conclusions
This paper presented a BN modeling framework for analyzing the risk of a portfolio in order to achieve sustainability. This framework includes a Bayesian network of portfolio risks, which clarifies their cause–effect relationships. Besides single-project risks, the network involves risks that arise from project interdependencies and portfolio-level risks, which were identified in this paper as well.
The results supported the idea that a way of identifying portfolio-level risks and integrating sustainability is to study portfolio success criteria, and marked risks such as “choosing projects that are unaligned with strategic objectives of the organization”, “lack of sharing or transparency in information”, “deficiency in portfolio risk management” and “portfolio manager’s incompetency” as the most approved portfolio-level risks. Furthermore, the results confirmed that although project interdependencies create synergies, they pose threats to the portfolio and projects’ success.
After identifying the risks, constructing the Bayesian network visualized how the risks of interdependent projects affect the other risks and the total risk of the portfolio. Moreover, this network highlighted the most important upstream (“top manager’s interference in governance review board’s decisions” and “governance review board’s incompetency”) and downstream (“choosing projects that are unaligned with strategic objectives of the organization”, “portfolio imbalance in terms of high-risk projects versus low-risk ones”, and “choosing too many projects for the available resources”) portfolio-level risks.
Having these characteristics, the presented BN-based framework was evaluated with the real data of a portfolio containing construction projects. In addition to calculating the probability of portfolio total risk, the model proved effective in quickly estimating the change in portfolio risk probability, in the case of adding or removing projects. Therefore, the framework showed that it could contribute to more accurate and sustainable portfolio project selection and decision-making process. Furthermore, it could discriminate between portfolio-level and project-level risks, proving beneficial in the development of diversified portfolios regarding the projects’ associated risks. In other words, the presented framework confirmed the approach that a diversified portfolio with a desired level of risk is not a set of projects with that risk level, but a group of projects with different levels of risk that, through interrelations, lead to a portfolio with the intended risk level. Moreover, as presented in
Figure 11 and
Figure 12, since the result of the model showed the probability of different categories of risks, the most effective risks in increasing the portfolio total risk could be recognized. This type of information can help managers and the decision makers in conducting a more successful risk-response planning and managing a more sustainable portfolio.
Author Contributions
F.G. and V.F., designed the research, set the objectives, studied the literature, analyzed data, designed and developed the portfolio risk analysis model based on Bayesian networks and using GeNIe software, and wrote the paper. R.F. and M.H.M.S. gathered data through conducting interviews with the experts, contributed to developing the research idea, and provided extensive advice on the literature review, risk identification, model development and its evaluation. J.T. collected and analyzed the data and the obtained results, provided extensive advice throughout the study, and revised the manuscript, methodology and findings. All authors discussed the model evaluation results and commented on the paper.
Funding
This research received no external funding.
Conflicts of Interest
The authors declare no conflict of interest.
References
- Project Management Institute. The Standard for Portfolio Management, 3rd ed.; Project Management Institute: Newtown Square, PA, USA, 2013. [Google Scholar]
- Sanchez, H.; Robert, B.; Pellerin, R. A project portfolio risk-opportunity identification framework. Proj. Manag. J. 2008, 39, 97–109. [Google Scholar] [CrossRef]
- Elonen, S.; Artto, K.A. Problems in managing internal development projects in multi-project environments. Int. J. Proj. Manag. 2003, 21, 395–402. [Google Scholar] [CrossRef]
- Teller, J. Portfolio Risk Management and Its Contribution to Project Portfolio Success: An Investigation of Organization, Process, and Culture. Proj. Manag. J. 2013, 44, 36–51. [Google Scholar] [CrossRef]
- Silvius, G. Integrating sustainability into project risk management. In Global Business Expansion: Concepts, Methodologies, Tools, and Applications; IGI Global: Hershey, PA, USA, 2018; pp. 330–352. [Google Scholar]
- Iqbal, S.; Choudhry, R.M.; Holschemacher, K.; Ali, A.; Tamošaitienė, J. Risk management in construction projects. Technol. Econ. Dev. Econ. 2015, 21, 65–78. [Google Scholar] [CrossRef]
- MacAskill, K.; Guthrie, P. Risk-based approaches to sustainability in civil engineering. Eng. Sustain. 2013, 166, 181–190. [Google Scholar] [CrossRef]
- Sanchez, H.; Robert, B.; Bourgault, M.; Pellerin, R. Risk management applied to projects, programs, and portfolios. Int. J. Manag. Proj. Bus. 2009, 2, 14–35. [Google Scholar] [CrossRef]
- Teller, J.; Kock, A. An empirical investigation on how portfolio risk management influences project portfolio success. Int. J. Proj. Manag. 2013, 31, 817–829. [Google Scholar] [CrossRef]
- Eik-Andresen, P.; Johansen, A.; Landmark, A.D.; Sørensen, A.Ø. Controlling a Multibillion Project Portfolio—Milestones as Key Performance Indicator for Project Portfolio Management. Proced. Soc. Behav. Sci. 2016, 226, 294–301. [Google Scholar] [CrossRef]
- Olsson, R. Risk management in a multi-project environment. An approach to manage portfolio risks. Int. J. Qual. Reliab. Manag. 2008, 25, 60–71. [Google Scholar] [CrossRef]
- Zhang, Y. Selecting risk response strategies considering project risk interdependence. Int. J. Proj. Manag. 2016, 34, 819–830. [Google Scholar] [CrossRef]
- Canbaz, B.; Marle, F. Construction of project portfolio considering efficiency, strategic effectiveness, balance and project interdependencies. Int. J. Proj. Organ. Manag. 2016, 8, 103–126. [Google Scholar] [CrossRef]
- Bathallath, S.; Smedberg, Å.; Kjellin, H. Managing project interdependencies in IT/IS project portfolios: A review of managerial issues. Int. J. Inf. Syst. Proj. Manag. 2016, 4, 67–82. [Google Scholar]
- Dehdasht, G.; Mohamad Zin, R.; Ferwati, M.S.; Mohammed Abdullahi, M.; Keyvanfar, A.; McCaffer, R. DEMATEL-ANP Risk Assessment in Oil and Gas Construction. Sustainability 2017, 9, 1420. [Google Scholar] [CrossRef]
- Gónzalez, M.P.; De La Rosa, C.G.B.; Moran, F.J.C. Fuzzy cognitive maps and computing with words for modeling project portfolio risks interdependencies. Int. J. Innov. Appl. Stud. 2016, 15, 737. [Google Scholar]
- Tofighian, A.A.; Moezzi, H.; Barfuei, M.K.; Shafiee, M. Multi-period project portfolio selection under risk considerations and stochastic income. J. Ind. Eng. Int. 2018, 1–14. [Google Scholar] [CrossRef]
- Panadero, J.; Doering, J.; Kizys, R.; Juan, A.A.; Fito, A. A variable neighborhood search simheuristic for project portfolio selection under uncertainty. J. Heuristics 2018, 1–23. [Google Scholar] [CrossRef]
- Sefair, J.A.; Méndez, C.Y.; Babat, O.; Medaglia, A.L.; Zuluaga, L.F. Linear solution schemes for Mean-SemiVariance Project portfolio selection problems: An application in the oil and gas industry. Omega 2017, 68, 39–48. [Google Scholar] [CrossRef]
- Marle, F.; Vidal, L.A.; Bocquet, J.C. Interactions-based risk clustering methodologies and algorithms for complex project management. Int. J. Prod. Econ. 2013, 142, 225–234. [Google Scholar] [CrossRef]
- Tamošaitienė, J.; Zavadskas, E.K.; Turskis, Z. Multi-criteria risk assessment of a construction project. Proced. Comput. Sci. 2013, 17, 129–133. [Google Scholar] [CrossRef]
- Boateng, P.; Chen, Z.; Ogunlana, S.O. An Analytical Network Process model for risks prioritisation in megaprojects. Int. J. Proj. Manag. 2015, 33, 1795–1811. [Google Scholar] [CrossRef]
- Diab, M.F.; Nassar, K. Using Risk Assessment to Improve Highway Construction Project Performance. In Proceedings of the ASC Annual 48th Annual International Conference, Birmingham, UK, 11–14 April 2012. [Google Scholar]
- Levine, H.A. Project Portfolio Management: A Practical Guide to Selecting Projects, Managing Portfolios, and Maximizing Benefits; John Wiley & Sons: San Francisco, CA, USA, 2007. [Google Scholar]
- Quresh, A.A.; Jeswani, H. Qualitative study on construction project risk. Int. J. Eng. Technol. Sci. Res. 2018, 5, 40–48. [Google Scholar]
- Gear, T.E.; Cowie, G.C. A note on modeling project interdependence in research and development. Decis. Sci. 1980, 11, 738–748. [Google Scholar] [CrossRef]
- Killen, C.P.; Kjaer, C. Understanding project interdependencies: The role of visual representation, culture and process. Int. J. Proj. Manag. 2012, 30, 554–566. [Google Scholar] [CrossRef]
- Schmidt, R.L. A model for R&D project selection with combined benefit, outcome and resource interactions. IEEE Trans. Eng. Manag. 1993, 40, 403–410. [Google Scholar]
- Bhattacharyya, R.; Kumar, P.; Kar, S. Fuzzy R&D portfolio selection of interdependent projects. Comput. Math. Appl. 2011, 62, 3857–3870. [Google Scholar]
- Verma, D.; Sinha, K.K. Toward a theory of project interdependencies in high tech R&D environments. J. Oper. Manag. 2002, 20, 451–468. [Google Scholar]
- Charniak, E. Bayesian Networks without Tears. AI Mag. 1991, 12, 50–63. [Google Scholar]
- Pearl, J. Probabilistic Reasoning in Intelligent Systems: Networks of Plausible Inference; Morgan Kaufmann: San Mateo, CA, USA, 1988. [Google Scholar]
- Fan, C.F.; Yu, Y.C. BBN-based software project risk management. J. Syst. Softw. 2004, 73, 193–203. [Google Scholar] [CrossRef]
- Heckerman, D. Bayesian Networks for Data Mining. Data Min. Knowl. Discov. 1997, 1, 79–119. [Google Scholar] [CrossRef]
- Jain, A.K.; Mao, J.; Mohiuddin, K.M. Artificial Neural Networks: A Tutorial. Computer 1996, 29, 31–44. [Google Scholar] [CrossRef]
- Uusitalo, L. Advantages and challenges of Bayesian networks in environmental modelling. Ecol. Model. 2007, 203, 312–318. [Google Scholar] [CrossRef]
- Hu, Y.; Zhang, X.; Ngai, E.W.T.; Cai, R.; Liu, M. Software project risk analysis using Bayesian networks with causality constraints. Decis. Support Syst. 2013, 56, 439–449. [Google Scholar] [CrossRef]
- Yet, B.; Constantinou, A.; Fenton, N.; Neil, M.; Luedeling, E.; Shepherd, K. A Bayesian network framework for project cost, benefit and risk analysis with an agricultural development case study. Exp. Syst. Appl. 2016, 60, 141–155. [Google Scholar] [CrossRef]
- Hu, Y.; Huang, J.; Chen, J.; Liu, M.; Xie, K. Software Project Risk Management Modeling with Neural Network and Support Vector Machine Approaches. In Proceedings of the Third International Conference on Natural Computation, Haikou, China, 24–27 August 2007; pp. 358–362. [Google Scholar]
- Shepherd, K.; Hubbard, D.; Fenton, N.; Claxton, K.; Luedeling, E.; Leeuw, J. Policy: Development goals should enable decision-making. Nature 2015, 523, 152–154. [Google Scholar] [CrossRef] [PubMed]
- Odimabo, O.O.; Oduoza, C.; Suresh, S. Methodology for Project Risk Assessment of Building Construction Projects Using Bayesian Belief Networks. Int. J. Constr. Eng. Manag. 2017, 6, 221–234. [Google Scholar]
- Vitabile, S.; Farruggia, A.; Pernice, G.; Gaglio, S. Assessing coastal sustainability: A Bayesian approach for modeling and estimating a global index for measuring risk. J. Telecommun. Inf. Technol. 2013, 4, 5–15. [Google Scholar]
- Woodberry, O.; Nicholson, A.E.; Korb, K.B.; Pollino, C.A. Parameterising Bayesian networks. In Proceedings of the 17th Australian Joint Conference on Artificial Intelligence, Cairns, Australia, 4–6 December 2004; pp. 1101–1107. [Google Scholar]
- Pollino, C.A.; Woodberry, O.; Nicholson, A.; Korb, K.; Hart, B.T. Parameterisation and evaluation of a Bayesian network for use in an ecological risk assessment. Environ. Model. Softw. 2007, 22, 1140–1152. [Google Scholar] [CrossRef]
- Wang, X.; Zhu, J.; Ma, F.; Li, C.; Cai, Y.; Yang, Z. Bayesian network-based risk assessment for hazmat transportation on the Middle Route of the South-to-North Water Transfer Project in China. Stoch. Environ. Res. Risk Assess. 2016, 30, 841–857. [Google Scholar] [CrossRef]
- Lee, E.; Park, Y.; Shin, J.G. Large engineering project risk management using a Bayesian belief network. Exp. Syst. Appl. 2009, 36, 5880–5887. [Google Scholar] [CrossRef]
- Cox, L.A. What’s wrong with risk matrices? Risk Anal. 2008, 28, 497–512. [Google Scholar] [PubMed]
- Yousefi, V.; Yakhchali, S.H.; Khanzadi, M.; Mehrabanfar, E.; Šaparauskas, J. Proposing a neural network model to predict time and cost claims in construction projects. J. Civ. Eng. Manag. 2016, 22, 967–978. [Google Scholar] [CrossRef]
- Du-Juan, G.; Pen, G. Constructing interdependent risks network of project portfolio based on bayesian network. In Proceedings of the International Conference on Management Science & Engineering (21th), Helsinki, Finland, 17–19 August 2014. [Google Scholar]
- Cooper, R.; Edgett, S.; Kleinschmidt, E. New product portfolio management: Practices and performance. J. Prod. Innov. Manag. 1999, 16, 333–351. [Google Scholar] [CrossRef]
- Heising, W. The integration of ideation and project portfolio management—A key factor for sustainable success. Int. J. Proj. Manag. 2012, 30, 582–595. [Google Scholar] [CrossRef]
- Cooper, R.; Edgett, S.; Kleinschmidt, E. Portfolio Management: Fundamental for New Product Success; John Wiley & Sons: New York, NY, USA, 2002. [Google Scholar]
- Meskendahl, S. The influence of business strategy on project portfolio management and its success—A conceptual framework. Int. J. Proj. Manag. 2010, 28, 807–817. [Google Scholar] [CrossRef]
- Archer, N.P.; Ghasemzadeh, F. An integrated framework for project portfolio selection. Int. J. Proj. Manag. 1999, 17, 207–216. [Google Scholar] [CrossRef]
- Killen, C.P.; Hunt, R.A.; Kleinschmidt, E.J. Project portfolio management for product innovation. Int. J. Qual. Reliab. Manag. 2008, 25, 24–38. [Google Scholar] [CrossRef]
- Jonas, D. Empowering project portfolio managers: How management involvement impacts project portfolio management performance. Int. J. Proj. Manag. 2010, 28, 818–831. [Google Scholar] [CrossRef]
- Unger, B.N.; Gemünden, H.G.; Aubry, M. The three roles of a project portfolio management office: Their impact on portfolio management execution and success. Int. J. Proj. Manag. 2012, 30, 608–620. [Google Scholar] [CrossRef]
- Fricke, S.E.; Shenhar, A.J. Managing multiple engineering projects in a manufacturing support environment. IEEE Trans. Eng. Manag. 2000, 47, 258–268. [Google Scholar] [CrossRef]
- Beringer, C.; Jonas, D.; Kock, A. Behavior of internal stakeholders in project portfolio management and its impact on success. Int. J. Proj. Manag. 2013, 31, 830–846. [Google Scholar] [CrossRef]
- Martinsuo, M.; Lehtonen, P. Role of single-project management in achieving portfolio management efficiency. Int. J. Proj. Manag. 2007, 25, 56–65. [Google Scholar] [CrossRef]
- Lawshe, C.H. A quantitative approach to content validity. Pers. Psychol. 1975, 28, 563–575. [Google Scholar] [CrossRef]
- Fang, C.; Marle, F. A simulation-based risk network model for decision support in project risk management. Decis. Support Syst. 2012, 52, 635–644. [Google Scholar] [CrossRef]
- GeNIe. Version 2.0; A Decision Systems Laboratory, School of Information Sciences, University of Pittsburgh: Pittsburgh, PA, USA, 2015.
Figure 1.
Project portfolio total risk content.
Figure 1.
Project portfolio total risk content.
Figure 2.
An independent project risk in portfolio risk Bayesian network.
Figure 2.
An independent project risk in portfolio risk Bayesian network.
Figure 3.
Projects with resource interdependency in portfolio risk Bayesian network.
Figure 3.
Projects with resource interdependency in portfolio risk Bayesian network.
Figure 4.
Projects with outcome dependency in portfolio risk Bayesian network.
Figure 4.
Projects with outcome dependency in portfolio risk Bayesian network.
Figure 5.
Projects with value interdependency in portfolio risk Bayesian network.
Figure 5.
Projects with value interdependency in portfolio risk Bayesian network.
Figure 6.
Portfolio-level risks in a Bayesian network.
Figure 6.
Portfolio-level risks in a Bayesian network.
Figure 7.
Example of a Bayesian network for portfolio risk analysis.
Figure 7.
Example of a Bayesian network for portfolio risk analysis.
Figure 8.
Conditional probability table (CPT) of PLR8.
Figure 8.
Conditional probability table (CPT) of PLR8.
Figure 9.
Portfolio Risk analysis procedure.
Figure 9.
Portfolio Risk analysis procedure.
Figure 10.
Bayesian network for the analyzed portfolio.
Figure 10.
Bayesian network for the analyzed portfolio.
Figure 11.
The portfolio risk analysis result.
Figure 11.
The portfolio risk analysis result.
Figure 12.
The portfolio risk analysis result after adding the fourth independent project.
Figure 12.
The portfolio risk analysis result after adding the fourth independent project.
Table 1.
Project interdependencies.
Table 1.
Project interdependencies.
| Interdependency | Description | References |
|---|
| Value interdependency | Total value of two projects being greater or less than the sum of their individual values (synergism or antagonism) | Gear, Cowie [26]; Killen, Kjaer [27]; Schmidt [28]; Bhattacharyya et al. [29] |
| Resource interdependency | Sharing resources among projects | Killen, Kjaer [27]; Schmidt [28]; Bhattacharyya et al. [29]; Verma, Sinha [30] |
| Technology interdependency | Using a specific technology in several projects | Gear, Cowie [26]; Bhattacharyya et al. [29]; Verma, Sinha [30] |
| Accomplishment dependency | Increase in project A’s probability of success as a result of undertaking project B | Gear, Cowie [26]; Schmidt [28] |
| Outcome dependency | Using the end result, knowledge or capabilities gained from project B, in project A | Gear, Cowie [26]; Killen, Kjaer [27] |
Table 2.
Portfolio management objectives.
Table 2.
Portfolio management objectives.
| Portfolio Management Objective | Description | References |
|---|
| Value maximization | To achieve the average success of single projects in terms of economic objective. | Heising [51]; Cooper et al. [52]; Project Management Institute [1] |
| To achieve the average success of single projects in time, cost, quality and customer satisfaction objectives. | Meskendahl [53] |
| To use the cross-project synergies in the portfolio. | Meskendahl [53] |
| Strategic alignment | To align portfolio projects with organizational strategy. | Cooper et al. [52]; Heising [51]; Project Management Institute [1] |
| Balance | To balance the constant use of resources during project implementation and the constant generation of cash flow. | Heising [51] |
| To balance high risk projects and low risk ones. | Archer, Ghasemzadeh [54]; Cooper et al. [52]; Killen et al. [55]; Jonas [56] |
| To balance large projects and small ones. | Archer, Ghasemzadeh [54] |
| To balance long term projects and short term ones. | Archer, Ghasemzadeh [54]; Cooper et al. [52]; Killen et al. [55] |
| To balance projects of new areas of application and projects of old areas of application. | Jonas [56] |
| To balance the use of new and current technologies in projects. | Cooper et al. [52]; Killen et al. [55] |
| To balance projects across various markets. | Cooper et al. [52]; Killen et al. [55] |
| To balance project types (including new product production, improvement, maintenance and repair, research and development (R&D), cost-cutting, etc.). | Cooper et al. [52] |
| Right number of projects | To balance available resources and resources needed for ongoing projects. | Cooper et al. [52] |
Table 3.
Portfolio success factors.
Table 3.
Portfolio success factors.
| Portfolio Success Factor | Description | References |
|---|
| Cooperation quality | Project managers‘ collaboration for resolving conflicts, and their preparedness to help fellow project managers. | Jonas [56]; Unger et al. [57] |
| Mutual assistance of project teams. | Jonas [56]; Unger et al. [57] |
| Inter-project abilities | Cross-trained staff who can easily switch from project to project. | Fricke, Shenhar [58] |
| Competency | Governance review board’s competency. | Authors |
| Portfolio manager’s competency. | Authors |
| Top manager’s appropriate engagement intensity | Top manager’s non-interference in governance review board’s decisions. | Authors |
| Appropriate pace and frequency of organizational changes | Appropriate pace and frequency of changes in positions, responsibilities, and organizational structure to maintain continuity in work. | Elonen, Artto [3] |
| Stakeholder management | Clarity in stakeholders’ roles and the intensity of their engagement. | Beringer et al. [59] |
| Management of portfolio risk | Managing portfolio risks (uncertain events or conditions that, if they occur, positively or negatively affect portfolio objectives) and their interdependencies. | Teller[4] |
| Information sharing | Sharing information and transparency in information. | Martinsuo, Lehtonen [60]; Killen, Kjaer [27]; Unger et al. [57] |
| Information quality | Information quality and accuracy. | Jonas [56]; Unger et al. [57] |
Table 4.
Portfolio-Level Proposed Risks.
Table 4.
Portfolio-Level Proposed Risks.
| Risk | Description |
|---|
| Portfolio’s imbalance | Imbalance between high-risk projects and low-risk ones. |
| Imbalance between large projects and small ones. |
| Imbalance between long-term projects and short-term ones. |
| Imbalance between projects of new areas of application and projects of old areas of application. |
| Imbalance between the use of new and current technologies in projects. |
| Imbalance in projects of various markets. |
| Imbalance in terms of project types (including new product production, improvement, maintenance and repair, R&D, cost-cutting, etc.). |
| Strategic lack of alignment | Choosing projects that are not aligned with strategic objectives of the organization. |
| Political, social or legislative changes which lead to changing the organizational strategy, and project’s objectives lack of alignment with the new strategy. |
| Governance review board’s reluctance to kill poor projects during their implementation and when they are no longer aligned with organizational strategy. |
| Wrong number of projects | Choosing too many projects for the available resources. |
| Governance review board reluctance to kill off or suspend projects when their required resources are no longer available. |
| Incompetency | Governance review board’s incompetency. |
| Portfolio manager’s incompetency. |
| Top manager’s interference | Top manager’s interference in governance review board’s decisions (which leads to choosing projects whose required resources are not available or that are not aligned with strategic objectives of the organization). |
| Lack of quality in cooperation | Conflict among project managers. |
| Lack of quality in cooperation among project teams. |
| Lack of inter-project abilities | Not having cross-trained staff who can easily switch from project to project |
| Recurrent organizational changes | Recurrent and rapid changes in positions, responsibilities and organizational structure, which hampers continuity in work. |
| Insufficient stakeholder management | Lack of clarity in stakeholders’ roles and the intensity of their engagement. |
| Insufficient portfolio risk management | Insufficient portfolio risk management (which leads to more risk materialization and consequently more unexpected and undesirable events). |
| Lack of sharing and transparency in information | Lack of sharing or transparency in information (which leads to the making of wrong decisions). |
| Lack of quality in information | Inaccuracy and lack of quality in information (which leads to the making of wrong decisions). |
Table 5.
Project Interdependencies Proposed Risks.
Table 5.
Project Interdependencies Proposed Risks.
| Arising From | Risk | Description |
|---|
| Value interdependency | Losing the potential value. | When the total value of two projects is greater than the sum of their individual values, if the success of one of them is at risk, then the potential value of value interdependency may be at risk too. |
| Resource interdependency | Lack of or delay in supply of shared resources. | If two projects share resources, then lack of or delay in supply of shared resources may pose a threat to the success of both projects. |
| Error in resource allocation. | If two projects share resources, then error in resource allocation may be a threat to the success of both projects. |
| Conflict between project managers. | If two projects share resources, then conflict between project managers may present a threat to success of both projects. |
| Accomplishment dependency | Cancellation of project B. | When the probability of project A’s success increases as a result of undertaking project B, if project B is cancelled, then the success of project A may be at risk. |
| Outcome dependency | Failure of project B. | When project A is dependent on the end result, knowledge or capability gained through project B, if project B’s success is at risk, then the project A’s success may be at risk too. |
Table 6.
Portfolio proposed valid risks.
Table 6.
Portfolio proposed valid risks.
| Abbr. | Portfolio-Level Risk | CVR |
|---|
| PLR1 | Choosing projects that are not aligned with strategic objectives of the organization. | 0.94 |
| PLR2 | Lack of sharing or transparency in information. |
| PLR3 | Insufficient portfolio risk management. |
| PLR4 | Portfolio manager’s incompetency. |
| PLR5 | Portfolio’s imbalance in terms of high-risk projects versus low risk ones. | 0.88 |
| PLR6 | Political, social or legislative changes which leads to changing the organizational strategy, and project’s objectives lack of alignment with the new strategy. | 0.82 |
| PLR7 | Top manager’s interference in governance review board’s decisions. |
| PLR8 | Choosing too many projects for the available resources. | 0.77 |
| PLR9 | Inaccuracy and lack of quality in information. |
| PLR10 | Portfolio’s imbalance between long-term projects and short-term ones. | 0.71 |
| PLR11 | Governance review board’s incompetency. | 0.60 |
| PLR12 | Frequent changes in roles, responsibilities and organizational structure. | 0.54 |
| PLR13 | Lack of clarity in stakeholders’ roles and the intensity of their engagement. |
| PLR14 | Governance review board reluctance to kill poor projects during their implementation, when they are no longer aligned with business strategy. | 0.48 |
| PLR15 | Governance review board’s reluctance to kill or suspend projects when their required resources are no longer available. |
| PLR16 | Portfolio’s imbalance across various markets. | 0.42 |
| PLR17 | Portfolio’s imbalance in terms of project types. |
Table 7.
Project interdependencies proposed valid risks.
Table 7.
Project interdependencies proposed valid risks.
| Arising From | Project Interdependency Risk | CVR |
|---|
| Resource interdependency | Lack of or delay in supply of shared resources. | 1 |
| Resource interdependency | Error in resource allocation. | 0.88 |
| Outcome dependency | Failure of project B (see Table 4). | 0.71 |
| Value interdependency | Losing the potential value. | 0.65 |
| Resource interdependency | Conflict between project managers. | 0.60 |
Table 8.
CPT of node x.
| i | High | Low |
|---|
| n | High | Low | High | Low |
|---|
| High | P(x = HIGH|i = HIGH, n = HIGH) | P(x = HIGH|i = HIGH, n = LOW) | P(x = HIGH|i = LOW, n = HIGH) | P(x = HIGH|i = LOW, n = LOW) |
| Low | P(x = LOW|i = HIGH, n = HIGH) | P(x = LOW|i = HIGH, n = LOW) | P(x = LOW|i = LOW, n = HIGH) | P(x = LOW|i = LOW, n = LOW) |
Table 9.
CPT of node x, using the noisy OR-gate model (1)
Table 9.
CPT of node x, using the noisy OR-gate model (1)
| i | High | Low |
|---|
| n | High | Low | High | Low |
|---|
| High | 1 − qi qn | 1 − qi | 1 − qn | 0 |
| Low | qiqn | qi | qn | 1 |
Table 10.
CPT of node x, using the noisy OR-gate model (2).
Table 10.
CPT of node x, using the noisy OR-gate model (2).
| i | High | Low |
|---|
| n | High | Low | High | Low |
|---|
| High | 1 − [(1 − P(x = HIGH|i = HIGH))*(1 − P(x = HIGH|n = HIGH))] | P(x = HIGH|i = HIGH) | P(x = HIGH|n = HIGH) | 0 |
| Low | (1 − P(x = HIGH|i = HIGH))*(1 − P(x = HIGH|n = HIGH)) | 1 − P(x = HIGH|i = HIGH) | 1 − P(x = HIGH|n = HIGH) | 1 |
© 2018 by the authors. Licensee MDPI, Basel, Switzerland. This article is an open access article distributed under the terms and conditions of the Creative Commons Attribution (CC BY) license (http://creativecommons.org/licenses/by/4.0/).

 ,
, 


