Article

Effects of Impervious Surface on the Spatial Distribution of Urban Waterlogging Risk Spots at Multiple Scales in Guangzhou, South China

1
Guangzhou Institute of Geochemistry, Chinese Academy of Sciences, Guangzhou 510640, China
2
University of Chinese Academy of Sciences, Beijing 100049, China
3
Guangdong Key Laboratory of Integrated Agro-environmental Pollution Control and Management, Guangdong Institute of Eco-environmental Science and Technology, Guangzhou, Guangdong 510650, China
4
School of Geographical Sciences, Guangzhou University, Guangzhou 510006, China
*
Authors to whom correspondence should be addressed.
Sustainability 2018, 10(5), 1589; https://doi.org/10.3390/su10051589
Submission received: 17 April 2018 / Revised: 10 May 2018 / Accepted: 11 May 2018 / Published: 16 May 2018

Abstract

:
An impervious surface is considered one of main factors affecting urban waterlogging. Previous studies found that spatial pattern (composition and configuration) of impervious surfaces affected urban waterlogging. However, their relative importance remains unknown, and the scale-effect of the spatial pattern on urban waterlogging has been ignored. To move forward, our research studied the relationship between spatial patterns on the impervious surface and its subcategories (building and pavement) on urban waterlogging risk spots using Pearson correlation, partial redundancy analysis and performed at three grid scales (1 km × 1 km, 3 km × 3 km, 5 km × 5 km) and the catchment scale based on different spatial resolution land cover maps (2 m, 10 m and 30 m). We identified positively-correlated metrics with urban waterlogging risk spots, such as the composition of impervious surface (i.e., total impervious surface, building, pavement) and the aggregation metric of the total impervious surface at most scales, as well as two negatively correlated metrics (i.e., proximity metric of building, fragmentation metric of total impervious surface). Furthermore, the total variance of urban waterlogging risk spots explained by the spatial pattern of the total impervious surface and its subcategories increased with studied grid and catchment scales while decreasing from a fine to a coarse resolution. The relative contribution of the impervious surface composition and configuration to the variation of urban waterlogging risk spots varied across scales and among impervious surface types. The composition contributed more than the configuration did for the total impervious surface at both grid and catchment scales. Similar to total impervious surface, the composition of buildings was more important than its configuration was at all the grid scales, while the configuration of buildings was more important at the catchment scale. Contrary to the total impervious surface, the configuration of pavement at both the grid and catchment scales mattered more than their compositions did. Furthermore, the composition of the building was more important than that of pavement, but its configuration mattered less. Our study could provide a multi-scale landscape perspective with detailed suggestions for controlling the area of impervious surface and optimizing its spatial configuration in urban waterlogging risk mitigation and urban planning.

1. Introduction

Urban waterlogging, a representative type of urban flooding [1,2], refers to the phenomenon in which a rainstorm or a short-term period of heavy rain surpasses the capacity of the urban drainage system, which results in a waterlogging disaster [3]. Due to global climate change and rapid urbanization, urban waterlogging has become a serious problem in urban areas worldwide [4,5]. This has resulted in socio-environmental problems such as property damage, traffic paralysis, water pollution and economic losses [6,7,8], especially in rapidly developing countries [3]. In China, approximately 62% of Chinese cities suffered from urban waterlogging especially in larger cities such as Beijing, Shanghai, Guangzhou and Wuhan [9]. Resolving urban waterlogging has been an urgent problem for the government, urban storm water management and urban planning agencies.
There have been many urban waterlogging mitigation measures worldwide such as the Low Impact Development in USA, Water Sensitive Urban Design in Australia and Sponge City in China [10,11,12]. However, the influence mechanisms behind urban waterlogging, as a premise of taking actions, have not yet been fully understood [13,14]. For example, although both the composition and configuration (i.e., spatial pattern) of impervious surfaces were found to affect urban waterlogging [15], their relative importance remains unknown, and the scale-effect of the influence is also unknown.
There are many factors influencing urban waterlogging such as topography [16,17], land subsidence [18,19], irrational land use planning [20,21,22] and additional features. Among these factors, the increase in impervious surface area, extreme rainstorms and poor drainage infrastructure were universally acknowledged as the three primary driving forces of urban waterlogging [23]. Among these factors, the impervious surface was easily obtained by remote sensing images and studied extensively. For example, many studies have been conducted to explore the relationship between impervious surface area and hydrological response (i.e., runoff and peak discharge), which are closely associated with urban waterlogging from the local scale to the watershed scale [11,24]. A few studies explored the relationship between the impervious surface area and the spatial pattern of urban waterlogging risk spots in urban regions [25,26]. Previous studies found that the composition of the impervious surface (the impervious surface area) reduced the total infiltration of water into the surface and, thereby, increased the surface runoff and peak discharge, which ultimately raised the associated risk of urban flooding [27,28]. In addition, several studies showed that the spatial configuration of the impervious surface influenced surface runoff and the potential urban flood risk, as well [27,29,30]. However, most previous studies primarily highlighted the importance of the location of the impervious surface (e.g., upstream, midstream or downstream) in an urban watershed or catchment to define the influence of the spatial configuration of the impervious surface. This may not be sufficient considering the high spatial heterogeneity in the urban context [31,32].
Landscape metrics measured by remote sensing images [33] (a basic tool in landscape ecology to characterize the composition and configuration of land use [34,35]) could be a new way to measure the spatial pattern (i.e., composition and configuration) of impervious surfaces to better understand the variability in hydrological responses to urbanization [36] and analyze urban waterlogging risk spots [15]. Currently, it is still unknown whether the composition or the configuration plays a more significant role in influencing waterlogging. Furthermore, the impacts of the composition and configuration of impervious surfaces on urban flooding are also scale dependent [37,38]. For example, Poelmans et al. [37] found that the relative importance of the area and spatial configuration of the impervious surface to potential urban flood risk varied with the studied scales. However, the majority of previous studies focused on a single spatial scale, while a multi-scale study is needed for a better understanding.
To move forward, this study took Guangzhou, South China, which is a city experiencing rapid urbanization and extensive urban waterlogging, as an example to explore the impact of the spatial pattern of the impervious surfaces and its subcategories (building and pavement) on urban waterlogging risk spots at multiple scales using Pearson correlation analysis and partial redundancy analysis. Specifically, we propose two research questions:
(1)
Does the composition or the configuration of the impervious surface affect urban waterlogging risk spots more?
(2)
How does the impervious surface influence urban waterlogging risk spots at multiple scales?

2. Materials and Methods
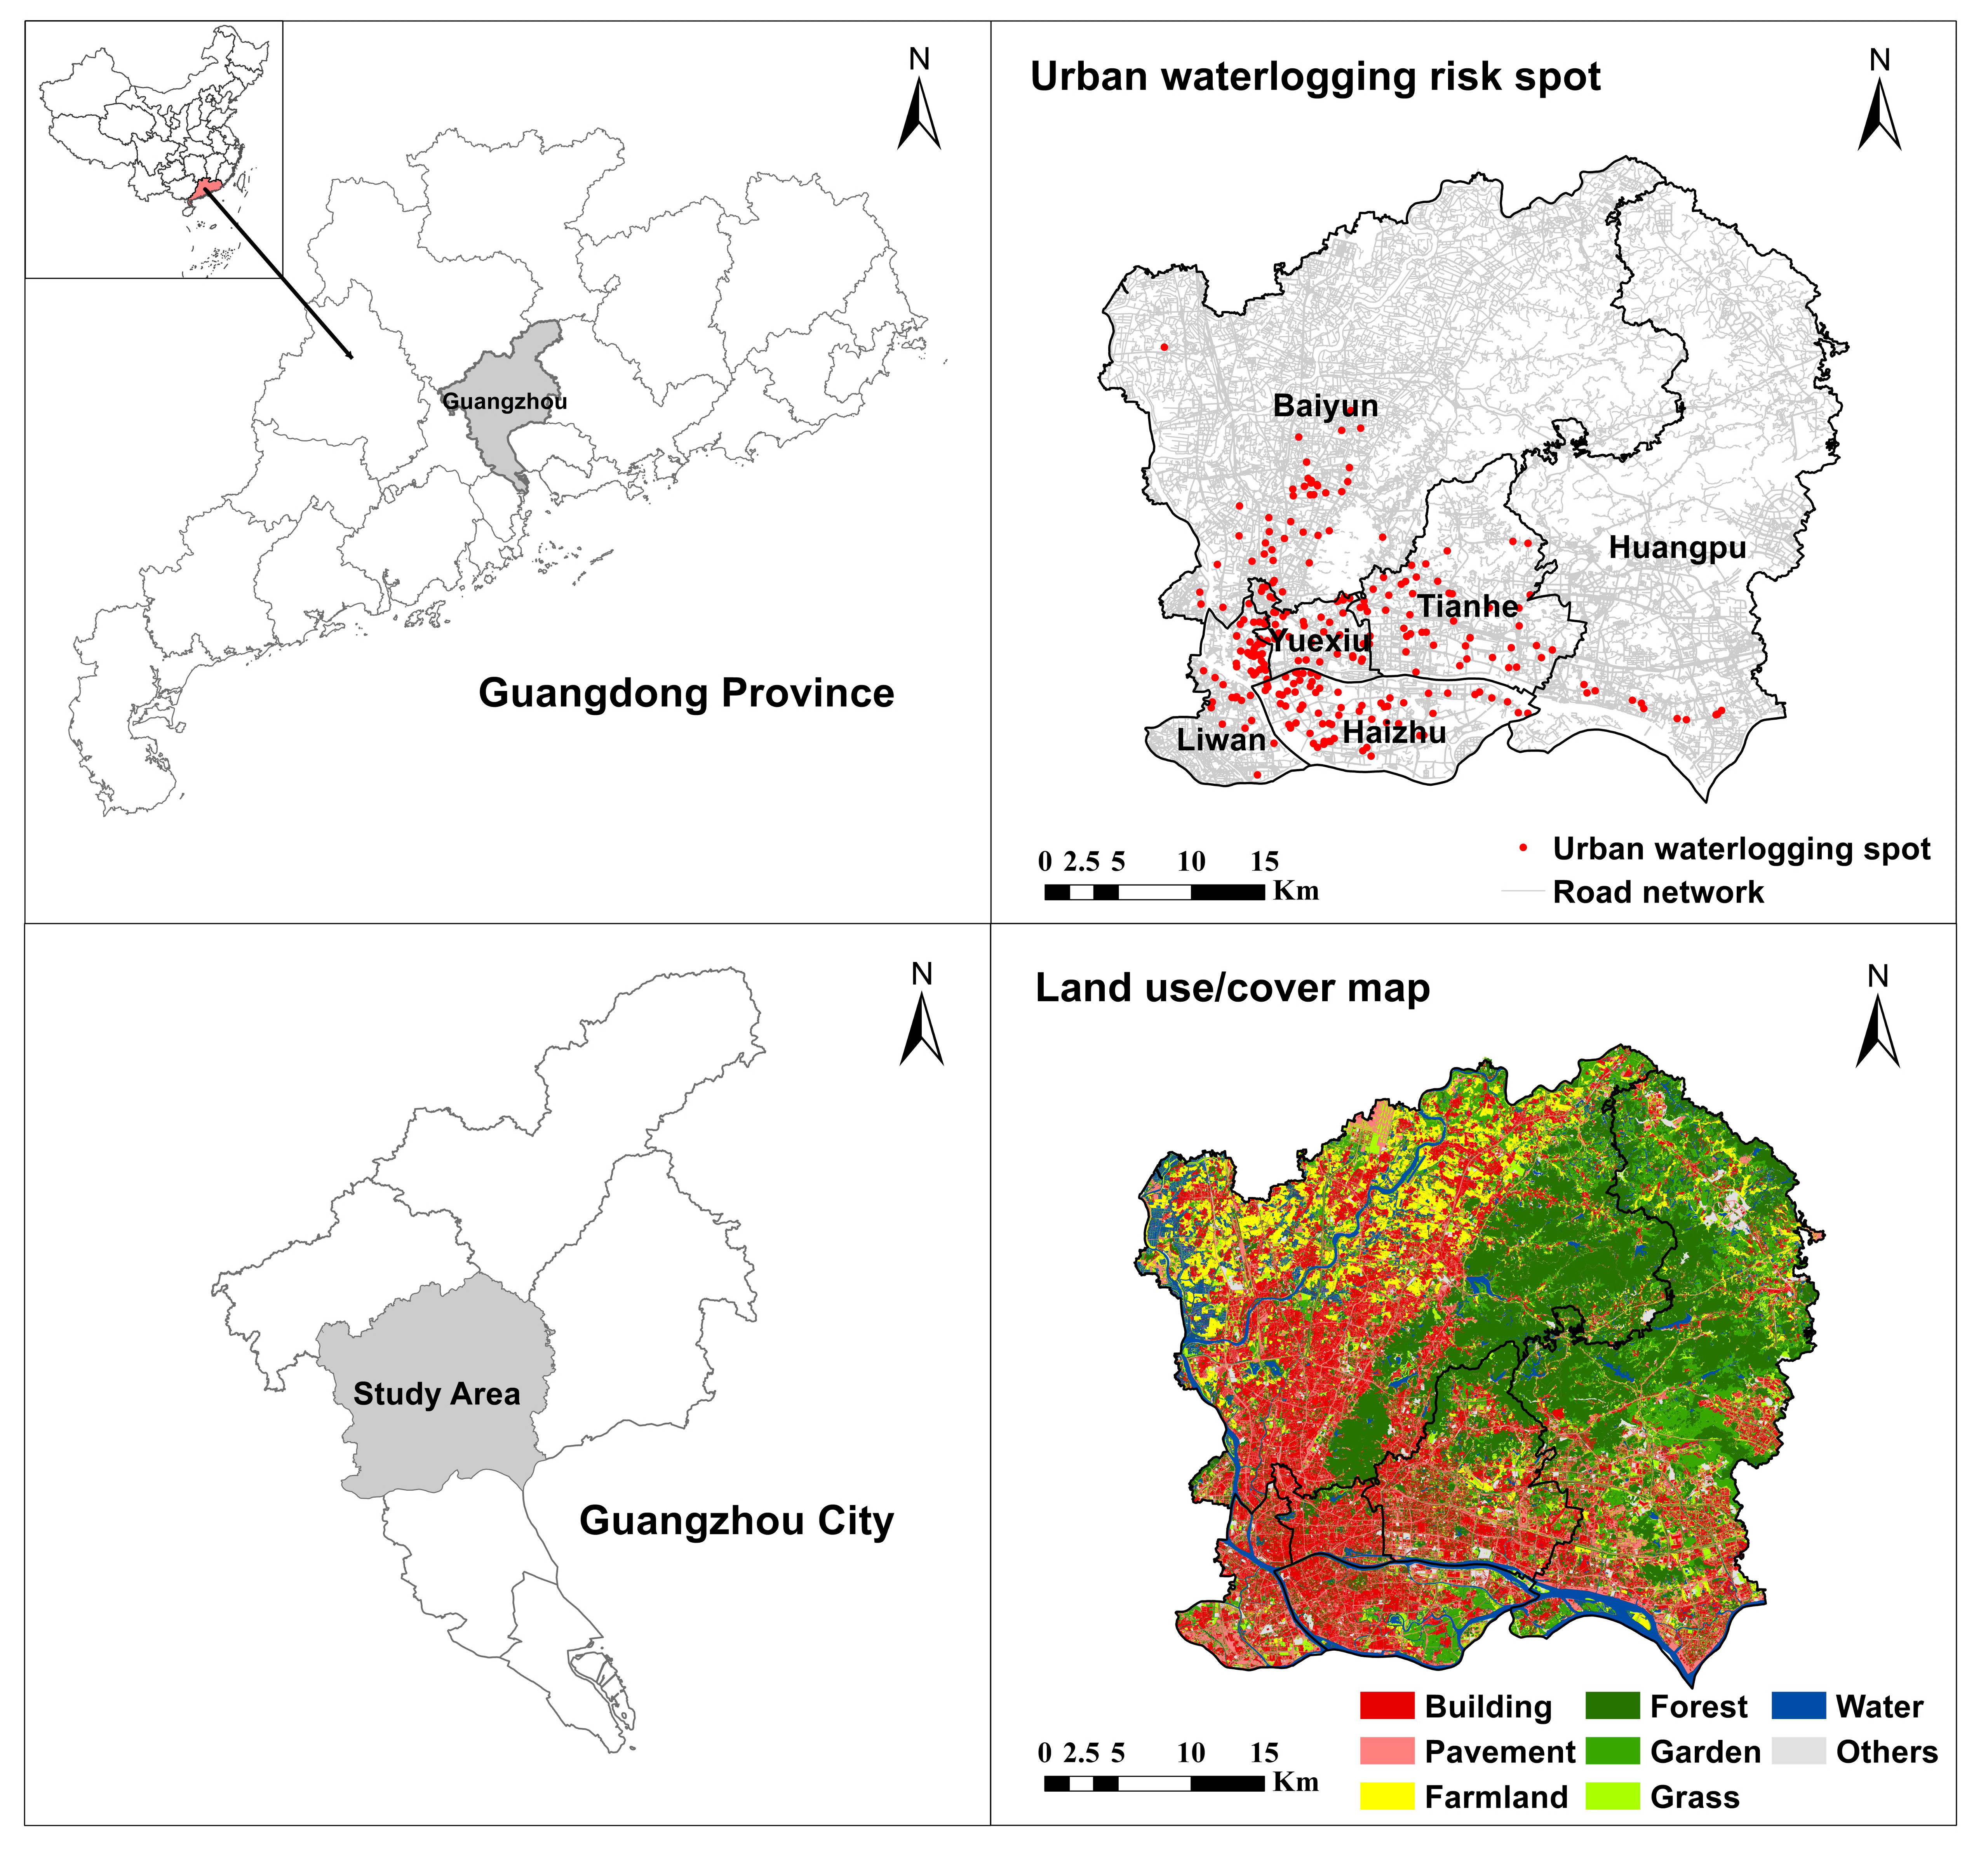
2.1. Study Area

Guangzhou, the capital of the Guangdong province and the central urban area of Guangdong-Hong Kong-Macao Greater Bay Area, is situated in Southern China (22°26′–23°56′ N and 112°57′–114°03′ E) and covers an area of approximately 7434 km2 (see Figure 1). This city is dominated by a sub-tropical monsoon with an average annual temperature of 21.9 °C, an annual precipitation of 1164~1899 mm and an annual average of 149 rainy days. When China instituted a reform and open policy in 1978, Guangzhou began experiencing rapid urbanization. As reported by Wu et al. [39], the urban area in Guangzhou has increased from 395.27 km2 in 1979 to 1907.52 km2 in 2013. Accordingly, urban waterlogging has become an increasingly significant issue, particularly in the central urban area [26].

2.2. Data and Methods

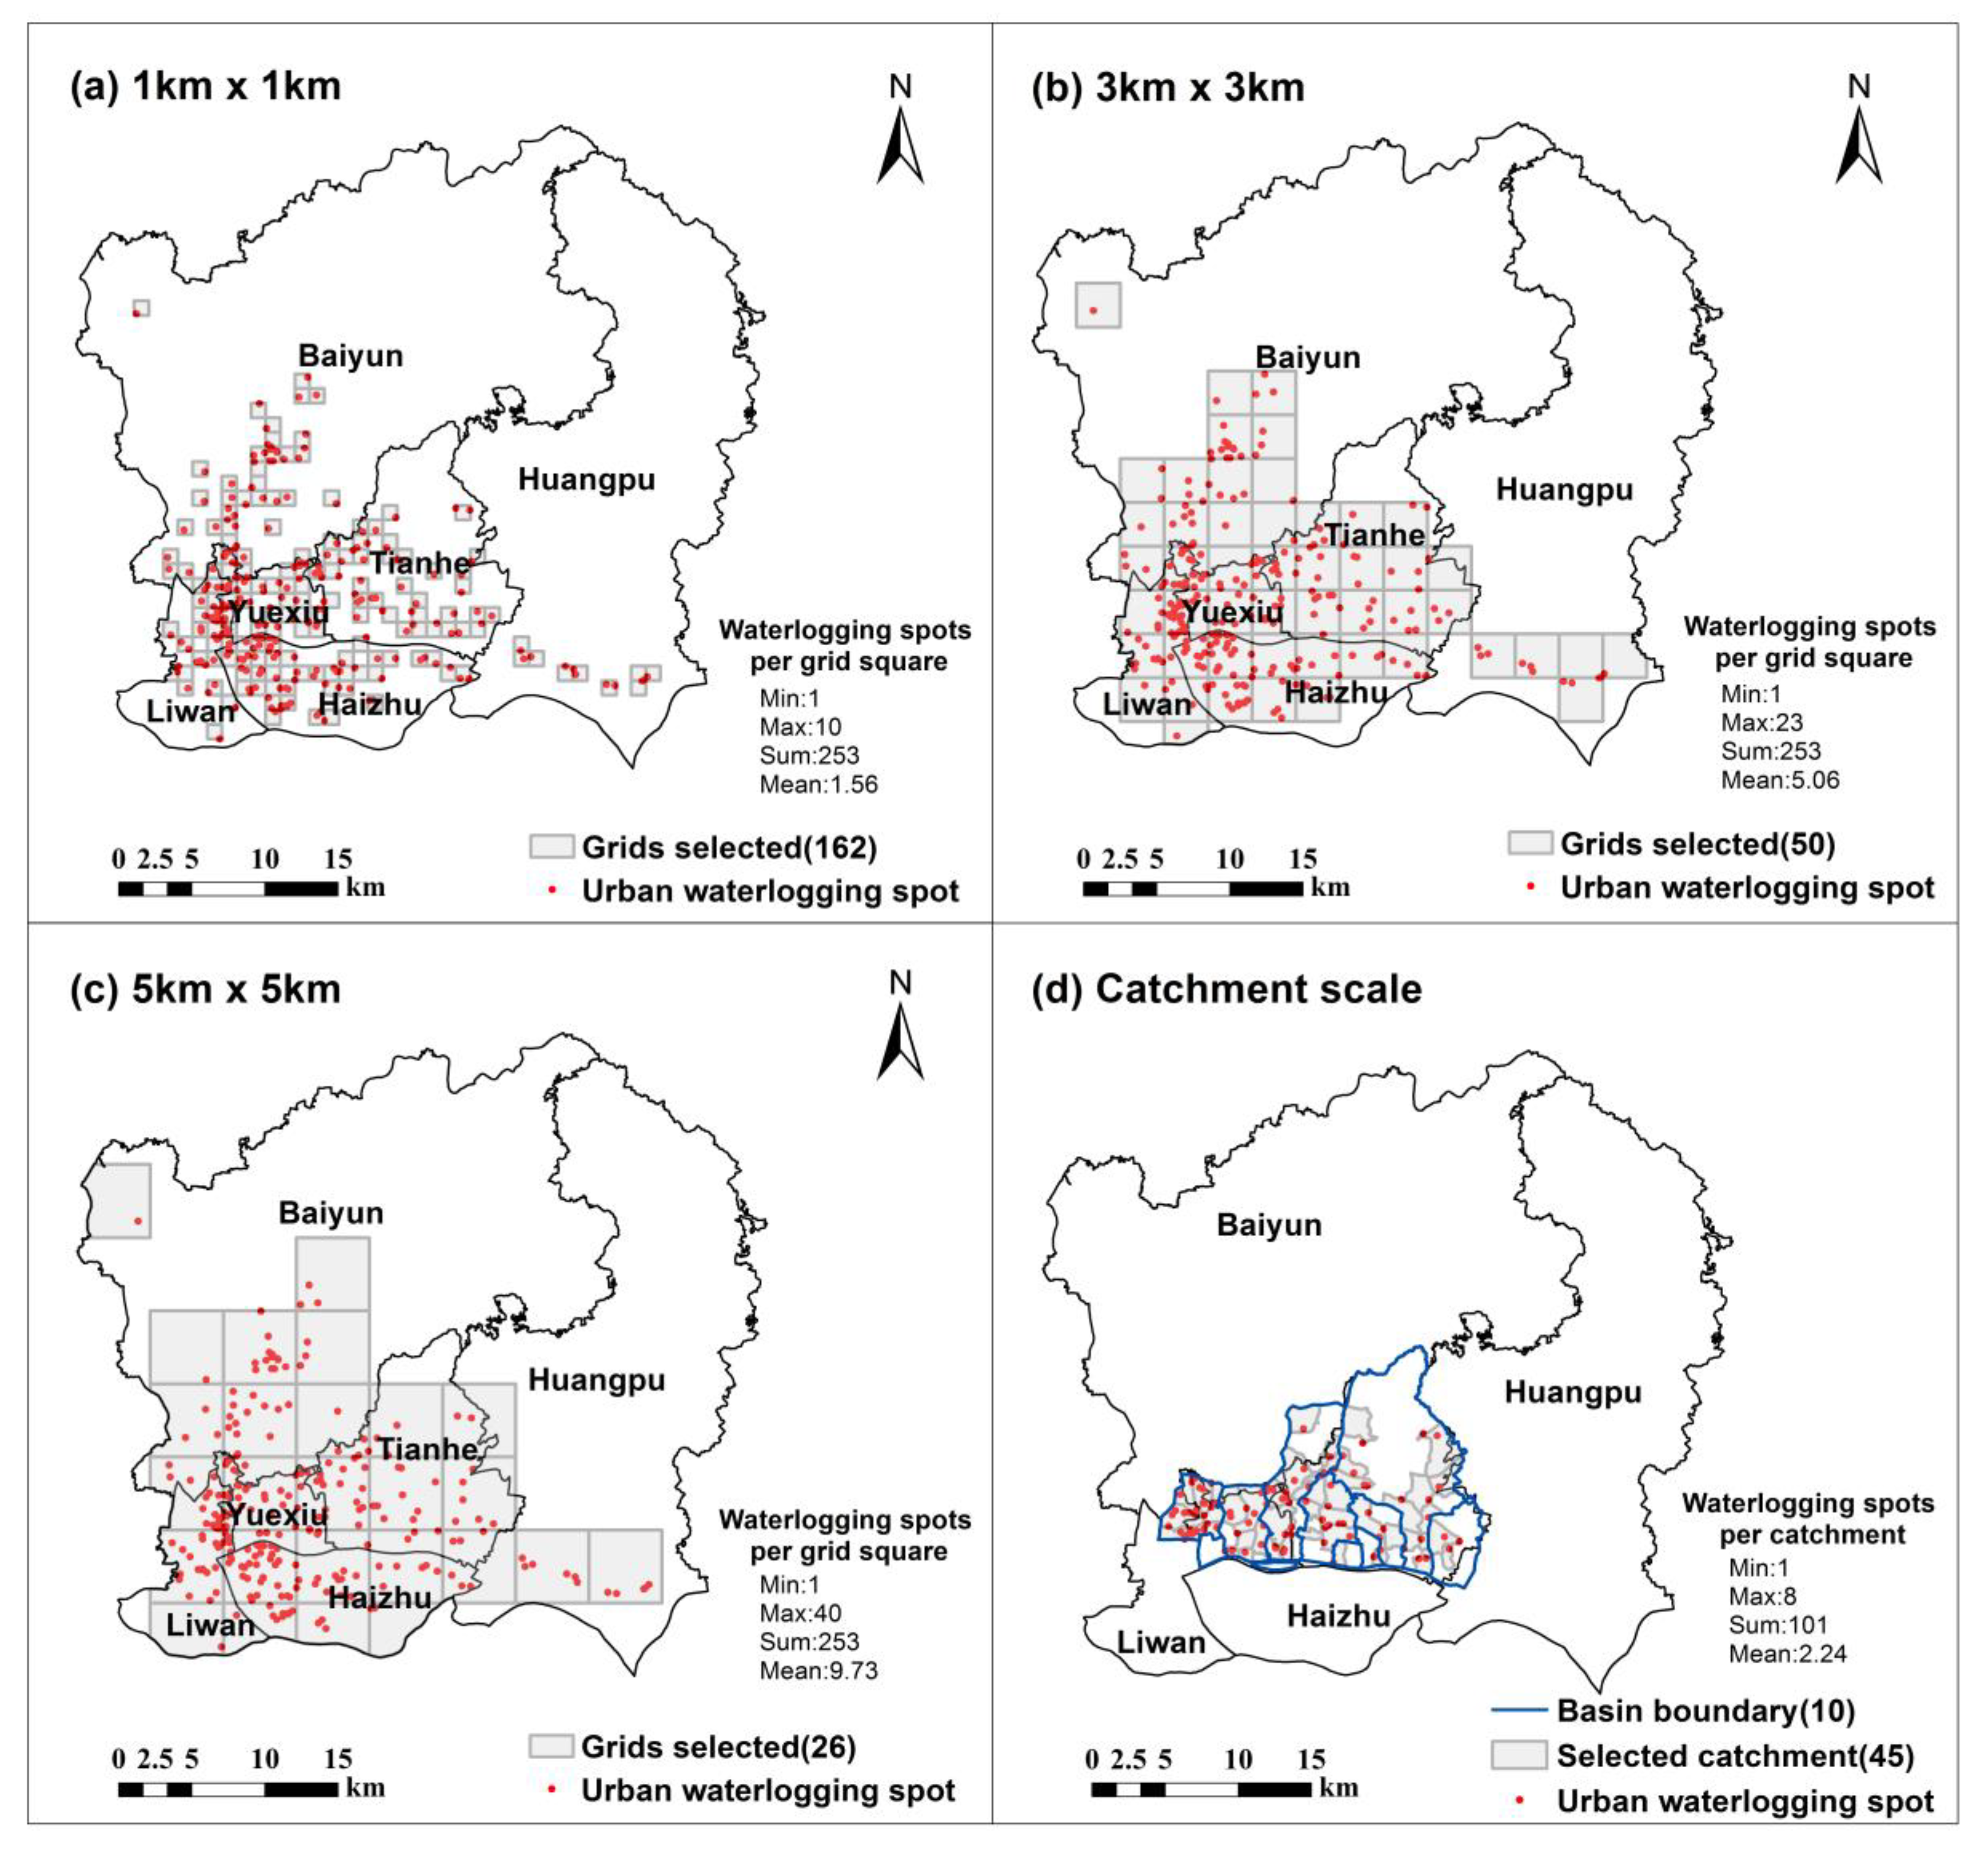
2.2.1. Urban Waterlogging Risk Spots and Scale Selection

The term “waterlogging” used in our study was used in previous studies [15,40], which was also called “pluvial flooding” in a few literature works [41,42]. To fully quantify waterlogging, at least three aspects were included, i.e., waterlogging spot location and inundation range and depth. The location of the waterlogging spot was opened to the public by the municipal water department and thus was easily acquired in our study. However, due to data availability, the inundation range and depth were not considered in our study.
Based on the rough locations of urban waterlogging spots as the municipal water department reported (e.g., the intersections of two roads or a part of road), we firstly mapped the urban waterlogging spot distribution in Google map. Note that, for the urban waterlogging inundation spots reported as a part of the road or the extent of one, we simplified by using their geometric centers as the urban waterlogging spots. We secondly downloaded the Google map with the coordinates and points and lastly calibrated them with the high resolution land use maps using the tool “Georeferencing” in ARCGIS 10.2 (Environmental Systems Research Institute, Redlands, CA, USA). The calibration error of less than one pixel was recognized as reasonable. At last, data for urban waterlogging risk spots (see Figure 1) from 2009–2013 were derived from the Bureau of Water Resources of the Guangzhou Municipality, which comprises a total of 253 urban waterlogging spots with an inundation depth of more than 15 cm. Considering that the attributes of land surface (i.e., land cover, substrate materials, etc.) surrounding the locations probably influenced the water interception or infiltration, we randomly selected 24 waterlogging points to do the site survey about the main substrate materials and land surface composition in their 100-m buffer radiuses (Table A1 and Figure A1 in the Appendix A). Table A1 shows that the main substrate materials of waterlogging points in their buffer radiuses were nearly completely impervious with a few permeable surfaces.
Scale refers to the grain and extent in the temporal and spatial dimension from the landscape ecology perspective [43]. In our study, the grain scale was considered. We chose two kinds of grain scales, which included the squared grid scale and catchment scale, called a hydrological unit (see Figure 2). We divided the study area into a series of regular squares of different sizes to represent multiple grain scales (i.e., 1 km × 1 km, 3 km × 3 km, 5 km × 5 km) using the following criteria: the mean nearest distance of urban waterlogging risk spots was 715 m. Due to data availability, we obtained 87 catchments in 10 basins located in the Yuexiu and Tianhe districts of Guangzhou (see Figure 2) derived from the Guangzhou Urban Planning and Surveying Research Institute.

2.2.2. Measurement of the Spatial Pattern of the Impervious Surface

A land use and cover map (see Figure 1) was acquired from the Guangzhou Land Resources and Planning Commission, which was digitized based on the 1:2000 aerial remote sensing images with orthogonal projection (spatial resolution 0.1 m) and 1:500 terrain data obtained from the field survey of 2013. The land cover and land use map is a product of the geographical survey project by the National Administration of Survey, Mapping and Geoinformation of China started in 2012. The original classification system contains 10 land cover types and 46 sub-types. Forty-six classes were reclassified into 10 land cover types of forest, farmland, grassland, building, road, non-building structure, water and others. Depending on the criterion of the impervious surface [43,44,45], the total impervious surface in our study contained building, road and non-building structure (mainly referring to squares, car parks and other paved surfaces). The total impervious surface was further subdivided into two subcategories of building and pavement (road and non-building structure), which considered the different influences of their hydrological responses [46,47].
Many landscape metrics have been proposed to measure the spatial pattern (i.e., area and configuration) of impervious surfaces [48,49,50]. In our study, eight landscape metrics that were used in previous studies and had a close association with hydrological responses [15,36,51,52,53] were selected. The composition metrics include the percent of total impervious surface (%imp), building (%build), pavement (%pave) and the class area (Area_imp, Area_build, Area_pave). Because %imp, %build and %pave had a strong collinearity with their area metrics at three grid scales, they were not further analyzed. The configuration metrics include Patch Density (PD), Edge Density (ED), Landscape Shape Index (LSI), Mean Euclidean Nearest Neighbor Distance (ENN_MN), the Patch Cohesion Index (Cohesion) and the Aggregation Index (AI) [53]. All of the landscape metrics (see Table 1) were calculated using Fragstats 4.1 at the class level [54]. To facilitate our results being extrapolated to other sites and for comparative purposes with other previous studies [43,55,56,57], we chose three resolutions of maps (i.e., 2 m, 10 m and 30 m) for analysis. The vector format of the land use and cover map was converted to the raster format with three resolutions for further landscape pattern analysis. Considering the loss of the details of buildings and pavement from a fine to a coarse resolution, we did not model their influences on waterlogging risk at 10-m and 30-m grid scales and the catchment scale.

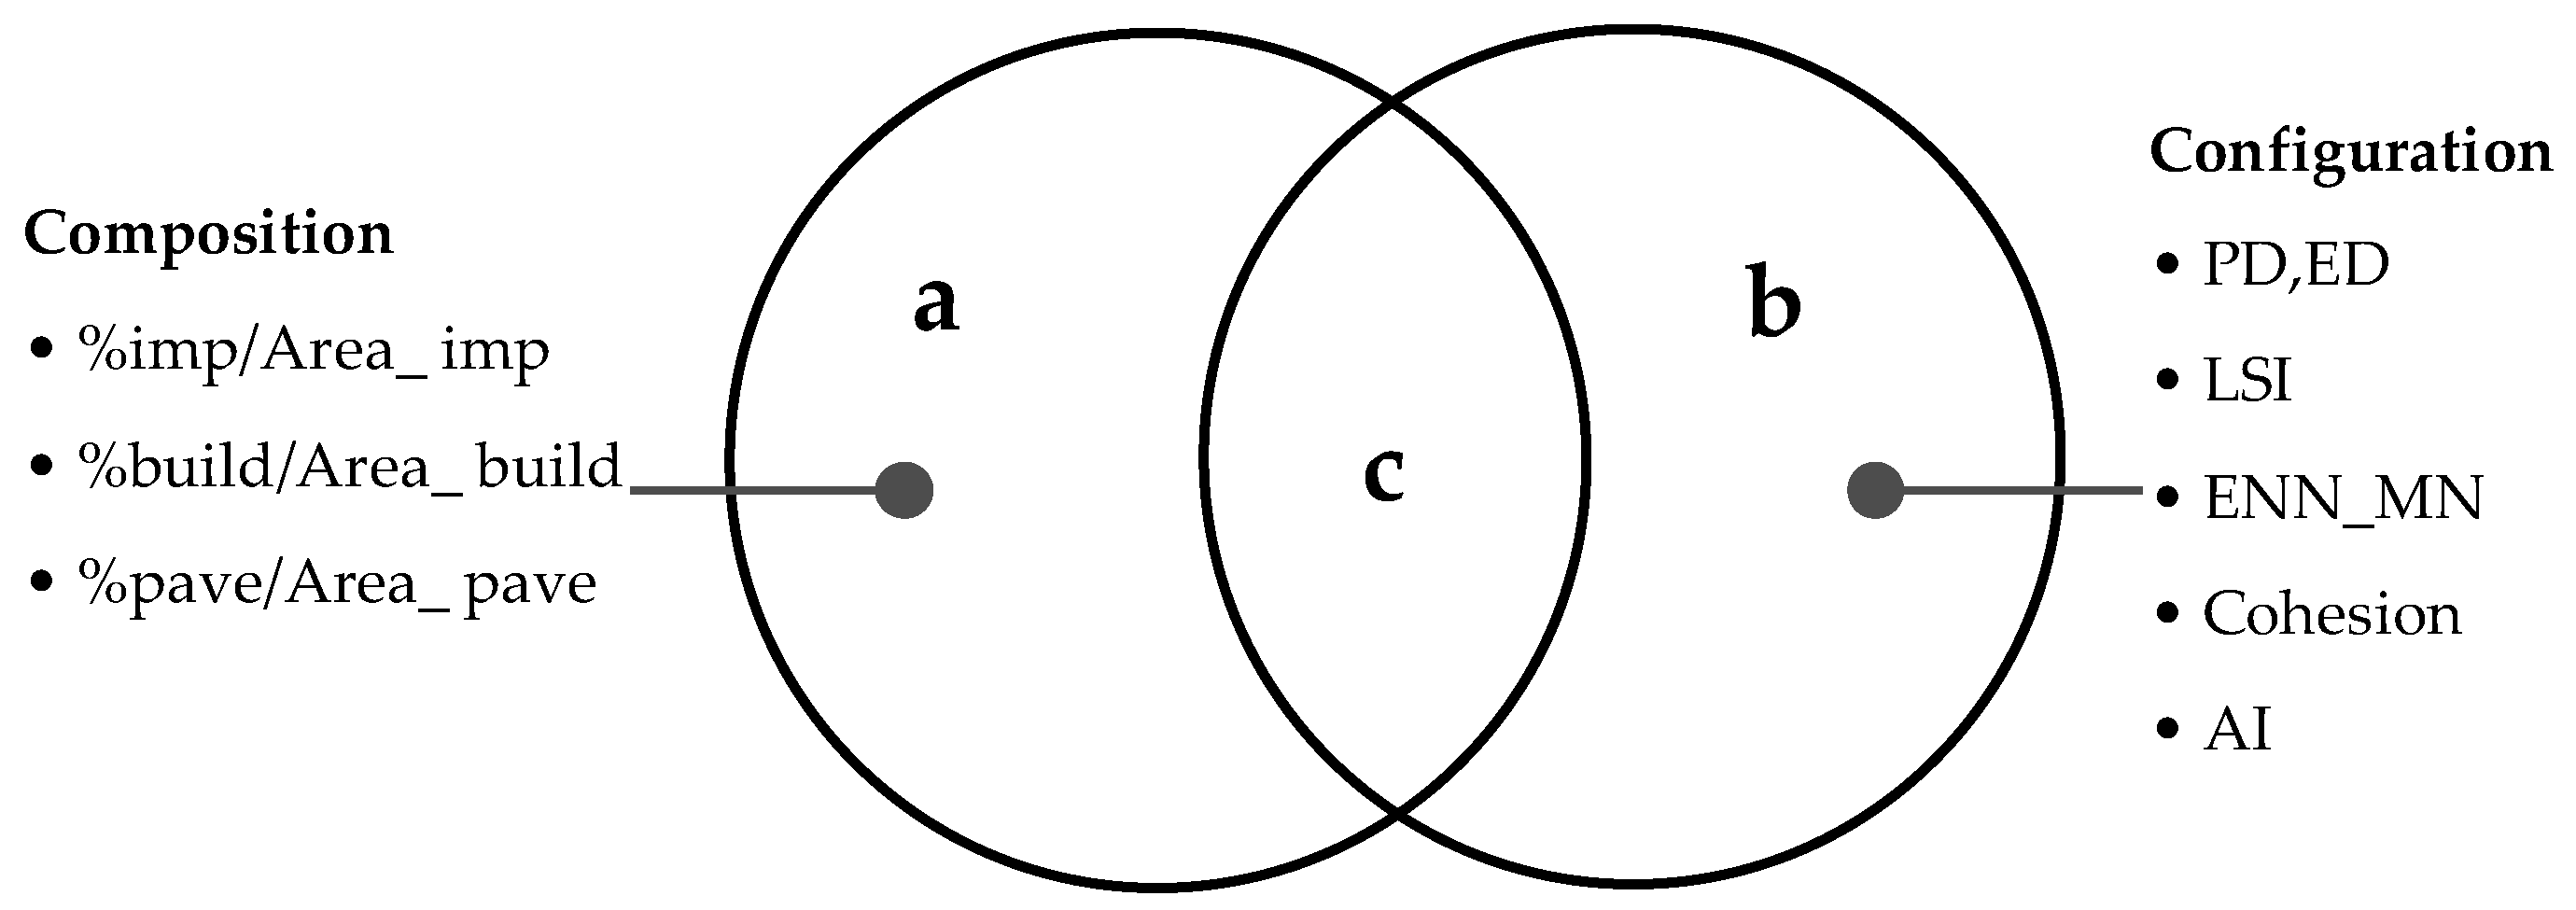
2.2.3. Statistical Analyses

Using the sum number of urban waterlogging risk spots for each grid square or catchment as the dependent factor and the landscape metrics calculated on the same grid square or catchment as the independent factors, we quantified the effects of the spatial pattern of the impervious surface on urban waterlogging risk spots through Pearson correlation by SPSS 18.0 and partial redundancy analysis by CANOCO 5.0. Partial redundancy analysis, a constrained ordination method, has been widely used in the field of ecology and vegetation science [58,59]. It is a robust means of exploring the relative importance of two or three groups of explanatory variables (independent variables). The working principle behind partial redundancy analysis is variation partitioning [60,61,62,63]. In this procedure, it usually does not quantify the effects of just two explanatory variables. Rather, it attempts to tease apart the effects (and their overlap) of two or more groups of environmental variables representing some distinct, ecologically-interpretable phenomena. For example, in our study, we have two groups of explanatory variables (X1, composition, and X2, configuration), and each group contains several variables. The variation in urban waterlogging risk spots was partitioned into three variances individually (i.e., a, b and c). Fractions a, b and c represent the partial effect from Group X1, Group X2 and the shared effect of both two groups, respectively, which could be calculated by partial constrained ordinations (see Figure 3). Specifically, Fraction a is calculated by the analysis where the variables from X1 are used as environmental variables and X2 as covariables. Similarly, Fraction b is calculated by the analysis where X2 acts as environmental variables and X1 as covariables. Fraction c is calculated by subtracting the sum of a and b from the amount of variability explained by an ordination model with the variables from both X1 and X2 acting as explanatory variables.
In this study, we used five partial redundancy analysis models: (1) composition of impervious surface (%imp/Area_imp) + configuration of impervious surface; (2) composition of building (i.e., %build/Area_build) + configuration of building; (3) composition of building + configuration of pavement; (4) composition of pavement (%pave/Area_pave) + configuration of building; and (5) composition of pavement + configuration of pavement. The first model was performed in order to answer the first research question. This question centers on the relative importance of the composition and the configuration of the impervious surface for urban waterlogging risk spots. In addition, we utilized the other four models to examine the relative importance of the different combinations for composition and configuration within the subcategories of the impervious surface (i.e., building and pavement). Before performing partial redundancy analysis, we conducted the procedure of “interactive-forward-selection” built into CANOCO 5.0 to select variables with significant contributions to urban waterlogging risk spots (Monte Carlo permutation test; p < 0.05). The working principal of this procedure is actually stepwise regression [60,61], which enables us to identify multicollinearity [61,62]. Before the statistical analyses, all the variables were subjected to normal distribution tests using the Kolmogorov–Smirnov method. The majority of variables were normally distributed. For a few variables with non-normal distributions, we used the natural logarithm, or square root, or rank sort method to make them meet the normal distribution after transformation.

3. Results

3.1. Correlation Analysis Results at Multiple Scales

The Pearson correlation analysis between the spatial pattern of the impervious surface and urban waterlogging risk spots is shown in Table 1. It shows that %imp was significantly positively correlated with urban waterlogging risk spots at all three spatial resolutions and all grid scales. At the catchment scale, the relationship between %imp and urban waterlogging risk spots was just significant at a 2 m spatial resolution. Similarly, %build showed a significantly positive correlation with urban waterlogging risk spots across all the grid scales. At the catchment scale, however, it was noted that the correlation between urban waterlogging risk spots and %pave was only significant at the 5 km grid scale.
For the configuration metrics, their relationships with urban waterlogging risk spots were different among metrics and spatial scales. For example, PD and LSI of the total impervious surface at a 2 m resolution showed no significant correlations with urban waterlogging spots at both grid and catchment scales. ENN_MN of the total impervious surface showed significantly negative correlations at both 3 km and 5 km grid scales, while Cohesion and AI showed significantly positive correlations at both 1 km and 3 km grid scales. However, directions (positive/negative) between configuration metrics and urban waterlogging risk spots changed with the spatial resolutions of the analysis. ED of the total impervious surface at a 2 m resolution for the catchment scale showed significantly negative correlations with urban waterlogging risk spots, while no correlations were found at a 10 m resolution for the catchment scale. PD of the total impervious surface showed no correlations at a 2 m resolution at both grid and catchment scales, while it showed negative correlations at a 10 m resolution. The scale-effect was also indicated by the PD and LSI of buildings and pavement.

3.2. Results of Partial Redundancy Analysis at Multiple Scales

The total variance of urban waterlogging risk spots explained by the spatial pattern of the impervious surface increased with the studied grid and catchment scales, while it decreased with the spatial resolutions. At a 2 m spatial resolution (Model 1), the composition and configuration of the impervious surface could explain 5.0–48.1% of the variations of urban waterlogging risk spots at different spatial scales, and the explanatory power of the model increased from the 1 km × 1 km to the 5 km × 5 km grid scale and to the catchment scale. When the resolution increased to 10 m and 30 m, the explanatory power of the model decreased to 4.8–41.0%, and the order of the explanatory power at different spatial scales from high to low was 5 km × 5 km, 3 km × 3 km, catchment scale and 1 km × 1 km. Furthermore, the combination of composition of buildings and the configuration of pavement (Model 3) showed the highest explanatory power (67.6%), indicating their importance in influencing urban waterlogging risk.
The results of partial redundancy analysis indicated that the relative importance of the spatial pattern of the impervious surface was different across spatial scales and among its subcategories (Table 2 and Table 3). The composition of the total impervious surface alone contributed more to the variation of urban waterlogging risk spots than the configuration alone did across scales regardless of the resolutions (Model 1 in Table 2). Similarly, the composition of buildings played a more important role than the configuration of buildings and pavement did at the grid scales (Models 2 and 3 in Table 3). However, the composition of pavement alone contributed less than its configuration alone did at all the studied scales, while the configurations of buildings and pavement contributed more than their composition did at the catchment scale (Models 2, 3, 4 and 5 in Table 3). Furthermore, the contributions of an individual fraction increased with the studied grid scales, such as the composition of the impervious surface (Fraction a) (Model 1 in Table 2) and buildings (Fraction a1), as well as the configuration of pavement (Fraction b2) (Model 3 in Table 3). It was noted that a few explanatory variables were not significant (p > 0.05), such as the configuration of the impervious surface (Model 1 in Table 1), the composition and configuration of buildings (Model 2 in Table 2), the composition of pavement (Model 4 and 5 in Table 3) and the configuration of pavement (Model 5 in Table 3). As a comparison with the partial redundancy analysis, the stepwise models were also used to quantify explanatory power of the spatial pattern of impervious surface and its subcategories on urban waterlogging (Table A2 and Table A3).

4. Discussion

4.1. Which Contributed More to Urban Waterlogging Risk Spots: The Composition or the Configuration of the Impervious Surface?

Previous studies have found the importance of the configuration of the impervious surface for urban waterlogging risk spots. For example, Yang et al. [30], Du et al. [27] and Yeo et al. [64] found that the configurations of the impervious surface in terms of the locations in the urban such as basin, upstream and downstream played important roles in urban flood risk. Su et al. [15] analyzed the correlation of urban waterlogging risk with the configuration of the whole landscape quantified by landscape metrics using Pearson correlation analysis. They found that urban waterlogging risk was positively correlated with landscape fragmentation (e.g., PD and ED) of the whole landscape, while negatively correlated with landscape contagion (e.g., CONTAG), which was consistent with our findings of buildings and pavement (Table 1). Our results demonstrated that the composition of the impervious surface contributed more to the variations of urban waterlogging risk than its configuration did across multiple spatial scales, which extends previous studies [45,65,66,67]. One important reason was due to the substitution of green spaces and water bodies by the impervious surface, which changed the natural hydrological process and increased the storm water runoff and peak flows. This ultimately led to a higher flood risk [27,68].
The importance of the spatial patterns of the impervious surface also differed with its subcategories. We found that the percent coverage of building made a larger contribution to urban waterlogging risk spots than the pavement did, which was consistent with Quan et al.’s [69] study. However, Wang et al. [14] found the pavement contributed more than the building did. Furthermore, we found that decreasing connectivity of buildings (Cohesion) and aggregation of the impervious surface (AI) and increasing proximity of the impervious surface and the building (ENN_MN) could reduce the risk of waterlogging, consistent with the results of Caparros-Midwood et al.’s [51] study that the incompact distribution of the impervious surface decreased urban waterlogging risk. This could be attributed to the fact that the clustered pattern of the impervious surface accelerated the flow rate without reducing the runoff amount [70,71], which subsequently gave rise to flow accumulation in a short time and transcended drainage ability. Several studies observed that buildings constituted an obstacle to the water flow path since they could reduce the flood depth and delay the time of the flood [46,68]. However, this type of interference from buildings might be limited, especially in extreme rainstorms.

4.2. Scales Effects

The scale effects of the spatial patterns of the impervious surface on urban waterlogging risk spots were different among the subcategories of the impervious surface (i.e., building and pavement), as well as among landscape metrics (i.e., composition and configuration). Firstly, the total explanatory power of the impervious surface and its subcategories (i.e., building and pavement) on urban waterlogging risk spots in five models increased as the scales varied. The composition and configuration of the total impervious surface could explain 5.0–48.1% of the variations in urban waterlogging risk spots with increasing explanatory power in the order of the 1 km × 1 km, 3 km × 3 km, 5 km × 5 km grid scale and catchment scale, while for the combination of building and pavement (0–67.6%) in the order of the 1 km × 1 km, catchment scale, 3 km × 3 km, 5 km × 5 km scale from low to high. We noted that at the small scale (1 km × 1 km), the five models accounted for less than 10% of the total variance of urban waterlogging risk spots. One possible reason for this could be the urban micro-topography, which may cause a larger influence on urban waterlogging risk spots at the small scale [72]. However, we did not consider this in our study due to data availability. The combined effects of the composition of buildings and the configuration of pavement with overall significance had better explanatory power in the 3 km × 3 km and 5 km × 5 km scales than that of other models at grid scales. This finding was primarily attributed to the collective effect of the dominant role of building area in the runoff generation and the control of the configuration of pavement [47,73]. Moreover, the highest explanatory power (67.6%) at grid scales (Model 3, 5 km grid scale) was larger than the highest one (48.1%) at the catchment scale. The probable cause was that the 5 km grid scale broke the constraint of a hydrological unit and included other factors, such as runoff produced in the impervious surface located upstream, which could cause pressure on the downstream drainage network and then increase the explanatory power. Secondly, the correlation directions changed with spatial scales and spatial resolutions. For example, the correlation direction of PD and ED of the total impervious surface changed with the spatial resolutions.

4.3. Implications for Urban Planning and Urban Waterlogging Mitigation

There is a growing interest in using urban ecology and the urban landscape for managing and controlling storm water runoff [74]. Our study of the influence of the spatial pattern of the impervious surface on urban waterlogging risk spots at multiple scales could provide important insights and perspectives into urban waterlogging risk mitigation and urban planning. Taking into account the impact of the area of the impervious surface on urban waterlogging, especially the building, a green roof could be considered as an effective way to mitigate urban waterlogging risk in highly-urbanized areas [10,75,76]. Our study also implies that optimizing the configuration of the building and pavement might be an effective solution in new urban district planning. Specifically, as indicated by Table 1 and Table 3, decreasing the fragmentation, connectivity and landscape shape complexity of the building and pavement or increasing the proximity of the building could decrease urban waterlogging risk.
Simultaneously, more than 50% of the total variance among urban waterlogging risk spots at most grid and catchment scales remained unexplained. This could be due to other factors such as drainage capacity, rainfall intensity and topography [17,23,77]. Thus, other factors such as drainage pipe networks affecting urban waterlogging risk spots are also required for further analysis of urban waterlogging control to determine a solution. By integrating the results of other literature, we found that the causes of urban waterlogging have strong local characteristics. For instance, the impact of topography and pipeline drainage on urban floods shows the contradiction caused by different hydrological characteristics in different study areas. Wang et al. [78] considered that flatter, low-lying topography characteristics could enlarge the risk of urban waterlogging, but Gaitan et al. [13] disagreed with the conclusion. Zhao et al. [25] and Wu et al. [79] did not think increasing pipeline drainage was helpful for mitigating the waterlogging risk, which was also supported by Wang et al. [14]. Hence, further analysis on how applicable our research results are in other study areas needs to be completed. An effective solution for the urban waterlogging problem should adjust targeted measures to local conditions under the premise of quantifying the causes of urban waterlogging using reasonable research methods.

5. Conclusions

In this research, we found that the influence of landscape patterns (i.e., composition and configuration) of the impervious surface on urban waterlogging risk spots changed with spatial scales and resolution for analysis and differed in its subcategories (building and pavement). The larger the spatial scales and the finer the resolution, the more total variance of urban waterlogging spots was explained by the landscape patterns of the impervious surface. The composition contributed more than the configuration did for the total impervious surface at both grid and catchment scales, while the configuration of the building at the catchment scale and the configuration of pavement at both grid and catchment scales contributed more. Furthermore, the composition of the building was more important than that of pavement, but its configuration mattered less. The study also had some limitations. First, our findings were acquired based on the case study of Guangzhou city, China, for which the applicability of the conclusions to other urban areas will need more comparative studies in the future. Second, we only focused on the effects of the spatial pattern of the impervious surface on urban waterlogging without taking other factors such as drainage pipeline networks, precipitation difference and topography into account. Although it was useful for fast warning of possible urban waterlogging areas by simply identifying land use and cover types, the possible problem areas might not really exist due to the optimal installation of drains. Thus, to improve the accuracy of the waterlogging risk warning in the future, the drainage data need more attention. Thirdly, spatial autocorrelation and heterogeneity existed for spatial data, which often violated the assumptions of traditional statistical analyses (e.g., correlation analysis, partial redundancy analysis). Because performing partial redundancy analysis and related statistical methods required the multinormality of the data, variance homogeneity and the independence of variables and also assumed the spatially-stationary relationship, due to data availability, we made efforts to solve these problems (e.g., performing a normality test of the data, increasing the sampling distance to reduce spatial auto-correlation) to some extent, but not all. In the future, the spatial autocorrelation analysis and spatial regression such as geographically -weighted regression need to be conducted to identify the spatial scales and explore the spatial variation of the relationships if the inundation data of area and depth are available. Furthermore, a hydrological-hydraulics inundation model should be established to explore the environmental factors on the depth, velocity and duration of urban waterlogging inundation.

Author Contributions

H.Z. collected and processed the data, performed the analysis and wrote the paper. Z.W. and C.L. conceived of and designed the study. All authors reviewed and approved the submitted manuscript, agreed to be listed and accepted the version for publication.

Acknowledgments

We thank the Science and Technology Project of Guangdong Province (2016A020223009; 2016A050502065), the National Natural Science Foundation of China (41671430; 41501203), the Project of Science and Technology Innovation Platform of Guangdong Province, China (2015B070701017), and Guangdong Academy of Sciences’ Special Project of Science and Technology Development (2017GDASCX-0831).

Conflicts of Interest

The authors declare no conflict of interest.

Appendix A

Figure A1. The spatial distribution map of 24 selected urban waterlogging risk spots and their on-site photographs.
Sustainability 10 01589 g0a1
Table A1. The substrate materials of 24 selected urban waterlogging risk spots and the percentages of impervious surface and vegetation at their 100-m buffer radiuses.
NumberUrban Waterlogging Risk Spot100-m Buffer Radiuses of Urban Waterlogging Risk Spots
Substrate Materials%Impervious%VegetationPervious
1Cement98.880.21No
2Cement85.5414.46No
3Cement92.467.54No
4Soil49.1215.53part
5Cement68.0631.94part
6Cement87.7312.27No
7Cement94.525.48No
8Asphalt1000No
9Cement82.4117.59No
10Asphalt98.781.22No
11Asphalt89.0910.08No
12Asphalt83.216.8No
13Asphalt99.590.41No
14Soil55.8944.11Part
15Asphalt77.9718.26No
16Asphalt86.7513.25No
17Asphalt85.090No
18Cement95.194.81No
19Soil66.8933.11Part
20Asphalt91.298.71No
21Asphalt89.4610.54No
22Asphalt82.8517.15No
23Asphalt69.1330.87Part
24Soil68.2231.78Part
Table A2. Stepwise regression models for the total number of urban waterlogging risk spots with spatial pattern metrics of the impervious surface. All coefficients are significant at the 0.01 level.
Spatial Resolution1 km × 1 km3 km × 3 km 5 km × 5 kmCatchment
Regression Model R2Regression ModelR2Regression ModelR2Regression ModelR2
2 mY = 0.285 × imp% + 1.5620.059Y = 0.274 × imp% + 5.0600.320Y = 6.600 × imp% + 9.7310.428Y = 1.259 × Area_imp-0.887 × LSI + 2.2620.424
10 mY = 0.285 × imp% + 1.5610.058Y = 2.729 × imp% + 5.0600.321Y = 6.610 × imp% + 9.7310.429Y = 0.934 × Area_imp + 2.2440.257
30 mY = 0.325 × imp% + 1.5760.073Y = 2.720 × imp% + 5.0600.319Y = 6.569 × imp% + 9.7310.423Y = 0.922 × Area_imp + 0.455 × imp% + 2.2440.307
Table A3. Stepwise regression models for the total number of urban waterlogging risk spots with spatial pattern metrics of building and pavement. Model 2: composition of building (i.e., %build/Area_build) + configuration of building; Model 3: composition of building + configuration of pavement; Model 4: composition of pavement (%pave/Area_pave) + configuration of building and Model 5: composition of pavement + configuration of pavement. All coefficients are significant at the 0.01 level. “-” indicates no metric selected for stepwise regression.
Model1 km × 1 km3 km × 3 km5 km × 5 kmCatchment
Regression ModelR2Regression ModelR2Regression ModelR2Regression ModelR2
Model 2Y = 0.306× %build + 1.5620.075Y = 3.056 × %build + 5.0600.409Y = 7.456 × ED + 9.7310.557Y = 0.884 × Area_build + 0.518 × ED + 2.2610.352
Model 3Y = 0.306× %build + 1.5620.069Y = 2.924 × %build + 1.075 × PD + 5.0600.472Y = 8.837 × %build + 5.344 × PD − 4.275 × ED + 9.7310.689Y = 0.965 × Area_build + 2.2610.297
Model 4Y = 0.578 × ED − 0.381 × LSI + 1.5620.083Y = 2.890 × ED + 1.504 ×AI + 5.0600.403Y = 7.456 × ED + 9.7310.557Y = 1.210 × LSI + 0.748 × AI + 2.3040.279
Model 5--Y = 1.547 × LSI + 5.0600.089Y = 4.800 × LSI + 9.7310.207Y = 0.831 × LSI + 2.3040.192

References

  1. East Asia Department, Asian Development Bank. Water-Related Disasters and Disaster Risk Management in the People’s Republic of China; ADB Reports; Asian Development Bank: Mandaluyong, Philippines, 2015. [Google Scholar]
  2. Hammond, M.J.; Chen, A.S.; Djordjević, S.; Butler, D.; Mark, O. Urban flood impact assessment: A state-of-the-art review. Urban Water J. 2015, 12, 14–29. [Google Scholar] [CrossRef]
  3. Xue, F.; Huang, M.; Wang, W.; Zou, L. Numerical Simulation of Urban Waterlogging Based on FloodArea Model. Adv. Meteorol. 2016, 2016, 3940707. [Google Scholar] [CrossRef]
  4. Akter, A.; Mohit, S.A.; Chowdhury, M.A.H. Predicting urban storm water-logging for Chittagong city in Bangladesh. Int. J. Sustain. Built Environ. 2017, 6, 238–249. [Google Scholar] [CrossRef]
  5. Li, C. Ecohydrology and good urban design for urban storm water-logging in Beijing, China. Ecohydrol. Hydrobiol. 2012, 12, 287–300. [Google Scholar] [CrossRef]
  6. Quan, R.-S.; Liu, M.; Lu, M.; Zhang, L.-J.; Wang, J.-J.; Xu, S.-Y. Waterlogging risk assessment based on land use/cover change: A case study in Pudong New Area, Shanghai. Environ. Earth Sci. 2010, 61, 1113–1121. [Google Scholar] [CrossRef]
  7. Salvadore, E.; Bronders, J.; Batelaan, O. Hydrological modelling of urbanized catchments: A review and future directions. J. Hydrol. 2015, 529, 62–81. [Google Scholar] [CrossRef]
  8. Zhang, L.; Yang, Z.; Voinov, A.; Gao, S. Nature-inspired stormwater management practice: The ecological wisdom underlying the Tuanchen drainage system in Beijing, China and its contemporary relevance. Landsc. Urban Plan. 2016, 155, 11–20. [Google Scholar] [CrossRef]
  9. Jia, H.; Yao, H.; Yu, S.L. Advances in LID BMPs research and practice for urban runoff control in China. Front. Environ. Sci. Eng. 2013, 7, 709–720. [Google Scholar] [CrossRef]
  10. Ahiablame, L.M.; Engel, B.A.; Chaubey, I. Effectiveness of Low Impact Development Practices: Literature Review and Suggestions for Future Research. Water Air Soil Pollut. 2012, 223, 4253–4273. [Google Scholar] [CrossRef]
  11. Fletcher, T.D.; Andrieu, H.; Hamel, P. Understanding, management and modelling of urban hydrology and its consequences for receiving waters: A state of the art. Adv. Water Resour. 2013, 51, 261–279. [Google Scholar] [CrossRef]
  12. Wang, Y.; Sun, M.; Song, B. Public perceptions of and willingness to pay for sponge city initiatives in China. Resour. Conserv. Recycl. 2017, 122, 11–20. [Google Scholar] [CrossRef]
  13. Gaitan, S.; Ten Veldhuis, J.A.E. Opportunities for multivariate analysis of open spatial datasets to characterize urban flooding risks. Proc. Int. Assoc. Hydrol. Sci. 2015, 370, 9–14. [Google Scholar] [CrossRef]
  14. Wang, C.; Du, S.; Wen, J.; Zhang, M.; Gu, H.; Shi, Y.; Xu, H. Analyzing explanatory factors of urban pluvial floods in Shanghai using geographically weighted regression. Stoch. Environ. Res. Risk Assess. 2017, 31, 1777–1790. [Google Scholar] [CrossRef]
  15. Su, M.; Zheng, Y.; Hao, Y.; Chen, Q.; Chen, S.; Chen, Z.; Xie, H. The influence of landscape pattern on the risk of urban water-logging and flood disaster. Ecol. Indic. 2017. [Google Scholar] [CrossRef]
  16. Su, W.; Duan, H. Catchment-based imperviousness metrics impacts on floods in Niushou River basin, Nanjing City, East China. Chin. Geogr. Sci. 2017, 27, 229–238. [Google Scholar] [CrossRef]
  17. Verstraeten, G.; Poesen, J. The nature of small-scale flooding, muddy floods and retention pond sedimentation in central Belgium. Geomorphology 1999, 29, 275–292. [Google Scholar] [CrossRef]
  18. Rodolfo, K.S.; Siringan, F.P. Global sea-level rise is recognised, but flooding from anthropogenic land subsidence is ignored around northern Manila Bay, Philippines. Disasters 2006, 30, 118–139. [Google Scholar] [CrossRef] [PubMed]
  19. Wang, J.; Gao, W.; Xu, S.; Yu, L. Evaluation of the combined risk of sea level rise, land subsidence, and storm surges on the coastal areas of Shanghai, China. Clim. Chang. 2012, 115, 537–558. [Google Scholar] [CrossRef]
  20. Herk, S.V.; Zevenbergen, C.; Ashley, R.; Rijke, J. Learning and Action Alliances for the integration of flood risk management into urban planning: A new framework from empirical evidence from The Netherlands. Environ. Sci. Policy 2011, 14, 543–554. [Google Scholar] [CrossRef]
  21. Mowla, Q.A.; Islam, M.S. Natural Drainage System and Water Logging in Dhaka: Measures to address the Problems. J. Bangladesh Inst. Plan. 2013, 6, 22–33. [Google Scholar]
  22. Nie, L. Integrated stormwater management as a long term strategy for preservation of building environment = La gestion intégrée des eaux pluviales comme stratégie à long terme pour la préservation du patrimoine bâti. J. Neurosci. Res. 2013, 42, 758–767. [Google Scholar]
  23. Hu, S.L.; Han, C.F.; Meng, L.P. A Scenario Planning Approach for Propositioning Rescue Centers for Urban Waterlog Disasters; Pergamon Press, Inc.: Oxford, UK, 2015; pp. 425–435. [Google Scholar]
  24. Miller, J.D.; Kim, H.; Kjeldsen, T.R.; Packman, J.; Grebby, S.; Dearden, R. Assessing the impact of urbanization on storm runoff in a peri-urban catchment using historical change in impervious cover. J. Hydrol. 2014, 515, 59–70. [Google Scholar] [CrossRef] [Green Version]
  25. Zhao, J.; Yu, K.; Li, D. Spatial characteristics of local floods in Beijing urban area. Urban Water J. 2014, 11, 557–572. [Google Scholar] [CrossRef]
  26. Li, B.; Zhao, Y.; Fu, Y. Spatio-temporal Characteristics of Urban Storm Waterlogging in Guangzhou and the Impact of Urban Growth. J. Geo-Inf. Sci. 2015, 17, 445–450. (In Chinese) [Google Scholar]
  27. Du, S.; Shi, P.; Van Rompaey, A.; Wen, J. Quantifying the impact of impervious surface location on flood peak discharge in urban areas. Nat. Hazards 2015, 76, 1457–1471. [Google Scholar] [CrossRef]
  28. Gilroy, K.L.; Mccuen, R.H. A nonstationary flood frequency analysis method to adjust for future climate change and urbanization. J. Hydrol. 2012, 414, 40–48. [Google Scholar] [CrossRef]
  29. Mejía, A.I.; Moglen, G.E. Impact of the spatial distribution of imperviousness on the hydrologic response of an urbanizing basin. Hydrol. Processes 2010, 24, 3359–3373. [Google Scholar] [CrossRef]
  30. Yang, G.; Bowling, L.C.; Cherkauer, K.A.; Pijanowski, B.C. The impact of urban development on hydrologic regime from catchment to basin scales. Landsc. Urban Plan. 2011, 103, 237–247. [Google Scholar] [CrossRef]
  31. Meierdiercks, K.L.; Smith, J.A.; Baeck, M.L.; Miller, A.J. Heterogeneity of Hydrologic Response in Urban Watersheds1. JAWRA 2010, 46, 1221–1237. [Google Scholar] [CrossRef]
  32. Weng, Q. Remote sensing of impervious surfaces in the urban areas: Requirements, methods, and trends. Remote Sens. Environ. 2012, 117, 34–49. [Google Scholar] [CrossRef]
  33. Csillag, F.; Kabos, S. Wavelets, boundaries, and the spatial analysis of landscape pattern. Ecoscience 2002, 9, 177–190. [Google Scholar] [CrossRef]
  34. Remmel, T.K.; Csillag, F. When are two landscape pattern indices significantly different? J. Geogr. Syst. 2003, 5, 331–351. [Google Scholar] [CrossRef]
  35. Remmel, T.K.; Fortin, M.J. Categorical, class-focused map patterns: Characterization and comparison. Landsc. Ecol. 2013, 28, 1587–1599. [Google Scholar] [CrossRef]
  36. Salavati, B.; Oudin, L.; Furusho-Percot, C.; Ribstein, P. Modeling approaches to detect land-use changes: Urbanization analyzed on a set of 43 US catchments. J. Hydrol. 2016, 538, 138–151. [Google Scholar] [CrossRef]
  37. Poelmans, L.; Van Rompaey, A.; Batelaan, O. Coupling urban expansion models and hydrological models: How important are spatial patterns? Land Use Policy 2010, 27, 965–975. [Google Scholar] [CrossRef]
  38. Yang, G.; Bowling, L.C.; Cherkauer, K.A.; Pijanowski, B.C.; Niyogi, D. Hydroclimatic Response of Watersheds to Urban Intensity: An Observational and Modeling-Based Analysis for the White River Basin, Indiana. J. Hydrometeorol. 2010, 11, 122–138. [Google Scholar] [CrossRef]
  39. Wu, Y.; Li, S.; Yu, S. Monitoring urban expansion and its effects on land use and land cover changes in Guangzhou city, China. Environ. Monitor. Assess. 2016, 188, 54. [Google Scholar] [CrossRef] [PubMed]
  40. Glenis, V.; Mcgough, A.S.; Kutija, V.; Kilsby, C.; Woodman, S. Flood modelling for cities using Cloud computing. J. Cloud Comput. Adv. Syst. Appl. 2013, 2, 7. [Google Scholar] [CrossRef] [Green Version]
  41. Tapia, C.; Abajo, B.; Feliu, E.; Mendizabal, M.; Martinez, J.A.; Fernández, J.G.; Laburu, T.; Lejarazu, A. Profiling urban vulnerabilities to climate change: An indicator-based vulnerability assessment for European cities. Ecol. Indic. 2017, 78, 142–155. [Google Scholar] [CrossRef]
  42. Guerreiro, S.; Glenis, V.; Dawson, R.; Kilsby, C. Pluvial Flooding in European Cities—A Continental Approach to Urban Flood Modelling. Water 2017, 9, 296. [Google Scholar] [CrossRef]
  43. Wu, J. Effects of changing scale on landscape pattern analysis: Scaling relations. Landsc. Ecol. 2004, 19, 125–138. [Google Scholar] [CrossRef]
  44. Arnold, C.L.; Gibbons, C.J. Impervious Surface Coverage: The Emergence of a Key Environmental Indicator. J. Am. Plan. Assoc. 1996, 62, 243–258. [Google Scholar] [CrossRef]
  45. Jacobson, C.R. Identification and quantification of the hydrological impacts of imperviousness in urban catchments: A review. J. Environ. Manag. 2011, 92, 1438–1448. [Google Scholar] [CrossRef] [PubMed]
  46. Leandro, J.; Schumann, A.; Pfister, A. A step towards considering the spatial heterogeneity of urban key features in urban hydrology flood modelling. J. Hydrol. 2016, 535, 356–365. [Google Scholar] [CrossRef]
  47. Redfern, T.W.; Macdonald, N.; Kjeldsen, T.R.; Miller, J.D.; Reynard, N. Current understanding of hydrological processes on common urban surfaces. Prog. Phys. Geogr. 2016, 40, 699–713. [Google Scholar] [CrossRef] [Green Version]
  48. Chen, A.; Yao, L.; Sun, R.; Chen, L. How many metrics are required to identify the effects of the landscape pattern on land surface temperature? Ecol. Indic. 2014, 45, 424–433. [Google Scholar] [CrossRef]
  49. Plexida, S.G.; Sfougaris, A.I.; Ispikoudis, I.P.; Papanastasis, V.P. Selecting landscape metrics as indicators of spatial heterogeneity—A comparison among Greek landscapes. Int. J. Appl. Earth Obs. Geoinf. 2014, 26, 26–35. [Google Scholar] [CrossRef]
  50. Uuemaa, E.; Mander, Ü.; Marja, R. Trends in the use of landscape spatial metrics as landscape indicators: A review. Ecol. Indic. 2013, 28, 100–106. [Google Scholar] [CrossRef]
  51. Caparros-Midwood, D.; Dawson, R.; Barr, S. Optimization of urban spatial development against flooding and other climate risks, and wider sustainability objectives. In Proceedings of the 3rd European Conference on Flood Risk Management (FLOODrisk 2016), Lyon, France, 17–21 October 2016; Volume 7, p. 04016. [Google Scholar]
  52. Mignot, E.; Paquier, A.; Haider, S. Modeling floods in a dense urban area using 2D shallow water equations. J. Hydrol. 2006, 327, 186–199. [Google Scholar] [CrossRef]
  53. Zhang, B.; Xie, G.D.; Li, N.; Wang, S. Effect of urban green space changes on the role of rainwater runoff reduction in Beijing, China. Landsc. Urban Plan. 2015, 140, 8–16. [Google Scholar] [CrossRef]
  54. McGarigal, K. FRAGSTATS Help; Documentation for FRAGSTATS; Fragstats: Amherst, MA, USA, 2014. [Google Scholar]
  55. Alexakis, D.D.; Grillakis, M.G.; Koutroulis, A.G.; Agapiou, A.; Themistocleous, K.; Tsanis, I.K.; Michaelides, S.; Pashiardis, S.; Demetriou, C.; Aristeidou, K.; et al. GIS and remote sensing techniques for the assessment of land use change impact on flood hydrology: The case study of Yialias basin in Cyprus. Nat. Hazards Earth Syst. Sci. 2014, 14, 413–426. [Google Scholar] [CrossRef] [Green Version]
  56. Li, L.; Xu, T.; Chen, Y. Improved Urban Flooding Mapping from Remote Sensing Images Using Generalized Regression Neural Network-Based Super-Resolution Algorithm. Remote Sens. 2016, 8, 625. [Google Scholar] [CrossRef]
  57. Remmel, T.K.; Csillag, F.; Mitchell, S.W.; Boots, B. Empirical distributions of landscape pattern indices as functions of classified image composition and spatial structure. In Proceedings of the Symposium on Geospatial Theory, Processing, and Applications, Ottawa, ON, Canada, 8–12 July 2002; pp. 9–12. [Google Scholar]
  58. Legendre, P. Studying beta diversity: Ecological variation partitioning by multiple regression and canonical analysis. J. Plant Ecol. 2007, 1, 3–8. [Google Scholar] [CrossRef]
  59. Mudrák, O.; Doležal, J.; Frouz, J. Initial species composition predicts the progress in the spontaneous succession on post-mining sites. Ecol. Eng. 2016, 95, 665–670. [Google Scholar] [CrossRef]
  60. Li, C.; Li, F.; Wu, Z.; Cheng, J. Effects of landscape heterogeneity on the elevated trace metal concentrations in agricultural soils at multiple scales in the Pearl River Delta, South China. Environ. Pollut. 2015, 206, 264–274. [Google Scholar] [CrossRef] [PubMed]
  61. Šmilauer, P.; Lepš, J. Multivariate Analysis of Ecological Data Using CANOCO 5; Cambridge University Press: New York, USA, 2014. [Google Scholar]
  62. Braak, C.J.F.; Šmilauer, P. CANOCO Reference Manual and User’s Guide: Software for Ordination (Version 5.0); Microcomputer Power: Ithaca, NY, USA, 2012. [Google Scholar]
  63. Volis, S.; Dorman, M.; Blecher, M.; Sapir, Y.; Burdeniy, L. Variation partitioning in canonical ordination reveals no effect of soil but an effect of co-occurring species on translocation success in Iris atrofusca. J. Appl. Ecol. 2011, 48, 265–273. [Google Scholar] [CrossRef]
  64. Yeo, I.Y.; Guldmann, J.M. Land-use optimization for controlling peak flow discharge and nonpoint source water pollution. Environ. Plan. B Plan. Des. 2006, 33, 903–921. [Google Scholar] [CrossRef]
  65. Gunn, J.R. Urban Patterns and Flood Damage in Texas Coastal Watersheds. Ph.D. dissertation, Texas A & M University, College Station, TX, USA, 2016. [Google Scholar]
  66. Niehoff, D.; Fritsch, U.; Bronstert, A. Land-use impacts on storm-runoff generation: Scenarios of land-use change and simulation of hydrological response in a meso-scale catchment in SW-Germany. J. Hydrol. 2002, 267, 80–93. [Google Scholar] [CrossRef]
  67. Sillanpää, N.; Koivusalo, H. Impacts of urban development on runoff event characteristics and unit hydrographs across warm and cold seasons in high latitudes. J. Hydrol. 2015, 521, 328–340. [Google Scholar] [CrossRef]
  68. Semadeni-Davies, A.; Hernebring, C.; Svensson, G.; Gustafsson, L.-G. The impacts of climate change and urbanisation on drainage in Helsingborg, Sweden: Combined sewer system. J. Hydrol. 2008, 350, 100–113. [Google Scholar] [CrossRef]
  69. Quan, R.; Zhang, L.; Liu, M.; Lu, M.; Wang, J.; Niu, H. Risk assessment of rainstorm waterlogging on subway in central urban area of Shanghai, China based on scenario simulation. Sci. Geogr. Sin. 2014, 73, 1569–1585. [Google Scholar]
  70. Brabec, E. Imperviousness and Land Use Policy: Toward an effective approach to watershed planning. J. Hydrol. Eng. 2009, 14, 425–433. [Google Scholar] [CrossRef]
  71. Vörösmarty, C.J.; Green, P.; Salisbury, J.; Lammers, R.B. Global water resources: Vulnerability from climate change and population growth. Science 2000, 289, 284–288. [Google Scholar] [CrossRef] [PubMed]
  72. Dottori, F.; Todini, E. Testing a simple 2D hydraulic model in an urban flood experiment. Hydrol. Processes 2013, 27, 1301–1320. [Google Scholar] [CrossRef]
  73. Amaguchi, H.; Kawamura, A.; Olsson, J.; Takasaki, T. Development and testing of a distributed urban storm runoff event model with a vector-based catchment delineation. J. Hydrol. 2012, 420–421 (Suppl. C), 205–215. [Google Scholar] [CrossRef]
  74. Mejía, A.I.; Moglen, G.E. Spatial Patterns of Urban Development from Optimization of Flood Peaks and Imperviousness-Based Measures. J. Hydrol. Eng. 2009, 14, 416–424. [Google Scholar] [CrossRef]
  75. Berndtsson, J.C. Green roof performance towards management of runoff water quantity and quality: A review. Ecol. Eng. 2010, 36, 351–360. [Google Scholar] [CrossRef]
  76. Feitosa, R.C.; Wilkinson, S. Modelling green roof stormwater response for different soil depths. Landsc. Urban Plan. 2016, 153, 170–179. [Google Scholar] [CrossRef]
  77. Ogden, F.L.; Raj Pradhan, N.; Downer, C.W.; Zahner, J.A. Relative importance of impervious area, drainage density, width function, and subsurface storm drainage on flood runoff from an urbanized catchment. Water Resour. Res. 2011, 47. [Google Scholar] [CrossRef]
  78. Wang, Z.; Lai, C.; Chen, X.; Yang, B.; Zhao, S.; Bai, X. Flood hazard risk assessment model based on random forest. J. Hydrol. 2015, 527, 1130–1141. [Google Scholar] [CrossRef]
  79. Wu, X.; Yu, D.; Chen, Z.; Wilby, R.L. An evaluation of the impacts of land surface modification, storm sewer development, and rainfall variation on waterlogging risk in Shanghai. Nat. Hazards 2012, 63, 305–323. [Google Scholar] [CrossRef]
Figure 1. Geographic location of Guangzhou (a) and (c), urban waterlogging risk spots of the central urban districts of Guangzhou (b) and land use/cover map (d).
Sustainability 10 01589 g001
Figure 2. Two measures of scales were selected in our study: three different grid scales of 1 km × 1 km, 3 km × 3 km, 5 km × 5 km (ac); catchment scale (d).
Sustainability 10 01589 g002
Figure 3. The total variation in urban waterlogging risk spots is partitioned into the contributions of two subsets of explanatory variables (a, b and shared portion c) [62]. PD, Patch Density; ED, Edge Density; LSI, Landscape Shape Index; ENN_MN, Mean Euclidean Nearest Neighbor Distance; AI, Aggregation Index.
Sustainability 10 01589 g003
Table 1. Pearson correlation coefficients between urban waterlogging risk spots and the spatial pattern of the impervious surface based on 2 m, 10 m and 30 m spatial resolution land cover maps and building and pavement based on 2 m spatial resolution land cover maps at three grid and catchment scales.
Spatial ResolutionClassScaleCompositionFragmentationShape LSIProximity ENN_MNConnectivity CohesionAggregation AI
%AreaPDED
2 mImpervious surface1 km × 1 km0.257 **-−0.082−0.019−0.093−0.0850.198 *0.207 **
3 km × 3 km0.578 **-−0.0670.149−0.121−0.422 **0.451 **0.371 **
5 km × 5 km0.671 **-0.0130.3590.076−0.528**0.2850.359
Catchment0.359 *0.477 **−0.112−0.394 **−0.1690.0470.416 **0.412 **
10 mImpervious surface1 km × 1 km0.255 **-−0.196 *0.000−0.080−0.1300.208**0.150
3 km × 3 km0.579 **-−0.374 **0.190−0.120−0.357 *0.429**0.376 **
5 km × 5 km0.672 **-−0.3700.434 *0.110−0.544 **0.3300.360
Catchment0.2600.523 **−0.170−0.1500.0700.1400.295*0.240
30 mImpervious surface1 km × 1 km0.260 **-−0.212 **−0.050−0.130−0.1000.196*0.181 *
3 km × 3 km0.577 **-−0.522 **0.110−0.220−0.407 **0.399**0.439 **
5 km × 5 km0.668 **-−0.574 **0.3800.010−0.462 *0.3800.442 *
Catchment0.2700.523 **−0.361 *−0.1900.0600.0100.335 *0.270
2 mBuilding1 km × 1 km0.274 **-−0.0010.237 **0.026−0.281 **0.186 *0.159
3 km × 3 km0.653 **-0.302 *0.623 **0.378 **−0.560 **0.382 **0.234
5 km × 5 km0.752 **-0.449 *0.748 **0.574 **−0.816 **0.407 *0.164
Catchment0.297 *0.545 **0.383 **0.371 *0.423 **−0.360 *0.1030.041
Pavement1km × 1km-0.034-0.0370.0300.008−0.013−0.020−0.041
3 km × 3 km0.228-0.401 **0.309 *0.390 **−0.1690.239−0.007
5 km × 5 km0.507 **-0.551 **0.457 *0.627 **−0.2700.0870.087
Catchment0.4330.433 **0.364 *0.1450.459 **−0.1170.202−0.271
Note: ** and * indicate significant at the 0.01 and 0.05 levels; “-” indicates area metrics not selected.
Table 2. Summary results of the partial redundancy analysis of the impervious surface based on 2-m, 10-m and 30-m spatial resolution land cover maps. For each of the models, urban waterlogging risk spots as the response variable was predicted by two subsets of landscape variables: (a) composition of the impervious surface alone, (b) configuration of the impervious surface alone, (c) the fraction of variation (c1) shared by two variables (a, b); (TE) Total Explained by variables (a, b, c1) for Model 1. “% of all” represented the contribution of the individual fraction (i.e., a, b and c) to the total variation. p indicates the significance of the results, for which the values less than 0.05 were significant.
Spatial ResolutionFraction1 km × 1 km 3 km × 3 km 5 km × 5 km Catchment
VariationTestSelectedVariationTestSelectedVariationTestSelectedVariationTestSelected
% of AllpMetrics% of AllpMetrics% of AllpMetrics% of AllpMetrics
2 ma3.00.025%imp10.30.008%imp27.30.003%imp25.10.001Area_imp
b−0.90.777AI−2.10.646AI2.00.277ENN_MN15.60.003ED
c12.90.027Cohesion21.70.002Cohesion15.50.002 7.40.001AI
TE5.0 29.9 ENN_MN44.8 48.1 Cohesion
10 ma1.30.079%imp14.80.003%imp17.50.012%imp19.40.004Area_imp
b−1.10.884PD1.10.315PD, AI−1.90.569ED0.30.274Cohesion
c14.60.034Cohesion17.30.002Cohesion25.40.006ENN_MN6.30.002
TE4.9 33.2 ENN_MN41.0 26.0
30 ma1.80.079%imp1.60.145%imp3.40.155%imp18.80.003Area_imp
b−0.70.589PD, AI−0.70.467PD, AI−1.80.515PD, AI3.10.163PD
c13.80.046Cohesion30.30.004Cohesion38.90.012ENN_MN6.90.002Cohesion
TE4.8 31.2 ENN_MN40.5 28.8
Table 3. Summary results of the partial redundancy analysis of building and pavement based on 2-m spatial resolution land cover maps. For each of the models, urban waterlogging risk spots as the response variable was predicted by two subsets of landscape variables: (a1) composition of building alone and (a2) composition of pavement alone; and (b1) configuration of building alone and (b2) configuration of pavement alone; (c) the fraction of variation shared by two c1 (a, b), c2 (a1, b1), c3 (a1, b2), c4 (a2, b1), c5 (a2, b2) variables; (TE) Total Explained by variables (a1, b1, c2) for Model 2, (a1,b2,c3) for Model 3, (a2, b1, c4) for Model 4 and (a2, b2, c5) for Model 5.
Fraction1 km × 1 km 3 km × 3 km 5 km × 5 km Catchment
VariationTestSelectedVariationTestSelectedVariationTestSelectedVariationTestSelected
% of AllpMetrics% of AllpMetrics% of AllpMetrics% of AllpMetrics
a13.10.013%build0.70.222%build−2.00.636%build10.70.012Area_build
b10.90.166ED−3.30.754PD, ED−5.90.793PD, ED20.60.008ED, LSI
c23.80.001ENN_MN40.20.001LSI, ENN_MN56.70.005LSI, ENN_MN−4.00.005ENN_MN
TE7.9 37.6 Cohesion48.8 Cohesion27.3
a16.90.002%build39.10.001%build45.30.001%build16.50.001Area_build
b2−4.00.974LSI6.30.045LSI12.90.022LSI25.00.001LSI
c3<0.10.168 1.80.001PD, ED9.40.001PD, ED−9.80.001
TE2.9 47.3 67.6 31.7
a2<0.10.323%pave2.60.100%pave−0.40.382%pave10.70.029Area pave
b15.30.007ED36.30.001ED44.90.011ED, PD12.80.031ED, LSI
c4−0.50.023ENN_MN0.60.001ENN_MN5.90.01ENN_MN4.30.006ENN_MN
TE4.8 39.5 50.4 27.8
a20.00.407%pave<0.10.293%pave−3.60.904%pave−3.10.825Area pave
b20.00.407ENN_MN5.00.139PD, ED13.20.117PD, ED−0.30.420LSI
c50.00.810ED3.20.103ENN_MN9.10.102ENN_MN14.70.033
TE0.0 8.2 18.7 11.3

