Optimal Price Subsidy for Universal Internet Service Provision


1
Department of Electrical and Electronic Engineering Science, University of Johannesburg, Johannesburg 2006, South Africa
2
Department of Mechanical Engineering Science, University of Johannesburg, Johannesburg 2006, South Africa
*
Author to whom correspondence should be addressed.
†
These authors contributed equally to this work.
Sustainability 2018, 10(5), 1576; https://doi.org/10.3390/su10051576
Submission received: 19 April 2018
/
Revised: 4 May 2018
/
Accepted: 10 May 2018
/
Published: 15 May 2018
(This article belongs to the Special Issue Information and Communications Technologies (ICT) for Sustainability)
Abstract
:Universal service has been adopted by many countries to bridge the digital divide between Information and communication technologies (ICTs) “haves” and “have-nots”. The key goal of universal service is to provide telecommunications services to “needy persons” at “reasonable” rate. It is, therefore, critical for policymakers to make decisions on what is a “reasonable” price or subsidy for “needy persons” so that the targeted users do utilize ICTs and benefit from them. This paper analyzes universal service subsidies in providing subsidized Internet access from a pricing point of view through a hypothetical scenario where the subsidized users being subsidized through a price subsidy and non-subsidized users share the same network operated by a service provider. We propose a service differentiation system based on priority queuing to accommodate both groups of users, and model such a system as a Stackelberg game from both a revenue-maximizing service provider perspective and a social welfare maximizing planner’s perspective. We then analyze the optimal prices that maximize the service provider’s revenue and social welfare respectively, investigate how the revenue maximizing price and social welfare maximizing price are effected by users’ willingness to pay and the subsidy ratio, and evaluate the revenue maximizing solution on welfare grounds using the social-maximizing solution as a benchmark. Interestingly, the optimal revenue maximizing solution corresponds to the socially optimal solution in terms of social welfare under the optimum subsidy ratio that maximizes the social welfare. This suggests that the subsidy ratio can be used as a tool to induce the revenue maximizing service provider to set a price that leads to social optimality.
1. Introduction
Information and communication technologies (ICTs) represent the best way to foster productivity and create opportunities for sustainable economic growth and employment. It is widely accepted that promoting access to ICTs will enable citizens to participate in economic, political, and social activities, and universal access to ICTs is the primary policy tool to promoting economic development and improve social welfare. In this context, access to the Internet has become a vital development tool. In South Africa, given income inequality and the existence of rural areas where access is difficult, there still exists a large digital divide in Internet access. Just over half of South Africa’s households (53.5%) had at least one member who has access to the Internet in 2015 [1]. In addition, although the South African broadband market is growing, there remain distinct gaps with regard to accessiblity to ICTs. According to [2], as of the first quarter of 2015 there are a little over 5 million fixed-broadband and mobile broadband subscribers, which make up 9% of the population penetration.
Universal service and access have been adopted by many countries in the world including South Africa to provide convenient and affordable access to telecommunication services to bridge the digital divide between ICT “haves” and “have-nots”, where ICT “haves” refer to those who can access ICTs while ICT “have-nots” are socially disadvantaged individuals who have less opportunity to access and use ICTs [3]. The primary goal of universal service is to provide telecommunication services to “needy persons” from underserved areas at “reasonable” or “affordable” rates given the cost of services and the income inequality of customers. Providing subsidized Internet access has been seen an important and necessary step to ensure that all segments of society, especially the underserved urban poor and rural communities, can access telecommunications services and narrow the digital divide [4]. It is, therefore, critical for policymakers and regulators to make decisions on what is in fact a “reasonable” price for “needy persons” in providing subsidized Internet access. In [5,6], the authors argue that it is crucial to incorporate how much consumers value the service being subsidized, in other words, how much consumers benefit from the service being subsidized, in creating a more efficient and effective universal service program. Studies have shown that demand for Internet is price-driven. Understanding the expected benefits to consumers would help policymakers make informed decisions about how much should be spent on subsidies, provide real benefits to “needy persons” rather than enrich particular firms, and limit total spending.
In addition, a subsidized Internet service cannot be viable and sustainable economically in the long term if demand is not able to generate sufficient revenue for universal service providers. Although the key goal of universal service is to provide telecommunications services at reasonable rates to “needy person”, a universal service provider could not only offer services to “needy persons” especially in urban areas, where poor people still cannot afford Internet access even though the network infrastructures for Internet have been built. In this case, universal service subsidies could be used directly on “needy persons”, which are also called subsidized users in the rest of the paper, rather than unnecessary network build. Theoretically, in this case, the subsidy could be used to subsidize portions of the service charges for the subsidized users.
However, this raises a question: how to price, in the presence of subsidized users and non-subsidized users sharing the same network resource, so that the universal service provider can economically and efficiently provide the necessary service to the subsidized users while guaranteeing certain quality of service (QoS) for the non-subsidized users? The price set by the universal service provider for the subsidized users could probably be so high that the subsidized users would still be deterred from ICT usage even with certain price subsidies. On the other hand, lower subsidized prices for the subsidized users could lead to overutilization of the services, which would in turn result in free-riding problem or congestion problem disturbing the non-subsidized users who share the same network with the subsidized users. If the QoS perceived by the non-subsidized users degrades to an unacceptable level, which they think is not worth paying what they are charged, due to the presence of subsidized users, the non-subsidized users would stop using the service or probably even choose to join the subsidized users by illegally connecting to a subsidized user’s Internet connection, which we call free-riding. This type of free-riding will definitely negatively affect the efficiency of universal service subsidies. Therefore, it is important for the revenue-maximizing universal service provider to find a balance between subsidized users and non-subsidized users through proper incentive-compatible pricing strategies that take into account how both types of users value the service or users’ willingness-to-pay.
The objective of this paper is to study the pricing problem in providing subsidized Internet access through a hypothetical scenario where the universal service subsidies are used to fund “needy persons” directly through a price subsidy, namely the services is provided to the subsidized users at a subsidized price, which is a percentage of the standard price. Although this hypothetical scenario is not actually used in current universal service subsidy mechanisms, it simplifies analysis and reflects the objective of universal service subsidies. The subsidized users and non-subsidized users should be handled differently. A possible solution is to give higher priority to the non-subsidized users, who pay more, while providing the subsidized users basic data services that can tolerate packet delivery delay and do not require a high guaranteed QoS, e.g., email, web browsing, file transfer, and so on. Without an appropriate pricing scheme, any prioritization is useless [7]. In our case, the price subsidy for the subsidized users can be seen as a means to price discriminate between the two types of users. Hence, the pricing problem here can be viewed as a differential pricing problem based on differentiated services. Differential pricing is generally required for an optimal allocation of resources in real life situations [8]. Economically, price discrimination is usually regarded as socially and economically desirable, since it often increases the efficiency of the economy [9]. A simple but well-studied scheme of differentiated pricing for communication networks is so-called Paris Metro Pricing (PMP) [10,11,12], which imposes differentiated prices at different service classes without fulfilling specific QoS requirements and let users spontaneously opt for the appropriate service classes according to their experienced performance. In our case, subsidized users, who pay less, should join the low-priority and reduced facility class, whereas non-subsidized users are encouraged to join the high-priority and value-added class.
From a game-theoretical perspective, such a service differentiation system can be viewed as a non-cooperative game where there are three players-the universal service provider, the non-subsidized users and the subsidized users, who have different utility functions and incentives to optimize their own payoffs, and each player must take other players’ actions into account. Precisely speaking, this non-cooperative game can be modeled as a Stackelberg game where the universal service provider, who has complete knowledge about users’ reaction to its price, as the leader of the game sets up prices so as to maximize its revenue, while the non-subsidized users and subsidized users as the followers will choose their optimal reactions to the price and QoS offered by the universal service provider by adjusting their usage of the service. In game-theoretical terms, the equilibrium price, with which no player has any incentive to unilaterally deviate from his current strategy, is the revenue-maximizing and incentive-compatible price in this game.
Nonetheless, a revenue-maximizing price derived from such a non-cooperative game model might not be a social optimal solution, where the sum of surpluses of all players-the government who pays the subsidy, the universal service provider, the non-subsidized users and the subsidized users-is maximized. The sum of surpluses of all players is called social welfare or economic efficiency. In game theory, usually non-cooperation leads to a loss of economic efficiency because players, who have self-interests or even conflicting interests, will act to achieve their own selfish objectives, which comes at the expense of social welfare. In our case, the government wants to subsidize as many “needy persons” as possible given a certain amount of funds while the universal service provider’s objective is to maximize its revenue. On the other hand, as mentioned above, too many subsidized users utilizing the same network could result in QoS degradation to the non-subsidized users. Theoretically, social welfare can be maximized by an appropriate pricing scheme that takes into account surpluses of all players.
The rest of the paper is organized as follows: In Section 2, a simple analysis of a system without service differentiation is given to show how the tragedy of the commons could occur in such a system. In Section 3, a mathematical framework based on priority queuing theory is presented to model the service differentiation system. With the subsidized users and non-subsidized users sharing a First-In-First-Out (FIFO) queue, In Section 4 and Section 5, we focus on the price selection problem from a revenue-maximizing perspective and social welfare maximizing perspective, respectively, to analyze how the revenue maximizing price and social welfare maximizing price are effected by users’ willingness to pay and the subsidy ratio, and evaluate the efficiency of the revenue-optimal pricing model using the socially-optimal pricing model as a benchmark. Finally, we conclude our investigation in Section 6.
2. The Tragedy of the Commons
In this section, we give a simple analysis of a system without service differentiation as presented in [7] to show how the tragedy of the commons could occur in such a system. The tragedy of the commons is a term describing what could happen if individuals in a group sharing a limited resource act in their own best self-interests and ignore what is best for the whole group.
Consider a system with two types of users: non-subsidized users (type 1) and subsidized users (type 2), who generate information packets according to a Poisson process with rates and respectively, and the service times of the individual packets are exponentially distributed with mean .
In an M/M/1 queue, with N independent users generating information packets according to a Poisson process with rate and the mean service time per packet being , the mean packet delay is
provided that . Note that .
Assume the price per packet transmission is p. To facilitate analysis, the price p includes costs incurred in providing the service and thus we do not need to consider costs when formulating the service provider’s revenue in the latter section. In addition, since a subsidized user actually only pay part of the price, we simply denote the price that a subsidized user pays by , where , to simplify mathematical analysis. Here is called subsidy ratio.
Utility theory, in which the level of customer satisfaction received from a service or how a customer values a service can be represented by utility-based functions, has been widely used in resource management in economics. In recent years, the utility function-based optimization approach has been adapted to study issues, e.g., rate control, resource allocation, pricing and so on, for communications networks in the literature [7,13,14,15,16,17,18,19,20].
A user uses the service as long as his utility minus price, which is called compensated utility, is positive [21]. As defined in [7], the compensated utilities for the non-subsidized user and subsidized user are, respectively,
where and are the utilities of the non-subsidized user and subsidized user respectively, and , meaning the subsidized users are more tolerant to packet delivery delay compared to the non-subsidized users.
Consider a hypothetical case where there are only subsidized users in the queue system. A subsidized user enters the queue as long as , which gives the maximum number of subsidized users
provided that .
Suppose subsidized users are present in the queue, then the expected compensated utility of a non-subsidized user who is deciding whether to use the service or not is
Given , if , the expected compensated utility is non-positive, meaning there is no incentive for a non-subsidized user to enter the queue when subsidized users are present in the queue. Only if , a non-subsidized user will choose to join in when subsidized users are present in the queue.
Conversely, for a hypothetical case where there are only non-subsidized users in the queue system, a non-subsidized user enters the queue as long as , which gives the maximum number of non-subsidized users
provided that .
Suppose non-subsidized users are present in the system, then the expected compensated utility of a subsidized user who is deciding whether to use the service or not is
Note that . Therefore, if , the expected compensated utility is non-positive, meaning there is no incentive for a subsidized user to enter the queue when non-subsidized users are present. Only if , a subsidized user will choose to join in when non-subsidized users are present.
Therefore, it can be concluded that, with non-subsidized users and subsidized users sharing the same queue, if prices are too low subsidized users dominate over non-subsidized users, while non-subsidized users dominate when prices are too high. In other words, when the price is low, in our case if , non-subsidized users who require low service delay could be excluded due to the unacceptably high congestion caused by subsidized users who are less insensitive to delay. This phenomenon is referred to as the tragedy of the commons. On the other hand, if the price is high, in our case if , subsidized users could be excluded, which makes the subsidy essentially worthless to the proposed recipients.
3. Service Differentiation in a Priority Queuing System
To satisfy the demands from both groups, a priority queuing system is introduced. In such a priority queuing system, the non-subsidized users are directed to the high priority queue and the subsidized users to the low priority queue. In standard queuing theory, there are two priority rules: preemptive-resume priority and non-preemptive priority. In this paper, we adopt the former one, where the high-priority users (non-subsidized users) get absolute service priority over the low-priority users (subsidized users). Precisely speaking, when a subsidized user is in service and a non-subsidized user arrives, the subsidized user’s service is interrupted and the server proceeds with the non-subsidized user. Once there are no more non-subsidized users in the system, the server resumes the service of the subsidized user at the point where it was interrupted. However, given a capacity constraint, without effective and incentive-compatible price discrimination schemes, such a service differentiation system could end up in a situation where the QoS of the high-priority class for the non-subsidized users could be so poor that the non-subsidized users could prefer the low-priority rather than the high-priority if they could choose.
In general, incentive-compatible pricing must consider customer’s utility. Obviously, in the priority queuing system presented above, packet delay is a key component in service differentiation and users’ satisfaction. Thus, price discrimination in such a system should be based on packet delay as well. According to standard queuing theory, the mean packet delays for both types are given by
where and are the number of non-subsidized users and subsidized users in the system.
Denote the gross utilities that a non-subsidized user and a subsidized user derive from transmitting per packet by and respectively. Then, the corresponding compensated utilities, and , are given by
respectively.
As mentioned above, a user will use the service if and only if the corresponding compensated utility is positive. Thus, the effective number of non-subsidized users and subsidized users are given by
where is the number of potential non-subsidized users and is the probability density function of ; and
where is the number of potential subsidized users and is the probability density function of , respectively.
For the sake of mathematical simplicity, and are assumed to be uniformly distributed over intervals and respectively, where and are continuously differentiable, non-increasing functions with respect to the mean packet delay. The smaller the packet delay is, the greater the user’s satisfaction. This is a common assumption in the literature [18,19,20] to model the proportionally fair resource allocation in communication networks. We further assume that and , where and are constants representing how the non-subsidized users and subsidized users value packet delivery delay in monetary terms. The assumption means that, Equations (1) and (2) can be simplified to
and
In the next section, we will discuss the price selection problem from a revenue-maximizing perspective.
4. Revenue Maximization
The total expected revenue generated from both non-subsidized users and subsidized users per unit time is given by
With the user’s utilities in Equations (3) and (4), the service provider’s revenue maximization problem can be written as
where
In order to find the optimal solution to this maximization problem, Lagrange multipliers method is applied. The Lagrange function is defined by the following system of equations:
where and are Lagrange multipliers, and the gradient vectors are:
where
Therefore, the optimal solution can be found by solving the following five equations in the five unknowns :
Since Equation (9) are difficult to solve analytically, a numerical example is given to analyze the optimal price differentiation between the subsidized users and non-subsidized users in this game. We will also investigate how the subsidy ratio affects the revenue-maximizing price, corresponding expected revenue and social welfare.
We first assume that the mean service time per packet, , is s. The number of potential non-subsidized users, , and subsidized users, , are 100 and 60 respectively. The rates that each non-subsidized user and subsidized user generate information packets, and , are 20 packets/s and 10 packets/s respectively. With these assumptions, we focus our attention on a scenario where the occupation rate, , due to both types of users, could exceed the full capacity of the queue system, 1, if there are not proper admission control mechanisms.
Figure 1 shows the optimal price that maximizes the service provider’s revenue as a function of subsidy ratio, , with and , meaning the non-subsidized users are more sensitive to packet delay compared to the subsidized users. It can be seen that the optimal price drops with an decrease in the subsidy ratio.
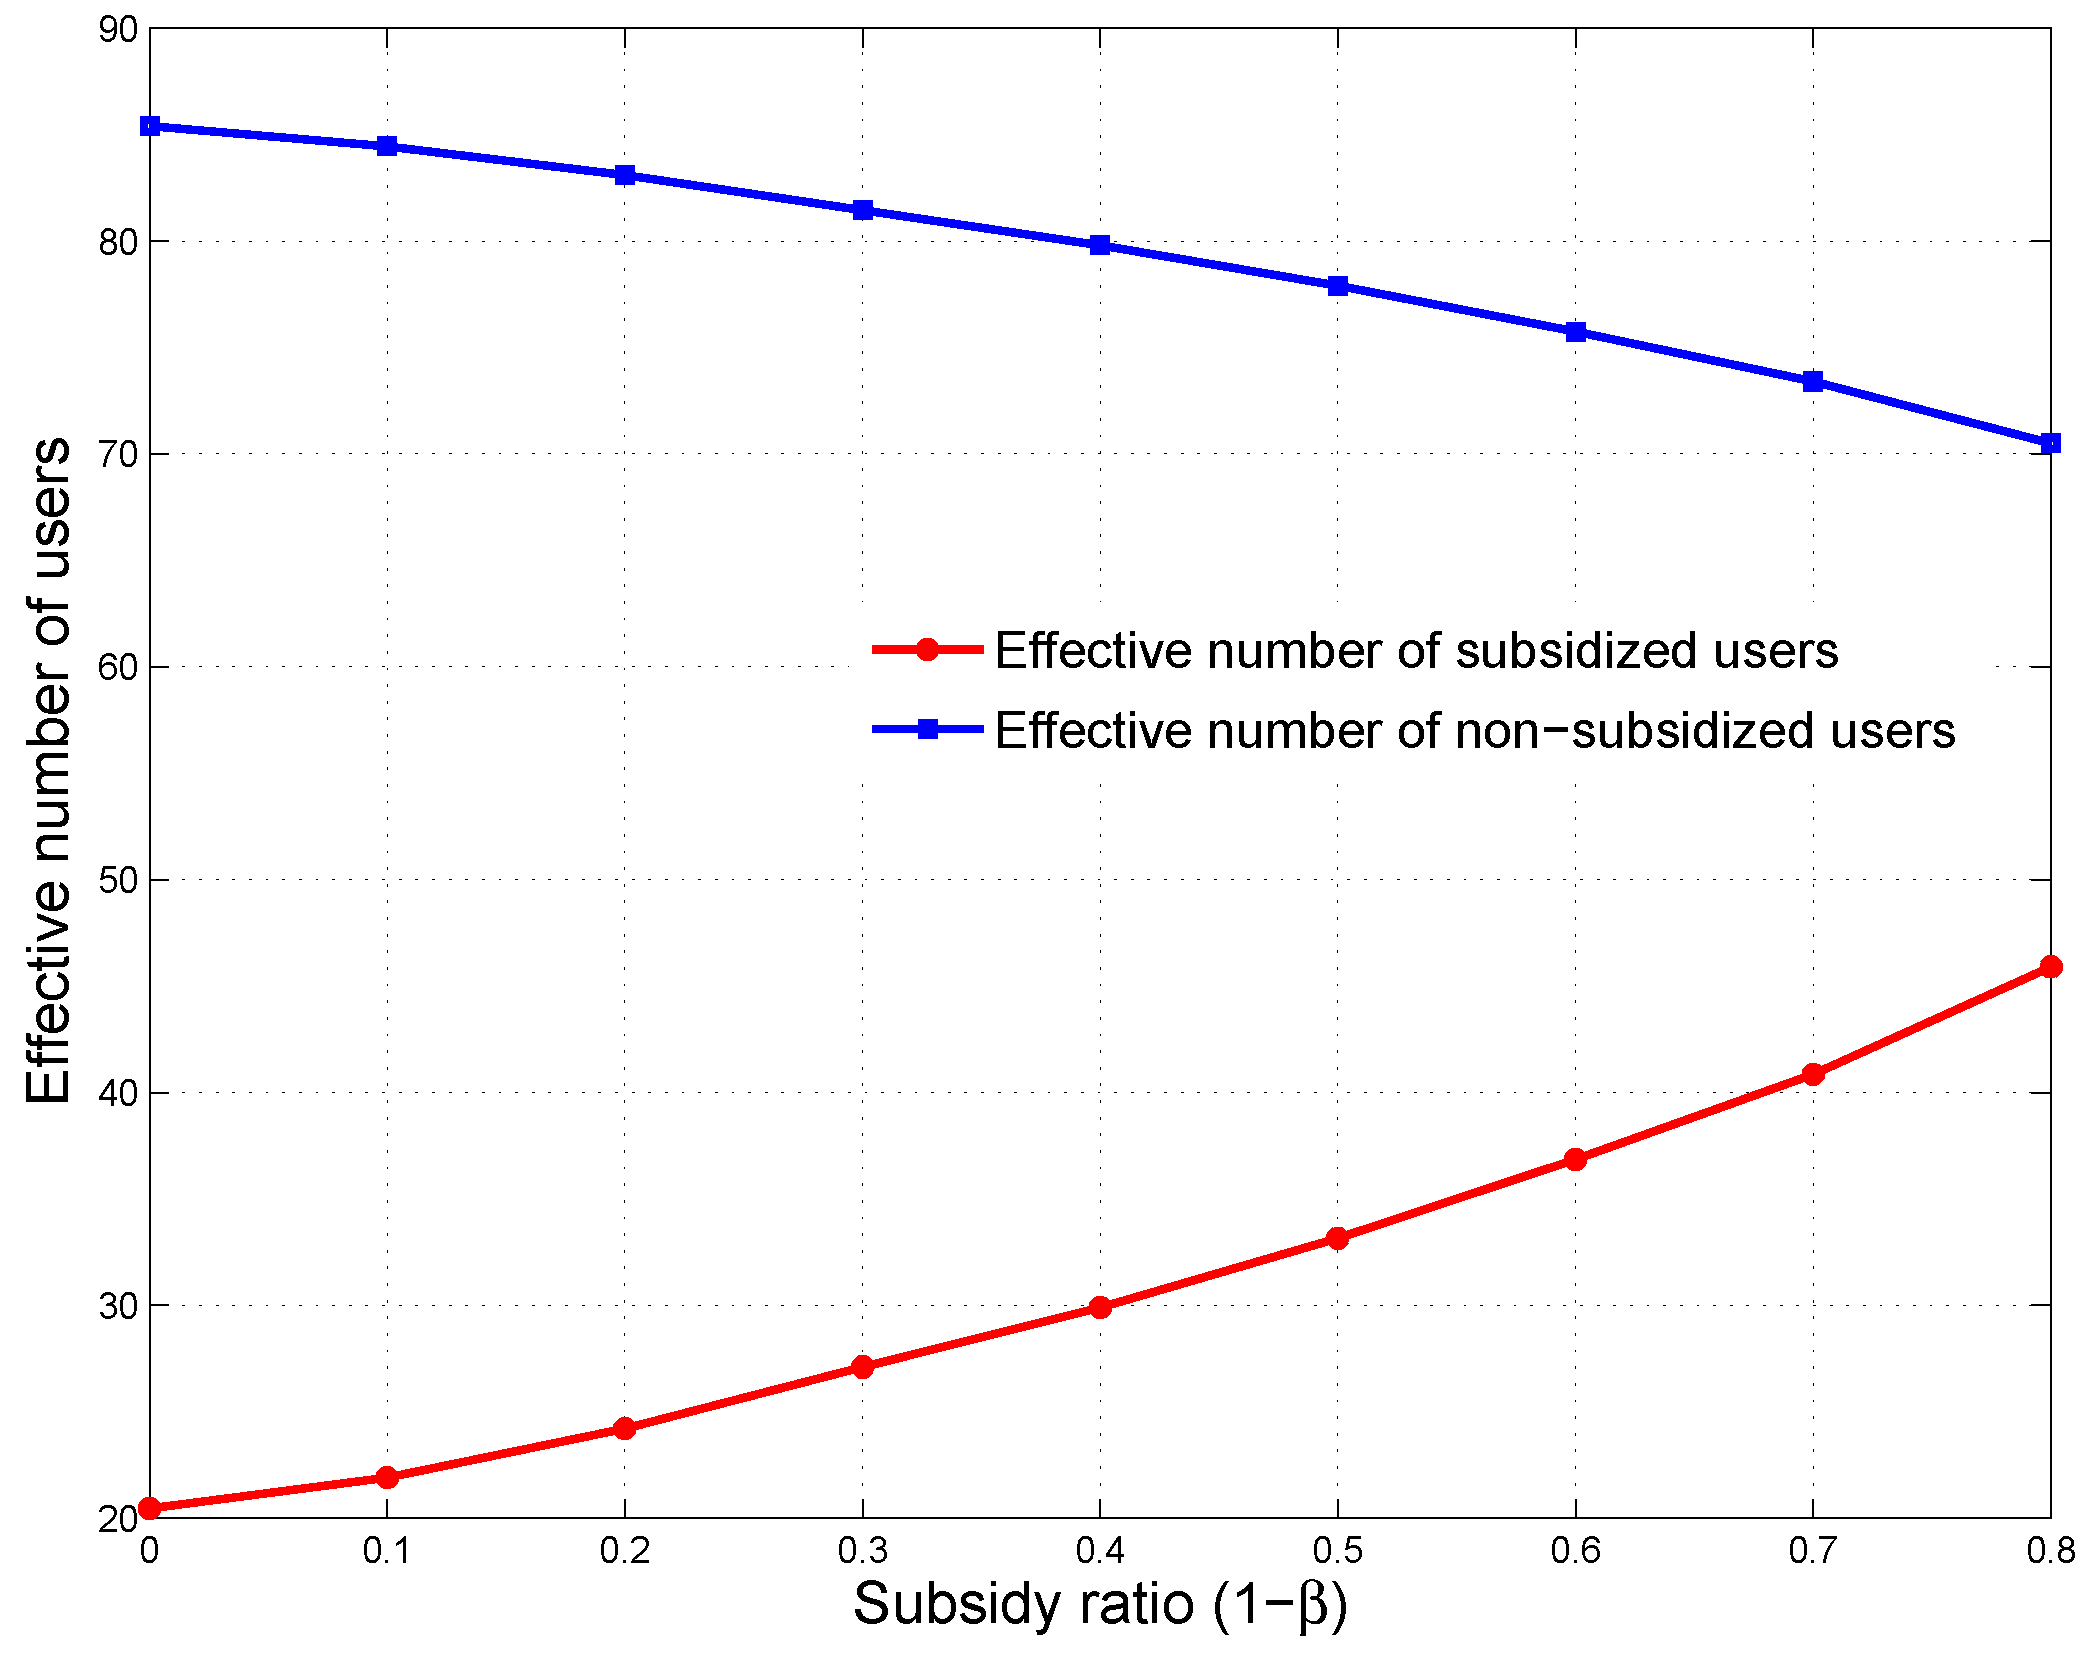
Figure 2 plots the effective number of non-subsidized and subsidized users respectively as functions of subsidy ratio, . As can be observed, when the subsidy ratio increases, the effective number of subsidized users decreases while the effective number of non-subsidized users increases. It is intuitive because fewer subsidized users would choose to use the service when the subsidy ratio drops, which means they have to pay more themselves, while more non-subsidized users would choose to join due to the decrease in the optimal price.
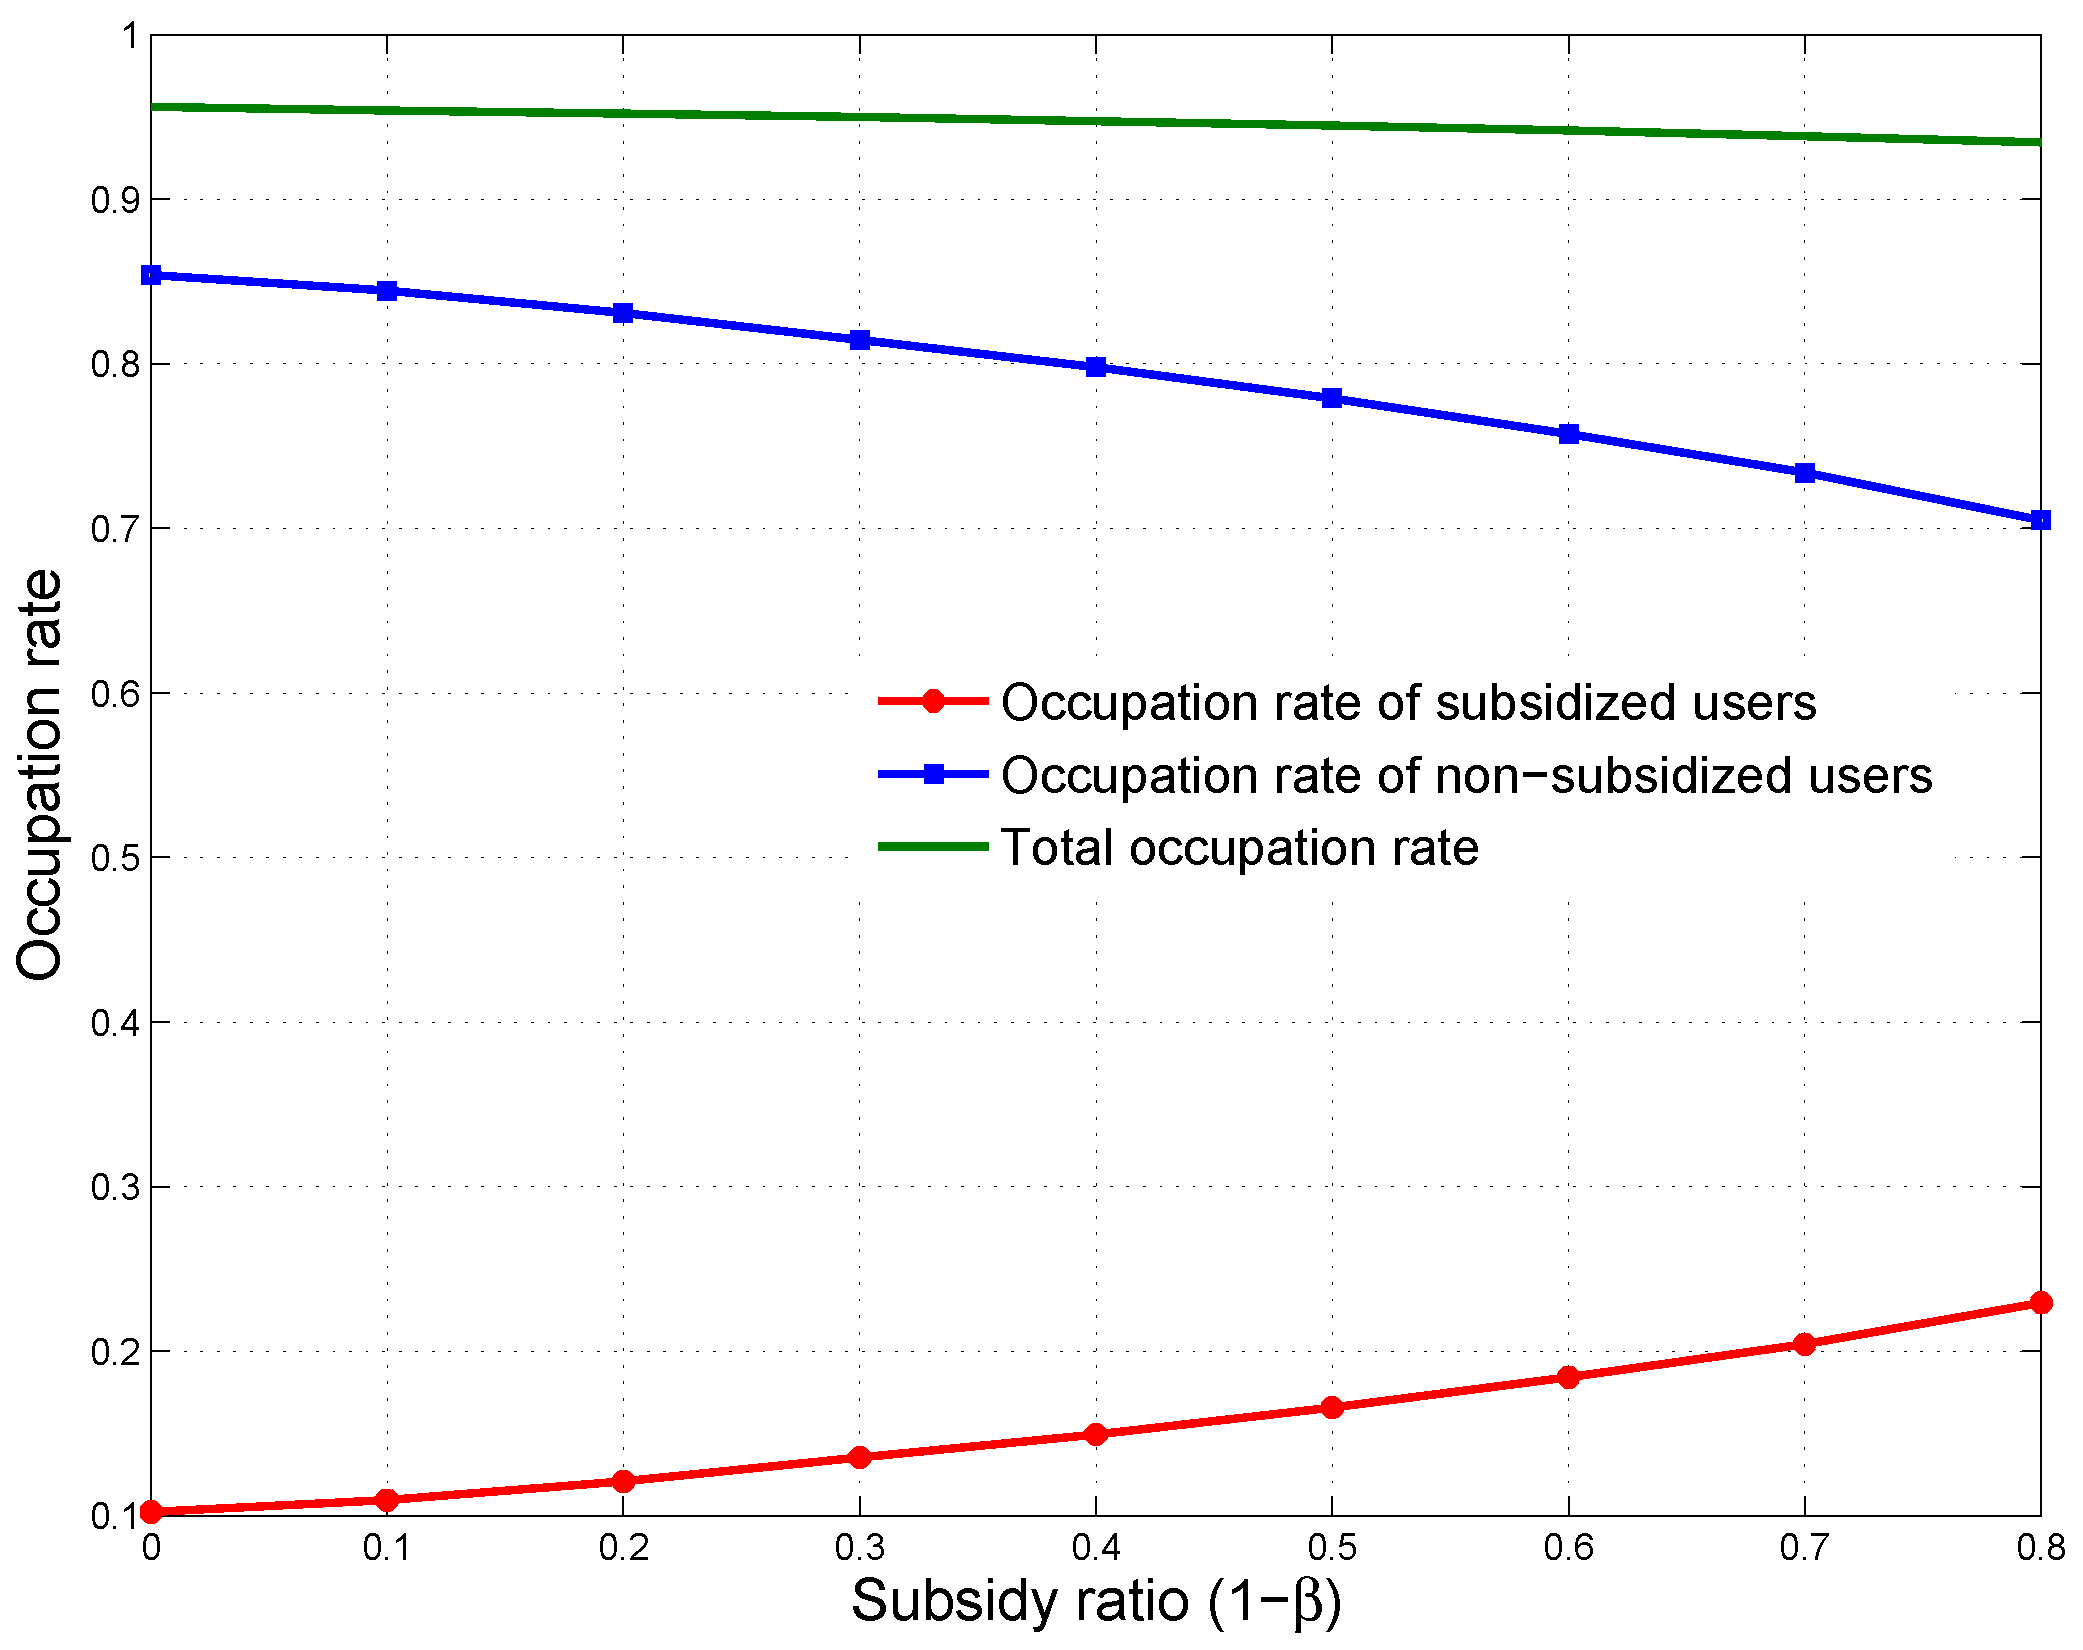
Figure 3 further plots the occupation rates of both non-subsidized () and subsidized () users as well as the total occupation rate () as functions of subsidy ratio, . It illustrates that the total occupation rate remains at a fairly constant level and close to 1, which implies an optimal incentive-compatible pricing model, which takes into account users sensitivity to QoS and price, could avoid congestion by using price as a measure to induce users to utilize the limited resource in a desirable way, and result in effective resource utilization.
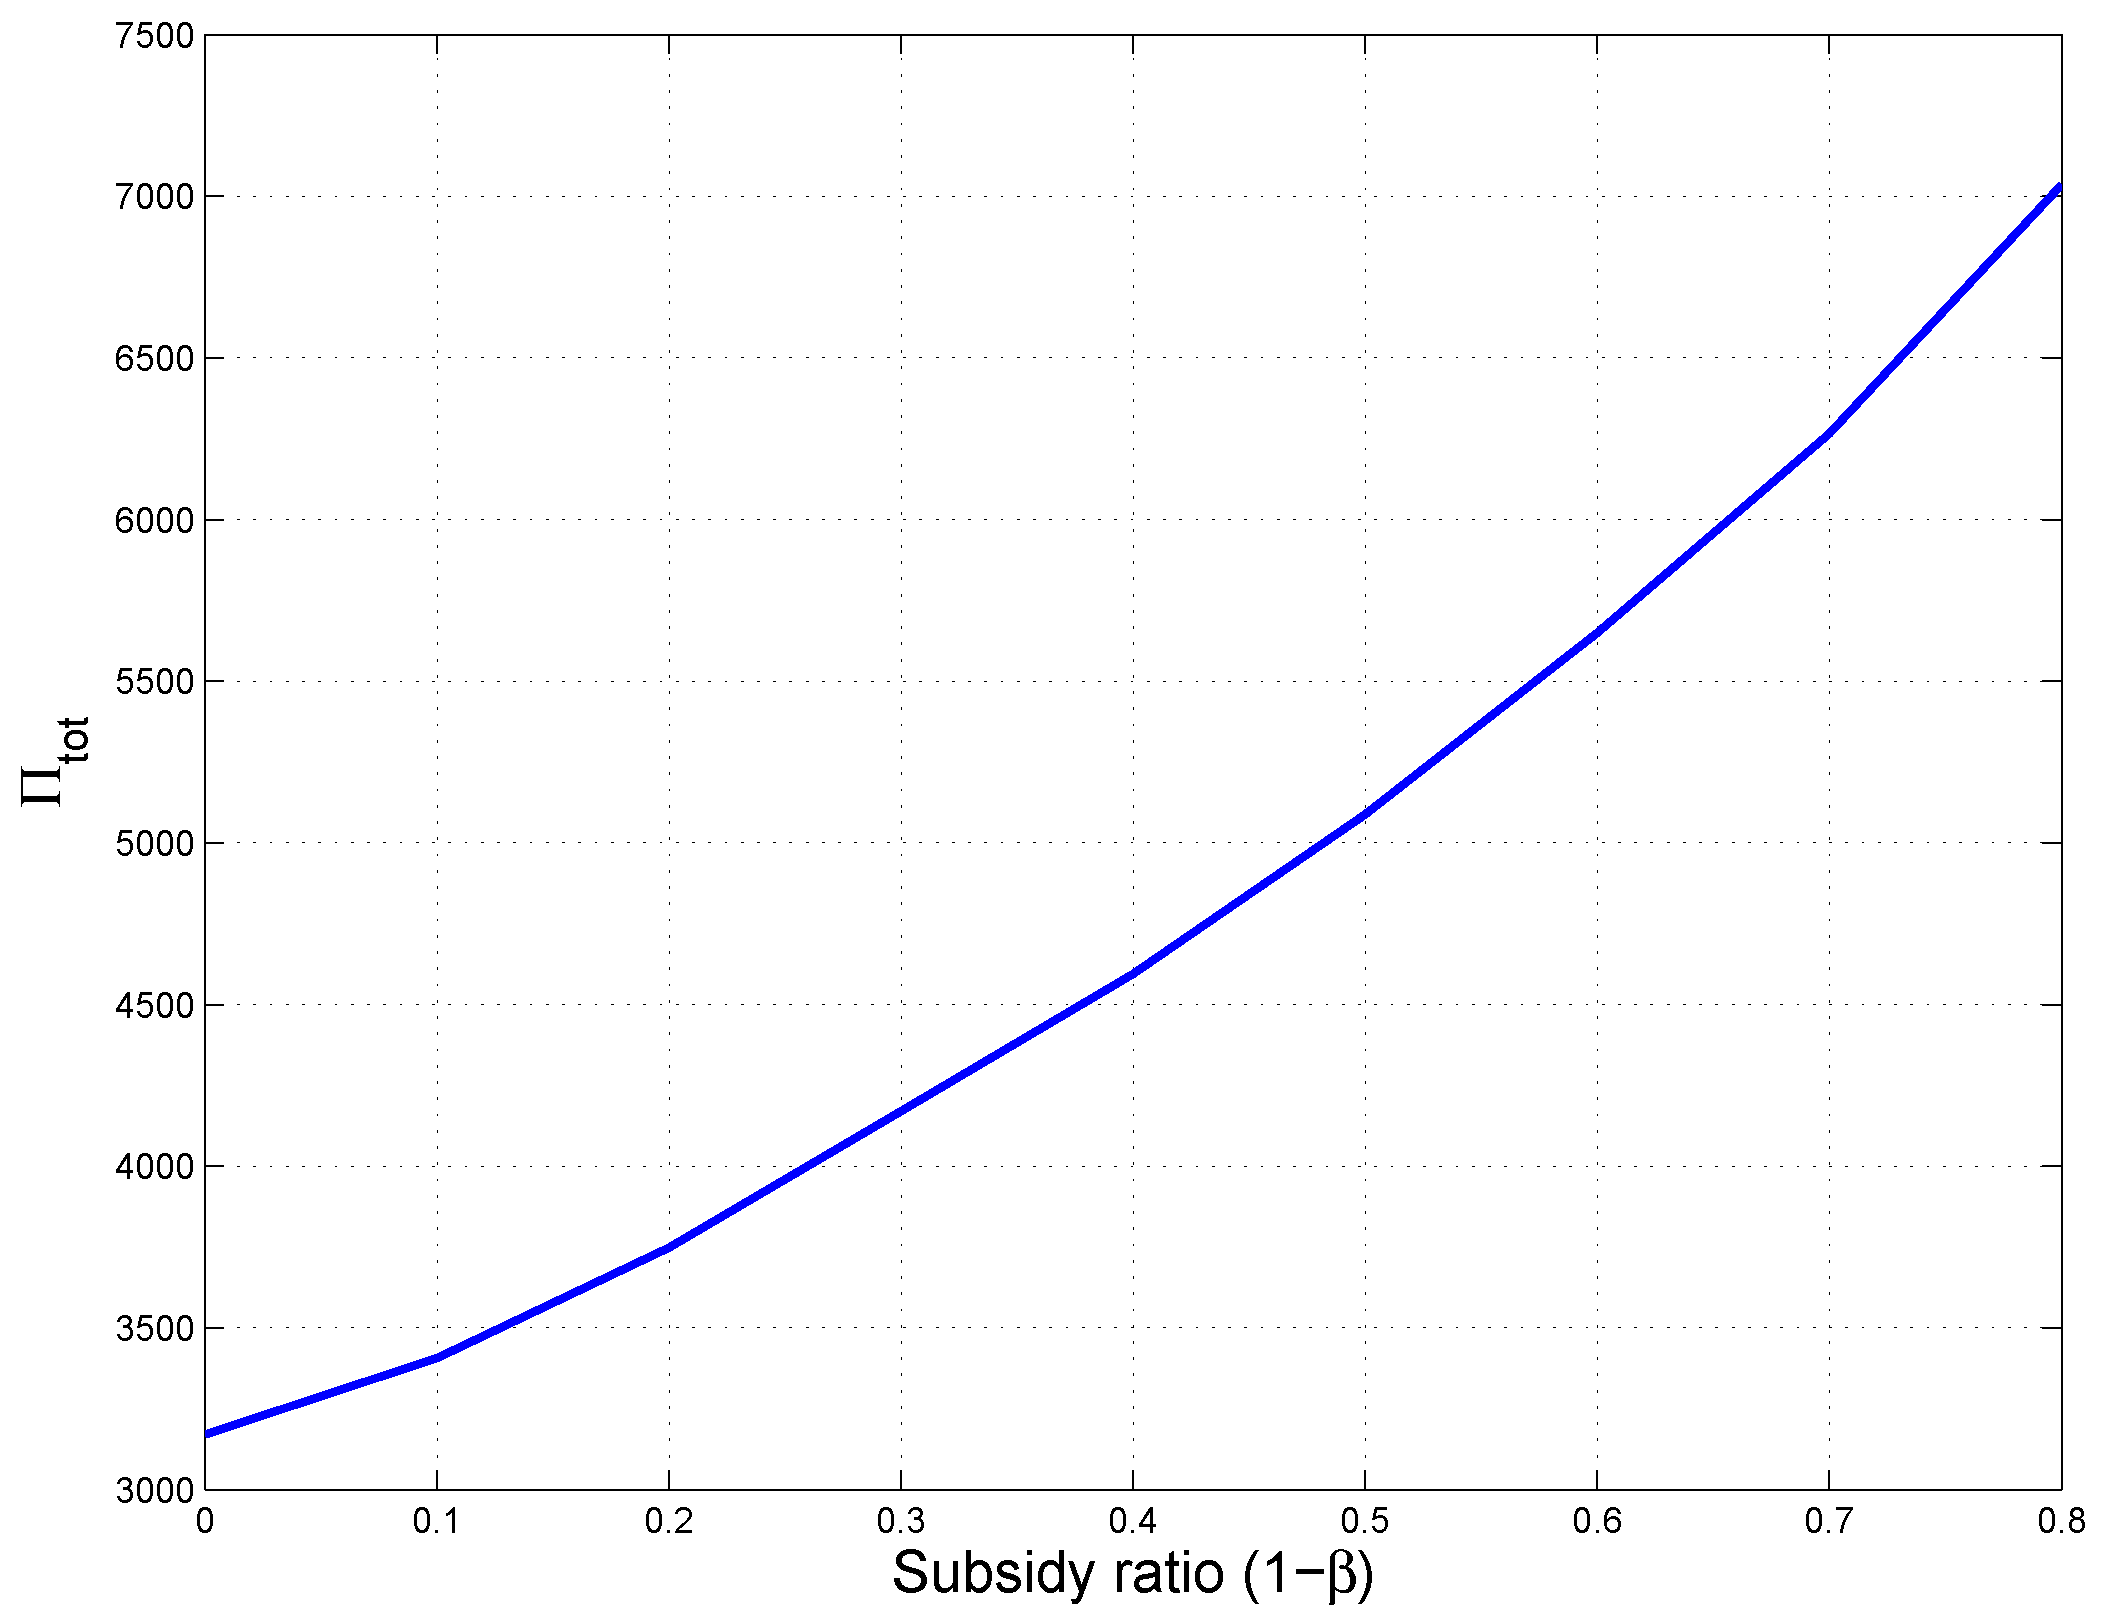
The corresponding total expected revenue is plotted in Figure 4. It demonstrates that the total expected revenue increases with an increase in subsidy ratio, . This is because the optimal price increases as the subsidy ratio rises while the total occupation rate () remains almost constant as observed in Figure 3.
Obviously, from the service provider’s perspective, a higher subsidy ratio would bring in more revenue. Nevertheless, from the policymakers’ perspective, the primary factor that must be considered in determining the provision of universal service is social welfare. Here we then study the optimal solutions to such a non-cooperative Stackelberg game, which is referred to as Stackelberg Equilibrium, on welfare grounds, and investigate how the social welfare is affected by the subsidy under this delay-based revenue-maximizing pricing model.
Defining social welfare as the sum of the utilities of all players in the game, including both types of users, the service provider and the government who provides the Internet service subsidy, the social welfare of the Stackelberg Equilibrium is given by
where
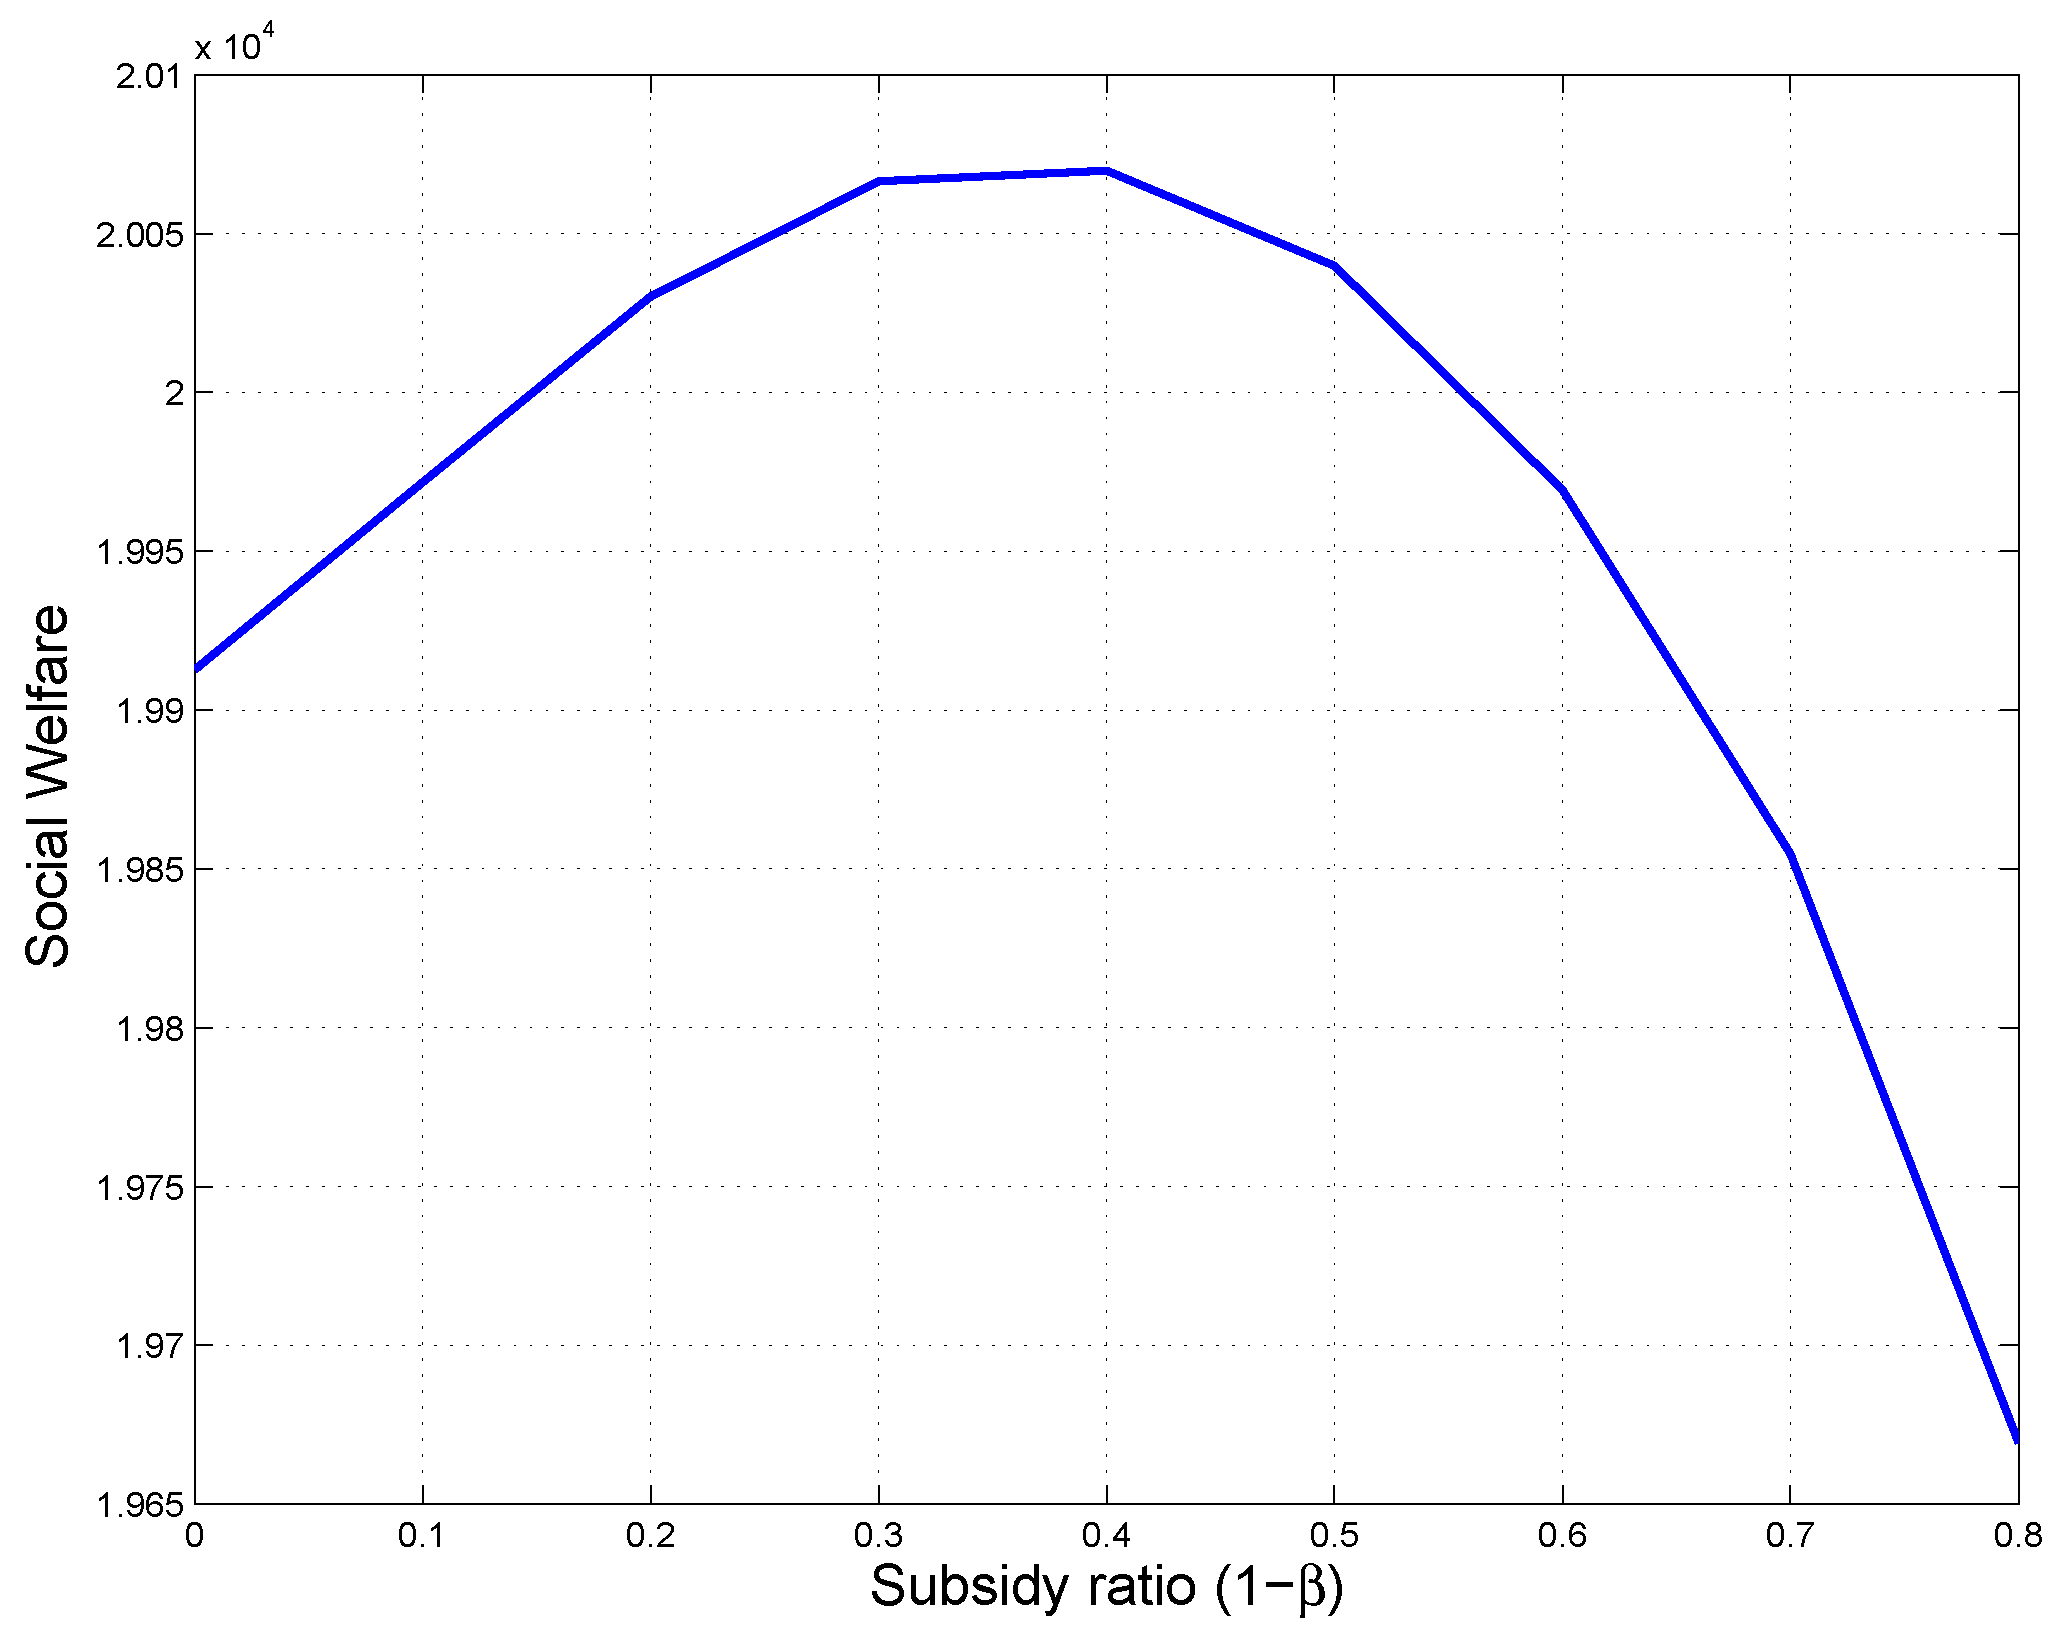
Note that variants with asterisks in Equation (10) are the optimal values of the Stackelberg Equilibrium. In Figure 5, the social welfare of Stackelberg Equilibrium is plotted against the subsidy ratio, . As can be observed, social welfare is a concave function of subsidy ratio and when the subsidy ratio is set as , the social welfare of the Stackelberg game in this example is maximized. Comparing Figure 5 with Figure 4, it can be seen that, with higher subsidy ratios, the service provider could generate more revenue but at the cost of social efficiency.
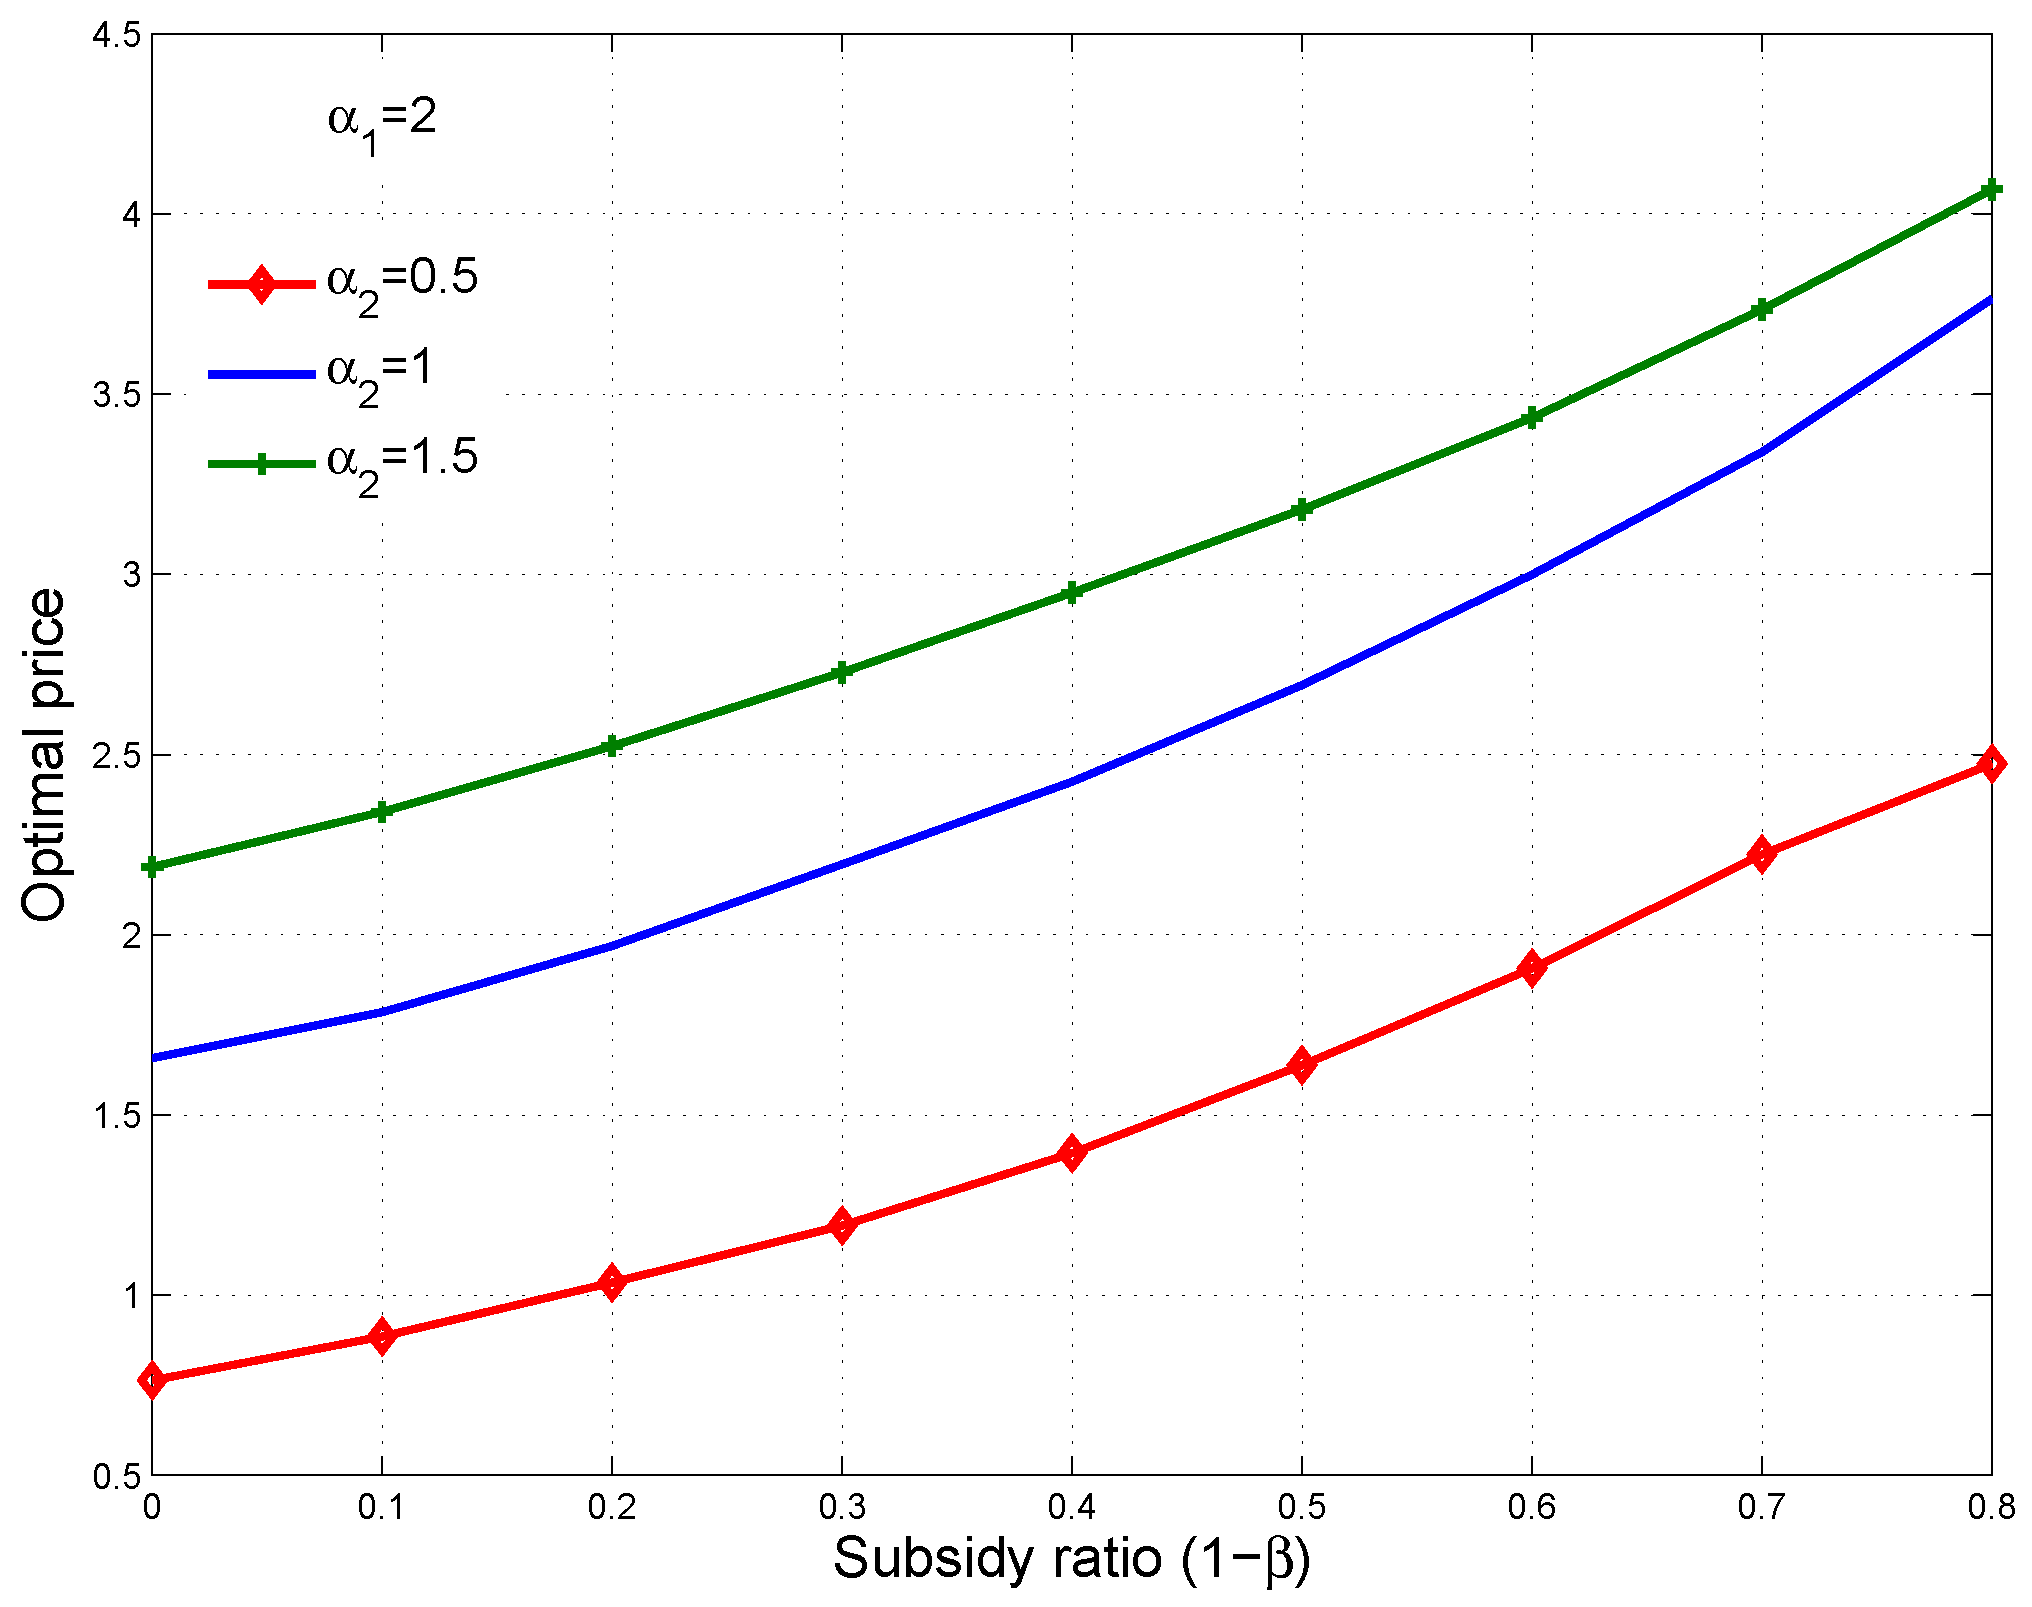
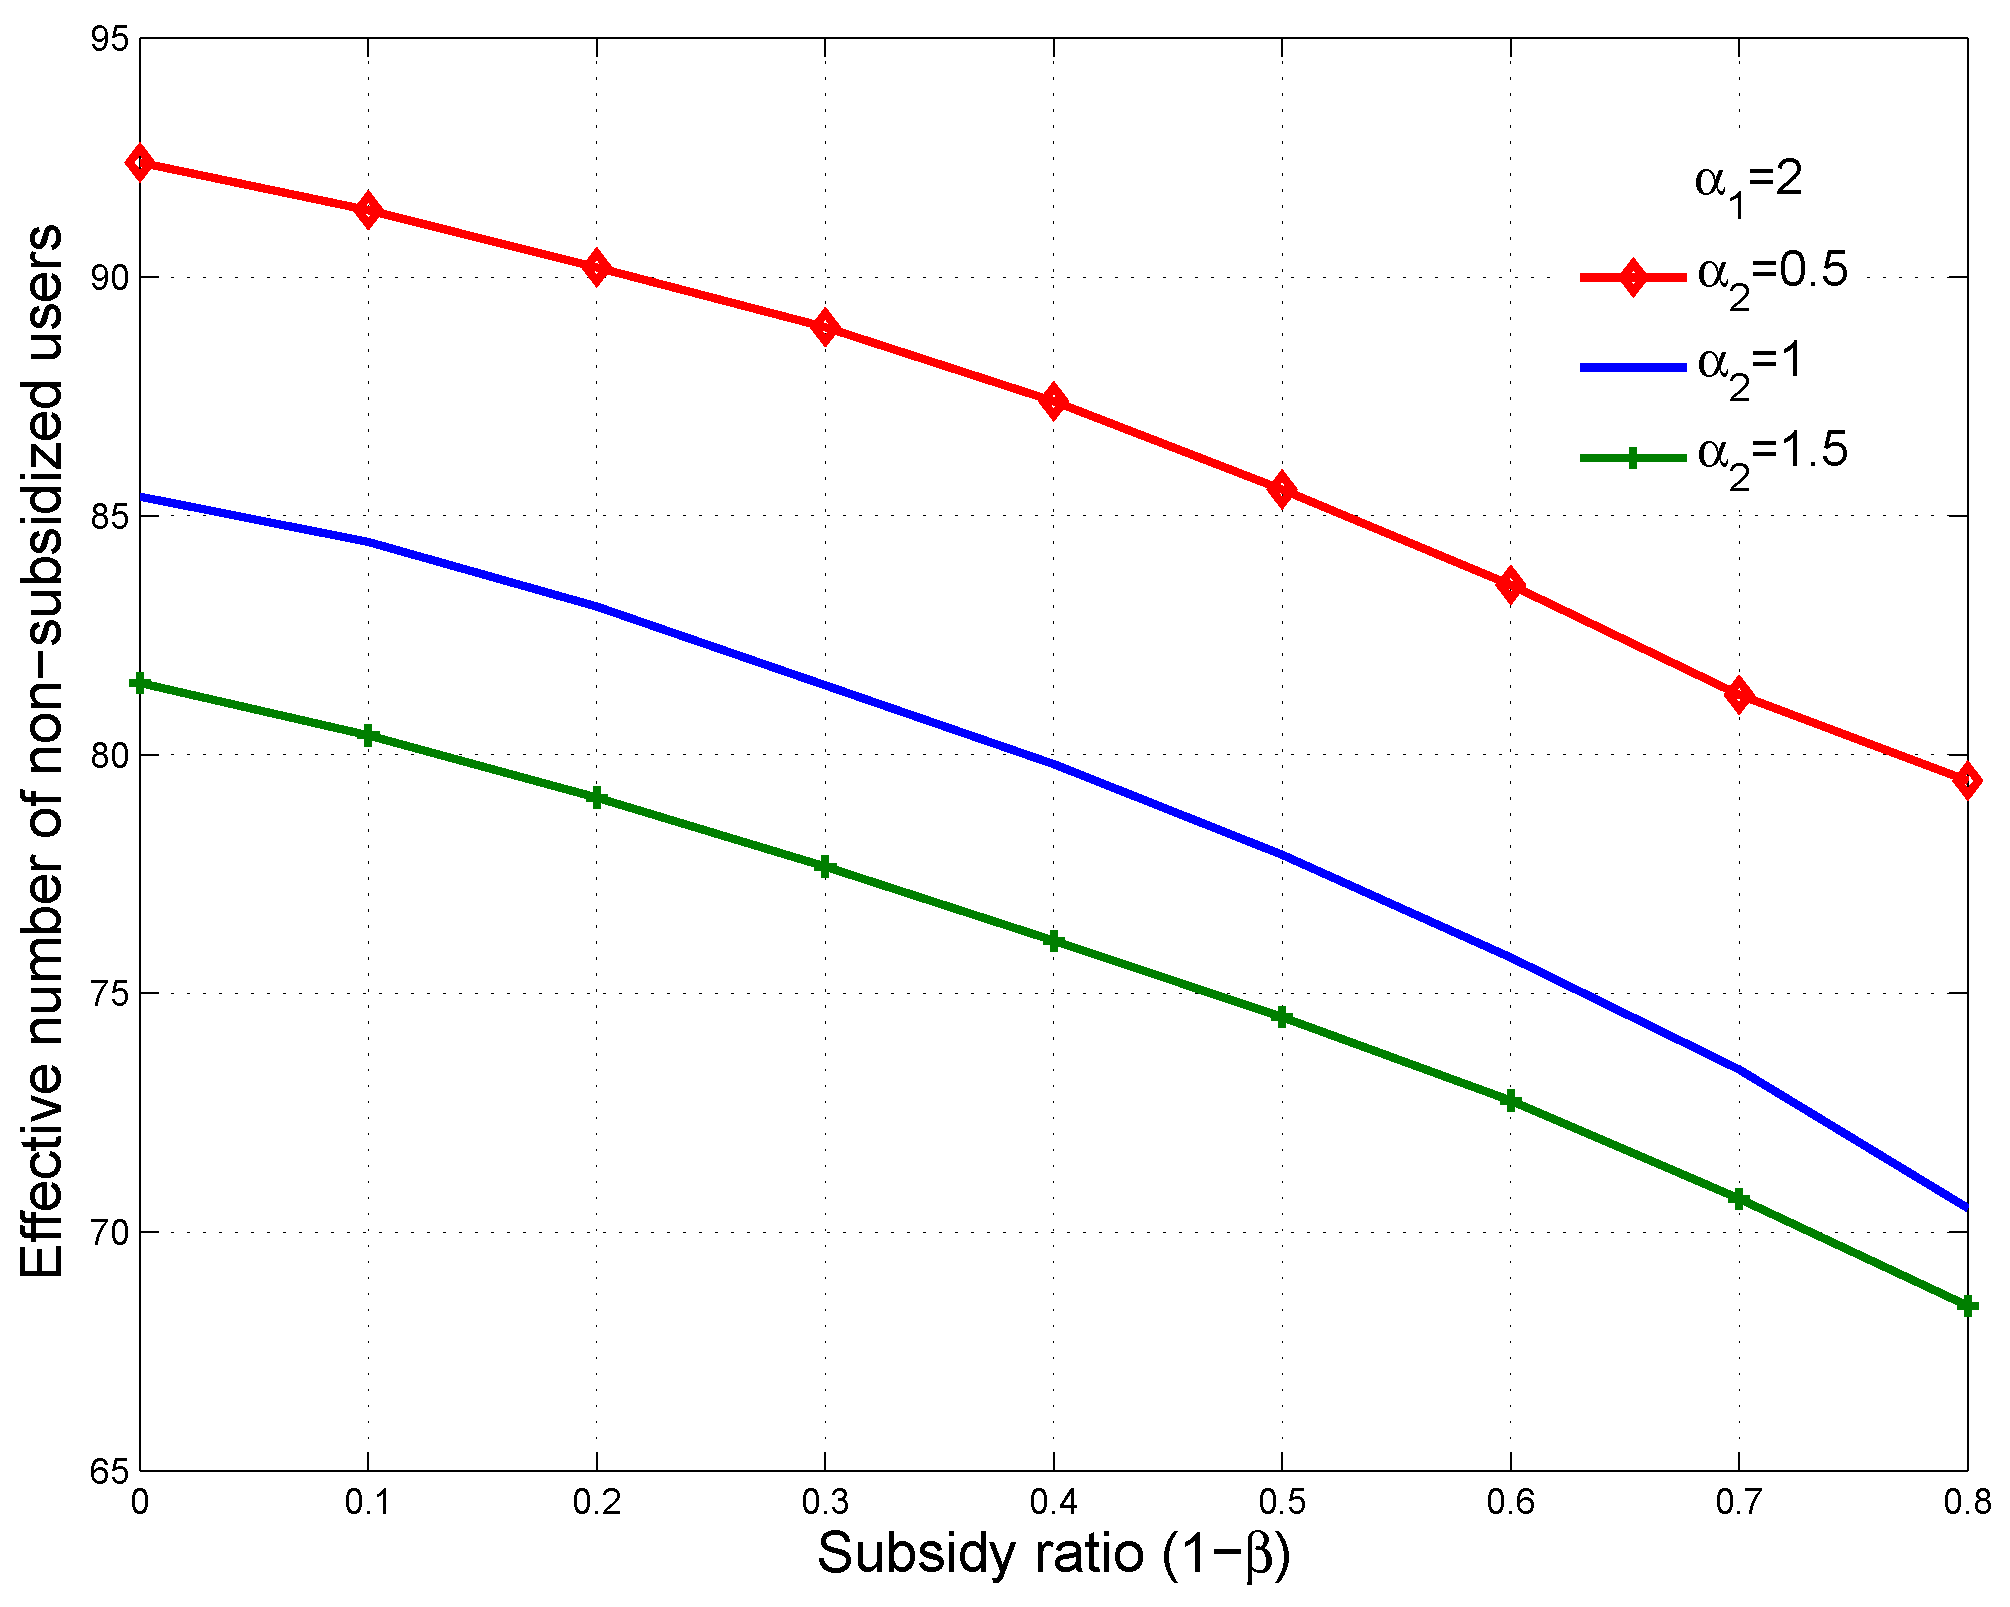
As discussed previously, how the subsidized users value the subsidized service in terms of price and QoS is an important factor in the provision of universal service. It certainly affects the optimal price and optimal subsidy ratio. Since our attention is focused on subsidy and subsidized users, representing how the non-subsidized users value the service based on delay is fixed in the following simulations. Figure 6 illustrates the optimal price that maximizes the service provider’s revenue with for different , which indicates how the subsidized users value the service based on delay. A greater means the subsidized users are more sensitive to packet delay. As can be seen, for a given subsidy ratio, the optimal price is higher when the subsidized users are more delay-sensitive. This is reasonable since a higher price leads to less non-subsidized users joining the system, as shown in Figure 7, which results in a higher QoS for the low-priority class for the subsidized users. Consequently, the higher QoS of the low-priority class would attract more subsidized users as depicted in Figure 8.
Figure 9 shows that, for a given subsidy ratio, more delay-sensitive subsidized users could bring in more revenue for the service provider. In other words, although the service provider would loss some non-subsidized users due to a higher price, more subsidized users could be attracted by the higher QoS of their low-priority class.
Figure 10 further compares the social welfare of Stackelberg Equilibrium for different . As can be seen, the social welfare maximizing subsidy ratio drops if the subsidized users are more delay-sensitive. It implies that, setting subsidy ratio without taking into consideration how the subsidized users value the subsidized service in terms of price and QoS would result in a loss in social efficiency.
According to game theory, non-cooperation does not in general lead to a socially efficient situation, in which the social optimum welfare is obtained from a scenario where there is a central authority. In the next section, we will discuss the price selection problem from a social welfare maximizing perspective as a benchmark to evaluate the efficiency of the delay-based revenue maximization pricing model presented in this section.
5. Social Welfare Maximization
Theoretically, each player in a non-cooperative game pursues his own self-interest and acts to achieve his own selfish objective. The divergence of players’ interests leads to a loss in social welfare. Thus, the optimal solution of the non-cooperative Stackelberg game presented in the previous section might not be a socially optimal solution. Ideally, the social welfare can be maximized if there is a central authority who is able to set the service price and the subsidy ratio by taking into account the utilities of all players in the system, including both types of users, the service provider and the government who provides the Internet service subsidy. We refer to such an ideal situation as Social Optimal Situation. As defined in Section 4, social welfare is given by:
To achieve the social optimum welfare, the central authority, who takes an overall view of social welfare, needs to solve the following optimization problem:
where
We apply the Lagrange multipliers method presented in Section 4 to solve this optimization problem. Similarly, the optimal solution can be found by solving the following five equations in the five unknowns :
where and are Lagrange multipliers and the gradient vectors are:
where
Approximately optimal solutions to the delay-based social welfare maximization problem in Equation (13) with the same assumptions used in the example given in the previous section are calculated.
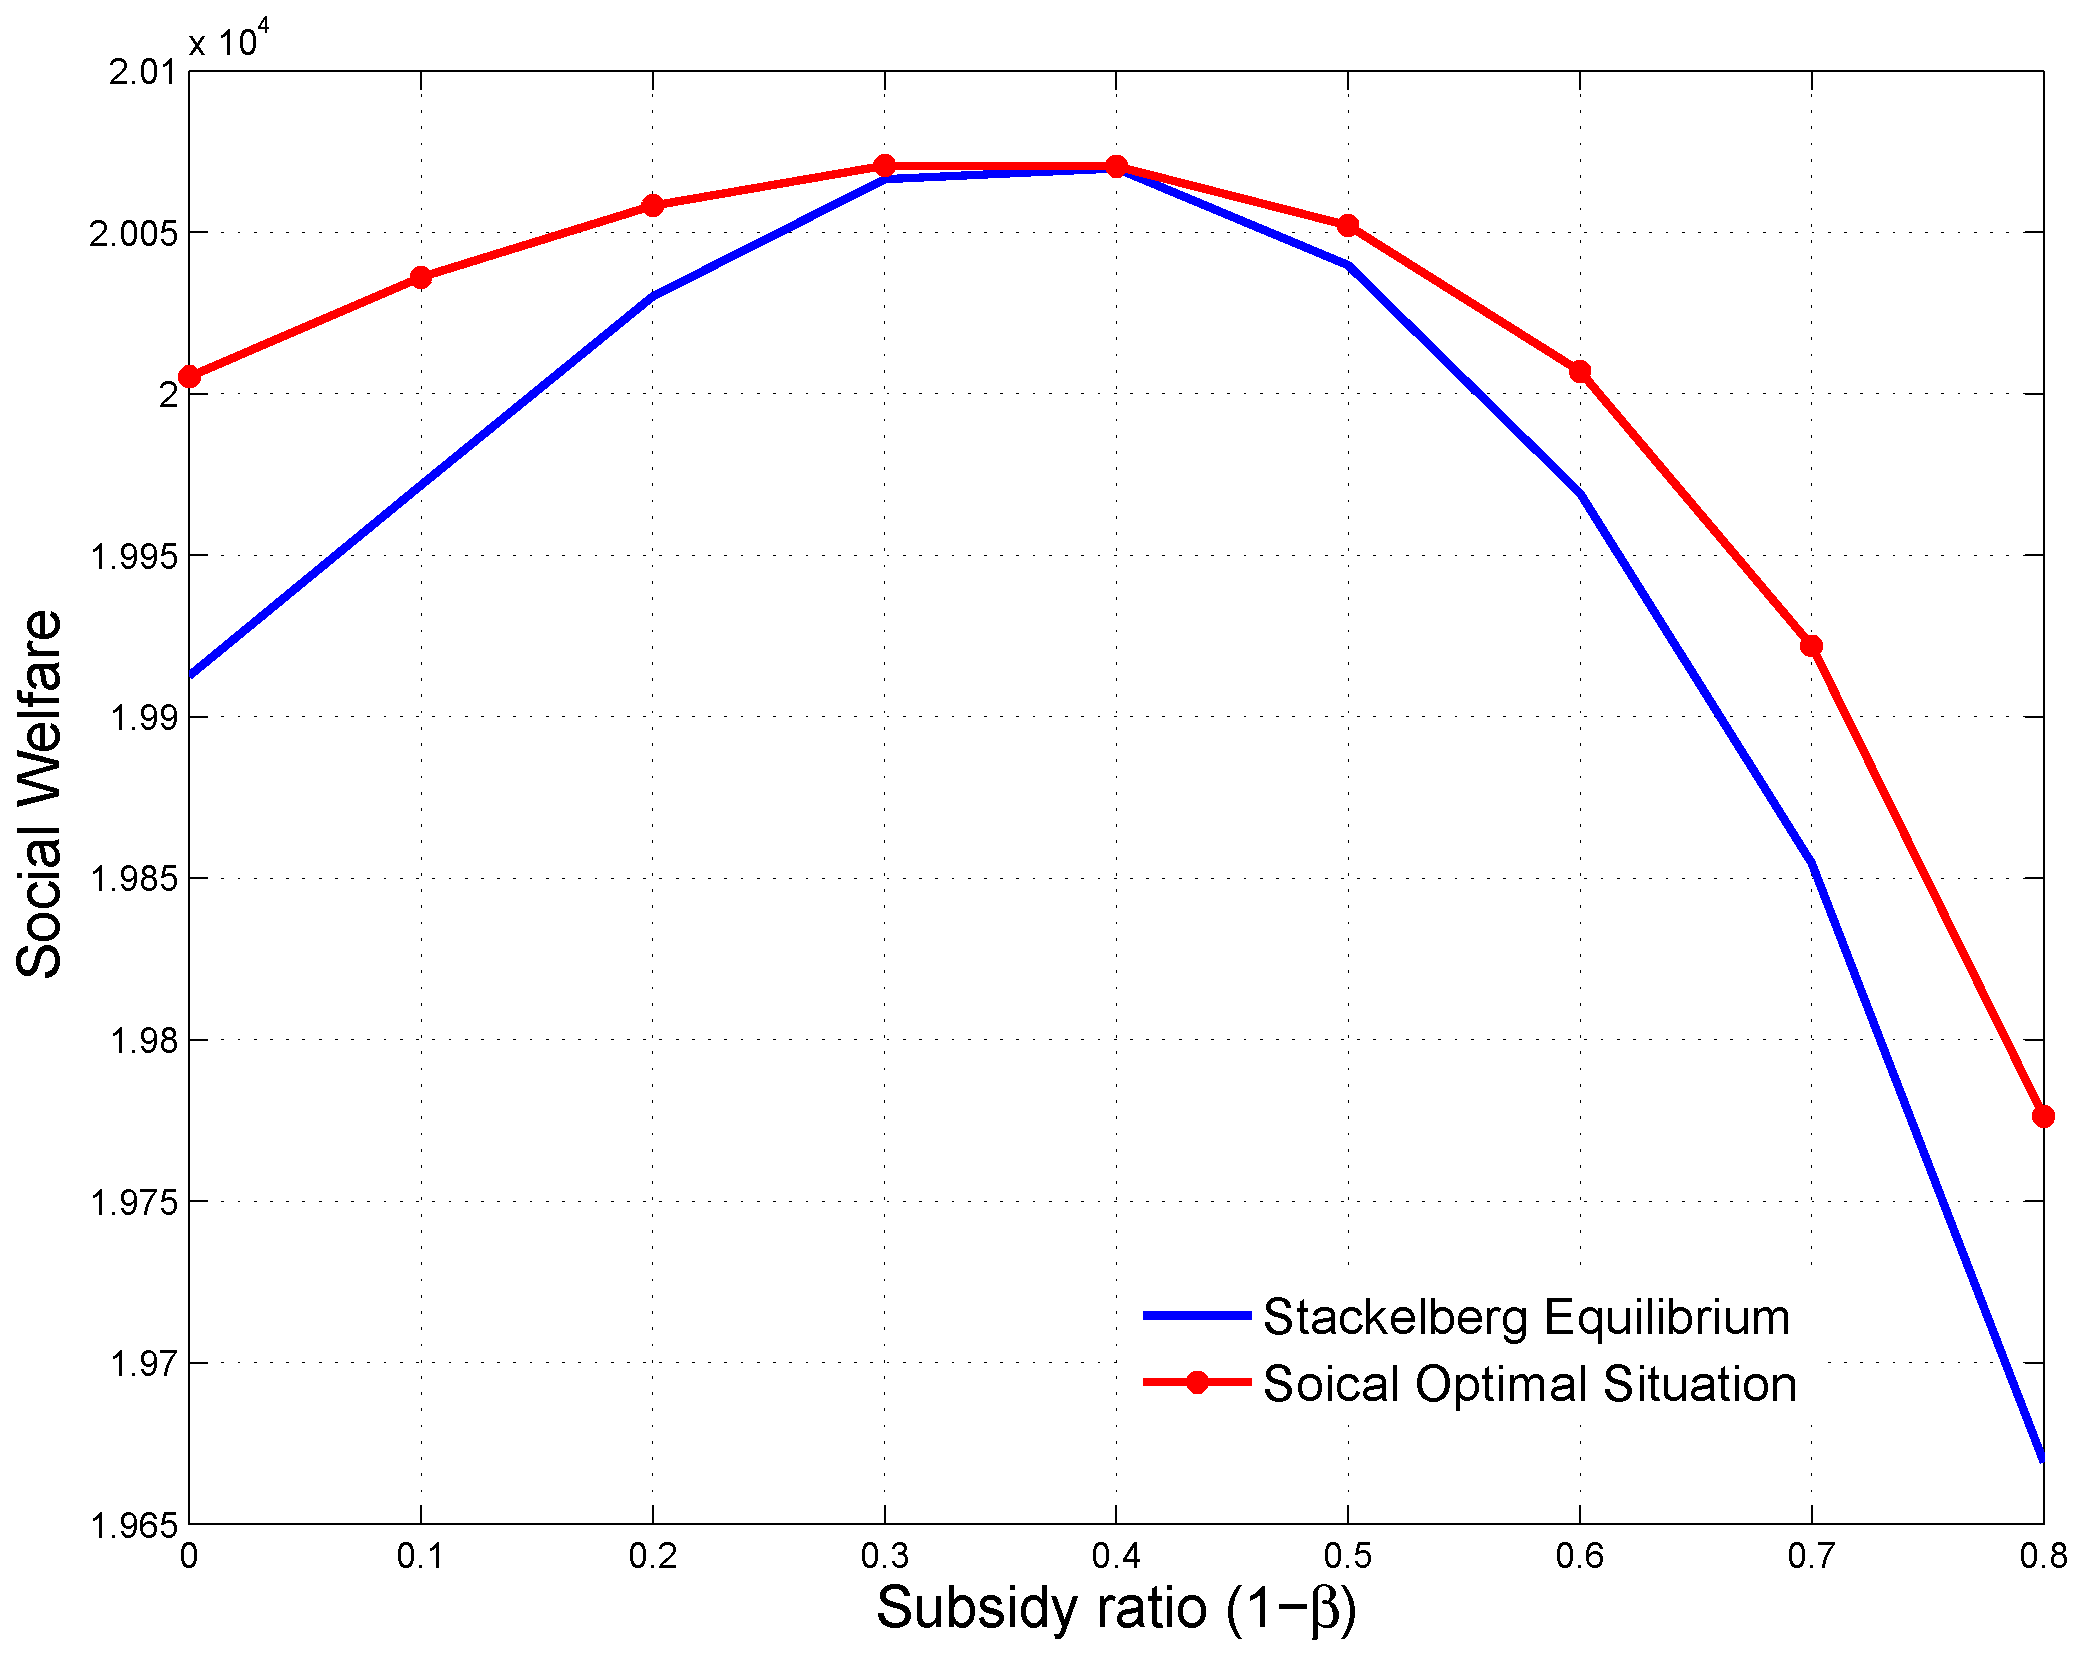
Figure 11 compares the social welfare of Stackelberg Equilibrium to the benchmark obtained from the Social Optimal Situation. As can be observed, the social welfare of Social Optimal Situation is also a concave function of the subsidy ratio, , and it shares the same optimal subsidy ratio of 0.4 with the social welfare of Stackelberg Equilibrium. In addition, there is a bigger difference in the social welfare between revenue maximization and social welfare maximization when the subsidy ratio is relative lower or higher. This suggests that, without properly setting the subsidy ratio, in such a shared resource allocation system with a service and price differentiation scheme that takes into consideration the willingness-to-pay of both types of users, the selfish interests in the Stackelberg game lead to social welfare losses.
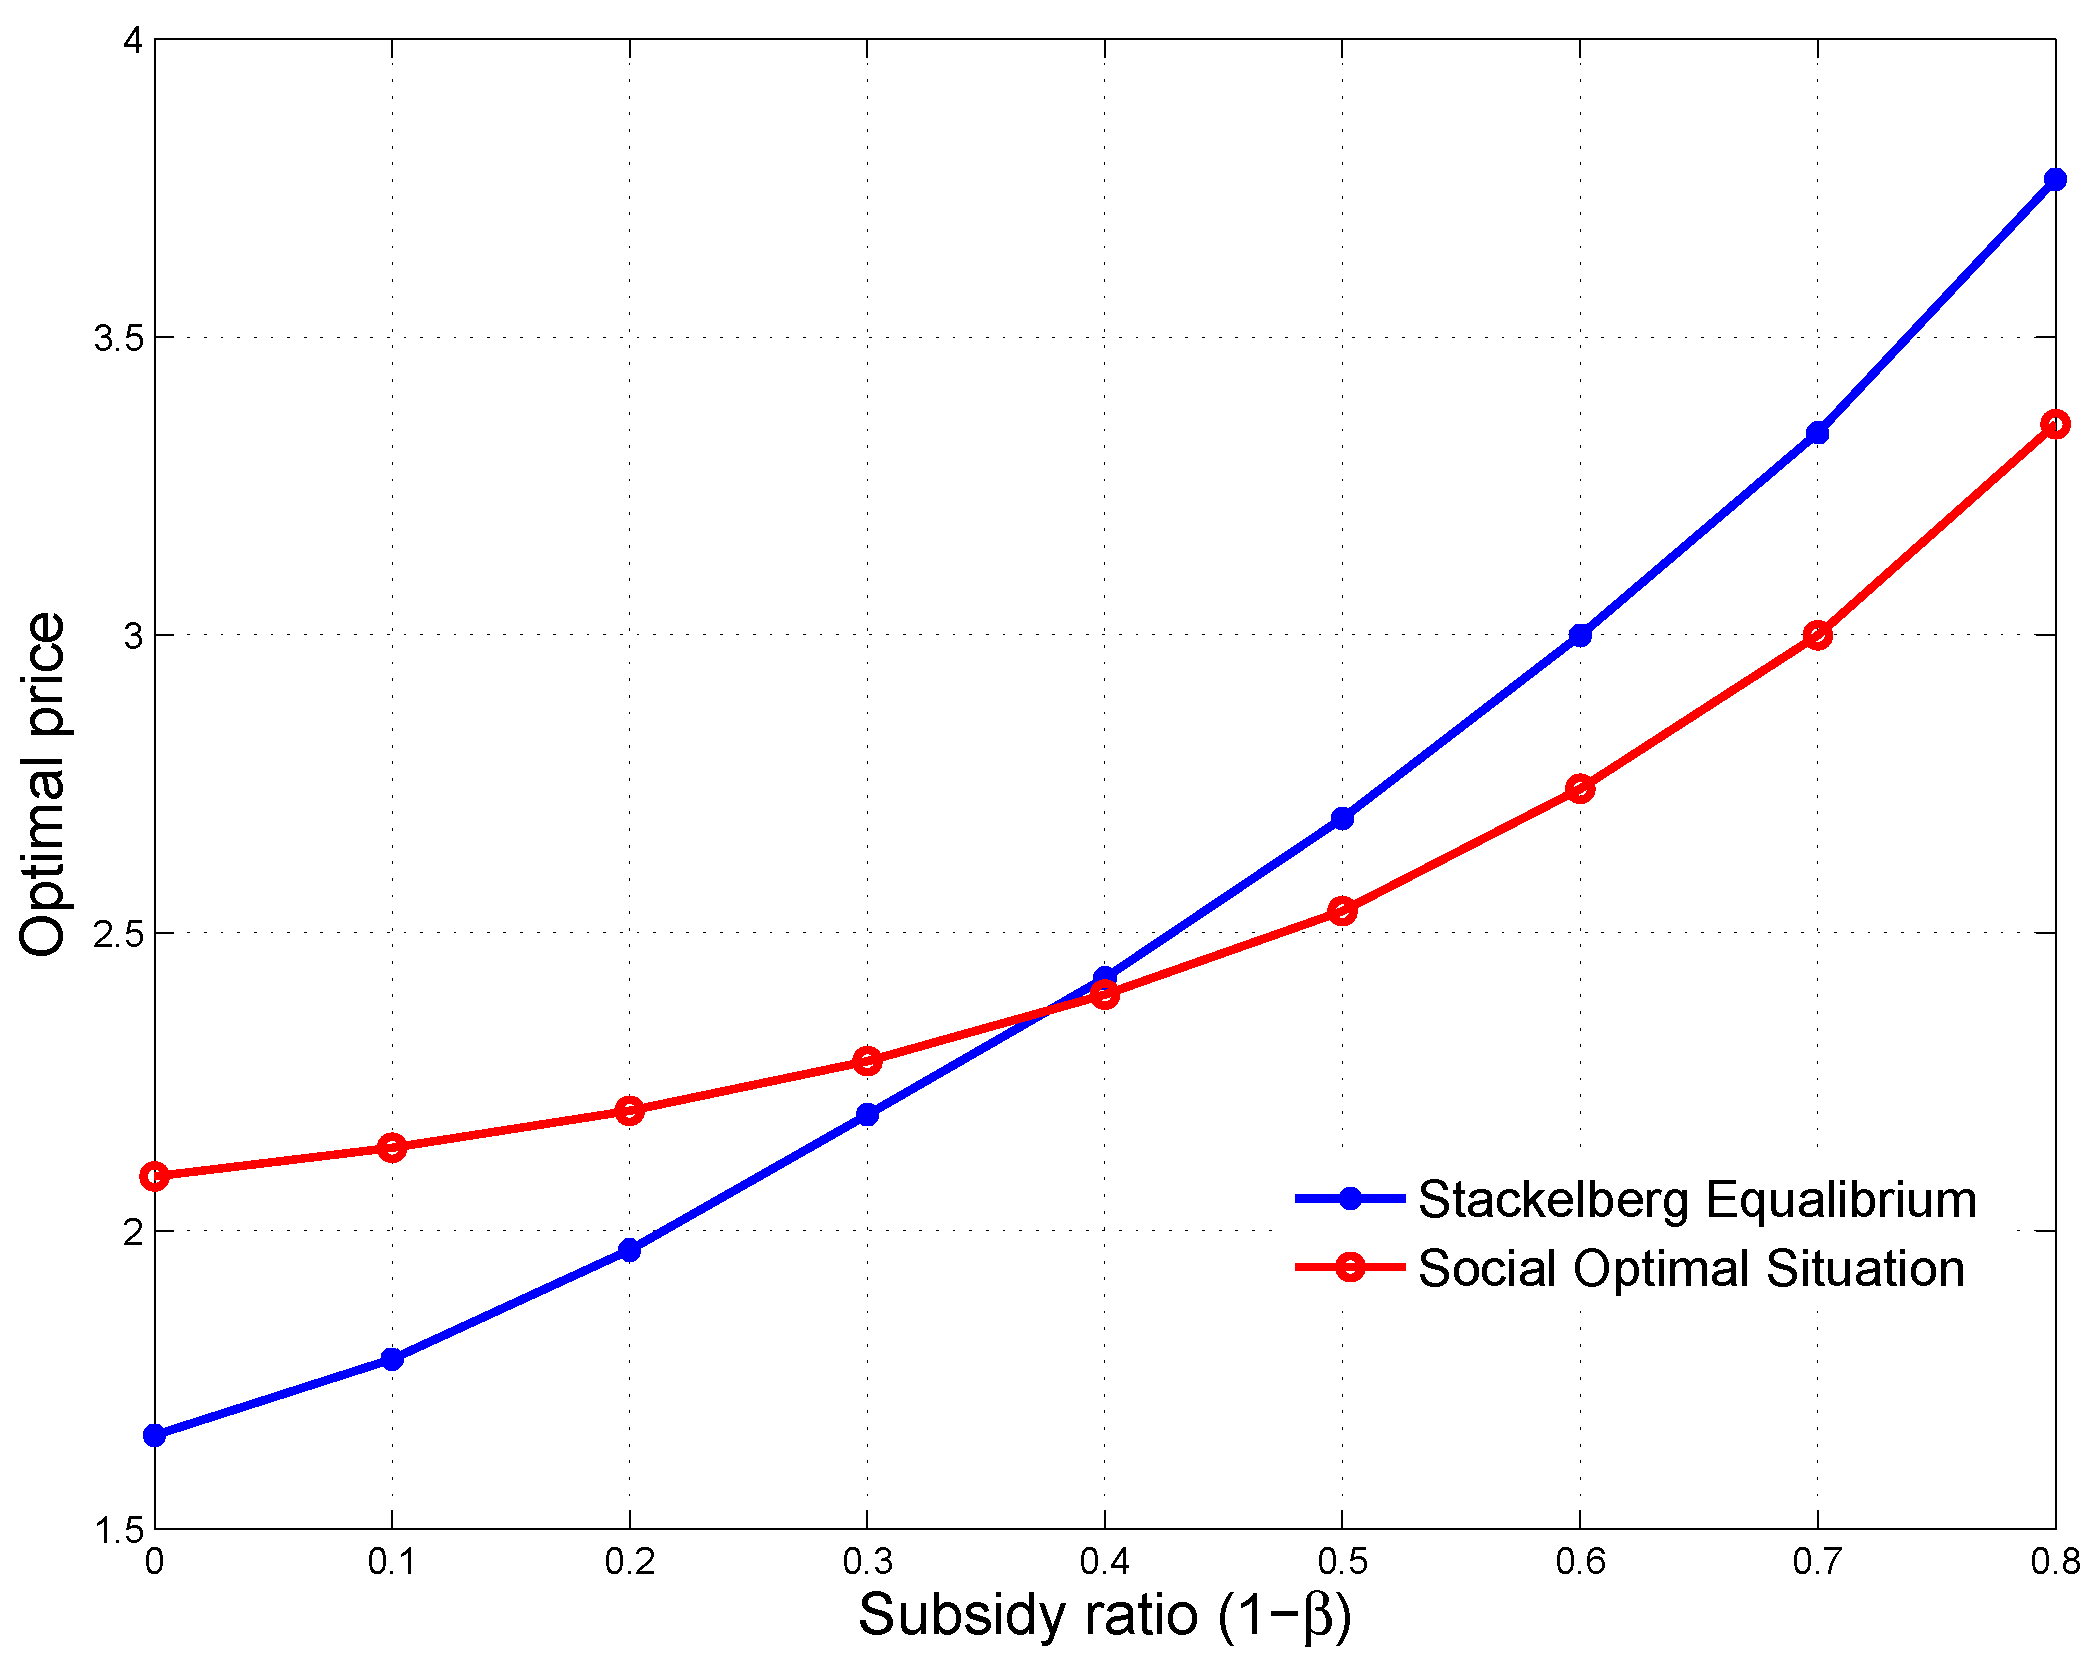
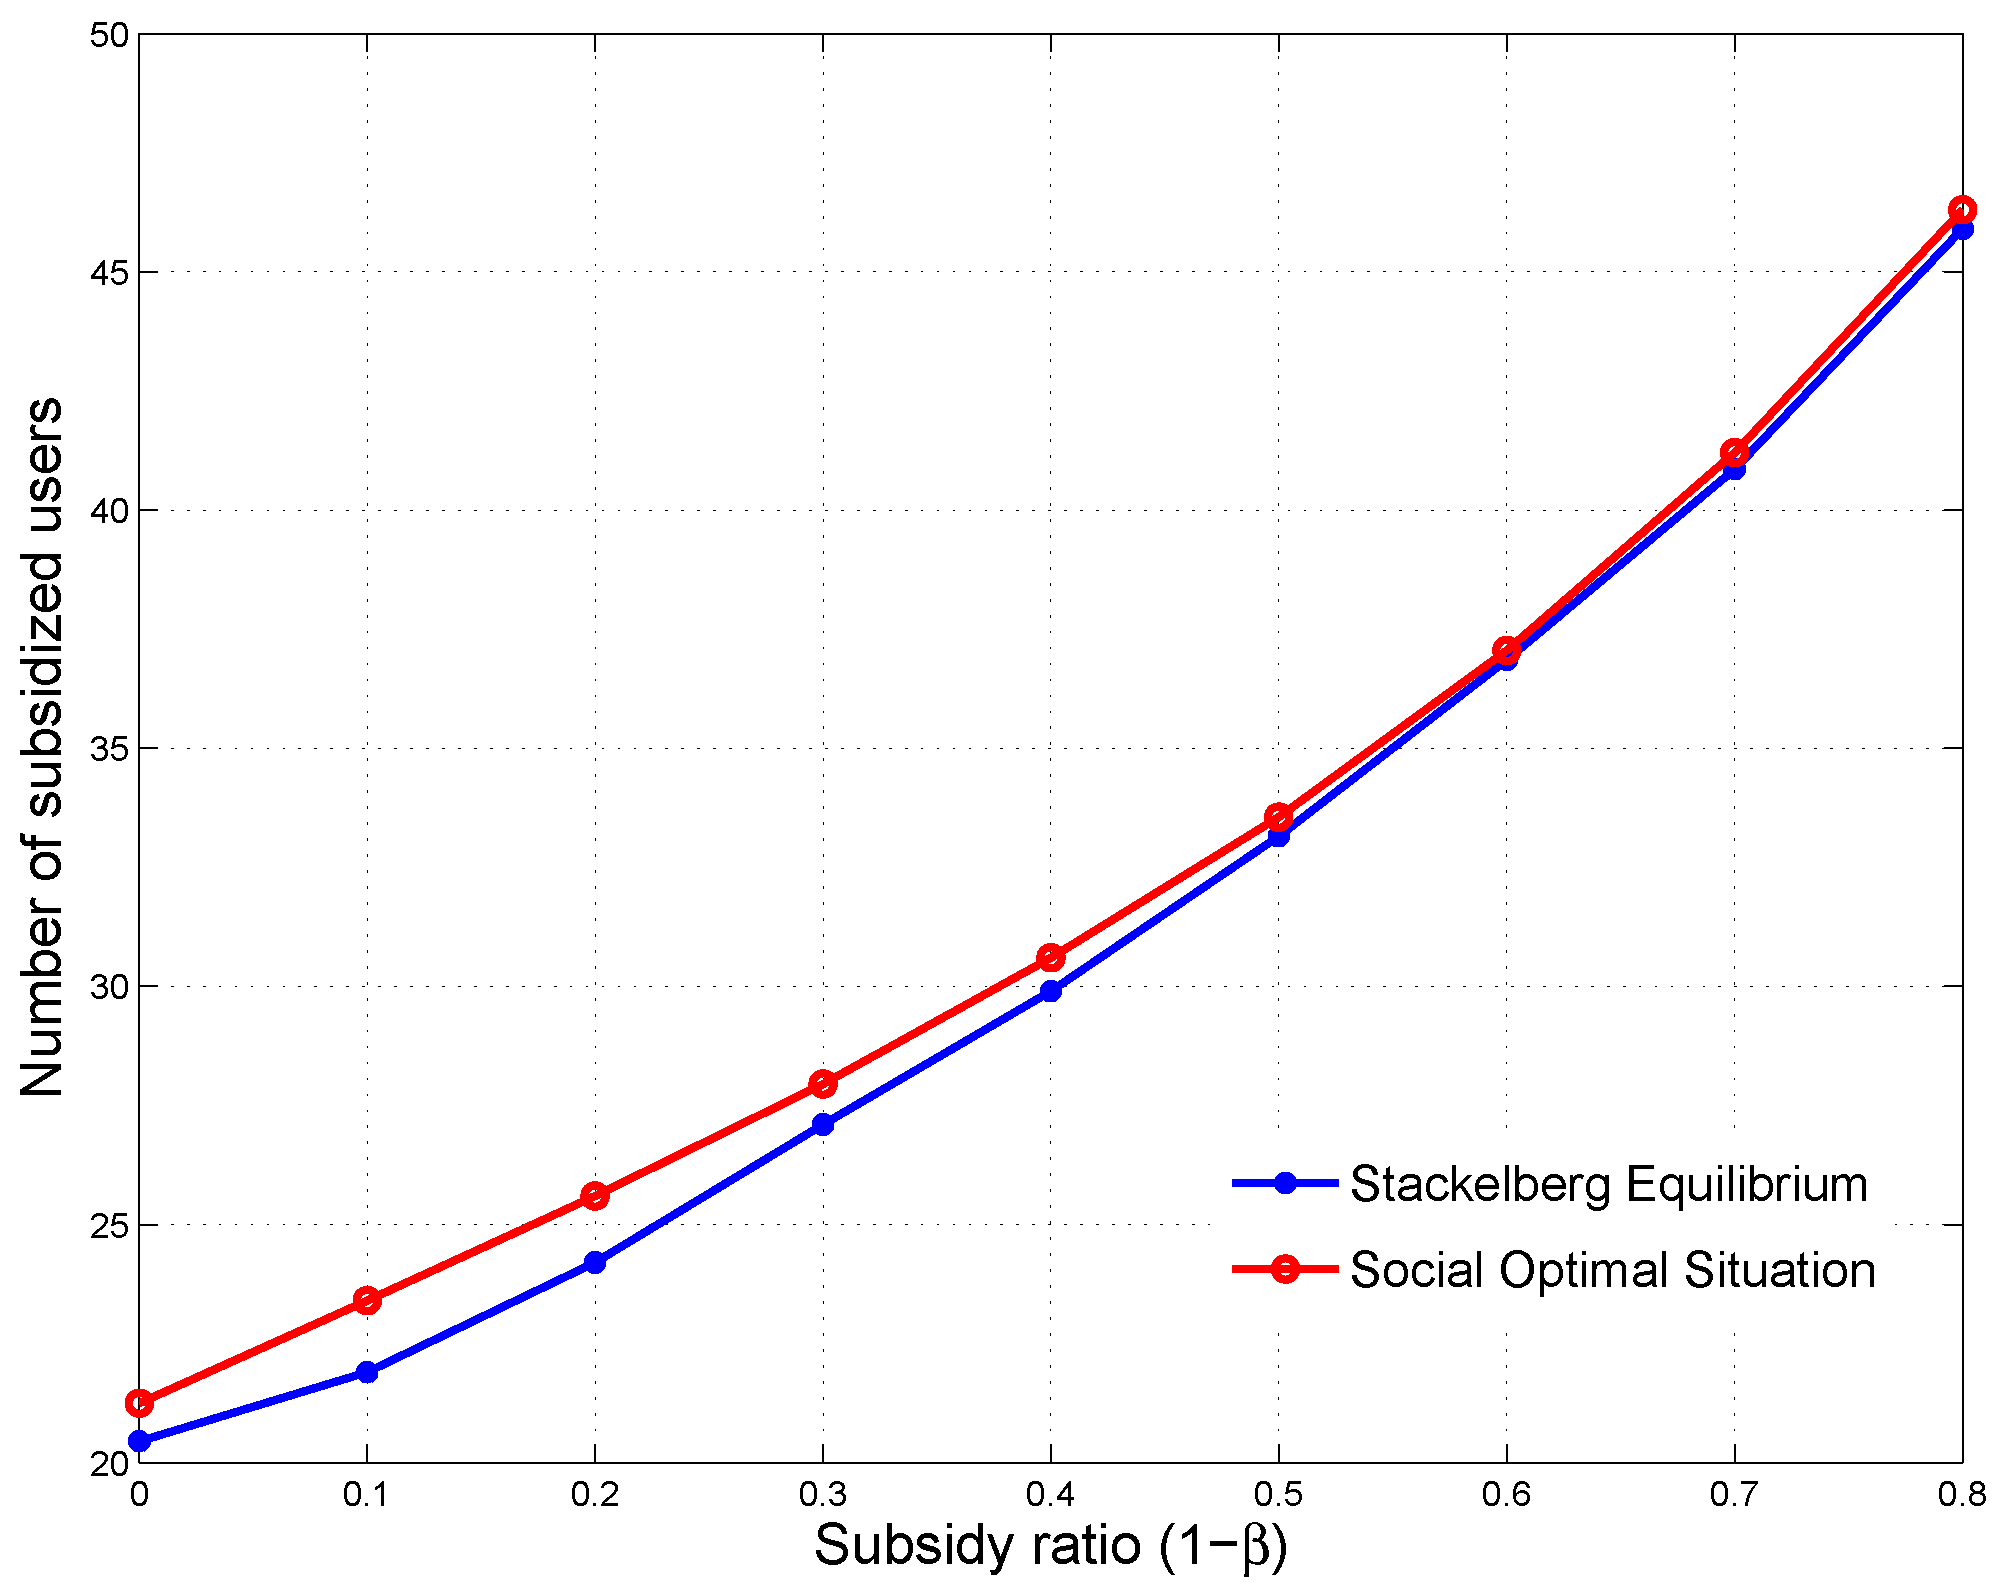
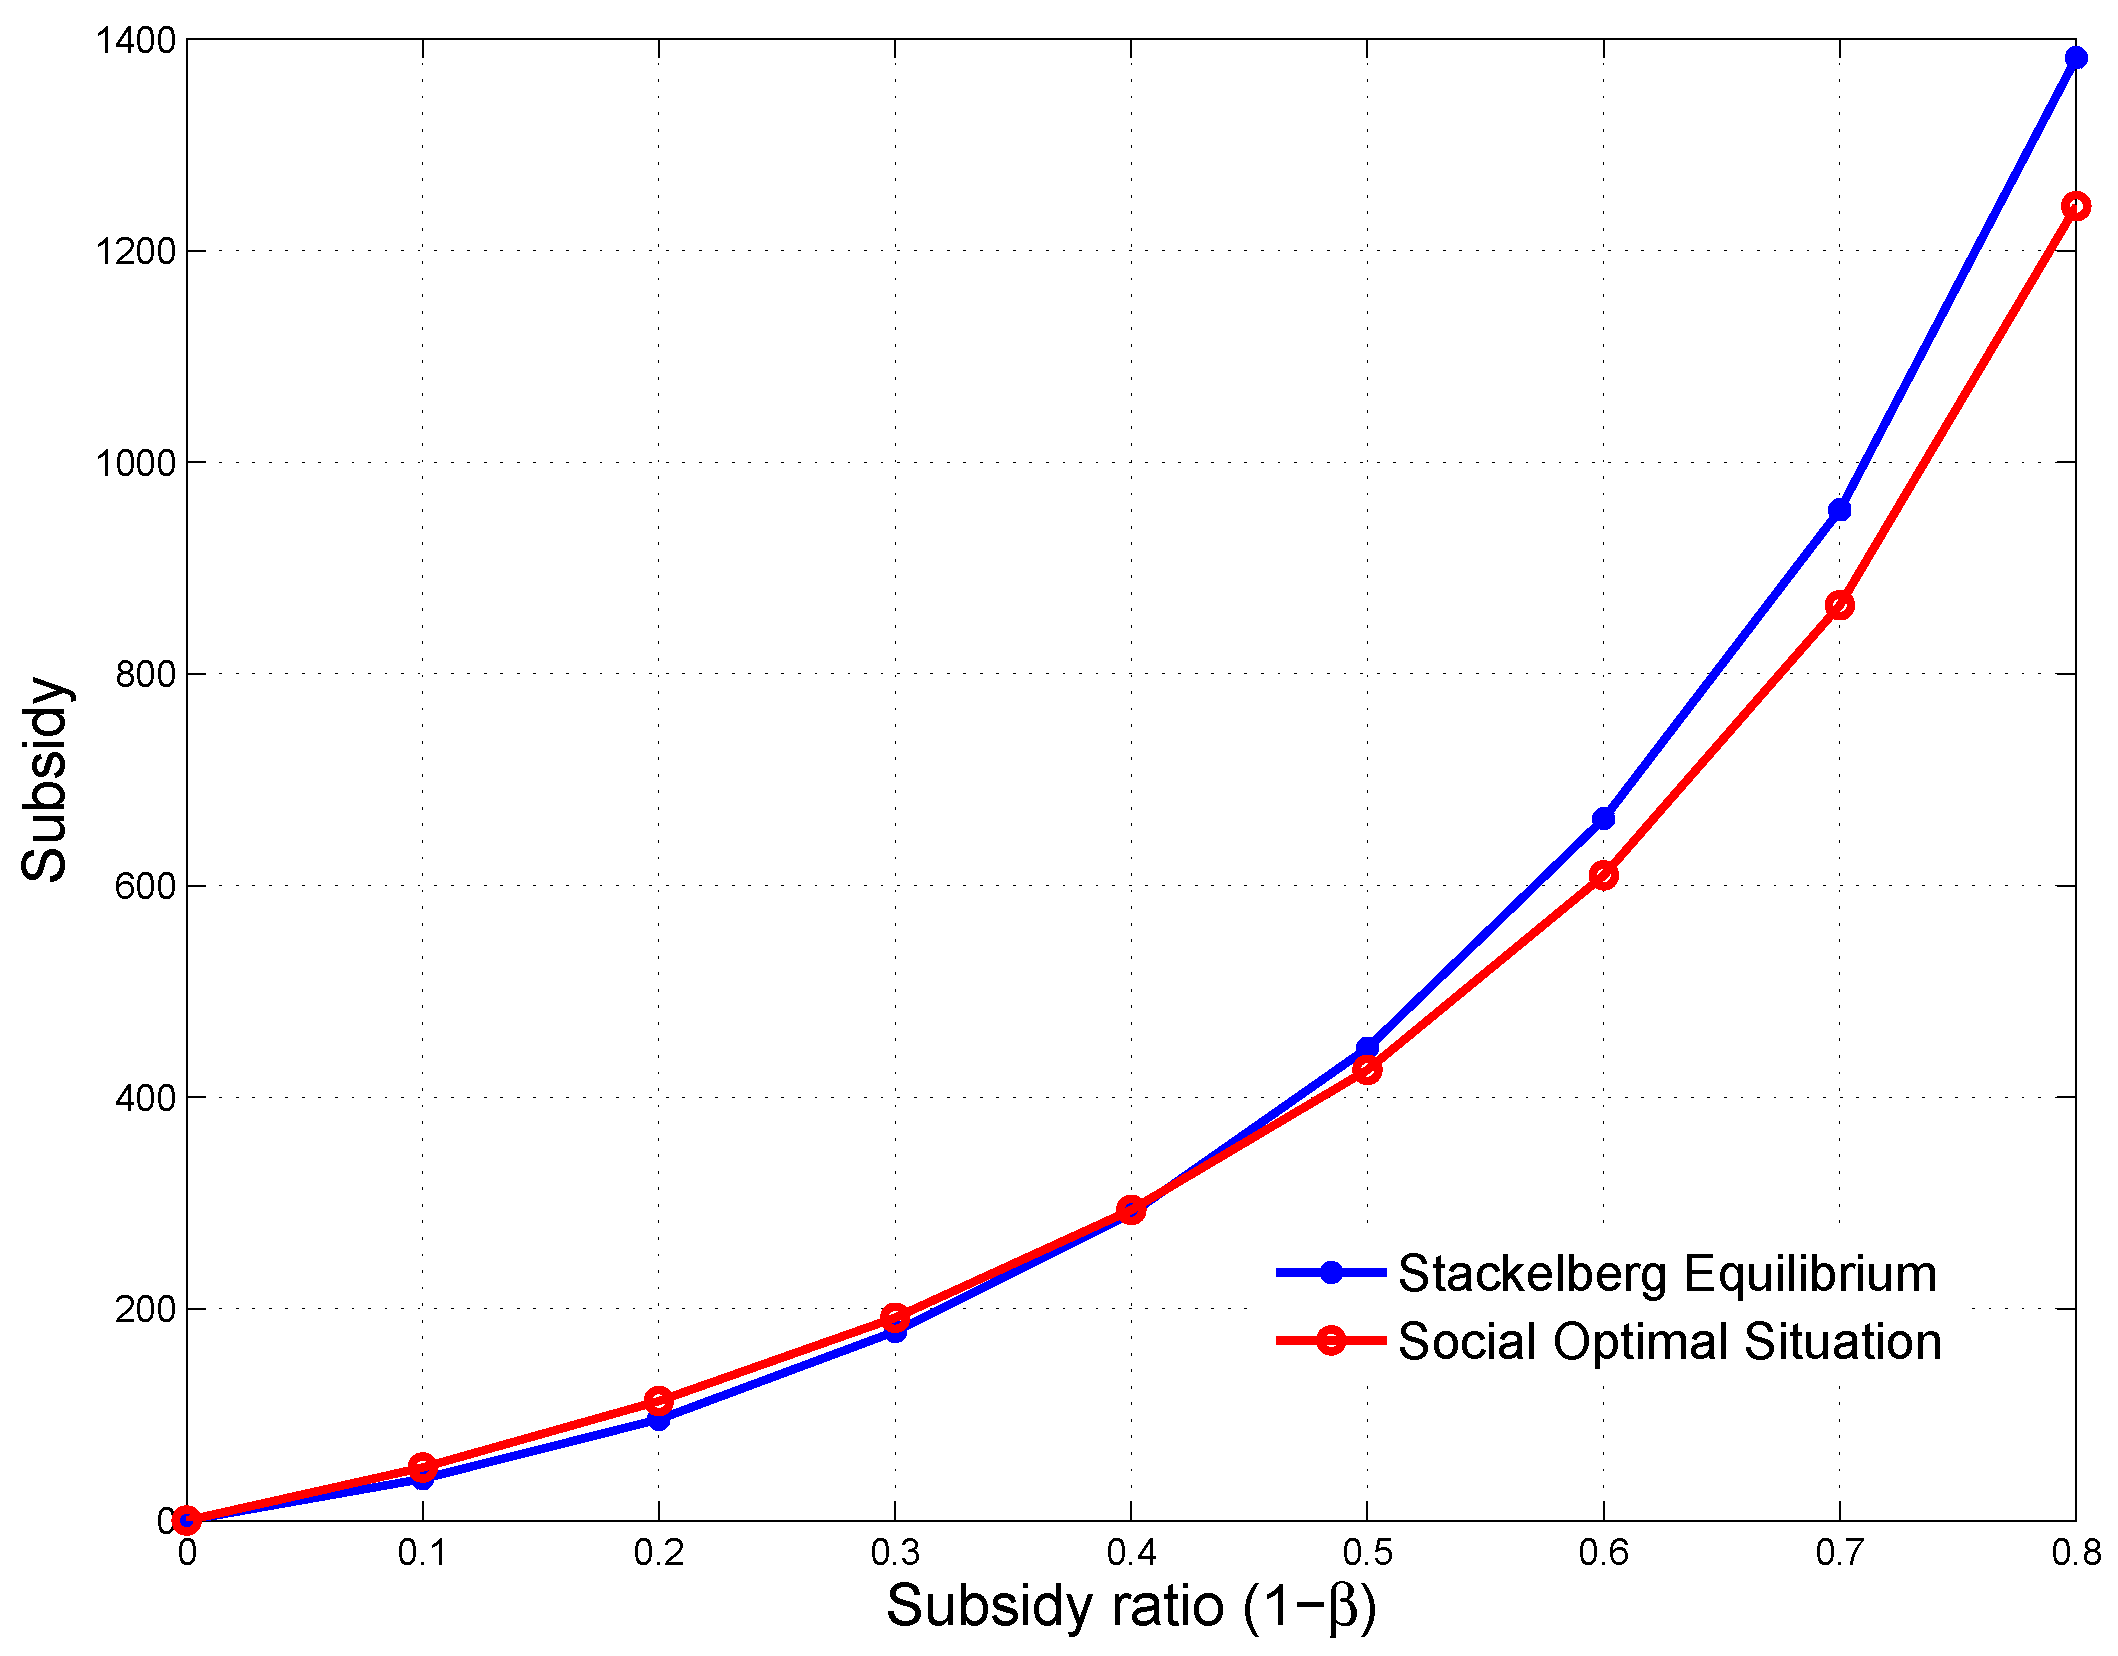
Figure 12 compares the optimal price between revenue maximization and social welfare maximization with and . It shows that, for higher subsidy ratios, the optimal social welfare maximizing price is lower than the optimal revenue-maximizing price. Consequently, more non-subsidized users utilize the service as shown in Figure 13, which results in a worse QoS for the lower priority class. However, the corresponding number of subsidized users is almost unchanged from that obtained from Stackelberg Equilibrium as shown in Figure 14. Meanwhile, the service provider’s revenue decreases as shown in Figure 15 while the subsidy cost decreases due to the lower social welfare maximizing price as shown in Figure 16. It implies that, for higher subsidy ratios, with the social welfare maximizing prices, despite higher total social welfare and lower subsidy costs, non-subsidized users instead of subsidized users benefit in terms of the number of users being served.
On the other hand, for lower subsidy ratios, the optimal social welfare maximizing price is higher compared to the optimal revenue-maximizing price as shown in Figure 12. Consequently, the corresponding number of non-subsidized users reduces as shown in Figure 13, which results in a better QoS for the lower priority class. This is why, with the optimal social welfare maximizing price, the number of subsidized users rises slightly as shown in Figure 14. Moreover, the social welfare maximizing prices generate more revenue for the service provider as shown in Figure 15 while the subsidy required only increases slightly as shown in Figure 16. It indicates that, as compared to the revenue maximization setting, for lower subsidy ratios, although the higher social welfare maximizing prices results in a lower number of non-subsidized users, more subsidized users will utilize the service and more revenue will be generated without requiring more subsidy.
Furthermore, the results suggest that, in such a resource sharing system with service differentiation and pricing discrimination, under the optimal subsidy ratio of 0.4, the corresponding optimal solutions, i.e., the optimal price, the expected numbers of subsidized and non-subsidized users, the expected revenue and the expected subsidy cost, to the Stackelberg Equilibrium of revenue maximization setting corresponds to those obtained from the Social Optimal Situation. It implies that the subsidy ratio can be used as a tool to induce the revenue maximizing service provider to set a price that leads to social optimality.
6. Conclusions
In this paper, we consider a situation, in which the non-subsidized users and subsidized users being subsidized through a price subsidy share the same network, to investigate universal service subsidies from a pricing perspective. We first discuss a scenario in which the two groups of users share the network resource without any service differentiation and pricing discrimination. It is shown that, without proper pricing mechanisms, one group of users could dominate over the other. Therefore, we propose a service differentiation system, in which the non-subsidized users have higher priority than the subsidized users, based on priority queuing theory, with price subsidy for the subsidized users that can be viewed as a means to price discriminate between the two types of users. We then formulate such a system as an optimization problem via a Stackelberg game from a revenue maximizing service provider’s perspective. By studying the optimal solution to this Stackelberg game through a numerical example, we demonstrate that, while the revenue maximizing price and the corresponding expected revenue increase with an increase in the subsidy ratio, the social welfare is a unimodal function of the subsidy ratio with a single maximum. This indicates that a higher subsidy ratio could lead to more revenue but at the cost of social efficiency. To evaluate the social efficiency of this revenue maximizing pricing model, a similar mathematical framework is used to study the price selection problem from a social welfare maximizing planner’s perspective. Comparison between the socially optimal solution and the revenue maximizing solution suggests that, in such a resource sharing system, the optimal revenue maximizing solution, which takes into account how users value the subsidized service in terms of price and QoS, corresponds to the socially optimal solution under the optimum subsidy ratio that maximizes the social welfare. It implies that policymakers and regulators could induce a universal service provider to set a price that leads to social optimality while maximizing its revenue by choosing the optimal subsidy ratio rather than intervening in the service provider’s pricing policy.
Author Contributions
H.Z. and A.N. conceived and designed the analytical model; H.Z. performed the simulation and wrote the paper with the help of K.O. All the authors were involved in problem formulation, data analysis and editing of the paper.
Conflicts of Interest
The authors declare no conflict of interest.
References
- Independent Communications Authority of South Africa. 2nd Report on the State of ICT Sector in South Africa; Independent Communications Authority of South Africa: Johannesburg, South Africa, 2017. [Google Scholar]
- Universal Service and Access Agency of South Africa. USAASA 2017–2021 Strategic Plan; Universal Service and Access Agency of South Africa: Johannesburg, South Africa, 2016. [Google Scholar]
- Lam, J.C.Y.; Lee, M.K.O. Digital Inclusiveness: Longitudinal Study of Internet Adoption by Older Adults. J. Manag. Inf. Syst. 2006, 22, 177–206. [Google Scholar] [CrossRef]
- Pee, L.G.; Kankanhalli, A.; On Show, V.C.Y. Bridging the Digital Divide: Use of Public Internet Kiosks in Mauritius. J. Glob. Inf. Manag. 2010, 18, 15–38. [Google Scholar] [CrossRef]
- Wallsten, S.J. How to Create a More Efficient Broadband Universal Service Program by Incorporating Demand and Cost-Effectiveness Analysis. Technology Policy Institute Working Paper. 2011. Available online: http://works.bepress.com/scott{_}wallsten/65 (accessed on 10 April 2018).
- Mayo, J.W.; Ukhaneva, O.; Wallsten, S.J. Toward a More Efficient and Effective Lifeline Program. Economic Policy Vignette. 2015. Available online: https://www.google.com/url?sa=t&rct=j&q=&esrc=s&source=web&cd=1&cad=rja&uact=8&ved=2ahUKEwjox6bA17TaAhXsI8AKHVXmA1UQFjAAegQIABAp&url=http{%}3A{%}2F{%}2Fcbpp.georgetown.edu{%}2Fsites{%}2Fcbpp.georgetown.edu{%}2Ffiles{%}2FMayo-Wallsten-Ukhaneva-toward-more-efficient-lifeline-program.pdf&usg=AOvVaw0eZbYe-SRjwHme6IxY2bVq (accessed on 10 April 2018).
- Mandjes, M. Pricing strategies and service differentiation. Netnomics 2004, 6, 59–81. [Google Scholar] [CrossRef]
- Phlips, L. The Economics of Price Discrimination; Cambridge University Press: Cambridge, UK, 1983. [Google Scholar]
- Odlyzko, A.M. Privacy, Economics, and Price Discrimination on the Internet. In Proceedings of the 15th International Conference on Electronic Commerce, Pittsburgh, PA, USA, 30 September–3 October 2003. [Google Scholar]
- Odlyzko, A. Paris metro pricing for the Internet. In Proceedings of the 1st ACM conference on Electronic commerce (EC’99), Denver, CO, USA, 3–5 November 1999; pp. 140–147. [Google Scholar]
- Ros, D.; Tuffin, B. A Mathematical Model of the Paris Metro Pricing Scheme for Charging Packet Network. Comput. Netw. 2004, 46, 73–85. [Google Scholar] [CrossRef]
- Chau, C.K.; Wang, Q.; Chiu, D.M. Economic Viability of Paris Metro Pricing for Digital Services. ACM Trans. Internet Technol. Spec. Issue Pricing Incent. Netw. Syst. 2014, 14. [Google Scholar] [CrossRef]
- Kelly, F.P.; Mauloo, A.K.; Tan, D.K.H. Rate Control in Communication Networks: Shadow Prices, Proportional Fairness and Stability. J. Oper. Res. Soc. 1998, 49, 237–252. [Google Scholar] [CrossRef]
- Lee, J.W.; Chiang, M.; Calderbank, R.A. Jointly optimal congestion and contention control based on network utility maximization. IEEE Commun. Lett. 2006, 10, 216–218. [Google Scholar]
- Low, S.H. A Duality Model of TCP and Queue Management Algorithms. IEEE/ACM Trans. Netw. 2003, 11, 525–536. [Google Scholar] [CrossRef]
- Siris, V.A.; Briscoe, B.; Songhurst, D. Economic Models for Resource Control in Wireless Networks. In Proceedings of the 13th IEEE International Symposium on Personal Indoor and Mobile Radio Communications (PIMRC2002), Lisbon, Portugal, 15–18 September 2002. [Google Scholar]
- Marbach, P.; Berry, R. Downlink Resource Allocation and Pricing for Wireless Networks. In Proceedings of the 21st Annual Joint Conference of the IEEE Computer and Communications Societies (INFOCOM2002), New York, NY, USA, 23–27 June 2002. [Google Scholar]
- Chau, C.K.; Wang, Q.; Chiu, D.M. On the Viability of Paris Metro Pricing for Communication and Service Networks. In Proceedings of the 29th IEEE International Conference on Computer Communications (IEEE INFOCOM 2010), San Diego, CA, USA, 15–19 March 2010. [Google Scholar]
- Ren, S.; Park, J.; van der Schaar, M. User Subscription Dynamics and Revenue Maximization in Communications Markets. In Proceedings of the 30th IEEE International Conference on Computer Communications (IEEE INFOCOM 2011), Shanghai, China, 10–15 April 2011. [Google Scholar]
- Li, S.; Huang, J. Price Differentiation for Communication Networks. IEEE/ACM Trans. Netw. 2014, 22, 703–716. [Google Scholar] [CrossRef]
- Mendelson, H. Pricing Computer Services: Queuing Effects. Commun. ACM 1985, 28, 312–321. [Google Scholar] [CrossRef]
Figure 1.
The optimal price as a function of subsidy ratio .
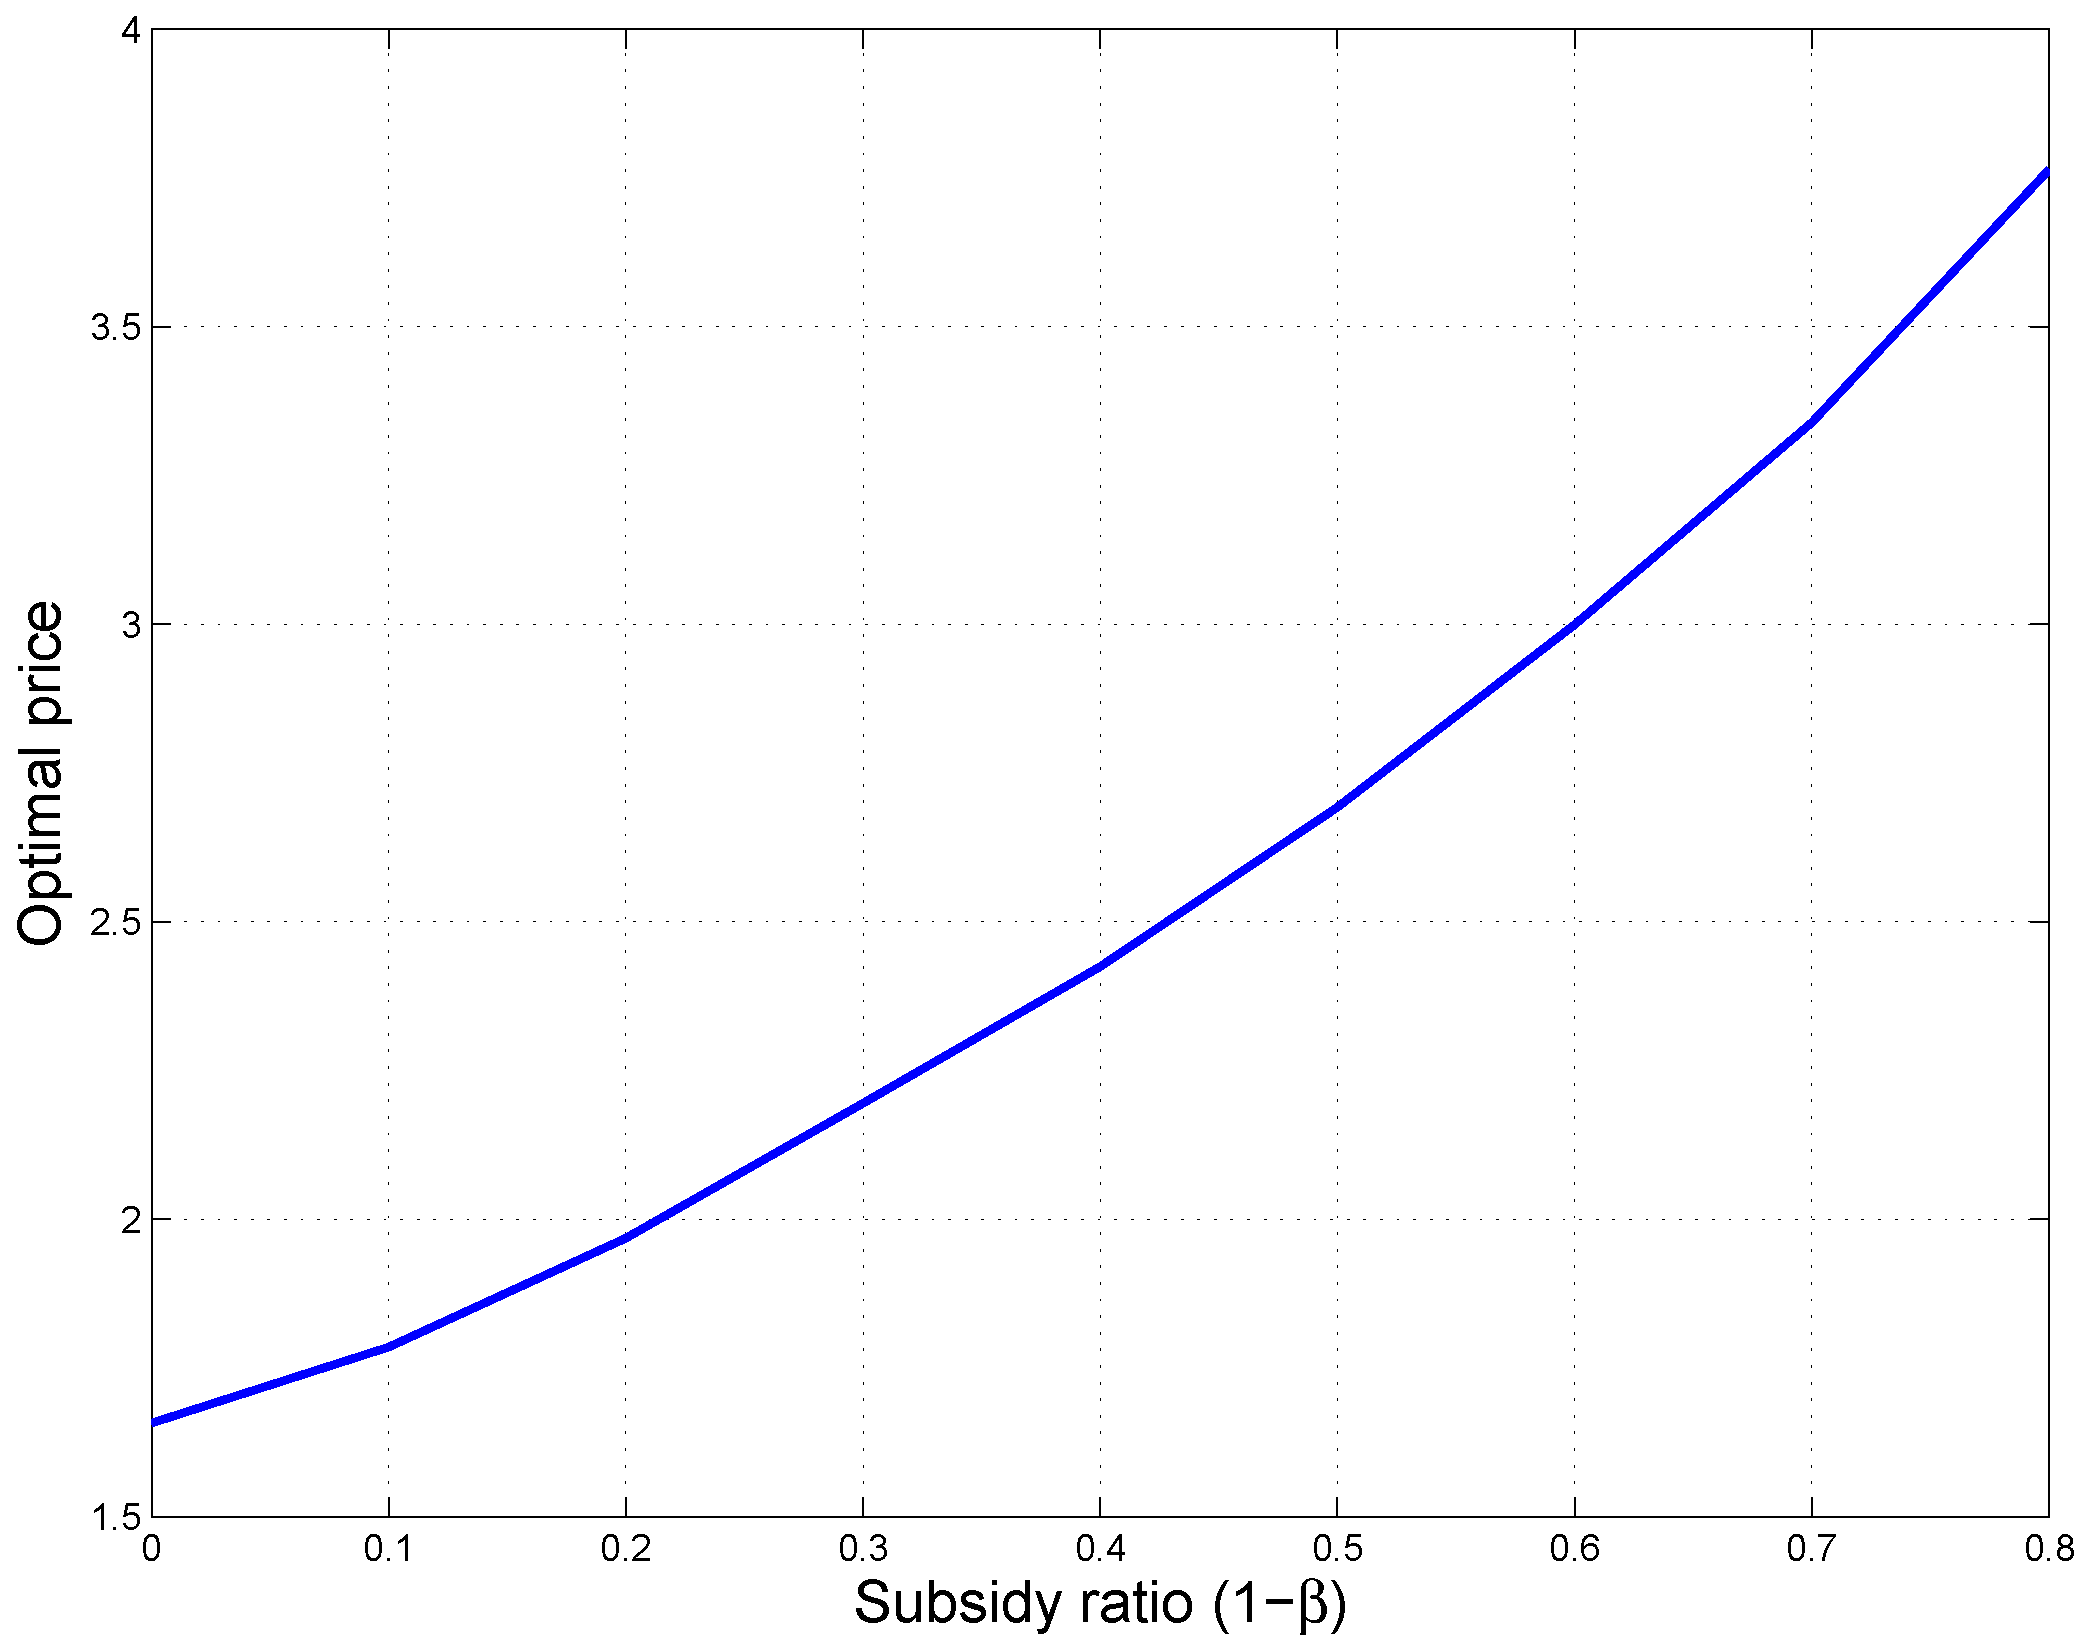
Figure 2.
The effective number of users as a function of subsidy ratio .

Figure 3.
The occupation rate of users as a function of subsidy ratio .

Figure 4.
The total expected revenue as a function of subsidy ratio .

Figure 5.
The social welfare of Stackelberg Equilibrium as a function of subsidy ratio .

Figure 6.
The optimal prices for different .

Figure 7.
The effective numbers of non-subsidized users for different .

Figure 8.
The effective numbers of subsidized users for different .
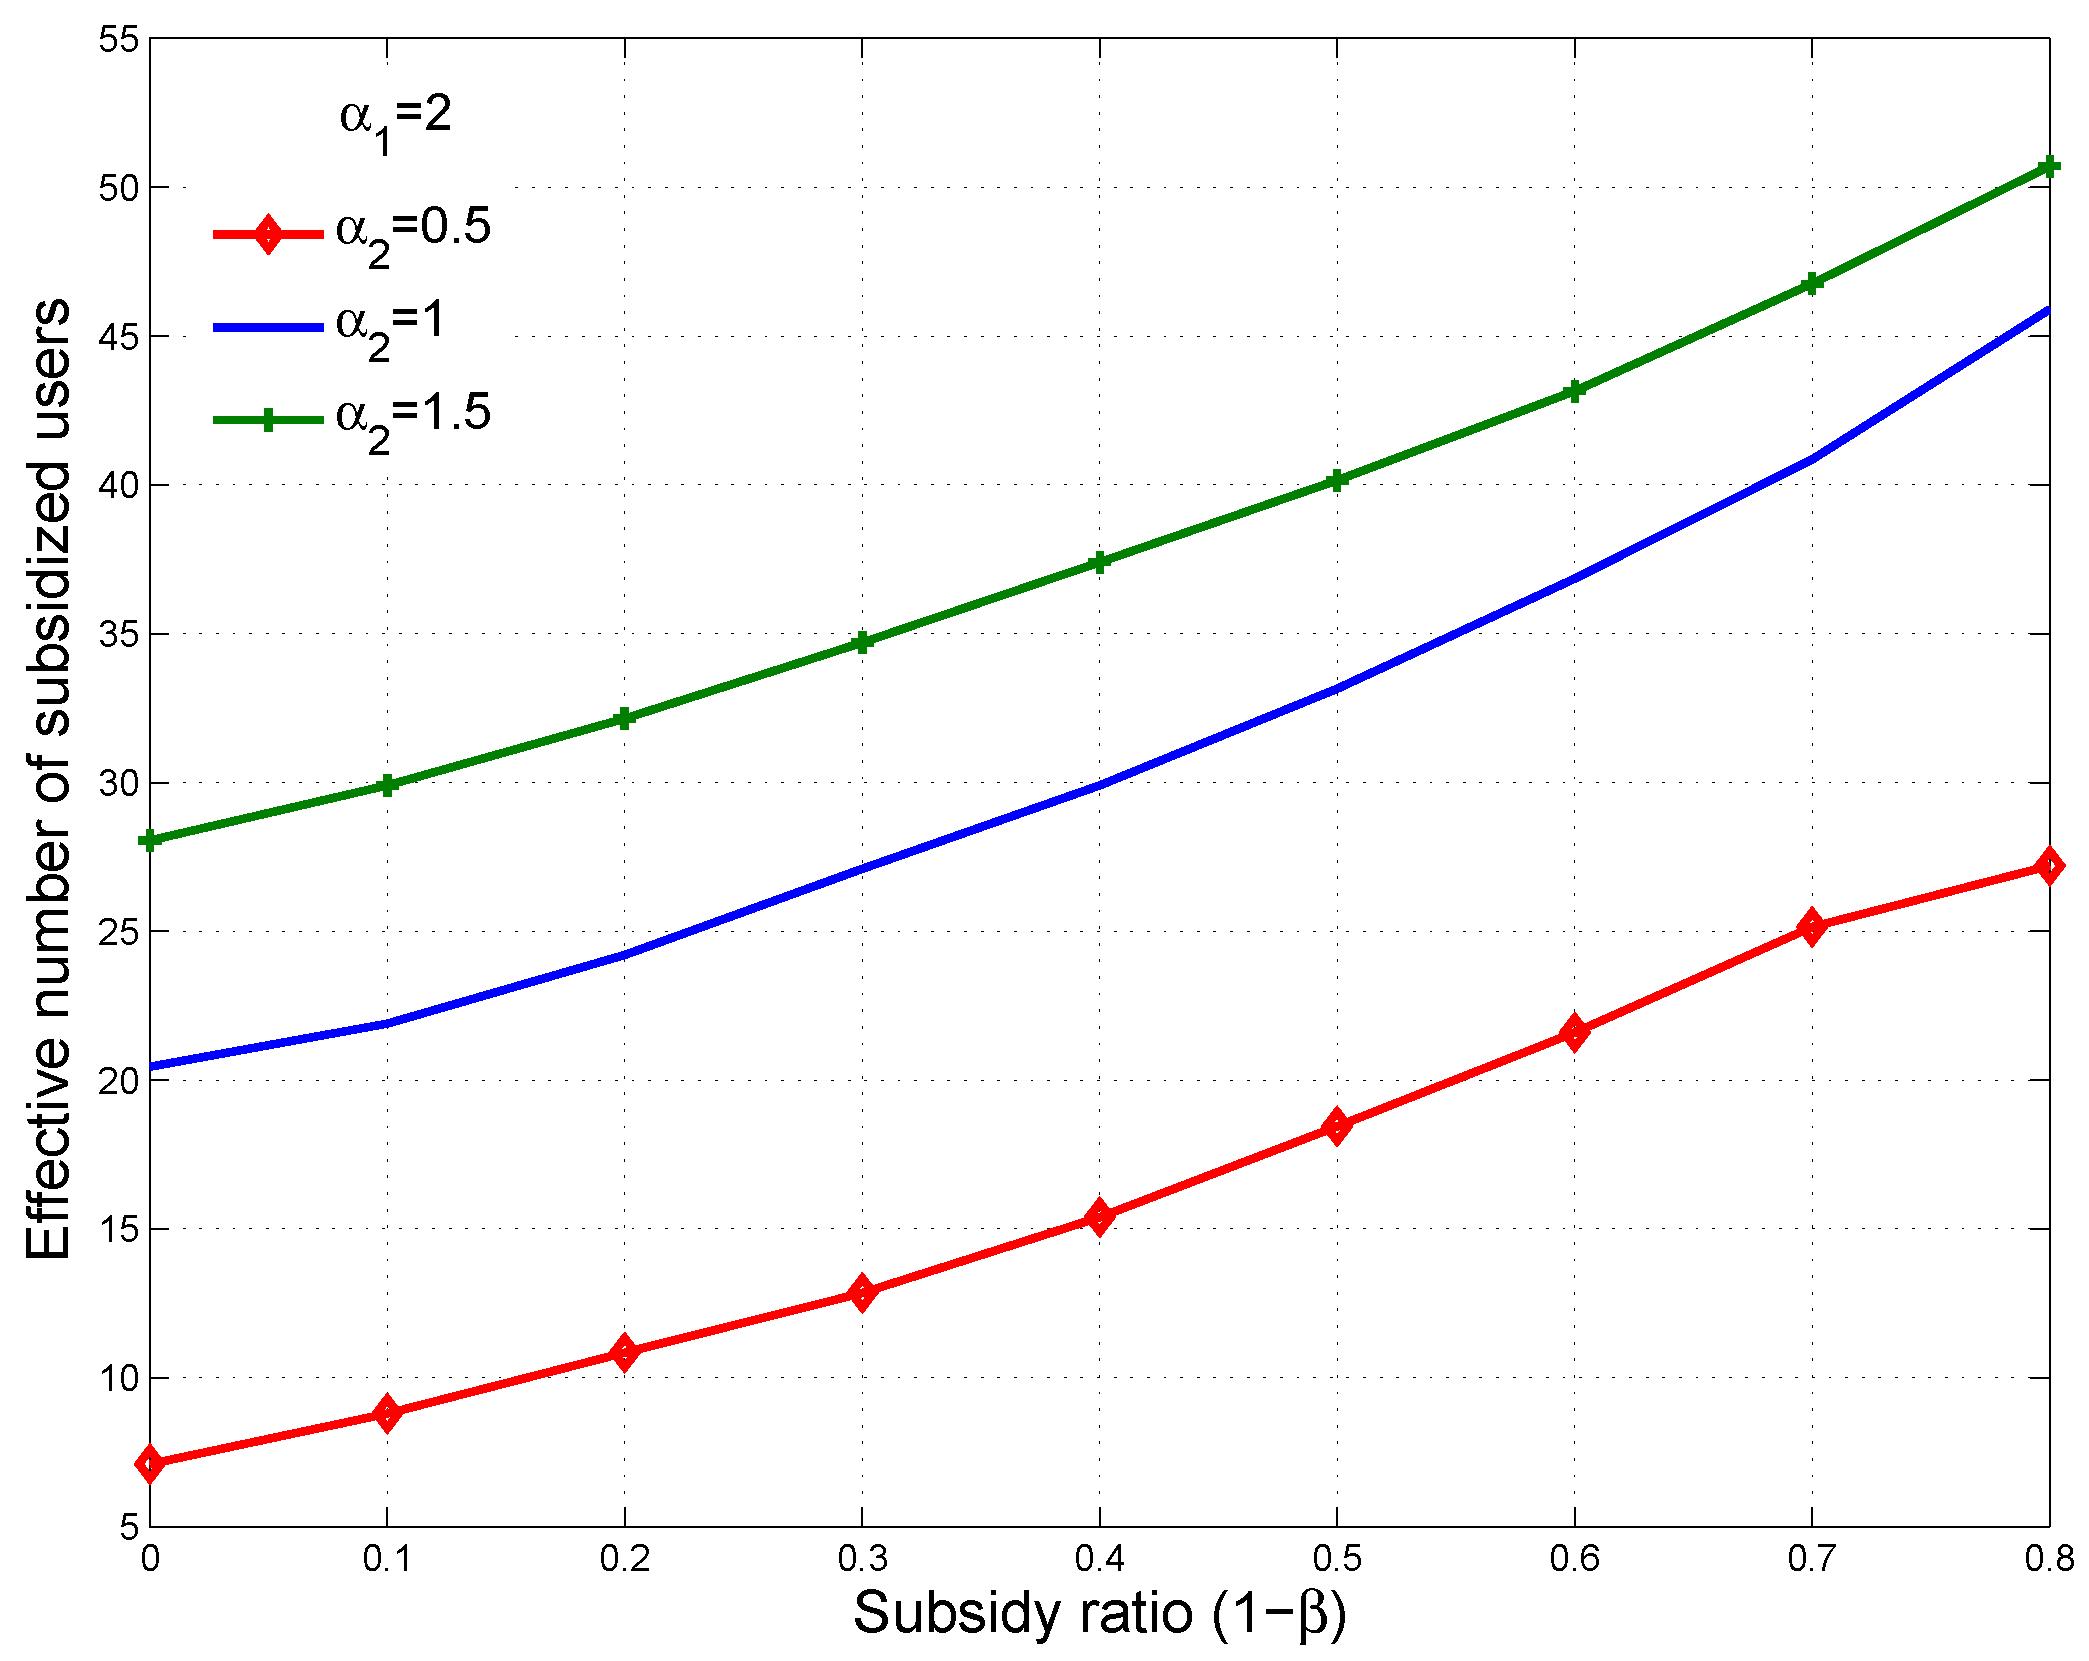
Figure 9.
The total expected revenues for different .
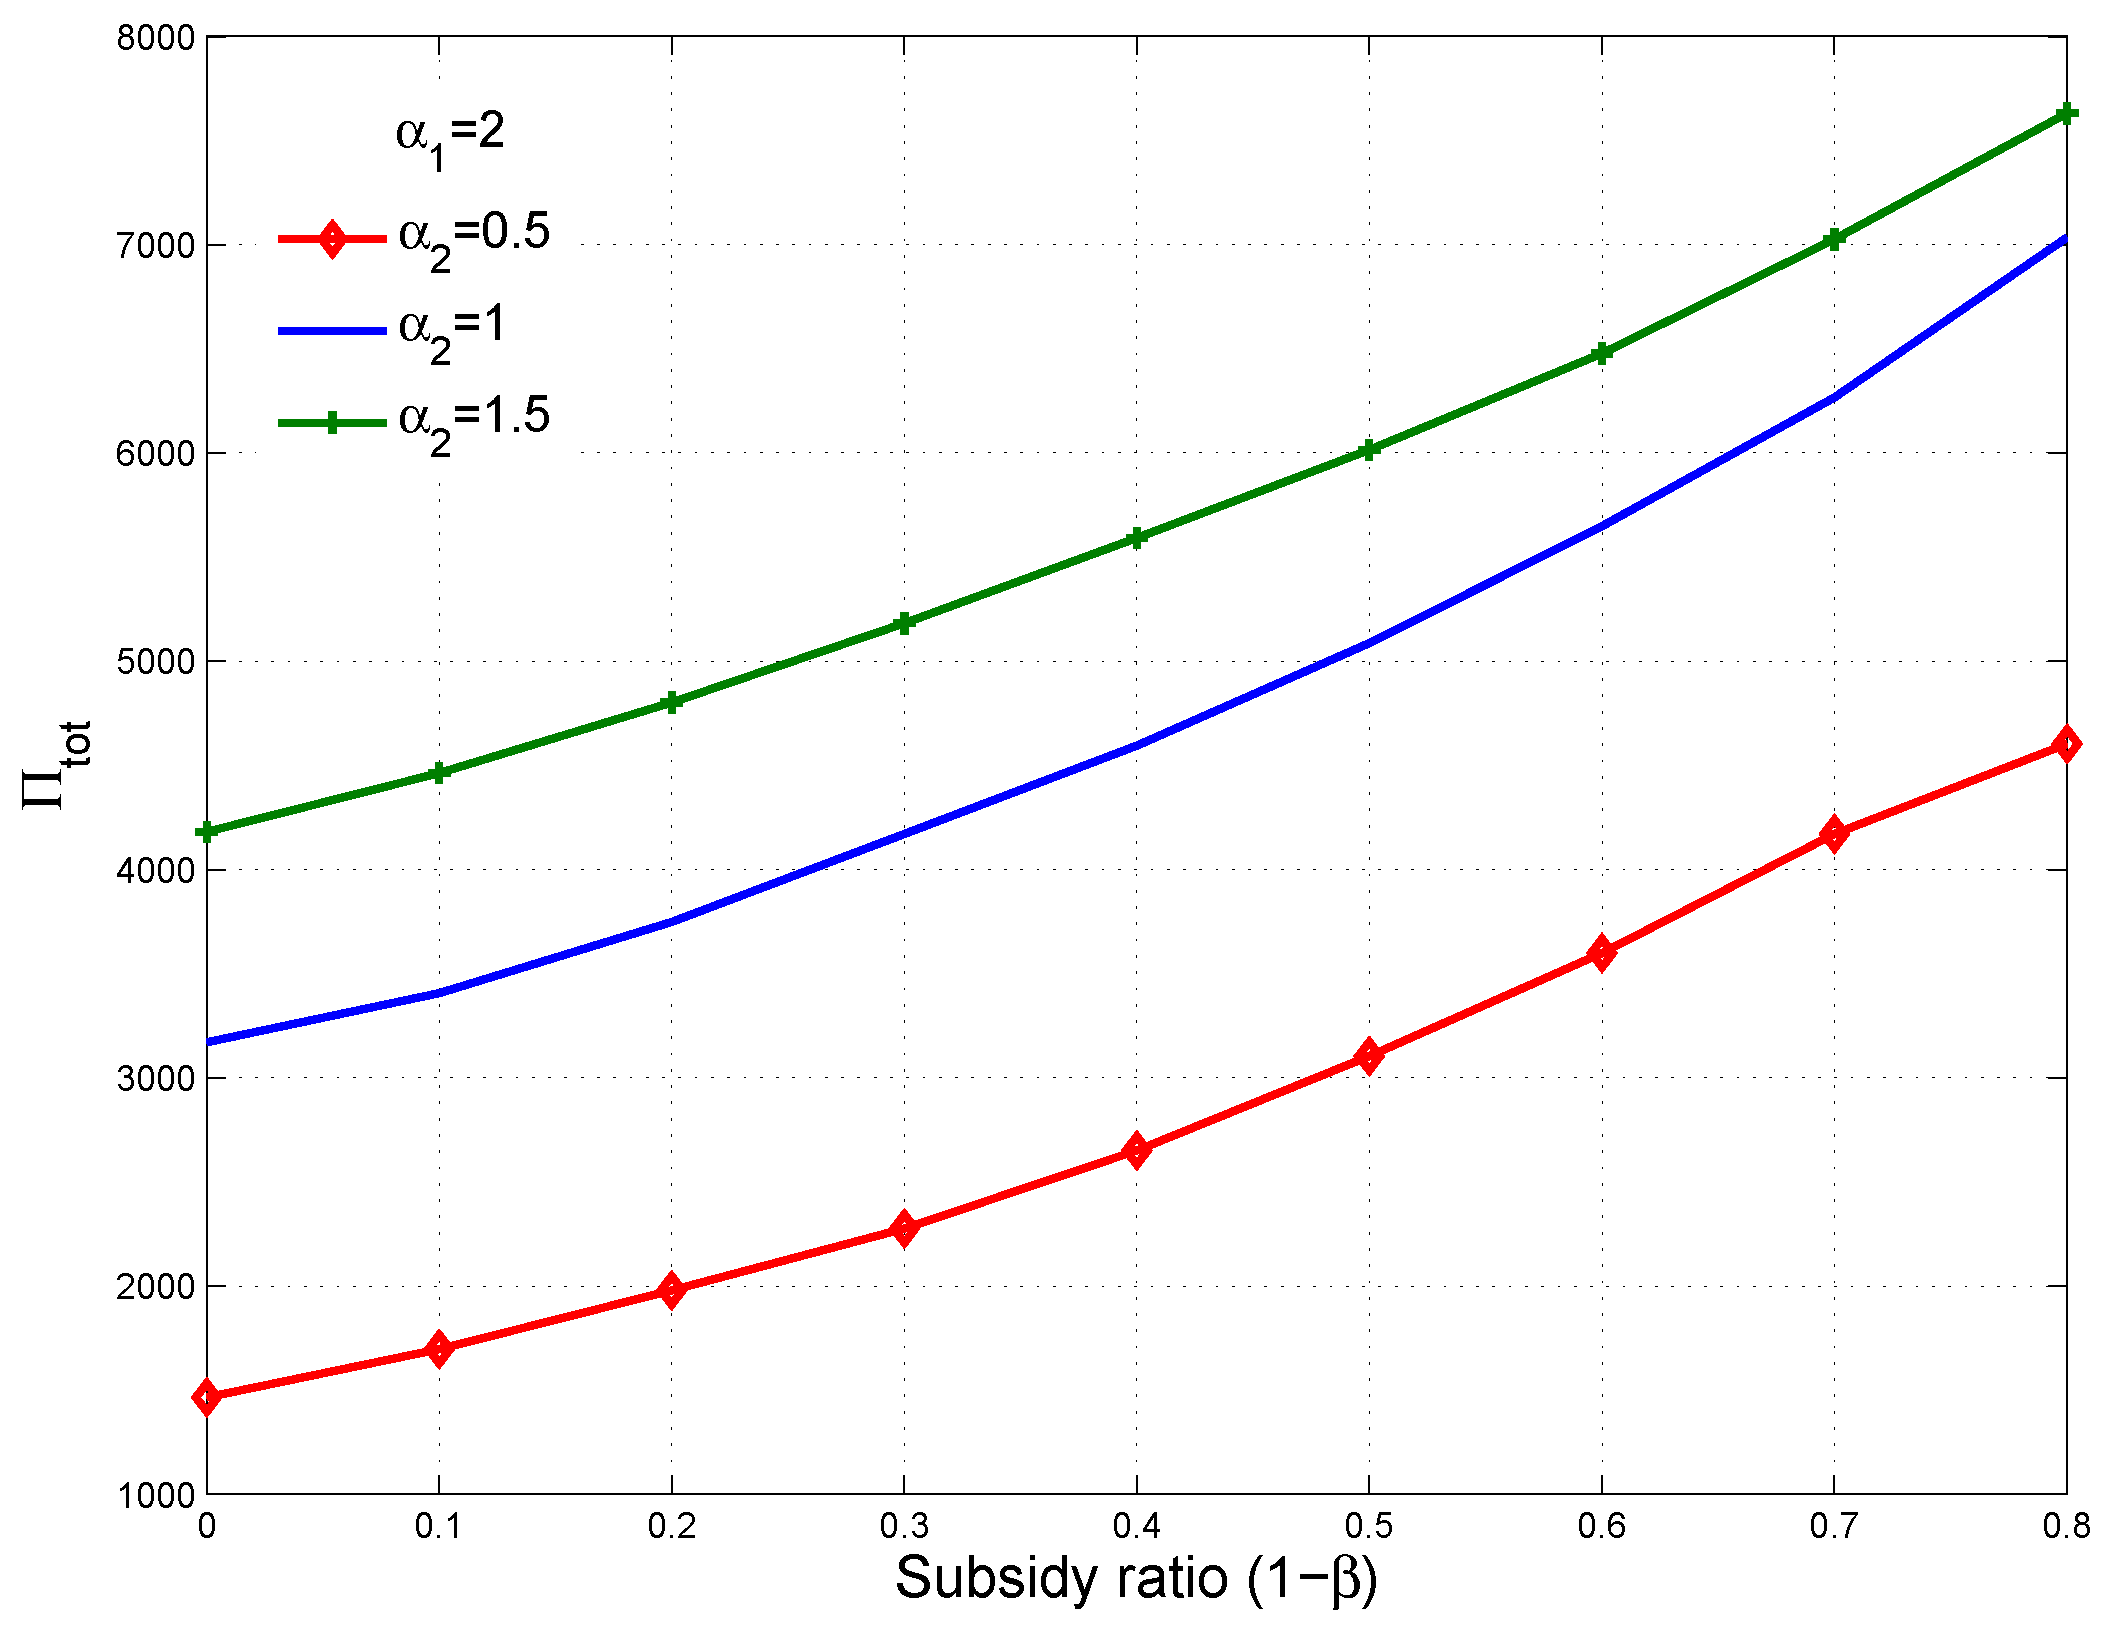
Figure 10.
The social welfare of Stackelberg Optimum for different .
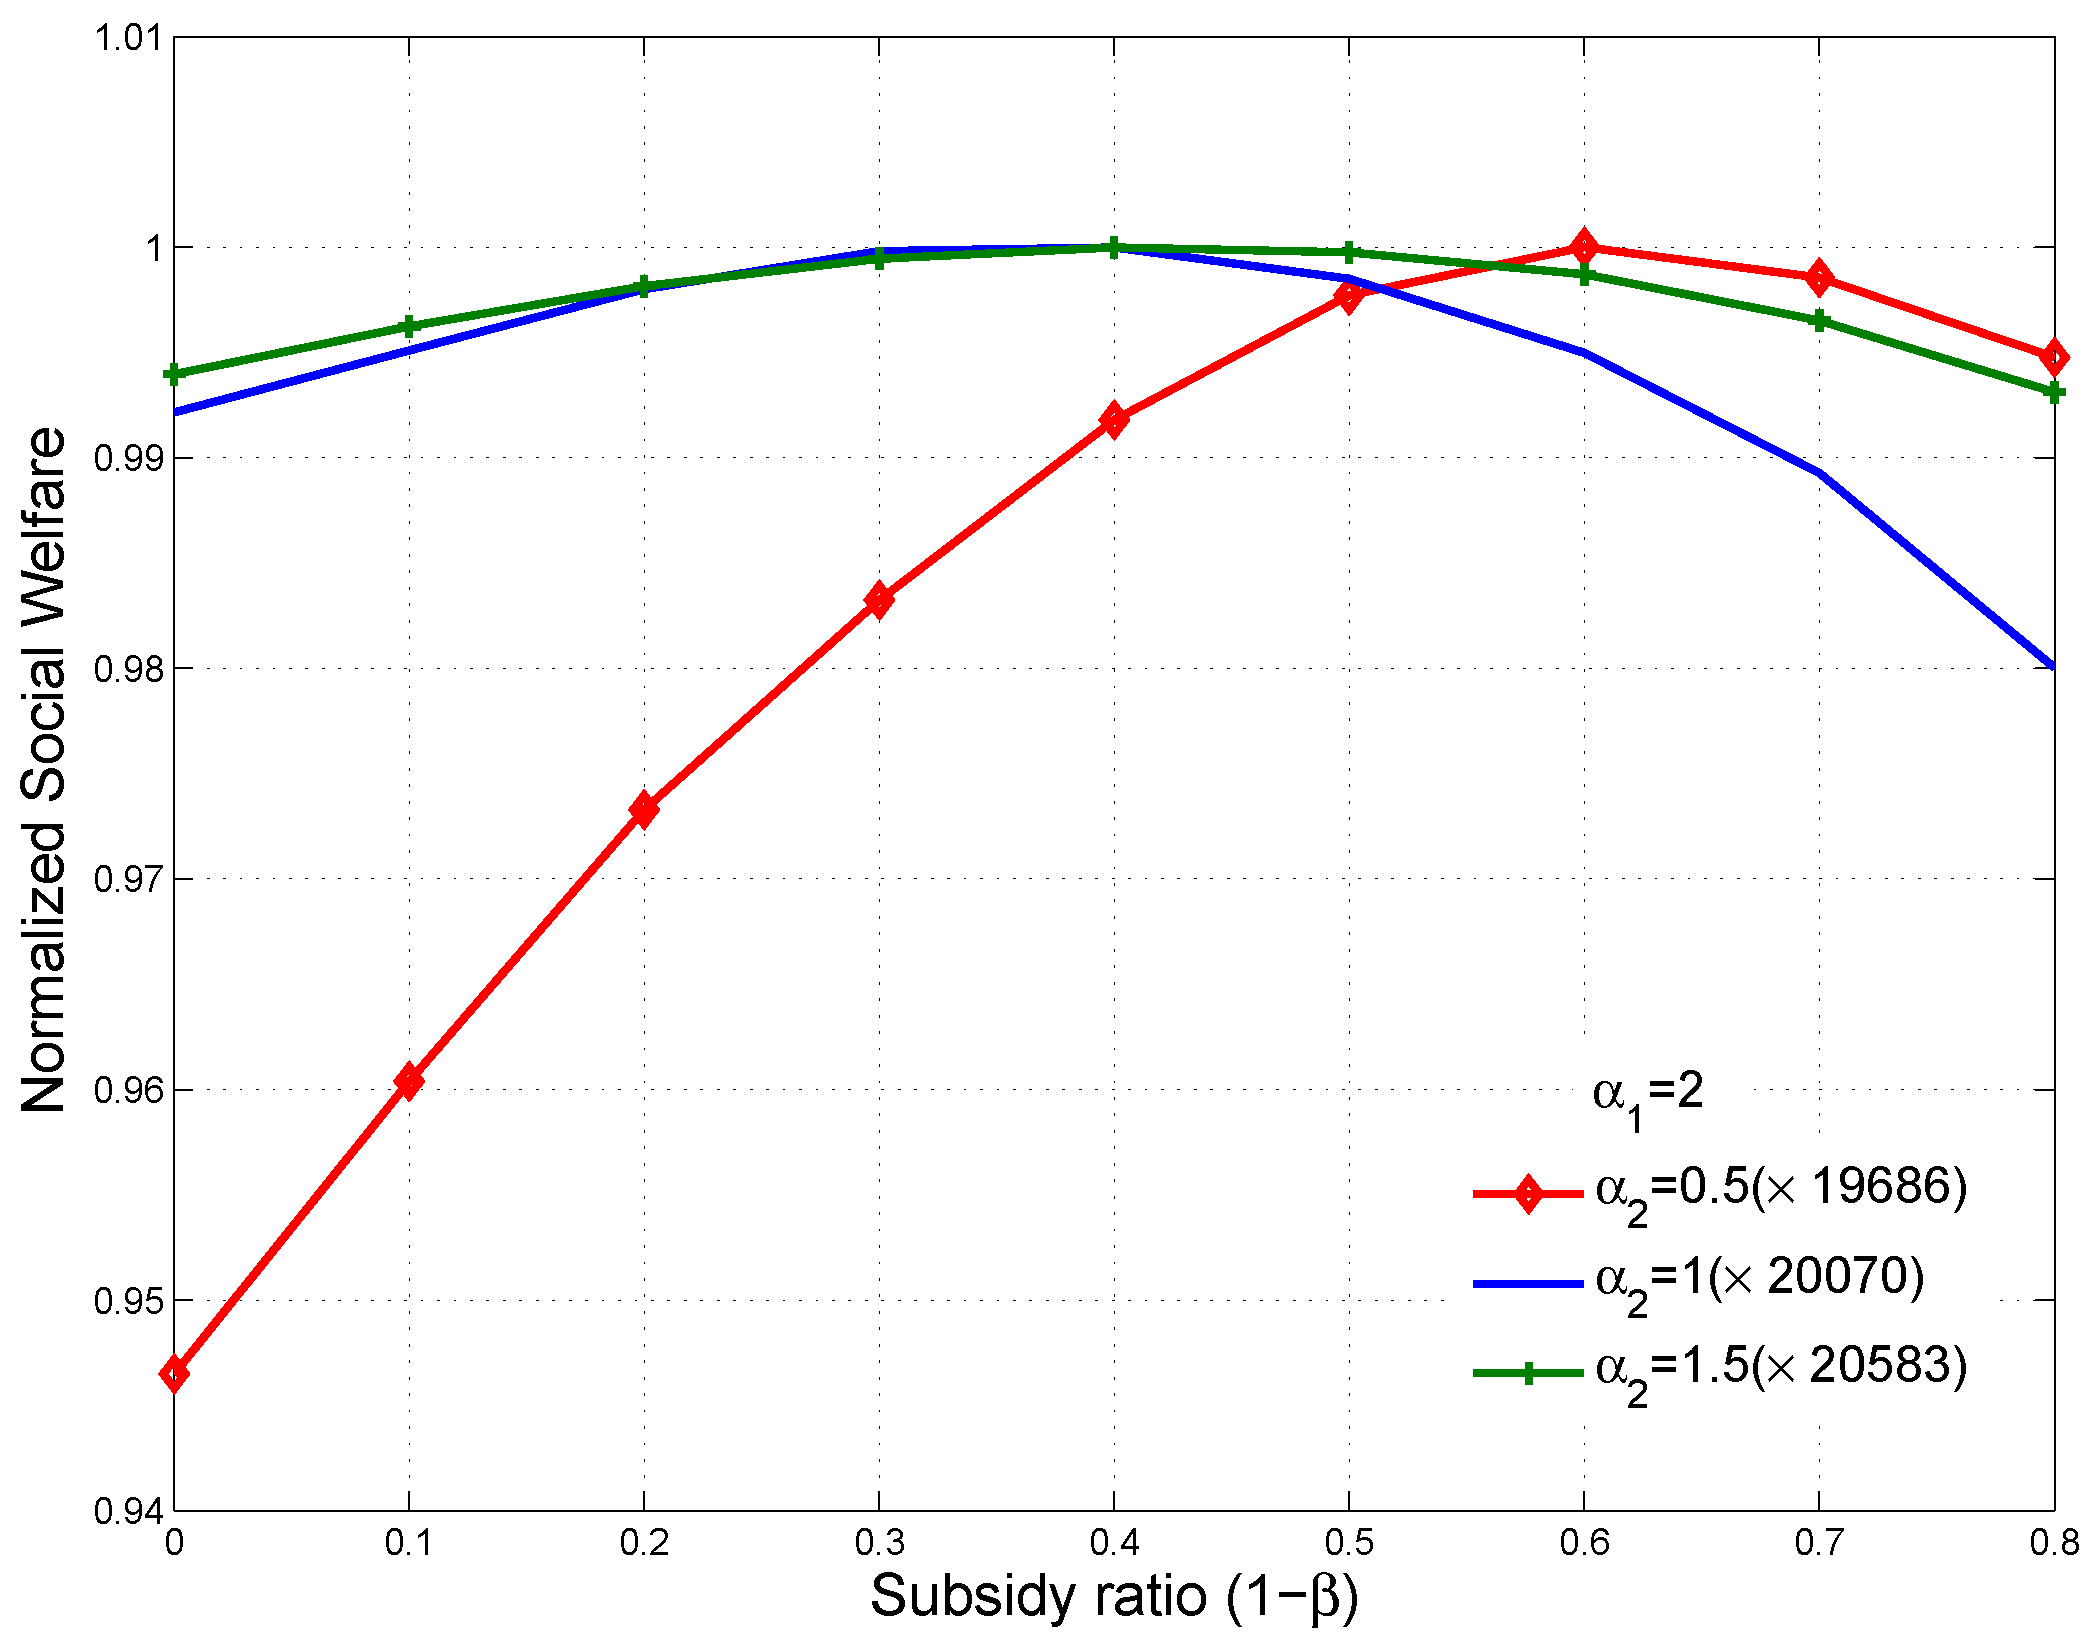
Figure 11.
The comparison of social welfare between Stackelberg Equilibrium and Social Optimal Situation.
Figure 11.
The comparison of social welfare between Stackelberg Equilibrium and Social Optimal Situation.

Figure 12.
The comparison of optimal price between Stackelberg Equilibrium and Social Optimal Situation.
Figure 12.
The comparison of optimal price between Stackelberg Equilibrium and Social Optimal Situation.

Figure 13.
The comparison of number of non-subsidized users between Stackelberg Equilibrium and Social Optimal Situation.
Figure 13.
The comparison of number of non-subsidized users between Stackelberg Equilibrium and Social Optimal Situation.
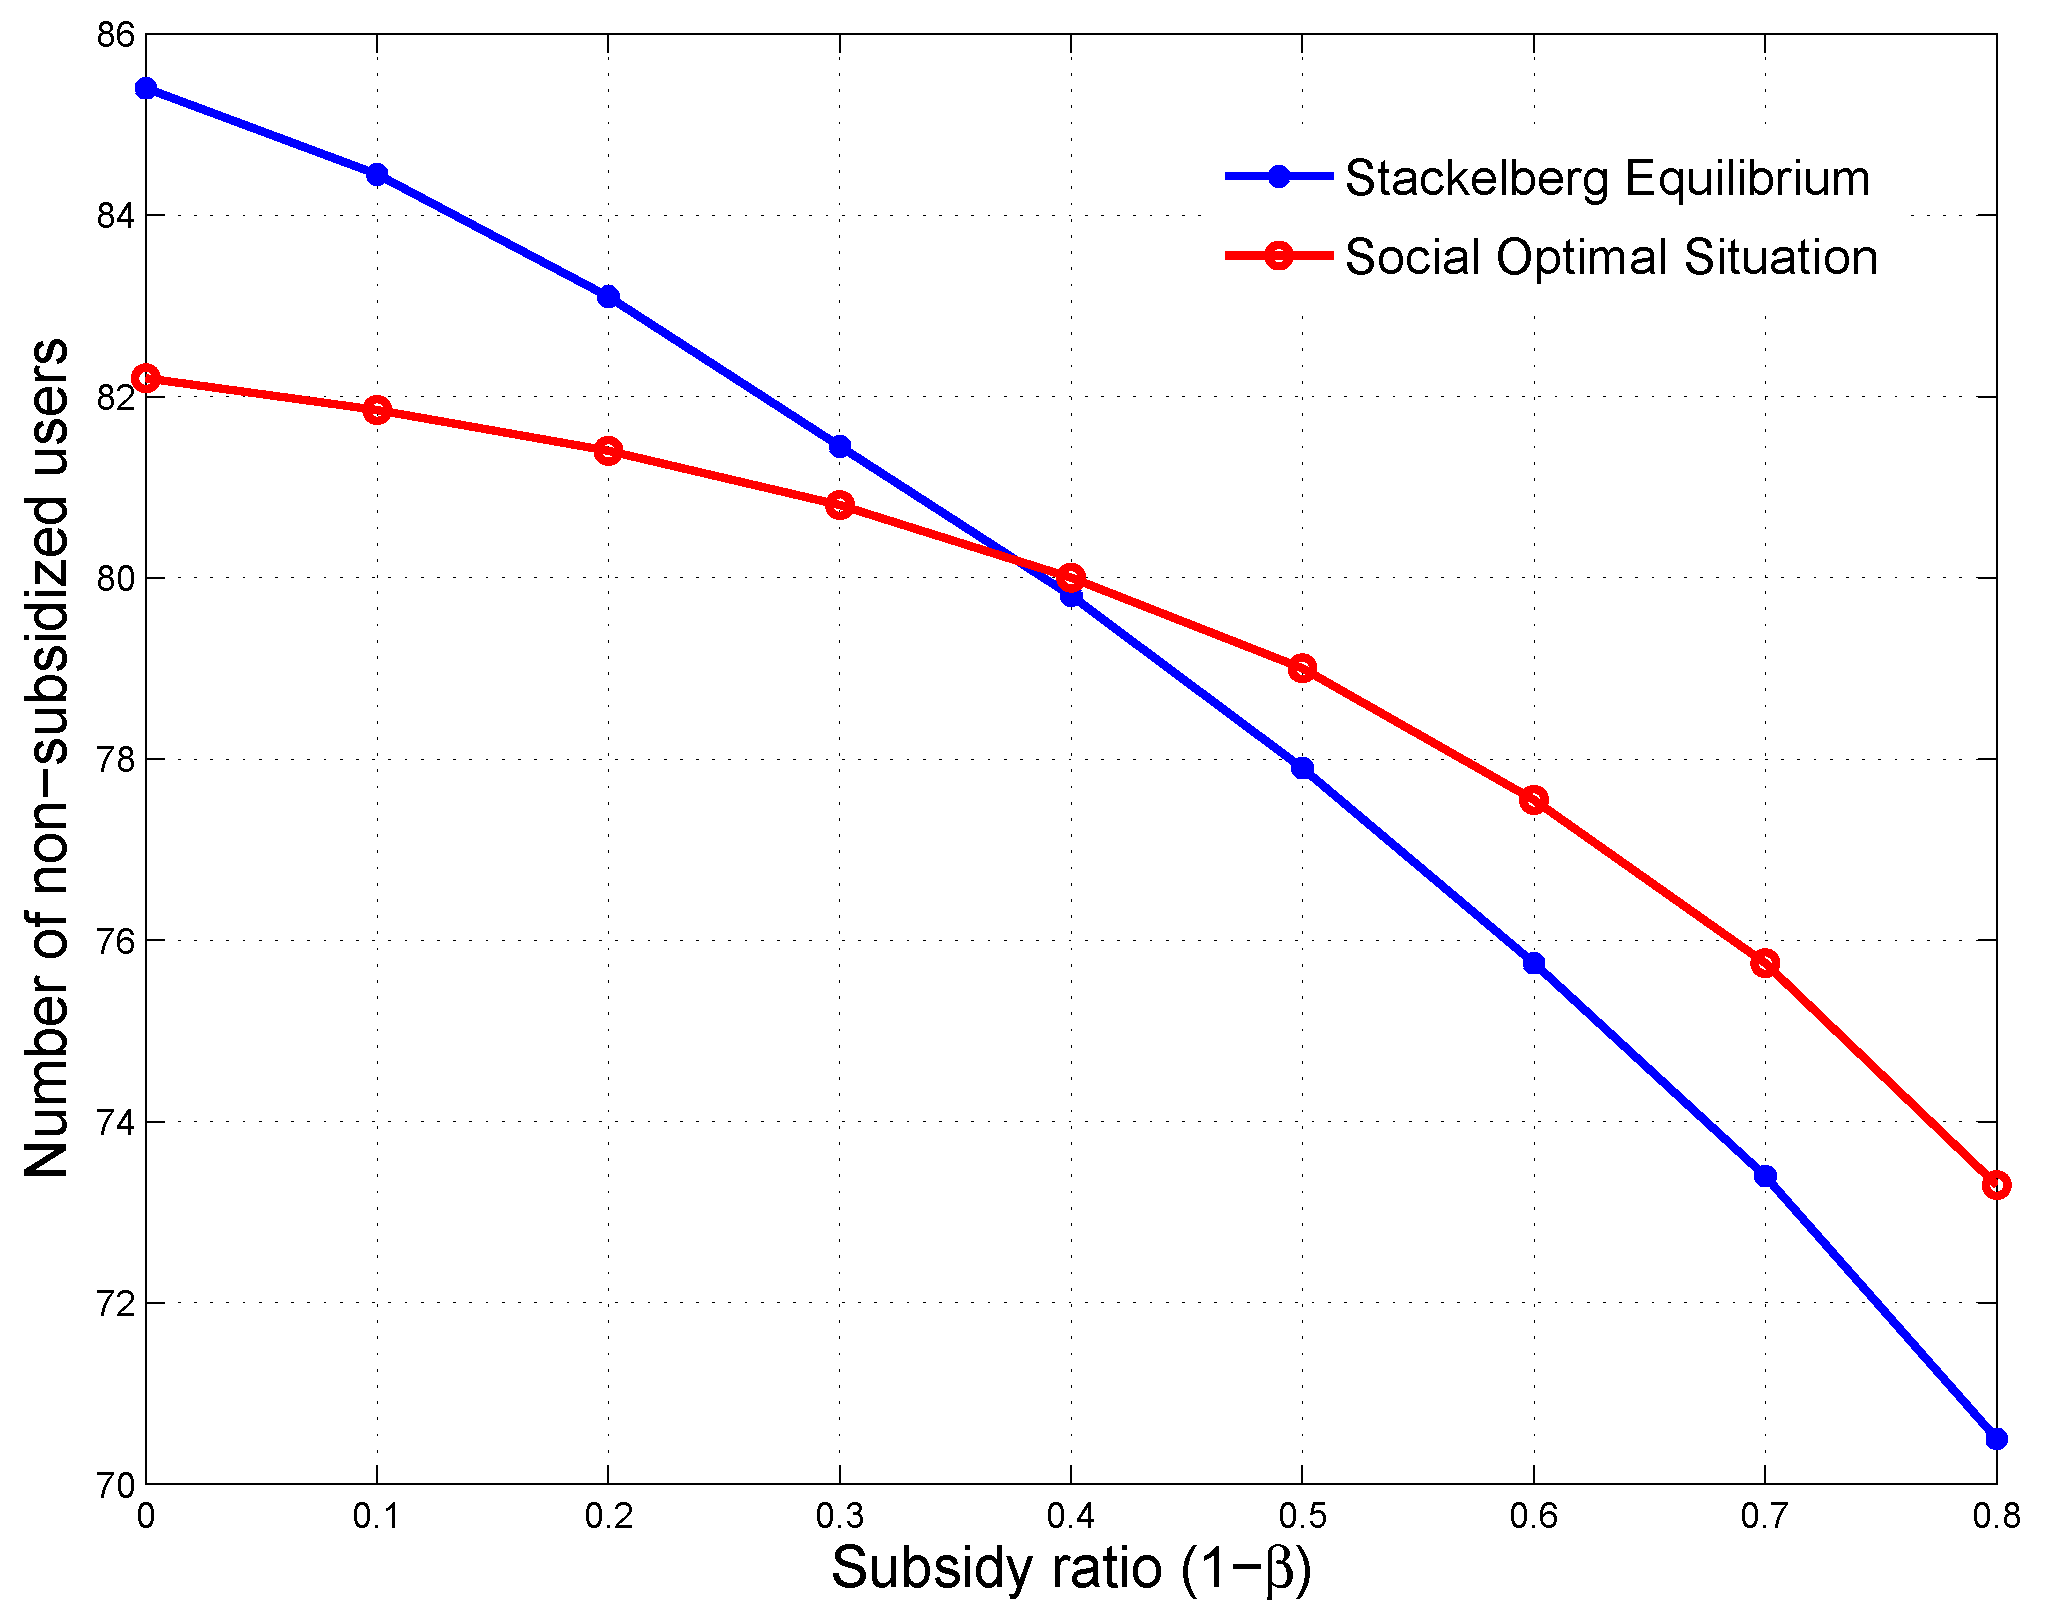
Figure 14.
The comparison of number of subsidized users between Stackelberg Equilibrium and Social Optimal Situation.
Figure 14.
The comparison of number of subsidized users between Stackelberg Equilibrium and Social Optimal Situation.

Figure 15.
The comparison of expected revenue between Stackelberg Equilibrium and Social Optimal Situation.
Figure 15.
The comparison of expected revenue between Stackelberg Equilibrium and Social Optimal Situation.
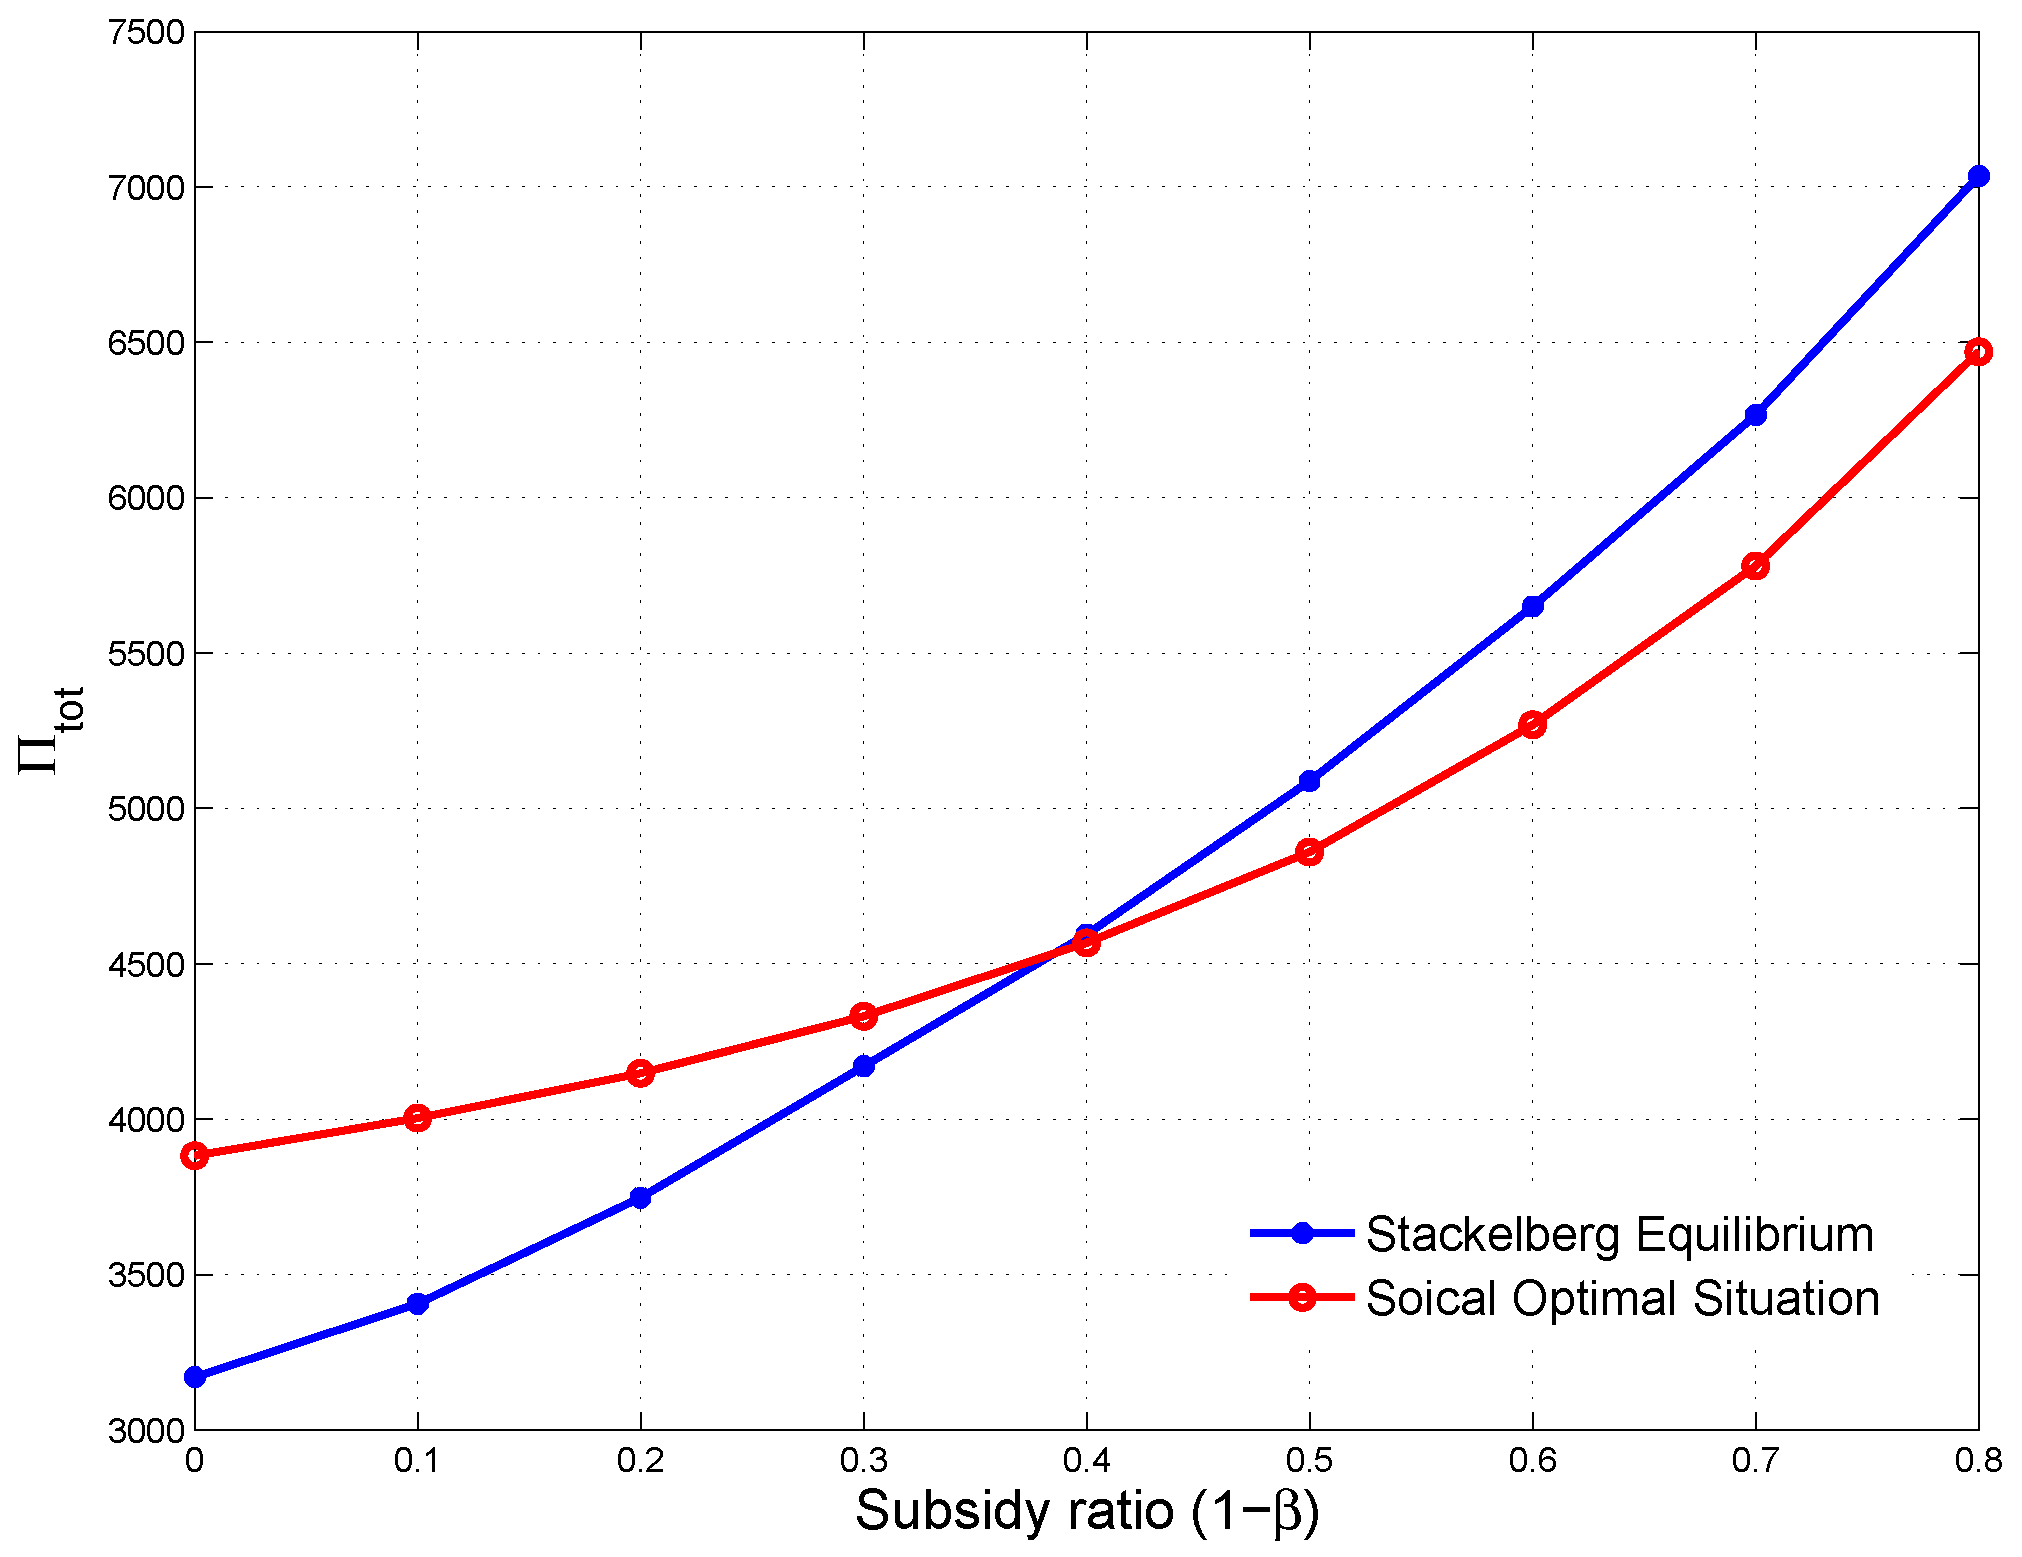
Figure 16.
The comparison of required subsidy between Stackelberg Equilibrium and Social Optimal Situation.
Figure 16.
The comparison of required subsidy between Stackelberg Equilibrium and Social Optimal Situation.
© 2018 by the authors. Licensee MDPI, Basel, Switzerland. This article is an open access article distributed under the terms and conditions of the Creative Commons Attribution (CC BY) license (http://creativecommons.org/licenses/by/4.0/).
Share and Cite
MDPI and ACS Style
Zhu, H.; Ouahada, K.; Nel, A. Optimal Price Subsidy for Universal Internet Service Provision. Sustainability 2018, 10, 1576. https://doi.org/10.3390/su10051576
AMA Style
Zhu H, Ouahada K, Nel A. Optimal Price Subsidy for Universal Internet Service Provision. Sustainability. 2018; 10(5):1576. https://doi.org/10.3390/su10051576
Chicago/Turabian StyleZhu, Hailing, Khmaies Ouahada, and Andre Nel. 2018. "Optimal Price Subsidy for Universal Internet Service Provision" Sustainability 10, no. 5: 1576. https://doi.org/10.3390/su10051576
Note that from the first issue of 2016, this journal uses article numbers instead of page numbers. See further details here.