The Sustainable Child Development Index (SCDI) for Countries


Institute of Environmental Technology, Technische Universität Berlin, Straße des 17. Juni 135, 10623 Berlin, Germany
*
Author to whom correspondence should be addressed.
Sustainability 2018, 10(5), 1563; https://doi.org/10.3390/su10051563
Submission received: 20 March 2018
/
Revised: 26 April 2018
/
Accepted: 9 May 2018
/
Published: 14 May 2018
Abstract
:Despite the relevance of children in inheriting and shaping society, an index assessing sustainable development with a focus on children is missing. To tackle this gap, this study established the Sustainable Child Development Index (SCDI) by considering child development topics in the context of inter-generational equity and applying indicators with available statistical data on country level. The SCDI at present addresses health, education, safety, economic status and environmental aspects described by 25 indicators. By taking reference points derived from the targets of the Sustainable Development Goals (SDGs), the SCDI scores for the year 2015 were calculated for 138 countries and then classified into four sustainable child development levels (very high, high, medium and low). The results showed great regional inequality on the status of sustainable child development. European countries generally have better status of sustainable child development. By contrast, 90% of African and 76% of Asian countries were classified as countries with medium and low levels. Moreover, the comparison of the SCDI, the Human Development Index (HDI) and the Child Development Index (CDI) based on correlation analysis and 10-year (2006–2015) country rankings demonstrated that the SCDI can complement existing development indices to provide a more comprehensive evaluation of sustainable development.
1. Introduction
Children (here defined as aged under 18 [1]) are an important stakeholder group for Sustainable Development (SD) as they connect current and future generations. The Brundtland Commission defined SD as “development that meets the needs of the present without compromising the ability of future generations to meet their own needs” [2]. The definition underlines the important relationship between children, inter-generational equity and SD.
As the needs of children and their susceptibility to external factors are different from those of adults, indices that evaluate SD by treating children as a key stakeholder group are needed for complementing whole-population-oriented assessments, such as the Human Development Index (HDI). The HDI was introduced by the United Nations Development Programme (UNDP) in the 1990s to measure the developmental state of a country by combining indicators of life expectancy, educational attainment, and income based on national average data of the whole population [3,4]. It has been widely applied for decades, but the missing consideration of future generations in its scheme persists.
Several indices for assessing child development have been proposed. Child development refers to change or growth that occurs in a child during the life span from birth to adolescence [5]. One relevant focus in child development-related studies is the development of indices [6,7]. An index aggregates a number of indicators addressing individual topics. Since child development is a multi-dimensional issue involving a large number of topics, there is a need to systematically aggregate the information to a simpler layout by constructing indices. For example, the Child Development Index (CDI) [8,9] evaluates the development of children considering the topics health (i.e., under-five mortality), education (i.e., primary school enrolment) and nutrition (i.e., underweight status), mirroring the HDI. Other indices address additional topics, such as relationships with family, school and community and safety. For example, Bradshaw et al. [10] proposed an index of child well-being on European level. The index considers the child’s rights and analyzes child well-being in eight topics (material situation, housing, health, education, relationships, civic participation, and risk and safety) with 51 indicators. Land et al. [11] constructed the Child and Youth Well-Being Index to track the trends in child well-being on a national level across 28 indicators and seven different topics. The seven topics were material well-being, health, social relationships, safety/behavior concerns, productivity/educational attainment, place in community, and emotional/spiritual well-being. Later on, the index was expanded to consider additional 16 indicators [12]. Breaking down from national to state level, the New KIDS COUNT Index was proposed for measuring and comparing the performance of child well-being across states of the United States [13]. The New KIDS COUNT Index classified 16 indicators to four topics, i.e., economic well-being, education, health, and family and community. Unlike the aforementioned indices, Moore et al. [14] used data of individual children obtained by National Survey of America’s Families instead of national or regional aggregated data to construct the index for indicating risks that individual children experience. A key characteristic of this index is the distinction between topics which refer to the outcome or performance of children development (i.e., well-being) and topics which refer to the contextual level (i.e., background that may influence well-being). This framework was further improved to address four topics for well-being (physical health, psychological health, social health, education), and three topics for the contextual part (family, community, and socio-demography), covering 69 indicators in an index in total [15,16].
Although numerous indices for assessing child development are already available, some limitations remain. The limitations include: (1) the lack of a consistent classification of topics and indicators considered in the indices; (2) the disregard of data availability for selected indicators; and (3) the neglect of topics related to environmental aspects. In fact, a classification of topics and indicators is not straightforward. According to a review on assessing child development conducted by Chang et al. [17], there is no generally accepted classification scheme. The same indicators can be classified into different topics. For example, school enrolment indicators were assigned to address the topic of education in many indices [10,13], but were allocated to the topic participation in some other indices [18,19]. Moreover, Chang et al. [20] pointed out that some studies did not clearly list the indicators needed for measuring the topics [21], or did not clarify the data availability of the selected indicators. Consequently, such indices may not be applied in practice, as data for one or more indicators are simply not available. Furthermore, current child development studies focus mainly on social and economic issues. Environmental aspects have not yet been addressed. However, environmental aspects need to be considered for connecting child development to SD with triple-bottom-line thinking (considering environmental, economic and social aspects [22]).
1.1. The Sustainable Child Development Index (SCDI) Framework and an Initial Indicator Set
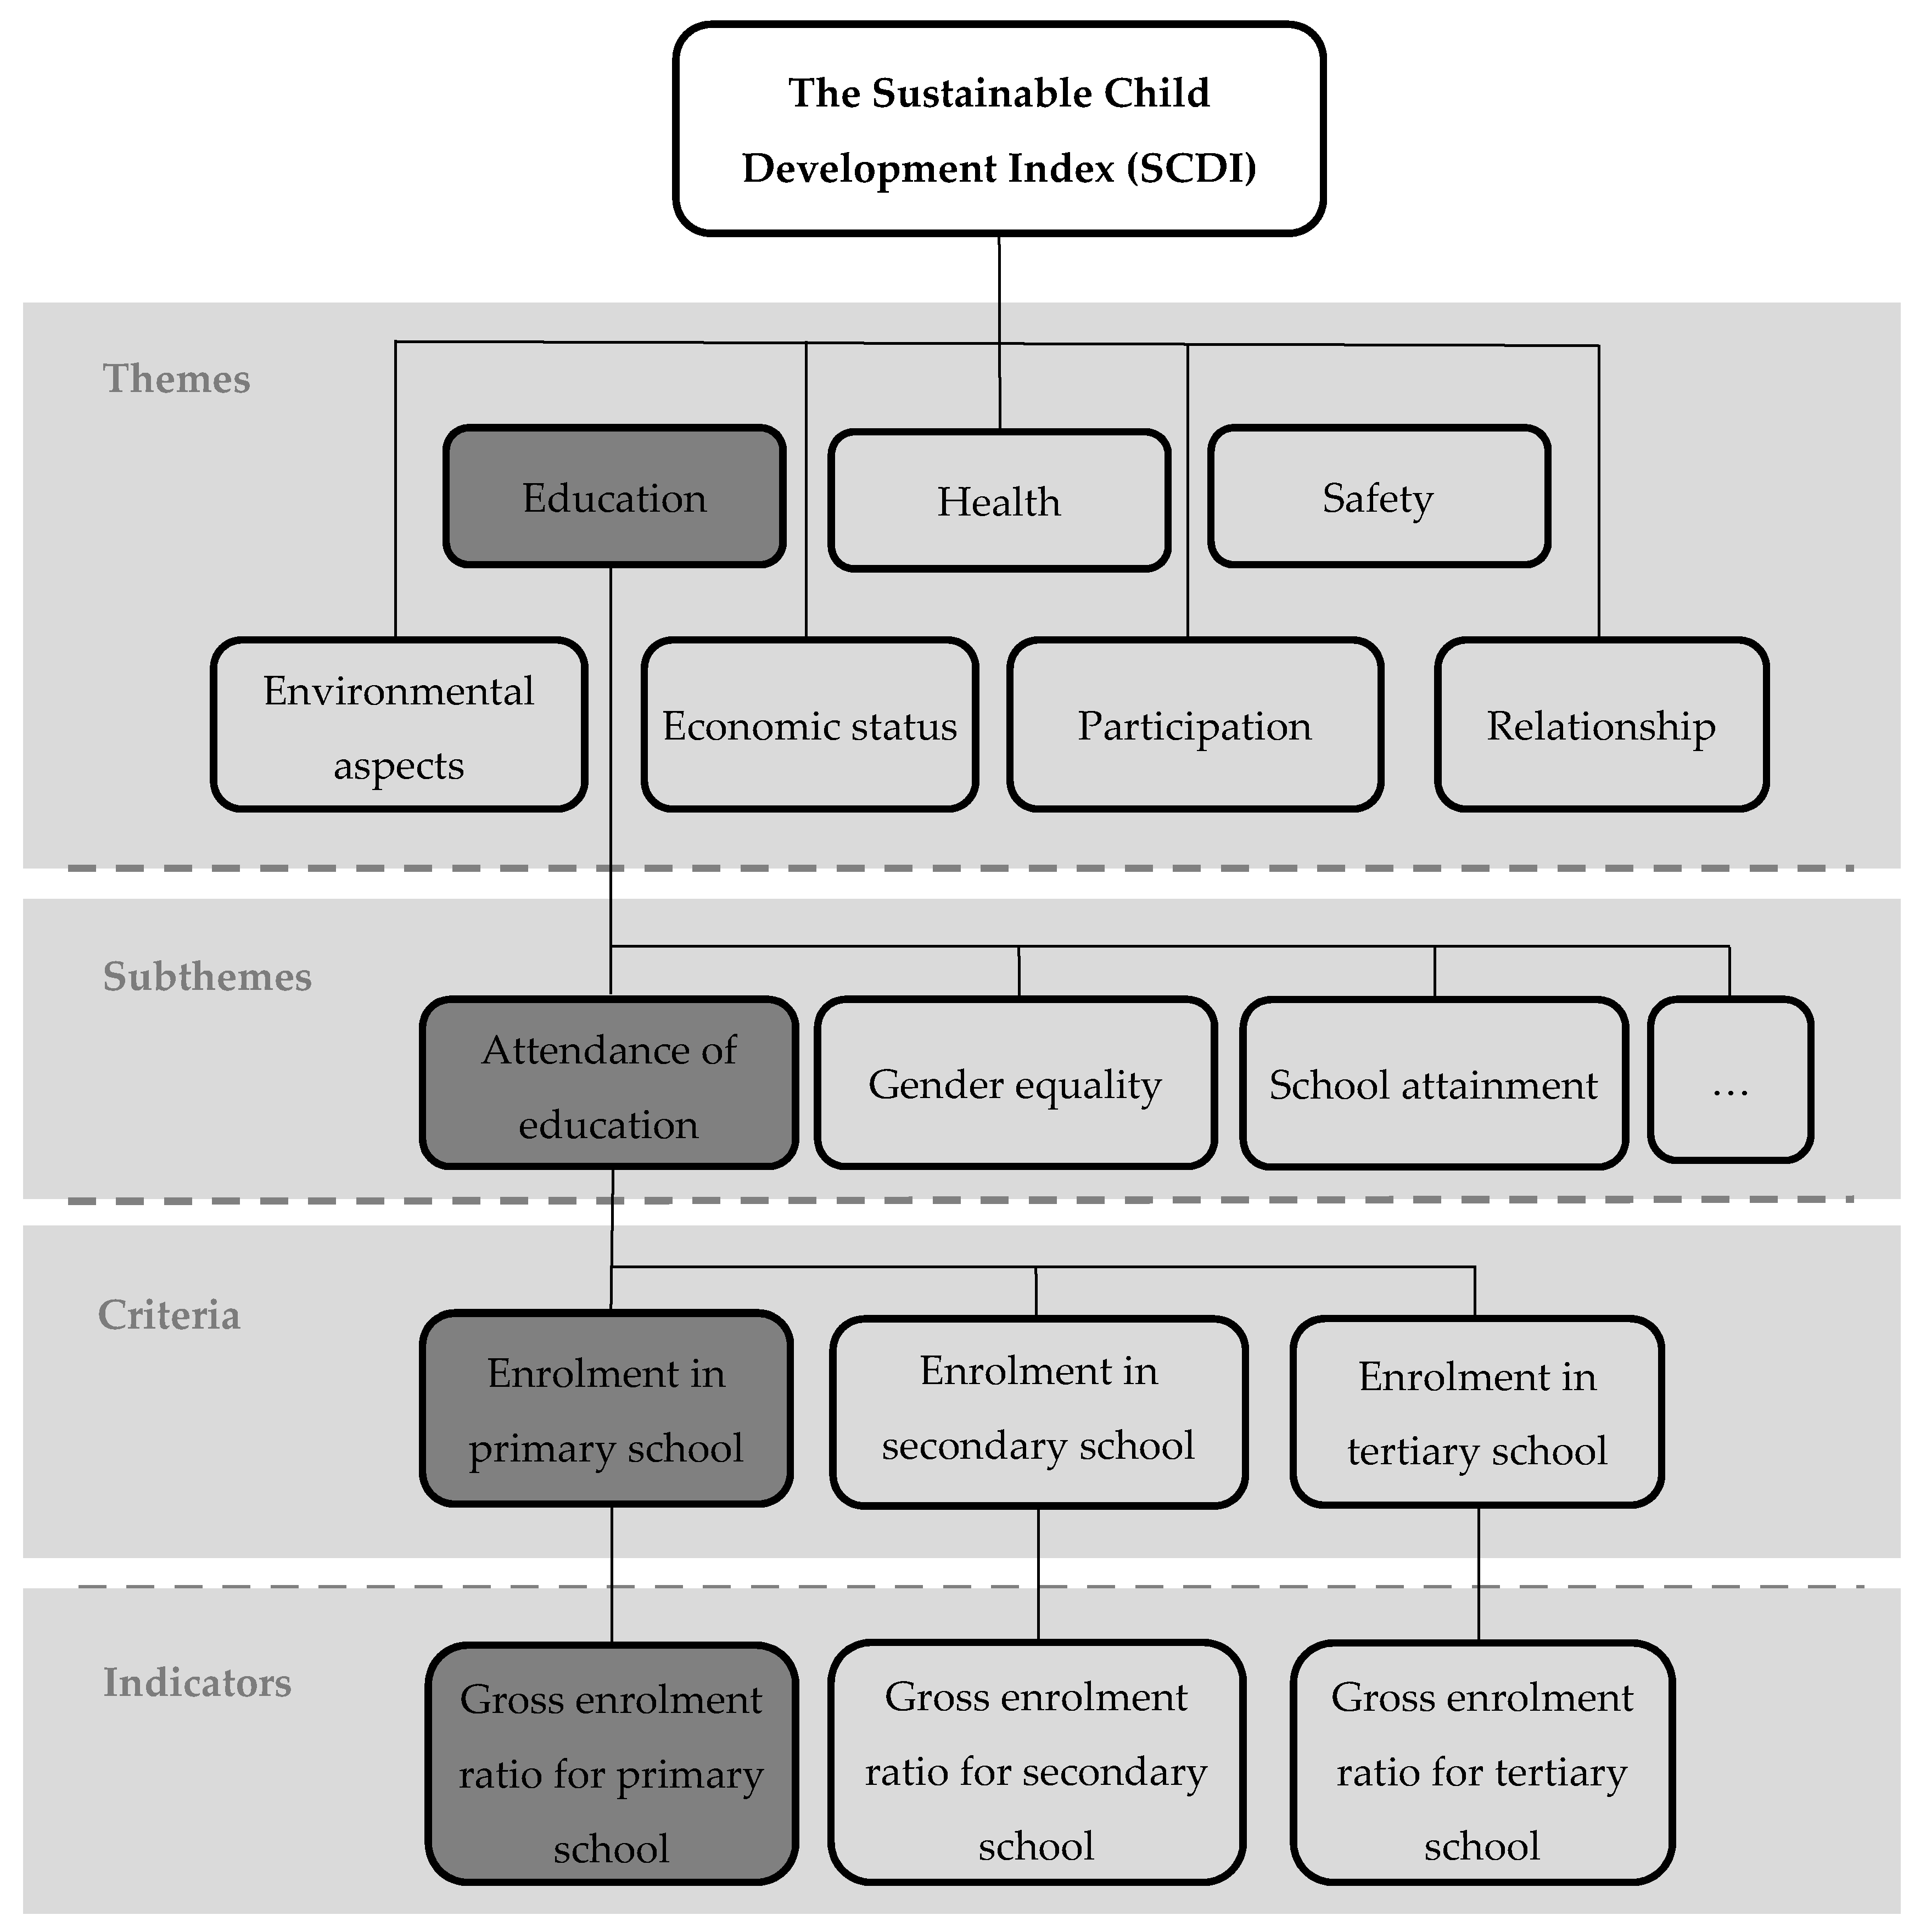
To address those aforementioned three gaps, Chang et al. [17] proposed the Sustainable Child Development Index (SCDI) framework which considers children as a stakeholder group, includes environmental aspects such as resource accessibility, and applies an indicator set based on available statistical data. Sustainable child development refers to a development that supports children to meet their needs in the present living state and protects children in order for them to have the ability for shaping their future prospects. The SCDI allows for comparing countries in terms of their status regarding sustainable child development and monitoring the trends on the status for countries by continuously updating the indicators over time. The SCDI framework considers seven themes related to sustainable child development: health, education, safety, economic status, relationship, and participation plus the newly suggested theme environmental aspects addressing resource accessibility. Children are those inheriting the resources from current generations. To protect inter-generational equity, resource condition such as accessibility to freshwater and the preservation of fossil fuels are of high concern. Therefore, the theme environmental aspects considers freshwater vulnerability and renewable energy consumption as starting points to address resource accessibility. Each of the seven SCDI themes is specified by 2–17 subthemes. Subthemes are further described by 1–7 criteria, which are measured by 1–4 indicators. For instance, the theme health specifies 17 subthemes (e.g., child mortality, risk behavior, mental health), described by 44 criteria (e.g., infant mortality, suicide, adolescent fertility), measured by 48 indicators (e.g., infant mortality rate, suicide rate and adolescent fertility rate). Details of topic and indicator collection and classification can be found in Chang et al. [17,20]. Figure 1 displays the overall structure of the SCDI framework. It provides a clear and consistent classification scheme for topics connected to child development including the theme environmental aspects. As an index for SD, the SCDI also closely reflects the Sustainable Development Goals (SDGs) [23,24]. For example, the SDG ‘ensure healthy lives and promote well-being for all’ is associated with the SCDI subthemes child mortality, maternal health, and hazardous pollutant, etc.; the SDG ‘ensure inclusive and equitable quality education and promote lifelong learning opportunities for all’ addresses the SCDI subthemes gender equality and attendance of education, etc.
In addition to the framework of the SCDI, an initial indicator set consisting of 66 indicators was proposed considering data availability [20]. Statistical data for each of the 66 indicators are available for at least 100 countries. The 66 indicators can clearly measure the criteria of sustainable child development and allow for a quantitative assessment with available statistical data.
1.2. Research Objective
On the basis of previous work of the authors [17,20], this study aims at establishing the SCDI by fine-tuning the indicator set, calculating the SCDI for countries, and analyzing the similarity between the SCDI and existing development indices.
Although the initial indicator set of 66 indicators was previously selected by Chang et al. [20], considering such a large number of indicators in one index may pose challenges for data collection as well as for indicator aggregation to an index, and thus impede the practicality of the SCDI. Therefore, the first focus of this study is to reduce the number of indicators for enhancing the practicality of the SCDI. To reduce the number of indicators, two steps were taken: (1) considering association (i.e., similarity) between indicators, and (2) balancing of the number of addressed countries and topics with regard to data availability.
A deeper analysis of the 66 indicators indicated that some indicators have a high association with each other, i.e., evaluate the topics in a similar way. For example, the three indicators neonatal-, infant-, and under-five mortality rate describe child mortality in a very similar manner. Therefore, one of these three indicators can be selected to represent the other indicators to address child mortality. That indicator (under-five mortality rate) is chosen as it has the highest data availability among the three indicators. By doing so, practitioners can use a smaller number of indicators to sufficiently address the considered topics.
Statistical data of each of the 66 indicators can be found for at least 100 countries. The limiting point is that the statistical data of each of the 66 indicators are available for different countries. The more indicators that are considered, the fewer the countries that can be addressed because of missing data. For example, for only nine countries (addressing 2.3% of child population in 2015 of 195 countries listed in the UNICEF database [25,26]), statistical data can be found for all the 66 indicators. In this case, the SCDI is hardly able to support comparing countries in terms of their status regarding sustainable child development in practice. On the other hand, the more countries that are considered, the fewer the topics as well as indicators that are addressed. For instance, 195 countries are considered when only three subthemes and seven indicators are addressed in the SCDI. This very limited consideration of topics leads to insufficient and biased assessment of sustainable child development status. Hence, a balance of the number of covered countries (as well as child population) and topics is needed to further reduce the 66 indicators for enhancing the practicality of the SCDI.
The second focus of this study is to construct the SCDI. Normalization and aggregation are used to combine the indicators into one index, thus to provide a summarized result [27,28]. Normalization is needed to transfer indicator values into a common scale (e.g., 0–1) by reference points [27,28]. By transferring indicator values into a common scale, the aggregation of different indicators into a dimensionless index is possible.
The third focus of this study is to compare the results of the SCDI with existing development indices (e.g., the HDI and the CDI) for clarifying their similarity. The comparison can examine if the SCDI evaluates the status of sustainable development for countries differently than existing development indices by considering children as key stakeholders and addressing topics in the context of SD. Therefore, the objective of this paper is to establish the SCDI for countries by:
- selecting a final indicator set for the SCDI;
- using normalization and aggregation methods to combine the final indicator set into one index, i.e., the SCDI; and
- comparing the results of the SCDI with existing development indices such as the HDI and the CDI.
2. Methods
In this section, the method for constructing the SCDI is presented. First, the method for selecting the final indicator set for the SCDI is introduced (Section 2.1). Methods for determining the SCDI scores for countries and country classification are then provided (Section 2.2). Afterwards, a way to compare the SCDI with other development indices is described in Section 2.3.
2.1. Selection of the Final Indicator Set to Be Used in the SCDI
A correlation analysis of the 66 indicators proposed by Chang et al. [20] was carried out to identify indicators that are strongly associated within individual themes (e.g., health or education). Correlation analysis can quantify the direction and strength of association between variables [29,30]. Spearman correlation was selected to perform the correlation analysis [29,30,31] since it is suitable to measure the association between two ranked variables (e.g., indicators). Spearman correlation does not require the making of any assumptions about the frequency distribution and the linear relationship between the two variables [29]. The value of the correlation coefficient varies between +1 and −1. A perfect Spearman correlation coefficient of ±1 occurs when a variable is in a perfect association to the other, i.e., the values of both variables are moving with fixed proportion. A pair-wise comparison was conducted for indicators within individual themes. A Spearman correlation coefficient of ±0.5 or ±0.7 is often used as a benchmark to determine strong association between variables [29,30]. In this study, a stricter benchmark, i.e., a Spearman correlation coefficient of ±0.8, was presumed to examine a strong association between indicators. If the Spearman correlation coefficient is higher than +0.8 or lower than −0.8, a strong association is assumed, i.e., the two indicators are similar and can represent each other. Therefore, one of the two indicators would be sufficient to describe/predict the performance of a specific topic. In that case, we selected the indicator which has statistical data for more countries and consider that indicator as the representative indicator. If the correlation analysis does not show a strong association between the two indicators, both indicators are kept because one indicator cannot represent the other.
In a second step, the number of the identified representative indicators was further reduced to balance the number of topics covered by the representative indicators and the number of countries for which data for the representative indicators are available. The number of representative indicators (as well as topics) addressed in the SCDI and their mutually covered countries were analyzed. Based on the results, the number of representative indicators was further reduced according to three principles. First, the final indicator set used in the SCDI shall consider at least 50% of the topics (i.e., themes, sub-themes and criteria) addressed by the representative indicators selected based on the results of the correlation analysis. Second, the number of mutually covered countries for which the SCDI can be calculated shall represent at least 70% of all 195 countries (i.e., 137 countries) listed in the United Nations Children's Fund (UNICEF) database, to consider countries across the five geographic regions, (namely Africa, Americas, Asia, Europe, and Oceania [32]). Third, apart from the coverage of countries, child population covered in the SCDI is the other consideration for assuring the practicality of the SCDI. At least 70% of the child population (of all 195 countries) shall be addressed to consider a large share of children. These three principles are value choices but are considered as suitable to foster the practicality of the SCDI. The final indicator set is used to construct the SCDI and measure the SCDI scores.
2.2. Determination of the SCDI Scores for Countries and Classification of Countries
To combine the final indicator set into one index, normalization and aggregation of the indicator values are required. The method is presented in the following two subsections.
2.2.1. Normalization of the Indicators of the Final Indicator Set
Indicators are usually measured in different units and scales. Normalization aims at transferring indicator values into a common scale. By doing so, the aggregation of different indicators into one index is possible. A scale of 0–l was chosen, and linear scaling was used as the normalization method to transform the indicator values into 0–1 scale. Linear scaling transformation requires two reference points for each indicator. Thus, two reference points (i.e., minimum and maximum reference point) were defined for each indicator of the final indicator set. The first reference point represents the target value for the indicators of the final indicator set. As the second reference point can be a minimum or maximum reference point, the lowest or highest indicator value collected for the indicators of the final indicator set among the considered countries from 2006 to 2015 was chosen. This setting supports a comparative assessment of sustainable child development status for countries within the same year or across years. Since the SCDI intends to reflect SD, the SDGs were used as a guide to define the first reference point (representing the target value). For example, SDG 3.9 includes the target “substantially reducing the number of deaths and illnesses from hazardous chemicals and air, water and soil pollution and contamination” [23]. In accordance with this target, the target value (here the minimum reference point) for the indicator ‘mortality rate attributed to household and ambient air pollution (per 100,000 populations)’ would be fixed to 0 which could represent the best case. Then, the other reference point is the maximum indicator value collected for the indicator among the addressed countries from 2006 to 2015, which is 300. If the definition of the target value for indicators cannot be guided directly from the SDGs, both reference points are defined based on maximum and minimum indicator values collected for the indicators of the final indicator set among the addressed countries from 2006 to 2015.
Having defined the reference points for the indicators of the final indicator set, the normalized indicator scores can be calculated. Depending on the type of indicator, the normalized indicator scores were calculated differently. In this study, three types of indicator, i.e., so-called positive indicators, negative indicators, and neutral indicators for sustainable child development, were distinguished. For positive indicators (e.g., ‘population using improved drinking-water sources’), a higher indicator value means a higher positive contribution to sustainable child development. For negative indicators (e.g., ‘under-five mortality rate’), a higher indicator value means a higher negative contribution to sustainable child development. The neutral indicators aim at reflecting equality topics (e.g., ‘sex ratio at birth’), namely expressing the relation between the indicator value and the equal state. In this sense, the closer the indicator value to the equal state of the topic (e.g., 1.05 for the topic sex ratio at birth [33,34], and 1.00 for the topic gender parity in school enrolment), the higher the positive contribution to sustainable child development results.
The normalized score for a positive indicator with data of a specific assessed country is measured according to Equation (1).
denotes the value for a positive indicator of a specific country . and represent the maximum and minimum reference points for , respectively.
The normalized score for a negative indicator with data of a specific assessed country is measured according to Equation (2).
denotes the value for a negative indicator of a specific country . and represent the maximum and minimum reference points for , respectively.
The normalized score for a neutral indicator with data of a specific assessed country is measured according to Equation (3).
denotes the value for a neutral indicator of a specific country . and represent the maximum and minimum reference points for , respectively. denotes the equal state value for a neutral indicator .
Equation (3) is not only used for normalizing the indicators of equality topics, but also for normalizing the indicators gross enrolment ratio in different education levels. The gross enrolment ratio presents the ratio of enrolled children of all ages to the total number of children in the official school age group. The ratio can exceed 100% when many children enter school late or repeat a grade. Repetition and postponement in education could imply negative conditions in education. In this context, 100% of the enrolment ratio was treated as the target value and also the equal state value in this study.
2.2.2. Aggregation of the Normalized Indicators into an Index—The SCDI and Country Classification
After normalizing the indicators of the final indicator set to the same scale, the indicators can be aggregated into the SCDI. Currently, no literature objectively provides information and the relative importance for the themes, subthemes and criteria of sustainable child development. Hence, equal weighting was presumed while conducting aggregation at indicator, criterion, sub-theme and themes level. That means all indicators, criteria, subthemes and themes were considered as being equally important. For instance, the criterion gender equality in enrolment and other criteria (e.g., gender equality in graduation) are presumed to have equal importance on the subtheme gender equality. The subtheme gender equality and other subthemes such as government support on education are suggested to have the same importance on the theme education. Then, the theme education and the other four themes considered in the SCDI have equal importance for measuring sustainable child development (i.e., the SCDI scores). Arithmetic average method was used for aggregating the scores from the indicator, criterion, sub-theme, theme to index level. As the values for the considered indicators range between 0–1 (see Section 2.2.1), the SCDI scores also range between 0–1. It is assumed that the higher the SCDI score is, the better is the sustainable child development status.
For example, the arithmetic average of the normalized scores of three indicators ‘gross enrolment ratio for primary school’ (representing the criterion ‘enrolment in primary school’), ‘gross enrolment ratio for secondary school’ (representing the criterion ‘enrolment in secondary school’) and ‘gross enrolment ratio for tertiary school’ (representing the criterion ‘enrolment in tertiary school’) is the aggregated score of the subtheme attendance of education. Then, the arithmetic average of the aggregated scores of the subtheme attendance of education and the other subthemes (e.g., gender equality) (see Figure 1) addressing the theme education represents the aggregated score of the theme education. Finally, the SCDI score for a country is calculated by arithmetically averaging the aggregated scores of the themes considered (e.g., health and education) in the SCDI.
As a next step, the SCDI scores for countries were classified into four levels of sustainable child development. This was done in order to communicate results on the status of sustainable child development for countries. The four levels were set as very high, high, medium and low sustainable child development, in accordance with the country classification approach applied in the HDI [35]. To define the four levels, the quartiles of the aggregated scores for each theme (calculated based on the collected indicator values in 2015) were used to derive three cutoff points. The quartiles of the aggregated scores for each theme were first determined. Then the three cutoff points were calculated by arithmetically averaging the quartiles of the aggregated scores for themes, in line with the defined aggregation method. The three cutoff points were determined to identify the four levels of sustainable child development, regarding the performance on the addressed indicators and the target values derived from the SDGs. For example, countries classified into very high sustainable child development level indicate that their performance reaches the highest 25% of the progress towards sustainable child development according to the defined target values. Moreover, the countries were assigned to the five regions, namely Africa, Americas, Asia, Europe, and Oceania defined by the UN [32], to present the status not only on a country level but also from a regional perspective.
2.3. Comparing the SCDI with Other Development Indices
The comparison aims at examining if the SCDI evaluates sustainable development for countries differently than existing development indices by considering children as the key stakeholder group and addressing topics in the context of SD.
The comparison of the SCDI, the HDI and the CDI was firstly conducted by using correlation analysis to describe the degree of association between the country ranking assessed by the three indices. The country ranking assessed by the SCDI for the year 2015 was compared with the country ranking assessed by the HDI for the year 2015 and the CDI for the year 2012. The HDI and the CDI are selected since they consider similar topics and cover a wide coverage of countries, as does the SCDI. The HDI has been widely adopted to measure the degree of countries’ development by considering a whole population-oriented perspective. The CDI applies a child-oriented perspective but does not allow a comprehensive assessment of child development in the context of SD. If the association between the SCDI, the HDI and the CDI is not strong, it is expected that the SCDI can assess the sustainable development status for countries in a different pattern than the HDI and the CDI by treating children as a key stakeholder group and addressing topics of child development in the context of inter-generational equity. That means the SCDI can complement existing development indices. In accordance with the correlation analysis conducted for selecting representative indicators (see Section 2.1), a correlation of indices is considered strong if the Spearman correlation coefficient is higher than +0.8. Moderate correlation between indices is recognized if the Spearman correlation coefficient ranges from +0.3 to +0.8 [29]. The country ranking of the HDI for the year 2015 and the CDI for the year 2012 can be found in the reports published by the UNDP [4] and the Save Children Fund [9] respectively.
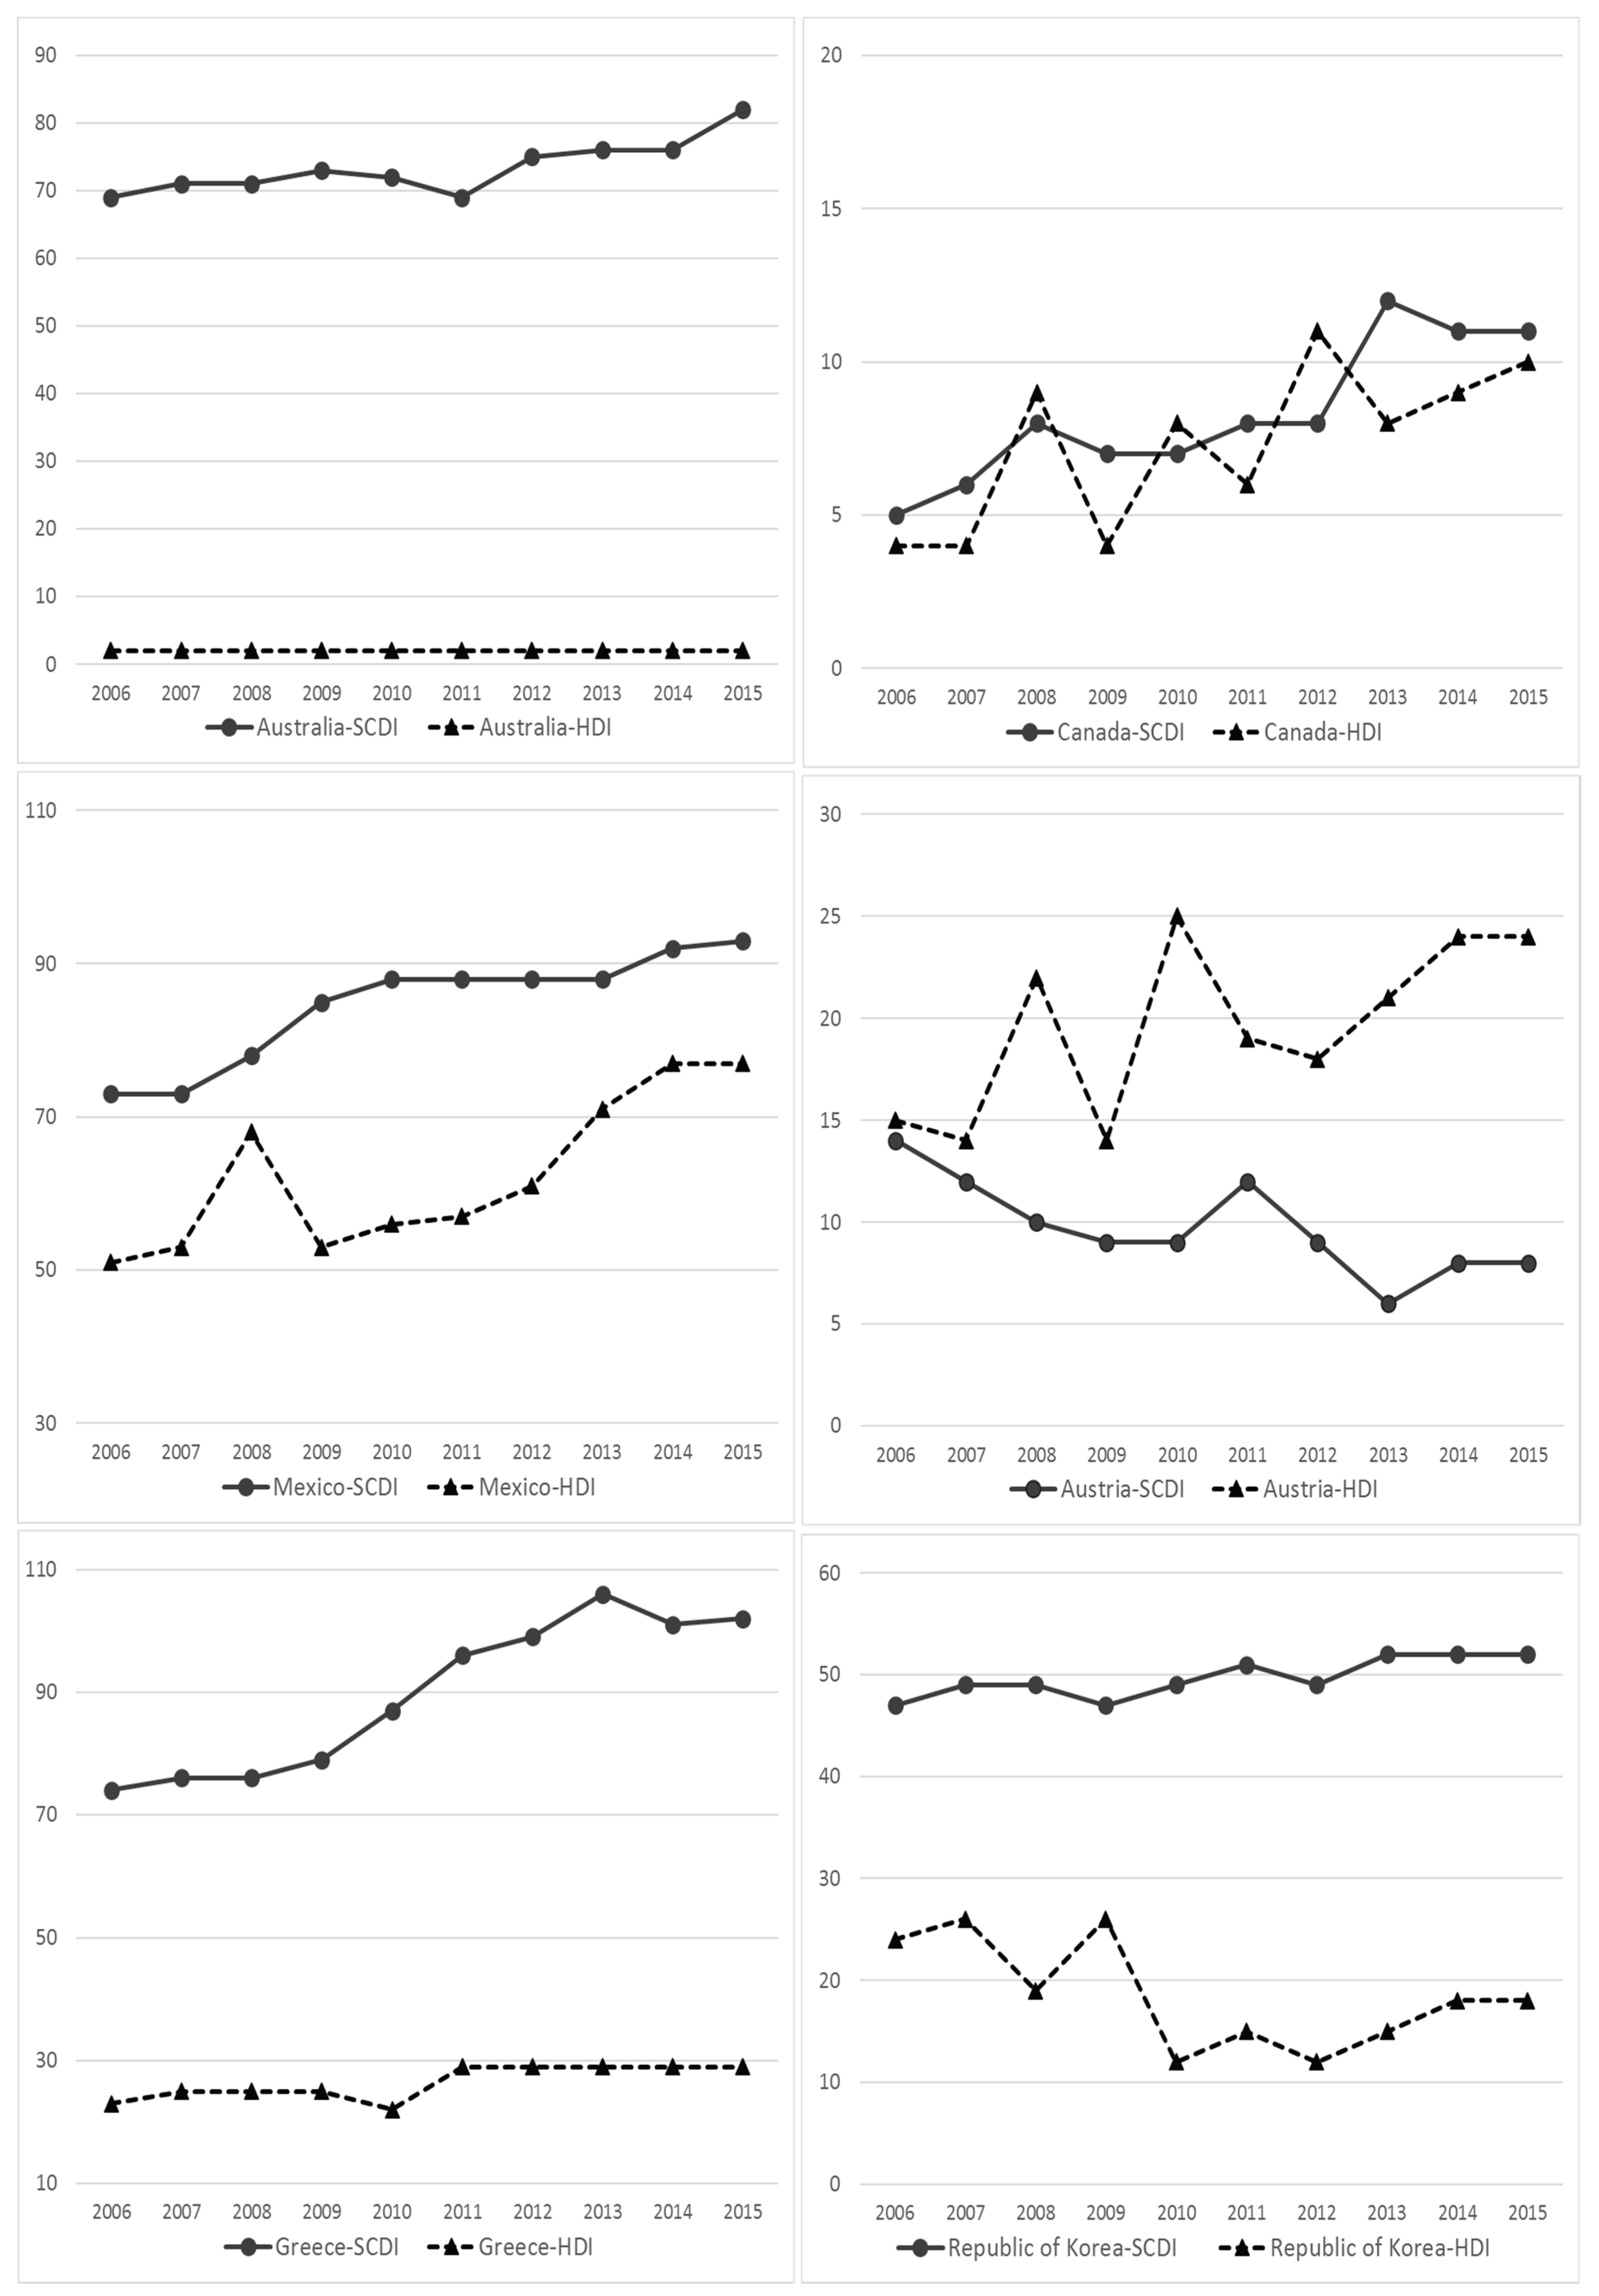
In addition, the country rankings from 2006 to 2015 assessed by the SCDI and the HDI were compared in order to investigate their similarity. The comparison focused on the Organization for Economic Cooperation and Development (OECD) countries to examine if those highly economically developed countries have a similar status of sustainable child development and human development. Among the OECD countries, six countries: Australia, Canada, Austria, Greece, Mexico, and Republic of Korea, were selected to consider a diversity of countries across the five geographic regions.
Moreover, since the country classification for the SCDI was constructed based on the HDI approach, comparing the results of country classification assessed by the SCDI and the HDI for the year 2015 is another way to check their similarity. For example, if one country is classified at medium development level in the SCDI but very high development level in the HDI, a difference is recognized in the SCDI country classification and the HDI country classification. Based on the comparison, an overview of the similarity between the SCDI country classification and the HDI country classification is provided.
3. Results
The following sections provide the results: the final indicator set for the SCDI (Section 3.1), the SCDI scores for 138 countries including country ranking and classification (Section 3.2), and the results of the comparison of the SCDI with the HDI and the CDI (Section 3.3).
3.1. Final Indicator Set for the SCDI
First, based on the results obtained from the correlation analysis (described in Section 2.1), 50 representative indicators were chosen from the original 66 indicators proposed by Chang et al. [20]. Detailed information of the correlation analysis (e.g., Spearman correlation coefficients for the 66 indicators) is shown in Table S1; the 50 representative indicators are listed in Table S2.
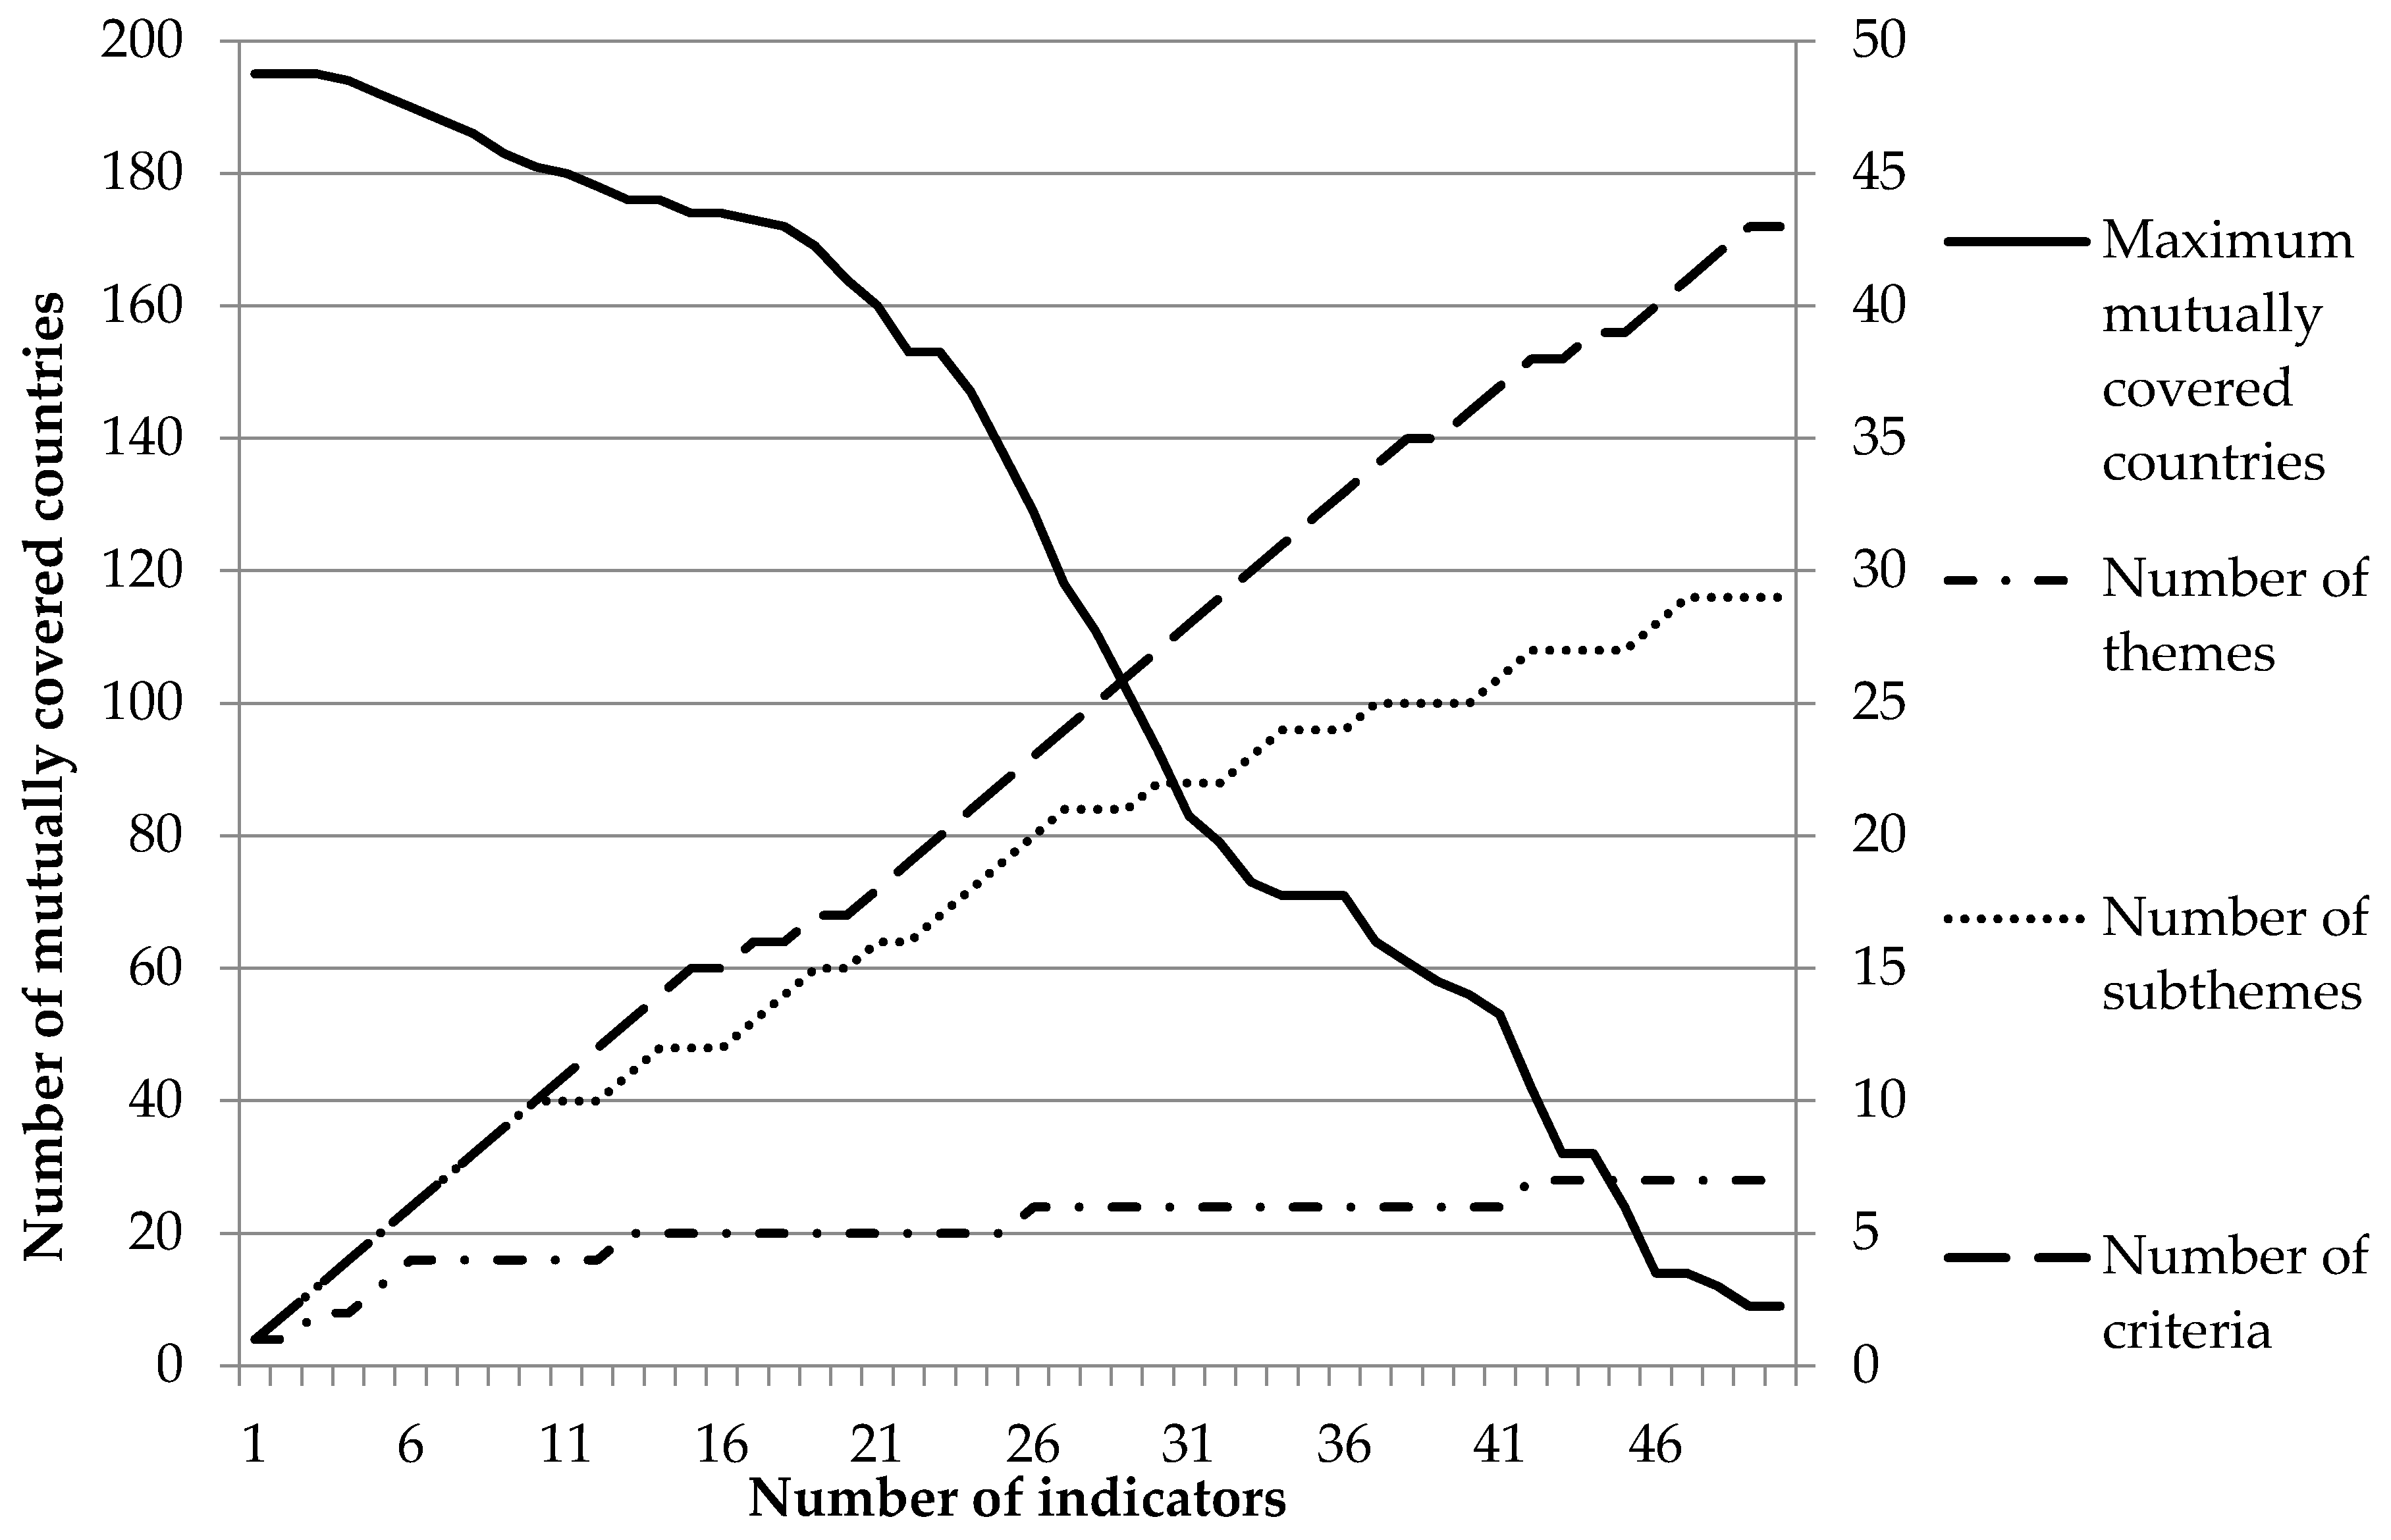
After selecting the 50 representative indicators based on correlation analysis, a second indicator selection process was conducted. An overview of the number of topics described by the 50 representative indicators and the number of countries for which data for the representative indicators are available is provided in Figure 2. Naturally, when more indicators are considered in the SCDI, more topics are considered (see dotted lines in Figure 2) as well. At the same time, the number of countries mutually covered by the indicators decreases. Only nine countries can be assessed by the SCDI when all the 50 indicators (as well as their considered topics, i.e., seven themes, 29 subthemes, and 43 criteria) are included. Details of the topics addressed by the 50 indicators can be found in Table S2.
The second indicator selection process follows the three principles defined in Section 2.1 to balance the number of topics, countries and child population covered in the SCDI. Table 1 shows that 138 (70.7%) countries and five regions are covered when 25 representative indicators are used for constructing the SCDI (also see Figure 2). In this context, 85.9% of the child population can be addressed in the SCDI (as shown in Table 1). While using these 25 representative indicators, five themes (health, education, safety, economic status and environmental aspects), 19 subthemes (e.g., nutrition, risk behavior, gender equality, violence and crime, macroeconomic status and freshwater vulnerability) and 22 criteria (e.g., low birth weight, alcohol use, gender equality in enrolment, criminal victimization, youth unemployment and risk of depleting freshwater resources) would be addressed in the SCDI, including more than 50% of the topics considered by the 50 indicators. When 26 representative indicators would be considered for constructing the SCDI, the share of mutually covered countries would decrease from 70.7% to 66.2%, not fulfilling the principle (defined by the authors) that the covered countries should represent at least 70% of countries. Thus, the 25 representative indicators are used as the final indicator set for constructing the SCDI. This final indicator set including the covered topics and data sources is listed in Table 2.
3.2. The SCDI Scores and Country Classification
Following the normalization and aggregation methods defined in Section 2.2, the SCDI scores for 138 countries for the year 2015 were determined. First, among the 25 indicators of the final indicator set (selected in Section 3.1), the reference points for 21 indicators were defined with regard to the targets of the SDGs. For the other four indicators, the reference points were defined based on the collected indicator values. These four indicators are ‘gross enrolment ratio in primary school’, ‘gross enrolment ratio in secondary school’, ‘government expenditure on education as percentage of GDP’ and ‘public debt as percentage of GDP’. The reference points used for normalizing the 25 indicators are listed in Table 2. Second, according to the defined reference points and Equations (1)–(3) (see Section 2.2.1), the values for the 25 indicators were transferred into scores between 0–1. Then, the normalized scores for the 25 indicators were aggregated into the SCDI scores for the 138 countries. The indicator values, normalized scores, the SCDI scores, as well as the country ranking for the 138 countries can be found in Table S3. Table 3 provides an overview of the results of the SCDI by showing an extract from the country ranking, namely the 20 highest and 20 lowest ranks. The result shows that Iceland, Bhutan, Norway, Sweden and Finland are the five highest-ranked countries based on the SCDI scores. By having a better performance in the subthemes freshwater vulnerability and renewable energy consumption considered for the theme environmental aspects, Bhutan, Uruguay and Paraguay have higher ranks than Denmark and Canada. Mauritania, Yemen, Lesotho, Namibia and Niger are the five lowest-ranked countries.
Furthermore, the SCDI scores and the according country ranking were determined for the year 2006 in order to observe the trend of sustainable development status for countries. Comparing the 2015 SCDI scores to the 2006 SCDI scores, 104 (75%) out of the 138 countries show an enhancement in sustainable child development status. In particular, nine countries (i.e., Armenia, Bhutan, Cambodia, Ethiopia, Lao People’s Democratic Republic, Lesotho, Liberia, Nepal and Niger) have the largest increase in SCDI scores during the 10-year period. The performance, especially for the themes health and economic status, has improved among these developing countries. By contrast, Cyprus, Greece, Mexico, Spain and Ukraine are the five countries with the largest declines of SCDI scores due to their decreasing performance for the themes health and economic status. The annual SCDI scores and country ranking from 2006 to 2015 are provided in Table S4.
According to the SCDI scores for the year 2015, the 138 countries were classified into four sustainable development levels. Table 4 presents the interval of the SCDI scores and the numbers of classified countries of the four levels of sustainable child development. The cutoff points to group the countries into the four levels are derived as 0.66, 0.75 and 0.81 according to the country classification approach defined in Section 2.2.2. Correspondingly, 15, 37, 65 and 21 countries were categorized as countries with very high, high, medium, and low sustainable child development levels, respectively. That is, the performance of 15 countries (11%) reach the highest 25% of the progress towards sustainable child development with regard to the defined target values. In addition, a majority (62%) of the covered countries were assessed as countries with medium and low sustainable child development. It indicates that many countries are indeed in critical conditions to reach the defined targets of sustainable child development. The country classification for the 138 countries is provided in Table S3.
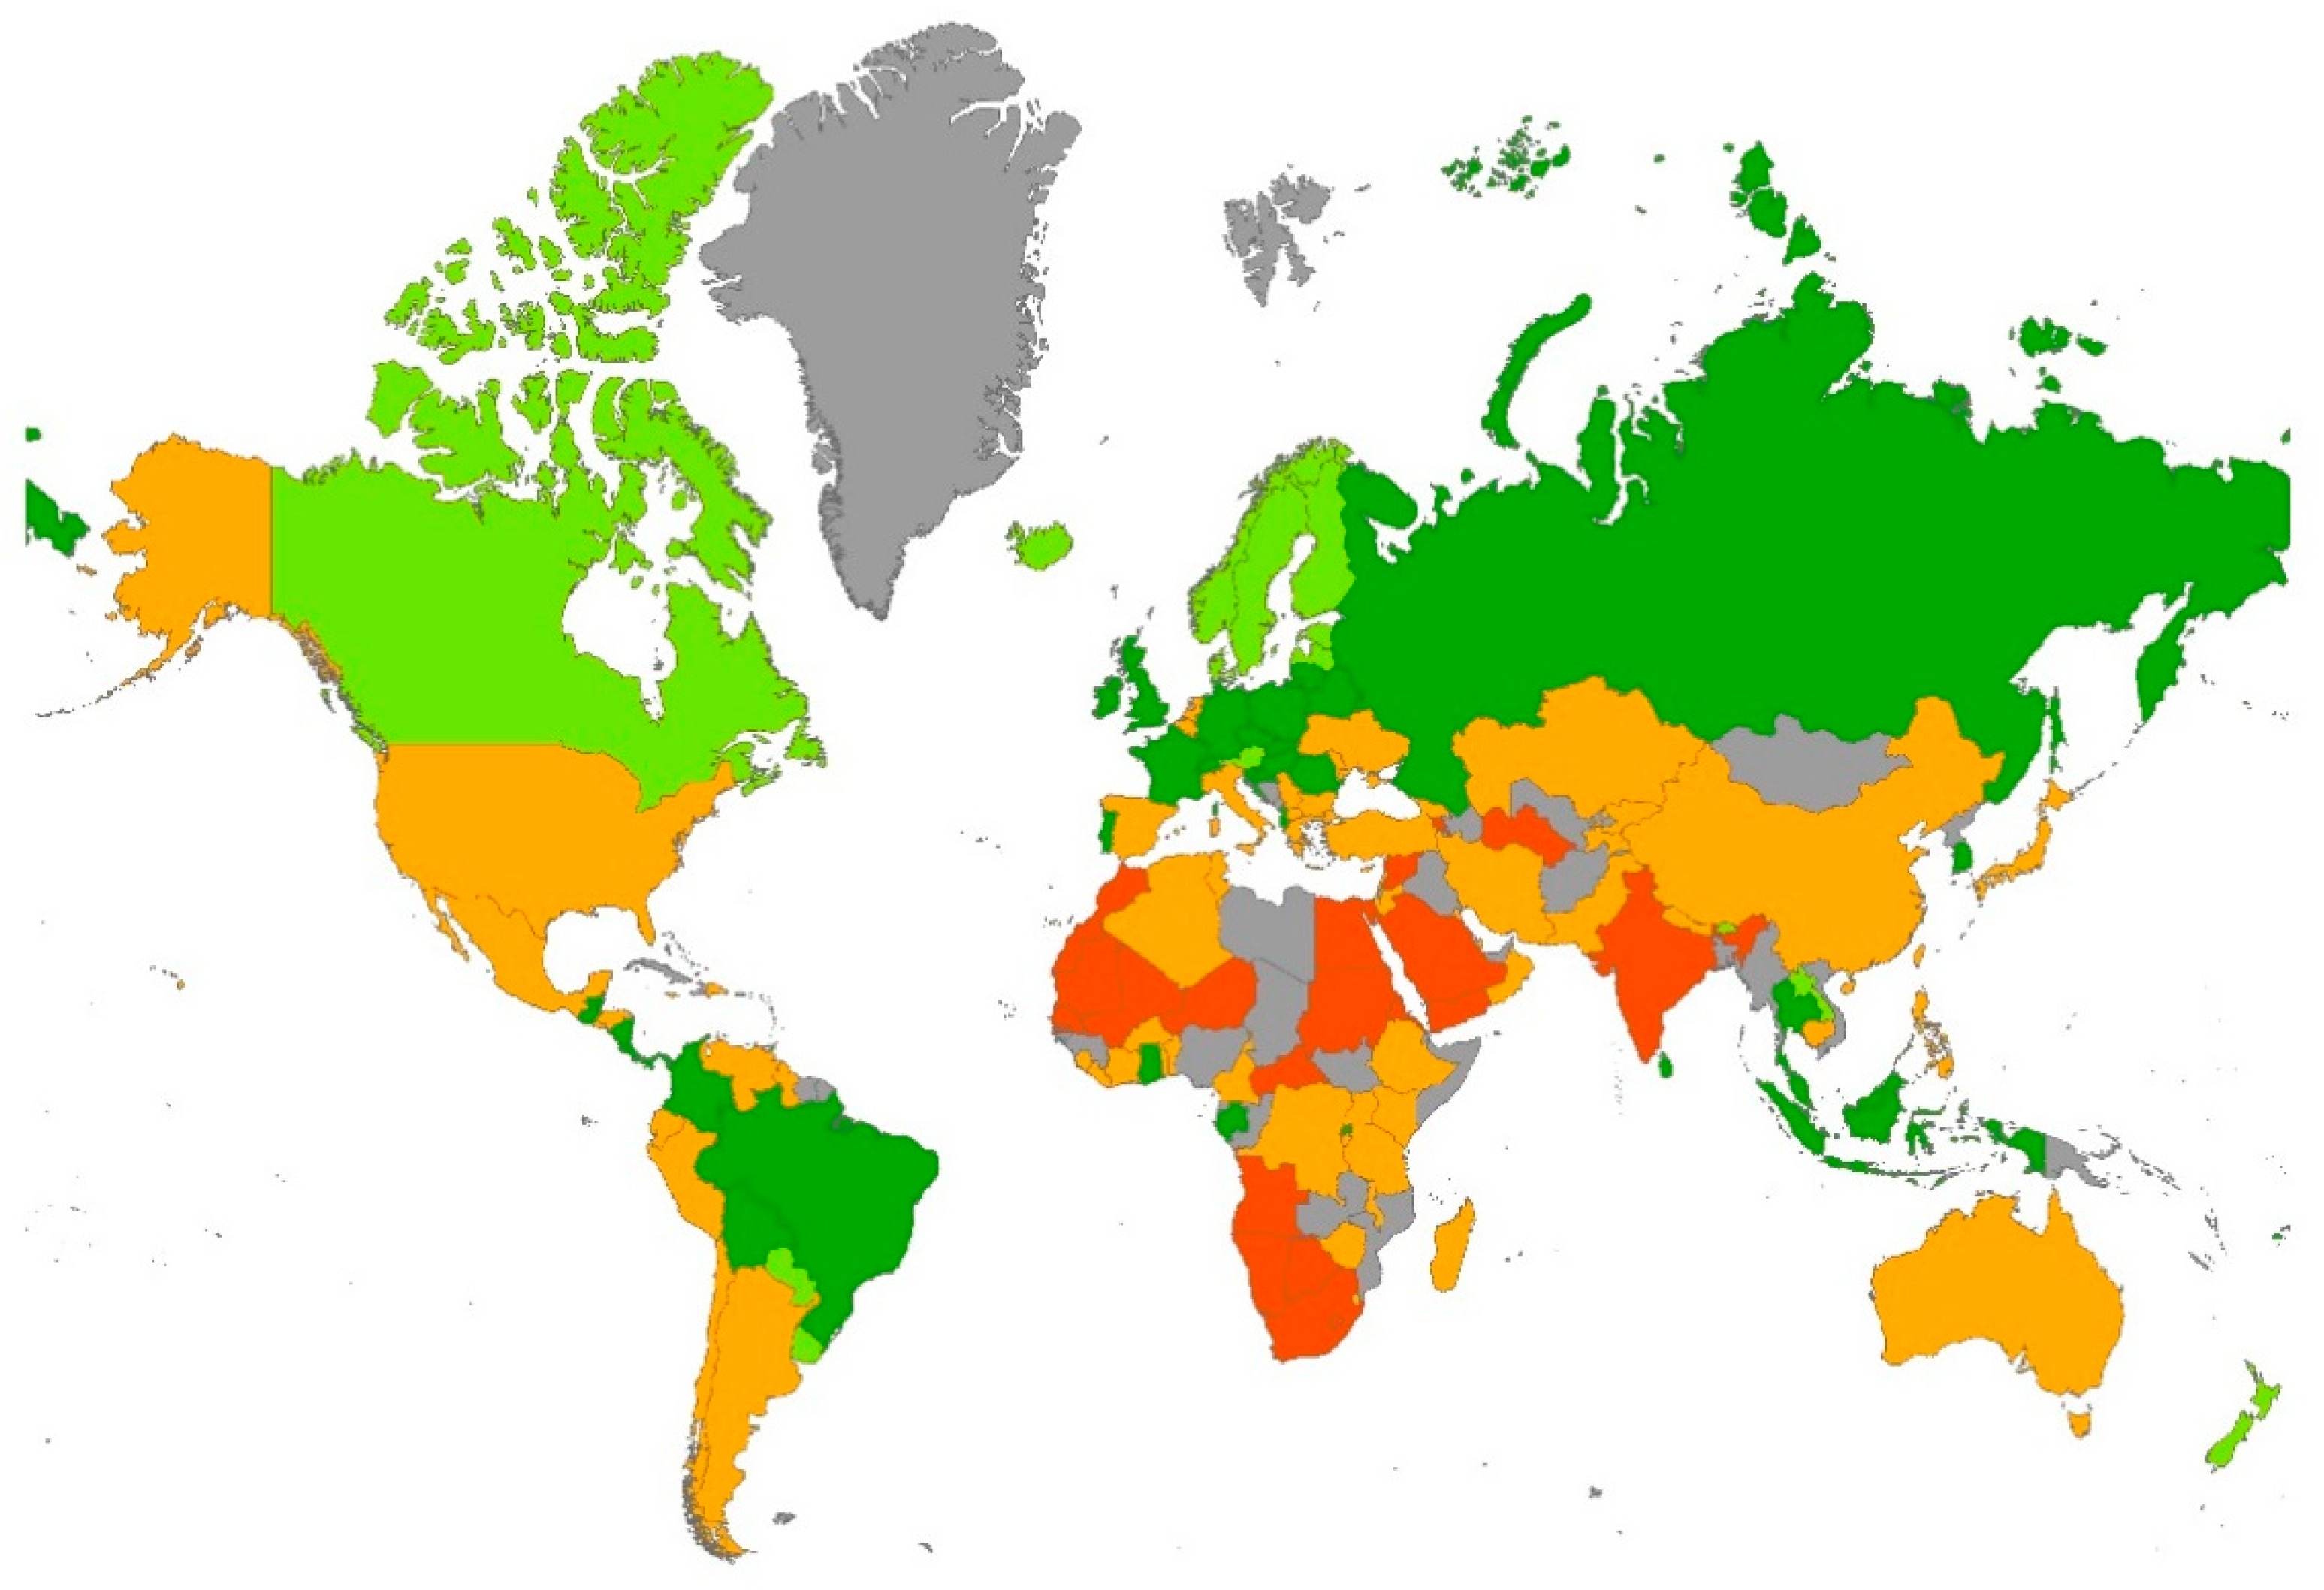
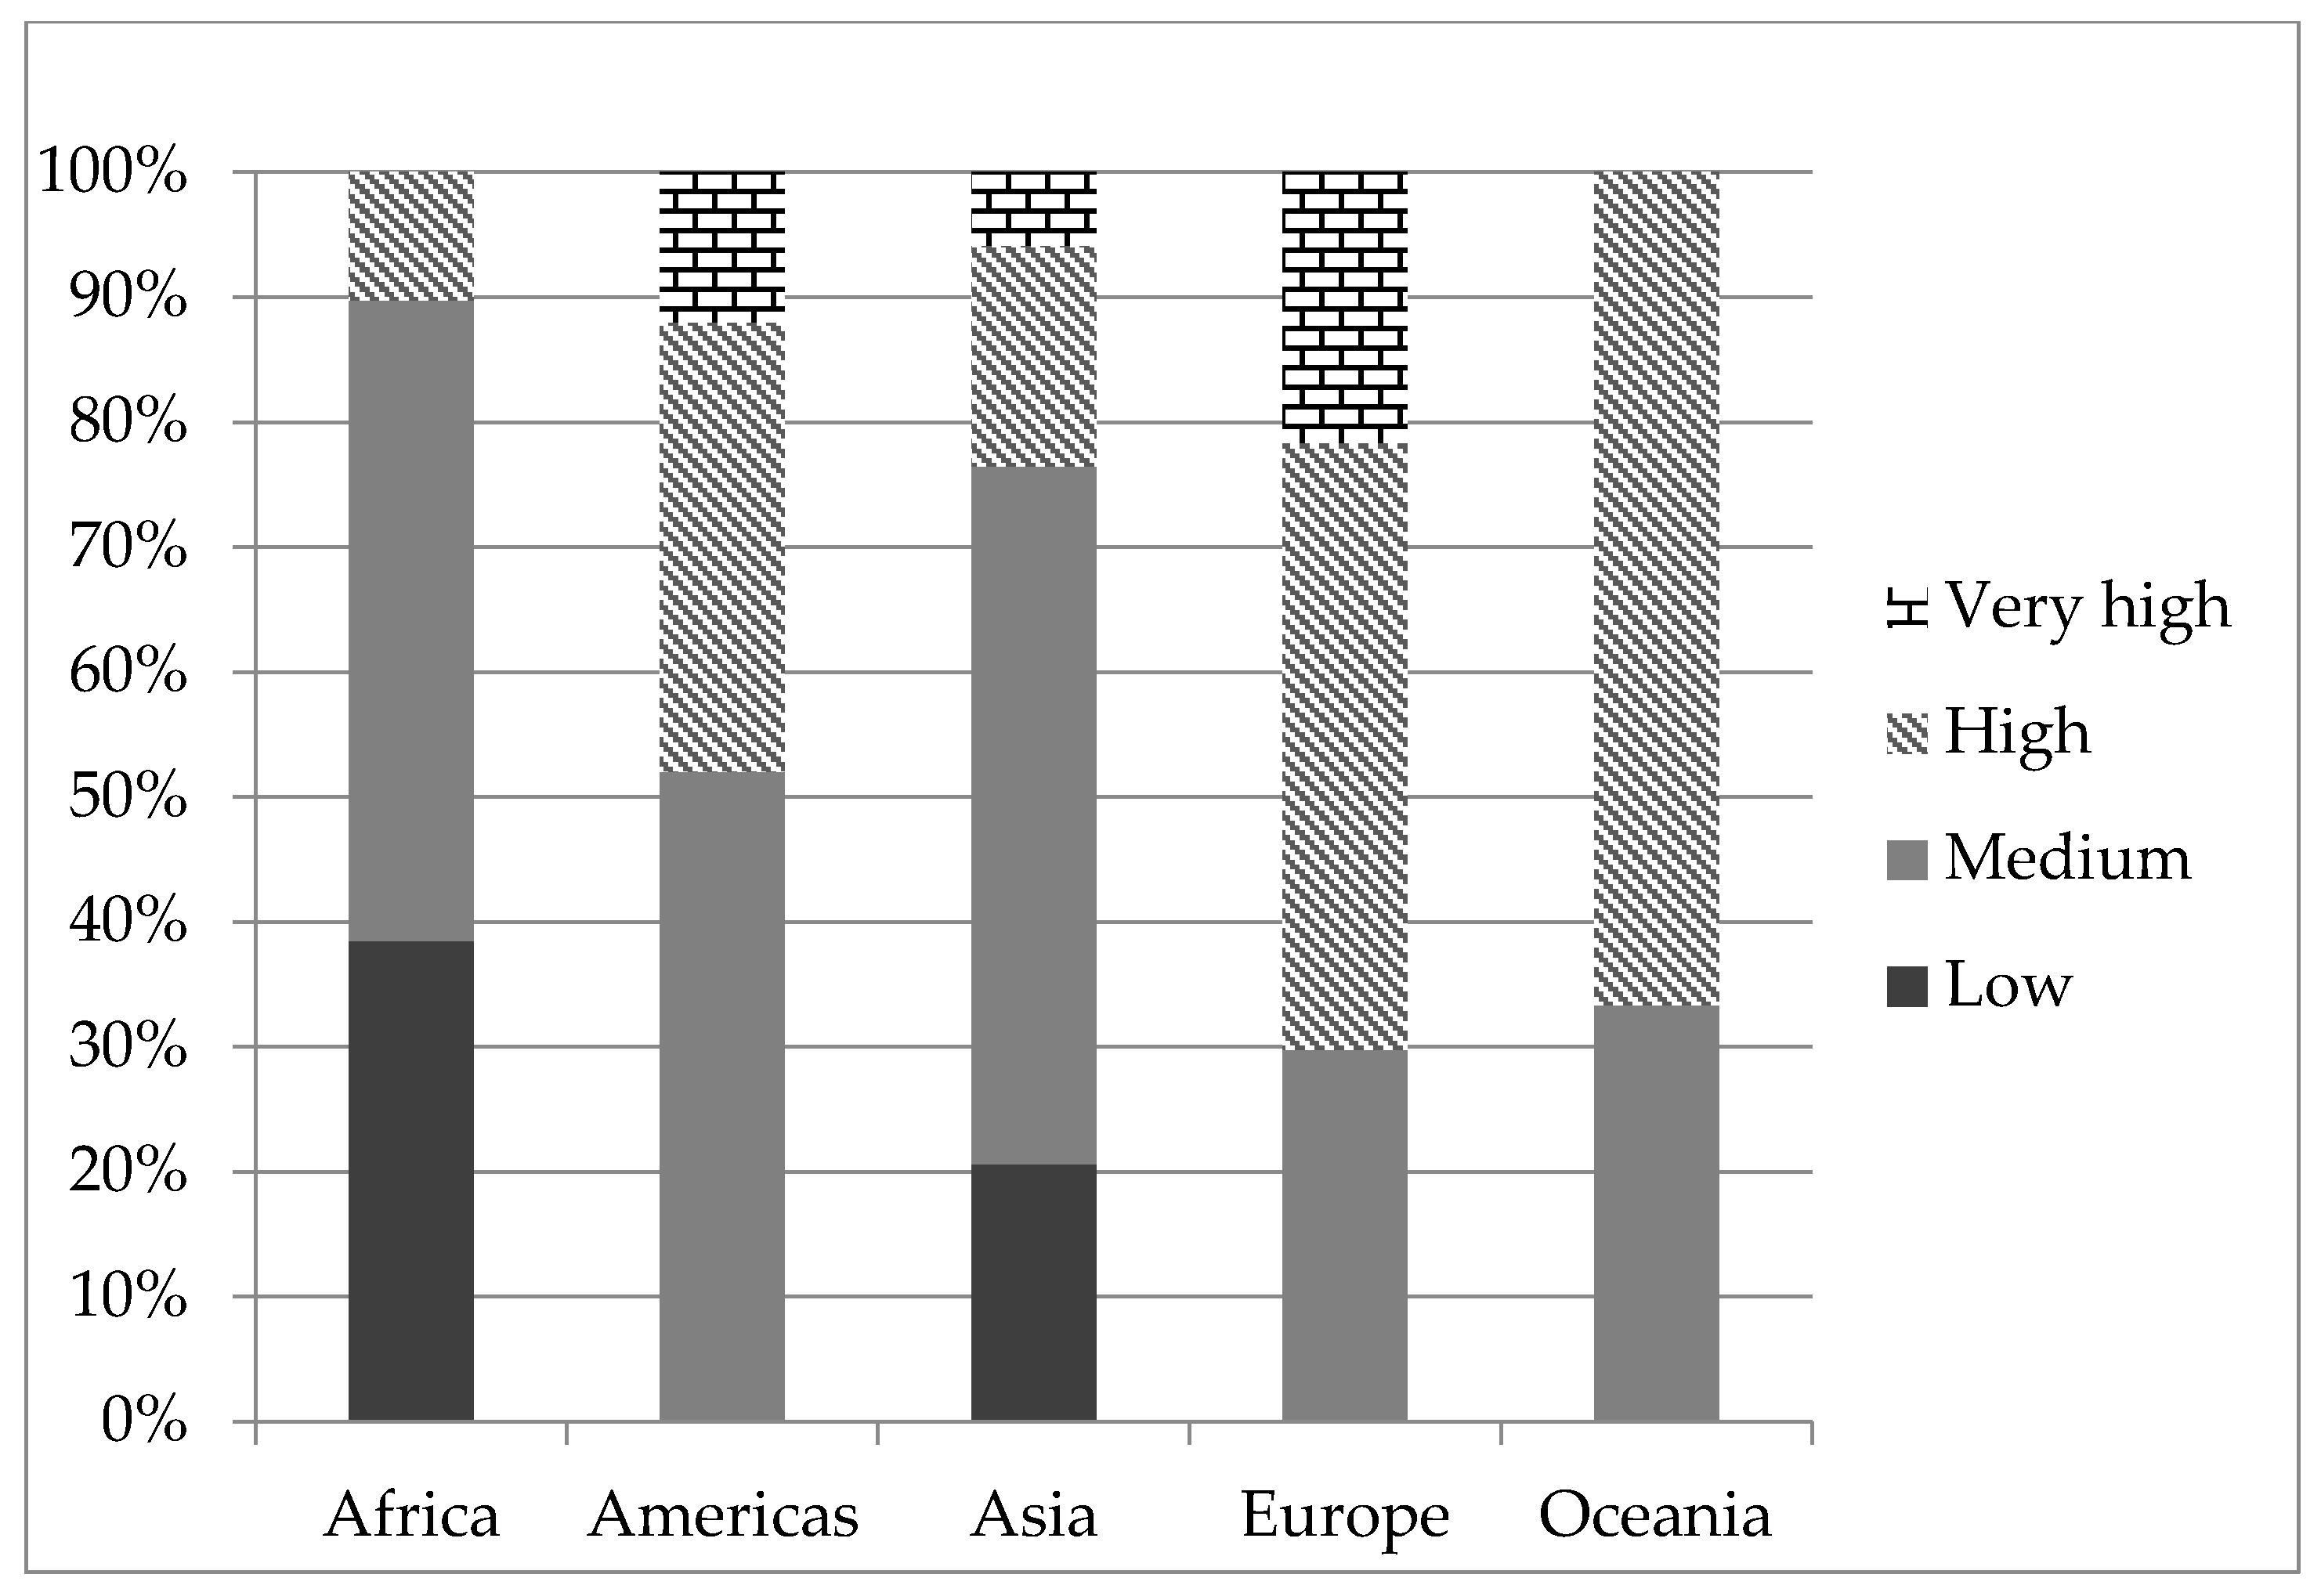
The country classification significantly points out the great regional inequality on sustainable child development. Figure 3 presents an overview of the status of sustainable child development for countries worldwide. In Figure 3, countries assessed with very high, high, medium and low sustainable child development are marked in light green, dark green, orange and red, respectively. The grey areas indicate the countries not covered in the SCDI at present. As shown in Figure 3, European countries generally have better sustainable child development while a large share of African and Asian countries has worse sustainable child development. Furthermore, Figure 4 shows that 70% of European countries are classified as countries with very high and high sustainable child development. In the Americas, 48% of countries are classified as those with very high and high sustainable child development. Several Central and South American countries e.g., Paraguay and Uruguay, show their good performance in sustainable child development (see Table 2). On the contrary, 90% of African and 76% of Asian countries are assigned to medium and low sustainable child development levels, as shown in Figure 4. These African and Asian countries (e.g., Niger, Yemen and Namibia) in general have lower performance in the themes economic status (e.g., access to electricity and youth unemployment), health (e.g., low birth weight) and environmental aspects (e.g., freshwater vulnerability). The results highlight the urgent need to improve the living conditions related to sustainable child development topics for most African and Asian countries. Children and youths dominate the populations of Africa. Children under the age of 15 accounted for 41% of the population, and youths aged 15–24 accounted for a further 19% in Africa in 2015 [46]. This result on the low level of sustainable child development is also in line with the statement claimed by UNICEF that nine out of 10 of the world’s children surviving in extreme poverty (less than US$1.90 a day) will live in sub-Saharan Africa in 2030 [25]. Note, some OECD countries, such as Australia, Netherlands, Japan, Israel, Italy and Turkey, were assigned to the medium sustainable child development level. One key reason is their weak performance in freshwater vulnerability and renewable energy consumption for the theme environmental aspects.
3.3. The SCDI Compared to the Human Development Index (HDI) and Child Development Index (CDI)
To evaluate the similarity between the SCDI and the selected existing development indices (i.e., the HDI and the CDI), a correlation analysis was conducted. The correlation coefficient of the country ranking assessed by the SCDI and HDI for the year 2015, the country ranking assessed by the SCDI for the year 2015, and the CDI for the year 2012 is 0.476 and 0.489, respectively. Therefore, the analysis implies that the SCDI has a moderate association with the HDI and the CDI. The results point out that the SCDI can evaluate the sustainable development status for countries differently than the HDI and the CDI. The full country rankings of the SCDI, the HDI and the CDI can be found in Table S5.
Three out of five themes of the SCDI (health, education and economic status) consider similar topics as the HDI (i.e., long and healthy life, knowledge, and a decent standard of living). Among the four indicators applied in the HDI, one indicator is addressed in the SCDI. The indicator ‘gross national income per capita at purchasing power parity’ used in the HDI is addressed in the SCDI by its representative indicator ‘access to electricity (percentage of population)’ in the theme economic status. The two indicators ‘expected years of schooling’ and ‘mean years of schooling’ which describe the topic knowledge, and the indicator ‘life expectancy’ which measures the topic health in the HDI, are not considered in the SCDI. Although the two indices tackle similar topics and one identical indicator, their moderate correlation supports the fact that the SCDI can differently assess a country’s sustainable development status from a child’s point of view than a whole population-oriented concept. The SCDI contributes to development index studies by treating children as key stakeholders in sustainable assessments.
All of the three topics considered in the CDI (i.e., health, education and nutrition) are covered in the SCDI. Two out of three indicators used in the CDI are also addressed in the SCDI. The two indicators ‘under-five mortality rate’ and ‘primary school enrolment rate’ are used in the CDI and the SCDI. Nutrition is measured by two different indicators, ‘percentage of under-fives who are underweight’, and ‘percentage of infants born with low birth weight’, that are used in the CDI and SCDI, respectively. The moderate correlation of the SCDI to the CDI shows that although the SCDI and the CDI are both children-oriented indices, addressing environmental and additional topics (such as safety and economic status) in the SCDI could lead to different sustainable development status for countries than the CDI.
The trend of development status for Australia, Canada, Mexico, Austria, Greece and Republic of Korea assessed by the SCDI and the HDI were compared. Significant differences were found between the country rankings assessed by the SCDI and the HDI (see Figure 5). For example, Australia and Greece were both assessed as the 30 highest-ranked countries by the HDI from 2006 to 2015, but ranked between the 70th and 110th by the SCDI from 2006 to 2015. This indicates that the HDI and the SCDI indeed provide different assessment results of national development status by considering different stakeholder groups and addressing topics in the context of SD. The OECD countries are usually recognized as highly economically developed countries. Nevertheless, the comparison of country rankings assessed by the SCDI and the HDI from 2006 to 2015 points out that such highly economically developed countries may have decreasing progress on sustainable child development (e.g., Greece). Ideally the trends of the country rankings assessed by the SCDI and the HDI shall both improve over time. The dissimilar trends (e.g., for Austria and Republic of Korea) could imply an incomplete consideration of children in development policies. The results further support the fact that the SCDI can be a complementary assessment to the existing development indices to support decision making. The full country ranking of the SCDI and the HDI from 2006 to 2015 can be found in Table S4.
Furthermore, the comparison of the results of country classification between the SCDI and the HDI was conducted to investigate their similarities and differences. The country classifications of the SCDI and the HDI are listed in Table S6. Out of the 138 countries (66%) assessed in the SCDI, 91 are evaluated with a different development level in the HDI; 22 countries are determined with at least two development levels difference between the SCDI and the HDI. For instance, Argentina and Chile are assigned to a medium development level in the SCDI but to a very high development level in the HDI. This outcome is in line with the correlation analysis of the SCDI and HDI, supporting the fact that the SCDI can be applied as a complementary assessment to the existing whole population-oriented development indices to provide a more comprehensive assessment of a country’s sustainable development performance with a focus on children.
Moreover, it is shown that the HDI is strongly associated with the CDI (correlation coefficient of 0.925). The results of the HDI can be used to image the outcome of the CDI, and vice versa. One key reason could be that the topics (e.g., life expectancy and child mortality) considered in the HDI and the CDI have a strong association.
4. Discussion
The following sections summarize the key findings and the contribution of the SCDI to sustainability assessment (Section 4.1) and present the limitations of the SCDI (Section 4.2) and an outlook for future research (Section 4.3).
4.1. Key Findings and Contribution of the SCDI to Sustainability Assessment
This study completes the establishment of a new index for assessing sustainable child development, namely the Sustainable Child Development Index (SCDI). The SCDI at present addresses five themes health, education, safety, economic status, and environmental aspects described by 25 indicators. The SCDI contributes to sustainability assessment as it addresses the inseparable relationship between children, inter-generational equity and sustainable development in an index. Furthermore, the SCDI is a development index that uniquely takes children as the core stakeholder group and addresses the topics with the triple-bottom-line thinking. As an index related to SD, the targets of the SDGs are employed to derive the reference points for determining the SCDI.
The SCDI allows comparing sustainable child development status for countries and supports monitoring the trend of the status of countries by continuously updating the indicators over time. Great regional inequality in sustainable child development exists among the assessed 138 countries and five regions; 90% of African and 67% of Asian countries are classified as countries with medium and low sustainable child development. The results reflect the urgent need for improving living conditions for most African and Asian countries. In addition, some OECD countries (e.g., Austria and Republic of Korea) have dissimilar trends on the status of sustainable child development and human development. This result implies that incomplete consideration of child development policies may exist in those highly economically developed countries. The study demonstrates that the SCDI can complement existing development indices (e.g., the HDI) by regarding children as a key stakeholder group and addressing topics (such as environmental aspects and safety) in terms of inter-generational equity for providing a more comprehensive evaluation of SD.
4.2. Limitations of the SCDI
Some research limitations regarding the SCDI remain. The limitations include: (1) a restricted number of indicators, topics and countries due to low data availability; (2) different reference years of statistical data for the indicators; and (3) value choices made for indicator selection and index calculation.
4.2.1. Limited Data Availability
Data availability is a key factor that leads to the need for balancing the number of considered topics (and indicators) and the countries covered in the SCDI. In order to balance the number of considered topics as well as indicators and countries covered, not all of the identified topics and indicators (e.g., for the themes relationship and participation) were considered in the SCDI. The limited inclusion of topics and indicators in the current SCDI may lead to incomplete and biased evaluation of the sustainable child development status for countries.
In addition, low data availability also results in limited consideration of indicators in specific themes (e.g., environmental aspects, relationship and participation). For instance, only two indicators were collected and then considered for the theme environmental aspects. Chang et al. [17] newly proposed the theme environment aspects in the SCDI framework for addressing triple-bottom-line thinking. Freshwater vulnerability and renewable energy consumption were selected as two subthemes as starting points for the theme environmental aspects. Other potential topics (such as soil quality) associated with resource accessibility usually have indicators with limited statistical data on country level. Databases need to be developed and more indicators addressing resource accessibility need to be considered in the SCDI framework for a more comprehensive coverage in order to protect inter-generational equity. It is notable that environmental pollution, e.g., air pollution, was classified under the theme health instead of the theme environmental aspects since environmental pollutants have been treated as a direct health determinant in the literature (e.g., the SDGs). Furthermore, indicators for the themes relationship and participation are not addressed in the present SCDI framework. Since relationship and participation are relatively new topics in the evaluation of sustainable child development, existing indicators usually have data only available for a few countries (e.g., the OECD countries). These themes (e.g., environmental aspects, relationship and participation) that have indicators with limited data availability have priority in indicator and data development.
Moreover, the limited data availability also influences the number of countries that can be assessed in the SCDI. That means, currently, that the SCDI cannot yet be determined for all countries (see Section 3.2). For some countries such as Cuba, Singapore and the United Arab Emirates, the SCDI could not yet be determined since data are not available for the indicators of the final set (e.g., ‘government expenditure on education as percentage of GDP’ or ‘public debt as percentage of GDP’). This incomprehensive coverage of countries may bring about a restricted set of countries for comparing sustainable child development status.
4.2.2. Inconsistent Reference Year of Statistical Data
Additionally, reference years of statistical data for the indicators of the final indicator set are not identical [20]. Statistical data of indicators for most of the subthemes (e.g., child mortality, gender equality and attendance of education), are updated annually. By contrast, indicators for some subthemes (e.g., mental health) are not frequently updated. This inconsistency is noticeable when interpreting the SCDI results, especially while monitoring the trend of sustainable child development status for countries.
4.2.3. Value Choices for Indicator Selection and Index Calculation
There are no widely used normalization and aggregation methods for combining indicators into an index. In this study, reference points for normalizing the indicators were defined based on the SDGs and the lowest or highest indicator values collected for the indicators among the assessed countries from 2006 to 2015. A reference point may be defined according to an extreme low or high indicator value collected for an indicator. Nevertheless, this reference point is still suitable as a benchmark to perform the comparative assessment of sustainable child development status for countries because it describes a general picture of countries’ performance for a specific topic. For negative indicators (e.g., under-five mortality rate), the target values were all presumed as zero in order to achieve the ultimate goal to eliminate the negative contribution to sustainable child development. Additionally, the reference points would be updated over time when the newly collected indicator values go beyond the current applied reference points. For instance, in this study, the reference points for the indicator ‘percentage of infants born with low birth weight’ were defined as 0 and 40 regarding the SDGs and the highest indicator values collected from 2006 to 2015 among the considered countries. The reference point shall be updated over time once the indicator value is found to be higher than 40.
Moreover, weighting applied in the aggregation stage can largely influence the assessment results. Because no literature objectively provides information and the relative importance of the indicators and topics of sustainable child development, all indicators, criteria, subthemes and themes were considered as being equal in aggregation. If practitioners assign specific weighting to the considered indicators and topics in the SCDI, the SCDI scores can be altered and thus influence country ranking and classification.
4.3. Outlook for Future Research
In future, the framework, the indicators, as well as the SCDI scores for countries will have to be refined and updated when additional topics, indicators and data regarding sustainable child development become available. Ongoing work of the authors focuses on the potential integration of the SCDI into current social sustainability assessment approaches (e.g., Social Life Cycle Assessment (SLCA) [47] and Social Organizational Life Cycle Assessment (SOLCA) [48]) and databases (e.g., The Social Hotspots Database [49]). For example, the SCDI can be an index that describes in particular the social conditions for the proposed stakeholder group, children, in SLCA and SOLCA studies. In addition, the current use of the HDI would be reviewed for recommending application options of the SCDI.
Supplementary Materials
The following are available online at https://www.mdpi.com/2071-1050/10/5/1563/s1, Table S1: Spearman correlation coefficients for the 66 indicators, Table S2: 50 representative indicators selected based on correlation analysis, Table S3: The indicator values, SCDI scores as well as country rankings and classification for the 138 countries, Table S4: Country ranking assessed by the SCDI and HDI from 2006 to 2015, Table S5: Country ranking assessed by the SCDI, the HDI and the CDI, Table S6: Country classification assessed by the SCDI and the HDI for the year 2015.
Author Contributions
Y.-J.C. composed this study and designed the research approach. Indicator selection and index calculation were completed by Y.-J.C. Furthermore, comparison of the SCDI and other development indices was performed by Y.-J.C. L.W. supported the statistical analysis for indicator selection. A.L. and M.F. provided substantial contributions and advice to the design of the research. All authors proofread and approved the final manuscript.
Acknowledgments
This work was partly supported by the German Research Foundation (Deutsche Forschungsgemeinschaft, DFG), the Collaborative Research Center (Sonderforschungsbereich, SFB), under Grant SFB 1026—Sustainable Manufacturing [SFB 1026]. We acknowledge support by the German Research Foundation and the Open Access Publication Funds of Technische Universität Berlin.
Conflicts of Interest
The authors declare no conflict of interest. The funding sponsors had no role in the design of the study; in the collection, analyses, or interpretation of data; in the writing of the manuscript, and in the decision to publish the results.
References
- UN. Rights of the Child; United Nations: Geneva, Switzerland, 2013. [Google Scholar]
- UN. Report of the World Commission on Environment and Development: Our Common Future; United Nations: New York, NY, USA, 1987. [Google Scholar]
- UNDP. Human Development Report 1995; United Nations Development Programme: New York, NY, USA, 1995. [Google Scholar]
- UNDP. Human Development Report 2016: Human Development for Everyone; United Nations Development Programme: New York, NY, USA, 2016; ISBN 978-92-1-126413-5. [Google Scholar]
- Ruffin, N.J. Understanding Growth and Development Patterns of Infants; Virginia Cooperative Extension: Blacksburg, VA, USA, 2009. [Google Scholar]
- Ben-Arieh, A.; Casas, F.; Frønes, I.; Korbin, J.E. The Handbook of Child Well-Being—Theories, Methods and Policies in Global Perspective, 1st ed.; Springer: Dordrecht, The Netherlands, 2014. [Google Scholar] [CrossRef] [Green Version]
- Fernandes, L.; Mendes, A.; Teixeira, A.A.C. A review essay on the measurement of child well-being. Soc. Indic. Res. 2012, 106, 239–257. [Google Scholar] [CrossRef]
- The Save the Children Fund. The Child Development Index—Holding Governments to Account Children’s Wellbeing; The Save the Children Fund: London, UK, 2008. [Google Scholar]
- The Save the Children Fund. The Child Development Index 2012—Progress, Challenges and Inequality; The Save the Children Fund: London, UK, 2012. [Google Scholar]
- Bradshaw, J.; Hoelscher, P.; Richardson, D. An Index of Child Well-being in the European Union. Soc. Indic. Res. 2007, 80, 133–177. [Google Scholar] [CrossRef] [Green Version]
- Land, K.C.; Lamb, V.L.; Mustillo, S.K. Child and youth well-being in the United States, 1975–1998: Some findings from a new index. Soc. Indic. Res. 2001, 56, 241–320. [Google Scholar] [CrossRef]
- Land, K.C.; Lamb, V.L.; Meadows, S.O.; Taylor, A. Measuring trends in child well-being: An evidence-based approach. Soc. Indic. Res. 2007, 80, 105–132. [Google Scholar] [CrossRef]
- The Annie E Casey Foundation. The New KIDS COUNT Index; The Annie E Casey Foundation: Baltimore, MD, USA, 2012. [Google Scholar]
- Moore, K.A.; Vandivere, S.; Lippman, L.; Mcphee, C.; Bloch, M. An index of the condition of children: The ideal and a less-than-ideal U.S. example. Soc. Indic. Res. 2007, 84, 291–331. [Google Scholar] [CrossRef]
- Moore, K.A.; Theokas, C.; Lippman, L.; Bloch, M.; Vandivere, S.; O’Hare, W. A microdata Child Well-Being Index: Conceptualization, creation, and findings. Child Indic. Res. 2008, 1, 17–50. [Google Scholar] [CrossRef]
- Moore, K.A.; Murphey, D.; Bandy, T.; Lawner, E. Indices of Child Well-Being and Developmental Contexts. In The Handbook of Child Well-Being—Theories, Methods and Policies in Global Perspective, 1st ed.; Ben-Arieh, A., Casas, F., Frønes, I., Korbin, J.E., Eds.; Springer: Dordrecht, The Netherlands, 2014; pp. 2807–2822. [Google Scholar] [CrossRef]
- Chang, Y.-J.; Schneider, L.; Finkbeiner, M. Assessing Child Development: A Critical Review and the Sustainable Child Development Index (SCDI). Sustainability 2015, 7, 4973–4996. [Google Scholar] [CrossRef]
- Land, K.C.; Lamb, V.L.; Meadows, S. Conceptual and Methodological Foundations of the Child and Youth Well-Being Index. In The Well-Being of America’s Children—Developing and Improving the Child and Youth Well-Being Index; Land, K.C., Ed.; Springer: Dordrecht, The Netherlands, 2012; pp. 13–27. [Google Scholar] [CrossRef]
- Land, K.C.; Lamb, V.L.; Meadows, S.; Zheng, H.; Fu, Q. The CWI and Its Components: Empirical Studies and Findings. In The Well-Being of America’s Children—Developing and Improving the Child and Youth Well-Being Index; Land, K.C., Ed.; Springer: Dordrecht, The Netherlands, 2012; pp. 29–75. [Google Scholar] [CrossRef]
- Chang, Y.-J.; Lehmann, A.; Finkbeiner, M. Screening indicators for the Sustainable Child Development Index (SCDI). Sustainability 2017, 9, 518. [Google Scholar] [CrossRef]
- Cho, E.Y.-N. A clustering approach to comparing children’s wellbeing accross countries. Child Indic. Res. 2014, 7, 553–567. [Google Scholar] [CrossRef]
- Elkington, J. Towards the Sustainable Corporation: Win-Win-Win Business Strategies for Sustainable Development. Calif. Manag. Rev. 1994, 36, 90–100. [Google Scholar]
- Sustainable Development Goals. Available online: https://sustainabledevelopment.un.org/sdgs (accessed on 17 June 2016).
- United Nations. The Sustainable Development Goals Report 2016; United Nations: New York, NY, USA, 2016; ISBN 978-92-1-101340-5. [Google Scholar]
- UNICEF. The State of the World’s Children 2016: A Fair Chance for Every Child; United Nations Children’s Fund: New York, NY, USA, 2016; ISBN 978-92-806-4838-6. [Google Scholar]
- Childinfo: Monitoring the Situation of Children and Women. Available online: http://www.childinfo.org/ (accessed on 11 March 2017).
- Saisana, M.; Tarantola, S. State-of-the-Art Report on Current Methodologies and Practices for Composite Indicator Development; Joint Research Centre, European Commission: Ispra, Italy, 2002. [Google Scholar]
- Singh, R.K.; Murty, H.R.; Gupta, S.K.; Dikshit, A.K. An overview of sustainability assessment methodologies. Ecol. Indic. 2012, 15, 281–299. [Google Scholar] [CrossRef]
- Xiao, C.; Ye, J.; Esteves, R.M.; Rong, C. Using Spearman’s correlation coefficients for exploratory data analysis on big dataset. Concurr. Comput. Pract. Exp. 2016, 28, 3866–3878. [Google Scholar] [CrossRef]
- Rae, A. Using Spearman’s Rank Correlation Coefficient in Coursework. Geofile Online 2006, 511, 1–4. [Google Scholar]
- Lehman, A.; Rourke, N.O.; Hatcher, L.; Stepanski, E.J. JMP® for Basic Univariate and Multivariate Statistics—Methods for Researchers and Social Scientists, 2nd ed.; SAS Institute Inc.: Cary, NC, USA, 2013; ISBN 978-1-61290-603-4. [Google Scholar]
- Composition of Regions. Available online: http://unstats.un.org/unsd/methods/m49/m49regin.htm (accessed on 8 November 2016).
- Dama, M.S. Sex Ratio at Birth and Mortality Rates Are Negatively Related in Humans. PLoS ONE 2011, 6, e23792. [Google Scholar] [CrossRef]
- Sex Ratio. Available online: http://www.searo.who.int/entity/health_situation_trends/data/chi/sex-ratio/en/ (accessed on 20 March 2017).
- UNDP. Human Development Report 2014—Technical Notes; United Nations Development Programme: New York, NY, USA, 2014. [Google Scholar]
- WHO. Preventing Suicide: A Global Imperative; World Health Organization: Luxembourg, 2014; ISBN 978-92-4-156477-9. [Google Scholar]
- Global Health Observatory (GHO) Data. Available online: http://www.who.int/gho/en/ (accessed on 10 March 2017).
- World Bank Open Data. Available online: http://data.worldbank.org/ (accessed on 11 March 2017).
- Oral Health Database. Available online: http://www.mah.se/capp/ (accessed on 25 August 2016).
- UIS.Stat for Education, Literacy, Science, Technology and Innovation, Culture, Communication and Information. Available online: http://data.uis.unesco.org/ (accessed on 11 August 2016).
- Drugs and Crime Statistics. Available online: https://www.unodc.org/unodc/en/data-and-analysis/statistics/index.html (accessed on 12 March 2017).
- Sex Ratio at Birth. Available online: https://www.cia.gov/library/publications/the-world-factbook/fields/2018.html (accessed on 20 March 2017).
- World Population Prospects 2017. Available online: https://esa.un.org/unpd/wpp/Download/Standard/Population/ (accessed on 10 August 2017).
- International Monetary Fund Data. Available online: http://www.imf.org/en/data (accessed 10 August 2017).
- Berger, M.; Van Der Ent, R.; Eisner, S.; Bach, V.; Finkbeiner, M. Water accounting and vulnerability evaluation (WAVE): Considering atmospheric evaporation recycling and the risk of freshwater depletion in water footprinting. Environ. Sci. Technol. 2014, 48, 4521–4528. [Google Scholar] [CrossRef]
- United Nations, Department of Economic and Social Affairs, Population Division. World Population Prospects: The 2015 Revision, Key Findings and Advance Tables; United Nations: New York, NY, USA, 2015. [Google Scholar]
- UNEP. The Guidelines for Social Life Cycle Assessment of Products; Benoît, C., UQAM/CIRAIG, Mazijn, B., Ghent University, Eds.; United Nations Environment Programme: Druk in de weer, Belgium, 2009; ISBN 978-92-807-3021-0. [Google Scholar]
- Martínez-Blanco, J.; Lehmann, A.; Chang, Y.-J.; Finkbeiner, M. Social organizational LCA (SOLCA)—A new approach for implementing social LCA. Int. J. Life Cycle Assess. 2015, 20, 1586–1599. [Google Scholar] [CrossRef]
- Social Hotspots Database. Available online: http://www.socialhotspot.org/ (accessed on 15 May 2017).
Figure 1.
Structure of the Sustainable Child Development Index (SCDI) framework (exemplary criteria and indicator are presented for the subtheme attendance of education and highlighted in dark grey), adapted from Chang et al. [17,20].

Figure 2.
Relation between number of representative indicators and coverage of topics and countries.
Figure 2.
Relation between number of representative indicators and coverage of topics and countries.

Figure 3.
Overview of different levels of sustainable child development for countries.

Figure 4.
Share of sustainable child development levels in different regions.

Figure 5.
Country ranking assessed by the SCDI and the HDI from 2006 to 2015 for selected OECD countries.
Figure 5.
Country ranking assessed by the SCDI and the HDI from 2006 to 2015 for selected OECD countries.

Table 1.
Relation between coverage of considered representative indicators, topics, countries and child population: an extract of a consideration from 24 to 29 representative indicators.
Table 1.
Relation between coverage of considered representative indicators, topics, countries and child population: an extract of a consideration from 24 to 29 representative indicators.
| Number of Indicators | Share of Topics (Criteria) | Number of Countries | Share of Countries | Number of Considered Counties | Share of Child Population | ||||
|---|---|---|---|---|---|---|---|---|---|
| Africa | Asia | Americas | Europe | Oceania | |||||
| 24 | 48.8% | 147 | 75.4% | 40 | 38 | 26 | 39 | 4 | 92.2% |
| 25 | 51.2% | 138 | 70.7% | 39 | 34 | 25 | 37 | 3 | 85.9% |
| 26 | 53.5% | 129 | 66.2% | 36 | 30 | 24 | 37 | 2 | 85.2% |
| 27 | 55.8% | 118 | 60.5% | 35 | 21 | 24 | 36 | 2 | 71.2% |
| 28 | 58.1% | 111 | 56.9% | 34 | 19 | 22 | 35 | 1 | 69.9% |
| 29 | 60.5% | 102 | 52.3% | 33 | 19 | 21 | 29 | 0 | 67.0% |
Table 2.
The final indicator set considered in the SCDI, including the reference points and the addressed themes, sub-themes, criteria and data sources.
Table 2.
The final indicator set considered in the SCDI, including the reference points and the addressed themes, sub-themes, criteria and data sources.
| Theme | Sub-theme | Criterion | Indicator | Maximum Reference Point | Minimum Reference Point | Target of the SDGs | Data Source |
|---|---|---|---|---|---|---|---|
| Health | Nutrition | Low birth weight | Percentage of infants born with low birth weight (<2500 g) | 0 | 40 | Target 2.2 | UNICEF [26] |
| Child mortality | Under-five mortality | Under-five mortality rate (probability of dying by age five per 1000 live births) | 0 | 210 | Target 3.2 | ||
| Mental health | Suicide | Suicide rate (per 100,000 aged 15–29 years) | 0 | 50 | Target 3.4 | WHO [36] | |
| Hazardous pollutant | Household and ambient air pollution | Mortality rate attributed to household and ambient air pollution (per 100,000 population) | 0 | 300 | Target 3.9 | WHO [37] | |
| PM2.5 air pollution | PM2.5 air pollution, population exposed to levels exceeding World Health Organization (WHO) guideline value (% of total) | 0 | 100 | Target 3.9 | UNICEF [26] | ||
| Immunization coverage | Diphtheria tetanus toxoid and pertussis (DTP3) immunization | Diphtheria tetanus toxoid and pertussis (DTP3) immunization coverage among one-year-olds (%) | 20 | 100 | Target 3.8 | ||
| Risk behavior | Alcohol use | 15–19 years old heavy episodic drinkers (population) (% by country) | 0 | 55 | Target 3.5 | WHO [37] | |
| Adolescent fertility | Adolescent fertility rate (per 1000 girls aged 15–19 years) | 0 | 220 | Target 3.7 | World Bank [38] | ||
| Oral health | Dental treatments | DMFT (decayed, missing or filled teeth) among 12-year-olds | 0 | 6 | Target 3.4 | Malmö University [39] | |
| Health expenditure | Public health expenditure | Health expenditure, public (% of total health expenditure) | 5 | 100 | Target 6.1 | WHO [32]; World Bank [38] | |
| Education | Attendance of education | Enrolment in primary school | Gross enrolment ratio, primary, both sexes (%) | 25 | 160 | - | United Nations Educational, Scientific and Cultural Organization (UNESCO) [40] |
| Enrolment in secondary school | Gross enrolment ratio, secondary, both sexes (%) | 5 | 170 | - | |||
| Early childhood education | Enrolment of kindergarten | Gross enrolment ratio, pre-primary, both sexes (%) | 0 | 160 | Target 4.2 | ||
| Gender equality | Gender equality in enrolment | Gross enrolment ratio, pre-primary, gender parity index (GPI) | 0.50 | 2 | Target 4.5 | ||
| Gross enrolment ratio, primary, gender parity index (GPI) | 0.50 | 1.20 | Target 4.5 | ||||
| Gross enrolment ratio, secondary, gender parity index (GPI) | 0.30 | 2 | Target 4.5 | ||||
| Gross enrolment ratio, tertiary, gender parity index (GPI) | 0.05 | 6.50 | Target 4.5 | ||||
| Government support on education | Public expenditure on education | Government expenditure on education (% of GDP) | 0.50 | 20 | - | ||
| Safety | Violence and crime | Criminal victimization | Intentional homicide count and rate per 100,000 population | 0 | 100 | Target 16.1 | United Nations Office on Drugs and Crime (UNODC) [41] |
| Demographic structure | Sex ratio | Sex ratio at birth (ratio) | 0.80 | 1.20 | Target 5.1 | Central Intelligence Agency (CIA) [42]; United Nations [43] | |
| Economic status | Housing quality | Electricity coverage | Access to electricity (% of population) | 0 | 100 | Target 7.1 | World Bank [38] |
| Macroeconomic situation | Youth unemployment | Youth unemployment rate (% of total labor force ages 15–24) | 0 | 65 | Target 8.5 | ||
| National debts | Public debt (% of GDP) | 0 | 600 | - | International Monetary Fund (IMF) [44] | ||
| Environmental aspects | Freshwater vulnerability | Risk of depleting freshwater resources | Water depletion index (WDI) (ratio) | 0 | 1 | Target 6.4 | Berger et al. [45] |
| Renewable energy consumption | Consumption of renewable energy | Renewable energy consumption (% of total final energy consumption) | 0 | 100 | Target 7.2 | World Bank [38] |
Table 3.
Country ranking based on the SCDI scores (2015): an extract showing the 20 highest and 20 lowest ranks.
Table 3.
Country ranking based on the SCDI scores (2015): an extract showing the 20 highest and 20 lowest ranks.
| Ranks: Highest 20 | Country | SCDI Score | Ranks: Lowest 20 | Country | SCDI Score |
|---|---|---|---|---|---|
| 1 | Iceland | 0.894 | 119 | Morocco | 0.659 |
| 2 | Bhutan | 0.860 | 120 | Angola | 0.657 |
| 3 | Norway | 0.846 | 121 | Senegal | 0.655 |
| 4 | Sweden | 0.840 | 122 | Saudi Arabia | 0.655 |
| 5 | Finland | 0.820 | 123 | Turkmenistan | 0.654 |
| 6 | Uruguay | 0.820 | 124 | Egypt | 0.648 |
| 7 | Paraguay | 0.819 | 125 | India | 0.644 |
| 8 | Austria | 0.818 | 126 | Eritrea | 0.643 |
| 9 | Estonia | 0.817 | 127 | Armenia | 0.638 |
| 10 | Denmark | 0.815 | 128 | Botswana | 0.637 |
| 11 | Canada | 0.814 | 129 | Gambia | 0.637 |
| 12 | Latvia | 0.813 | 130 | Syrian Arab Republic | 0.635 |
| 13 | Brunei Darussalam | 0.813 | 131 | South Africa | 0.623 |
| 14 | New Zealand | 0.811 | 132 | Sudan | 0.621 |
| 15 | Lao People’s Democratic Republic | 0.810 | 133 | Mali | 0.610 |
| 16 | Ghana | 0.809 | 134 | Niger | 0.608 |
| 17 | Costa Rica | 0.806 | 135 | Namibia | 0.605 |
| 18 | Thailand | 0.804 | 136 | Lesotho | 0.603 |
| 19 | Fiji | 0.804 | 137 | Yemen | 0.576 |
| 20 | Malaysia | 0.801 | 138 | Mauritania | 0.548 |
Table 4.
Four levels of sustainable child development and the number of classified countries.
| Level of Sustainable Child Development | Interval of the SCDI Score | Number of Classified Country |
|---|---|---|
| Very high | 0.81–0.89 | 15 |
| High | 0.75–0.80 | 37 |
| Medium | 0.66–0.74 | 65 |
| Low | 0.54–0.65 | 21 |
© 2018 by the authors. Licensee MDPI, Basel, Switzerland. This article is an open access article distributed under the terms and conditions of the Creative Commons Attribution (CC BY) license (http://creativecommons.org/licenses/by/4.0/).
Share and Cite
MDPI and ACS Style
Chang, Y.-J.; Lehmann, A.; Winter, L.; Finkbeiner, M. The Sustainable Child Development Index (SCDI) for Countries. Sustainability 2018, 10, 1563. https://doi.org/10.3390/su10051563
AMA Style
Chang Y-J, Lehmann A, Winter L, Finkbeiner M. The Sustainable Child Development Index (SCDI) for Countries. Sustainability. 2018; 10(5):1563. https://doi.org/10.3390/su10051563
Chicago/Turabian StyleChang, Ya-Ju, Annekatrin Lehmann, Lisa Winter, and Matthias Finkbeiner. 2018. "The Sustainable Child Development Index (SCDI) for Countries" Sustainability 10, no. 5: 1563. https://doi.org/10.3390/su10051563
Note that from the first issue of 2016, this journal uses article numbers instead of page numbers. See further details here.