Estimation and Forecasts for the Share of Renewable Energy Consumption in Final Energy Consumption by 2020 in the European Union


1
Department of Statistics and Economic Informatics, University of Craiova, A.I. Cuza 13, Craiova 200585, Romania
2
Department of Mathematics, University of Craiova, A.I. Cuza 13, Craiova 200585, Romania
*
Author to whom correspondence should be addressed.
Sustainability 2018, 10(5), 1515; https://doi.org/10.3390/su10051515
Submission received: 2 April 2018
/
Revised: 3 May 2018
/
Accepted: 7 May 2018
/
Published: 10 May 2018
(This article belongs to the Section Economic and Business Aspects of Sustainability)
Abstract
:European Union Directive 2009/28/EC established that the share of renewable energy in the final energy consumption should reach a target of 20% by 2020 in European Union (EU) countries. This study analyses the tendency of this share using data for EU 28, taken from the Eurostat database for the period 1995–2016. First, after a brief statistical and economic analysis of the three macroeconomic indicators at EU level, five regression models (polynomial, ARIMA) were used to estimate the evolution of the share of renewable energy consumption into the final energy consumption, all of them showing an increasing trend for this indicator. The positive impact of the EU Directive in increasing this share was proved by means of a perturbed regression model. Forecasts of this share for the 2020 horizon were obtained, all showing that the EU target is yet to be reached. Secondly, four groups of EU-countries were considered, according to the final energy consumption. Empirical estimations of renewable energy share into the final energy consumption showed increasing trend for all groups, while providing forecasts quite different from the EU ones. Also, economic interpretations of the results are performed.
1. Introduction
The European Parliament has in recent years given an increasing importance to renewable energy sources, in terms of the need to prevent global warming, climate change, and to reduce carbon dioxide emissions in order to protect the environment for future generations [1].
Thus, through a series of adopted resolutions [2,3], the European Union (EU) has set as a primary objective the increase of energy production from renewable energy sources [4]. Globally, the European Union is a promoter of renewable energy, being a leader in renewable energy technologies (it owns 40% of global renewable energy patents and almost half of global renewable energy production capacity) [5]. At the same time, the EU has launched a series of programs [6] on reducing energy demand (as conventional fuels are becoming less and more expensive), increasing energy efficiency, and finding new options of energy at reasonable costs and addressing import dependency issues.
An estimate of the evolution of final energy consumption and final energy consumption from renewable resources can bring benefits to EU countries in order to take appropriate initiatives in favor of renewable energy sources, and thus to achieve the objective of increasing the share of clean energy to 20% of total consumption by 2020 [2].
The final energy consumption of each EU member depends to a large extent on the structure of its energy system, on the availability of renewable resources, and on the structure and level of development of each economy. Energy consumption of a state is defined by Eurostat in several forms [7].
The Gross final energy consumption is the energy used by end-consumers (final energy consumption) plus grid losses and self-consumption of power plants. In the Renewable Energy Directive (2009/28/EC) [2], gross final energy consumption is defined as energy commodities delivered for energy purposes to final consumers (industry, transport, households, services, agriculture, forestry, and fisheries), including the consumption of electricity and heat by the energy branch for electricity and heat production, and including losses of electricity and heat in distribution and transmission.
Gross inland consumption of all products represents the quantity of energy necessary to satisfy inland consumption of the geographical entity under consideration. Gross inland consumption includes indigenous production, primary product receipts, direct use and from other sources, imports, stock changes and excludes exports and international marine bunkers. Gross inland energy consumption is the total energy demand of a country or region. It represents the quantity of energy necessary to satisfy inland consumption of the geographical entity under consideration. Gross inland energy consumption covers:
- consumption by the energy sector itself;
- distribution and transformation losses;
- final energy consumption by end users;
- “statistical differences” (not already captured in the figures on primary energy consumption and final energy consumption).
Final energy consumption (FEC) from all resources includes the following categories: solid fuels, total oil products, gas, nuclear heat, renewable energies, electrical energy and waste (non-renewable). FEC covers total energy consumption in industry, transport, and other sectors, for all energy uses.
Final energy consumption from renewable resources (FECRE) includes: wind energy, solar (thermal, photovoltaic, and concentrate), hydroelectric power, tidal power, geothermal energy, biofuels, and the renewable part of waste.
EU countries’ governments are increasingly interested in monitoring the relationship between the FEC and the FECRE because of the international target of 40% greenhouse gas emission reduction by 2030 [8], which required EU member states to adopt measures to support renewable energy sources.
Starting from the European Commission’s decisions on the necessity to reduce the final energy consumption and to increase the share of renewable energy consumption in final energy consumption, the overall objective of this paper is to analyze the evolution of the share of final energy consumption from renewable sources into the final energy consumption in the European Union, in the period 1995–2016 and to obtain useful predictions for the horizon 2020.
In a previous paper [9], analyzing the relations between economic growth, final energy consumption, and final energy consumption from renewable sources for EU countries, we found a positive impact of renewable energy consumption on economic growth and also unidirectional or bidirectional Granger causalities between these macroeconomic indicators. Also, using linear regression, we found an increasing trend for the share of FECRE in FEC for each of the 28 EU countries, over the period 1995–2015.
The study in this paper extends the analysis [9] in two directions. Firstly, we use different regression models (polynomial or autoregressive models) for estimation and forecasting of the share of FECRE in FEC for the EU overall. Secondly, the analysis is performed on data series for groups of EU countries, constituted by certain criterion. Thus, the main aim of this paper is to forecast the ratio between the final energy consumption from renewable sources and final energy consumption inside European Union, namely the adimensional indicator .
Based on data from 1995 to 2016, we find different estimates for this ratio, and consequently different forecasting for the horizon 2020, by means of several regression models.
As the ratio is the main variable of interest in our study, we consider univariate regression models, as: (i) polynomial time dependent regression; (ii) autoregressive models.
All the results are analyzed and interpreted from an economic point of view.
Most research papers address the consumption of energy related to other macroeconomic indicators, paying less attention to the analysis of the share of renewable energy consumption in energy consumption. Eurostat provides general information on this share but it is calculated at the final gross energy consumption (which includes final energy consumption). We believe that through our analysis we provide useful information about the share of renewable energy consumption and a starting point for an analysis of this share on elements from the structure of energy consumption.
This paper is organized as follows. Section 1 contains the motivation of this study, while the research background and the methods for forecasting are presented briefly in Section 2. In Section 3, we analyze the data and introduce the general regression models used in the paper. Based on such models, in Section 4, the ratio is empirically estimated and predictions of its expected values for the horizon 2020 are obtained. In Section 5, by means of polynomial regression, we obtain estimation for the ratio for four groups of EU countries. In addition, some economic analysis is provided. Finally, in the last section, conclusions of this study are made.
2. Brief Literature Review
Energy plays a key role in the economic development of any country, with a leverage effect on economic growth. Energy policy adopted at EU level influences the economic systems of the member countries. The evolution and perspective of the energy system at European level have to be considered in the light of current climate change by identifying the more or less competitive European Union member states in terms of sustainable growth [10].
Exhaustible sources of energy (fossil and nuclear fuels) are limited (in time and space), being able to satisfy the needs of human society for only a certain period of time. According to Bloomberg New Energy Finance [11], in 2040 about 70% of Europe’s electricity production will be produced from renewable sources, while that number is 44% in the United States. The year 2015 marked a historic peak in renewable energy investments ($286 billion), for the first time the investments in renewable energy facilities exceeded conventional energy, the global green energy production capacity reached 55% of the capacity of new installations [5].
The European Union is a world leader in the promotion and development of renewable energy, coordinating efforts to combat climate change, encouraging the transition to a low-carbon economy, and stimulating the potential growth of the economy. The EU 2020 Directive establishes the objective of increasing the share of renewable energy in final energy consumption to 20% until 2020, and to 27% by 2030 [2]. The share of petroleum products and solid fuels decreased from 65.1% of total consumption in 1990 to 50.6% in 2015 [12]. In this context, the production of renewable energy will continue to grow rapidly in the coming years due to lower production costs, so it is estimated that in 2040 they will account for 70% of Europe’s electricity production [11].
Numerous economists and researchers [13,14,15,16,17,18,19,20,21,22,23,24,25,26,27] have studied the relationship between final energy consumption or renewable energy consumption and other indicators from different perspectives using various methodologies. Some researchers designed a renewable energy sustainability index and tested it on 15 European countries, with different levels of final energy consumption and economic development [13], or examined per capita energy use for 19 Eurozone countries [14]. Others investigated the causality among energy consumption or renewable energy consumption and various macroeconomic indicators, such as economic growth (of European Union (EU)-28 countries [15], of Algeria [16], for 42 developing countries [17], for the 15 former Soviet Union countries [18] or for major renewable energy consuming countries in the world [19]), economic growth, capital, and labor (for new EU member countries [20]), carbon dioxide emissions, economic growth, and financial development (in the Gulf Cooperation Council (GCC) countries [21]), technological innovation (for China [22]), urbanization and economic growth (for China [23]). Liddle and Lung [24] disaggregate energy consumption and GDP data according to end-use to analyze a broad number of developed and developing countries grouped in panels by similar characteristics. Cucchiella [25] uses a mathematical model of quantitative analysis based on the share of energy from renewable sources in gross final energy consumption that allows a comparison between 28 European Union Member States. Others examined the forecast of energy consumption in Japan (based on the effects of financial development, economic growth, export, imports, and capital) [1] and China [26].
The benefits of transferring renewable energy technologies to emerging countries have been highlighted [28]. Various research has analyzed data from a wide sample of countries or regions, considered either individually or as groups, as a result of certain criterion. Thus, the impact of renewable energy and non-renewable energy consumption is analyzed for OECD countries [29], for a group of 29 OIC countries [30], and for China [31], to emphasize some of them.
The empirical findings are also found to differ across countries and regions, and all these findings have important policy implications for the countries concerned [32].
Simple and multiple linear regression analyses as well as quadrature regression analyses were performed to study final energy consumption and renewable energy in different contexts, such as an analysis of energy consumption associated to the residential sector [33], the dynamic relationship between energy consumption and economic growth in nine South and Southeast Asian countries [34] or for forecasting Greek electricity consumption [35].
Energy consumption forecast studies were conducted using the ARIMA models, taking into account both autoregressive and mobile environments. For instance, this type of study has been used to forecast the annual energy consumption in Iran [36], to analyze energy consumption of buildings [37], to solve the long-term system load forecasting problem caused by load fluctuation in some developed cities [38], to forecast electricity demand [39], to compare the predictive accuracy of various uni- and multivariate models in forecasting international city tourism demand for Paris [40], to forecast China’s primary energy consumption [41] and growth trends in renewable energy consumption of China [42], to forecast energy consumption and greenhouse gases emission of India [43], for forecasting national and regional energy demand [44], or to compare forecasting of energy consumption in Shandong, China [45]. Ozturk and Ozturk [46] used the autoregressive integrated moving average (ARIMA) model to forecast total of energy consumption and its structure in Turkey for the next 25 years.
Although most researchers prefer ARIMA as a forecasting model, boundaries need to be highlighted. The most important drawback of the ARIMA model is that it requires a long series of data; most researchers propose at least 50 observations for an ARIMA model [47]. Some researchers [48,49] consider that ARIMA is quite suitable for short-term forecasting and not for long-term forecasting. Others [50] consider that one of the main tools for forecasting economic indicators is to analyze time series.
3. Data and Models
3.1. Data Analysis
The macroeconomic indicators analyzed in this paper are:
- FEC—covers total energy consumption in industry, transport, and other sectors, for all energy uses—is expressed in thousand tons of oil equivalents (TOE).
- FECRE includes wind energy, solar, hydroelectric power, tidal power, geothermal energy, biofuels, and the renewable part of waste and is expressed in thousand tons of oil equivalents (TOE).
- Share of renewable energy in final energy consumption—(percent %)—measures how extensive is the use of renewable energy and, by implication, the degree to which renewable fuels have substituted fossil and/or nuclear fuels and therefore contributed to the decarbonisation of the EU economy.
The value of these indicators for the period 1995–2016 for the 28 EU member states taken from the Eurostat database [51].
The data on which the survey was based are organized in a two-dimensional form:
- cross-section data—which contain information on the value of the three analyzed indicators (FEC, FECRE, and share FECRE in FEC) at a given time (annually) for the 28 EU member states;
- time series data—which contain information on the value of each of the analyzed indicators, obtained between 1995 and 2016, for the 28 EU member states.
The theoretical models are estimated using panel data techniques, with the aid of EViews 9 software, which is an econometric software for powerful statistical, forecasting, and modeling tools [52].
The data available from Eurostat show that the renewable energy consumption prior to 1995 was statistically insignificant in the final energy consumption. This began to increase as a consequence of several UE decisions that promoted the concept of sustainable development and clean energy.
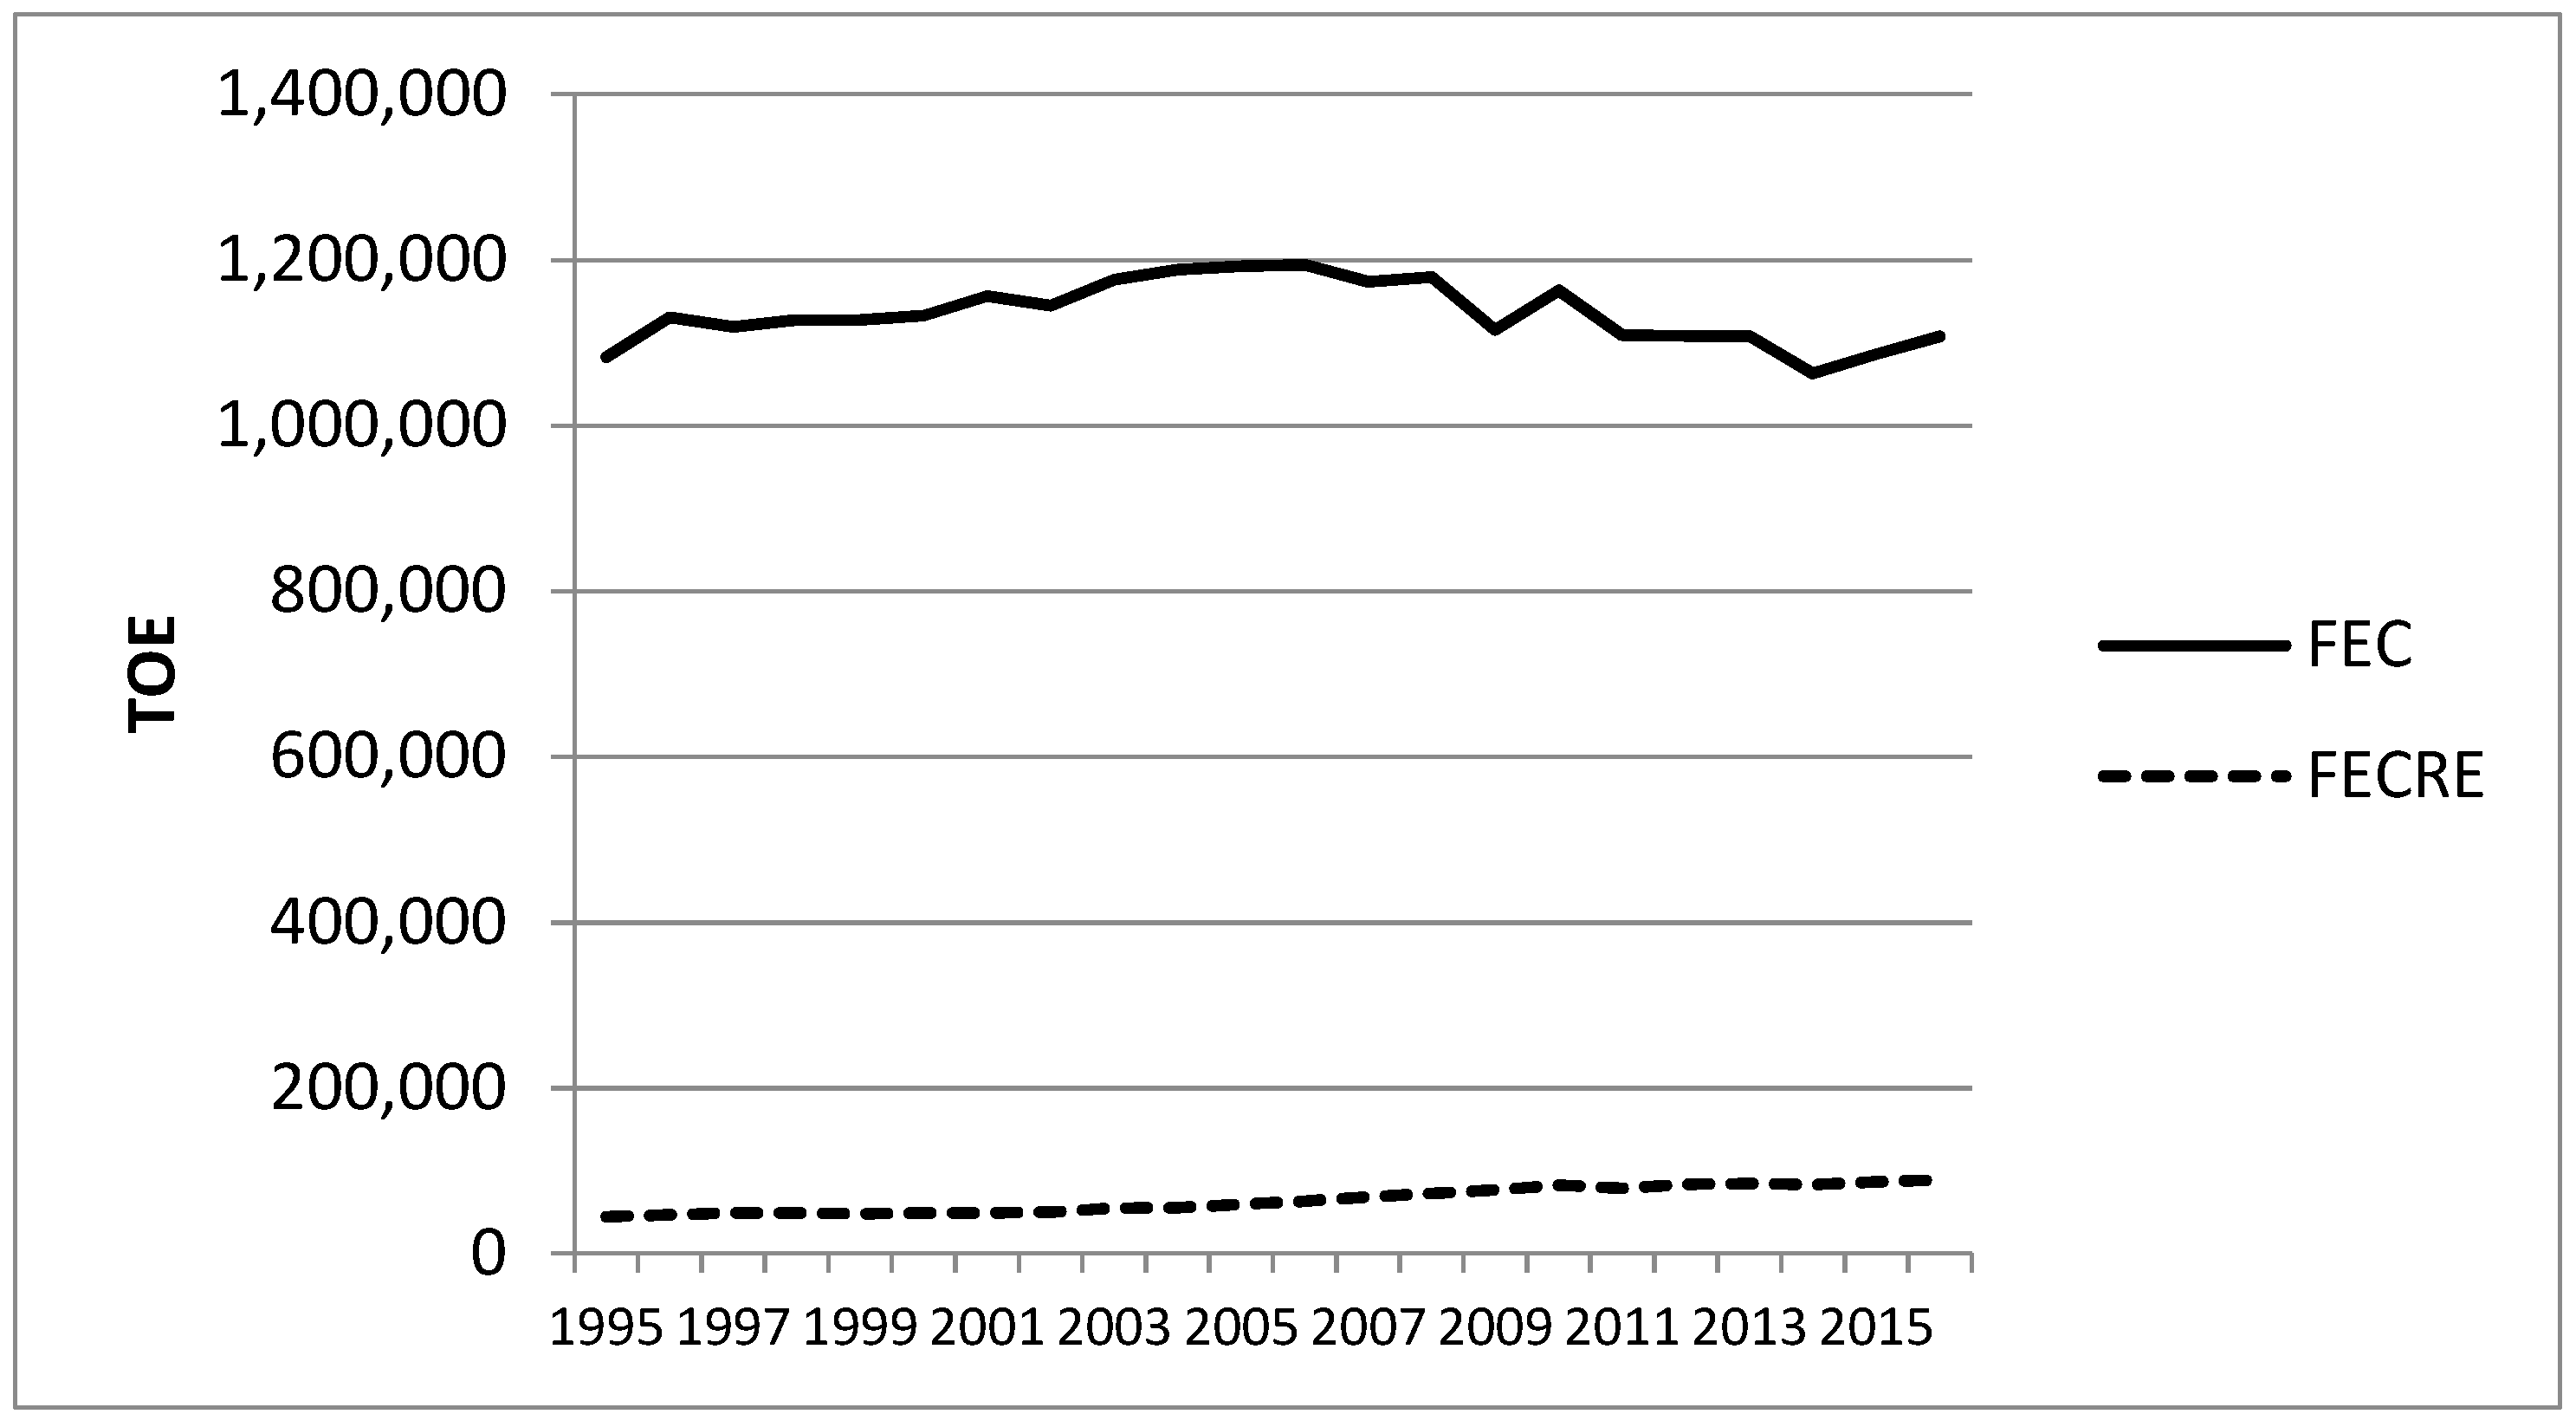
The time series of the European Union’s energy consumption from renewable resources and final energy consumption are shown in Figure 1. The values for the two variables FECRE and FEC for each year where obtained as sums of the corresponding values for the 28 European Union members.
It is noted that the FEC at the EU level had a significant increase in 1996 compared to 1995, followed by a relatively steady increase until 2006 when it reached the highest level of 1194.4 million TOE (less in 2002 when had a slight decrease), then a fall in 2007 due to the effects of the crisis, followed by a slight rebound in 2008, and a significant reduction by 2014 [5].
The consumption of energy from renewable sources has been steadily rising and doubled in 2016 (88.93 million TOE) compared to 1995 (44.28 million TOE).
We denote by the yearly ratio (expressed as percentage) between the two variables, that is
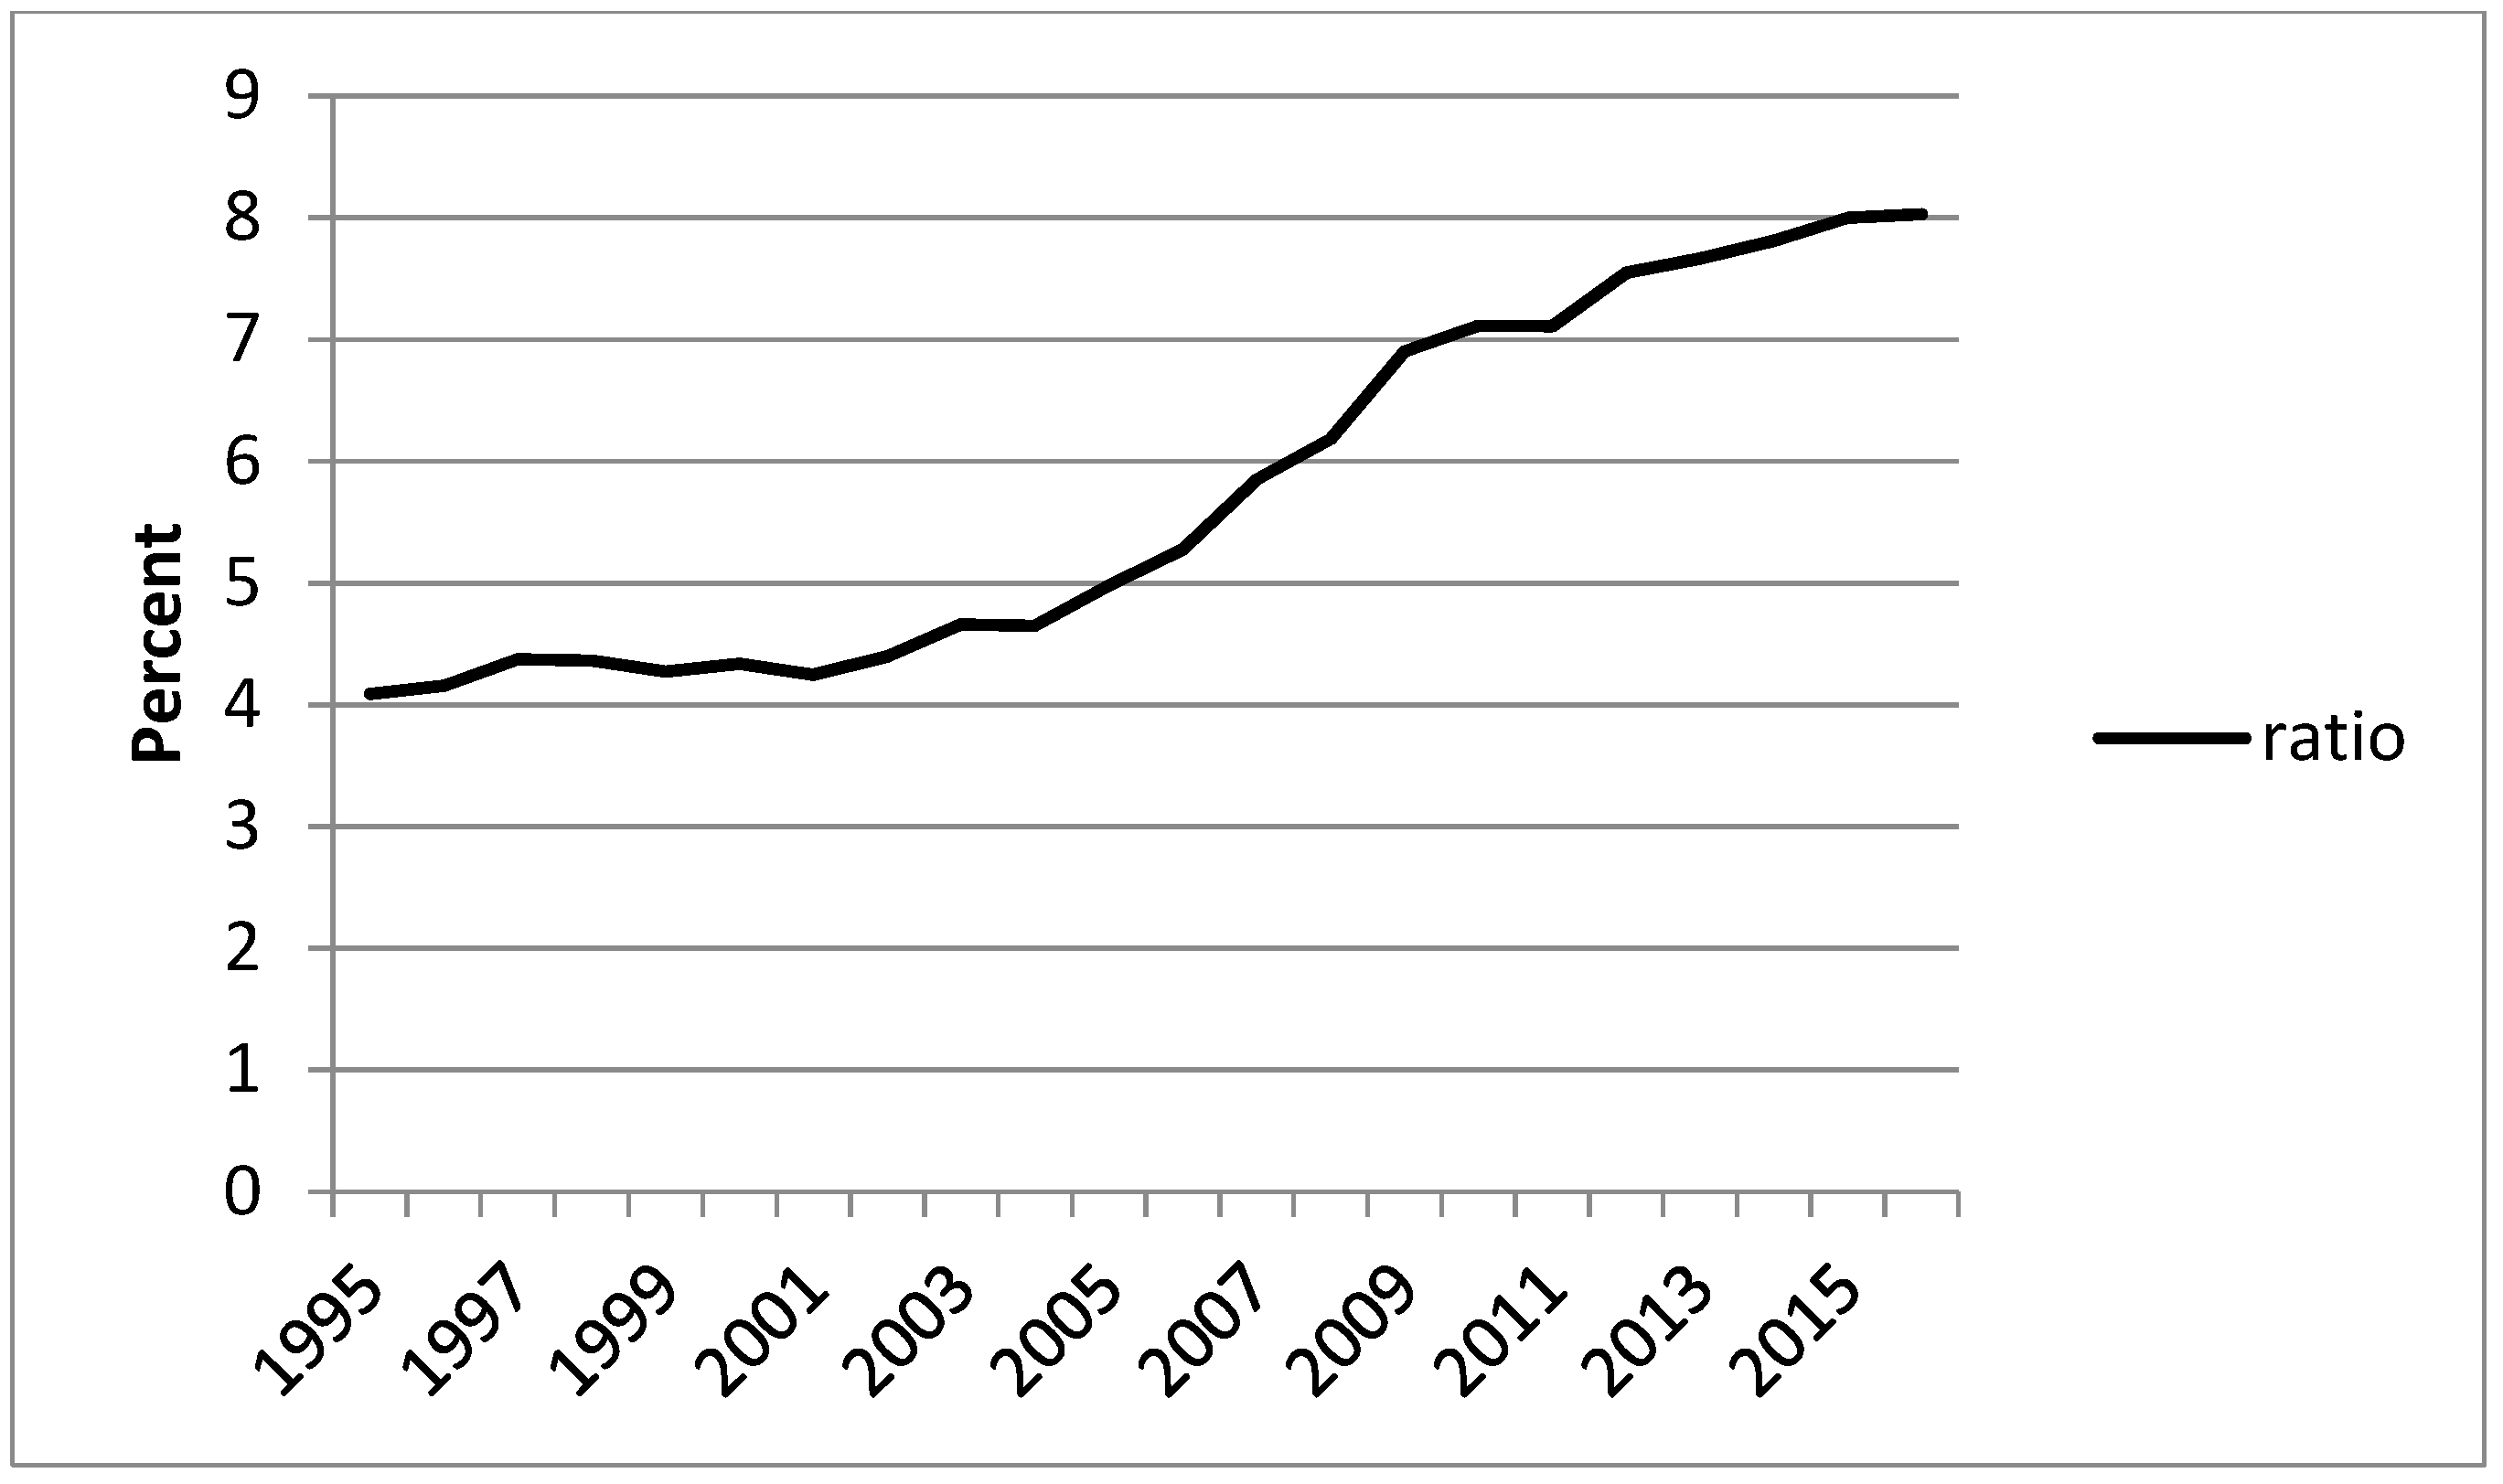
where represents the year. Its evolution from 1995 to 2016 is shown in Figure 2.
The figure clearly shows the permanent increase in the share of renewable energy consumption in final energy consumption, from 4.1% in 1995 to almost double (8.02%) in 2016. The share of FECRE in FEC was almost constant until 2002, followed by a slow rate of increase until 2006, then by a significant large rate increase in the remaining period (see Figure 2).
Table 1 presents descriptive statistics of the two data series and for the ratio time series.
The mean value of final energy consumption is 1,135,864 TOE, the FEC series values being concentrated around this value (the standard deviation is 3.3%). Concerning the final energy consumption from renewable sources and ratio, the deviations of actual values around their mean values are greater, being 24.6% and 26.2%, respectively.
None of the analyzed variables follow a normal distribution, but a platykurtic one (see Table 1). Distributions also show a slight left asymmetry for FEC and right asymmetry for FECRE and ratio, which also proves the trend for the three variables.
3.2. Time Regression and Autoregressive Models
Generally, it is difficult to choose the best model from a statistical point of view to fit a given set of data. For this reason, we use several regression models to estimate the evolution of ratio, and then we compare the empirical results, using statistical criteria. Finally, we perform predictions based on these estimations.
In order to estimate and forecast the ratio between the final energy consumption from renewable sources and final energy consumption inside the European Union, this study uses several polynomial regression and autoregressive models.
The general time regression model can be written as:
where is the discrete time, is the response variable at the time , is a function of time, depending of the -dimensional parameter . As , the parameter terms , …, are called the regression coefficients that need to be estimated in order to determine the regression function .
If is an estimation of the regression coefficient , the estimation of is , and the predicted value of previous equation is
while the differences
are the residual values (or estimation errors).
The most common method used in estimating parameters in regression analysis is the least squares method (LSM), which finds the parameters for which the sum of the squared errors has a minimum value.
The quality of the fit of the model to a set of observed data can be assessed by using several coefficients, such as the coefficient of determination , the Akaike information criterion (AIC), or the Schwartz criterion.
Considering as either linear or quadratic, two models will be used in this study, namely, the linear regression model
and the quadratic model
The linear model (1) can provide only a general trend for the data, either increasing, decreasing, or stationary at constant rate, while the quadratic model (2) also gives information on the variable speed of this process.
In order to assess to impact of the EU directive 2009, we modify the regression models (1) and (2) by adding an auxiliary variable D. This variable takes value 1 in the presence of the directive and 0 otherwise, such that
Thus, two new models are obtained:
and
The autoregressive models use expression of the interest variable as a function of the previous terms . There are several types of autoregressive models used in estimations. The most general model is . This model contains autoregressive terms, moving average terms, and, also, differencing of order . Denoting by the backshift operator, , this model can be written as:
4. Forecasting of Share of FECRE in FEC for EU
4.1. Empirical Estimation Using Time Regression Models
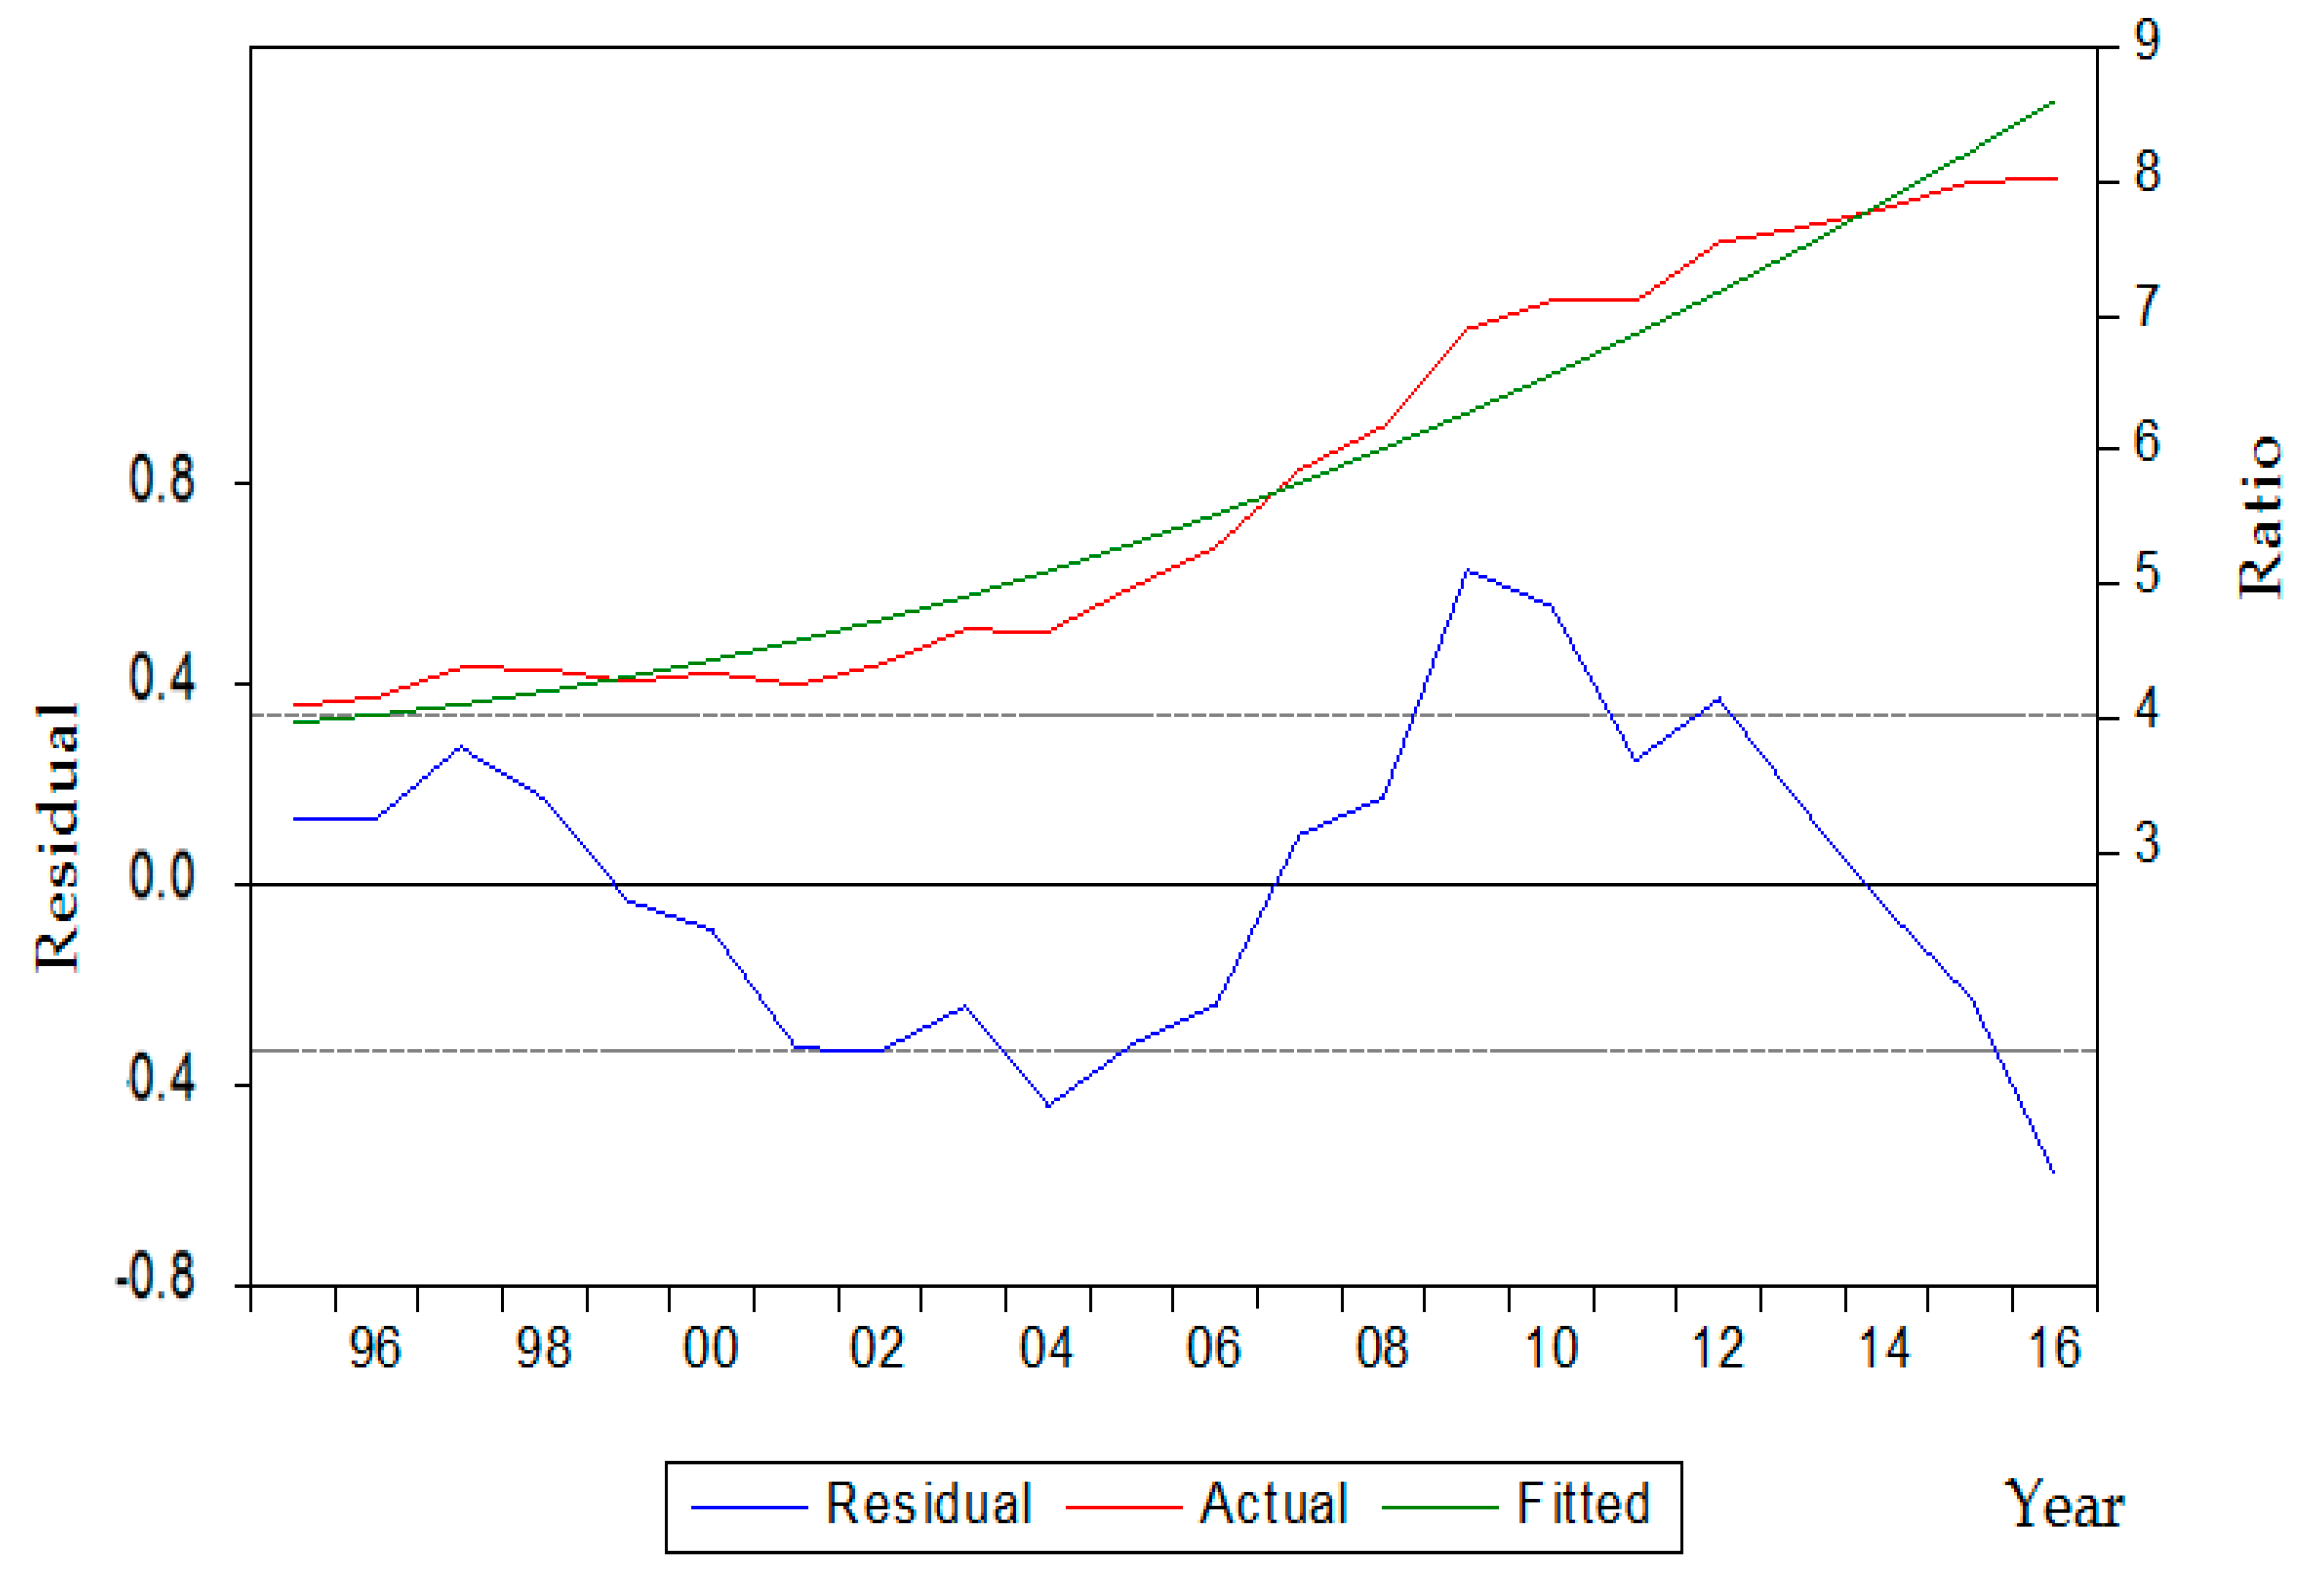
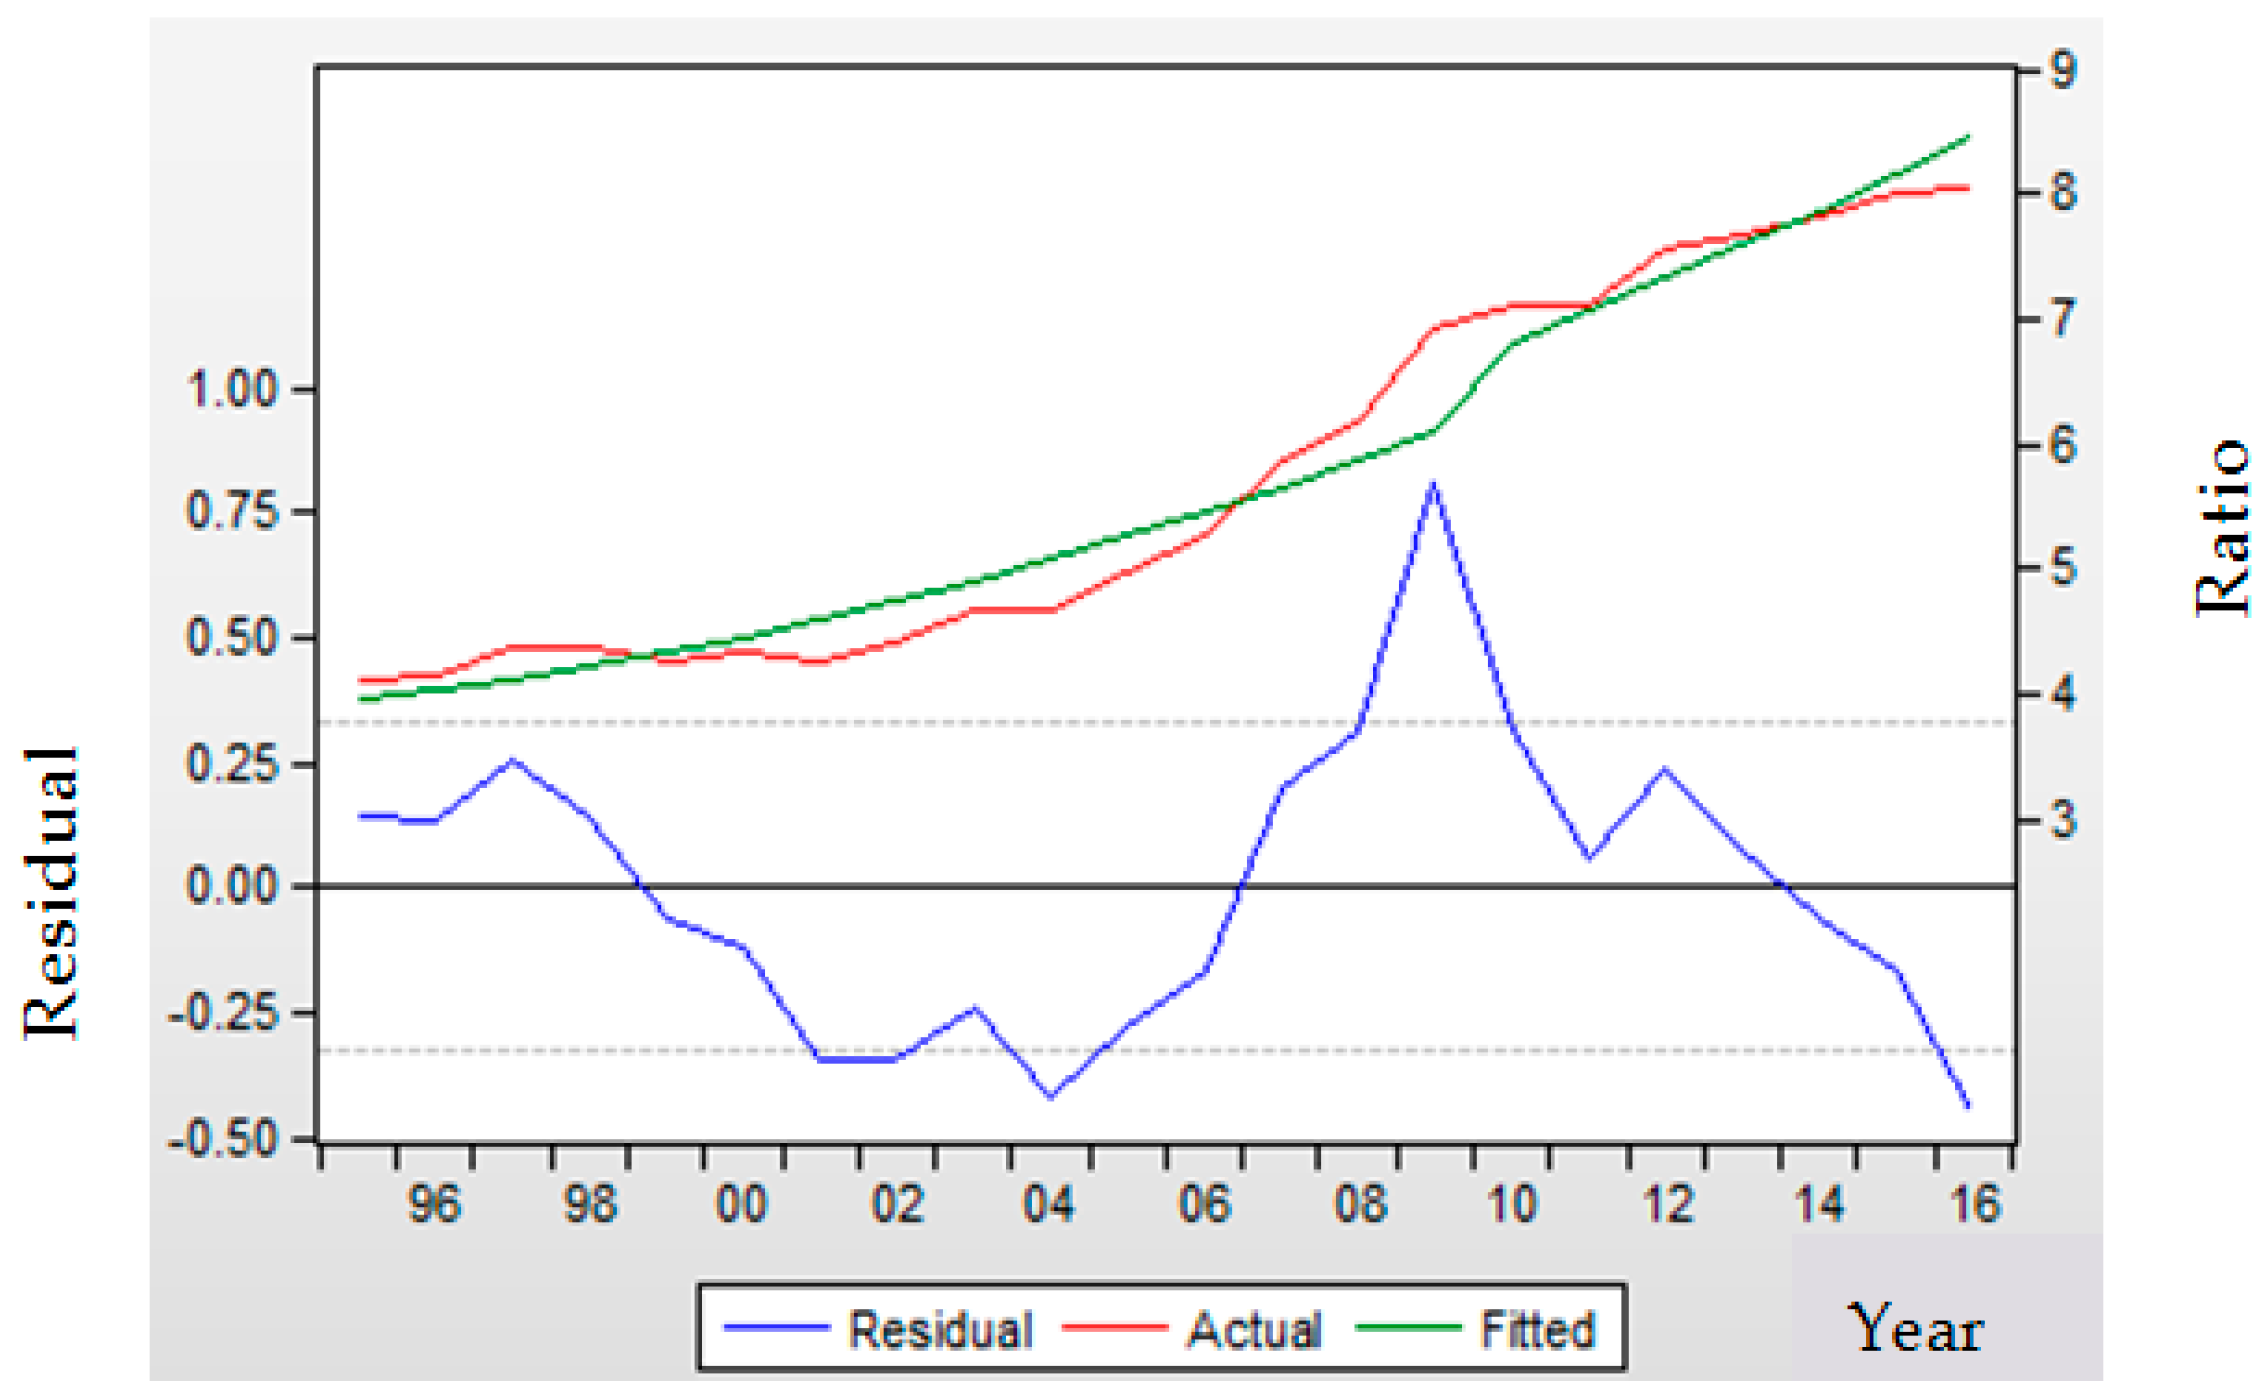
Using the ratio as the response variable, the results of the estimation of Equation (1) using LSM are given in Table 2 and Figure 3.
Note that the estimated coefficients and (of the variables C and t) given in Table 2 are statistically significant at the 1% significance level, as the probability for the estimated coefficients is 0, so the hypothesis that they are equal to 0 is rejected.
In Figure 3, the actual values of ratio and the regression line are plotted in the upper part, while in the lower part, the corresponding estimation error terms are plotted.
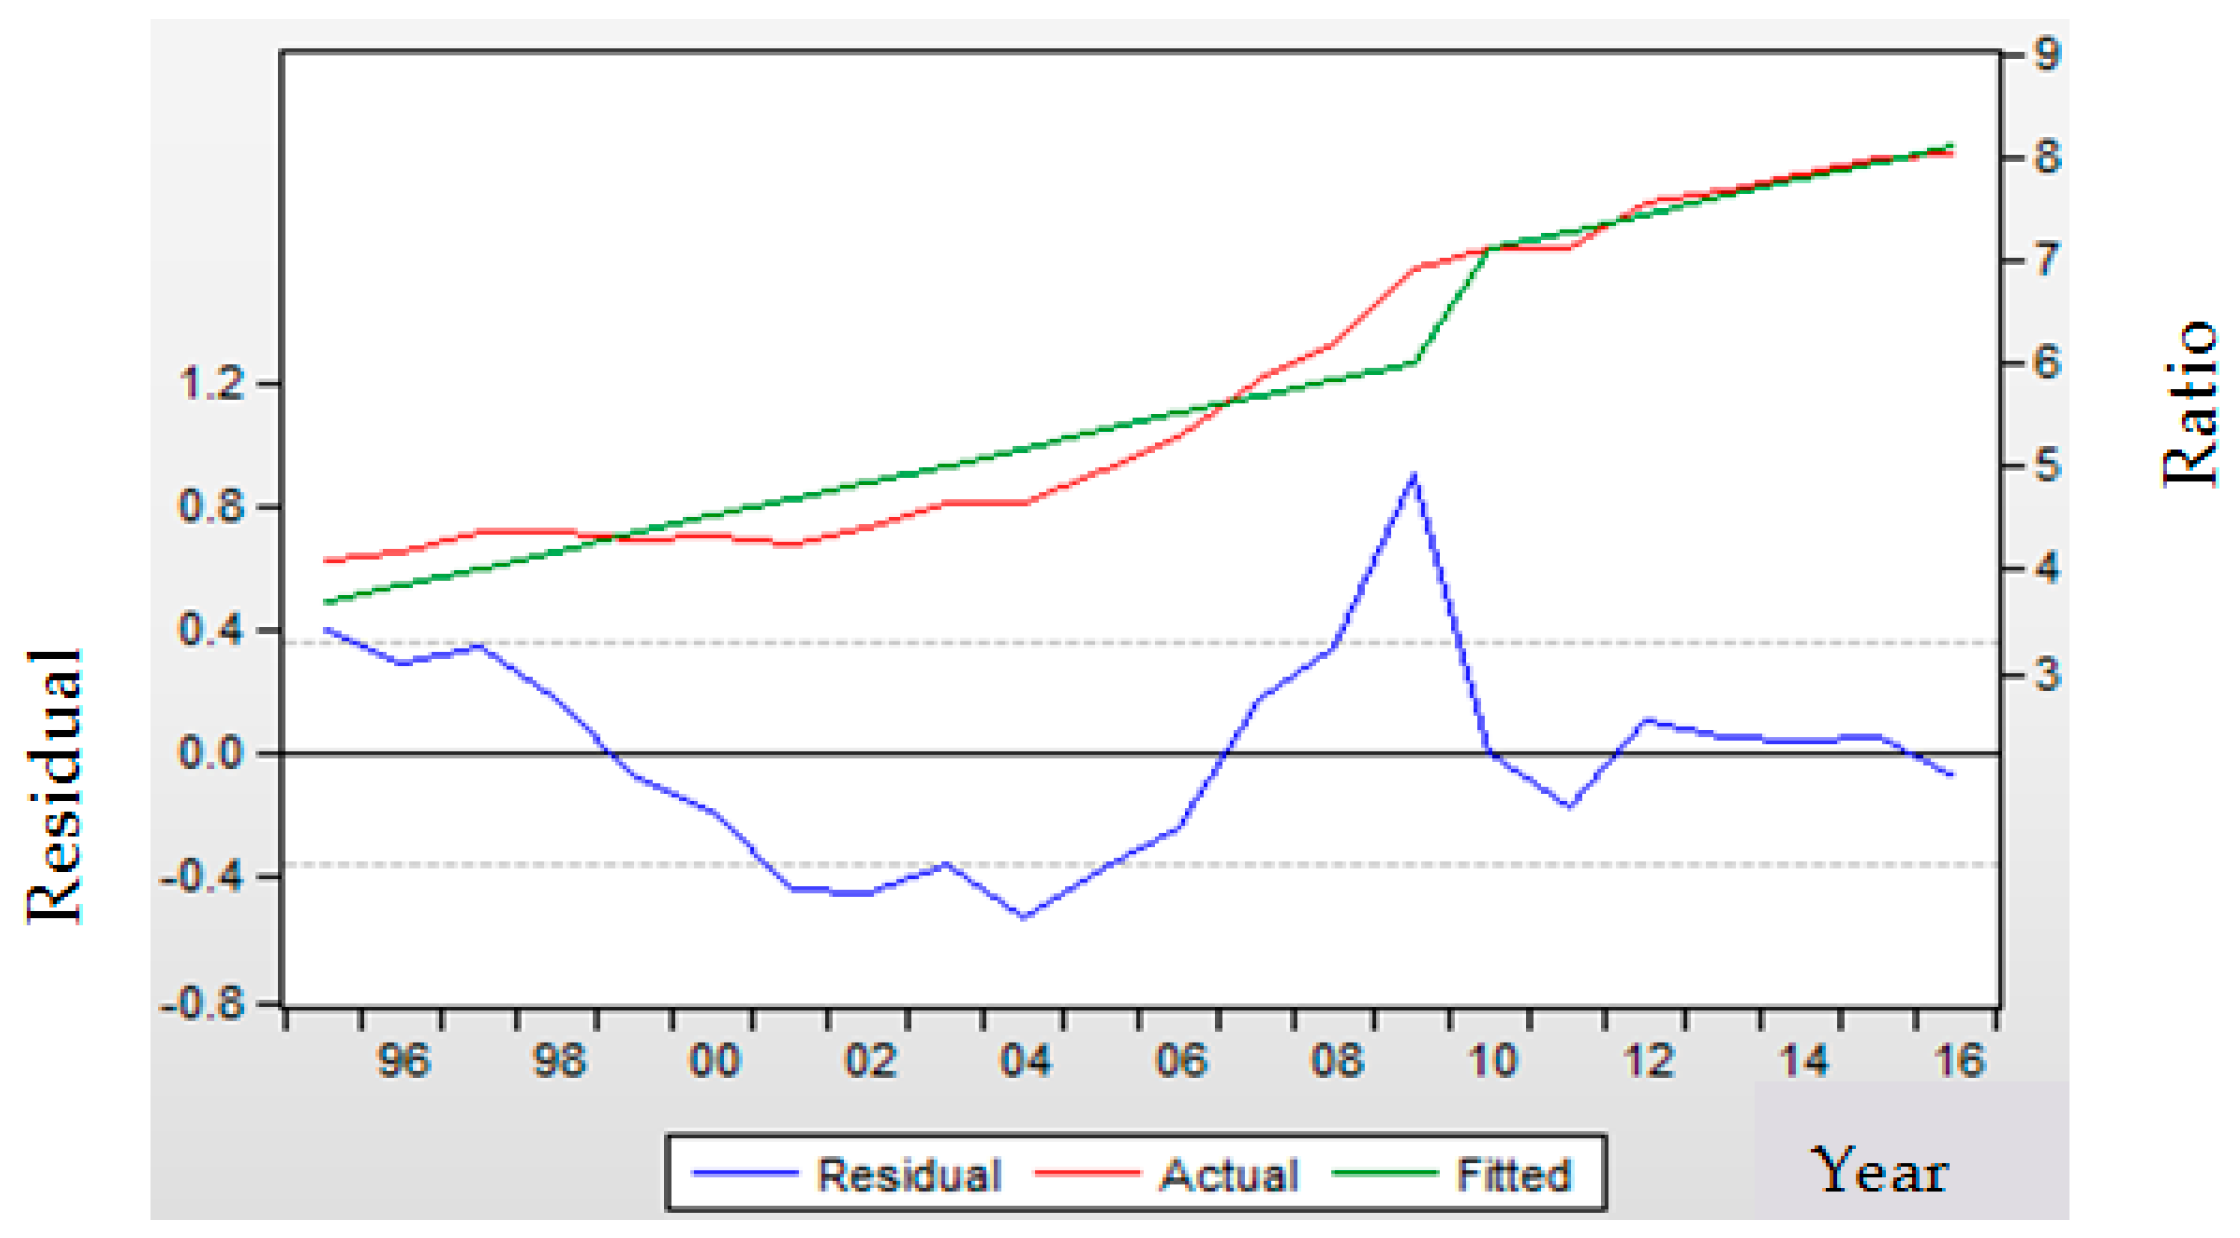
Using the quadratic regression model (2), we obtained the results in Table 2 for the ratio variable. The actual values of ratio, the regression parabola, and the estimation errors are plotted in Figure 4.
As the estimated coefficient the -term is positive, the estimating function is convex and increasing over the period of interest. That means that speed of the increasing of the ratio variable is also increasing.
In order to assess to impact of the 2009 EU directive, the perturbed models (3) and (4) are used.
Note that the coefficients of c, t, and in Table 3 are statistically significant at the 1% significance level. The assumptions of time trend and impact of the EU directive is confirmed by the result given by the linear estimate (3). The hypothesis that the coefficient of in Equation (4) is equal to 0 cannot be rejected at a 10% significance level.
According to the linear perturbed model (3), the effect of the EU directive is an increase of ratio of 0.95 (representing 13.7% from the value in 2009). By model (4), this effect is of only 0.47, representing 6.8% of the value in 2009.
The actual values of ratio, the regression curves, and the corresponding estimation errors for Equations (3) and (4) are plotted in Figure 5 and Figure 6, respectively. Note that the presence of the term has the effect of a jump on both the straight line and parabola.
In order to compare the quality of the fit of the four models presented above to the analyzed set of data, we use several regression coefficients, provided by EViews, given in Table 4.
Comparing the values in Table 4, we may conclude that from the four considered models, the best fit to the data is the quadratic model (2), while the worst one is the linear one.
We also note that the perturbation causes a very small effect on the quadratic model. For the linear model, the presence of the perturbation results in a significant statistical improvement.
In Table 5, the values of statistical descriptors skewness and kurtosis are given, and for the Jarque–Bera test, for the error series corresponding to the four regression models analyzed in this section.
These descriptors show that none of the four series of errors are normally distributed. We may conclude that the linear estimates obtained are not the best linear estimates for the analyzed data.
4.2. Estimation Using Autoregressive Model ARIMA(1,1,1)
In order to select an appropriate autoregressive model for our data, we have to check the stationarity of the time series. Thus, performing the Augmented Dickey–Fuller (ADF) unit root test on the ratio data series, we found that only the first difference of this variable is stationary (see Table 6).
Consequently, an ARIMA model with differencing order 1 could be appropriate. For this reason, we chose the ARIMA(1,1,1) model given by Equation (5). We obtained the empirical indicators reported in Table 7.
All regression coefficients are statistically significant at the 1% significance level. The model is stationary, as the AR-root is 0.98, smaller than 1. Also, as the MA-root is −0.41, the model is invertible.
However, as the AR-root is very close the threshold value of 1, their confidence interval at a -significance level may include 1, so the model does no evolve to a stationary state.
4.3. Forecasting Ratio Using Regression Models
The regression models described in the previous subsections can be used to predict the percentage ratio of FECRE in FEC variables for the 2020 horizon. The results are presented in Table 9.
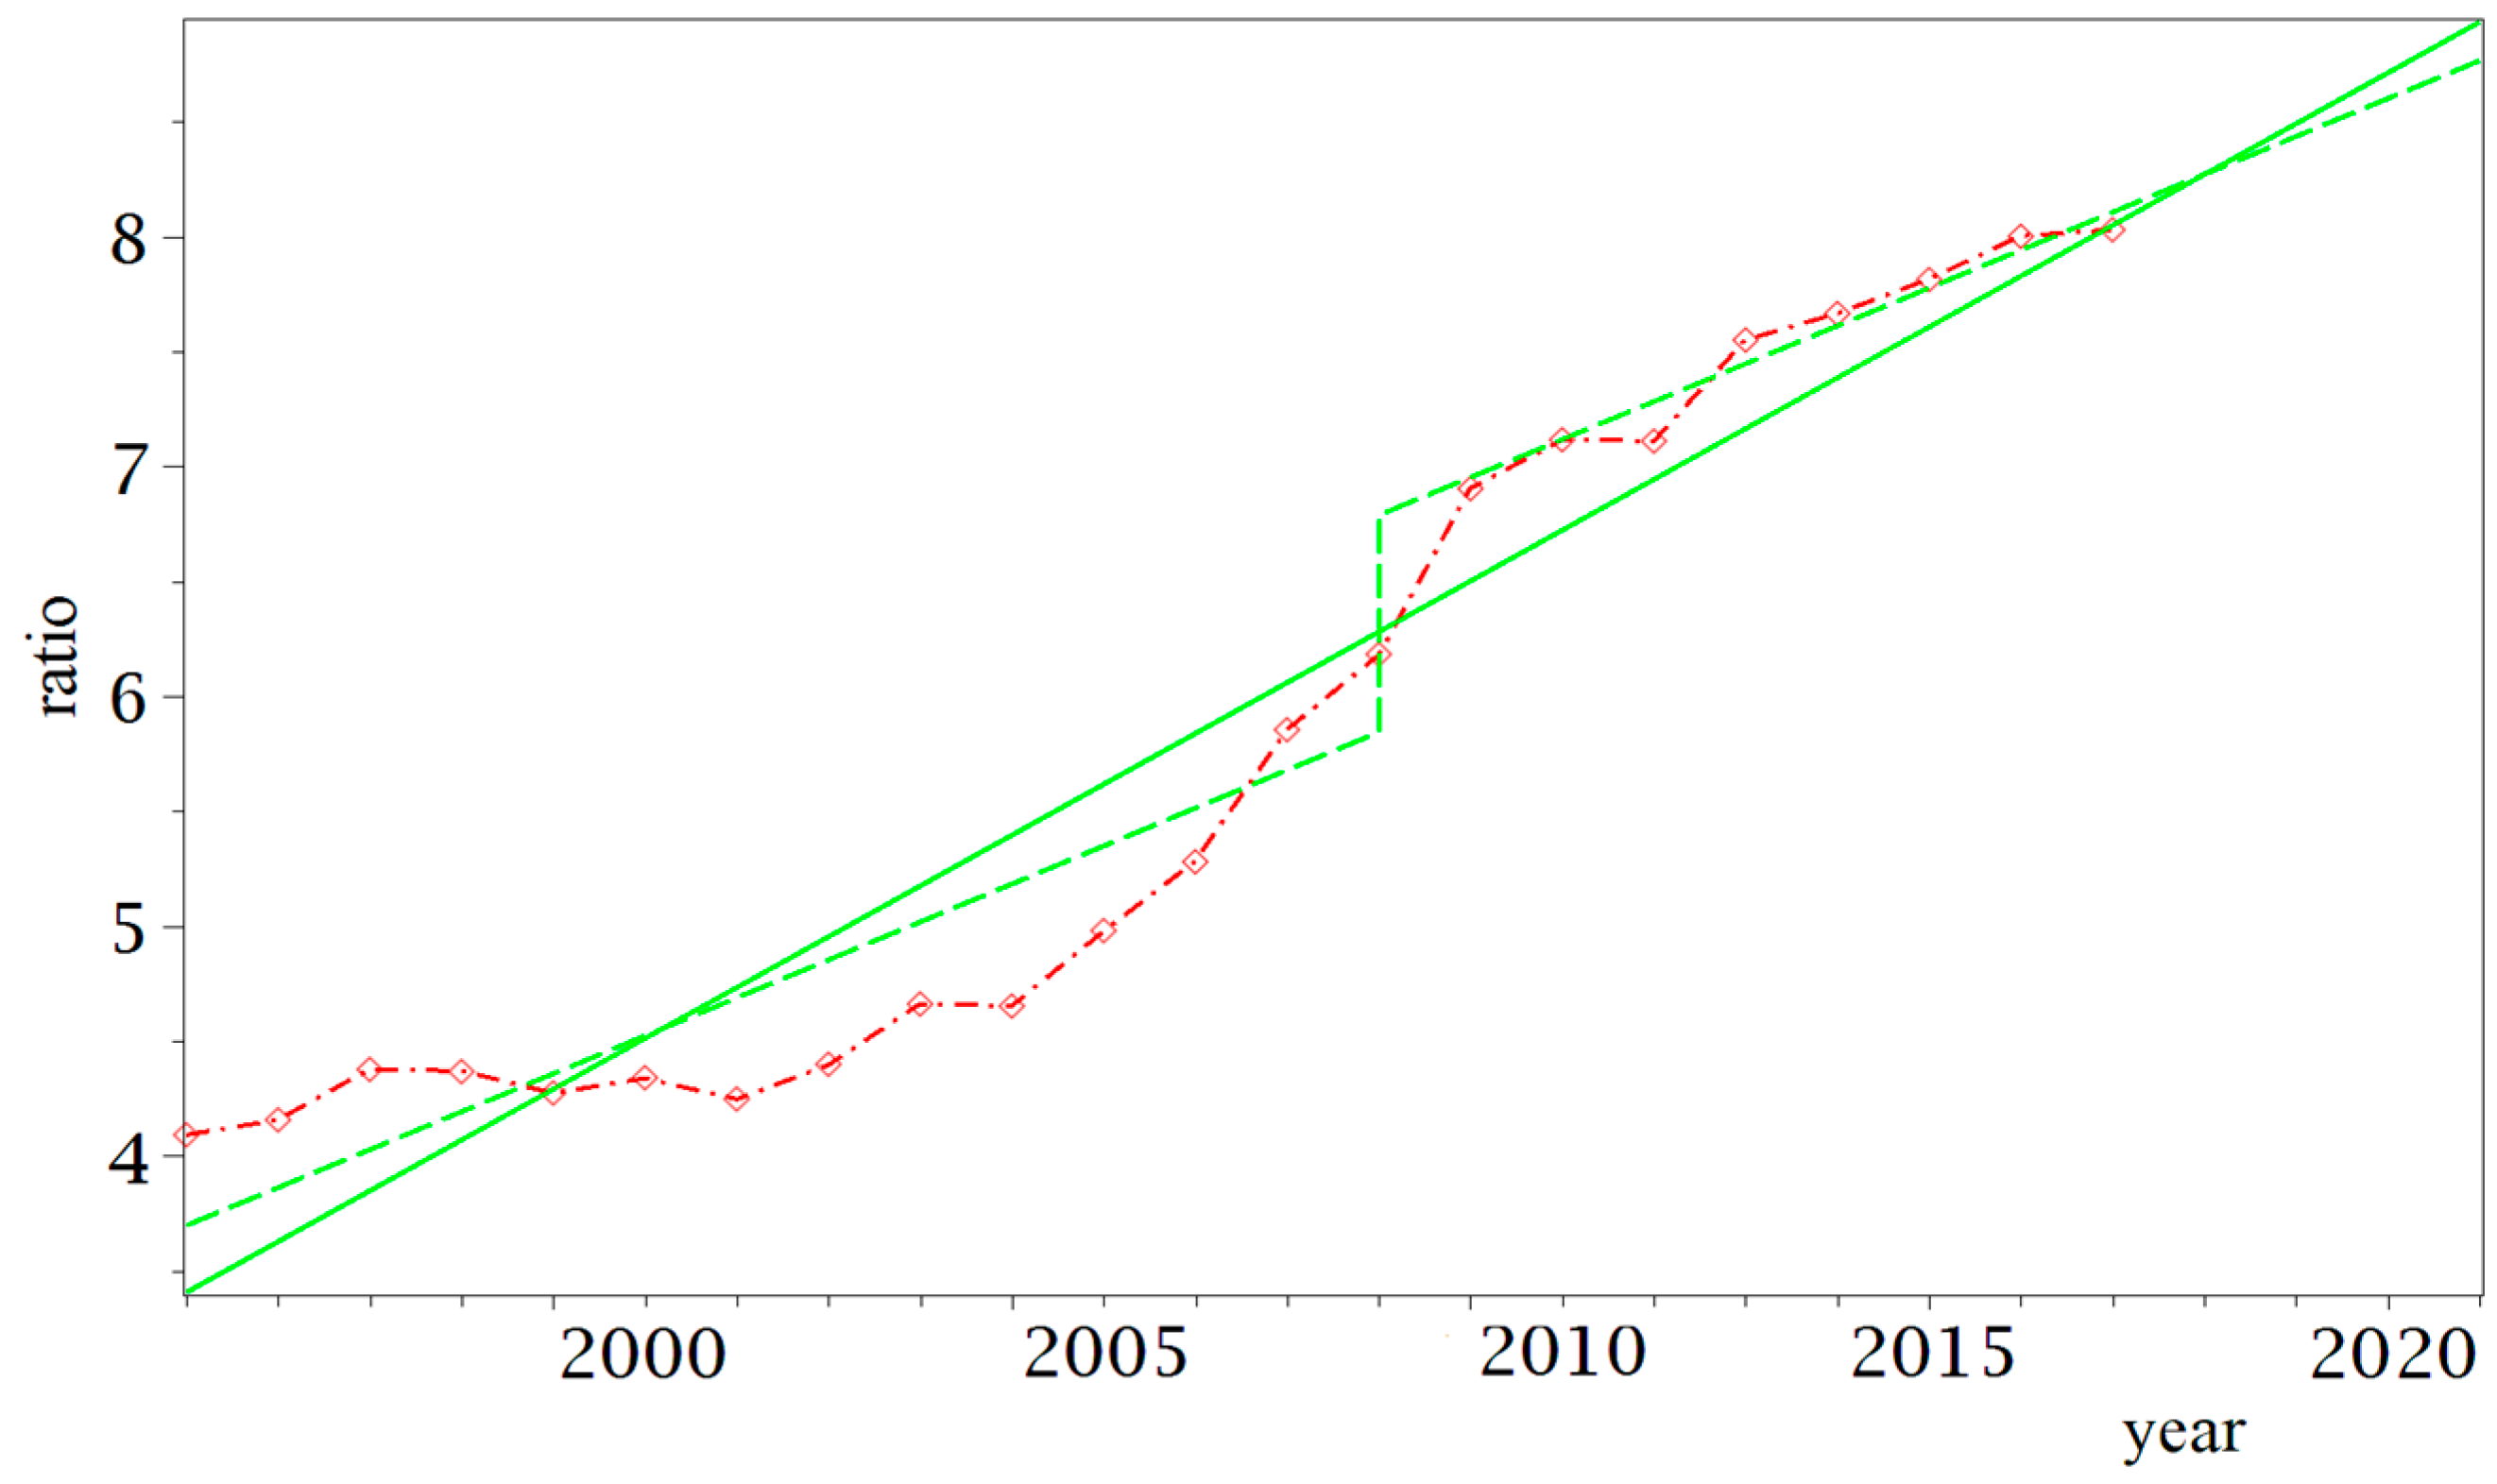
In Figure 7, we represented the actual ratio series, the linear and the linear perturbed regression curves, containing the 2017–2020 region that corresponds to the predicted values in Table 9.
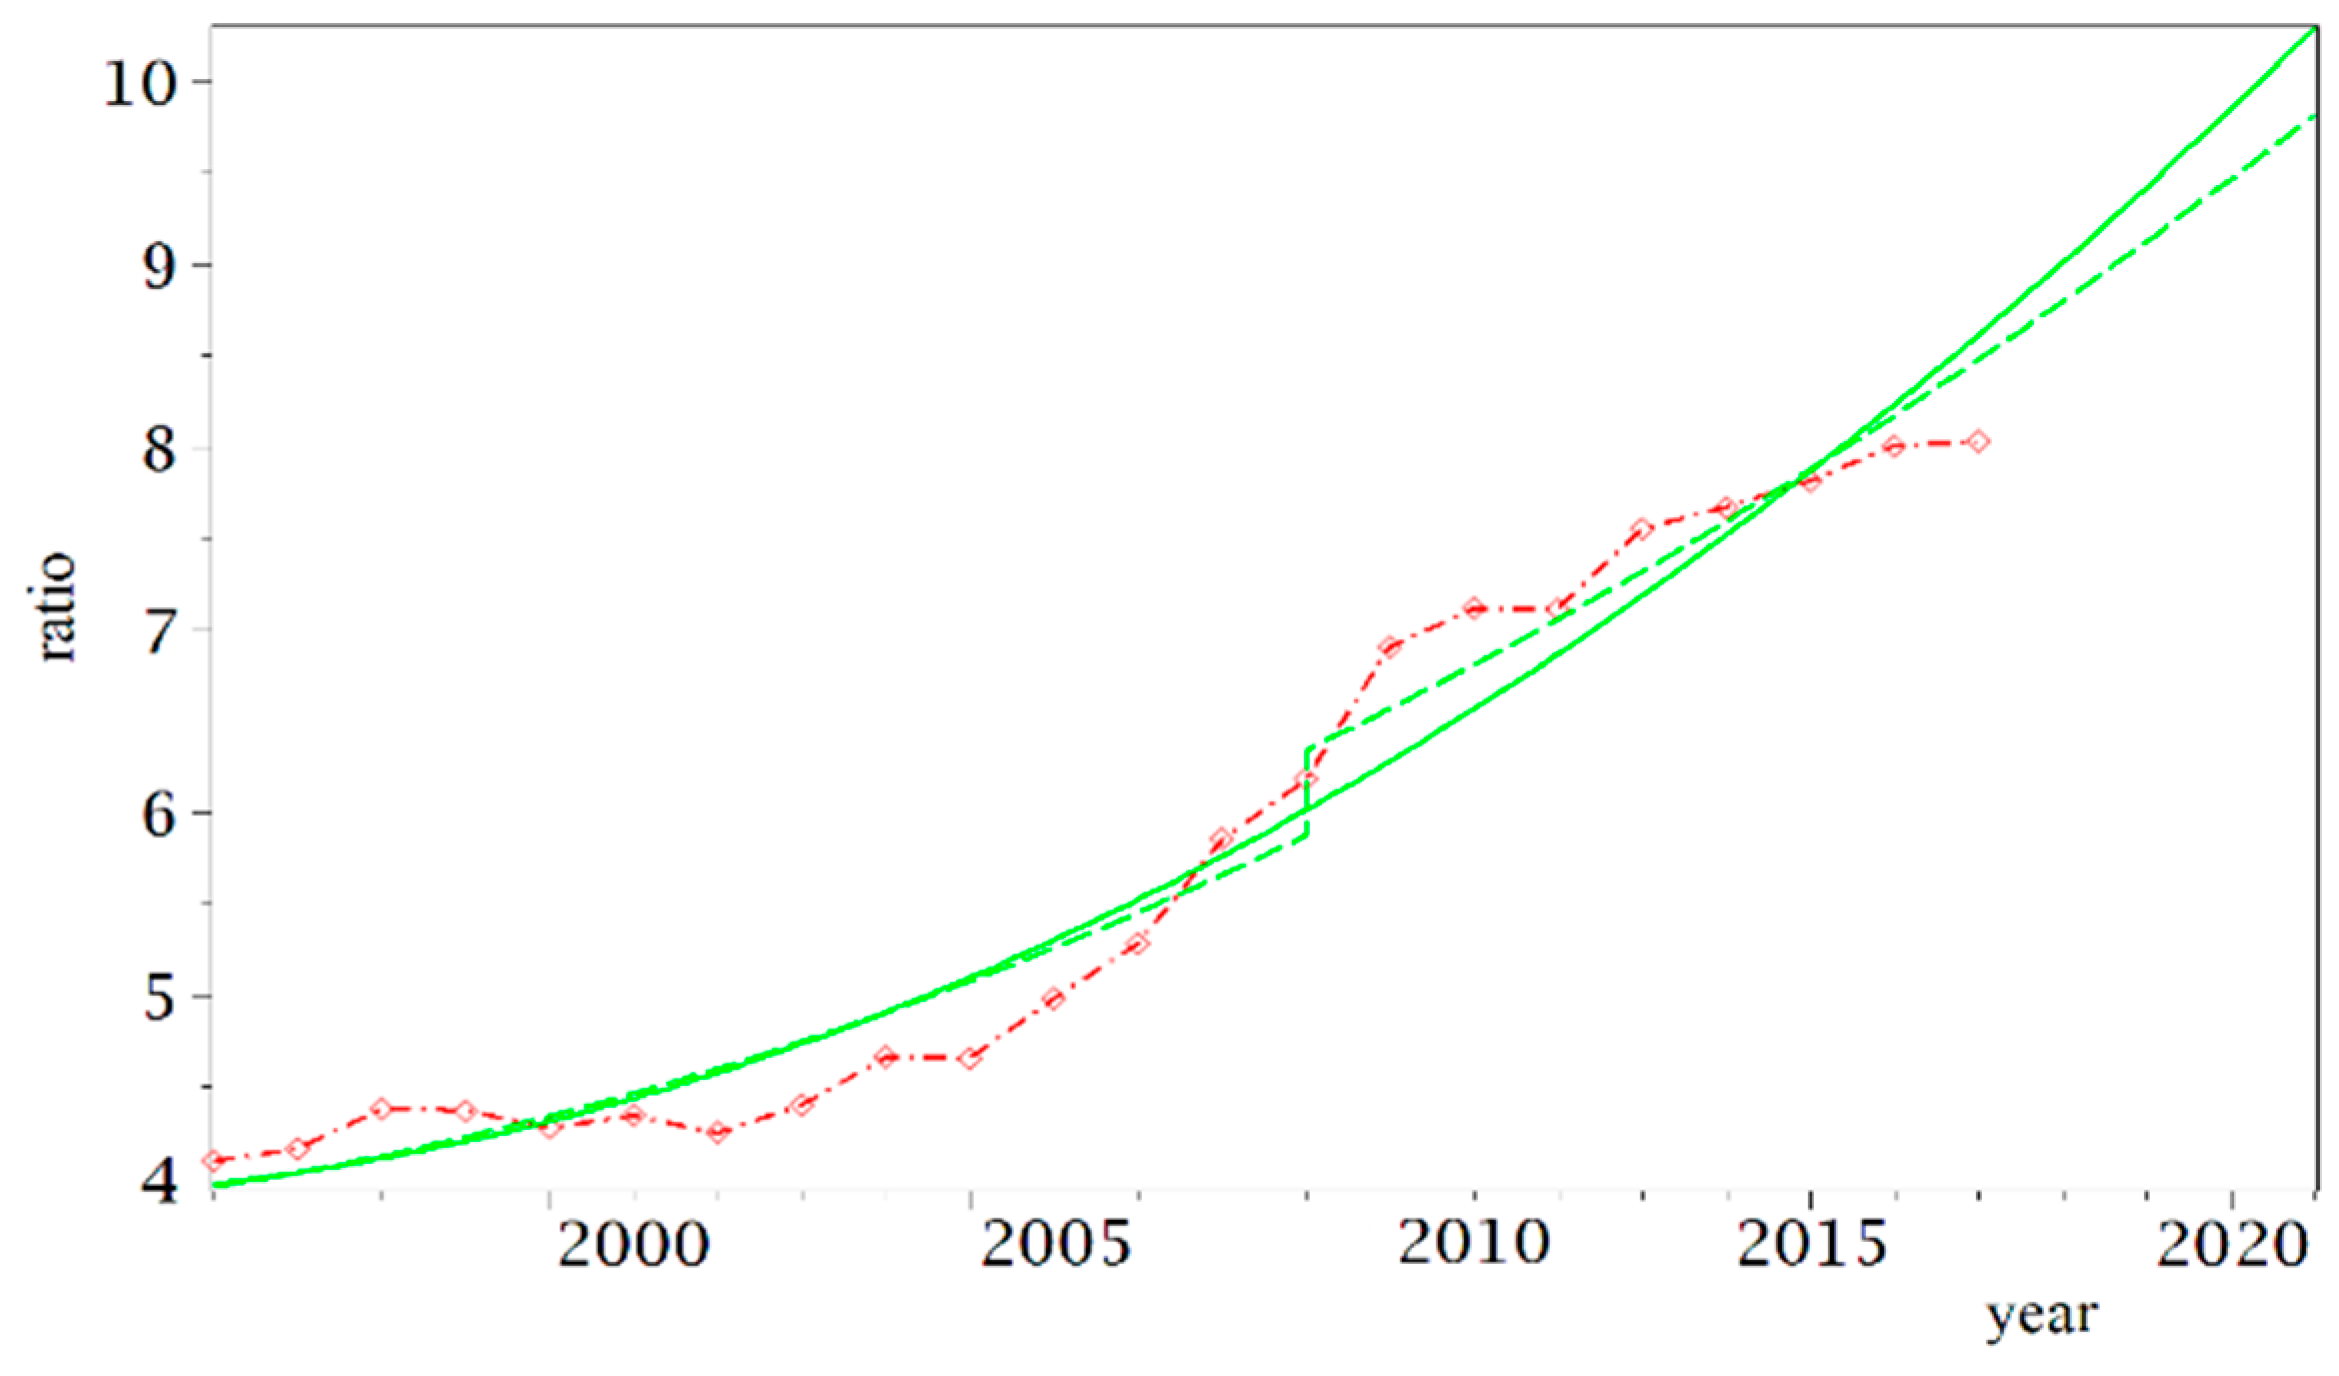
In Figure 8, we represented the actual ratio series, the quadratic and the quadratic perturbed regression curves (models (2) and (4)), containing the 2017–2020 region that corresponds to the predicted values in Table 9.
Taking the standard deviation into account, we may emphasise the best of the four analyzed regression models and corresponding confidence interval. For instance, for the biggest predicted value of the share, given by the quadratic model (2), the confidence interval is (9.71, 10.87), at a 5% confidence level. Using the ARIMA(1,1,1) model, we obtain the estimate of 10.37 for 2020, close to the one predicted by the quadratic regression models (see Table 9).
It should be noted that the confidence interval at a -significance level for the forecasting in the case of polynomial regression has the same length as we consider successive future lags, while in the case of autoregressive models, this interval is widening as the lag increases.
We may conclude that the predicted values of the share of renewable energy of the final energy consumption obtained by the considered models (1)–(5) are very far from the EU expected target.
5. Estimation of Ratio on Groups of EU Countries
5.1. Motivation of Group Selection
EU member states have set their major targets as the reduction of gross energy consumption by 2020, as in order to achieve the objectives of EU Directive [2,3], they should reduce final energy consumption by 20%. However, some countries have increased their consumption compared to 1995 (Croatia, Cyprus, Finland, Greece, Italy, and Portugal). The largest increase in final energy consumption was found in Malta and Lithuania. On the other hand, the share of final national energy consumption in the EU’s total energy consumption is different. For example, Germany has a share of about 20% in EU final energy consumption, while in Malta this value is only 0.04%. Thus, a 5% increase in FECRE in Germany contributes 1% growth at the EU level, while the same increase in Malta is insignificant (0.002%). This observation has led us to group EU countries according to the share of national energy consumption in total EU consumption. The average share of final energy consumption into final energy consumption of the EU over the period 1995–2016, ordered decreasingly is reported in Table 10.
Group 1 contains the four EU members having the largest energy consumption with an average EU final energy consumption share of 56.38% (Germany—19.25%, France—13.43%, United Kindom—12.74%, and Italy—10.96%). This is due to the fact that these countries have a developed economy and a higher standard of living than most of the world’s states.
The second group of countries has a share of 3.2–7.3%, summing to 20.54% overall, and includes Spain, Poland, Netherland, and Belgium.
The third group comprises 9 countries with a share of 1–3%, accounting for 17.75% of the total energy consumed at the EU level.
The remaining 11 countries form the final group, with shares below 1%, accounting for 5.32% of the total energy consumed at the EU level.
The average shares of national FECRE in FEC (ratio) over the analyzed period for the 28 EU countries are given in Table 11. Note that the values are no longer decreasing.
Concerning the FECRE share in FEC, the highest average can be found for countries in the Groups 3 and 4 (Latvia from the fourth group, 24.78%, Finland from the third group, 17.83%), while the countries from Groups 1 and 2 have average shares much lower than the EU average (UK from the first group, 1.78%, Nederland from the second group, 1.51%).
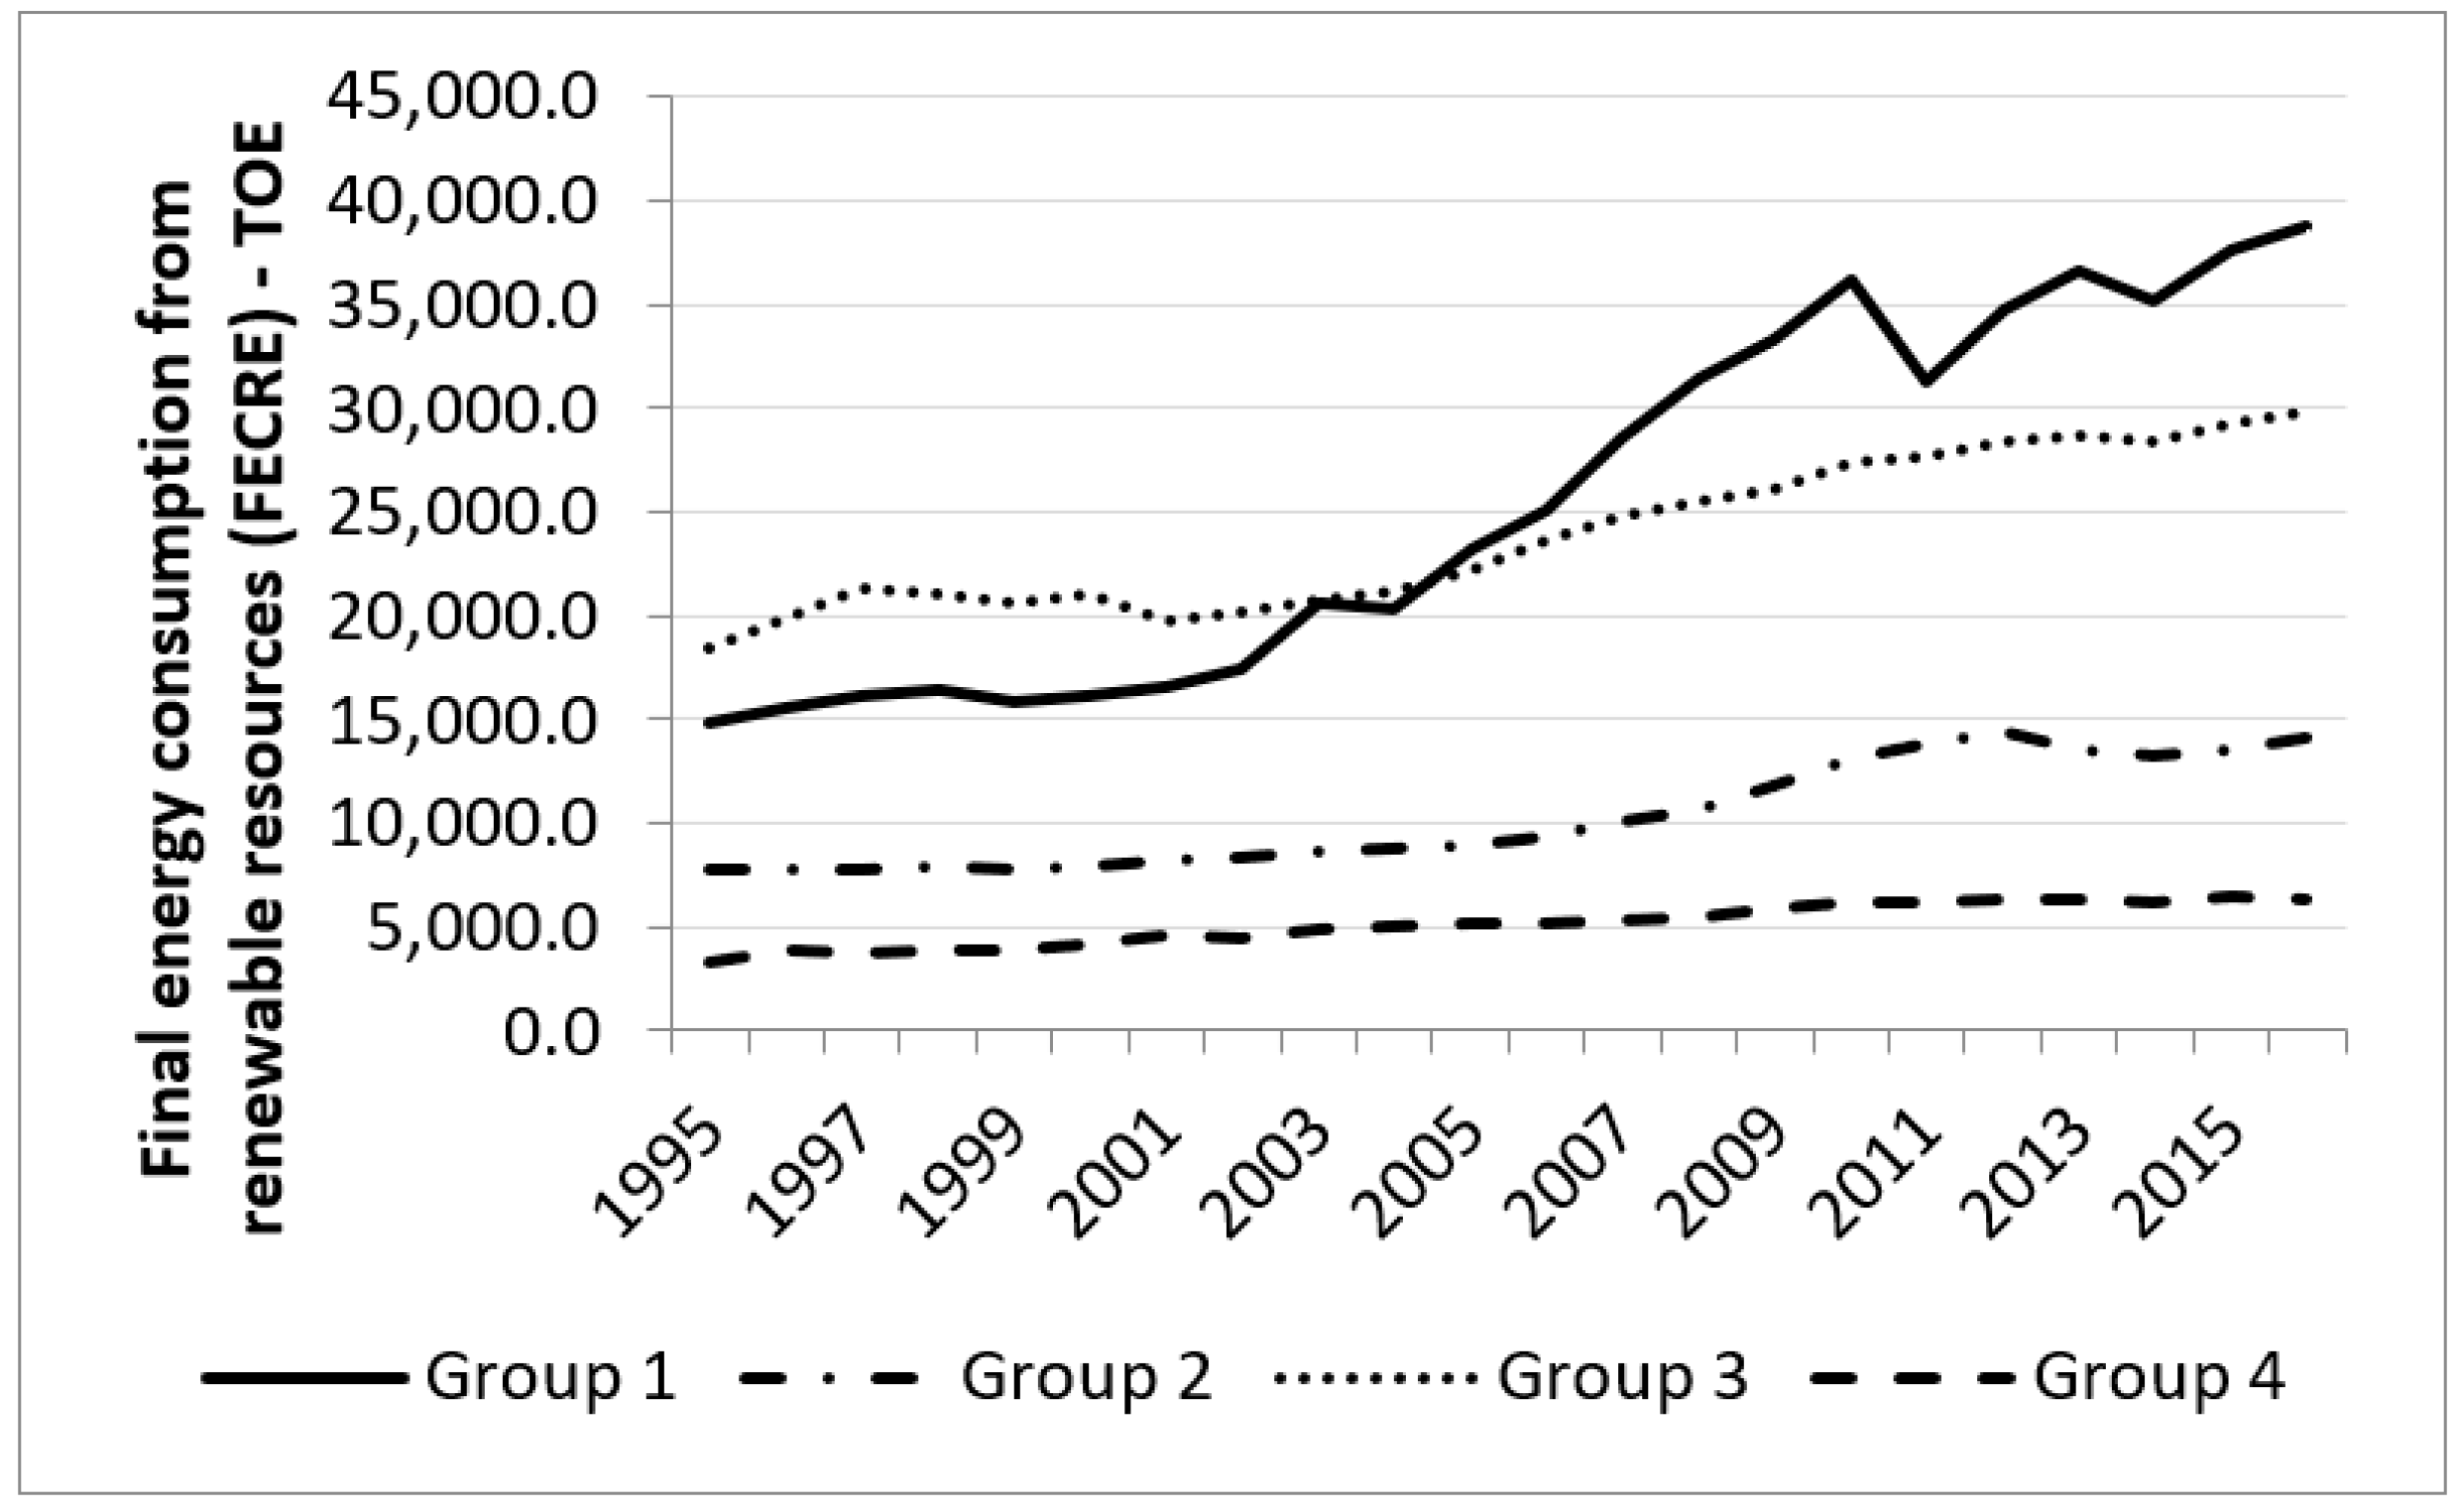
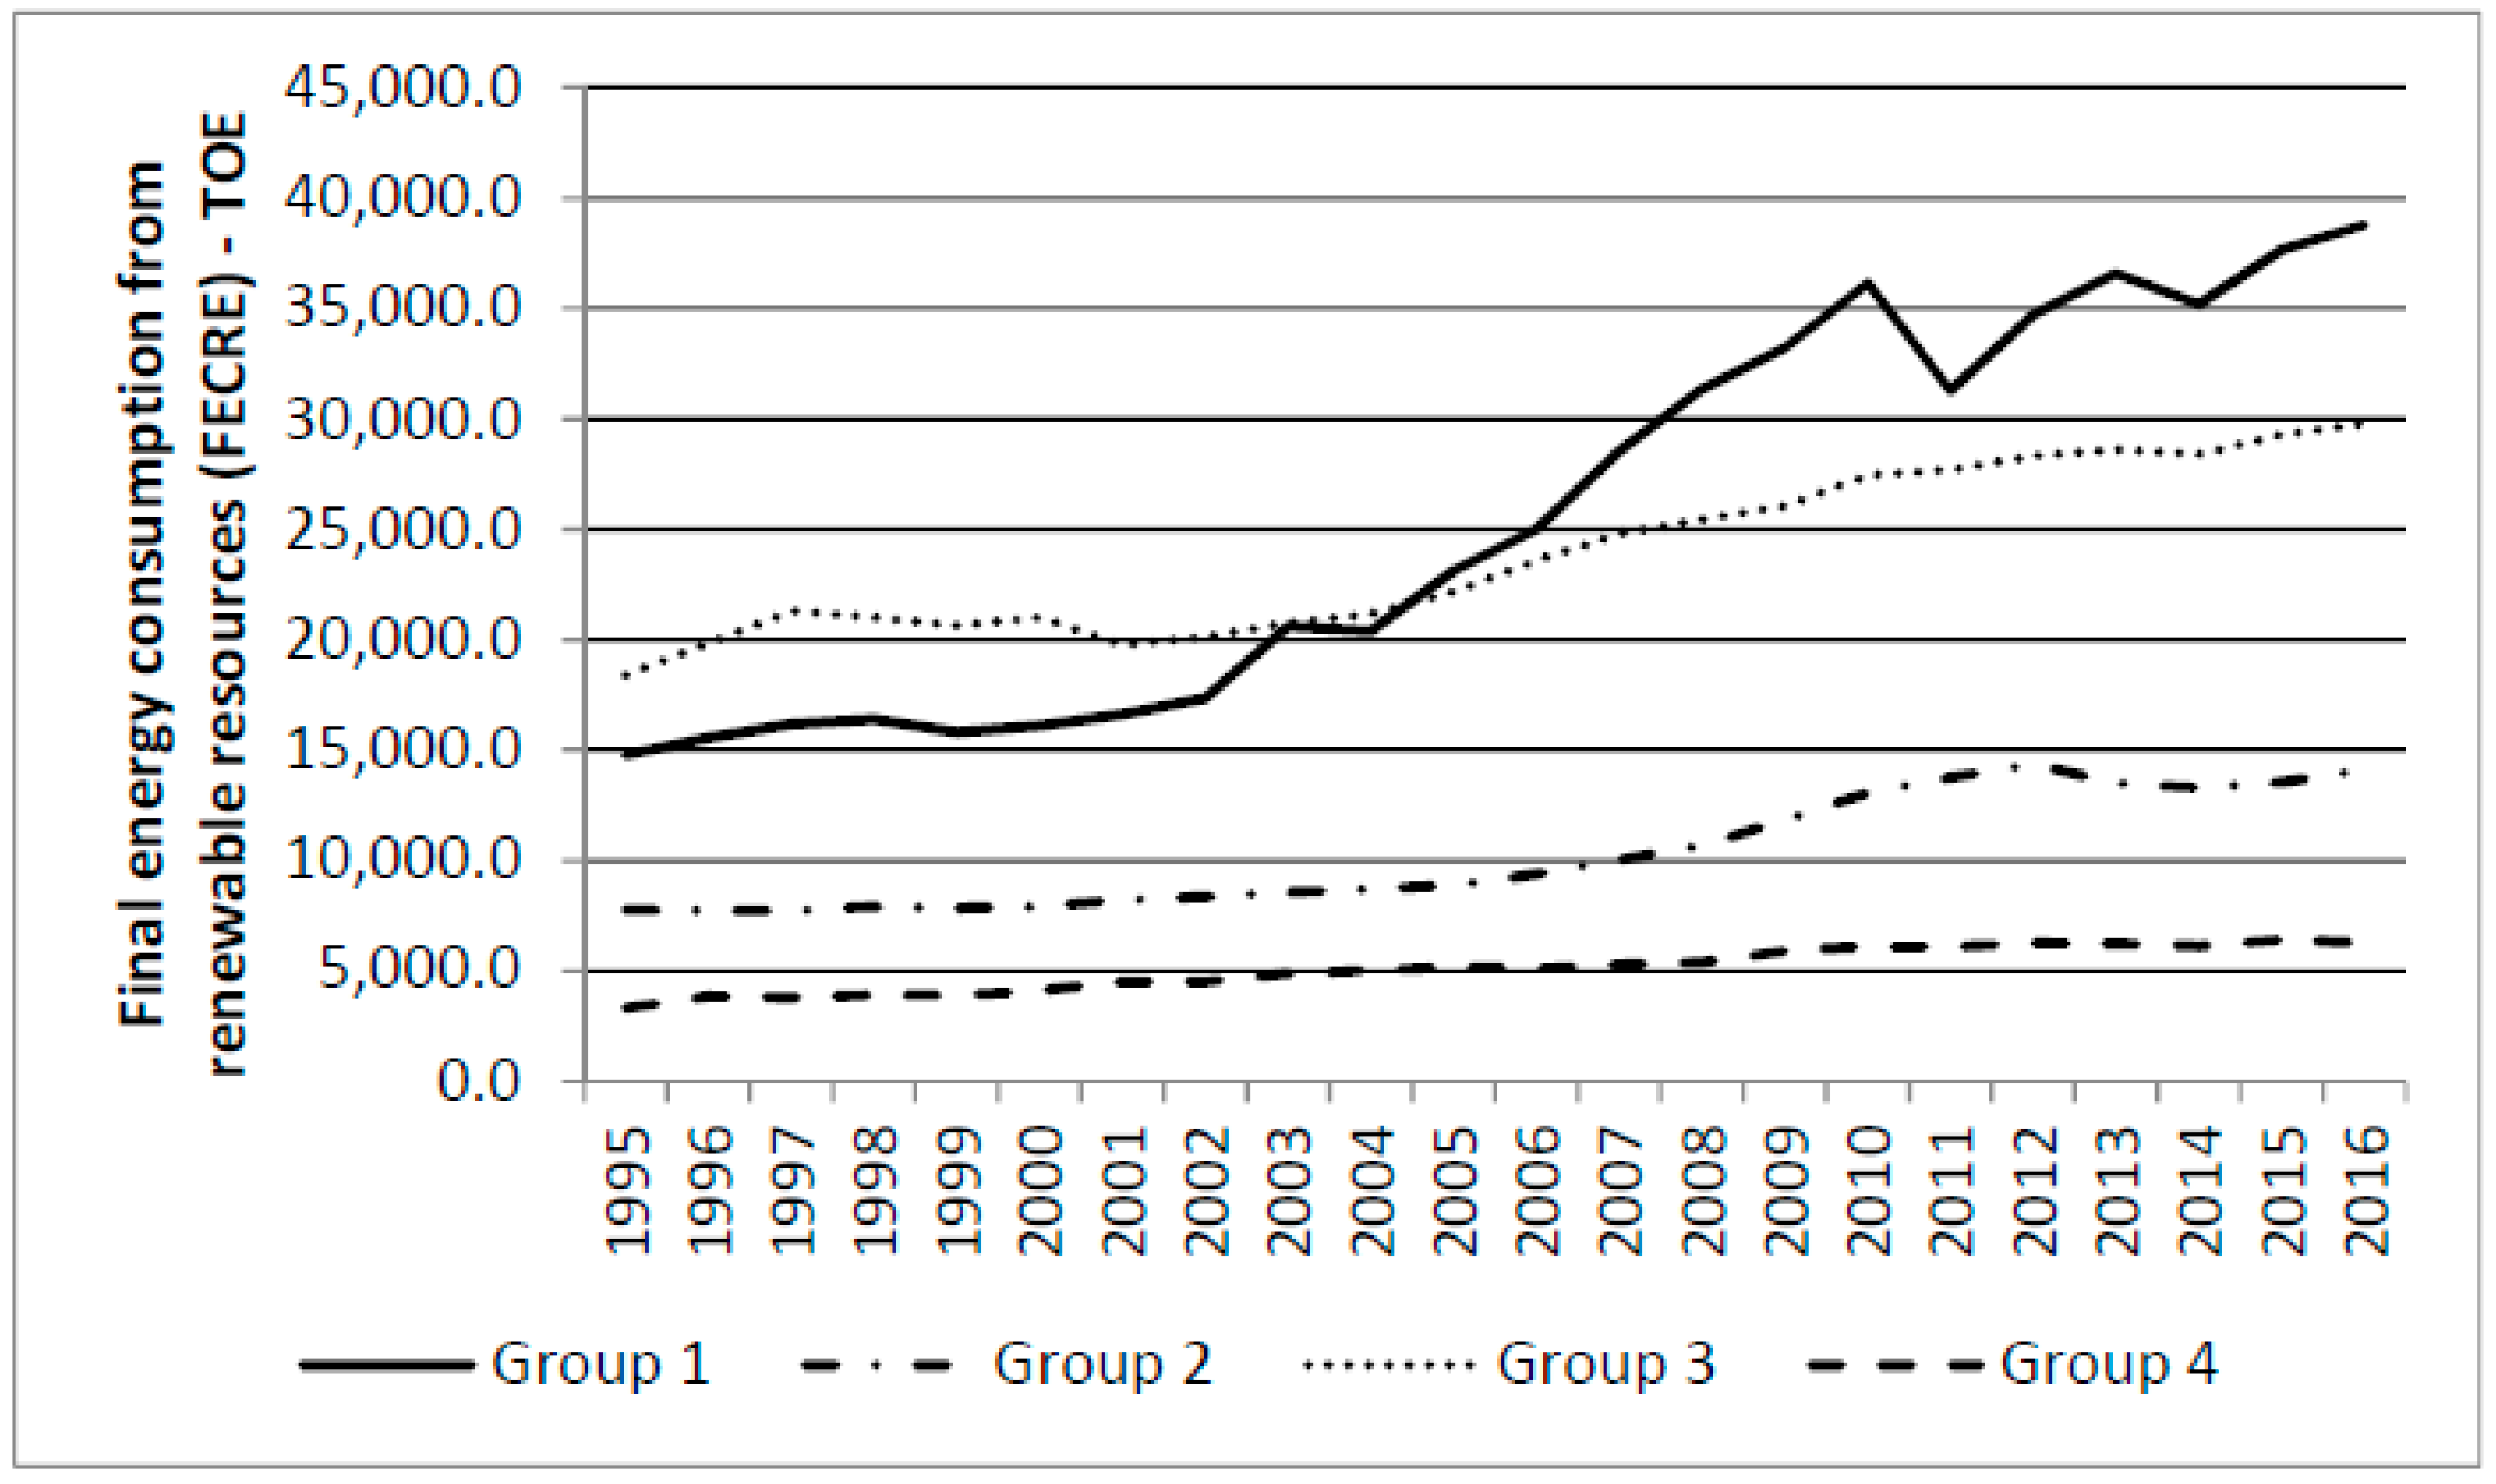
The time series of final energy consumption and final energy consumption from renewable sources are shown in Figure 9 and Figure 10, respectively.
According to the EU Directive [2], by 2020, the final energy consumption should decrease by 20% from the 1995 level. It can be noted that Group 1 experienced a small decrease of 1.48%, while for the other three groups there are significant increases (of 10.8%, 2.97%, and 9.89%, respectively).
From Figure 10, it is clear that the consumption of energy from renewable sources increased in all 4 groups, with a significant increase being recorded in the first group of countries (162.36% in 2016 compared to 1995), followed by the Group 4 countries with an increase of 88.81%, those in Group 2 by 81.08%, and those in Group 3 by 61.94%.
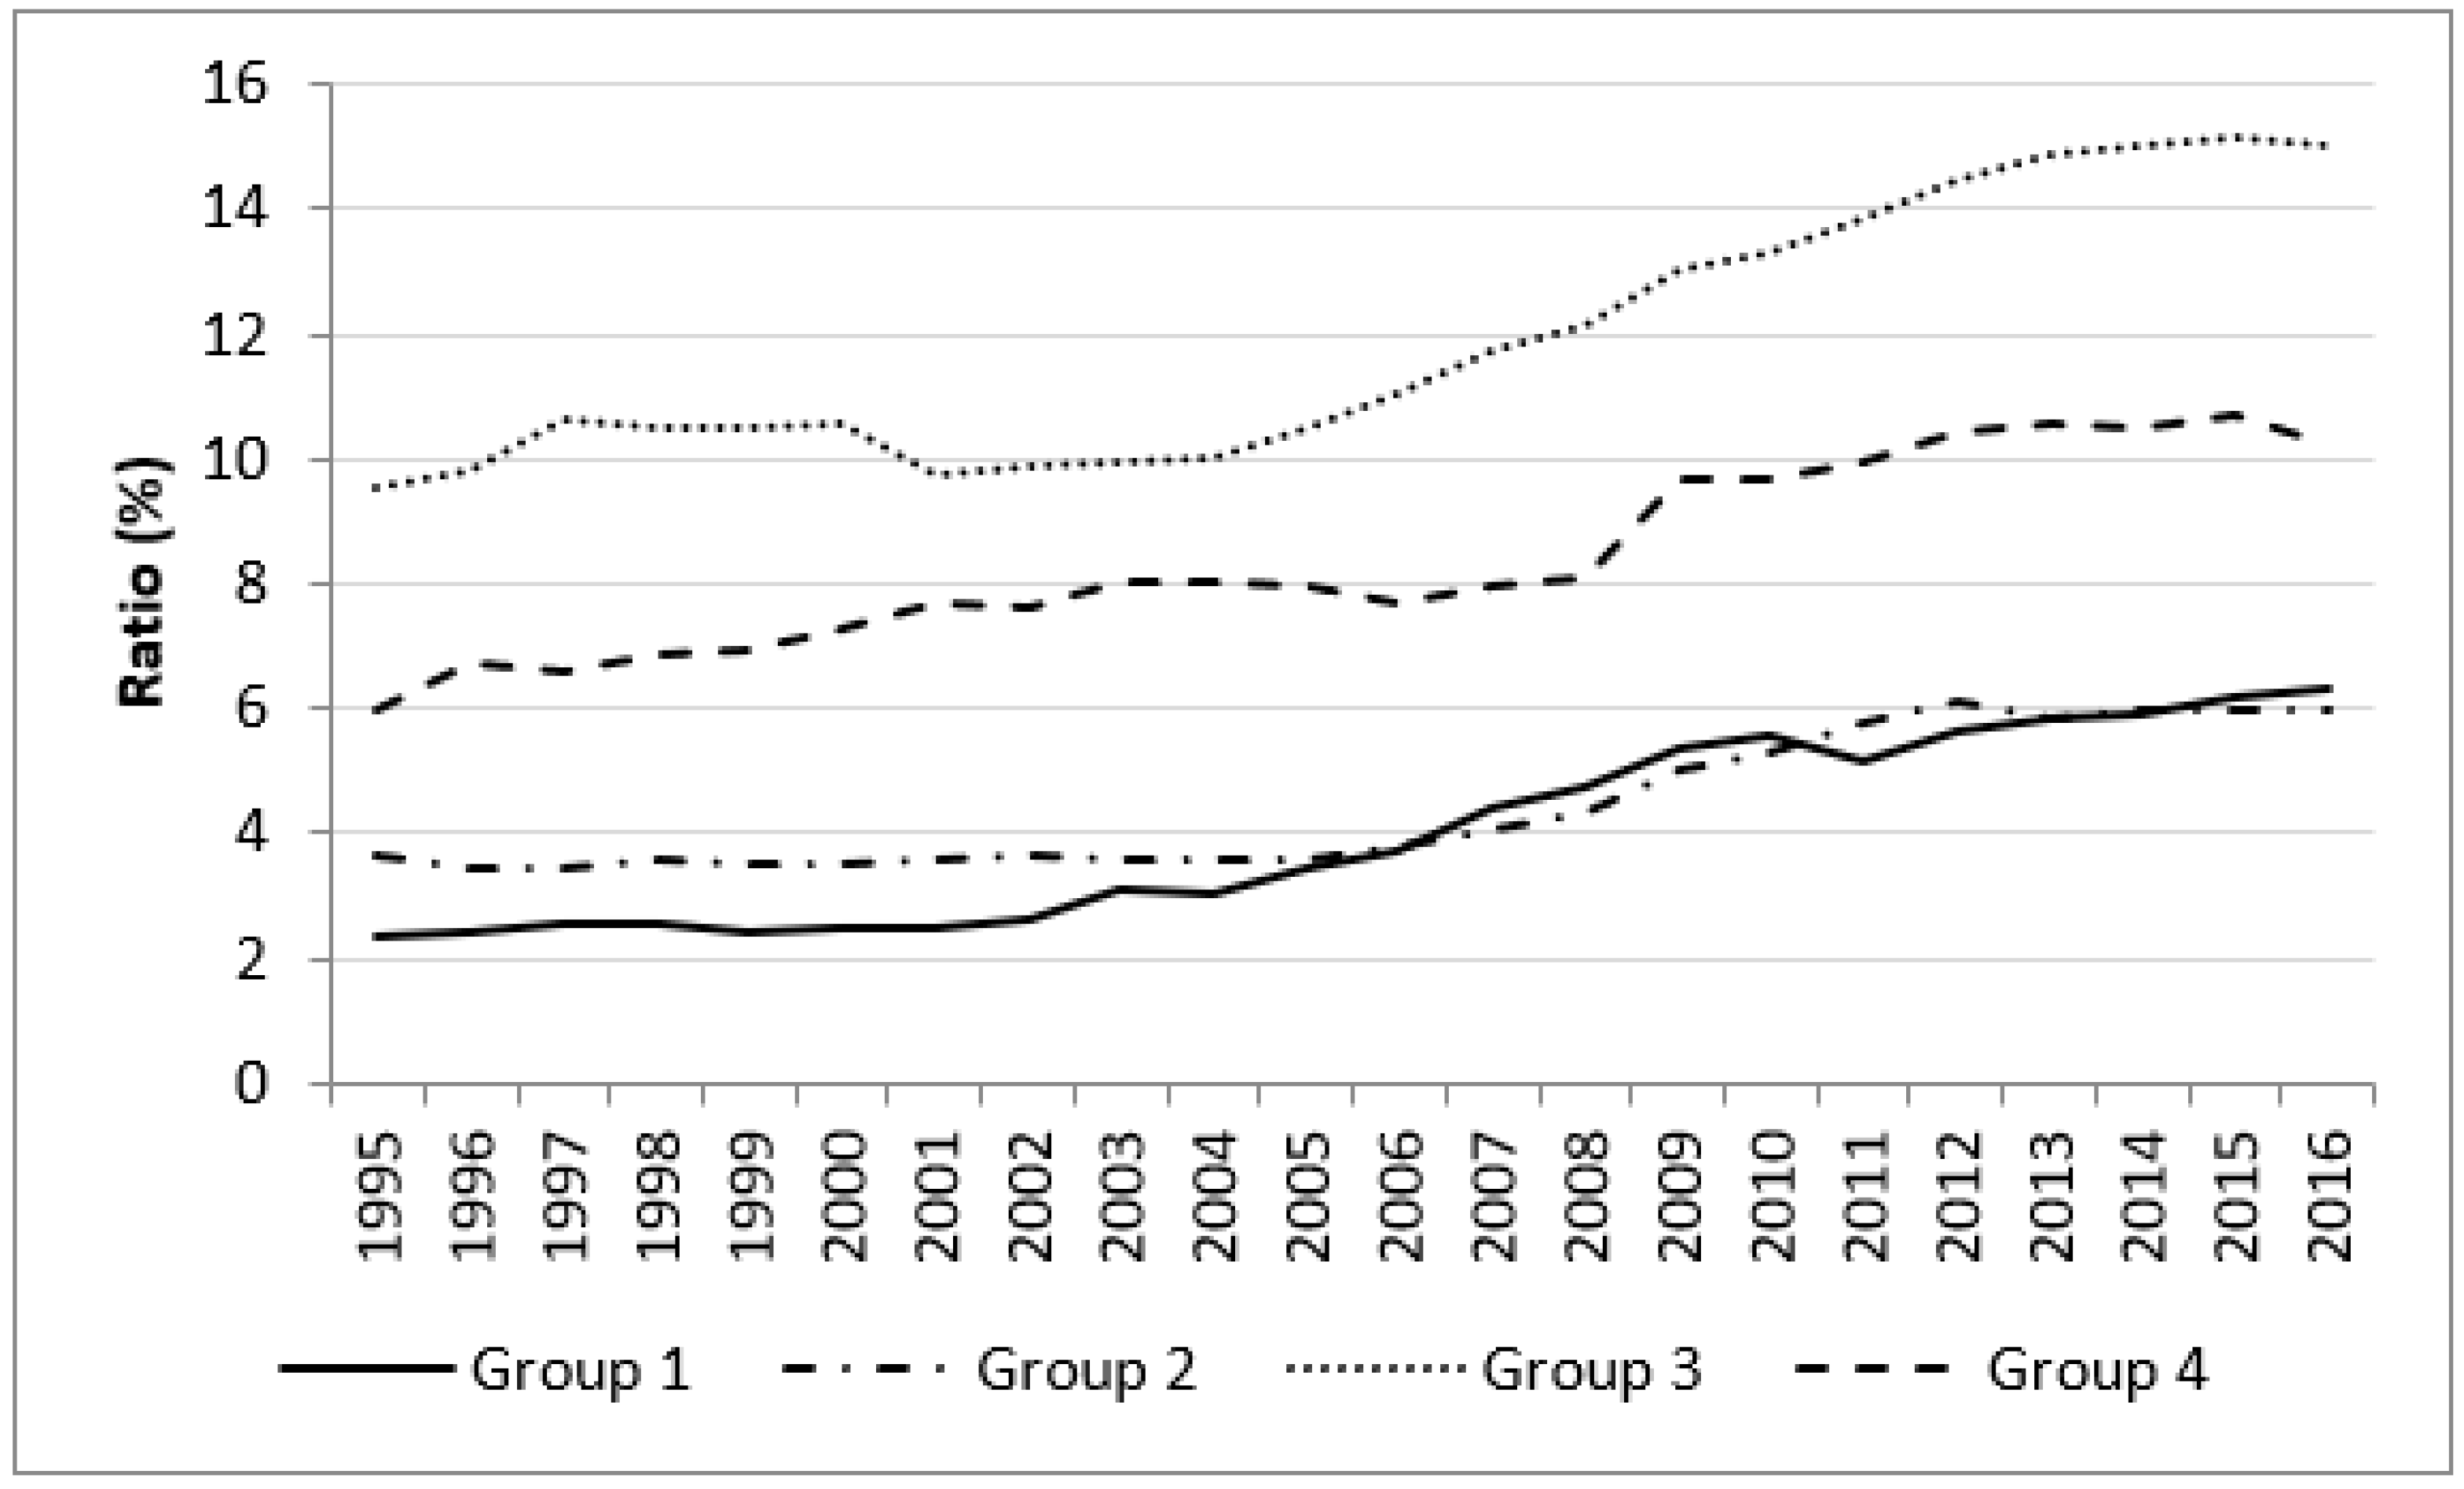
The evolution of the share of FECRE in FEC for the four focus groups over the analyzed period is represented in Figure 11.
It is evident from Figure 11 that the share of FECRE in FEC increased in 2016 compared to 1995 in the four groups of countries. Although the highest share increase rate was recorded by Group 1 (more than 2.5 times), the greatest share increase, in absolute values, corresponds to countries in the third group (which had a share of 9.56% in 1995 and reached 15.04% in 2016). This is also noted in Table 12, where the average FECRE share in FEC for Group 3 is more than double the EU level. We observe that the third group of countries has a much higher average than the EU average, compared to the Groups 1 and 2 countries that are below the EU average.
The mean values of the percentage ratio in the four groups are given in Table 12.
5.2. Empirical Estimations
In order to estimate the evolution of the ratio of FECRE and FEC for the four focus groups, we chose to use the linear and quadratic time regression models introduced in Section 3, namely
for .
The results of estimations obtained by LSM method in EViews, for Equation (6) are given in Table 13 below.
All the coefficients of C and t given in Table 13 are statistically significant at the 1% significance level. Note that the increasing speed of the ratio in linear model (6) for EU, equal to 0.222, is almost equal to that of Group 1. This result is in good agreement with the weight of 56% in the final energy consumption of EU for this group. Compared to the result for EU, the increasing speed of the ratio is 24.05% bigger for Group 3 and 33% smaller for Group 2.
The empirical estimations of Equation (7) for the four groups are given in Table 14.
The estimated coefficients the -term are all positive, hence the estimating function is convex and increasing, as for the EU case.
The estimations for the linear perturbed model in Equation (8) are given in Table 15.
All the coefficients of C, t, and D in Table 15, except one, are statistically significant at the 1% significance level.
The coefficient of D for Group 1 has a probability of 0.102, so it is not statistically significant at the 10% significance level. Thus, the assumptions of time trend and impact of the EU directive are confirmed by the results of the linear perturbed model for three of the four groups.
The effect of the EU directive modelled by the term D is different for the four groups and the value 0.947 was obtained for the EU. The empirical estimation results in Table 15 show that this effect is greatest for the countries of Group 3.
The analysis of the values of different regression coefficients (R-squared, SER, AIC, Schwarz) shows that the best fit for the data in Groups 1 and 3 is the quadratic one, while the perturbed linear model is the best fit for data in Groups 2 and 4.
The prediction obtained using the above three regression models for the four groups of EU countries for the horizon of 2020 are given in Table 16.
The standard error of regression in Table 13, Table 14 and Table 15 have to be taken into account in order to establish confidence intervals for these predicted values. We point out that according to these simulations, the countries in Group 3 may reach the threshold of 20% established in the EU Directive.
5.3. Economic Analysis
One of the EU’s strategies is to reduce final energy consumption by increasing energy efficiency and increasing the share of renewable energy consumption in final energy consumption, aiming to achieve sustainable development, to reduce the EU’s dependence on energy imports, to combat global warming, and to protect the environment.
As a result of the study, we found that the EU’s final energy consumption has been continually and significantly reduced, which leads us to conclude that the decrease in consumption could go below the 2020 target. Also, European countries have committed themselves to increasing the share (expressed as a percentage) of renewable energy consumption in final energy consumption (20% on average), which is different for each country.
Thus, each EU country has set its own 2020 target, taking into account its own characteristics, the potential of renewable sources, and economic performance. As a result, since 2004, the share of energy from renewable sources in final energy consumption has increased significantly in all EU member states. However, as it follows from Table 11, 11 EU countries (namely Belgium, Germany, Ireland, Spain, Italy, Cyprus, Luxembourg, Malta, Netherlands, Slovakia, and the United Kingdom) have a share of renewable energy consumption in final energy consumption below the European Union average.
Among states with the highest shares are Latvia, Finland, Sweden, and Croatia (which have already exceeded the EU), and the opposite is Malta (about 2%), followed by the Netherlands and United Kingdom with a share of around 3%. Obviously, each of these countries will need to increase their share of renewable energy consumption in final consumption to achieve national targets and to fit into the European Union’s strategy. This, we believe, will require a change of policies and national renewable energy action plans and sustained support from the EU. Otherwise, there is a risk of widening the differences between EU countries, where only some will be able to continue the path of increasing the share of renewable energy consumption in final energy consumption. This could lead to the distortion and fragmentation of the internal energy market, automatically generating higher costs and a reduction in the use of energy from renewable sources at the EU level.
The increase in renewable energy consumption has begun to be significant since 2010, along with considerable investment in the production of energy from renewable sources in the EU countries as a result of the EU Directive from 2009. Although most member states are on an upward trend, it does not mean that the achievement of the 2020 target is secure, especially since the investments in renewable energy production have slowed down since 2015.
It is important to note that the first group that has the highest final energy consumption at the EU level (over 56%) has the lowest share of renewable energy (an average for the period 1995–2016 of 3.98%). Although significant investments have been made in increasing the production capacity of renewable energy (especially solar panels), the UK is the farthest country from achieving the EU target. Germany also continues to have overwhelming consumption of fossil and nuclear fuels, and alongside Italy and France, there are large deficits in meeting the targets by 2020.
Countries in the second group with final energy consumption of around 20% have a very different share of renewable energy consumption, averaging a total of 4.42%, which means they will also have problems reaching the targets. The Netherlands has the lowest average of ratio (1.51%) of the group, reaching 2.37% in 2016, much below the European average. This is due to the fact that their final energy consumption is based on a natural gas network (the gas is quite cheap), and government subsidies for the promotion of renewable energy sources are not attractive, being much lower than in other countries (e.g., Scandinavian countries). Spain and Belgium, with an average share of FECRE in FEC lower than the European one, focus on the consumption of electricity from renewable sources, the remainder being based on other types of fuels. Poland has taken important steps in increasing renewable energy consumption and is above the EU average, but in order to achieve the 2020 target, it will be necessary to take additional and rapid measures to boost production and appropriate energy consumption from renewable sources.
In Group 3, we have 9 countries with a final energy consumption of about 17%, but the final consumption of energy from renewable sources is the most significant in this group. This is because on the one hand, the group includes countries where renewable sources have already had a significant role in the energy mix (Austria, Denmark, Finland, and Sweden), and where the climate and the lack of fossil fuel resources have forced industry and society to minimize energy consumption. Portugal had a downward trend, unfortunately, and although it has invested heavily in renewable energy, in recent years the share of renewable energy consumption has fallen (17.44% in 1995 to 13.43 in 2016), due to fairly high costs. On the other hand, the other countries (Czech Republic, Romania, Greece, and Hungary), in addition to benefiting from a rich network of renewable sources, joined the EU quite recently (except for Greece) and had to intensify efforts to meet EU targets.
Group 4 includes the countries with the lowest final energy consumption of the final energy consumption total at the EU level (each smaller than 1%, with a sum of about 5%). But what is important is that the states in this group are small states, some of them have joined the EU recently and thus have constantly increased their share of FECRE in the FEC.
In some EU countries, the share of renewable sources in gross final consumption exceeded the target value for 2020, starting with Estonia and Hungary in 2011, Bulgaria and Sweden in 2012, Czech Republic in 2013, and Italy, Lithuania, Romania, and Finland in 2014, but their shares in final energy consumption are still significantly far from reaching the EU targets.
The forecasting realized in Section 4 for the EU showed that the best prediction for the share of FECRE in FEC is 10.29% with a confidence interval (9.71, 10.87). The best prediction obtained using regression models in Section 5.2 shows that expected values are smaller for Groups 1 and 2 (about 8.5%). The best prediction for Group 3 (of 18.7%) reaches the target imposed by the EU Directive.
6. Conclusions
In this paper, motivated by EU Directive 2009/28/EC stating the necessity to decrease final energy consumption while increasing the renewable energy consumption, such that its share into the final energy consumption should reach a target of 20% by 2020 in the EU countries, we analyzed the tendency of these shares and obtained forecasting, using a panel of data for 28 countries of European Union over a period from 1995 to 2016 and several regression models.
The study was developed in two directions.
First, we analyzed final energy consumption, energy consumption from renewable sources, and their ratio in the European Union. The results obtained demonstrate that the final energy consumption at the EU level has been decreasing continuously, which leads us to conclude that the fall in consumption could be exceeding the indicative targets for 2020. Consumption of energy from renewable sources over all the EU has marked a permanent increase, in 2016 being double that of 1995.
We used four polynomial regression models to estimate the evolution of ratio, with all the models showing an increasing trend for the ratio between final energy consumption from renewable sources and final energy consumption at the EU level.
Comparing the values obtained by the four considered models, we found that the best statistical fit for the data was the quadratic model, while the worst was the linear model. Empirical simulations using perturbed linear and quadratic regression models showed the positive impact of the EU Directive in increasing this ratio.
We found that the best empirical forecast obtained by these models is around 10.3%, quite far from the target established by EU Directive 2009/28/EC.
Second, using the share of national energy consumption into the final energy consumption for the EU overall as a criterion, we constituted four groups of countries, with total share of about 56%, 21%, 18%, and 5%, respectively. Empirical estimations of the share of renewable energy consumption into the final energy consumption showed increasing trend for all groups. However, we found different empirical forecasting, with best expected values of 8.5%, 8.1%, 18.7%, and 12.4%, respectively.
The results obtained in this paper prove that the political decisions of the EU concerning the necessity to increase renewable energy consumption had an impact on national politics, resulting in a continuous increase in the share of final energy consumption from renewable sources in final energy consumption. Despite the progress in this direction, our forecasts based on the present data indicate that the target of reaching the 20% share of renewable energy in final energy consumption will not be achieved by 2020.
By grouping states according to final energy consumption, we could see that for the energy-intensive states, although they have increased their renewable energy consumption share, this share is still well below the target set, unlike the states in third and fourth groups. The point is that the objective will only be achieved by significantly increasing the contribution of renewable energy sources to energy consumption across all EU Member States. This requires EU members to take measures and carry on concerted action to reduce energy consumption and also to increase the renewable energy share in the final energy consumption to reach the 2020 target. With the increase of this share, we believe that EU countries will have the potential to significantly reduce greenhouse gas emissions and thus improve the quality of the environment.
Finally, we point out that energy consumption at the EU level in 2016 was nearly the same as in 1990, although the EU-28 population increased by 33.3 million people in the same period. Thus, we consider that per capita consumption would be a more relevant indicator. A study based on this indicator will be addressed in a future paper.
Author Contributions
All three authors contributed equally in designing and writing this paper. Specific tasks were done as follows: A.M. and G.S. researched and realized the database; M.S. selected and adapted the time regression and Autoregressive models, and also the methodology; G.S. analyzed the data; A.M. performed the empirical estimations in EViews; M.S. analyzed and interpreted the empirical results; A.M. and G.S. performed the economic analysis; A.M. researched and compiled the references.
Acknowledgments
The authors express their gratitude to the anonymous reviewers, whose insightful comments and suggestions led to improvement of this paper. This research did not receive any specific grant from funding agencies in the public, commercial, or not-for-profit sectors.
Conflicts of Interest
The authors declare no conflict of interest.
References
- European Parliament. Promotion of Renewable Energy Sources in the EU, EU Policies and Member State Approaches. European Union. Available online: http://www.europarl.europa.eu/RegData/etudes/IDAN/2016/583810/EPRS_IDA%282016%29583810_EN.pdf (accessed on 15 September 2017).
- EUR-Lex. Directive 2009/28/EC of the European Parliament and of the Council of 23 April 2009 on the Promotion of the Use of Energy from Renewable Sources and Amending and Subsequently Repealing Directives 2001/77/EC and 2003/30/EC. Available online: http://eur-lex.europa.eu/legal-content/EN/TXT/PDF/?uri=CELEX:32009L0028&from=RO (accessed on 18 September 2017).
- EUR-Lex. Directive (EU) 2015/1513 of the European Parliament and of the Council of 9 September 2015 Amending Directive 98/70/EC Relating to the Quality of Petrol and Diesel Fuels and Amending Directive 2009/28/EC on the Promotion of the Use of Energy from Renewable Sources. 2015. Available online: http://eur-lex.europa.eu/legal-content/EN/TXT/PDF/?uri=CELEX:32015L1513&from=EN (accessed on 5 October 2017).
- EUR-Lex. Proposal for a Directive of the European Parliament and of the Council on the Promotion of the Use of Energy from Renewable Sources (Recast), Brussels. Available online: http://eur-lex.europa.eu/legal-content/EN/TXT/?uri=CELEX:52016PC0767R%2801%29 (accessed on 6 October 2017).
- IEA. Energy and Climate Change, World Energy Outlook Special Report. Available online: https://www.iea.org/publications/freepublications/publication/WEO2015SpecialReportonEnergyandClimateChange.pdf (accessed on 7 November 2017).
- EUR-Lex. Directive 2012/27/EU of the European Parliament and of the Council of 25 October 2012 on Energy Efficiency, Amending Directives 2009/125/EC and 2010/30/EU and Repealing Directives 2004/8/EC and 2006/32/EC. Off. J. Eur. Union 2012. Available online: http://eur-lex.europa.eu/legal-content/EN/TXT/PDF/?uri=CELEX:32012L0027&from=EN (accessed on 25 September 2017).
- Eurostat Statistics Explained. Available online: http://ec.europa.eu/eurostat/statistics-explained/index.php/Glossary:Gross_inland_energy_consumption (accessed on 17 November 2017).
- Council of the European Union. Tackling Climate Change, the 2030 Climate and Energy Framework, Brussels. Available online: http://data.consilium.europa.eu/doc/document/ST-169-2014-INIT/en/pdf (accessed on 14 September 2017).
- Soava, G.; Mehedintu, A.; Sterpu, M.; Raduteanu, M. Impact of renewable energy consumption on economic growth: Evidence from European Union countries. Technol. Econ. Dev. Econ. 2018, 24, 1197–1215. [Google Scholar]
- Cucchiella, F.; D’Adamo, I.; Gastaldi, M.; Miliacca, M. Efficiency and allocation of emission allowances and energy consumption over more sustainable European economies. J. Clean. Prod. 2018, 182, 805–817. [Google Scholar] [CrossRef]
- Frankfurt School UNEP Centre; Bloomberg New Energy Finance (BNEF). Global Trends in Renewable Energy Investment. Frankfurt School-UNEP Centre. 2016. Available online: http://fs-unep-centre.org/sites/default/files/attachments/press_release_gtr_2016_in_english.pdf (accessed on 27 October 2017).
- European Environment Agency (EEA). Renewable Energy in Europe 2016—Recent Growth and Knock-On Effects. Available online: https://www.eea.europa.eu/publications/renewable-energy-in-europe-2016 (accessed on 14 September 2017).
- Cîrstea, S.D.; Moldovan-Teselios, C.; Cîrstea, A.; Turcu, A.C.; Darab, C.P. Evaluating Renewable Energy Sustainability by Composite Index. Sustainability 2018, 10, 811. [Google Scholar] [CrossRef]
- Kula, F.; Aslan, A.; Ozturk, I. Is per capita electricity consumption stationary? Time series evidence from OECD countries. Renew. Sustain. Energy Rev. 2012, 16, 501–503. [Google Scholar]
- Armeanu, D.S.; Vintilă, G.; Gherghina, S.C. Does Renewable Energy Drive Sustainable Economic Growth? Multivariate Panel Data Evidence for EU-28 Countries. Energies 2017, 10, 381. [Google Scholar] [CrossRef]
- Amri, F. The relationship amongst energy consumption (renewable and non-renewable), and GDP in Algeria. Renew. Sustain. Energy Rev. 2017, 76, 62–71. [Google Scholar] [CrossRef]
- Fotourehchi, Z. Renewable Energy Consumption and Economic Growth: A Case Study for Developing Countries. Int. J. Energy Econ. Policy 2017, 7, 61–64. [Google Scholar]
- Dedeoglu, D.; Piskin, A. A dynamic panel study of energy consumption-economic growth nexus: Evidence from the former Soviet Union countries. Int. Sci. J. 2014, 38, 75–106. [Google Scholar]
- Bhattacharya, M.; Paramati, S.; Ozturk, I.; Bhattacharya, S. The effect of renewable energy consumption on economic growth: Evidence from top 38 countries. Appl. Energy 2016, 162, 733–741. [Google Scholar] [CrossRef]
- Alper, A.; Oguz, O. The role of renewable energy consumption in economic growth: Evidence from asymmetric causality. Renew. Sustain. Energy Rev. 2016, 60, 953–959. [Google Scholar] [CrossRef]
- Salahuddin, M.; Gow, J.; Ozturk, I. Is the long-run relationship between economic growth, electricity consumption, carbon dioxide emissions and financial development in Gulf Cooperation Council Countries robust? Renew. Sustain. Energy Rev. 2015, 51, 317–326. [Google Scholar] [CrossRef]
- Jin, L.; Duan, K.; Tang, X. What Is the Relationship between Technological Innovation and Energy Consumption? Empirical Analysis Based on Provincial Panel Data from China. Sustainability 2018, 10, 145. [Google Scholar] [CrossRef]
- Zhao, Y.; Wang, S. The Relationship between Urbanization, Economic Growth and Energy Consumption in China: An Econometric Perspective Analysis. Sustainability 2015, 7, 5609–5627. [Google Scholar] [CrossRef]
- Liddle, B.; Lung, S. Revisiting Energy Consumption and GDP Causality: Importance of a Priori Hypothesis Testing, Disaggregated Data, and Heterogeneous Panels. Appl. Energy 2015, 142, 44–55. [Google Scholar] [CrossRef]
- Cucchiella, F.; D’Adamo, I.; Gastaldi, M. Future Trajectories of Renewable Energy Consumption in the European Union. Resources 2018, 7, 10. [Google Scholar] [CrossRef]
- Rafindadi, A.A.; Ozturk, I. Effects of financial development, economic growth and trade on electricity consumption: Evidence from post-Fukushima Japan. Renew. Sustain. Energy Rev. 2016, 54, 1073–1084. [Google Scholar] [CrossRef]
- Zeng, B.; Zhou, M.; Zhang, J. Forecasting the Energy Consumption of China’s Manufacturing Using a Homologous Grey Prediction Model. Sustainability 2017, 9, 1975. [Google Scholar] [CrossRef]
- Tzeng, G.H.; Shiau, T.A.; Lin, C.Y. Application of multicriteria decision making to the evaluation of new energy system development in Taiwan. Energy 1992, 17, 983–992. [Google Scholar]
- Salim, R.A.; Shafiei, S. Urbanization and renewable and non-renewable energy consumption in OECD countries: An empirical analysis. Econ. Model. 2014, 38, 581–591. [Google Scholar] [CrossRef]
- Anwar, A.; Arshed, N.; Kousar, N. Renewable Energy Consumption and Economic Growth in Member of OIC Countries. Eur. Online J. Nat. Soc. Sci. 2017, 6, 111–129. [Google Scholar]
- Liu, Y. Exploring the relationship between urbanization and energy consumption in China using ARDL (autoregressive distributed lag) and FDM (factor decomposition model). Energy 2009, 34, 1846–1854. [Google Scholar] [CrossRef]
- Sadorsky, P. Renewable energy consumption and income in emerging economies. Energy Policy 2009, 37, 4021–4028. [Google Scholar] [CrossRef]
- Fumon, N.; Biswas, M.A.R. Regression analysis for prediction of residential energy consumption. Renew. Sustain. Energy Rev. 2015, 47, 332–343. [Google Scholar] [CrossRef]
- Rezitis, A.N.; Ahammad, S.M. The relationship between energy consumption and economic growth in South and Southeast Asian countries: A panel vector autoregression approach and causality analysis. Int. J. Energy Econ. Policy 2015, 5, 704–715. [Google Scholar]
- Pappas, S.S.; Ekonomou, L.; Karamousantas, D.C.; Chatzarakis, G.; Katsikas, S.; Liatsis, P. Electricity demand loads modeling using AutoRegressive Moving Average (ARMA) models. Energy 2008, 33, 1353–1360. [Google Scholar] [CrossRef]
- Barak, S.; Sadegh, S. Forecasting energy consumption using ensemble ARIMA–ANFIS hybrid algorithm. Electr. Power Energy Syst. 2016, 82, 92–104. [Google Scholar] [CrossRef]
- Hsu, D. Identifying key variables and interactions in statistical models of building energy consumption using regularization. Energy 2015, 83, 144–155. [Google Scholar] [CrossRef]
- Ardakani, F.J.; Ardehali, M.M. Long-term electrical energy consumption forecasting for developing and developed economies based on different optimized models and historical data types. Energy 2014, 65, 452–461. [Google Scholar] [CrossRef]
- Wang, Y.; Wang, J.; Zhao, G.; Dong, Y. Application of residual modification approach in seasonal ARIMA for electricity demand forecasting: A case study of China. Energy Policy 2012, 48, 284–294. [Google Scholar] [CrossRef]
- Gunter, U.; Onder, I. Forecasting international city tourism demand for Paris: Accuracy of uni- and multivariate models employing monthly data. Tour. Manag. 2015, 46, 123–135. [Google Scholar] [CrossRef]
- Yuan, C.; Liu, S.; Fang, Z. Comparison of China’s primary energy consumption forecasting by using ARIMA (the autoregressive integrated moving average) model and GM(1,1) model. Energy 2016, 100, 384–390. [Google Scholar] [CrossRef]
- Tsai, S.B.; Xue, Y.; Zang, J.; Chen, Q.; Liu, Y.; Zhou, J.; Dong, W. Models for forecasting growth trends in renewable energy. Renew. Sustain. Energy Rev. 2017, 77, 1169–1178. [Google Scholar] [CrossRef]
- Sen, P.; Roy, M.; Pal, P. Application of ARIMA for forecasting energy consumption and GHG emission: A case study of an Indian pig iron manufacturing organization. Energy 2016, 116, 1031–1038. [Google Scholar] [CrossRef]
- Suganthi, L.; Samuel, A.A. Energy models for demand forecasting—A review. Renew. Sustain. Energy Rev. 2012, 16, 1223–1240. [Google Scholar] [CrossRef]
- Li, S.; Li, R. Comparison of forecasting energy consumption in Shandong, China Using the ARIMA model, GM model, and ARIMA-GM model. Sustainability 2017, 9, 1181. [Google Scholar] [CrossRef]
- Ozturk, S.; Ozturk, F. Forecasting Energy Consumption of Turkey by Arima Model. J. Asian Sci. Res. 2018, 8, 52–60. [Google Scholar] [CrossRef]
- Abeysinghe, T.; Balasooriya, U.; Tsui, A. Small-sample forecasting: Regression or ARIMA models? J. Quant. Econ. New Ser. 2003, 1, 103–113. [Google Scholar]
- Erdogdu, E. Electricity demand analysis using cointegration and ARIMA modeling: A case study of Turkey. Energy Policy 2007, 35, 1129–1146. [Google Scholar] [CrossRef] [Green Version]
- Ediger, V.S.; Akar, S. ARIMA forecasting of primary energy demand by fuel in Turkey. Energy Policy 2007, 35, 1701–1708. [Google Scholar] [CrossRef]
- Wang, T. Forecast of Economic Growth by Time Series and Scenario Planning Method—A Case Study of Shenzhen. Mod. Econ. 2016, 7, 212–222. [Google Scholar] [CrossRef]
- Eurostat. Statistics-Explained, Energy Production and Imports. Available online: http://ec.europa.eu/eurostat/statistics-explained/index.php/Energy_production_and_imports (accessed on 12 September 2017).
- Eviews. EViews 9 User’s Guide I, II. IHS Global Inc. Available online: www.eviews.com (accessed on 19 September 2017).
Figure 1.
Final energy consumption from renewable resources and final energy consumption in EU (in TOE).
Figure 1.
Final energy consumption from renewable resources and final energy consumption in EU (in TOE).

Figure 2.
The evolution of percentage ratio in EU, for the 1995–2016 period.

Figure 3.
Estimation of ratio by the linear regression method.

Figure 4.
Estimation of ratio by the quadratic regression method.

Figure 5.
Estimation of ratio by the linear regression model, with auxiliary term D.

Figure 6.
Estimation of ratio by the quadratic regression model with auxiliary term D.

Figure 7.
Estimation and prediction of ratio by linear models (1) (in green full line) and (3) (in green dash line).
Figure 7.
Estimation and prediction of ratio by linear models (1) (in green full line) and (3) (in green dash line).

Figure 8.
Estimation and prediction of ratio by quadratic models (7) (in green full line) and (8) (in green dash line).
Figure 8.
Estimation and prediction of ratio by quadratic models (7) (in green full line) and (8) (in green dash line).

Figure 9.
Final energy consumption in the 4 groups of countries (in TOE).

Figure 10.
Final energy consumption from renewable resources in the 4 groups of countries (in TOE).

Figure 11.
The evolution of percentage ratio in the 4 groups, for the 1995–2016 period.


Table 1.
Descriptive statistics: FEC, FECRE (in MTOE), and ratio for the 1995–2016 period.
| Variable | Mean | Std. Dev. | Kurtosis | Jarque–Bera | Probability |
|---|---|---|---|---|---|
| FEC | 1,135,864 | 37,891.84 | 2.027124 | 0.867829 | 0.647968 |
| FECRE | 64,840.06 | 15,957.81 | 1.390218 | 2.524127 | 0.283069 |
| Ratio | 5.728331 | 1.499647 | 1.451634 | 2.699234 | 0.259340 |
Table 2.
Estimations of Equations (1) and (2) for EU data.
| Model | Variable | Coefficient | Std. Error | t-Statistic | Prob. |
|---|---|---|---|---|---|
| (1) | C | 3.185195 | 0.195486 | 16.29373 | 0.0000 |
| t | 0.221142 | 0.014884 | 14.85767 | 0.0000 | |
| (2) | C | 3.919397 | 0.234588 | 16.70754 | 0.0000 |
| t | 0.037592 | 0.046986 | 0.800052 | 0.4336 | |
| t2 | 0.007980 | 0.001984 | 4.022879 | 0.0007 |
Table 3.
Estimations of Equations (3) and (4) for EU data.
| Model | Variable | Coefficient | Std. Error | t-Statistic | Prob. |
|---|---|---|---|---|---|
| (3) | C | 3.529398 | 0.187586 | 18.81485 | 0.0000 |
| t | 0.165022 | 0.020403 | 8.088284 | 0.0000 | |
| D | 0.946559 | 0.277905 | 3.406049 | 0.0030 | |
| (4) | C | 3.876768 | 0.230553 | 16.81511 | 0.0000 |
| t | 0.063077 | 0.049184 | 1.282453 | 0.2160 | |
| t2 | 0.005664 | 0.002531 | 2.237805 | 0.0381 | |
| D | 0.468926 | 0.330657 | 1.418163 | 0.1732 |
Table 4.
Regression statistical coefficients for models (1), (2), (3), and (4) for EU data.
| Model | R² | SER | SSR | AIC | Schwarz Criterion |
|---|---|---|---|---|---|
| Equation (1) | 0.917 | 0.443 | 3.923 | 1.296 | 1.395 |
| Equation (2) | 0.955 | 0.334 | 2.119 | 0.770 | 0.919 |
| Equation (3) | 0.948 | 0.358 | 2.436 | 0.910 | 1.059 |
| Equation (4) | 0.960 | 0.325 | 1.906 | 0.755 | 0.954 |
Table 5.
Statistical descriptors for the error series for models (1), (2), (3), and (4) for EU data.
Table 5.
Statistical descriptors for the error series for models (1), (2), (3), and (4) for EU data.
| Model | St. Dev. | Skewness | Kurtosis | JB | Prob. |
|---|---|---|---|---|---|
| Equation (1) | 0.432 | −0.263 | 1.805 | 1.562 | 0.458 |
| Equation (2) | 0.279 | 0.312 | 2.435 | 0.620 | 0.733 |
| Equation (3) | 0.341 | 0.572 | 3.369 | 1.326 | 0.515 |
| Equation (4) | 0.301 | 0.592 | 3.402 | 1.437 | 0.487 |
Table 6.
Augmented Dickey–Fuller (ADF) unit root test.
| t-Statistic | Prob. | |
|---|---|---|
| Level | 0.665294 | 0.9881 |
| First difference | −3.290096 | 0.0293 |
Table 7.
Estimation using the autoregressive model (5).
| Model | Variable | Coefficient | Std. Error | t-Statistic | Prob. |
|---|---|---|---|---|---|
| (5) | C | 6.004268 | 1.756389 | 3.4185 | 0.0031 |
| AR(1) | 0.982216 | 0.081471 | 12.0560 | 0.0000 | |
| MA(1) | 0.405636 | 0.403229 | 1.0060 | 0.3278 | |
| SIGMASQ | 0.06059 | 0.015793 | 3.836648 | 0.0012 |
Table 8.
Statistical coefficients for the autoregressive model (5).
| Model | R² | SER | SSR | AIC | Schwarz Criterion |
|---|---|---|---|---|---|
| ARIMA | 0.972 | 0.272 | 1.333 | 0.587 | 0.787 |
Table 9.
Prediction of percentage share of FECRE in FEC for the EU until 2020.
| Model | 2017 | 2018 | 2019 | 2020 |
|---|---|---|---|---|
| Equation (1) | 8.271 | 8.493 | 8.714 | 8.935 |
| Equation (2) | 9.005 | 9.418 | 9.847 | 10.291 |
| Equation (3) | 8.271 | 8.436 | 8.601 | 8.766 |
| Equation (4) | 8.793 | 9.122 | 9.463 | 9.815 |
| Equation (5) | 8.767 | 9.258 | 9.797 | 10.371 |
Table 10.
Average share of national FEC in FEC EU, 1995–2016.
| Countries | Mean % | Countries | Mean % |
|---|---|---|---|
| Germany (DE) | 19.2515 | Portugal (PT) | 1.5096 |
| France (FR) | 13.4344 | Hungary (HU) | 1.5025 |
| United Kingdom (UK) | 12.7409 | Denmark (DK) | 1.3141 |
| Italy (IT) | 10.9596 | Slovakia (SK) | 0.9754 |
| Spain (ES) | 7.3309 | Ireland (IE) | 0.9688 |
| Poland (PL) | 5.4029 | Bulgaria (BG) | 0.8563 |
| Netherlands (NL) | 4.6032 | Croatia (HR) | 0.5784 |
| Belgium (BE) | 3.2027 | Slovenia (SI) | 0.4156 |
| Sweden (SE) | 2.9579 | Lithuania (LT) | 0.4059 |
| Austria (AT) | 2.2830 | Luxembourg (LU) | 0.3431 |
| Czech Republic (CZ) | 2.2383 | Latvia (LV) | 0.3387 |
| Finland (FI) | 2.1840 | Estonia (EE) | 0.2461 |
| Romania (RO) | 2.1218 | Cyprus (CY) | 0.1521 |
| Greece (EL) | 1.6402 | Malta (MT) | 0.0418 |
Table 11.
Average share of national FECRE in FEC (ratio), 1995–2016.
| Countries | Mean % | Countries | Mean % |
|---|---|---|---|
| DE | 4.03 | PT | 14.25 |
| FR | 6.62 | HU | 8.02 |
| UK | 1.18 | DK | 6.59 |
| IT | 4.09 | SK | 3.07 |
| ES | 5.17 | IE | 1.77 |
| PL | 7.08 | BG | 7.80 |
| NL | 1.51 | HR | 17.81 |
| BE | 2.53 | SI | 9.70 |
| SE | 16.02 | LT | 14.36 |
| AT | 11.42 | LU | 1.48 |
| CZ | 7.20 | LV | 24.78 |
| FI | 18.74 | EE | 16.65 |
| RO | 13.28 | CY | 3.95 |
| EL | 6.31 | MT | 0.58 |
Table 12.
Average ratio on the four groups for the period 1995–2016.
| Group 1 | Group 2 | Group 3 | Group 4 | EU | |
|---|---|---|---|---|---|
| Mean | 4.0196 | 4.4224 | 11.8799 | 8.4224 | 5.7283 |
Table 13.
Estimation of Equation (6).
| Group | Coefficient | R² | SER | SSR | AIC | Schwarz Criterion | |
|---|---|---|---|---|---|---|---|
| C | t | ||||||
| 1 | 1.465 | 0.222 | 0.929 | 0.408 | 3.336 | 1.133 | 1.233 |
| 2 | 2.719 | 0.148 | 0.813 | 0.473 | 4.479 | 1.428 | 1.527 |
| 3 | 8.532 | 0.291 | 0.844 | 0.831 | 13.816 | 2.555 | 2.654 |
| 4 | 5.854 | 0.223 | 0.921 | 0.435 | 3.781 | 1.259 | 1.358 |
Table 14.
Estimation of Equation (7).
| Group | Coefficient | R² | SER | SSR | AIC | Schwarz Criterion | ||
|---|---|---|---|---|---|---|---|---|
| C | t | t2 | ||||||
| 1 | 1.983 | 0.093 | 0.006 | 0.95 | 0.36 | 2.44 | 0.91 | 1.06 |
| 2 | 3.545 | −0.058 | 0.009 | 0.91 | 0.34 | 2.20 | 0.81 | 0.96 |
| 3 | 10.029 | −0.083 | 0.016 | 0.93 | 0.58 | 6.31 | 1.86 | 2.01 |
| 4 | 6.095 | 0.163 | 0.003 | 0.93 | 0.43 | 3.59 | 1.30 | 1.45 |
Table 15.
Estimation of Equation (8).
| Group | Coefficient | R² | SER | SSR | AIC | Schwarz Criterion | ||
|---|---|---|---|---|---|---|---|---|
| C | t | D | ||||||
| 1 | 1.654 | 0.191 | 0.519 | 0.939 | 0.39 | 2.89 | 1.080 | 1.229 |
| 2 | 3.207 | 0.069 | 1.341 | 0.937 | 0.28 | 1.49 | 0.419 | 0.568 |
| 3 | 9.250 | 0.174 | 1.972 | 0.917 | 0.62 | 7.36 | 2.016 | 2.165 |
| 4 | 6.167 | 0.172 | 0.861 | 0.947 | 0.37 | 2.55 | 0.956 | 1.104 |
Table 16.
Prediction of percentage ratio of FEC in FECRE for Groups 1, 2, 3, and 4 of EU, horizon 2020.
Table 16.
Prediction of percentage ratio of FEC in FECRE for Groups 1, 2, 3, and 4 of EU, horizon 2020.
| Group | Linear Model (6) | Linear Perturbed Model (8) | Quadratic Model (7) |
|---|---|---|---|
| 1 | 7.237 | 7.139 | 8.457 |
| 2 | 6.567 | 6.342 | 8.121 |
| 3 | 16.098 | 15.746 | 18.687 |
| 4 | 11.652 | 11.500 | 12.361 |
© 2018 by the authors. Licensee MDPI, Basel, Switzerland. This article is an open access article distributed under the terms and conditions of the Creative Commons Attribution (CC BY) license (http://creativecommons.org/licenses/by/4.0/).
Share and Cite
MDPI and ACS Style
Mehedintu, A.; Sterpu, M.; Soava, G. Estimation and Forecasts for the Share of Renewable Energy Consumption in Final Energy Consumption by 2020 in the European Union. Sustainability 2018, 10, 1515. https://doi.org/10.3390/su10051515
AMA Style
Mehedintu A, Sterpu M, Soava G. Estimation and Forecasts for the Share of Renewable Energy Consumption in Final Energy Consumption by 2020 in the European Union. Sustainability. 2018; 10(5):1515. https://doi.org/10.3390/su10051515
Chicago/Turabian StyleMehedintu, Anca, Mihaela Sterpu, and Georgeta Soava. 2018. "Estimation and Forecasts for the Share of Renewable Energy Consumption in Final Energy Consumption by 2020 in the European Union" Sustainability 10, no. 5: 1515. https://doi.org/10.3390/su10051515
Note that from the first issue of 2016, this journal uses article numbers instead of page numbers. See further details here.