Phosphorus Processing—Potentials for Higher Efficiency


1
Proman Management GmbH, Weingartenstrasse 92, 2214 Auersthal, Austria
2
Kompetenzzentrum Wasser Berlin gGmbH, Cicerostrasse 24, 10709 Berlin, Germany
*
Author to whom correspondence should be addressed.
Sustainability 2018, 10(5), 1482; https://doi.org/10.3390/su10051482
Submission received: 6 April 2018
/
Revised: 27 April 2018
/
Accepted: 2 May 2018
/
Published: 8 May 2018
(This article belongs to the Special Issue Phosphorus Circular Economy: Closing Loops through Sustainable Innovation)
Abstract
:In the aftermath of the adoption of the Sustainable Development Goals (SDGs) and the Paris Agreement (COP21) by virtually all United Nations, producing more with less is imperative. In this context, phosphorus processing, despite its high efficiency compared to other steps in the value chain, needs to be revisited by science and industry. During processing, phosphorus is lost to phosphogypsum, disposed of in stacks globally piling up to 3–4 billion tons and growing by about 200 million tons per year, or directly discharged to the sea. Eutrophication, acidification, and long-term pollution are the environmental impacts of both practices. Economic and regulatory framework conditions determine whether the industry continues wasting phosphorus, pursues efficiency improvements or stops operations altogether. While reviewing current industrial practice and potentials for increasing processing efficiency with lower impact, the article addresses potentially conflicting goals of low energy and material use as well as Life Cycle Assessment (LCA) as a tool for evaluating the relative impacts of improvement strategies. Finally, options by which corporations could pro-actively and credibly demonstrate phosphorus stewardship as well as options by which policy makers could enforce improvement without impairing business locations are discussed.
1. Introduction
The scientific committee of the present publication has invited us to present and publish our reflections about phosphate processing within the societal, economic and environmental framework to which all member states of the United Nations are now committed. In this context, we refer to the 17 Sustainable Development Goals of “Transforming our world: the 2030 Agenda for Sustainable Development adopted by the UN General Assembly (193 nations) on 25 September 2015” and The Paris Agreement (COP21) adopted by 195 nations at the 21st Conference of the Parties of the UNFCCC on 12 December 2015. The latter has entered into force on 4 November 2016, thirty days after the date on which at least 55 Parties to the Convention accounting in total for at least an estimated 55% of the total global greenhouse gas emissions have ratified the agreement.
In response to the prevailing economic model held responsible for the inefficient resource use, the European Commission has adopted a Circular Economy Package, also in 2015. The Circular Economy aims at redesigning, reusing and recycling resources, materials and products to keep them in the loop and avoid waste. In contrast to the UN-based initiatives, it directly addresses the economic model and may serve as a tool for transition towards sustainable economic principles.
Consequently, humanity, for the first time in history, has a binding global framework with clear targets underlying societal and economic policies and activities. This normative framework is supposed to protect our planet from nothing less than the risk of catastrophic consequences induced by the ongoing overuse of natural resources and excessive emission of greenhouse gases. However, it is apparently in conflict with—at least the perceived—short-term economic interest of businesses and governments as demonstrated by the Trump administration in the United States. Nonetheless, some industry stakeholders have started to become receptive to the opportunities and potentials unveiled by the present paper and inclined to align its processing activities accordingly.
2. Societal, Environmental and Economic Framework
2.1. Resource Use and Decoupling
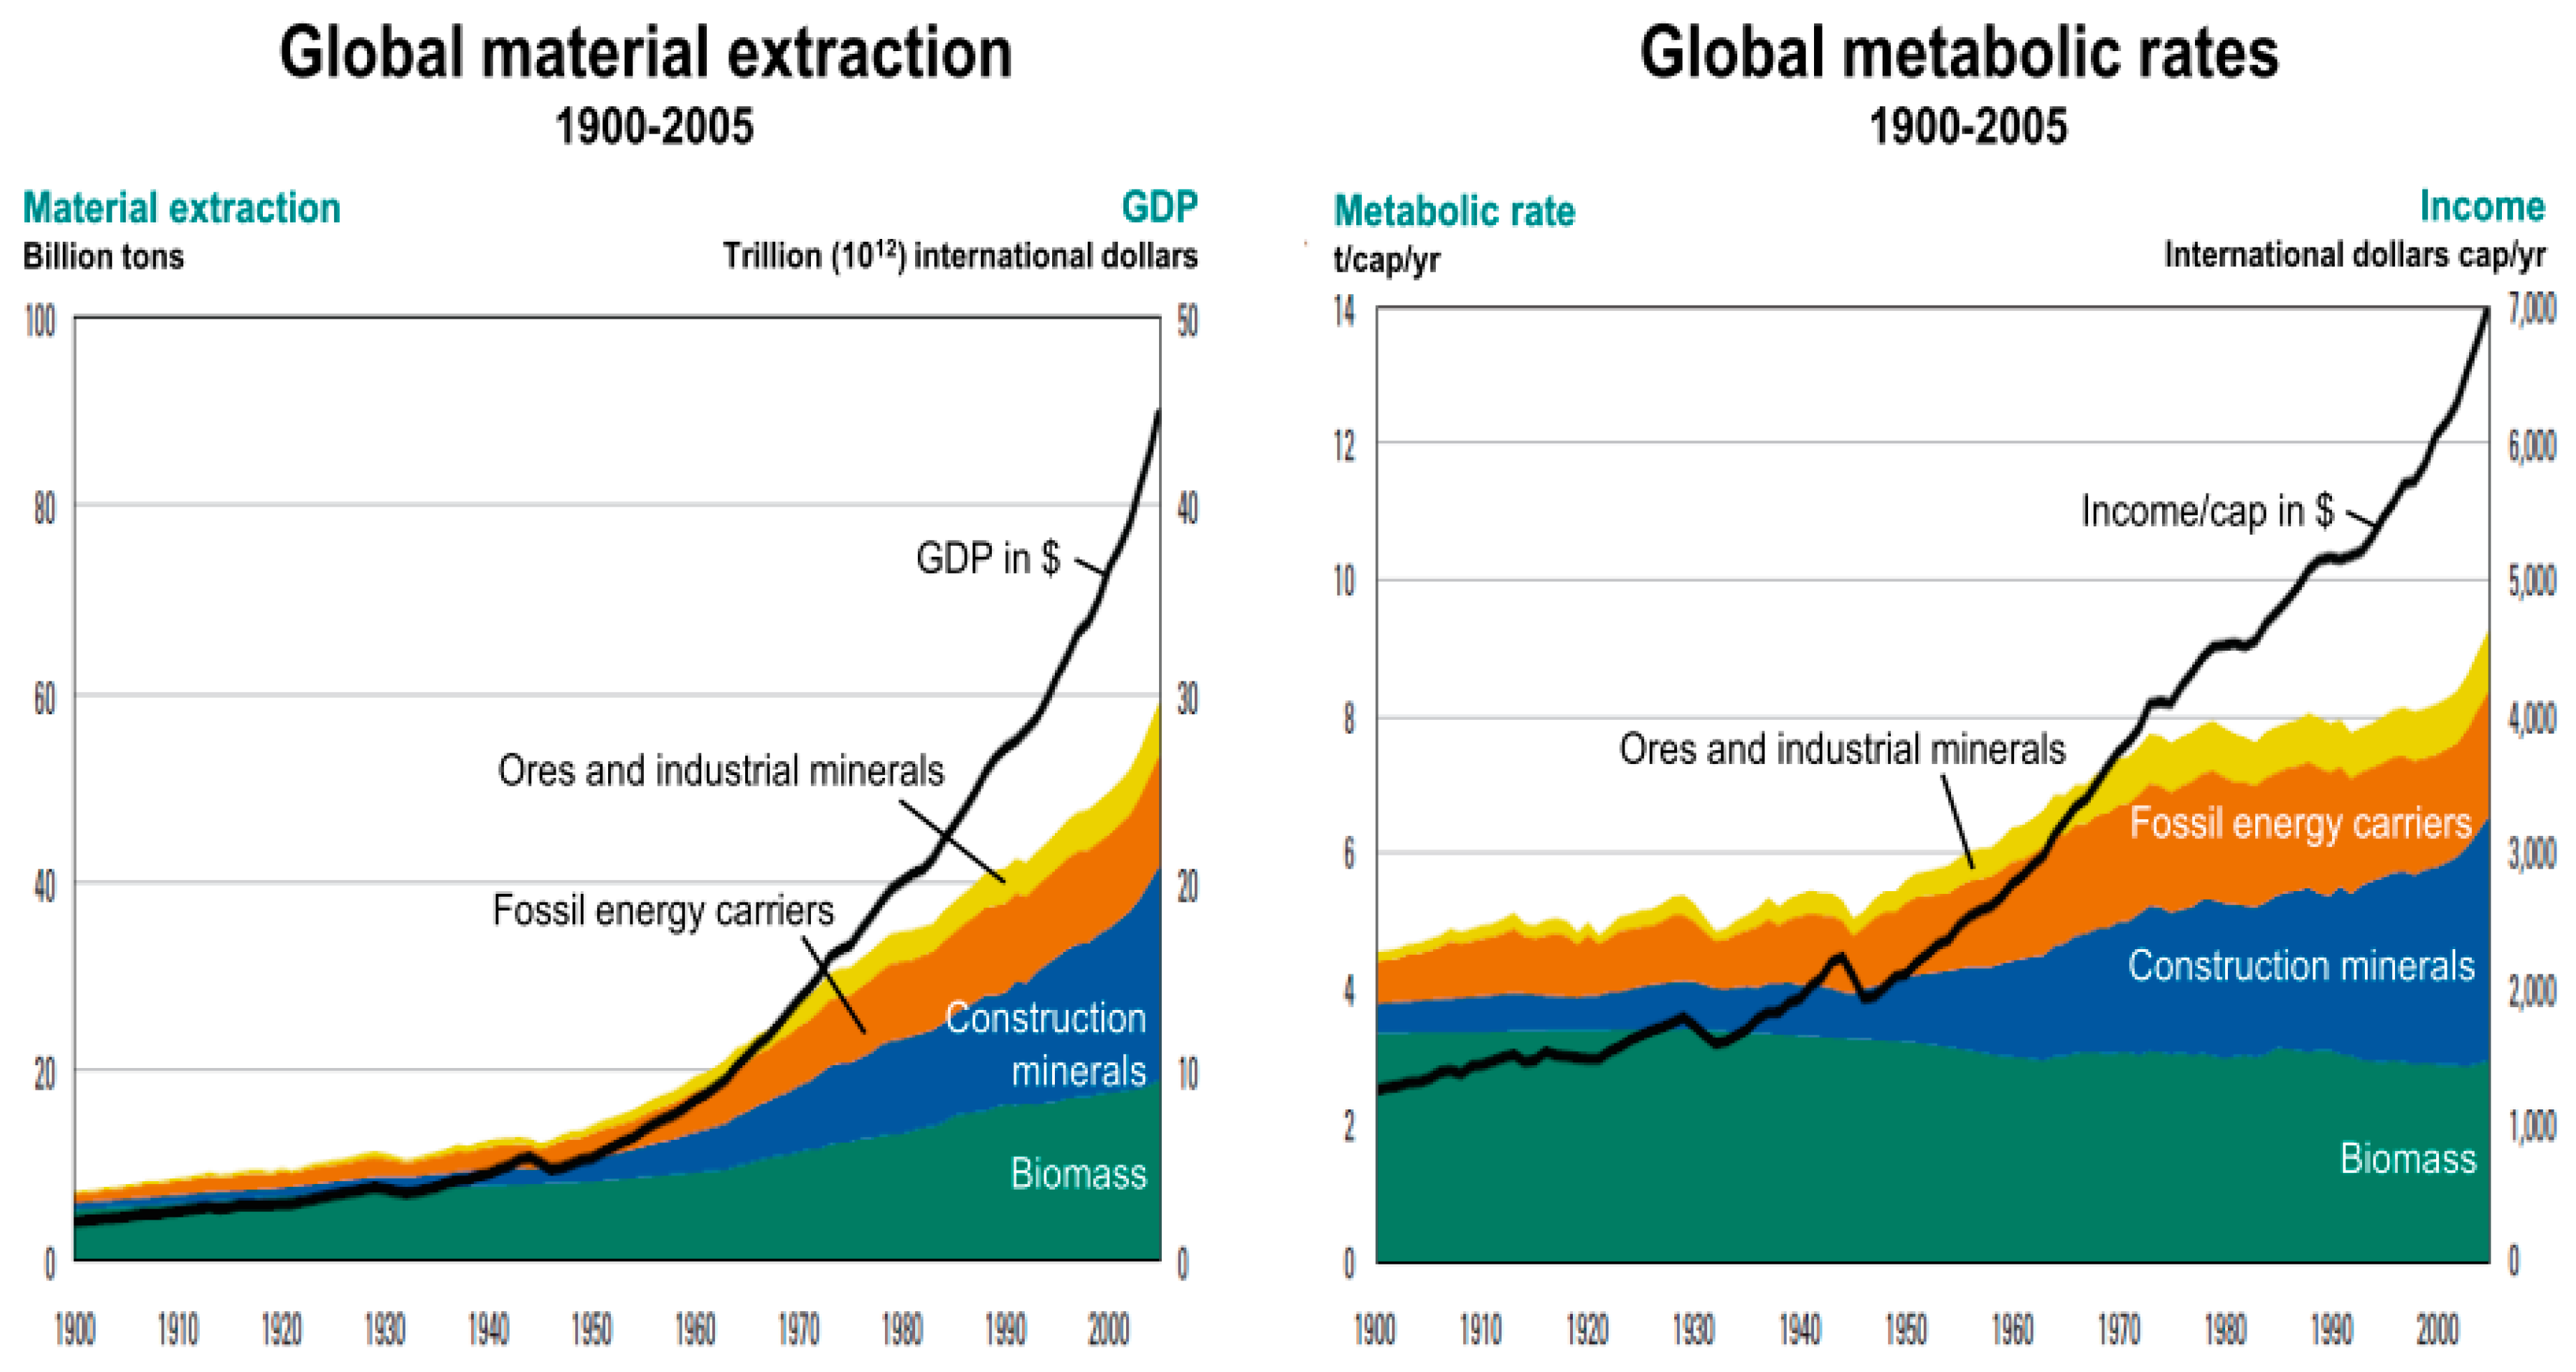
Steffen et al. [1] saw the timespan from 1901 to 2000 as the century of great acceleration: the global population grew 3.7-fold, total material extraction 8-fold, use of fossil fuels 12-fold, greenhouse gas (GHG) emissions 13-fold, extraction of ores and minerals 27-fold and the global economy at constant prices 23-fold. Hence, per capita GHG emissions increased by a factor 3.5 and ore and mineral extraction by a factor 7.3, outpacing the concurrent economic growth by 17%. The figures reveal that material extraction outpaces population growth by a factor two, indicating that per capita resource use has doubled, from 4.6 to 9.2 tons.
Since the global economy during the 20th century expanded by a factor 23 (at constant prices), the per capita income increased six-fold. Hence, the global economy grew by a much larger pace than resource use and population, showing already a spontaneous decoupling of resource use from population growth and per capita income without targeted policy measures [2].
Resource decoupling means reducing the rate of use of (primary) resources per unit of economic activity, commonly expressed as GDP. What we can call increasing resource use efficiency or “dematerialization” is based on using less material, energy, water and land resources for the same economic output. From 1970, per capita resource extraction was stagnating while per capita income continued to rise until 2000, as nicely shown in Figure 1 by a comparison of global material extraction and global metabolic rates over time [2]. However, from the beginning of the 21st century, resource use efficiency has declined, i.e., resource use per capita has been on the rise again. While resource use in Western industrialized countries continued stagnating or declining, resource use in Asia has risen and outpaced global GDP growth. The accelerated pace of extraction and consumption of resources goes hand in hand with the increase in global trade. Figures suggest that free trade and globalization has induced production to shift from countries with high resource efficiency to countries with lower resource efficiency.
Population is still growing and estimated to reach 9 billion people in 2050, living in urban agglomerations on a planet with limited resources [3]. In the light of the universal agreements on sustainable development (SDGs) and climate change (COP21), it is evident that we cannot continue with business as usual. Deep and permanent decoupling of resource use from human well-being is a universal requirement to which we are all committed. Engineers need to develop, scientists to assess and investors and operators to implement processes that truly increase resource efficiency and reduce the environmental footprint of our industrial operations. We need to produce more with less! Figure 1 shows historic (1990–2005) unsustainable global ratios between material extraction and GDP, as well as between metabolic rates and income.
2.2. Sustainability
On 11 December 1987, the UN General Assembly defined in a resolution Sustainable Development as Development that meets the needs of the present without compromising the ability of future generations to meet their own needs. It reflected the conclusions of the report “Our Common Future” by the World Commission on Environment and Development, chaired by Gro Harlem Brundtland. The report, commonly known as the Brundtland Report, was the first official UN publication addressing the interdependency of population growth, poverty and environmental degradation. It contains a comprehensive concept of sustainable development and proposes legal principles for environmental protection and sustainable development [4].
At the time when the report was prepared, 30-years ago, the world was facing problems that sound very familiar to us: unilateralism, falling commodity prices and rising inequality. Virtually all the societal, economic and environmental issues we are currently dealing with were addressed in the report and one could conclude that nothing has happened since its first publication. Nevertheless, we have seen periodic progress in terms of resource efficiency (1970–2000) and we have noticed a strong increase in public awareness that—through several multilateral efforts and global—lead to the two milestones recently achieved: The 17 Sustainable Development Goals and the Paris Agreement to limit the global temperature increase by “well below 2° Celsius”.
On 25 September 2015, the UN General Assembly (193 nations) has adopted “Transforming our World: the 2030 Agenda for Sustainable Development”. The 17 Sustainable Development Goals (SDGs) came into force officially on 1 January 2016. SDG1 and SDG2 are eradicating poverty and hunger as this was considered the most important and indispensable requirement for sustainable development. In addition, the SDGs aim at achieving universal health services, quality education, gender equality, clean water and sanitation, clean energy, good jobs and inclusive economic growth, sustainable infrastructure, reduced inequalities, sustainable cities and communities, responsible consumption, protecting the planet, life below water and life on land as well as peace, justice and partnerships for the promotion of the goals. The 17 Sustainable Development Goals are presented in Figure 2.
Finally, on 12 December 2015, 195 governments agreed at the 21st Conference of the Parties (COP21) of The United Nations Framework Convention for Climate Change (UNFCCC) on long-term greenhouse gas emission goals [5]: (1) Keep the increase in global average temperature to “well below” 2 °C above pre-industrial levels. (2) Aim to limit the increase to 1.5 °C (this would significantly reduce risks and impacts of climate change. (3) Aim for global emissions to peak as soon as possible (recognizing that the transition to a low carbon economy will take longer for developing countries) and (4). Undertake rapid reductions thereafter in accordance with the best available science.
On 5 October 2016, the threshold for entry into force of the Paris Agreement was achieved—at least 55 Parties to the Convention accounting in total for at least an estimated 55% of the total global greenhouse gas emissions have deposited their instruments of ratification, acceptance, approval or accession with the Depositary. The Paris Agreement entered into force on 4 November 2016. The first session of the Conference of the Parties serving as the Meeting of the Parties to the Paris Agreement (CMA 1) took place in Marrakech, Morocco during 15–18 November 2016.
The Paris Agreement followed The United Nations Framework Convention on Climate Change (UNFCCC) adopted at the “Rio Earth Summit” in 1992 that entered into force on 21 March 1994 and The Kyoto Protocol, adopted in Kyoto, Japan, on 11 December 1997 and entering into force on 16 February 2005. In contrast to the previous agreements, The Paris Agreement included clearly defined targets and a Working Program [6] requesting each nation to prepare, communicate and maintain successive Nationally Determined Contributions (NDCs) that it intends to achieve. Parties shall pursue domestic mitigation measures, with the aim of achieving the objectives of such contributions. The NDCs submitted so far are not sufficient for meeting the temperature target. However, the agreement also requires a review and update of the national contributions every five years, with a first evaluation in 2023.
2.3. Circular Economy
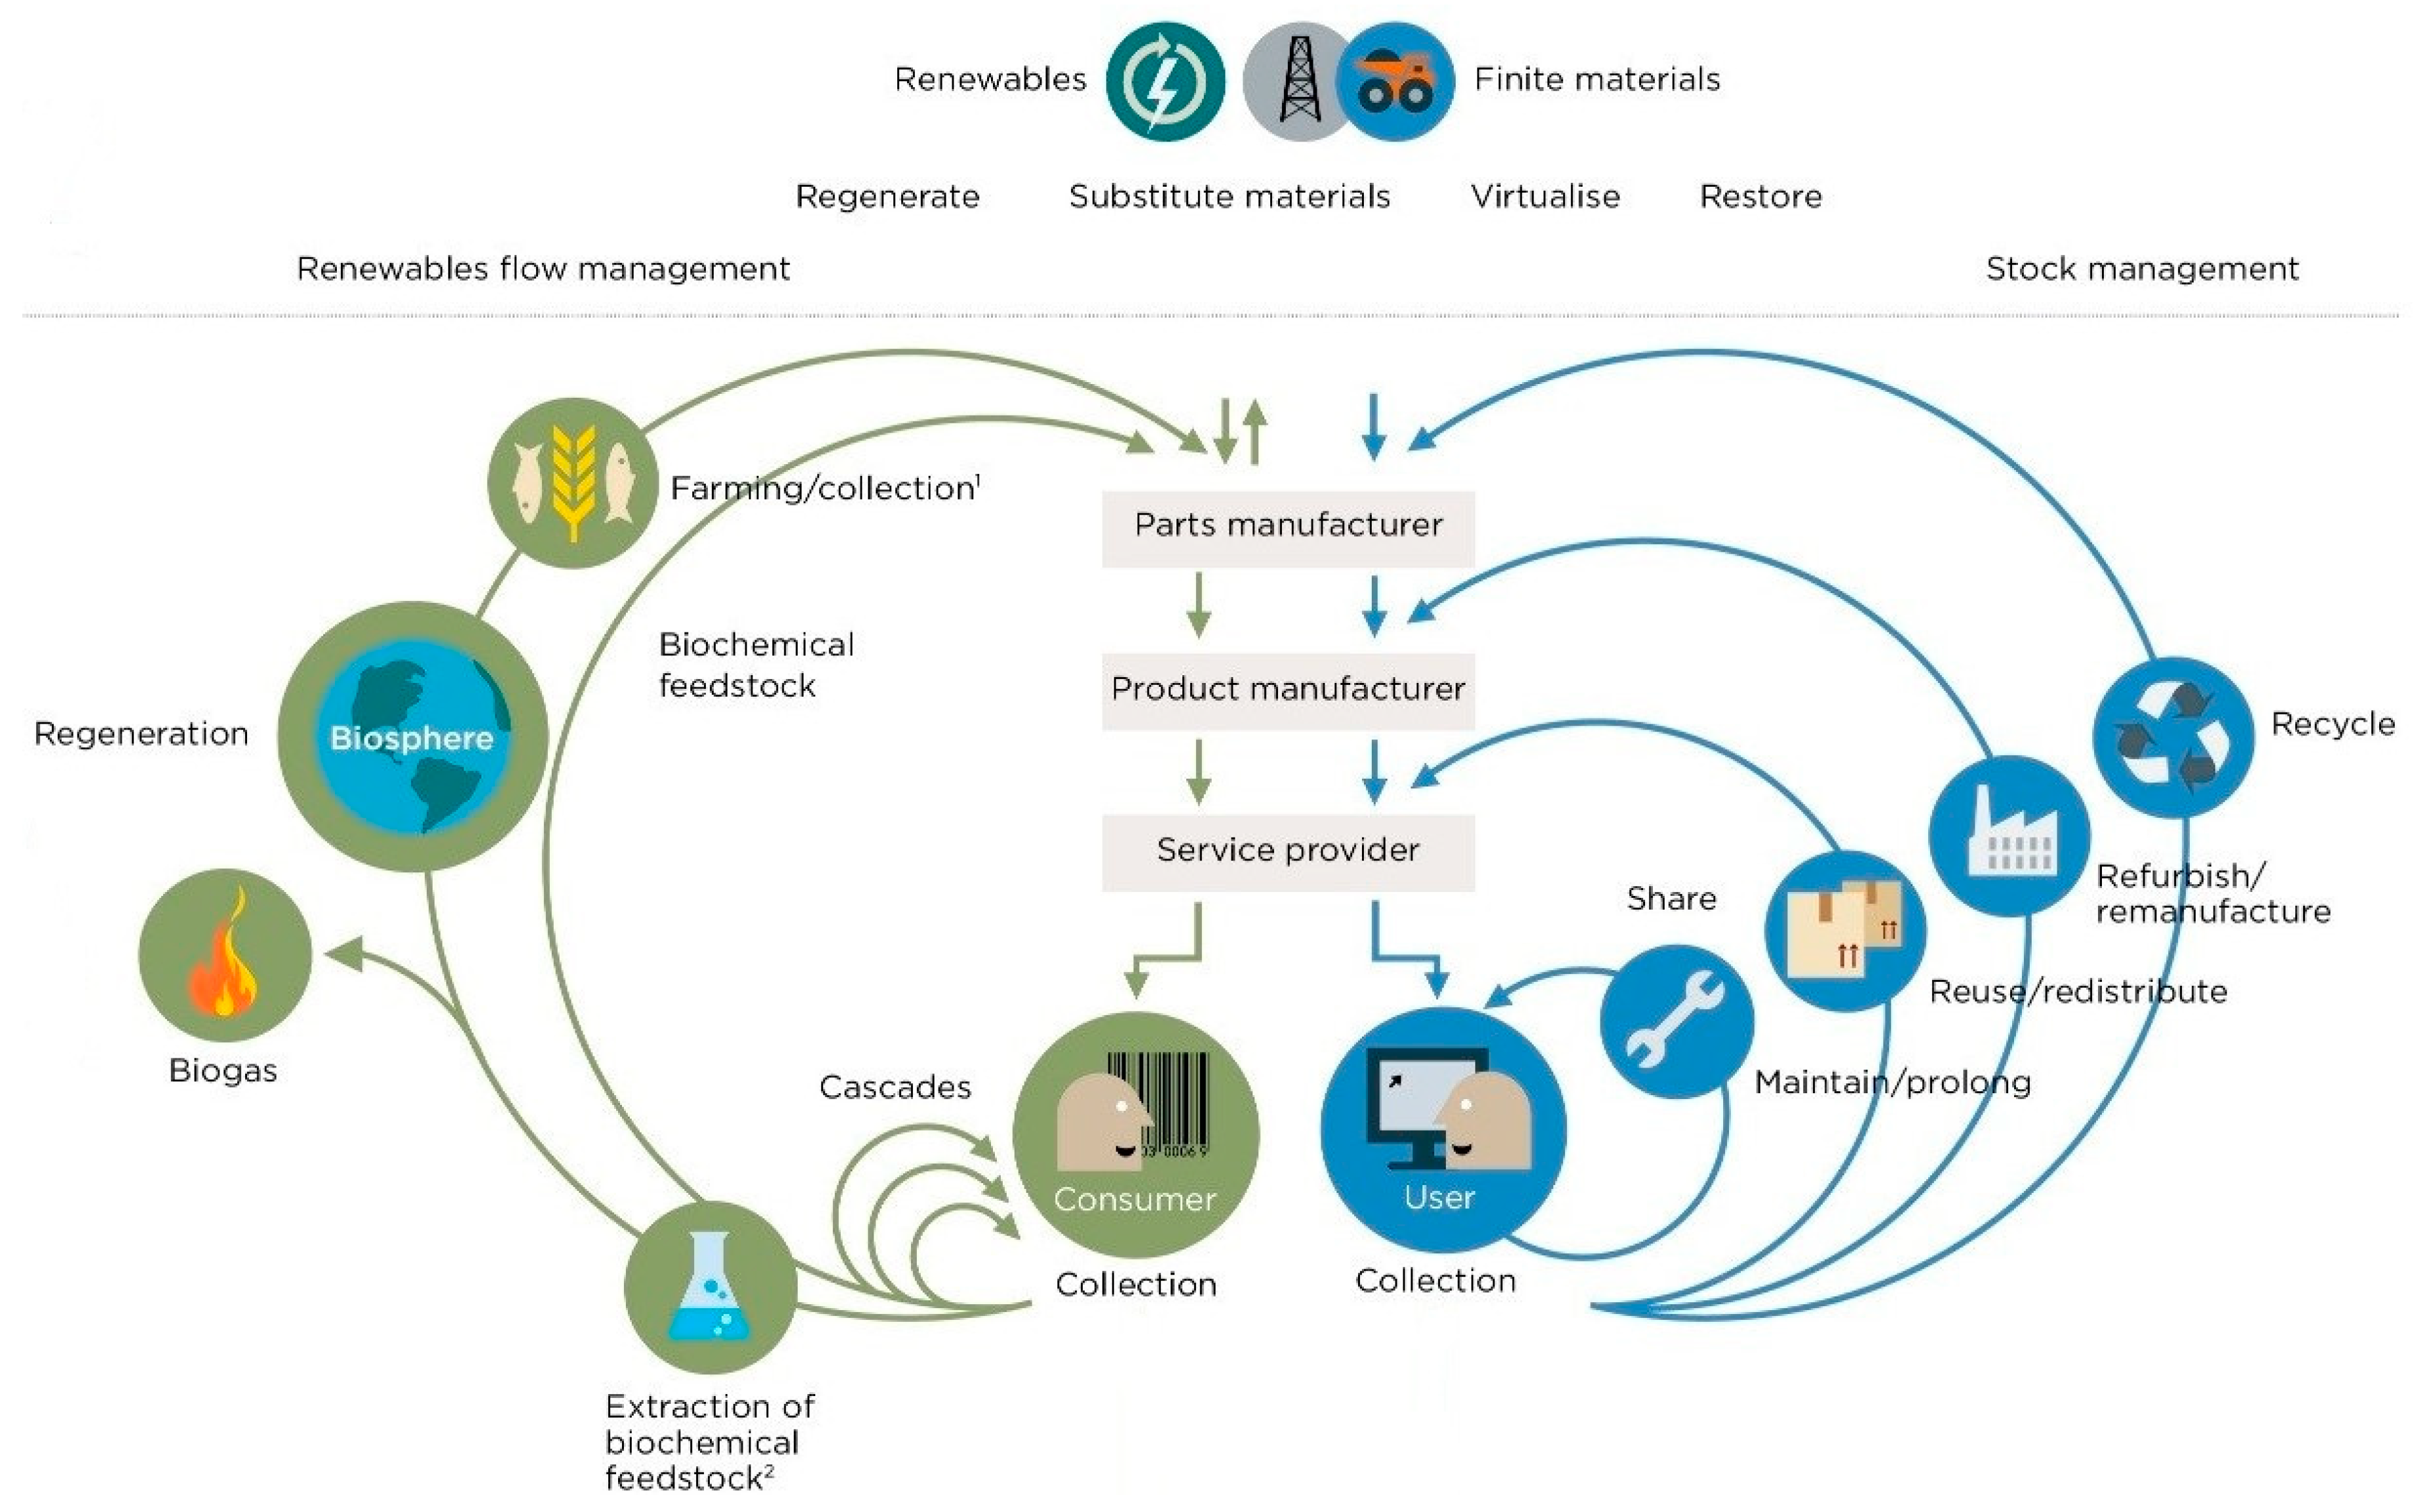
Concurrently with the UN-lead agreements, the European Commission adopted a Circular Economy Package including revised legislative proposals on waste and—responding to the national and regional initiatives for nutrient (phosphorus) recycling—a total recast of the European Fertilizer Regulation. The package largely consists of an EU Action Plan for the Circular Economy covering the economic cycle from extraction, production and consumption to waste management, recovery and recycling of secondary (raw) materials. Its focus is on decoupling, triggering enhanced economic growth by shifting the economic activities from linear to circular flows [7]. The Action Plan includes a roadmap with short-, medium- and long-term targets, addressing production, consumption and waste management. A graphic outline of a Circular Economy is shown in Figure 3.
Apart from the European Commission, the Ellen MacArthur Foundation and McKinsey in cooperation with the Stiftungsfonds für Umweltökonomie und Nachhaltigkeit have investigated the potentials of a transition towards a Circular Economy and have published a few studies, the most prominent being “Growth within: A circular economy vision for a competitive Europe” [8]. In this report, a Circular Economy, defined as an economy providing added value without consuming primary resources and based on the principles of: (1) preservation of natural capital; (2) optimization of resource yields by circulating materials and products; and (3) avoiding externalities, i.e., negative impacts on air, soil and water as well as on animal and human life. The authors claim additional benefits (largely savings) of up to €1.8 trillion per year and additional 7% GDP growth by 2030 in three systems, mobility, food and housing (60% of expenses of EU households and 80% of resource use), if circular principles were applied to the European economy.
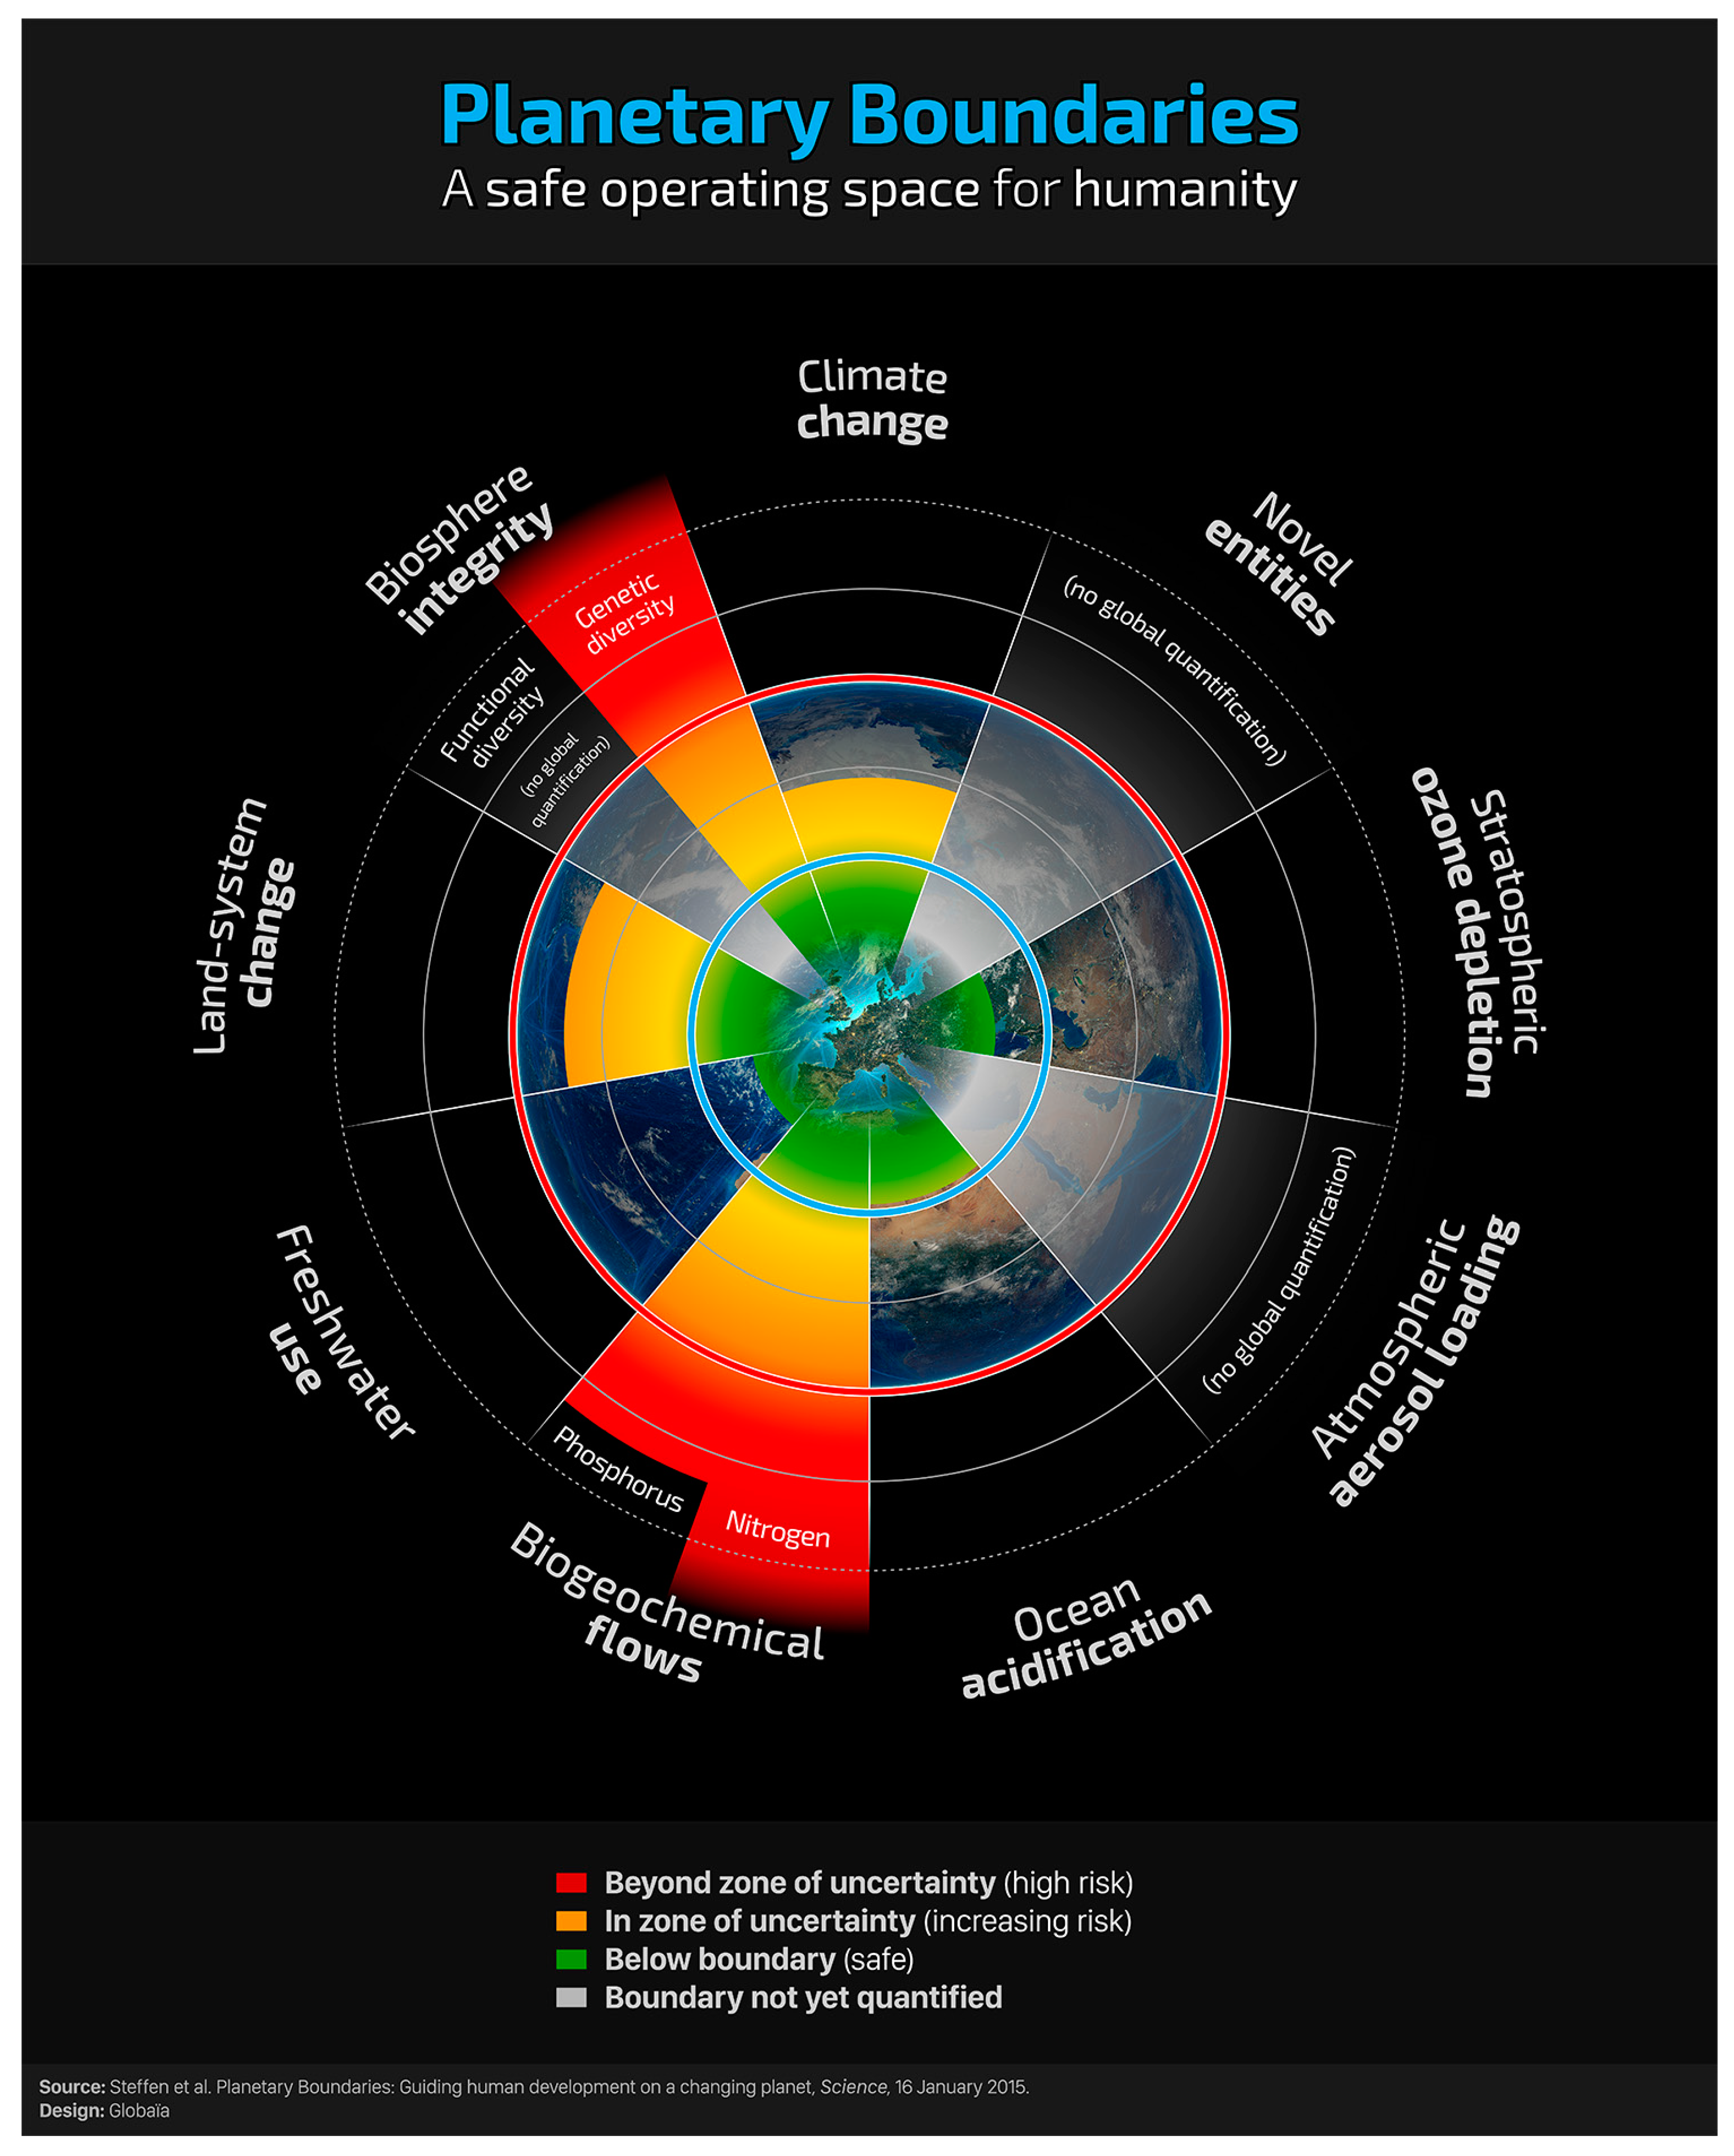
The term “within” again refers to decoupling and more precisely to the research of the Stockholm Resilience Institute that has been culminated in the globally discussed publication of Steffen et al. (2015) about the planetary boundaries [9]. According to Will Steffen and his colleagues, safe operation planetary boundaries have already been transgressed for biosphere integrity (genetic diversity), nitrogen and phosphorus use. Abrupt and catastrophic global environmental change are imminent if we continue with business as usual. In their recent paper “A roadmap for rapid decarbonization”, Johan Rockström et al. [10] emphasized the urgent need for a “Carbon Law” requiring halving greenhouse gas (GHG) emissions every decade from 2020 to 2050. In this scenario, GHG emissions would peak in 2020 and come to about zero by 2050, giving the planet a 75% chance to stay below the 2 °C temperature Paris Agreement target. Halving the GHG emissions needs to be complemented by doubling renewable energy every 5–7 years, a trajectory that we have already started by doubling the use of renewable energies every 5.5 years. Alongside with renewable energy sources, carbon capture and storage as well as sustainable agricultural practices should be developed and implemented. Planetary boundaries and areas where the safe operation space has been transgressed are shown in Figure 4.
3. Phosphorus Processing Following Sustainable and Circular Principles
Thus far, this paper has reviewed the normative framework governing the activities of responsible policy makers and businesses, including phosphate processing companies. However, the normative framework outlined above is not legally binding, making it difficult and potentially risky to base investment- and/or operations-related decisions on this framework. This is probably the single most important reason the circular economy principles have not had a larger impact until now. Investors do not put equity into more sustainable and/or circular practices without a tangible return.
3.1. Why Phosphorus—Historic Development and Scarcity Considerations
The availability of resources in general and phosphorus in particular has been controversially discussed repeatedly since scarcity of resources was first addressed 1798 by Thomas Robert Malthus writing about the limits to growth of mankind by scarce resources [8]. The term Super Phosphate was introduced 1797 by the British physician George Pearson describing Calcium Di-Hydrogenphosphate (Ca(H2PO4)2) found in bones. Dilute sulfuric acid was first used in Bohemia in 1831 to convert biogenic phosphate in the form of bones and fossilized animal feces (coprolites) to a largely water-soluble form. In 1840, Justus von Liebig made a historic address before the British Association of Science explaining the role of minerals in plant growth and laying the groundwork for modern agricultural science. He was the first to demonstrate scientifically that insoluble phosphates such as bone could be made to release their phosphorus in a form more quickly available to growing plants if they were caused to react with sulfuric acid [9]. Following a similar concept, John Bennett Lawes treated coprolites with sulfuric acid and tested the resultant phosphate as a plant nutrient. In 1842, Lawes was granted a patent on this idea and he established the first commercial Super Phosphate Works. Within the next 20 years, 150,000 tons of Super Phosphate were produced every year in the United Kingdom [9]. The rapid growth of world demand in the 1850s severely depleted the known resources of phosphates—bones, coprolites and guano—prompting Liebig to express his concern that the excessive import of bones by England would not allow other countries a sufficient supply of fertilizers for maintaining soil-fertility. From 1855, Peruvian Guano sustained much of the global phosphate needs before resources were exhausted by the end of the 1870s [8]. During that period, Liebig’s perception of a forthcoming scarcity induced humanity to search for alternative resources and eventually large phosphorite deposits were found in South Carolina, USA. Mining began in 1867 and, having secured raw material supply, the phosphate industry developed in the USA and Europe. By 1889, the mine in South Carolina supplied more than 90% of the global phosphate demand and prospection in Florida was underway [9]. In the 20th century, prospection, mining and processing in other countries followed suit, Office Chérifien des Phosphates (predecessor of OCP Group) was founded in Morocco in 1920. During the 20th century, concerns about phosphorus scarcity reappeared in 1938/1939, 1972 and 1979, mainly in the United States [8].
In 2009, Dana Cordell published the “Peak Phosphorus” thesis in the article “The story of phosphorus: Global food security and food for thought” [10] supporting a wave of P-recycling activities taking off in the beginning of the 21st century in many industrialized countries. Meanwhile, Scholz and Wellmer [11,12] put the phosphorus story into perspective emphasizing the special position of phosphorus among the natural resources despite its comparatively high availability.
Phosphorus, like the two other primary nutrients nitrogen and potassium, is a bio-essential element, indispensable and irreplaceable for plant nutrition and all life on earth. SDG 2—Eradication of Hunger—is not attainable without phosphorus, nitrogen, and potassium. Secondary and trace nutrients are doubtlessly beneficial for plant growth, but they are not indispensable for human life [12]. Provided humanity learns how to harvest effectively the energy available from renewable resources [13], long-term supply of reactive nitrogen from the atmosphere and of potassium from seawater should be assured. Other mineral and metal resources are replaceable by similar elements performing the same functionality. Phosphorus does not share its metabolic functionalities with any other element on the planet and thus cannot be replaced. Consequently, mining, processing and use of phosphorus should be subject to extended ethical and information requirements [12]. The good news is that using phosphorus as a fertilizer is only dispersing the element and—if managed properly—large fractions can be recovered, fertilize many sequences of crops and feed many generations of people. Good management means applying circular principles to phosphorus mining, processing, use, recovery and recycling as well as minimizing the environmental impacts of related activities and phosphate use in agriculture.
The European Commission has acknowledged the significance of phosphorus, nitrogen and potassium by presenting a revised fertilizer regulation aiming at providing a level playing field for fossil and secondary nutrients as a first deliverable of the Circular Economy Package. Circular principles are a powerful tool to decouple economic growth from material use and essential nutrients are a great choice to start with. Waiting for actual scarcity is certainly not a smart option.
3.2. Economic Framework of Phosphorus Processing
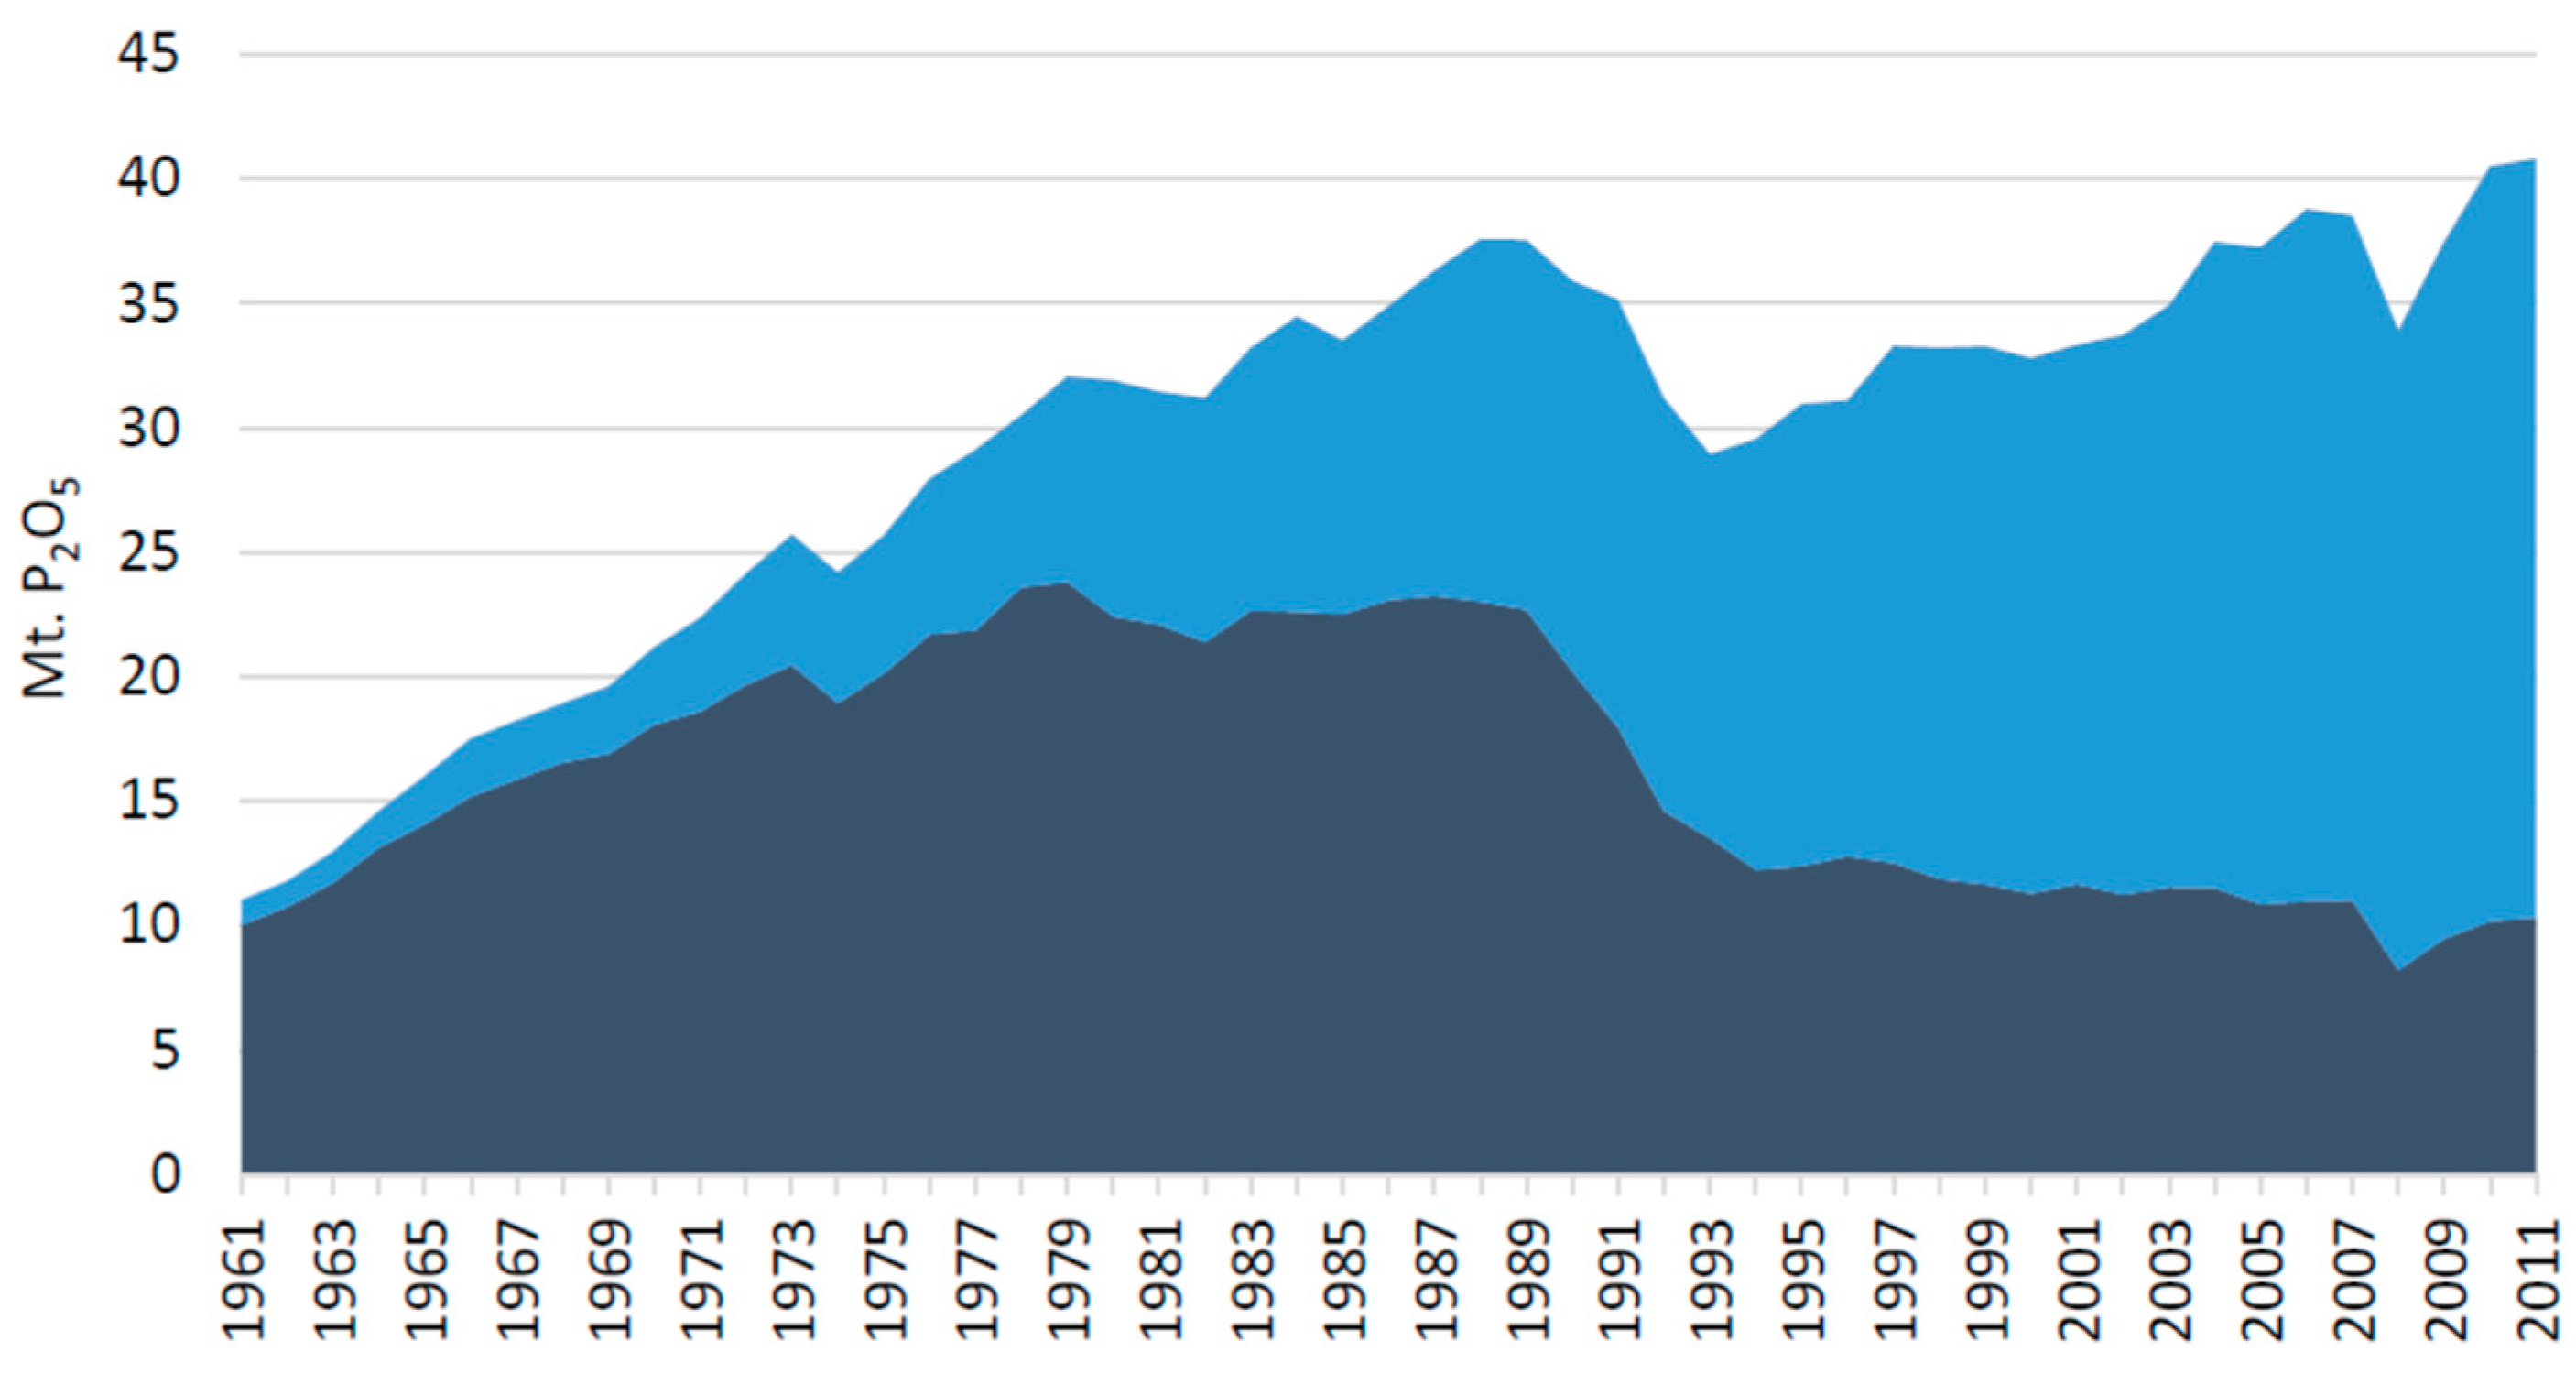
After the establishment of the industry in the early 20th century, demand for phosphate fertilizers gradually increased, particularly after World War I. After World War II, fertilizer consumption soared from slightly above 10 million tons per year in 1961 to 37 million tons in 1987 in-line with the overall resource use development shown in Figure 1. Figure 5 shows how demand shifted from early industrialized to developing countries, gradually from the early 1970s and more pronounced after 1989 with a marked decline of consumption in developed countries and a continuous rise in developing countries [14] to around 50 million tons P2O5 consumed today.
In contrast to common sense economic expectations, market prices did not follow the strong growth path. They remained stable and even declined in real terms, as shown in Figure 6. The light grey dotted and solid lines at the bottom of the graph show a marginally increasing phosphate nominal and declining real rock prices between 1960 and 2008, when a price spike interrupted the long-term pattern. Figure 6 shows that fertilizer prices essentially follow food prices, also declining in real terms between 1960 and 2012, albeit with higher volatility compared to fertilizer prices.
In the context of phosphorus processing, we are more interested in the long-term trends than in short-term phenomena such as the price peaks in 1974/1975 and 2007/2008, which are due to a coincidence of different influencing factors but certainly not a sign of impending scarcity [14]. The long-term negative price development lead though to exploiting the existing equipment and very low R&D expenses by the industry.
As the CEO of the OCP Group nicely explained in a speech given to Massachusetts Institute of Technology (MIT) Sloan alumni in February 2014 [15], OCP Group in 2006 had a negative equity of 1.5 billion USD after having gone through a long period of making losses year after year. Other companies may have performed better but in a market with declining real prices obviously not much room is left for innovation. The 2007/2008 peak and the following years during which prices only gradually returned to “normal” levels spurred investments and we have seen new state-of-the-art facilities being built and operated in several countries, particularly in Morocco, Saudi Arabia, Russia and China. Apart from investing in new capacity, industry started engaging in efficiency improvements and research in new fertilizer types (e.g., controlled release fertilizers) adapted to the requirements of precision agriculture. The increased capacity lead to prices declining again but not coming down to pre-peak levels. In February 2018, phosphate rock prices f.a.s. (free alongside ship) Casablanca (Morocco) stood at USD 86.00/ton, twice the level of February 2006 at USD 42.00/ton and slightly recovered from its post-peak low of USD 80.00/ton in December 2017 [16].
Consequently, phosphate fertilizer producers had been operating in a very difficult economic environment hampering research, innovation and investment into new technologies. However, the industry has used the last decade for vertical integration—most phosphate producers have access to own mines and control the whole value chain—and efficiency improvements with lower environmental impacts. In addition, several companies have started to test using secondary raw materials from recycling activities, for instance admixing ash to phosphate rock upstream of leaching and struvite to complex fertilizer blends (ICL) or producing ammonium nitrate from ammonia stripping at wastewater treatment plants (Yara).
3.3. Phosphorus Processing to Fertilizers
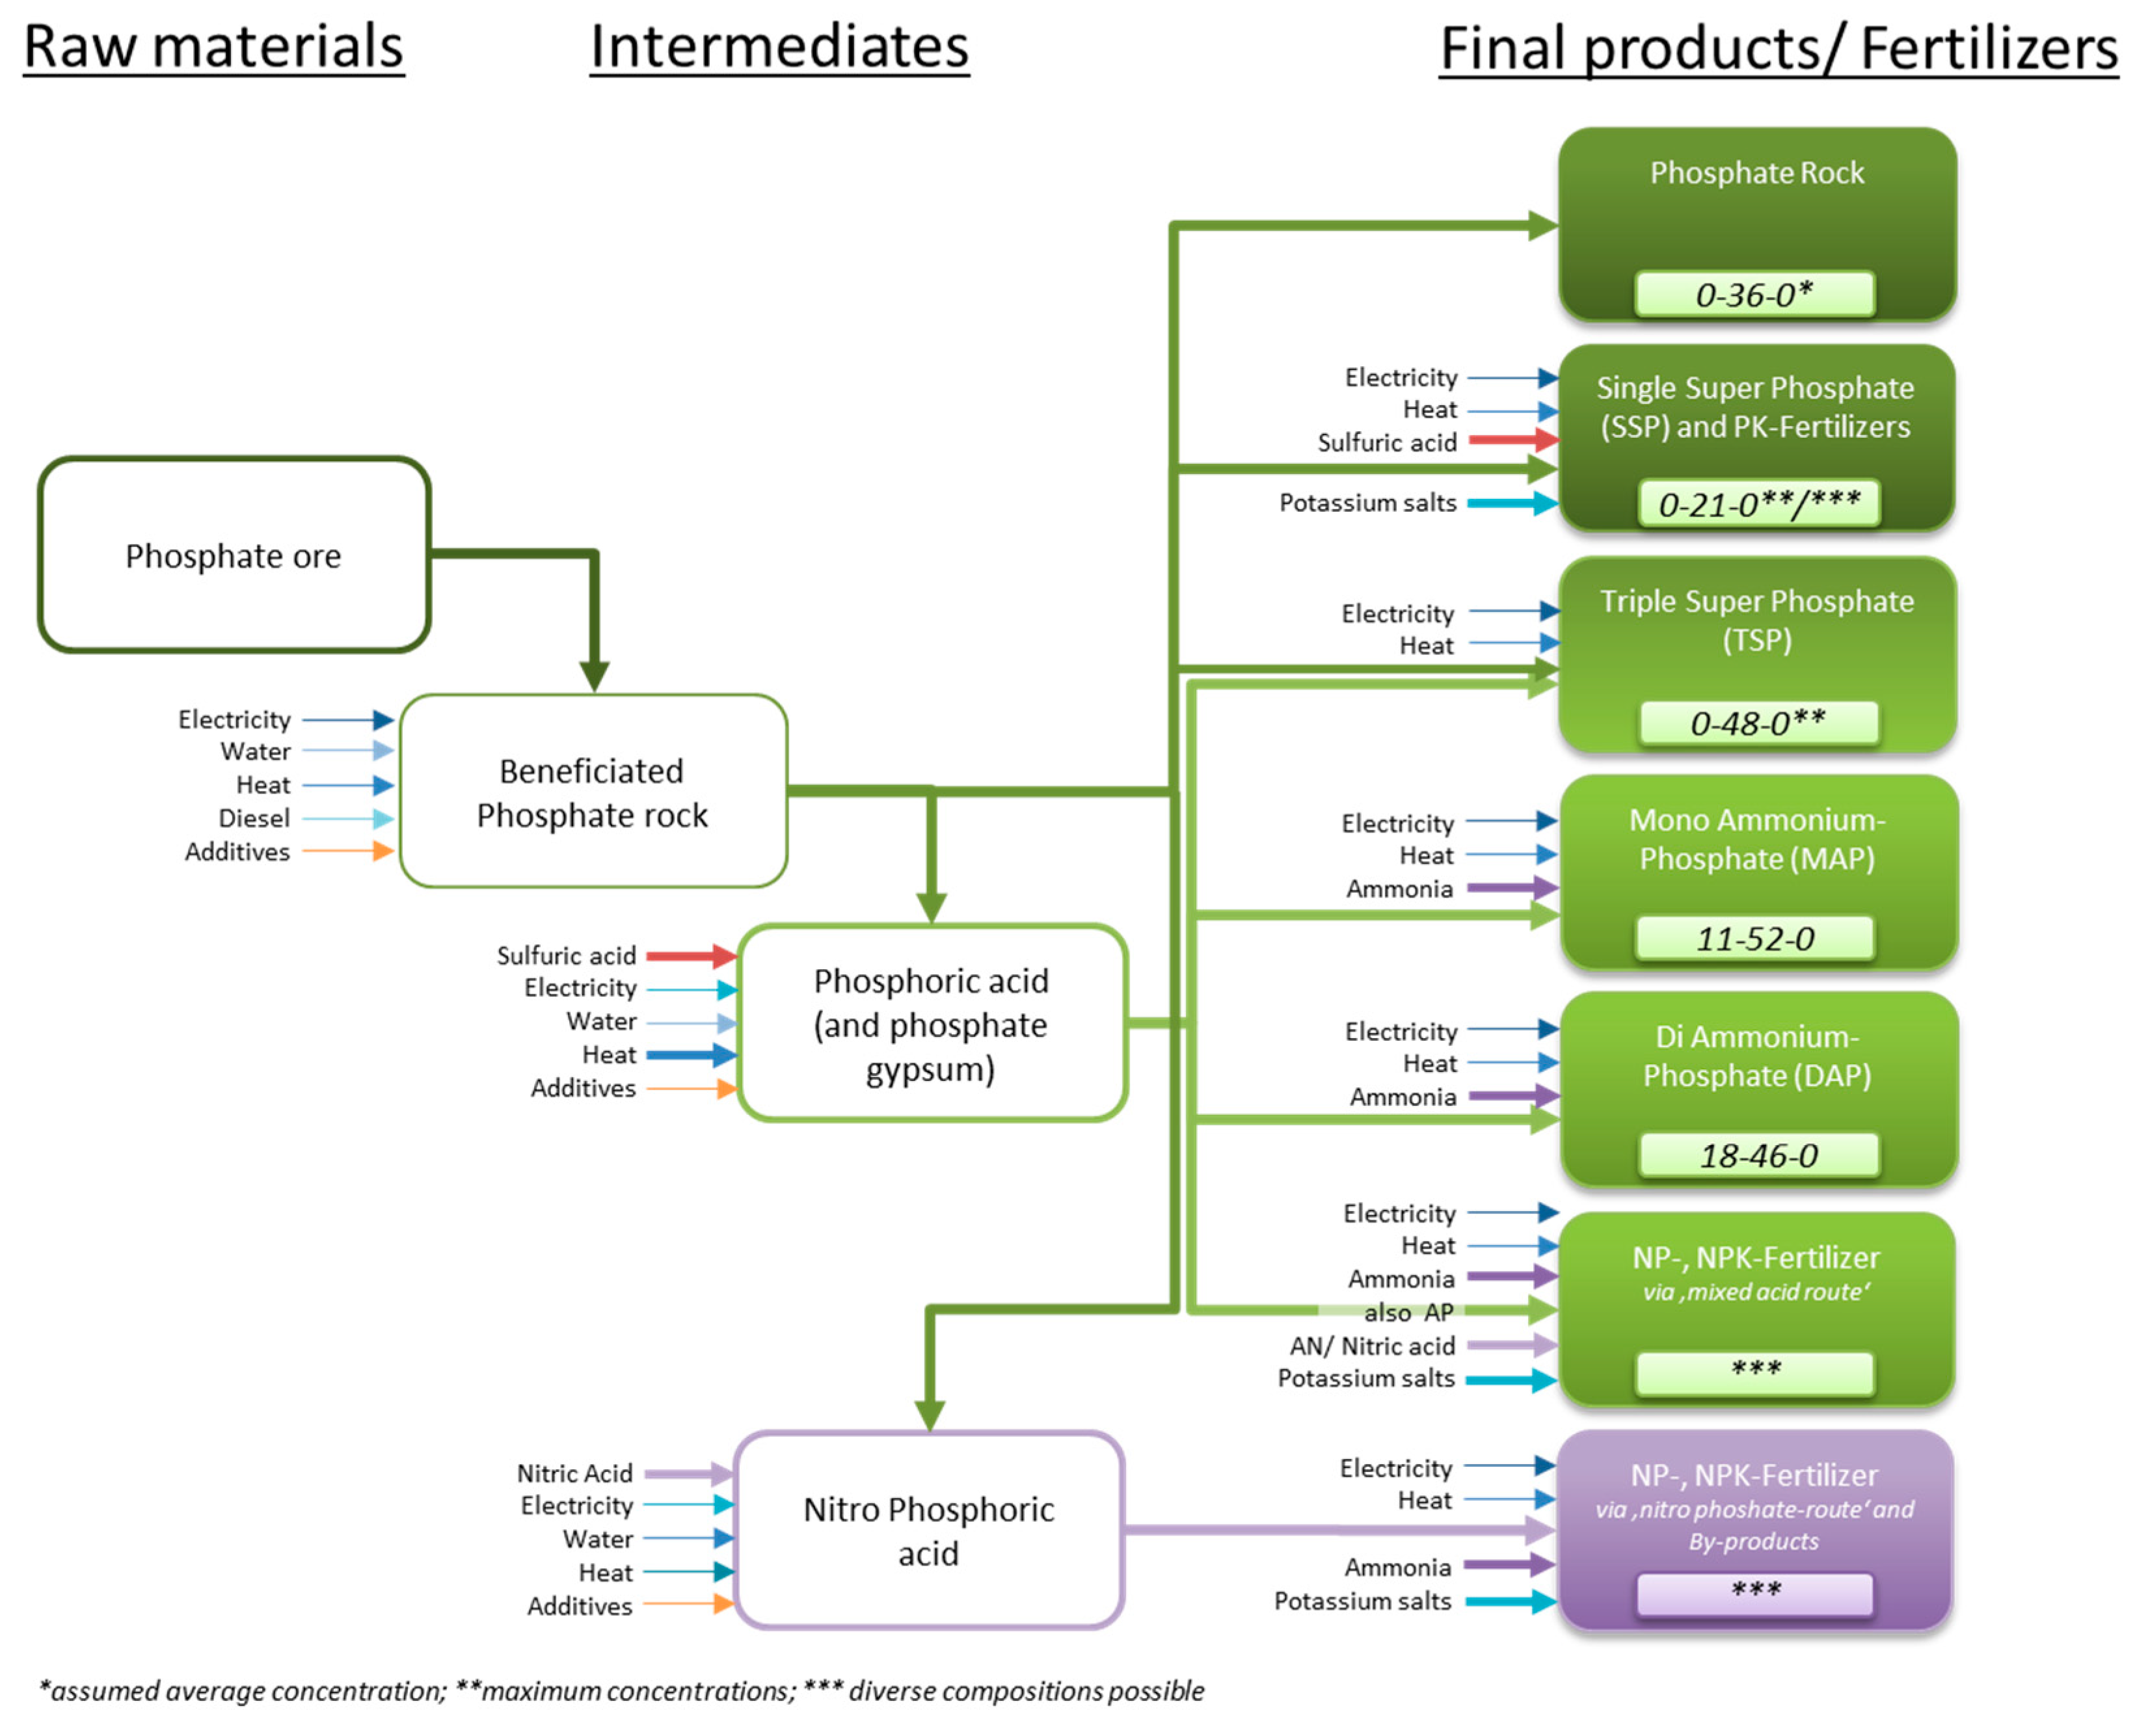
In 2016, about 90% of the globally extracted phosphorus was processed to fertilizers and feed phosphates (estimated to represent 7% of P2O5 use) [9] by acidic digestion of phosphate rock concentrate [17]. Worldwide, in terms of P2O5, close to 61 million tons of phosphate rock (concentrate) were extracted and beneficiated, of which close to 45 million tons (74%) were processed to phosphoric acid and about 10 million tons (16%) to Single Super Phosphate [17]. Phosphoric acid is the starting material for most phosphate containing fertilizers in the market with close to 20 million tons Di Ammonium Phosphate (DAP), 13 million tons Mono Ammonium Phosphate (MAP) and 4 million tons of Triple Super Phosphate (TSP). The global capacity of NPK fertilizer production with variable phosphate concentrations close to 110 million tons in 2014. NPKs are partly produced using phosphoric acid as a starting material and partly by digesting phosphate rock (concentrate) with nitric acid. Di Ammonium phosphate (DAP) is the most consumed P fertilizer worldwide with a market share of more than 50% [17]. The various fertilizer processing routes and products are shown in Figure 7.
3.4. Relevant Waste Flows and Environmental Impacts
Roughly three quarters of phosphate fertilizers are produced using phosphoric acid as an intermediate product [17], leaving 4–5 tons phosphogypsum (PG) per ton of P2O5 in the acid as relevant by-product/waste [19]. Currently, about 85% of 5.6–7.0 billion tons PG produced worldwide in the lifetime of phosphate industry is disposed of in stacks in 52 countries. Three to four billion tons are accessible for recovery. The stacks are growing by some 200 million tons per year at the current rate of phosphoric acid production [19].
Phosphogypsum is composed mostly of calcium sulfate and is a by-product of the reaction between sulfuric acid and phosphate rock in the manufacture of phosphoric acid. It is produced in a hydrated form, the degree of hydration depending on the process conditions, such as the temperature, the P2O5-concentration and the free sulfate content. The main forms of phosphogypsum produced are the dihydrate form (CaSO4·2H2O) and the hemihydrate form (CaSO4·½H2O). After separating the phosphoric acid from the insoluble rock constituents, typically by a tilting pan filter, the wet phosphogypsum is sent to a residue pile (stack) for storage, usually after washing to remove traces of phosphoric acid and fluoride. Since hemihydrate and other hydrate forms convert rapidly to the dihydrate form, dihydrate is the default form. Phosphogypsum may contain low residual concentrations of radium from the source rock (and other metals) and hence can potentially have a level of radioactivity associated with radon gas, which is the main reason regulators have limited or even forbidden its use, for instance the US EPA in Florida [9].
Numerous solutions for phosphogypsum use have been investigated during several decades by many regional, national and global institutions such as the Aleff Group (UK) [20], the International Fertilizer Association [17], the Florida Industrial and Phosphate Research Institute (FIPR) [19], and the International Atomic Energy Association (IAEA) [9]. The body of research work has produced many publications proposing different use options including agriculture, construction and ceramics. The IAEA Safety Report published 2013 [9] was considered a potential game-changer by some stakeholders and, in some countries, good examples exist of beneficial use of PG, for instance for soil improvement in Brazil, but the real breakthrough may depend on a changing global economic framework and technological progress in terms of efficient recovery technologies [21]. Disposing PG in the sea as still practiced by OCP in Morocco is not a sustainable solution. However, as Mustafa Terrab, the CEO of the OCP Group, stated in a presentation at the Massachusetts Institute of Technology [15], OCP plans to phase out this practice.
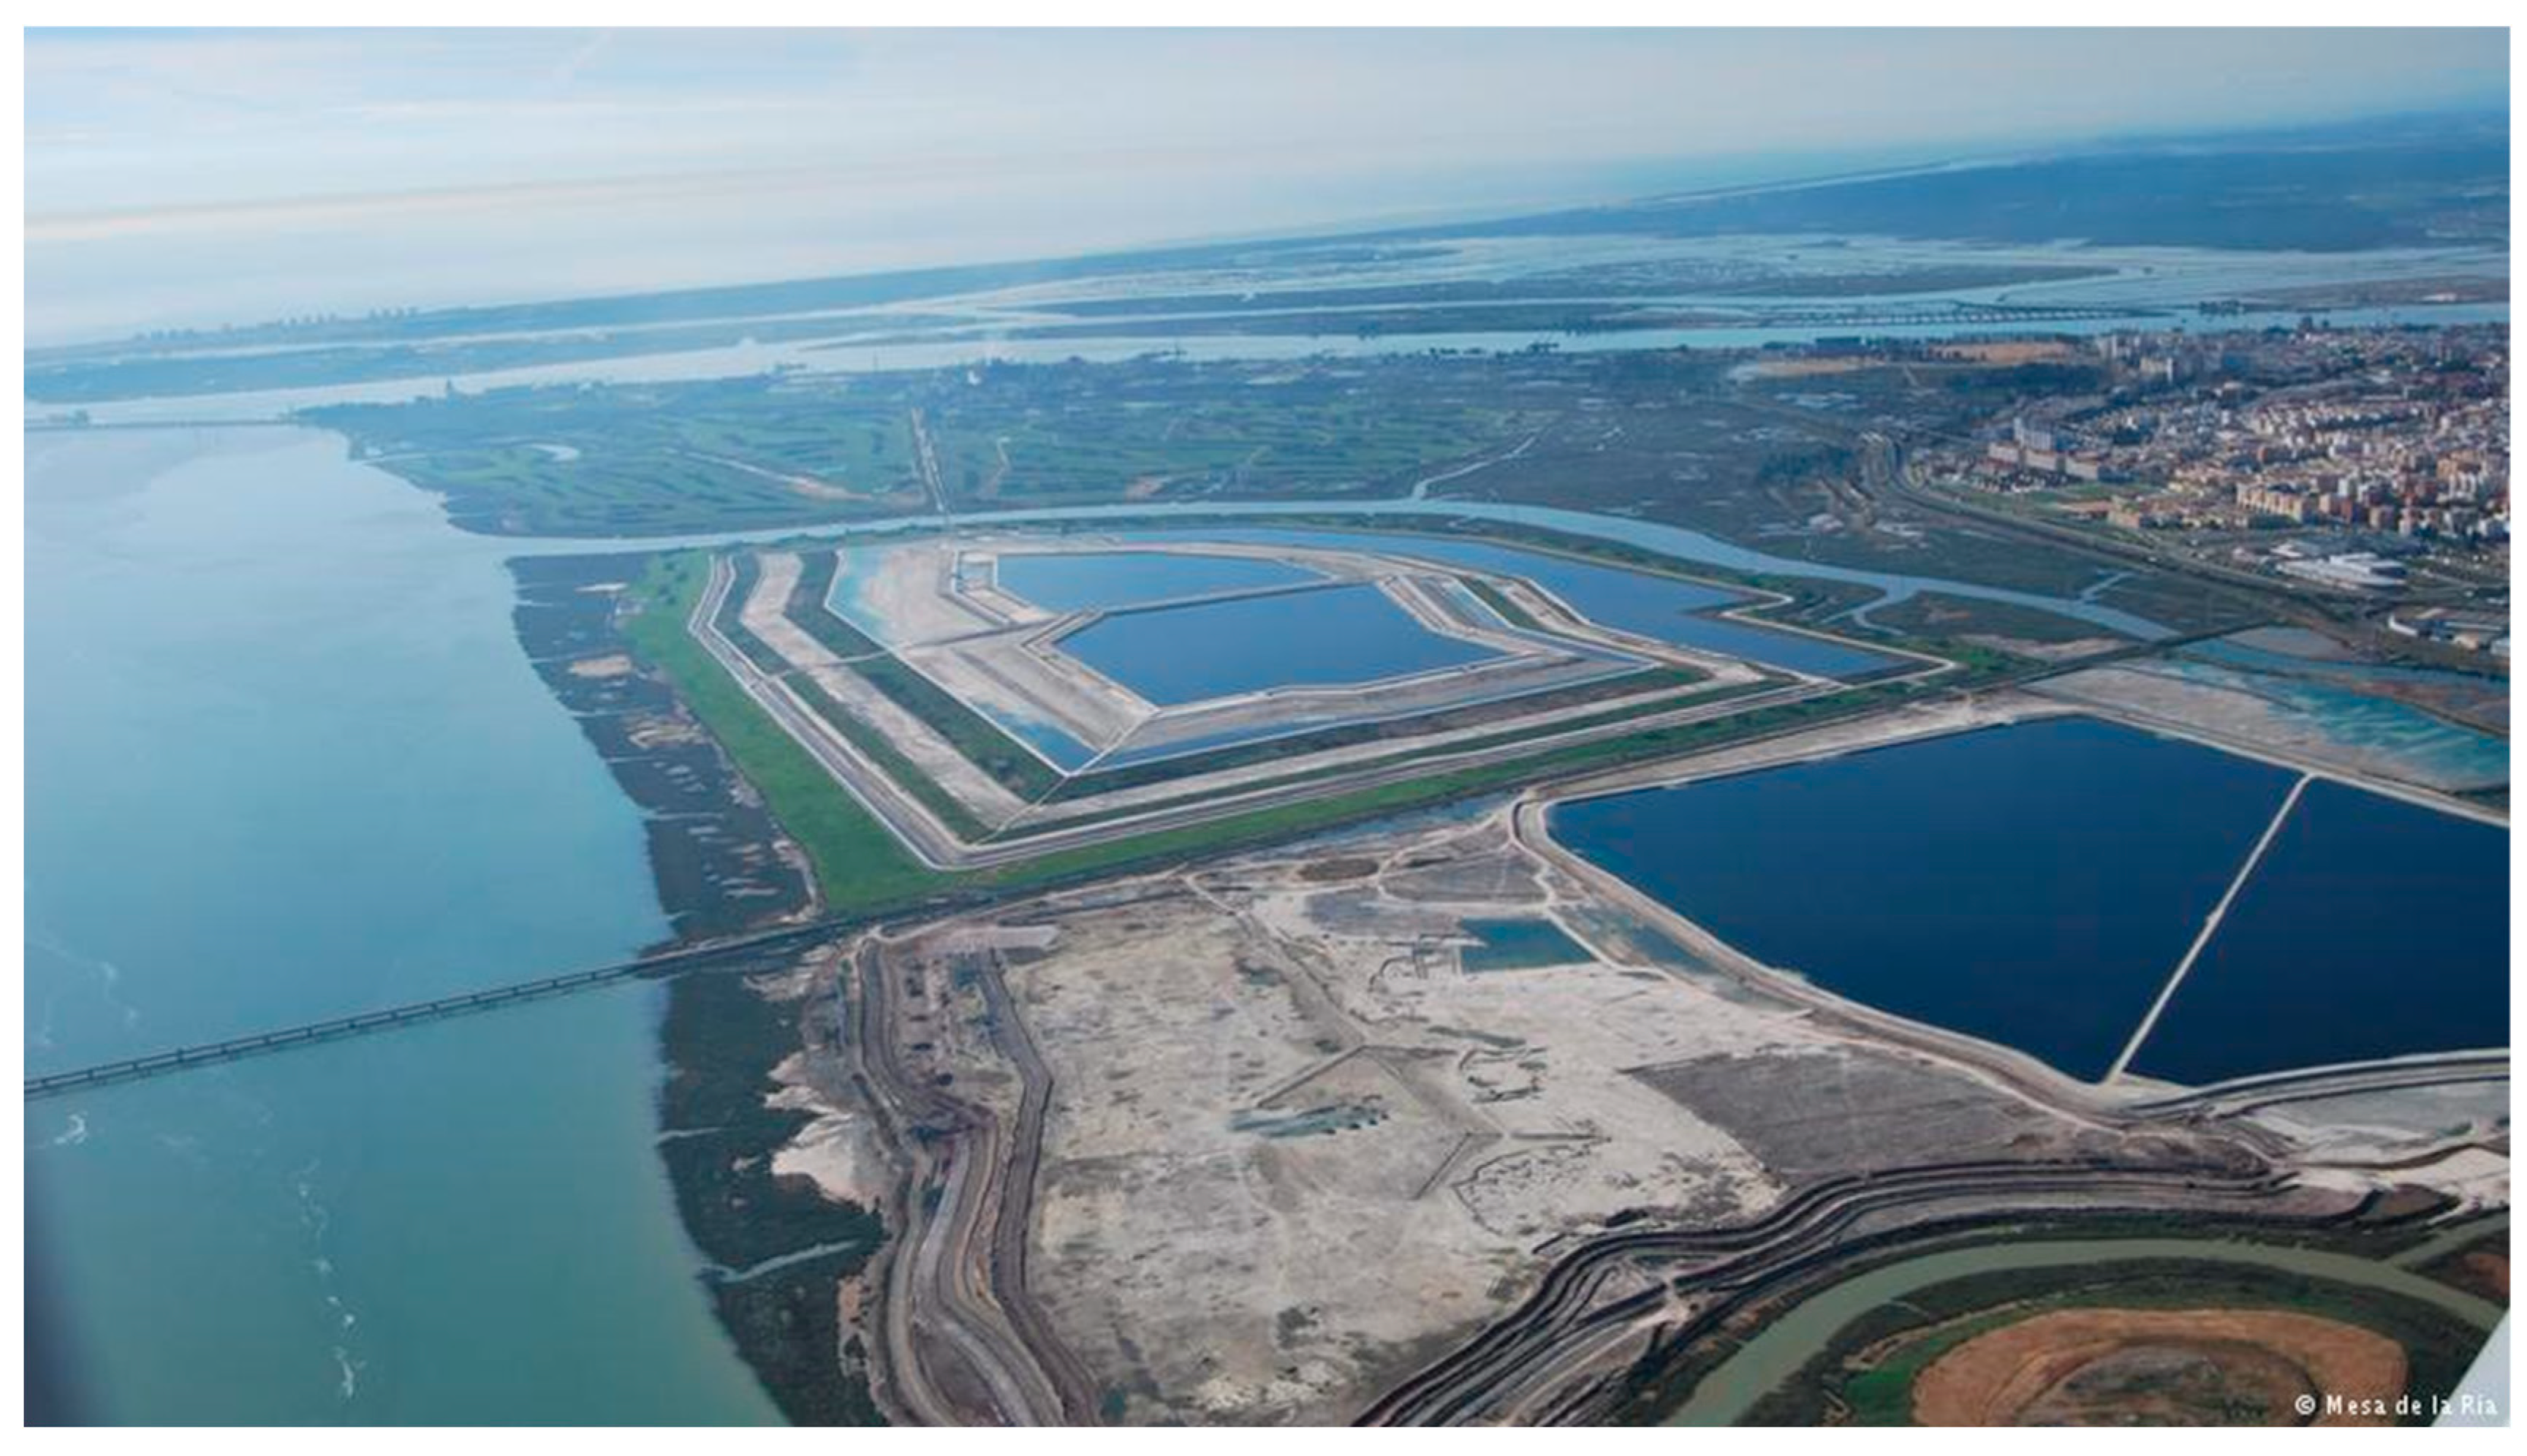
From a regional environmental point of view, PG may be the single most critical processing issue of fertilizer production. Large volumes of acid process water inside and on top of the stacks are frequently leaching to the ground water and to adjacent rivers and lakes [22,23], even decades after the stack being closed and covered by vegetation. Every now and then the dam at the top or the bottom cracks leading to spills of hundreds of thousands of cubic meters of acid process water into the environment [24] or into the groundwater through so-called sinkholes [25], as frequently occurring in Florida. An aerial image of a typical phosphogypsum stack is shown in Figure 8.
The nature of the phosphogypsum management issues is probably best demonstrated by a 2015 settlement between the US Environmental Protection Agency and the world leading phosphate fertilizer producer Mosaic Fertilizer LLC binding Mosaic to commit close to 2 billion USD in funding and penalties to ensure the proper treatment, storage and disposal of an estimated 30 million tons of hazardous waste (mainly phosphogypsum) at six facilities in Florida and two in Louisiana. Under the settlement, Mosaic Fertilizer will establish a USD 630 million trust fund, which will be invested until it reaches full funding of USD 1.8 billion. These funds will cover the future closure of and treatment of hazardous wastewater at four Mosaic facilities—the Bartow, New Wales and Riverview plants in Florida and the Uncle Sam plant in Louisiana—as well as the long-term care of those facilities and three additional facilities that are already undergoing closure [25].
3.5. Life Cycle Assessment as a Powerful Tool for Decision Making
Life cycle assessments should be performed in full compliance with the corresponding standard ISO 14040:2006. It includes the definition of the goal and scope of the LCA, the inventory analysis phase (LCI), the impact assessment phase (LCIA) and the interpretation, reporting and critical review including the limitations, relations between the phases and conditions for the use of choices and options. The LCA technique, the methodologies and the application as such is not standardized, leading to frequently insurmountable difficulties in comparing different LCAs performed by different institutions. The problem is accentuated by the conflict of interest between the non-disclosure of process details by suppliers and operators of techniques and the need of far reaching transparency as a prerequisite of plausible LCAs. The comparative LCA performed on behalf of the German Environmental Protection Agency [18] has been conceived as a model LCA for phosphate fertilizers produced from fossil and recycled materials. Several database flaws have been revealed and corrected and full transparency will be provided as soon as the report is published [18].
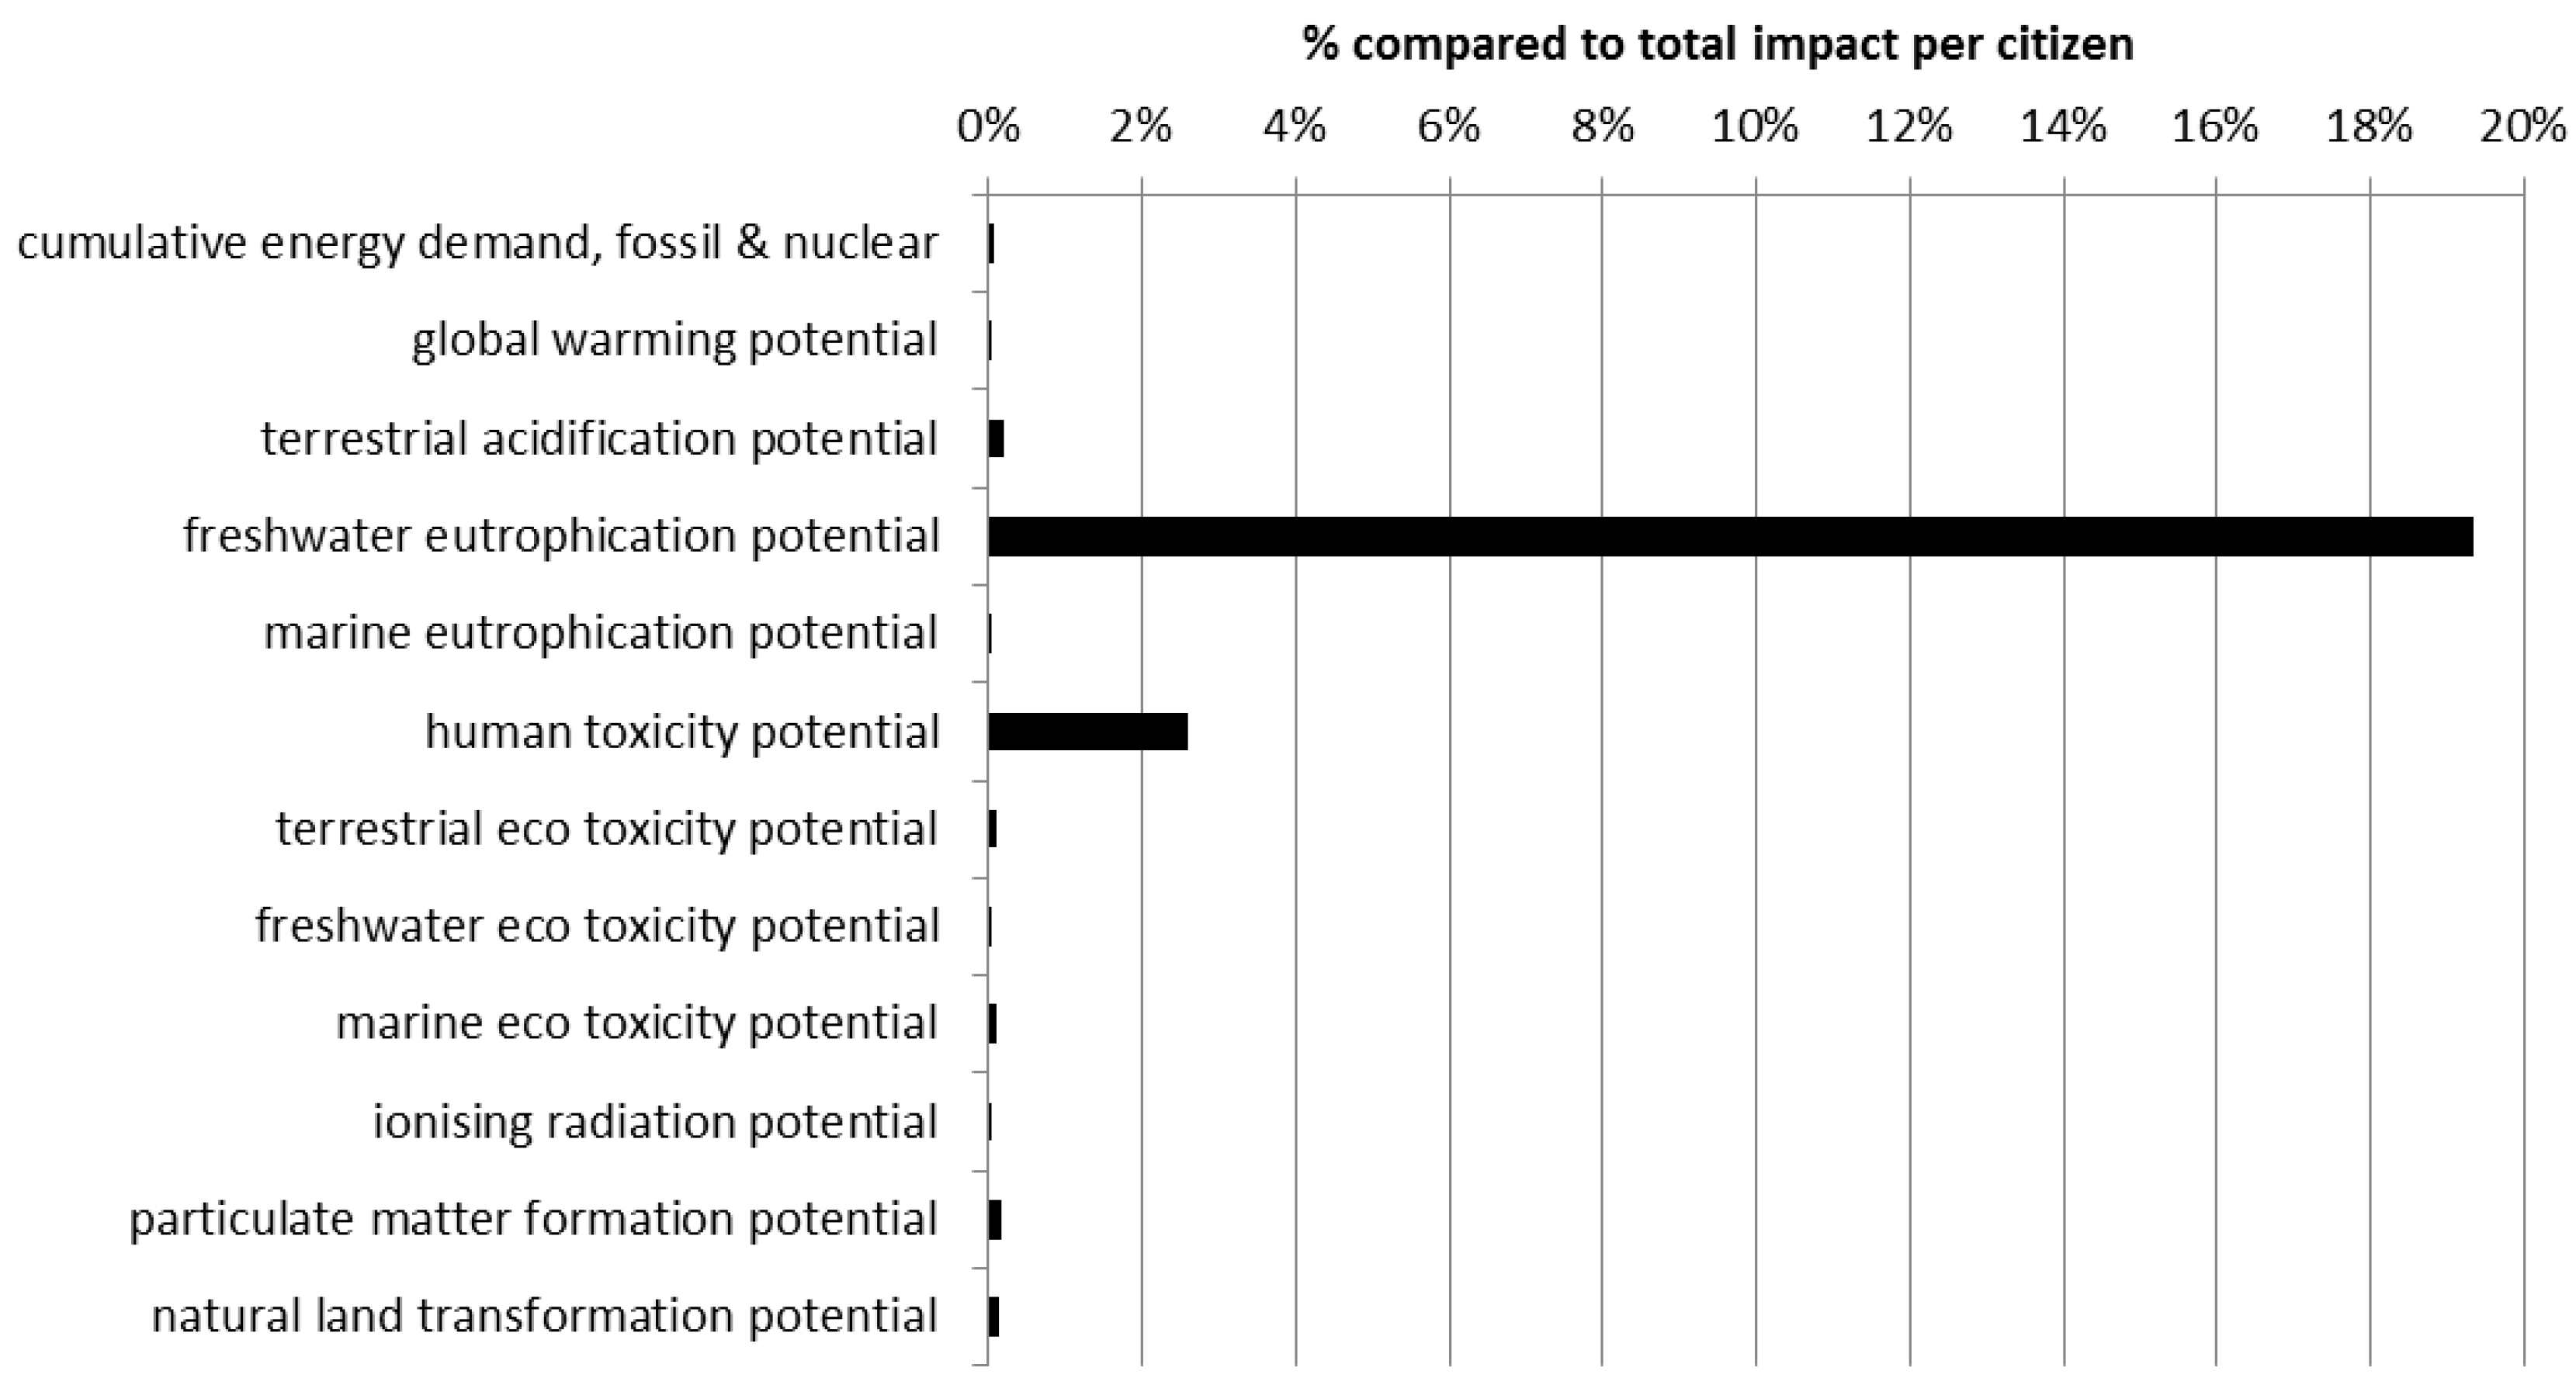
The preliminary results of the normalized LCA of phosphate fertilizers on the German market [18] exhibit two relevant environmental impacts: eutrophication and human toxicity. Eutrophication is mainly caused by applying fertilizers to cropland and losing phosphate to water bodies. Long-term eutrophication is also due to phosphogypsum stacks directly releasing acidic process water to rivers [22,23] but does only marginally contribute to the global impact reflected in the LCA, if no long-term sensitivity analysis is performed. The main contributor to the human toxicity impact category is cadmium (Cd), a toxic metal present in relatively high concentrations in sedimentary phosphates. The relevance of the two main impact categories in comparison to others is exhibited in Figure 9.
Despite its flaws in revealing the regional impacts of phosphogypsum stacks, regardless if caused by accidents [24,25] or by continuous leaching [22,23], LCA is a powerful tool for evaluating the direct environmental impact of options for improvement in case of conflicting interests. In the LCA study, the conflicting interests are between energy consumption with its corresponding greenhouse gas emissions and human toxicity, since removing cadmium from phosphate fertilizers consumes energy from fossil fuels, regardless if wet chemical or thermochemical processes are used. The critical question is whether the additional use of energy justifies the removal of cadmium in terms of the impact categories of the LCA.
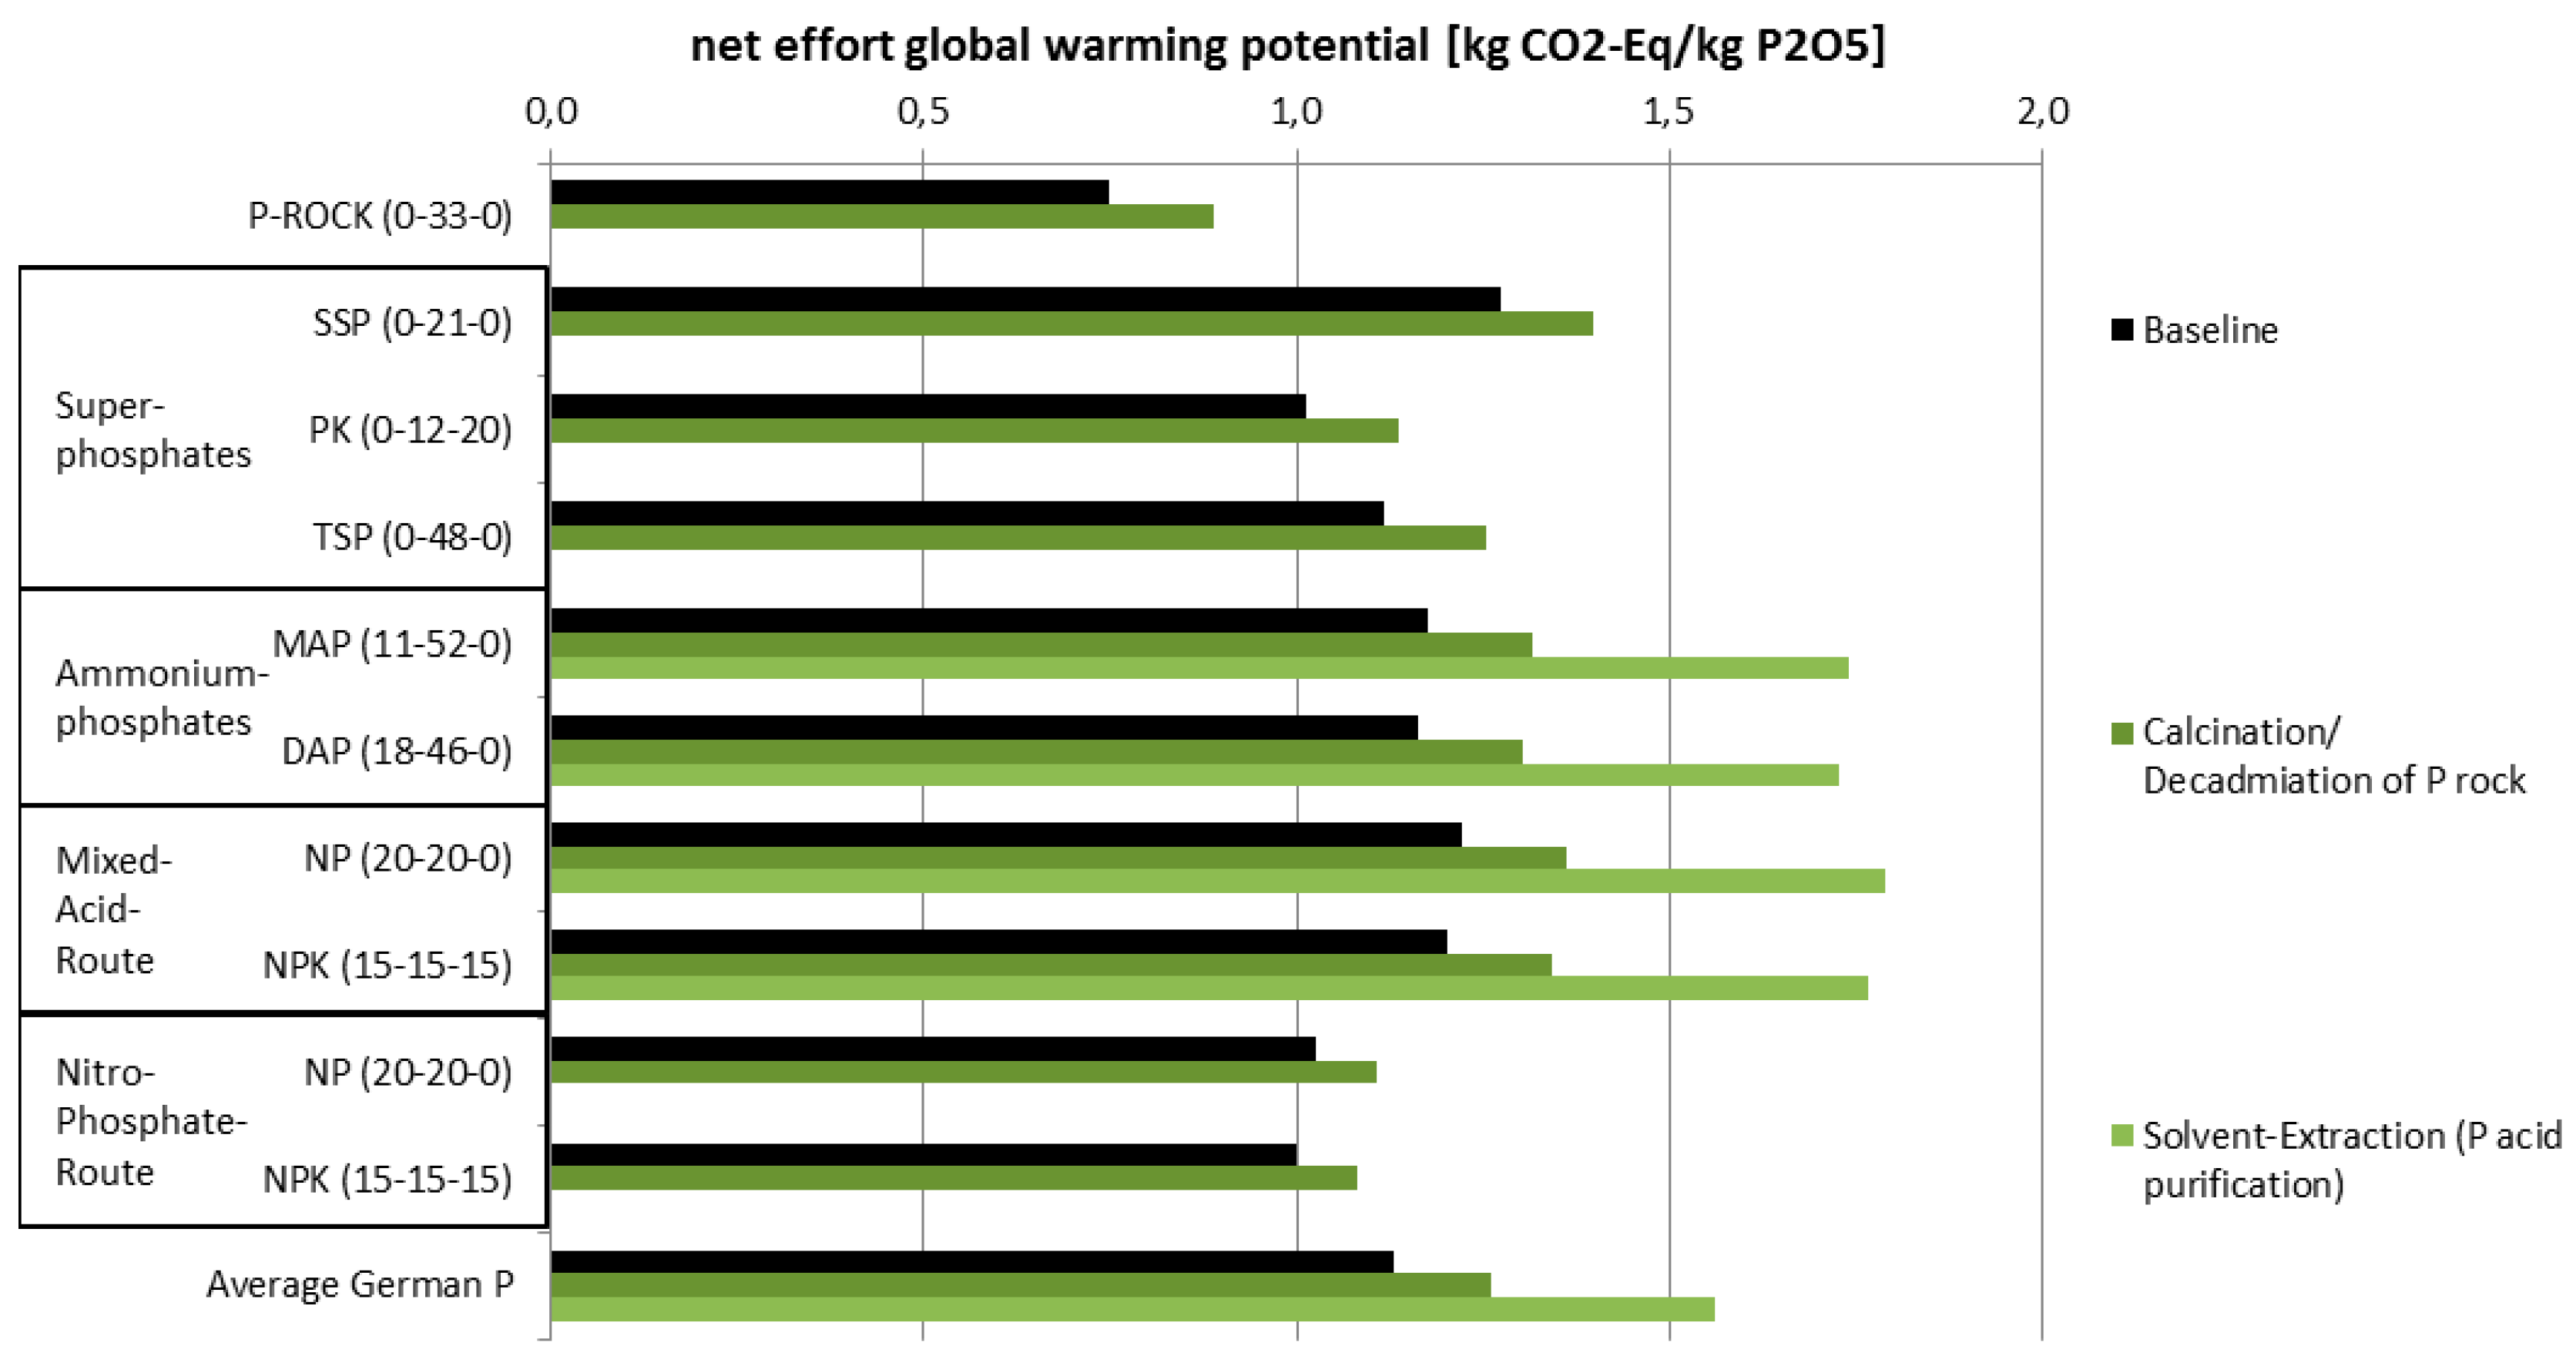
As Figure 9 clearly shows, phosphate processing only marginally (<0.1%) contributes to the global warming potential by greenhouse gas (GHG) emissions. Even if more energy is needed for producing controlled release fertilizers or removing cadmium from phosphate rock or phosphoric acid, the impact on greenhouse gas emissions is unlikely to become relevant, since the additional GHG emissions remain marginal. In addition, fossil fuels such as natural gas in the study for calcination, may be replaced by renewable energy such as concentrated solar power in the future, whereas cadmium accumulated in soils will remain and only gradually be taken-up by crops, consequently increasing the weekly human cadmium intake rate already exceeding the European Food Safety Authority’s (EFSA) recommendations (tolerable weekly intake of 2.5 µg/kg body weight) for toddlers, children and vegetarians. According to the Scientific Report of EFSA, individual dietary survey results varied between a weekly minimum lower bound average of 1.15 to a maximum upper bound average of 7.84 μg/kg body weight and a minimum lower bound 95th percentile of 2.01 and a maximum upper bound 95th percentile of 12.1 μg/kg body weight reflecting different dietary habits and survey methodologies [26]. Figure 10 shows the increase of global warming potential if applying cadmium removal processes, a marginal increase from a very low basis of only 0.1% of the global impact per citizen.
A significant reduction of the human toxicity potential is achieved which has a tangible impact on the percentage of contribution of phosphate fertilizers to the total toxicity humans are exposed to. The results represent the average toxicity potential for people living in Germany, where more than 50% of phosphate fertilizers in the market are produced from Russian phosphate rock concentrate with negligible cadmium concentrations. In countries where sedimentary rock-based fertilizers prevail, the impact is even more pronounced. The relevant toxicity potential decrease achievable by cadmium removal is shown in Figure 11.
3.6. Circular Principles and Resource Efficiency
In terms of using by- or secondary products, the phosphate industry, similar to the entire chemical industry, is an early adapter of circular principles. In Europe, about 70% of sulfuric acid used for rock digestion is secondary (used) acid originating from other processes [18]. The phosphate industry absorbs most ammonium sulfate coming as a by-product of caprolactam production as N-carrier and the nitro-phosphate process (also known as Odda process) does not generate waste flows at all by producing nitro phosphoric acid and calcium ammonium nitrate (CAN), the latter being a by-product and a widely accepted nitrogen fertilizer [27]. However, due to using very old processes, dating back to the 19th and 20th centuries, and the frequent usage of old production facilities that have not been revamped for decades, there is a significant gap between the efficiency options available and those used in practice.
Resource efficient production processes facilitate waste management and a faster transition to circular principles. Phosphate processing offers a variety of options to increase the resource efficiency and separate commercially viable resources from waste streams. Hereafter, we discuss two examples of low hanging fruits for increased materials and energy efficiency in the phosphate industry and some more challenging options.
Resource efficiency in terms of phosphate use is determined by P solubilization during digestion and by co-crystallization in phosphogypsum. Energy efficiency depends on heat recovery rates from exothermic reactions (sulfur burning, acid neutralization) and on the heat employed for phosphoric acid concentration [18,28].
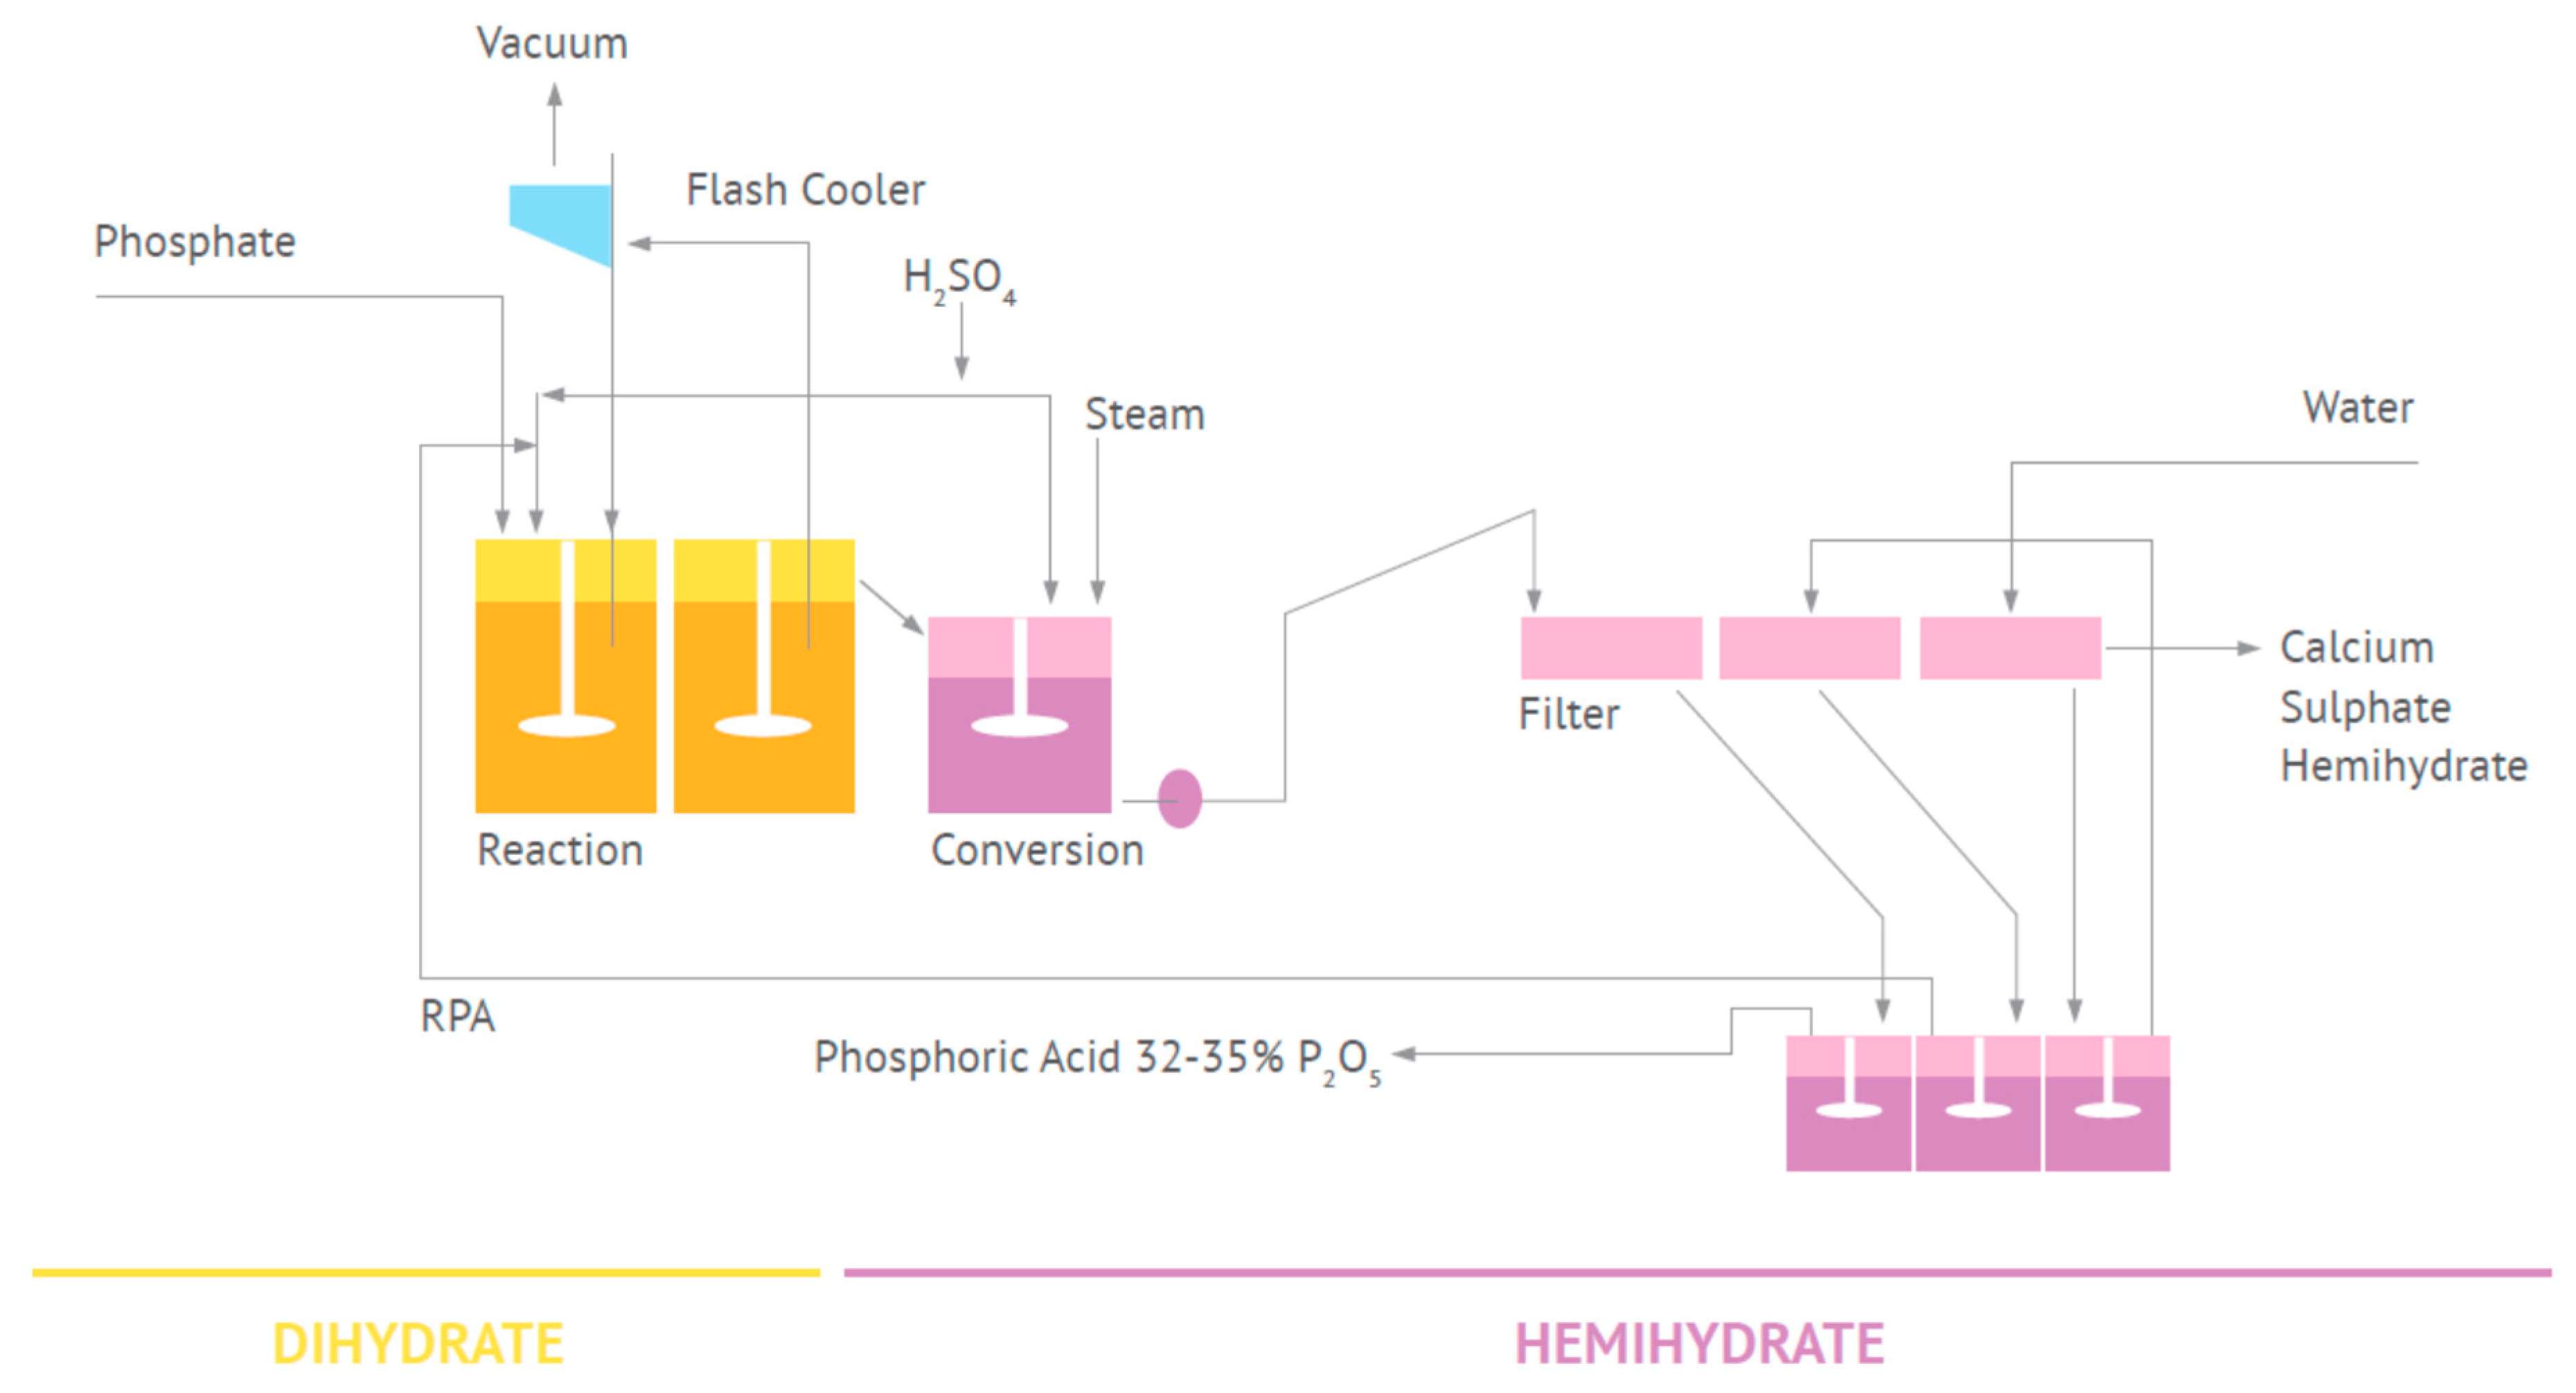
Almost 92% of the world’s phosphoric acid processes outside of China operate the Dehydrate (DH, about 76% of global PA production) and Hemihydrate processes (HH, about 15% of global PA production), the classical one-crystal processes with P2O5 recovery rates of 95% (DH) and 93% (HH), respectively. The lower recovery rate of the HH process is compensated by a significantly higher P2O5 concentration in the acid—40–46% vs. 26–32%—requiring less steam for water evaporation to the usual 54% P2O5 concentration in merchant grade acid (MGA) [29]. At least two proven processes that increase the P recovery rates to 97–98% and produce a cleaner and dryer phosphogypsum are available and reportedly easily implementable with moderate CAPEX investments: Nissan’s H and Prayon’s DA-HF processes, using double crystallization and single filtration according to the flow sheet in Figure 12 [28].
Apart from OCP’s SAFI MP1 and MP2 (Nissan H process) and a few other plants, the described efficiency enhancement processes are not widely used, despite their environmental and economic advantages [28]. If the transition to a Circular Economy is taken seriously, industrial implementation of higher resource efficiency processes should become a priority. Having a direct impact on the phosphate recovery rate, the double crystallization processes reduce co-crystallization of P in phosphogypsum and its water content from close to 20% to 6% thus giving a very good example for the interdependency of resource efficiency and waste management. In addition, these processes do not cause a conflict of interest—they just require revamping phosphoric acid plants with some moderate investment [30].
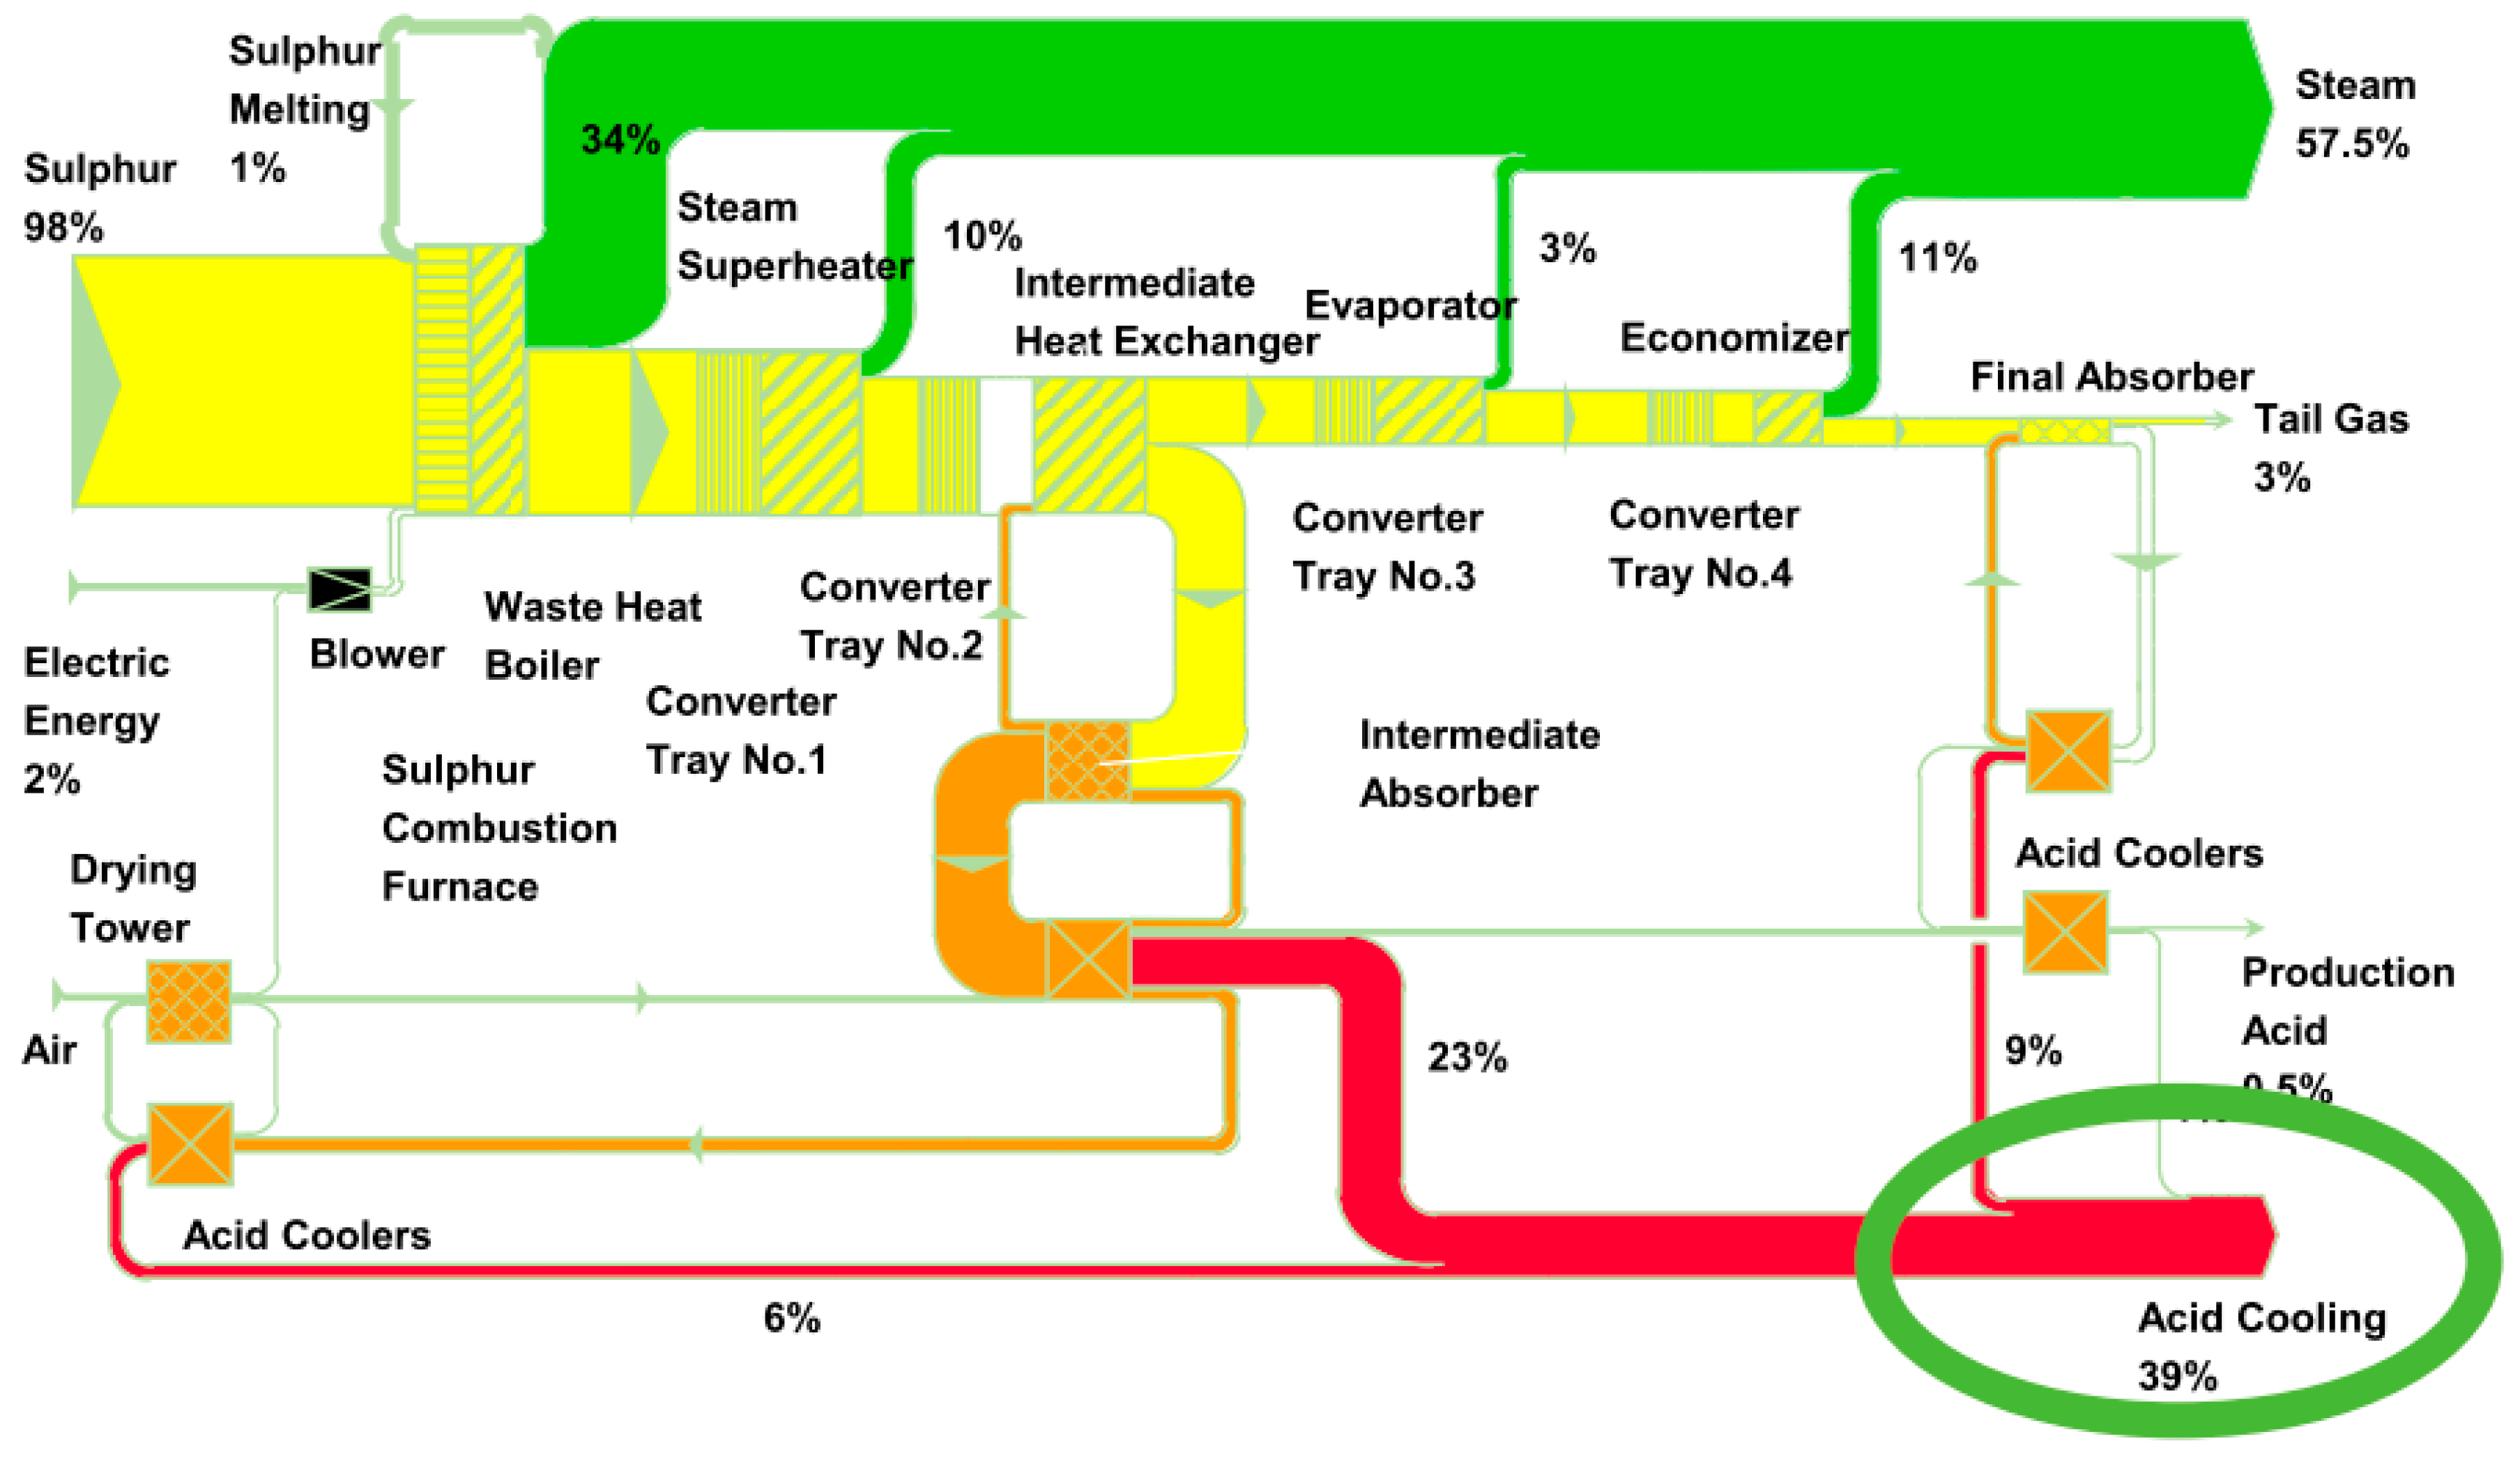
A low hanging fruit for energy efficiency improvement is enhancing the heat (steam) recovery during sulfuric acid production. In conventional sulfuric acid plants, about 40% of the recoverable heat is wasted, as shown by the Sankey diagram in Figure 13.
By implementing enhanced heat recovery system (e.g., Outotec’s Heros®), the conversion efficiency of sulfur combustion could be increased from close to 58% to 71%, a big step in resource efficiency. The system produces a low-pressure steam of about 10 bars for constant use. Smart heat recovery systems do not hamper the production of sulfuric acid if shut down for maintenance [31].
Another example for energy efficiency by low pressure steam recovery are closed loop steam dryers, cutting the energy use for drying by 60%, from 800–1000 kWh per ton of water to less than 400 kWh. Closed loop steam dryers are typically used for biomass drying before its use as a fuel. Outotec has built a pilot dryer for testing different materials containing up to 80% water. Until now, (sewage) sludges and slurries (e.g., digestion residues) have been successfully dried to 90–95% dry matter. The CLS dryer may be a valuable option for drying slurries and products in the phosphate industry [32].
Apart from materials and energy for direct use in the plant, phosphate ores may contain fluorine, rare earth elements (REE), uranium, radium, cadmium and other elements that are transferred to the product or the waste streams without having a positive functionality. On the contrary, some of these components are undesirable or classified as pollutant that may hamper the beneficial use of fertilizers or the recycling potential of waste streams, in particular regarding the use of phosphogypsum [33,34] In a linear economy and a business as usual scenario, these resources are extracted as long as they can be sold and supplied in response to an apparent market demand and directly contribute to the profits of the phosphate industry. In a Circular Economy, solutions should be sought by joint efforts of larger stakeholder groups forming clusters. Their common task is developing solutions that could bring about mid-term commercial and environmental benefits.
Phosphate ore is a relevant resource for uranium with some 20,000 tons globally addressable. Prayon and Union Minière (now Umicore) developed the so-called DEHPA/TOPO two-stage solvent extraction process for recovery of uranium from Moroccan phosphoric acid [35]. The first uranium recovery plant from phosphate ores was operational in Florida in 1976. Prayon successfully recovered uranium from phosphoric acid from 1980 until 1998 in Belgium. When the investment decision was taken, the price for U3O8 was USD 42.00/lb. The plant was closed when the price for U3O8 was USD 10.00/lb. A profitable extraction of uranium from phosphate ores was not possible from these days onwards [35].
Another valuable resource associated with some phosphate ores are rare earth elements (REE). Among others, the ores of the Kirovsky and Kovdorsky mines in the Murmansk region (Russia) contain REE in concentrations apparently making extraction commercially feasible. The Russian fertilizer producer Acron extracted and processed 200 tons of rare earth oxides – Cerium, Lanthanum and Neodymium—from its apatite concentrate. Acron is currently the only Russian industrial producer of REE [18]. Solvent extraction processes are appropriate for extracting REE from phosphoric acid and revenues from two groups of elements—radionuclides and REE may support each other to achieve commercially viable technology developments [36].
The examples for higher phosphorus recovery rates and energy efficiency are arbitrarily selected for demonstration that technology suppliers have solutions for improvement. Other suppliers may have similar improvements and examples must not be understood as a recommendation for the suppliers mentioned above.
4. Conclusions
The United Nations—indeed all nations on our planet—have committed themselves to the 17 Sustainable Development Goals and to the Paris Agreement (COP21) to curb greenhouse gas emissions drastically for preventing a temperature increase of more than 2 °C. (On 1 June 2017, Donald Trump announced that the United States would withdraw from the COP21 Agreement. According to Article 28 of the Agreement, the earliest possible effective US withdrawal date could be 4 November 2020, four years after the Agreement became effective in the US.) The UN has set the normative framework for sustainable and inclusive development. In this spirit, the European Commission has adopted the Circular Economy Package. If we take this framework seriously—it is highly recommended to do so if we intend to operate within the safe space of our planet—business as usual is not an option.
For the first time in industrial history, we have a global and a European framework, albeit not legally binding, for decoupling growth from materials use. The global agreements reflect a shared conviction that, by continuing the unlimited use of natural resources, the conditions for life on our planet will be destroyed. Conditions for life are not exacerbated by scarcity, but by abundance, use of resources to an extent that nature cannot tolerate.
In nature, circular principles prevail. Atoms do not disappear, they simply change chemical bonding and physical state. Human interference dissipates and transfers them to places where they cause damage. While burning fuels, we transfer carbon and other greenhouse gases to the atmosphere instead of keeping it in our soils. While producing fertilizers and using them, we dissipate phosphorus and transfer it to aquatic bodies causing eutrophication and killing aquatic life. The fact that nothing disappears, and that nature provides a model for how we should deal with our resources gives rise to optimism. We just need to learn to copy nature, and the Circular Economy, judged from this point of view, is obviously a smart concept.
Investigating the strong and week points in phosphate processing revealed the by-product phosphogypsum disposed of in stacks or still discharged to the ocean being the single most critical issue: it contributes to P losses and eutrophication. A comparative life cycle assessment performed on behalf of the German EPA exhibited two major environmental impacts of phosphate fertilizers: eutrophication and human toxicity. Eutrophication is mainly due to fertilizer application but can be influenced by producing fertilizers which release nutrients in synchrony with plant uptake. New fertilizers and new fertilizing practices must be developed hand in hand to avoid dissipation of P and the transfer of (concentrated) pollutants to feed and food.
How LCA can be used to evaluate conflicting options has been demonstrated by comparing the normalized impact of reducing the human toxicity and producing additional greenhouse gas emissions for that purpose. Using some additional energy for producing controlled release fertilizers will probably bring similar results but was not subject of the study.
Eventually, several technology options are discussed which do not lead to a conflict of interests and simply need modest CAPEX investments to be implemented, even in existing facilities. These technologies lead to higher phosphorus use efficiencies or to higher energy efficiencies without any negative environmental impacts. Most of these processes are mature and ready for implementation. The good news is that during the last decade we have seen several new facilities using best available technologies. Some include extraction of rare earth elements at industrial scale using technologies that are suitable for targeted separation of a variety of substances. Once in use, value materials as well as pollutants may be extracted.
It can be concluded that despite the apparent problems related to phosphate processing, policy makers, academia and industry jointly launch initiatives towards cleaner, more efficient production of products with a lower impact. These initiatives would, however, be more convincing if industry lobbying for higher pollution limits would be replaced by a joint societal commitment to all-inclusive Circular Economy principles.
Author Contributions
L.H. conceived and wrote the paper. F.K. did the Life Cycle Assessment of decadmiation technologies. R.H. did research on waste flows.
Funding
This research received no external funding except for the Life Cycle Assessment case study which was funded as part of a comprehensive study by the German Environmental Agency, UFOPLAN research no. 3716 31 330 0.
Conflicts of Interest
The authors declare no conflicts of interest.
References
- Steffen, W.; Broadgate, W.; Deutsch, L.; Gaffney, O.; Ludwig, C. The trajectory of the Antropocene: The Great Acceleration. Antropocene Rev. 2015, 2, 81–98. [Google Scholar] [CrossRef]
- Fischer-Kowalski, M.; Swilling, M.; von Weiszäcker, E.; Ren, Y.; Moriguchi, Y.; Crane, W.; Krausmann, F.; Eisenmenger, N.; Giljum, S.; Hennicke, P.; et al. Decoupling Natural Resource Use and Environmental Impacts from Economic Growth; UNEP Working Group on Decoupling: New York, NY, USA, 2011. [Google Scholar]
- Von Weiszäcker, E.U.; de Larderel, J.; Hargroves, J.; Hudson, C.; Smith, M.; Rodrigues, M. Decoupling 2: Technologies, Opportunities and Policy Options; A Report of the Working Group on Decoupling to the International Resource Panel; UNEP: New York, NY, USA, 2014. [Google Scholar]
- World Commission on Environment and Development (WCED). Our Common Future; United Nations: New York, NY, USA, 1987. [Google Scholar]
- United Nations. Sustainable Development Goals; United Nations Department of Public Information: New York, NY, USA, 2018; Available online: https://sustainabledevelopment.un.org/sdgs (accessed on 12 March 2018).
- Ellen MacArthur Foundation, McKinsey Centre for Business and Environment and Stiftungsfonds für Umweltökonomie und Nachhaltigkeit (SUN). Growth Within: A Circular Economy Vision for a Competitive Europe; Ellen MacArthur Foundation: Isle of Wright, UK, 2015. [Google Scholar]
- Steffen, W.; Richardson, K.; Rockström, J.; Cornell, S.; Fetzer, I.; Bennett, E.; Biggs, R.; Carpenter, S.; de Vries, W.; de Witt, A.; et al. Planetary boundaries: Guiding human development on a changing planet. Science 2015, 347, 1259855. [Google Scholar] [CrossRef] [PubMed]
- Ulrich, A.E.; Frossard, E. On the history of a reoccurring concept: Phosphorus scarcity. Sci. Total Environ. 2014, 490, 694–707. [Google Scholar] [CrossRef] [PubMed]
- International Atomic Energy Agency (IAEA). Radiation Protection and Management of NORM Residue in the Phosphate Industry; IAEA Safety Report Series No. 78; IAEA: Vienna, Austria, 2013. [Google Scholar]
- Cordell, D.; Drangert, J.-O.; White, S. The story of phosphorus: Global food security and food for thought. Glob. Environ. Chang. 2009, 19, 292–305. [Google Scholar] [CrossRef]
- Scholz, R.W.; Wellmer, F.-W. Although there is no Physical Short-Term Scarcity of Phosphorus, its Resource Efficiency Should be Improved. J. Ind. Ecol. 2018. [Google Scholar] [CrossRef]
- Wellmer, F.W.; Scholz, R.W. Putting phosphorus first: The Need to Know and Right to Know—Call for a Revised Hierarchy of Natural Resources. Resources 2017, 6, 20. [Google Scholar] [CrossRef]
- Moriarty, P.; Honnery, D. What is the global potential for renewable energy? Renew. Sustain. Energy Rev. 2012, 16, 244–252. [Google Scholar] [CrossRef]
- Heckenmüller, M.; Daiju, N.; Klepper, G. Global Availability of Phosphorus and Its Implications for Global Food Supply: An Economic Overview; Kiel Institute for the World Economy: Kiel, Germany, 2014. [Google Scholar]
- Terrab, M. Youtoube. 2014. Available online: https://www.youtube.com/watch?v=41ORMwrGoqU (accessed on 4 February 2018).
- IndexMundi. Commodities. 2017. Available online: https://www.indexmundi.com/commodities/?commodity=rock-phosphate (accessed on 28 March 2018).
- IFA International Fertilizer Association. 2016. Available online: https://www.fertilizer.org/En/Statistics/PIT_Excel_Files.aspx (accessed on 5 February 2018).
- Kraus, F.; Zamzow, M.; Conzelmann, L.; Remy, C.; Hermann, L.; Seis, W.; Kabbe, C.; Miehe, U.; Hermann, R. Ökobilanzieller Vergleich der P-Rückgewinnung aus dem Abwasserstrom mit der Düngemittelproduktion aus Rohphosphaten unter Einbeziehung von Umweltfolgeschäden und deren Vermeidung; UBA-FB 00; Umweltbundesamt: Dessau-Roßlau, Germany, 2018; in press. [Google Scholar]
- Birky, B.; Hilton, J.; Johnston, A.J. Phosphogypsum: Sustainable Management and Use, 1st ed.; IFA: Paris, France, 2016. [Google Scholar]
- Lloyd, M.; Stana, R. American Institute of Chemical Engineers—Central Florida Section. 2007. Available online: http://www.aiche-cf.org/Clearwater/2007/Paper1/7.1.3.pdf (accessed on 14 January 2018).
- Kovler, K.; Dashevsky, B.; Kosson, D.S. Purification of Phosphogypsum from 226Ra and Heavy Metals for Its Further Utilization in Construction: Technological Utopia or Reality? National Building Research Institute: Haifa, Israel, 2016. [Google Scholar]
- Pérez-López, R.; Macias, F.; Ruiz-Cánovas, C.; Migue-Sarmiento, A.; Pérez-Moreno, S.M. Pollutant flows from a phosphogypsum disposal area to an estuarine environment: An insight from geochemical signatures. Sci. Total Environ. 2016, 553, 42–51. [Google Scholar] [CrossRef] [PubMed]
- Räike, A.; Koskela, J.; Knuuttila, S.; Lehtoranta, J.; Pitkänen, H.; Risto, M.; Vuorinen, J. Joint Polish–Finnish Sampling of Surface Waters around the Phosphogypsum Waste Stacks in Gdańsk and Police from 1 to 3 July 2013; Finnish Environment Institute: Helsinki, Finland, 2015. [Google Scholar]
- Sones, M. Arutz Sheva 7, Israel National News. 2017. Available online: http://www.israelnationalnews.com/News/News.aspx/238800 (accessed on 15 January 2018).
- United States Environmental Protection Agency. United States Environmental Protection Agency, Mosaic Fertilizer, LLC Settlement. 1 October 2015. Available online: https://www.epa.gov/enforcement/mosaic-fertilizer-llc-settlement (accessed on 15 January 2018).
- European Food Safety Authority. Cadmium Dietary Exposure in the European Population; EFSA: Parma, Italy, 2012. [Google Scholar]
- Jenssen, T.K.; Kongshaug, G. Energy Consumption and Greenhouse Gas Emissions in Fertilizer Production; Academic Press Limited: London, UK, 2003. [Google Scholar]
- Collin, M. A way to Improve Performances of Classical Phosphoric Acid Production Processes. In Proceedings of the CRU’s Phosphates 2017, Tampa, FL, USA, 13–15 March 2017. [Google Scholar]
- European Fertilizer’s Manufacturers Association (EFMA). Production of Phosphoric Acid, Booklet No. 4 of 8, Best Available Techniques for Pollution Prevention and Control in the European Fertilizer Industry; EFMA: Brussels, Belgium, 2000. [Google Scholar]
- Theys, T.; van Lierde, N.; Wavrei, A. Water management in phosphoric acid: A processes comparison. Procedia Eng. 2016, 138, 472–480. [Google Scholar] [CrossRef]
- Heat Recovery—Efficiency at Any Price? Proceedings of COBRAS 2015 Congresso Brasileiro de Acido Sulfurico. Published on 26 October 2015. Available online: https://www.slideshare.net/Cobras2015/heat-recovery-efficiency-at-any-price-cobras-2015 (accessed on 15 January 2018).
- European Sustainable Phosphorus Platform. Outotec steam dryer. Scope Newsl. 2015, 116, 11–12. [Google Scholar]
- Bigalke, M.; Ulrich, A.; Rehmus, A.; Keller, A. Accumulation of cadmium and uranium in arable soils in Switzerland. Environ. Pollut. 2017, 221, 85–93. [Google Scholar] [CrossRef] [PubMed]
- Roberts, T.L. Cadmium and Phosphorous Fertilizers: The Issues and the Science. Procedia Eng. 2014, 83, 52–59. [Google Scholar] [CrossRef]
- Collin, M. Uranium Extraction from Phosphoric Acid: The Experience of Prayon. In Proceedings: International Fertiliser Society; International Fertiliser Society: London, UK, 2015. [Google Scholar]
- Valkov, A.; Andreev, V.; Anufrieva, A.; Makaseev, Y.; Bezrukova, S.; Demyanenko, N. Phosphogypsum technology with the extraction of valuable components. Procedia Chem. 2014, 11, 176–181. [Google Scholar] [CrossRef]
Figure 1.
Global material extraction vs. global metabolic rates during 1900–2005 (source: UNEP-IRP, Decoupling natural resource use and environmental impacts from economic growth [2].
Figure 1.
Global material extraction vs. global metabolic rates during 1900–2005 (source: UNEP-IRP, Decoupling natural resource use and environmental impacts from economic growth [2].

Figure 2.
Sustainable Development Goals [5].
Figure 2.
Sustainable Development Goals [5].

Figure 3.
Outline of a Circular Economy, (source: https://www.ellenmacarthurfoundation.org/circular-economy [6].
Figure 3.
Outline of a Circular Economy, (source: https://www.ellenmacarthurfoundation.org/circular-economy [6].

Figure 4.
Planetary boundaries [7].
Figure 4.
Planetary boundaries [7].

Figure 5.
Historic phosphate fertilizer consumption in developed (grey) and developing countries (blue) [14].
Figure 5.
Historic phosphate fertilizer consumption in developed (grey) and developing countries (blue) [14].

Figure 6.
Historic fertilizer prices, 1960–2012 [14].
Figure 6.
Historic fertilizer prices, 1960–2012 [14].

Figure 7.
Fertilizer processing routes and corresponding products [18].
Figure 7.
Fertilizer processing routes and corresponding products [18].

Figure 8.
Phosphogypsum stack in Huelva, Spain—closed since 2010 (Source: Mesa de la Ria).

Figure 9.
LCA normalization of baseline for average P fertilizers sold in Germany [18].
Figure 9.
LCA normalization of baseline for average P fertilizers sold in Germany [18].

Figure 10.
Global warming potential increase by the net energy effort for cadmium removal by calcination (rock decadmiation) or solvent extraction (acid decadmiation) [18].
Figure 10.
Global warming potential increase by the net energy effort for cadmium removal by calcination (rock decadmiation) or solvent extraction (acid decadmiation) [18].

Figure 11.
Human toxicity potential decrease due to cadmium removal by calcination (rock decadmiation) or solvent extraction (acid decadmiation) [18].
Figure 11.
Human toxicity potential decrease due to cadmium removal by calcination (rock decadmiation) or solvent extraction (acid decadmiation) [18].

Figure 12.
Prayon DA-HF process flow sheet [28].
Figure 12.
Prayon DA-HF process flow sheet [28].

Figure 13.
Sankey diagram of heat flows from sulfur conversion [31].
Figure 13.
Sankey diagram of heat flows from sulfur conversion [31].

© 2018 by the authors. Licensee MDPI, Basel, Switzerland. This article is an open access article distributed under the terms and conditions of the Creative Commons Attribution (CC BY) license (http://creativecommons.org/licenses/by/4.0/).
Share and Cite
MDPI and ACS Style
Hermann, L.; Kraus, F.; Hermann, R. Phosphorus Processing—Potentials for Higher Efficiency. Sustainability 2018, 10, 1482. https://doi.org/10.3390/su10051482
AMA Style
Hermann L, Kraus F, Hermann R. Phosphorus Processing—Potentials for Higher Efficiency. Sustainability. 2018; 10(5):1482. https://doi.org/10.3390/su10051482
Chicago/Turabian StyleHermann, Ludwig, Fabian Kraus, and Ralf Hermann. 2018. "Phosphorus Processing—Potentials for Higher Efficiency" Sustainability 10, no. 5: 1482. https://doi.org/10.3390/su10051482
Note that from the first issue of 2016, this journal uses article numbers instead of page numbers. See further details here.