Is Fish Farming an Illusion for Lake Malawi Riparian Communities under Environmental Changes?


1
Faculty of Landscape and Society, Department of International Environment and Development Studies (Noragric), Norwegian University of Life Sciences, P.O. Box 5003, N-1430 Ås, Norway
2
Department of Fisheries and Aquatic Sciences, Mzuzu University, Private Bag 2, Luwinga, Mzuzu, Malawi
3
Faculty of Biosciences, Department of Animal and Aquacultural Sciences, Norwegian University of Life Sciences, P.O. Box 5003, N-1430 Ås, Norway
*
Author to whom correspondence should be addressed.
Sustainability 2018, 10(5), 1453; https://doi.org/10.3390/su10051453
Submission received: 29 March 2018
/
Revised: 1 May 2018
/
Accepted: 2 May 2018
/
Published: 7 May 2018
Abstract
:Global environmental changes have negatively affected many food systems while the demand for food has continued to rise. An urgent need exists to identify other sustainable means of producing food. This is a case in Malawi, where capture fisheries and agriculture are not supplying sufficient food. Fish farming food systems by communities who rely on inland fisheries have not been evaluated. Therefore, a study was conducted in two phases: January 2016 to May 2016 and in July 2017 to evaluate if fish farming could sustainably support livelihoods of Lake Malawi riparian communities. We used mixed methods to collect and analyze data. The data collection methods included explorative surveys, household survey interviews, focus group discussion and key informant interviews. Qualitative data was analyzed using content analysis for themes. This identified themes that were quantitatively analyzed using descriptive and inferential statistics. We observed that fish farming was dominated by men and also not the main occupation for the respondents despite owning fishponds. The respondents have water and land, which are prerequisite for any farming. The study also observed fish farming production challenges related to quality fingerlings, formulated diets, and extension services. Cases of food insecurity amongst the respondents were also prevalent due to lack of food to cover the entire year. Weak synergies existed between fish farming and agriculture restricting bio-resource flow and water usage between these two food systems, meaning the outcomes of the food systems provide unsustainable diets. Furthermore, water availability, money spent on food, and cassava cropping increased fish farming participation. Whereas operating a bicycle taxi, casual labor, former fish farming, as well as application of agricultural wastes negatively affected fish farming. On the other hand, extreme weather events (increased incidences of droughts and floods) attributed to inter annual rainfall variation also negatively affected fish farming. The responses from Lake Malawi riparian communities indicate that they merely look upon fish farming as an alternative to capture fisheries than as an illusion. Nonetheless, the research provides a theoretical platform to explore the potential to develop sustainable fish farming food system adapted to such changes. Therefore, we have brought new evidence that progress of fish farming in Malawi is being made, but there is a long way to go before it can be considered successful and sustainable.
1. Introduction
Global environmental changes challenge achieving sustainable development goals. For instance, global environmental changes derail achieving global food security, which is an outcome for many food systems [1]. Continuous exposure to global environmental changes renders many households vulnerable and unable to attain sustained livelihoods. Therefore, in order to devise ways to enhance livelihoods, there is need to understand available food systems and their role in providing livelihoods.
One such food system, which is less understood, is Lake Malawi, a home of 500–1000 endemic fish species [2]. This lake is super rich as it has many fish species compared to other lakes in the world. The lake provides many ecosystem services to communities around it [3,4,5]. It is the small scale fishers who mostly do the fishing and the majority of them use traditional fishing methods [6]. The majority (90%) of annual fish catches in Malawi are mostly from these small scale fishers [5].
Despite such attributes of Lake Malawi in providing ecosystem services, edible fish catches have decreased in the last three decades resulting into reduced consumption from 14 kg per year in 1970s to 4 kg in 2005 [7]. This picture is also similar at a global level [8,9,10]. Such low fish supply calls into question whether Malawi’s fish still provides a cheaper source of animal protein compared to other livestock groups [5]. From an economic point of view, as the fish supply decreases, the demand goes up and in doing so the prices go up too. The decrease of fish diversity results in some species rarely being caught [3] and many also being categorized in the IUCN Red List as threatened towards extinction [11]. Fish eating habits have also changed as species which used to be considered inferior, like the ornamental species, are now considered edible [12]. Furthermore, climate projections for Malawi show increased temperatures and low precipitation [13,14], even though there is lack of research on how Malawi fisheries are directly affected by extreme weather events, but we could as well say, fisheries might equally be affected. This is because climate directly affects fish production and distribution [15,16,17].
Low fish catches render the fisheries food system unable to provide sustainable diets because fish is an essential source of nutrients recognized in most national dietary guidelines [18,19,20]. Despite low fish catches, the communities around Lake Malawi continue to exploit the waters due to few options for pursuing other livelihood sources. The coping mechanisms which have been employed by the majority of the fishers are not sustainable and do not conform with the FAO code of conduct for responsible fisheries [21]. These include use of non-selective fishing gears [3] and cultivating closer to the buffer zones of rivers, causing siltation, which affects breeding grounds for many fish species [22,23]. This behavior leads to catching more fish beyond the maximum sustainable yields. Therefore, mitigating for such uncertainties is important as it builds resilience of the people who live around Lake Malawi [24].
Unsustainable fishing is attributed to population increase and movement of people from other food systems which are also under immense pressure [5,25]. Lake Malawi is an open resource where anyone can just walk in and start fishing. In addition, the regulations set by the government in collaboration with the local communities have failed to yield positive behavior changes, as people need to survive [26]. However, this has led local communities to suffer most because their livelihoods are centered around fish.
Therefore, this calls for a holistic assessment of other food systems that could be promoted to support the livelihoods of Lake Malawi fishers. This might ease the fishing pressure being exerted on the already overfished resource. Malawi fishers migrate between agriculture and fisheries as major livelihood sources [27]. Nevertheless, just like fisheries, the Malawi agricultural sector has also been experiencing continuous low crop yields [28,29]. Global environmental changes is among the factors impacting Malawi’s agriculture because of over-dependence on rainfall, which is characterized by erratic, late onset, early cessation, and low intensity [30,31].
While other food systems have failed to enhance food security of the fishers, fish farming in Malawi improves resilience against food and income shocks when agriculture is impacted by extreme weather events. Furthermore, there has been a great deal of integration between agriculture and fish farming, which benefits both food systems [32]. Since most fishers in Malawi possess agricultural land, fish farming could be a solution to enhance sustainable diets [3,25,27].
In Malawi, fish farming has been practiced for over 100 years [33], but its impact as a food system to people who fish in Lake Malawi as a source of livelihood is not known. Yet, globally, aquaculture is the fastest growing food producing sub-sector [34]. Indeed, the total global supply of fish from aquaculture is projected to increase from 154 million tons in 2011 to 186 million tons by 2030 [35]. However, for many countries, aquaculture development and its uptake has been stagnant despite its potential to reduce income- and food-vulnerabilities [36,37,38,39]. Adopting fish farming as an outright coping mechanism requires understanding its implications for riparian communities.
Information on suitability of fish farming for people who rely on inland capture fisheries is scant. Therefore, the goal of this study is to provide information to understand the status of fish farming with a specific focus on how it could work as a livelihood strategy for small-scale fishers. Specifically, the research has the following objectives: (a) to assess the socio-economic characteristics of the existing fish farmers; (b) to assess the status of fish farming food system; (c) to analyze the impact of extreme weather events on fish farming and; (d) to assess food systems outcomes.
2. Fish Farming in Malawi
In establishing the suitability of fish farming as a possible livelihood strategy for Lake Malawi fishers, there is a need to understand the context of fish farming. In Malawi, fish farming dates back to 1908 when brown and rainbow trout fish were reared for sport. However, small scale fish farming started around the 1950s in the northern region of Malawi as a response by the British Colonial Office to improve supply and nutrition in its colonies [33].
Ever since the introduction of fish farming in Malawi, the majority of fish farmers are still small scale whose fish are raised in earthen ponds utilizing natural productivity [6]. On the other hand, there is only one large scale aquaculture company in the southern part of Lake Malawi and it uses salmon cages to raise local species [40] cited in [6]. The common species cultured are Oreochromis karongae, Oreochromis shiranus, Tilapia rendalli, and Clarius gariepinus and most of these species are endemic to Malawi. These species have inferior growth rates and feed utilization compared to exotic species who are legally barred to be cultured in Malawi [6]. The local species can grow with very low inputs, this makes fish farming less intensive, but it affects the final nutrient quality of the fish.
Over the years, many development agencies have joined hands with the government to promote fish farming in order to enhance the welfare of poor farmers [33]. Its positive effects was an increase in fish ponds from less than 100 in the 1960s to over 7000 in 2005 [6].
Despite efforts from the government and non-governmental organizations (NGOs), fish from Malawi’s farms are still mainly for household consumption by the farmers themselves and the surplus is sold locally. The government’s support for fish farming is challenged by high vacancy rate in the Fisheries Department [41,42]. Additional, most fish farming efforts have failed to continue beyond the funding lifespan of developmental projects by NGOs and development agencies, keeping adoption very low [32]. Indeed, fish production remains lower than other developing countries, which started aquaculture long after Malawi [37]. Despite these setbacks, Malawi fish farming has the potential to improve income and food security [43].
The slow development of fish farming in Malawi has several factors, with institutional failures being a primary cause [41,42]. There have been many initiatives aimed at supporting fish farming, but these did not yield the projected benefits [32]. For instance, restoration of Oreochromis spp. stocks (important food fish) in major water bodies [44], has yet to be assessed in terms of impact. On the other hand, Malawi’s Presidential Initiative on Aquaculture Development (PIAD) that aimed to develop fish farming sector [45], failed to meet its target of 5000 metric tons of fish by year 2011. Currently, aquaculture production for Malawi is 3600 metric tons per year [5].
3. Conceptual Framework
In order to understand fish production and its interaction with other systems, the elements of food system approach were used [1,46,47]. Furthermore, food security [48], sustainable diets [19,20,49], and vulnerability frameworks [50] were also used to enhance the understanding of the food systems’ outcomes and their interaction effect with other aspects like the environment (Figure 1).
A food system is defined as a “chain of activities from the production to consumption with emphasis on processing and marketing and the multiple transformations of food that these entail” [1]. Food systems have been typified by Ericksen [46] as traditional and modern. Malawi fish farming fits well in the traditional category where “the supply chain is short and local, production systems are diverse and vary, labor is family based”. Furthermore, the food system concept is part of the systems approach, which open doors with respect to understanding complex interactions that govern a specific behavior towards attainment of food security [46].
Food security is another complex multidimensional concept that this study looked at. Food security is achieved when the following conditions are met “when all people, at all times, have physical and economic access to sufficient, safe and nutritious food to meet their dietary needs and food preferences for an active healthy life” [48]. This concept is dynamic and has three main pillars—namely food availability, food access, and food utilization. Food availability deals with production, distribution, and exchange. Whereas access to food comprised of affordability, allocation, and preference. Finally, utilization consists of three elements—nutritional value, social value, and food safety [46]. Food security is important, but that security needs to be developed in a sustainable fashion [19].
Therefore, the concept of sustainable diets is used in assessing the processes of food production. In order to understand sustainable diets, it is also important to realize factors which affect it, especially in food insecure areas like Malawi. Sustainable diets “are those diets with low environmental impacts which contribute to food and nutrition security and to healthy life for present and future generations. Sustainable diets are protective and respectful of biodiversity and ecosystems, culturally acceptance, accessible, economical fair and affordable; nutritional adequate, safe and health; while optimising natural and human resources” [20]. This concept is also complex and multidimensional as it touches many areas and it is difficult to measure and in most cases it is presented as a description of the food system [19]. However, Lairon [52] in applying the concept looked at how food is produced (low input agro-ecological food production); where is food being produced (local production and short-distance production-consumption nets) and food quality, culinary skills, dietary pattern, and nutrition education as some of the aspects which could be used to describe sustainable diets. Even though Béné et al. [53] showed how fish is important in feeding 9 billion people by 2050, the role of fisheries and aquaculture in sustainable diets is less investigated [18,54].
As much as fish farming has the potential to build food supply resilience, it has also been found to lower resilience in cases where it “relies on terrestrial crops and wild fish for feeds, its dependence on freshwater and land for culture sites, and environmental impacts associated to it” [55]. Therefore, promoting fish farming has to safeguard against such impacts. Other authors found out that despite the increase in global aquaculture production, fishmeal and oil needed in aqua feeds have remained stable—in some cases—it is projected to go down [56]. For Malawi, caution has to be taken because its aquaculture species rely on feed inputs, which compete with humans. However, many fish farmers in Malawi do not feed their fish with formulated diets. Furthermore, these farmers also struggle to feed fish with crop and animal residues due to lack of labor to collect these residues during the main farming season [57].
Despite being lowly intensified, fish farming might also be under similar threats of global environmental changes, which impact both capture fisheries and agriculture. Therefore, application of the vulnerability concept enables an evidence-based assessment which does not only focus on the final outcome but also on causal interactions affecting fish farming. Vulnerability is comprised of three elements—exposure, sensitivity, and adaptive capacity [50]. These components vary based on spatial and temporal scales [58]. However, these components are also affected by socio-economic factors, socio-cultural institution among others [59]. In this study, vulnerability is used to separate different drivers of change like climate and socio-economic transformations [47]. However, since fisheries has been failing to provide enough food due to different changes, and in that case it is considered to be vulnerable [46]. Should that also be the case with fish farming?
This study assumed linkages between environmental degradation [44] and food system activities [1,46,47] which has an impact on food security. This includes social welfare and the environmental security or natural capital which both affect and are affected by food security [48]. This emphasizes the need to move away from just looking at the impacts of climate change on food production to also include how it can reduce the causes of climate change [1].
4. Materials and Methods
4.1. Study Site
The study was conducted in Nkhotakota (Figure 2), a district located on the western shores of Lake Malawi, between two phases (January 2016 to May 2016 and July 2017). Lake Malawi is shared by three countries—Malawi, Tanzania, and Mozambique. Nkhotakota is located in the central region of Malawi and is 200 km North East of Lilongwe, the capital city of Malawi. The district has two climate seasons: the wet season, which spans between November and April; and the dry season that spans between May and October. Nkhotakota’s annual rainfall varies between 860 mm and 1600 mm while the average monthly maximum and minimum temperatures are 28.7 °C and 20 °C respectively [60].
The majority of Nkhotakota’s inhabitants are small scale fishers [60], who use different types of fish catching equipment and catch different types of fish [61]. However, fish catches in Nkhotakota have been fluctuating and some major species are rarely caught these days [3]. Despite having small land area, the people of Nkhotakota are also engaged in agriculture. On the other hand, big chunks of the land in Nkhotakota is used for sugar cane cultivation by commercial companies and the other parts are reserved for game and forests [60].
Nkhotakota is a climate change hot spot due to global environment changes impacts. For instance in April 2018, there were many flash floods which destroyed crops and property [62]. These were caused by the El Niño-Southern Oscillation (ENSO) circulation patterns [63]. Despite Nkhotakota being a climate hotspot, there is lack of research on how these changes have affected livelihoods of local communities. Therefore, there is a need to investigate other sustainable livelihood sources that could be appropriate for such communities. Of course, there have been climate related studies on agriculture [64,65] and fisheries [3] in Nkhotakota, but these studies lacked aspects of interaction with other livelihood sources. For instance, Russell et al. [6] reported that Nkhotakota had fish farming activities, therefore it will be important to look at its interaction with agriculture while devising ways of scaling it up as a livelihood source.
4.2. Data Collection
To explore the status of fish farming and its suitability as a livelihood source in Nkhotakota, we used mixed sampling methods [66,67] to collect and analyze data. These methods included an exploratory survey, which was conducted to contextualize the research within the study area. During the explorative survey, we visited farming households to appreciate the level of fish farming technologies and facilities in use. Furthermore, we had open-ended interviews [68] with the fish farmers, fish farming clubs, village development committees, fisheries department, and NGOs. This involved asking questions related to: livelihood sources and food security; the status of fishing farming and challenges being faced; common extreme weather events for the area and their impact on livelihoods.
Most of the responses from the exploratory survey were used to develop research tools for the quantitative household survey (Supplementary Materials). We used a semi-structured questionnaire adapted from Andrew et al. [69] to collect information on: household composition and structure; access to and use of land and natural resources; household livelihoods and wealth indicators; food security; fish farming activities; climate change risks; perceptions on climate and ecosystem changes and analysis of adaptation measures to climate change. Forty-seven (47) fish farmers (pond owners) were randomly sampled [70] for household interviews from those engaged in fish farming.
As a follow up to household surveys and exploratory interviews we also conducted focus group discussions and key informant interviews. The participants to these were purposively sampled. This enabled collection of in depth information from a small number of cases carefully selected and fit the phenomena under study through open-ended questions [66,68]. These methods helped to probe the respondents and to interpret data by seeking answers on how and why questions. Ten (10) focus group discussions were conducted with fishers, beach village committees, fish traders, lead farmers, fish farmers, and fish farmers’ clubs. These groups were separated by gender to enable women contribute freely to the discussions [29]. Additionally, we also conducted five (5) key informant interviews with extension agents, lead farmers, government officials, and NGOs to understand fish farming. The use of different methods increased the validity and reliability of the findings as it enabled triangulating the sources of information, which provided depth and breadth of the context under study [66].
4.3. Data Analysis
Qualitative data was transcribed, translated to English and then analyzed using content analysis for themes [71]. Content analysis involves coding the data to get initial themes, which are reviewed and named based on data patterns. In order to express the sentiments of different groups of people interviewed, we also used direct quotations in some cases to support the results.
Household survey data was analyzed using descriptive statistics (frequencies, means, range, and proportions). Furthermore, we used inferential statistics (Independent sample t-tests at a 5% confidence interval) to test the significant differences between water usage in irrigation and fish farming. We also used Pearson and Spearman correlations to assess factors that affected participation in fish farming. Despite the small sample size for the quantitative household surveys, which could have presented limitations in robust statistical analysis, we used qualitative results to support the outcomes [66].
5. Results
5.1. Context of the Study Area
5.1.1. Socio-Economic Factors
Table 1 summaries the characteristics of the respondents that have implications on achieving sustainable diets from fish farming food systems. The majority (98%) of the sampled respondents were men and these were the ones who owned fishponds. This might entail labor demands in conducting food system activities, land ownership processes, and how the innovations were diffused to the respondents. The results also show that none of the respondents had fish farming as a major food system suggesting that it supplemented other systems like agriculture.
Table 2 shows other socio-economic characteristics of the respondents. The average age of the respondents and time stayed in the area were 43 and 36 years respectively. This suggests that many of the respondents were born in the study area and this affected land ownership, which is one of major factors of food production where food systems activities are conducted.
The average education years was low suggesting difficulties in understanding the basic biology required in both agriculture and fish farming. These results further showed that the respondents possessed large land holding sizes, suggesting availability of land for agriculture and fish farming. Despite having large land holding capacity, the average household sizes were small. This illustrates low family labor availability for farming activities because farming was not mechanized, but relied on human labor.
5.1.2. Land Quality and Crops Grown
A large proportion (67%) of the land was cultivated and the mean of cultivated land was 12,383 m2. Table 3 shows land quality as a function of soil quality [69]. Most households (96%) had a field for agriculture, with soil quality ranging from good and excellent. These results imply availability of good quality land for venturing into different types of farming.
The respondents practiced mixed cropping and the proportion of the total farmed area under different crops was: summer maize (39%), winter maize (8%), cassava (15%), rice (12%), sweet groundnuts (12%), potatoes (6%), pigeon peas (6%), and vegetables (2%). Of these crops, rice was the only crop which was grown for sale while the rest were for household consumption. At the same time, processing of the harvest did not involve any value addition. The high diversity of crops grown suggests well balanced diets and good nutrition in the study area. The growing of many crops also could be an indication of livelihood diversification in cases where other crops fail. The many crops also entail a good pool of agricultural residues that could be used to fertilize agricultural fields or fishponds. Recycling of wastes further entails how sustainable the food systems were.
5.1.3. Water Availability
The growing of many crops could entail availability of water and land to drive the food system. Furthermore, water availability is both crucial in agricultural and fish farming food systems just like land. The study showed that all respondents had access to water for agriculture and fish farming. The water sources included: furrow from a river (40%), ground water seepage (30%), furrow from a spring well (17%), and from a shared irrigation furrow (4%). However, water flow was variable due to less rainfall (57%), evaporation (18%), low stream flow (11%), seepage from furrows (11%), and competition between users (3%). The competition in water usage suggests that food production did not follow the sustainable diets concept.
During the qualitative interviews when we probed on the water usage competition from a focus group discussion at Site A on 15 May 2016. We were informed that, due to extensive rice production and the need for each farmer to maximize rice production, some farmers had channeled the water to the rice fields without considering other farmers who also wanted the same water for farming. However, keeping stagnant water in rice fields also increases production of methane which is a greenhouse gas that influences global environmental changes.
While that could be an isolated case which might not reflect the entire study area, another key informant interviewed at Site B on 31 March 2016 had to say this “I have plenty of water and land for any land based farming operation, however the only lacking thing is capital to expand my farming activities”.
The annual water availability showed significant differences between water usage for irrigation and fish farming (t (11) = −13.4, p < 0.001). Water flow for irrigation and fish farming decreased between June and January (Table 4). Still, the majority of respondents (87%) cited having enough water to support expansion of fish farming and agricultural activities. There was equal preference for expanding agriculture through irrigation and fish farming. This suggests how these food systems were important to the respondents’ livelihoods, despite none of them citing fish farming as a major food system.
5.1.4. Livestock Ownership
Water availability also determines types of livestock suitable for the study area. Table 5 shows livestock ownership in the study area. Livestock were used to provide food and income to the respondents. Although water was available, the results revealed that the study area does not have many livestock types and some households did not own livestock. Even though there were less livestock, the majority (72%) of the respondents had access to grazing lands. The grazing lands belonged either to the community (46%) or individuals (54%). These results have implications on the availability of cheap animal protein sources and animal wastes being generated for agricultural fields and fishponds fertilization. The low number of livestock also meant that low production of greenhouse gases that has an impact on global environmental changes.
Having noted the importance of the livestock component in both agricultural and fish farming food systems, we further probed during the focus group discussions on the reasons why the area had few types of livestock and what was the role of livestock in their lives. It was noted that some types of livestock for example were not kept due to religious beliefs as the study area had a large number of Muslims. Furthermore, the study showed that small stocks (goats, chicken, and sheep) were easy to keep because they did not require many production inputs. However, these were also suitable for very hot weather as perceived in the study area. While investing in cattle was hard for the respondents due to lack of extra income to purchase the livestock and to pay for labor services of cattle herders.
5.2. Fish Farming Food System
5.2.1. Fish Farming Objectives and Division of Labor
The study showed that the main objective for fish farming by all respondents was mainly for food with a possibility of selling surplus fish produced. The respondents were first involved in fish farming by self-motivation (54%), often by fish farming project incentives (39%) and occasionally through inheritance (7%). The fish farming food system’s activities were dominated (92%) by household heads who happened to be men.
Most respondents (83%) were still involved in fish farming 20 years after adopting the innovation. However, some respondents (17%) had stopped fish farming due to no source of fingerlings (39%), low water levels (35%), lack of profits (13%), and flooding which damaged their ponds (14%). These results reveal challenges with the food system activities. Whereas low water levels and flooding were related to the effects of global environmental changes. However, the identified bottlenecks for the fish farming food system activities offered business opportunities for potential investors in supplying fingerlings and fish marketing solutions.
During the qualitative interviews with inland fishers and the beach village committees on why they were not involved in fish farming, one participant cited that:
We are everyday cash people with exceptions when our fishing nets are damaged or if the south easterly winds are persistent. We do not have the patience of waiting for more than six months for the fish to mature in fishponds. It is also better to venture into agriculture, because it is very difficult to be sure, if our fish are in the ponds or they have been either stolen or died. Secondly, fish farming requires a lot of education which most of us do not have.
This suggests that adoption of fish farming by such groups of people might not be easy because of such perceptions.
5.2.2. Organization of Fish Farmers
Most fish farmers (81%) were members of fish farming clubs. Fish farming clubs are comprised of farmers who own at least a fishpond and are hardworking, trustworthy, reside in villages closer to each other, and have the ability to pay entry and annual subscription fees. The clubs have governance structures that are elected annually. Furthermore, the clubs were entry points for any fish farming related development initiatives. The benefits of joining a fish-farming club were easy access to: loans, extension services and advice, fish markets, labor when digging the ponds, cleaning, feeding, and harvesting. While for old club members, the club was a platform for sharing lessons learned in fish farming. These results suggest that even if farmers had individual ponds, but the food system activities were influenced by their group dynamics.
During a focus group discussion with a fish farming club members, the governance committee emphasized that:
Being a member of the fish farming club has improved our livelihoods by expanding sources of income and food. The income has also enabled timely payment of school fees for our children and we expanded our farming activities.
5.2.3. Land Allocation to Ponds and Cost of Digging Ponds
The fish farmers had variable fishpond sizes. The majority (72%) of the fishponds were less than 900 m2 while some (21%) ranged between 1000 and 6400 m2. This also applied to the number of fishponds per farmer, with some (34%) having two ponds, others (15%) having three ponds, and half (51%) of the respondents having one pond. In comparison with agricultural food system, the total land invested in fish farming was 13 times less. The average cost (US$54) for constructing a fishpond using combined family and fish farming club labor was six times less than those who engaged hired labor (US$341). Most of these ponds were self-constructed (57%), inherited (25%), project constructed (11%), and constructed with paid labor (2%). These fishponds were constructed between 1989 and 2016 and the common culture methods were monoculture (75%) and polyculture (25%). The culturing methods illustrated a certain level of sustainability and maximized usage of production inputs within the different food systems in the study area.
5.2.4. Common Fish Species Stocked
The common cultured and preferred fish species were: Oreochromis shiranus (54%), Oreochromis karongae (26%), Tilapia rendalli (10%), and Clarius gariepinus (10%). These species were preferred because of having: good flavor, simple diet, early maturation, fast growth rate, low mortality rate, and high reproduction rate. Despite accessing fish fingerlings from other farmers, self-production, NGOs, and the Fisheries Department, the respondents had challenges in accessing fingerlings for all the preferred species. Only one farmer was producing fingerlings in the study area and in 2015, he sold 300 fingerlings to fellow farmers at US$0.04 each.
5.2.5. Fish Feeding
Fish feeding is an important food system activity. Therefore, stocking quality fingerlings without feeding them could have negative effects on the final product. The majority of respondents fed their fish with maize bran (84%) and some with rice bran (9%). On the other hand, some (24%) used cassava wastes. Fishponds’ primary productivity was also boosted with organic manure (77%). The manure sources were goat (61%) and chicken (12%) droppings. In addition to crop and animal by-products, some respondents (6%) also provided mineral premixes to their fish. These feeding schemes suggest that sustainable ways of recycling residues were being practiced. Despite less mineral supply to the fish, none of the farmers cited fish-disease outbreaks. These results further illustrate that fish health was not affected by a lack of formulated diets or any other supplementary feeding.
5.2.6. Fish Harvesting
When harvesting fish, all farmers did not drain the ponds due to water problems. Fish were harvested at different times. Half of the farmers (51%) harvested the fish after a complete growing cycle (6–9 months); while others (24%) had no specific harvesting roster, some harvested monthly (22%) and weekly (2%). These methods suggested that different fish sizes were harvested as a response to either market demand or household consumption or different stocking times or different maturation times for the cultured species.
5.2.7. Fish Marketing
For the question “Does the price that you receive for the same weight of small and large fish differ when you sell your fish?” the responses were yes (64%), no (7%), and I do not know (27%). The respondents’ fish sales between 2011 and 2016 showed that most of the fish produced were sold at the local market. The reasons given for selling the produce at a local market were proximity to farm (69%), direct cash payment (17%), better prices (11%), and encouragement from NGOs (3%). The distances to the local markets ranged from one to five kilometers and the average transportation cost to the nearest market was US$0.30. Despite selling fish locally, the fish farmers also suffered multiple problems: low fish price (69%), long distance (8%), late payments (3%), and conflicts within the farming club (3%). Selling fish locally entailed improved sustainable diets by optimizing taste and flavor. The average fish price per kilogram between July 2015 to June 2016 was US$0.60. The outputs from the fish farming food system were fresh fish and fertilized water used for agricultural activities. Furthermore, no value addition—i.e., packaging or preservation of the fish—was done, suggesting that the fish retained all their nutrients. As shown from the results, by the time fish were harvested the farmers might have consumed or sold most of the fish. This further illustrates availability of animal protein to the households and their kinship involved in fish farming.
5.2.8. Fish Farming Cost Structure
The major costs related to fish production were feed (86%), labor (9%), construction and maintenance of the fishponds (5%). Evaluating these costs was partially done by examining fish farming records kept by half of the fish farmers. However, the majority (89%) of the records were poorly maintained with a lot of missing information. This might be a result of respondents’ low education levels. These results suggest that calculating profitability could pose a challenge due to a lack of records, however, the main purpose of fish farming was not entirely profit oriented.
5.2.9. Fish Farming Technologies Adoption and Dissemination
Despite low education levels and lack of proper record keeping, the respondents had adopted many fish farming technologies. These included: integrating agriculture and fish farming, direct feeding with formulated diets, direct feeding (maize bran, cassava wastes, and vegetables), cleaning the ponds after harvest, use of polyvinyl chloride (PVC) pipes as water inlet and outlet, use of ash as a buffer system, and using fast growing fish species like O. shiranus. Diffusion of fish farming was passed through multiple channels, but most respondents (67%) accessed it from extension agents. The average contact time of farmers with extension agents was 1.66 times per month. To supplement visits by extension agents, lead farmers were also acting as role models to other farmers. Lead farmers advised fellow farmers on fish production and securing better markets. About half of the respondents (45%) had been in touch with a lead farmer. Lead farmers were selected based on: nomination and voted by fellow farmers at the fish farming club; possession of a fish farm and being knowledgeable about fish farming; good level of education and training in fish farming. During key informant interviews, extension agents cited facing the following challenges:
… there is lack of funding for us to do activities such as offering business and general fish farming lessons; there is no transportation for us to travel long distance to the fish farmers from where we are based; and we are few extension workers to cover many potential and existing fish farmers.
These results suggest that the extension agents were not motivated to work hard as their working conditions were poor. During another focus group discussions, fish farmers cited the following on how dissemination of fish farming information have improved their fish farming:
Much as we want to be visited more often by the agents. However, with the little information they gave us we managed to generate a lot of profits, what more if we had more information.
5.2.10. Factors Affecting Fish Farming Participation
Table 6 summarizes factors which affected fish farming. Water availability, money spent on non-staple foods, area planted with cassava, buying staple food in December, and the amount of fish partially harvested at one time increased participation in fish farming. Whereas operating a bicycle taxi, being a former fish farmer, amount of compost and rice bran applied to the fishponds, and providing casual labor in October reduced the probability to participate in fish farming. These results suggest that most of the significant factors had a direct implication on the productivity of the food system.
Furthermore, the qualitative interviews also revealed some factors, which might have influenced participation in fish farming. During the focus group discussions and key informant interviews, we gathered the following overview on factors affecting fish farming participation:
… yes we are fish farmers, but we also have successes and challenges when culturing the fish, the important successes include availability of fish throughout the year, we are not worried or concerned by hash weather conditions affecting the fishers at the lake; furthermore, we can irrigate winter crops with the water from the ponds. Our challenges include in some cases, drying up of the ponds due to poor workmanship during construction and extreme hot temperatures; sourcing of quality fish seeds is not easy as certified hatcheries are very far away; and cheap formulated diets …
On the other hand, we also provide a summary of a key informant interview with a female fish farmer.
… fish farming is good because we don’t have to worry about food throughout the year, however as a woman I am challenged because fish farming is labor intensive, especially during pond construction and harvesting; therefore, I have to hire paid labor …
The results for the qualitative and quantitative interviews have revealed multiple factors affecting the fish farming food system at production level. Despite the differences in the significant factors between the two methods, all the factors are important in enhancing productivity of the food system. The study can only attribute such disparities to a small sample size for the quantitative part, which was however supported by qualitative interviews.
5.3. Effects of Perceived Extreme Weather Events on Fish Farming
The study observed through qualitative interviews that some extreme weather events were directly affecting fish farming. Those observations were confirmed through household survey, where most fish farmers (89%) experienced significant changes in weather patterns between 2000 and 2016, compared to the 1980s and 1990s. The extreme weather events included increased incidences of drought (47%), late rainfall (40%), floods (6%), dry spells (4%), and extreme temperatures (2%). However, in the past five years (2010–2015), some respondents (58%) were exposed to these events in 2015 compared to 2% in 2013. While in the last 20 to 30 years, the exposure to rainfall has been erratic (37%), late onset (41%), poor distribution (20%), and early onset (2%).
The study revealed that, in general, the common impact of the extreme weather events included crop damage, livestock loss, loss of biodiversity, and low fish catches. Whereas the specific effects to fish farming observed by the majority (75%) of fish farmers included death of fish, low fish yields, drying of ponds, high water temperatures, and lack of natural food for the fish. These results suggest extreme weather events are a force to reckon in fish production.
5.4. Food System Outcome
Although the study has revealed that both fish farming and agricultural food systems are facing challenges, however these are better placed because the farmers can influence the production unlike in the capture fisheries ecosystem. The main outcome of these food systems was supposed to be food security. Therefore, in assessing the annual availability and utilization of food consumption by the respondents, the study showed that most (60%) of the respondents had enough food, whereas some (7%) lacked proteins only, some (13%) also had no staple food and some (20%) did not have enough food throughout the year (Table 7). These results reflect that being involved in either fish farming or agricultural food systems did not always result in producing enough food for consumption.
However, the annual food availability varied between the main foods groups (proteins and carbohydrates). For instance, lack of proteins within the year ranged from 2% to 15%. This might be because of fish farming adoption, as the respondents did not have challenges in accessing proteins. The results also reveal that the critical months where households lacked food were between December and March. During these months between 44% and 72% of the households bought staple foods.
5.5. Household Income and Expenditure
Table 8 indicates that a large proportion of income was generated from crop sales (60.1%) and most of it was spent on food (51%). Despite fish sales contributing (10%) to the annual income, the respondents also bought fish for consumption. These results suggest that income for the respondents was centered on the agricultural and fish farming related food systems.
6. Discussion
6.1. Socio-Economic Factors
Socioeconomic factors are an important aspect of any food system’s outcomes. These factors also drive the necessary feedbacks and interactions with other components of the food system. By the respondents not having their main occupation as fish farming it had some implications on the study area’s food system. Furthermore, despite all the respondents owning fishponds and having water, they were not full time fish farmers. The fish food system was dominated by men (98%), and this suggests labor intensive activities, especially during constructing of fishponds, fish harvesting, and pond cleaning. Although these results are consistent with other studies in Malawi [43], it was surprising that few women were involved in fish farming despite being custodians of the land due to a dominant matrilineal system [72]. However, access and ownership of farming land in the study area was not a problem. This could be attributed to the household head’s age and the amount of time having stayed in the area. In other areas in Malawi, land can be accessed through either inheritance or granted by local leaders or purchased [73]. The majority of the fish farmers were married; and being in such a marital status might have a potential to improve labor availability for farm activities even though their household sizes were small. Another factor, which has an impact on farming activities, is level of education [74]. In this study, the average level of education was very low. This might have a negative impact in adoption of innovations like fish farming which represents a complex food system.
Complexity of fish farming could be the reason the majority of the respondents were into agriculture. This was also confirmed in the qualitative interviews, and is reflected in the major income sources. However, the low proportion of fish farming incomes to the total annual income were within the range (1–17%) that has been reported for Malawi [69]. However, these results might not be good enough to encourage adoption of fish farming as a business [38,69] but as a necessary food system in enhancing food security.
6.2. Fish Farming Food System
Although fish farming contributed low income to the respondents. Its adoption was consistent to findings reported by Hecht and Maluwa [41] and Russell et al. [6] in Malawi and Brummett et al. [75] in Cameroon. These results indicate that no new development players have been promoting fish farming except for the government and NGOs. This might be attributed to some adopters discontinuing it due to lack of inputs to enable them to execute several food system activities.
Lack of inputs like fingerlings could be a reflection of small sized fishponds, despite having large land holding capacity. The mean sizes of the earthen ponds were lower than the recommended size for maximizing production (1000 m2) in Malawi [76]. These results reveal opportunities to use fingerlings from the wild as the farmers are closer to Lake Malawi than where certified hatcheries are located. Use of fingerlings from the wild has been reported to be profitable [77].
Another trait of importance which could lower mortalities is high disease resistance in the cultured species despite no mineral supplementation. This could be attributed to species hardness [32] and low stocking densities [78,79] among other factors not explored in this study. On the other hand, one of the cultured species (Tilapia rendalli) can grow with less food, making it a candidate for fish farming to farmers who cannot afford feeds [80]. This could also be true for the other species cultured in the study area [32].
Culturing of different species could be the reason farmers had varied harvesting times, while this shows these species were sustainably using different food available in pond environment [81]. This also could be an indication that farmers were using their farms, as safety nets when food and income were needed urgently [69]. Although this practice makes it difficult to calculate profits, it could be viewed as a sustainable livelihood strategy. Partial harvesting also enabled the fish farmers to supply different market segments with different fish sizes. However, leaving fish to continue growing entailed incurring more production costs [82], as revealed in this study. This could be true if animal and crop residues applied to the ponds were being bought or costs were incurred in transporting them from their source. The use of animal wastes improves pond fertilization more than crop residues [83].
High fish farming costs could be also a reflection of the process of diffusion of innovation. The drivers of such a process are extension agents [74], and with less visits by extension agents, high costs are expected. Furthermore, packaging of extension messages plays a big role in adoption of an innovation [29] and it is affected by the level of education. Some studies have recommended targeting extension support to certain fish farming food system activities, like fingerling production compared to table size fish production [84]. Despite the absence of formal fingerling producers in the study area, this study recommends providing extension services to both fingerling producers and table-sized fish farmers.
Fish farming participation has also affected agricultural food systems. For instance, increasing the amount of land under cassava cultivation improved fish farming participation. This could be attributed to cassava not requiring many inputs compared to other crops, like rice and maize, grown in the study area [85]. An input like labor could be channeled towards fish farming operations, which is laborious.
There were also other factors, which affected fish farming participation. For example, having income from the bicycle taxi reduced farmers’ motivation to farm fish. This entailed having more purchasing power to buy food and fish from other farmers. While contrary to the tenets of earthen pond fish production, adding residues (compost and rice ban) reduced fish farming participation [62]. These results might be a reflection of competition for use of these residues in the agricultural fields as a fertilizer because the respondents had agriculture as their main occupation.
Even though some factors were supposed to influence fish farming participation, this was not the case. Factors like extension agent visits, level of education, land holding size, age, and gender are known to significantly influence fish farming participation. This could be attributed to the study sample size, which was small compared to other studies, which found these variables to be significant [40]. Another explanation of the small sample size could be related to social structures and perceptions of people around the study area regarding fish farming as they are close to the lake where they could get fish with ease even though the catches had gone down [3].
6.3. Impact of Extreme Weather Events on Fish Farming
The study revealed that the respondents perceived extreme weather events to affect fish farming food system. These events have the potential to directly affect food systems and related socioeconomic factors of the respondents, which again drive the food system [47]. The extreme weather events experienced revolved around rainfall and temperature, these results corroborated those of Limuwa et al. [3]. These events are consistent with Kolding et al. [86], who reported that sporadic rainfall patterns are the main driver of environmental changes for many regions in Sub Saharan Africa where Malawi is located. Furthermore, Malawi’s rainfall pattern has been showing increased annual variations [31]. Nicholson et al. [30] also noted reduced rainfall in mid-February for Malawi. This might have an impact on agricultural food systems [87] on which fish farming directly relies upon [88,89,90]. Our results on negative effects of extreme weather events in fish production corroborated with Faruque and Kabir [91]. Such impacts of extreme temperatures offer opportunities to conduct selective breeding for increased temperature tolerance. Whereas raising fishpond dykes could mitigate floods as perceived in the study area [92].
6.4. Food System Outcome
Even though the fish food system is challenged by inputs and weather related events, the respondents had diversified their livelihood sources through fish farming. This was however not enough because they were still food insecure (availability and access), for all food groups between the months of December and March. These results are consistent with GoM [5]. The high availability of protein in the study area might have been supplied through either livestock or domesticated fish or fish from the lake and could be an indication of sustainable diets [52]. However, the study did not quantify other aspects of food utilization like social value and food safety. On the other hand, the lack of staples in the study area has a direct implication on human body energy from the carbohydrates needed for labor intensive farm activities [93]. Lack of staple foods in some months was contrary to diversified crops grown in the study area, but it reflected mechanisms to safeguard against food insecurity [94]. Different crops have different growing requirements and if one crop fails, other crops provide the needed food supply—for instance, crops grown in the area, such as cassava, which is drought tolerant, and soybeans and groundnuts, which do not require extra costs in buying fertilizers because they can fix nitrogen in the soil [85]. Despite diversified crop production, the study area had few types and low numbers of livestock. These results are contrary to Andrew et al. [69] who attributed having few livestock to lack of grazing land because of high population densities. While this might be true to other areas, the study could attribute high population of small stocks to the climate of the area [95]. However, low numbers of livestock could lead to sustainable diets as it decreases greenhouse gas production, which could increase global warming because livestock produce methane gas [96].
In assessing the fish farming food system and its relationship with the agricultural food system, the study reveals that fish production did not fully result in realization of sustainable diets [52], although it improved food availability and utilization through animal protein. This could be attributed to the competition for production inputs, which existed between agricultural and fish farming food systems.
7. Conclusions
Fish farming food system is important as it provides animal source proteins throughout the year. However, this study has revealed that all the respondents did not consider fish farming as their main occupation. Furthermore, fish farming activities were biased towards men. The fish farmers’ education and household sizes were low. The fish farming food system was faced with production challenges—especially accessing fingerlings, formulated feeds, and extension services—even though the fish farmers had access to water and land. Not everyone had food to last them throughout the year and this created the need to intensify fish farming. Weak synergies existed between fish farming and agricultural food systems. Therefore, affecting bio-resource flows between these two systems, as earthen fishponds depended on agricultural residues for their natural productivity. Despite the farmers practicing mixed cropping, the recycling of agricultural wastes in fishponds was also affected by few types of livestock and the competition for the same wastes as a source of fertilizer to crops. Another competition existed for water usage in rice fields between the farmers. These competitions had an impact in attainment of sustainable diets.
Fish farming was also affected by extreme weather events. These events perceived by farmers offer room for practicing adaptive management. For instance, breeding fish for extreme temperature tolerance and early maturing fish strains. Although progress of aquaculture development in Malawi is being made, there is a long way to go before it can be considered successful. This is the case because these pre-existing bottlenecks reported more than 10 years ago are still persistent [6]. Furthermore, the results also suggest the need to strengthen the supply chain by the government or offer business opportunities in food system activities such as fingerling and feed production and supply. Therefore, fish farming is not an illusion as it might provide supplementary livelihoods to inland fishers, but this development reliant upon improving the operational environment with more easily accessible inputs.
Supplementary Materials
The following are available online at https://www.mdpi.com/2071-1050/10/5/1453/s1, Household survey questionnaire.
Author Contributions
M.M.L., the main author, was involved in designing the research, data collection and analysis, and developing the manuscript. T.S. was involved in designing the study, field scooping, review of the study tools, data analysis, and review of the manuscript. W.S. was also involved in designing the study, testing data collection tools, and reviewing of the manuscript.
Acknowledgments
We would like to acknowledge support from the Norwegian Ministry of Foreign Affairs through funding to the Government of Malawi on the Capacity Building for Managing Climate Change Program in Malawi (CABMACC) (grant number MWI—2011-11/0007). We also thank the Lilongwe University of Agriculture and Natural Resources (LUANAR)’s Programmes Coordinating Office (PCO) team for the support they provided during field activities. We thank the supervisors and enumerators who were key to the data collection in this study. We also thank Sibusisiwe Kamanga and Paul Beaumont for their comments in earlier drafts of this paper.
Conflicts of Interest
The authors declare no conflict of interest.
References
- Ingram, J. A food systems approach to researching food security and its interactions with global environmental change. Food Secur. 2011, 3, 417–431. [Google Scholar] [CrossRef]
- Turner, G.F.; Seehausen, O.; Knight, M.E.; Allender, C.J.; Robinson, R.L. How many species of cichlid fishes are there in African lakes? Mol. Ecol. 2001, 10, 793–806. [Google Scholar] [CrossRef] [PubMed]
- Limuwa, M.; Sitaula, B.; Njaya, F.; Storebakken, T. Evaluation of small-scale fishers’ perceptions on climate change and their coping strategies: Insights from Lake Malawi. Climate 2018, 6, 34. [Google Scholar] [CrossRef]
- Government of Malawi (GoM). National Irrigation Policy; Ministry of Agriculture and Water Development: Lilongwe, Malawi, 2016; p. 44.
- Government of Malawi (GoM). National Fisheries and Aquaculture Policy; Department of Fisheries: Lilongwe, Malawi, 2016; p. 23.
- Russell, A.J.; Grötz, P.A.; Kriesemer, S.K.; Pemsl, D.E. Recommendation Domains for Pond Aquaculture: Country Case Study: Development and Status of Freshwater Aquaculture in Malawi; WorldFish: Penang, Malaysia, 2008; p. 62. [Google Scholar]
- Food and Agriculture Organization (FAO). Malawi Fishery and Aquaculture Country Profile; Food and Agriculture Organization of the United Nations: Rome, Italy, 2008. [Google Scholar]
- Myers, R.A.; Worm, B. Rapid worldwide depletion of predatory fish communities. Nature 2003, 423, 280–283. [Google Scholar] [CrossRef] [PubMed]
- Pauly, D.; Christensen, V.; Dalsgaard, J.; Froese, R.; Torres, F. Fishing down marine food webs. Science 1998, 279, 860–863. [Google Scholar] [CrossRef] [PubMed]
- Willman, R.; Kelleher, K.; Arnason, R.; Franz, N. The Sunken Billions: The Economic Justification for Fisheries Reform; IBRD: Washington, DC, USA; FAO: Rome, Italy, 2009. [Google Scholar]
- Kaunda, E.; Limuwa, M. “Wake-up call!”—Mpasa, Opsaridium microlepis released in the 2006 IUCN Red list of threatened species: A synoptic review of studies and proposal for conservation of the threatened species. In Proceedings of the 3rd Bunda College Research Dissemination Conference, University of Malawi, Bunda College, Lilongwe, Malawi; Safalaoh, A.C.L., Mtethiwa, A.H.N., Kabambe, V., Eds.; Research and Publication Committee (RPC), Bunda College of Agriculture: Lilongwe, Malawi, 2006; pp. 20–24. [Google Scholar]
- Munthali, S.M. Dwindling food-fish species and fishers’ preference: Problems of conserving Lake Malawi’s biodiversity. Biodivers. Conserv. 1997, 6, 253–261. [Google Scholar] [CrossRef]
- McSweeney, C.; Lizcano, G.; New, M.; Lu, X. The UNDP climate change country profiles: Improving the accessibility of observed and projected climate information for studies of climate change in developing countries. Bull. Am. Meteorol. Soc. 2010, 91, 157–166. [Google Scholar] [CrossRef]
- Saka, J.D.; Siable, P.; Hachigonta, S.; Sibanda, L.M. Southern African Agriculture and Climate Change: A Comprehensive Analysis-Malawi; International Food Policy Research Institute: Washington, DC, USA, 2012. [Google Scholar]
- Karenge, L.; Kolding, J. On the relationship between hydrology and fisheries in man-made Lake Kariba, central Africa. Fish. Res. 1995, 22, 205–226. [Google Scholar] [CrossRef]
- Kolding, J.; van Zwieten, P.A. Relative lake level fluctuations and their influence on productivity and resilience in tropical lakes and reservoirs. Fish. Res. 2012, 115, 99–109. [Google Scholar] [CrossRef]
- Owen, R.; Crossley, R.; Johnson, T.; Tweddle, D.; Kornfield, I.; Davison, S.; Eccles, D.; Engstrom, D. Major low levels of Lake Malawi and their implications for speciation rates in cichlid fishes. Proc. R. Soc. Lond. B Biol. Sci. 1990, 240, 519–553. [Google Scholar] [CrossRef]
- Farmery, A.K.; Gardner, C.; Jennings, S.; Green, B.S.; Watson, R.A. Assessing the inclusion of seafood in the sustainable diet literature. Fish Fish. 2017, 18, 607–618. [Google Scholar] [CrossRef]
- Johnston, J.L.; Fanzo, J.C.; Cogill, B. Understanding sustainable diets: A descriptive analysis of the determinants and processes that influence diets and their impact on health, food security, and environmental sustainability. Adv. Nutr. 2014, 5, 418–429. [Google Scholar] [CrossRef] [PubMed]
- Burlingame, B.; Dernini, S. Sustainable Diets and Biodiversity: Directions and Solutions for Policy, Research and Action. In Proceedings of the International Scientific Symposium, Biodiversity and Sustainable Diets United against Hunger, FAO Headquarters, Rome, Italy, 3–5 November 2010; Food and Agriculture Organization of the United Nations (FAO): Rome, Italy, 2012. [Google Scholar]
- Food and Agriculture Organization (FAO). Code of Conduct for Responsible Fisheries; FAO: Rome, Italy, 1995. [Google Scholar]
- Mkanda, F. Contribution by farmers’ survival strategies to soil erosion in the Linthipe river catchment: Implications for biodiversity conservation in lake Malawi/Nyasa. Biodivers. Conserv. 2002, 11, 1327–1359. [Google Scholar] [CrossRef]
- Zidana, A.; Kaunda, E.; Phiri, A.; Khalil-Edriss, A.; Matiya, G.; Jamu, D. Factors influencing cultivation of the Lilongwe and Linthipe river banks in Malawi: A case study of Salima district. J. Appl. Sci. 2007, 7, 3334–3337. [Google Scholar]
- Fisher, B.; Naidoo, R.; Guernier, J.; Johnson, K.; Mullins, D.; Robinson, D.; Allison, E.H. Integrating fisheries and agricultural programs for food security. Agric. Food Secur. 2017, 6. [Google Scholar] [CrossRef]
- Chidanti-Malunga, J. Adaptive strategies to climate change in southern Malawi. Phys. Chem. Earth Parts A/B/C 2011, 36, 1043–1046. [Google Scholar] [CrossRef]
- Hara, M.; Njaya, F. Between a rock and a hard place: The need for and challenges to implementation of rights based fisheries management in small-scale fisheries of southern Lake Malawi. Fish. Res. 2016, 174, 10–18. [Google Scholar] [CrossRef]
- Mvula, P.M. Fluctuating Fisheries and Rural Livelihoods at Lake Malawi. Ph.D. Thesis, University of East Anglia, Norwich, UK, 2002. [Google Scholar]
- Phiri, I.M.G.; Saka, A.R. The impact of changing environmental conditions on vulnerable communities in the Shire Valley, southern Malawi. In The Future of Drylands; Springer: Dordrecht, The Netherlands, 2008; pp. 545–559. [Google Scholar]
- Kakota, T.; Nyariki, D.; Mkwambisi, D.; Kogi-Makau, W. Gender vulnerability to climate variability and household food insecurity. Clim. Dev. 2011, 3, 298–309. [Google Scholar] [CrossRef]
- Nicholson, S.; Klotter, D.; Chavula, G. A detailed rainfall climatology for Malawi, Southern Africa. Int. J. Climatol. 2014, 34, 315–325. [Google Scholar] [CrossRef]
- Ngongondo, C.; Xu, C.-Y.; Gottschalk, L.; Alemaw, B. Evaluation of spatial and temporal characteristics of rainfall in Malawi: A case of data scarce region. Theor. Appl. Climatol. 2011, 106, 79–93. [Google Scholar] [CrossRef]
- Brummett, R.E.; Noble, R. Aquaculture for African Smallholders; ICLARM Technical Report; WorldFish: Penang, Malaysia, 1995; Volume 46, p. 69. [Google Scholar]
- Kalinga, O. Evolution of fish farming in Malawi. In Aquaculture Research and Development in Africa, Zomba, Malawi, 2–6 April 1990; Costa-Pierce, B., Lightfoot, C., Ruddle, K., Pullin, R.S.V., Eds.; ICLARM-GTZ: Zomba, Malawi, 1991; p. 7. [Google Scholar]
- Ahmed, M.; Lorica, M.H. Improving developing country food security through aquaculture development-lessons from Asia. Food Policy 2002, 27, 125–141. [Google Scholar] [CrossRef]
- Kobayashi, M.; Msangi, S.; Batka, M.; Vannuccini, S.; Dey, M.M.; Anderson, J.L. Fish to 2030: The role and opportunity for aquaculture. Aquac. Econ. Manag. 2015, 19, 282–300. [Google Scholar] [CrossRef]
- Béné, C.; Arthur, R.; Norbury, H.; Allison, E.H.; Beveridge, M.; Bush, S.; Campling, L.; Leschen, W.; Little, D.; Squires, D. Contribution of fisheries and aquaculture to food security and poverty reduction: Assessing the current evidence. World Dev. 2016, 79, 177–196. [Google Scholar] [CrossRef]
- Brummett, R.E.; Lazard, J.; Moehl, J. African aquaculture: Realizing the potential. Food Policy 2008, 33, 371–385. [Google Scholar] [CrossRef]
- Brummett, R.E.; Williams, M.J. The evolution of aquaculture in African rural and economic development. Ecol. Econ. 2000, 33, 193–203. [Google Scholar] [CrossRef]
- Lazard, J. Tilapia Farming in the 21st Century: Proceedings of the International Forum on Tilapia Farming 25–27 February 2002, Los Baños, Laguna, Philippines; Guerrero-del Castillo, M.R., Guerrero, R.D., Eds.; Philippine Fisheries Association: Los Baños, Philippines, 2002; pp. 21–41. [Google Scholar]
- Windmar, L.; Kambewa, P.; Jamu, D.; Macuiane, M.; Kambewa, E.; Kamthunzi, W. Feasibility Study for a Community Driven Fish Cage Model in Lake Malawi; WorldFish Center: Domasi, Malawi, 2008. [Google Scholar]
- Hecht, T.; Maluwa, A. Situation Analysis of Aquaculture in Malawi; Working Paper on the Development of Nation Aquaculture Strategic Plan 2006–2015; Department of Fisheries: Lilongwe, Malawi, 2005.
- Msiska, O.V. The status of aquaculture research and development in Malawi. In Aquaculture Research and Development in Rural Africa Zomba, Malawi, 2–6 April 1990; Costa-Pierce, B., Lightfoot, C., Ruddle, K., Pullin, R.S.V., Eds.; ICLARM-GTZ: Zomba, Malawi, 1991; p. 8. [Google Scholar]
- Dey, M.M.; Paraguas, F.J.; Kambewa, P.; Pemsl, D.E. The impact of integrated aquaculture-agriculture on small-scale farms in southern Malawi. Agric. Econ. 2010, 41, 67–79. [Google Scholar] [CrossRef]
- Banda, M.; Jamu, D.; Njaya, F.; Makuliwa, M.; Maluwa, A. The Chambo Restoration Strategic Plan; WorldFish: Penang, Malaysia, 2005; p. 71. [Google Scholar]
- Government of Malawi (GoM). Presidential Initiative on Aquaculture Development (PIAD) in Malawi; Department of Fisheries: Lilongwe, Malawi, 2006; p. 9.
- Ericksen, P.J. Conceptualizing food systems for global environmental change research. Glob. Environ. Chang. 2008, 18, 234–245. [Google Scholar] [CrossRef]
- Allen, T.; Prosperi, P. Modeling sustainable food systems. Environ. Manag. 2016, 57, 956–975. [Google Scholar] [CrossRef] [PubMed]
- FAO. Rome declaration on world food security and world food summit plan of action. In World Food Summit 13–17; FAO: Rome, Italy, 1996. [Google Scholar]
- Gussow, J.D.; Clancy, K.L. Dietary guidelines for sustainability. J. Nutr. Educ. 1986, 18, 1–5. [Google Scholar] [CrossRef]
- McCarthy, J.J.; Canziani, O.F.; Leary, N.A.; Dokken, D.J.; White, K.S. Climate Change 2001: Impacts, Adaptation, and Vulnerability: Contribution of Working Group II to the Third Assessment Report of the Intergovernmental Panel on Climate Change; Cambridge University Press: Cambridge, UK; New York, NY, USA, 2001. [Google Scholar]
- FAO. Bioversity. In Sustainable Diets and Bioversity: Directiona and Solutions for Policy, Research and Action; FAO: Rome, Italy, 2012. [Google Scholar]
- Lairon, D. Biodiversity and sustainable nutrition with a food-based approach. In Sustainable Diets and Biodiversity: Directions and Solutions for Policy, Research and Action, Proceedings of the International Scientific Symposium, Rome, Italy, 3–5 November 2010; Burlingame, B.D.S., Ed.; FAO: Rome, Italy, 2012; pp. 30–35. [Google Scholar]
- Béné, C.; Barange, M.; Subasinghe, R.; Pinstrup-Andersen, P.; Merino, G.; Hemre, G.-I.; Williams, M. Feeding 9 billion by 2050—Putting fish back on the menu. Food Secur. 2015, 7, 261–274. [Google Scholar] [CrossRef]
- Toppe, J.; Bondad-Reantaso, M.G.; Hasan, M.R.; Josupeit, H.; Subasinghe, R.P.; Halwart, M.; James, D. Aquatic biodiversity for sustainable diets: The role of aquatic foods in food and nutrition security. In Sustainable Diets and Biodiversity: Directions and Solutions for Policy, Research and Action, Proceedings of the International Scientific Symposium, Rome, Italy, 3–5 November 2010; Burlingame, B.D.S., Ed.; FAO: Rome, Italy, 2012; pp. 94–101. [Google Scholar]
- Troell, M.; Naylor, R.L.; Metian, M.; Beveridge, M.; Tyedmers, P.H.; Folke, C.; Arrow, K.J.; Barrett, S.; Crépin, A.-S.; Ehrlich, P.R. Does aquaculture add resilience to the global food system? Proc. Natl. Acad. Sci. USA 2014, 111, 13257–13263. [Google Scholar] [CrossRef] [PubMed]
- Tacon, A.G.; Hasan, M.R.; Metian, M. Demand and Supply of Feed Ingredients for Farmed Fish and Crustaceans: Trends and Prospects; FAO Fisheries and Aquaculture Technical Paper No. 564; FAO: Rome, Italy, 2011; Volume I, 87p. [Google Scholar]
- Brummett, R. Why Malawian Smallholders don’t Feed Their Fish; Aquaculture and Fisheries Document; University of Malawi, Bunda College of Agriculture Library: Lilongwe, Malawi, 1997; Volume 53, p. 12. [Google Scholar]
- Smit, B.; Wandel, J. Adaptation, adaptive capacity and vulnerability. Glob. Environ. Chang. 2006, 16, 282–292. [Google Scholar] [CrossRef]
- Smith, J.B.; Klein, R.J.; Huq, S. Climate Change, Adaptive Capacity and Development; Imperial College Press: London, UK, 2003. [Google Scholar]
- Government of Malawi (GoM). Nkhotakota District Social Economic Profile; Nkhotakota District Council: Lilongwe, Malawi, 2010; p. 168.
- Sipawe, R.; Namoto, W.; Mponda, O.; Bay, M. Analysis of Catch and Effort Data for the Fisheries of Nkhotakota 1976–1999; Department of Fisheries: Lilongwe, Malawi, 2001; p. 22.
- Mwanza, A. Over 3000 People Displaced in Nkhotakota Floods. Available online: http://www.manaonline.gov.mw/index.php/national/environment/item/8581-over-3000-people-displaced-in-nkhotakota-floods (accessed on 28 April 2018).
- Government of Malawi (GoM). Malawi 10-Day Weather and Agrometeorological Bulletin for 11–20 April, 2018; Ministry of Natural Resources, Energy and Mining, Department of Climate Change and Meteorological Services: Blantyre, Malawi, 2018; p. 4.
- Ngwira, A.; Thierfelder, C.; Eash, N.; Lambert, D.M. Risk and maize-based cropping systems for smallholder malawi farmers using conservation agriculture technologies. Exp. Agric. 2013, 49, 483–503. [Google Scholar] [CrossRef]
- Thierfelder, C.; Chisui, J.L.; Gama, M.; Cheesman, S.; Jere, Z.D.; Bunderson, W.T.; Eash, N.S.; Rusinamhodzi, L. Maize-based conservation agriculture systems in Malawi: Long-term trends in productivity. Field Crop. Res. 2013, 142, 47–57. [Google Scholar] [CrossRef]
- Teddlie, C.; Yu, F. Mixed methods sampling: A typology with examples. J. Mixed Methods Res. 2007, 1, 77–100. [Google Scholar] [CrossRef]
- Blythe, J.L. Social-ecological analysis of integrated agriculture-aquaculture systems in Dedza, Malawi. Environ. Dev. Sustain. 2013, 15, 1143–1155. [Google Scholar] [CrossRef]
- Patton, M.Q. Qualitative interviewing. In Qualitative Research and Evaluation Methods; Sage Publications, Inc.: Thousand Oaks, CA, USA, 2002; pp. 339–348. [Google Scholar]
- Andrew, T.G.; Weyl, O.; Andrew, M. Aquaculture Master Plan Development in Malawi: Socio-Economic Survey Report; Malawi Government: Lilongwe, Malawi, 2003; p. 89.
- Levy, P.; Lemeshow, S. Sampling of Populations: Methods and Applications; John Wiley & Sons: New York, NY, USA, 1999; p. 567. [Google Scholar]
- Braun, V.; Clarke, V. Using thematic analysis in psychology. Qual. Res. Psychol. 2006, 3, 77–101. [Google Scholar] [CrossRef]
- Phiri, K.M. Some changes in the matrilineal family system among the Chewa of Malawi since the nineteenth century. J. Afr. Hist. 1983, 24, 257–274. [Google Scholar] [CrossRef]
- Hatlebakk, M. Regional variation in livelihood strategies in Malawi. S. Afr. J. Econ. 2012, 80, 62–76. [Google Scholar] [CrossRef]
- Rodgers, E.M. Diffusion of Innovations, 4th ed.; The Free Press: New York, NY, USA, 1995; pp. 1–35. [Google Scholar]
- Brummett, R.E.; Gockowski, J.; Pouomogne, V.; Muir, J. Targeting agricultural research and extension for food security and poverty alleviation: A case study of fish farming in central Cameroon. Food Policy 2011, 36, 805–814. [Google Scholar] [CrossRef]
- Simon, L.; Nagoli, J.; Unyolo, S.; Mwale, R. Malawi Gold Standard (Creating Income from Natural Resources): Fish. Farmer’s Handbook for Pond Aquaculture; COMPASS II: Blantyre, Malawi, 2007. [Google Scholar]
- Bombeo-Tuburan, I.; Coniza, E.B.; Rodriguez, E.M.; Agbayani, R.F. Culture and economics of wild grouper (Epinephelus coioides) using three feed types in ponds. Aquaculture 2001, 201, 229–240. [Google Scholar] [CrossRef]
- Barcellos, L.; Nicolaiewsky, S.; De Souza, S.; Lulhier, F. The effects of stocking density and social interaction on acute stress response in Nile tilapia Oreochromis niloticus (L.) fingerlings. Aquac. Res. 1999, 30, 887–892. [Google Scholar] [CrossRef]
- El-Sayed, A.F.M. Effects of stocking density and feeding levels on growth and feed efficiency of Nile tilapia (Oreochromis niloticus L.) fry. Aquac. Res. 2002, 33, 621–626. [Google Scholar] [CrossRef]
- Hlophe, S.; Moyo, N. The aquaculture potential of Tilapia rendalli in relation to its feeding habits and digestive capabilities. Phys. Chem. Earth Parts A/B/C 2013, 66, 33–37. [Google Scholar] [CrossRef]
- Tacon, A.G.; De Silva, S.S. Feed preparation and feed management strategies within semi-intensive fish farming systems in the tropics. Aquaculture 1997, 151, 379–404. [Google Scholar] [CrossRef]
- Engle, C.R. Aquaculture Economics and Financing: Management and Analysis; John Wiley & Sons: Singapore, 2010; p. 272. [Google Scholar]
- Kang’ombe, J.; Brown, J.A.; Halfyard, L.C. Effect of using different types of organic animal manure on plankton abundance, and on growth and survival of Tilapia rendalli (Boulenger) in ponds. Aquac. Res. 2006, 37, 1360–1371. [Google Scholar] [CrossRef]
- Lewis, D. Rethinking aquaculture for resource-poor farmers: Perspectives from Bangladesh. Food Policy 1997, 22, 533–546. [Google Scholar] [CrossRef]
- Government of Malawi (GoM). Guide to Agricultural Production and Natural Resources Management in Malawi; Ministry of Agriculture, Food Security and Water Development: Lilongwe, Malawi, 2012; p. 367.
- Kolding, J.; van Zwieten, P.; Marttin, F.; Poulain, F. Fisheries in the Drylands of Sub-Saharan Africa “Fish Come with the Rains”; FAO Fisheries and Aquaculture Circular; FAO: Rome, Italy, 2016. [Google Scholar]
- Tadross, M.; Suarez, P.; Lotsch, A.; Hachigonta, S.; Mdoka, M.; Unganai, L.; Lucio, F.; Kamdonyo, D.; Muchinda, M. Growing-season rainfall and scenarios of future change in southeast Africa: Implications for cultivating maize. Clim. Res. 2009, 40, 147–161. [Google Scholar] [CrossRef]
- Brummett, R.E. Integrated aquaculture in Subsaharan Africa. Environ. Dev. Sustain. 1999, 1, 315–321. [Google Scholar] [CrossRef]
- Brummett, R.E.; Chikafumbwa, F.J.K. Management of rainfed aquaculture on Malawian smallholdings. In Proceedings of the Symposium on Sustainable Aquaculture, Honolulu, HI, USA, 11–14 June 1995; pp. 47–56. [Google Scholar]
- Chikafumbwa, F. Farmer participation in technology development and transfer in Malawi: A rice-fish example (extended abstract). In Aquaculture Policy Options for Integrated Resource Management in Sub Saharan African; Brummett, R.E., Ed.; ICLARM: Manila, Philippines, 1994; Volume 46, pp. 30–31. [Google Scholar]
- Faruque, M.H.; Kabir, M.A. Climate change effects on aquaculture: A case study from north western Bangladesh. Int. J. Fish. Aquat. Sci. 2016, 4, 550–556. [Google Scholar]
- Shelton, C. Climate Change Adaptation in Fisheries and Aquaculture–Compilation of Initial Examples; FAO Fisheries and Aquaculture Circular No. 1088; FAO: Rome, Italy, 2014; p. 34. [Google Scholar]
- Cox, M.M.; Nelson, D.L. Lehninger Principles of Biochemistry; WH Freeman: New York, NY, USA, 2008; pp. 562–570. [Google Scholar]
- Block, S.; Webb, P. The dynamics of livelihood diversification in post-famine Ethiopia. Food Policy 2001, 26, 333–350. [Google Scholar] [CrossRef]
- Chingala, G.; Mapiye, C.; Raffrenato, E.; Hoffman, L.; Dzama, K. Determinants of smallholder farmers’ perceptions of impact of climate change on beef production in Malawi. Clim. Chang. 2017, 142, 129–141. [Google Scholar] [CrossRef]
- Moss, A.R.; Jouany, J.-P.; Newbold, J. Methane Production by Ruminants: Its Contribution to Global Warming; Annales de zootechnie, EDP Sciences: Les Ulis, France, 2000; pp. 231–253. [Google Scholar]

Figure 2.
Map of Malawi showing Nkhotakota district and the study area [3].
Figure 2.
Map of Malawi showing Nkhotakota district and the study area [3].


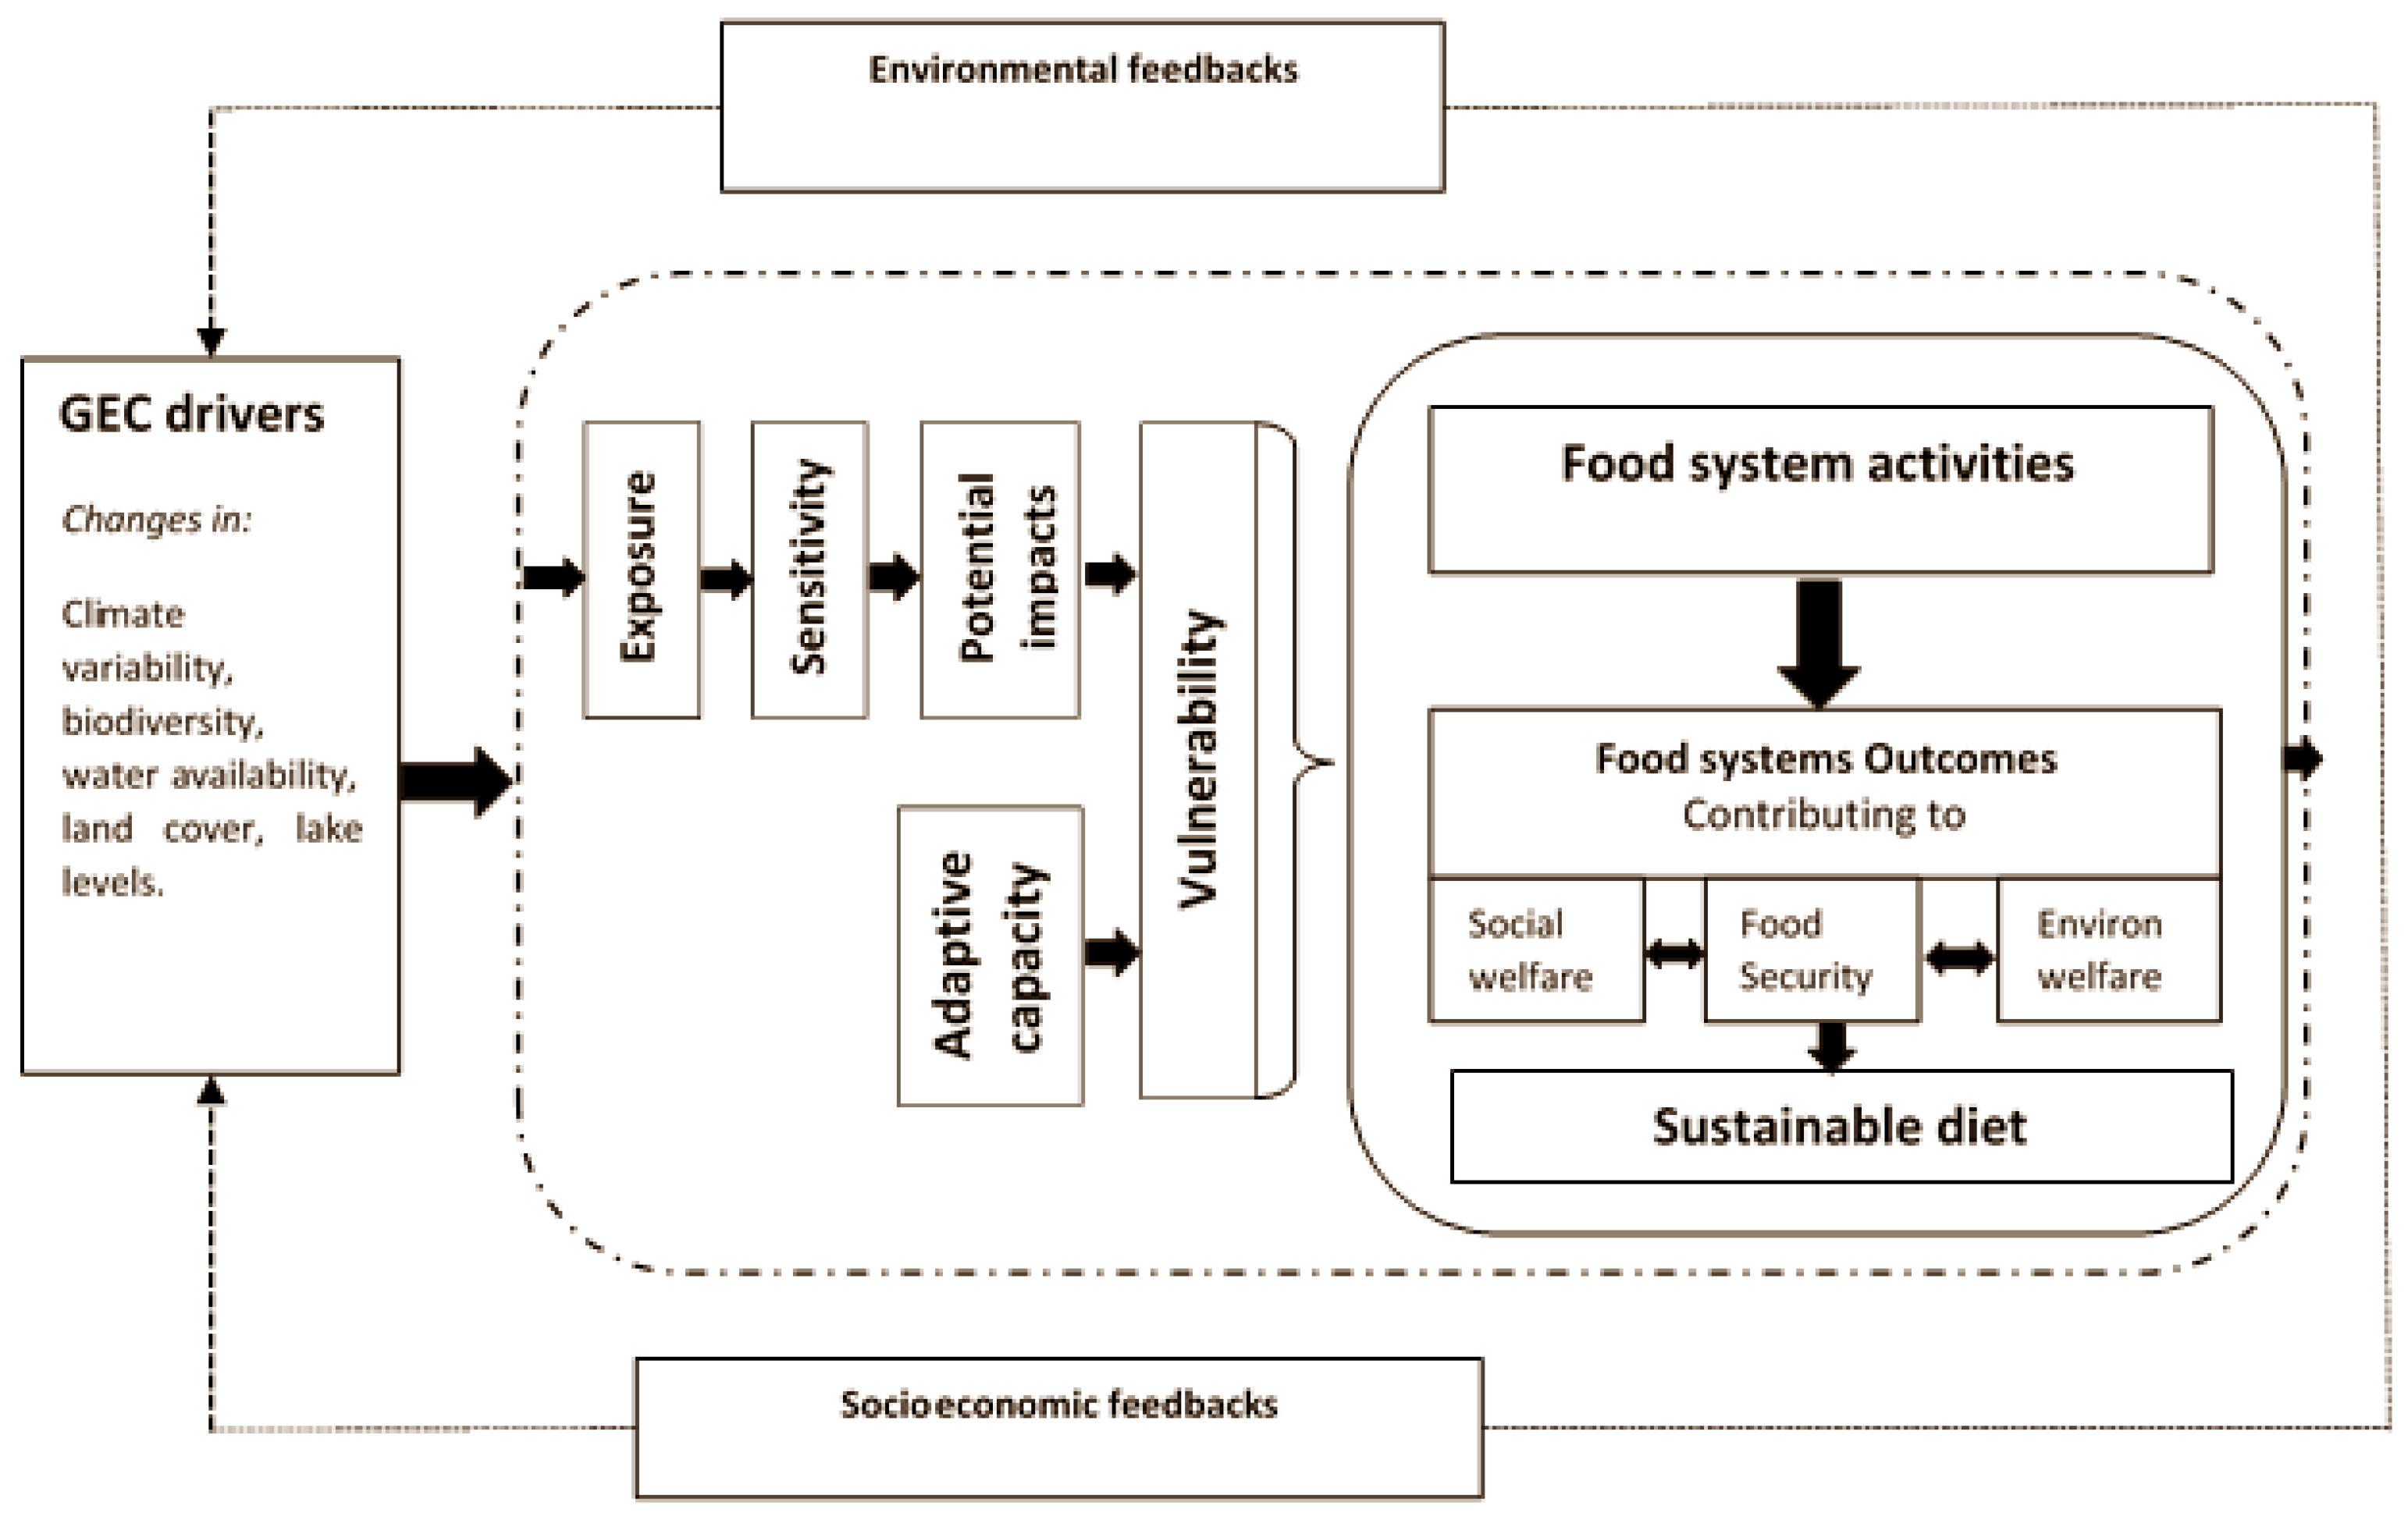
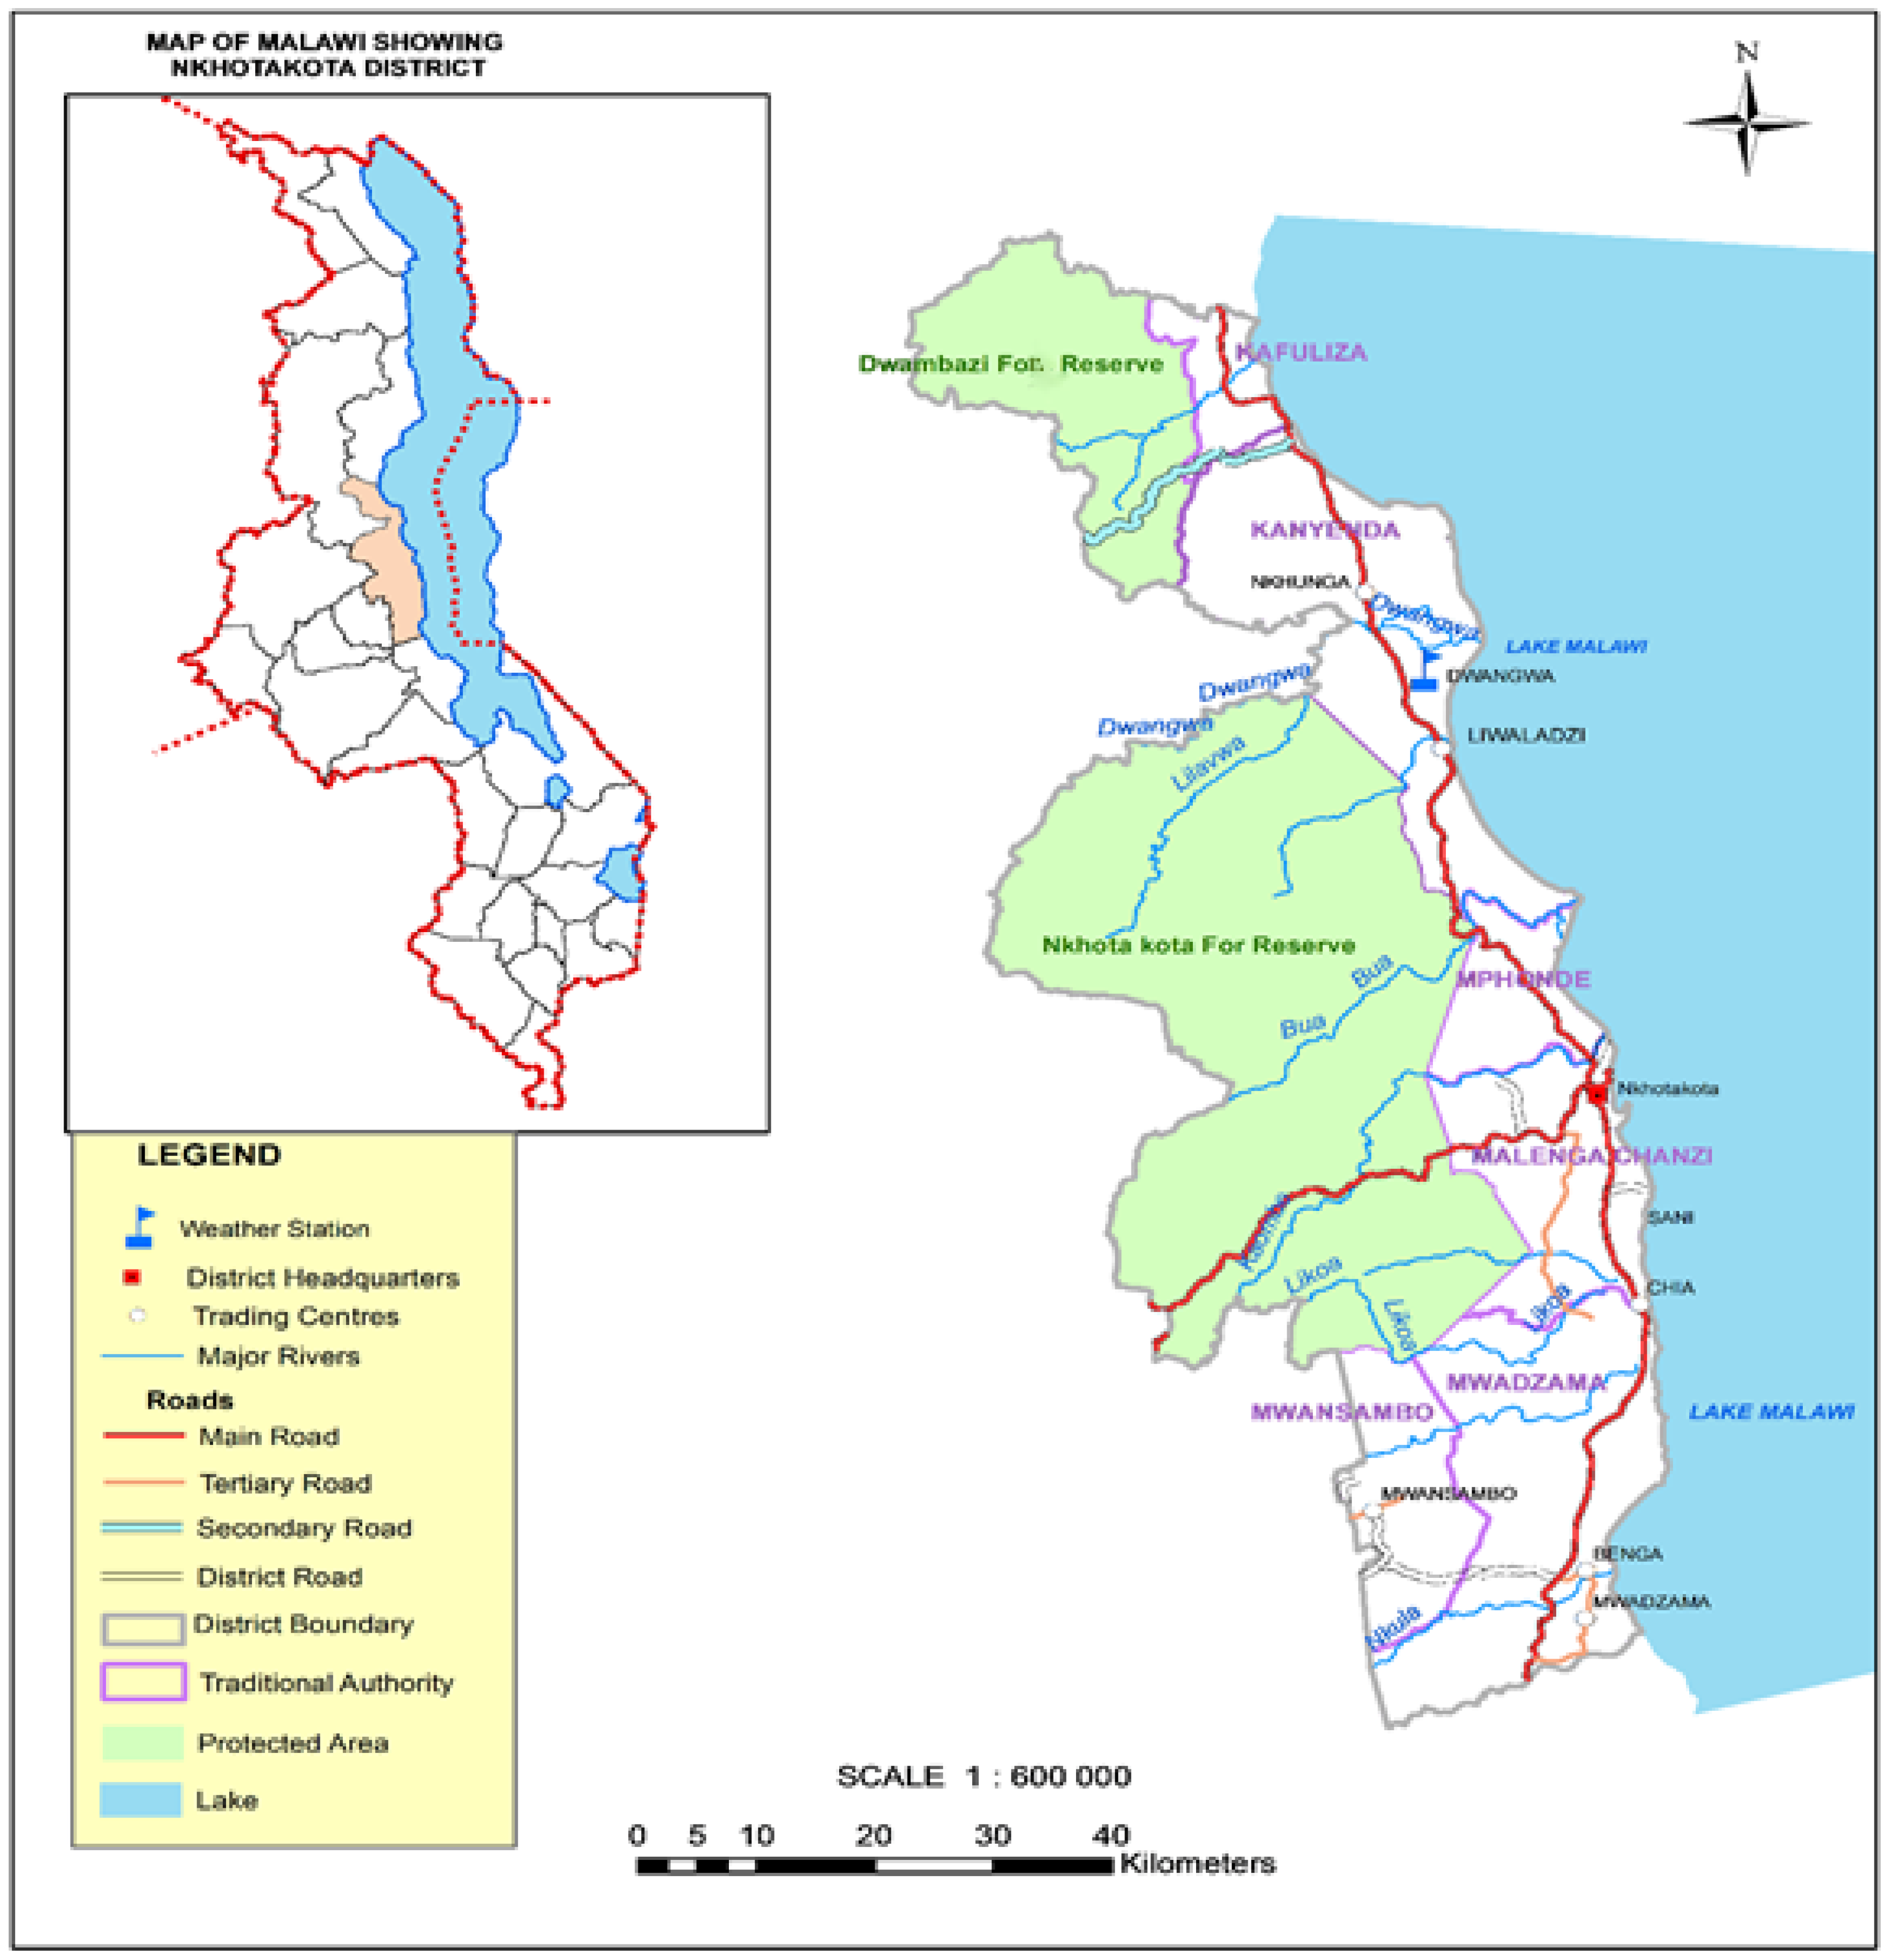
Table 1.
Household characteristics as described by respondents in semi-structured interviews (N = 47).
Table 1.
Household characteristics as described by respondents in semi-structured interviews (N = 47).
| Characteristic | Frequency | Percent (%) | |
|---|---|---|---|
| Sex | Male | 46 | 98 |
| Female | 1 | 2 | |
| Marital Status | Married | 44 | 94 |
| Single | 1 | 2 | |
| Widowed | 1 | 2 | |
| Divorced | 1 | 2 | |
| Main occupation | Agriculture | 42 | 89 |
| Fisheries | 3 | 6 | |
| Hunting | 2 | 4 | |
Source: Fish farming survey data, 2016.
Table 2.
Key farmer attributes as described by respondents in semi-structured interviews (N = 47).
| Household Socio–Economic Factors | Sample Mean | Max (min) Values |
|---|---|---|
| Age of household head (year) | 43 | 79 (22) |
| Amount of time stayed in the area (year) | 36 | 77 (2) |
| Education of household head (year) | 5 | 12 (0) |
| Household size | 4 | 9 (1) |
| Household land for farming (m2) | 24,119 | 93,078 (0) |
| Household earthen ponds size (m2) | 949 | 6400 (40) |
| Assets cost (US$) | 132 | 1356 (1.4) |
Source: Fish farming survey data, 2016. US$1 = MKW 733.
Table 3.
Frequency (n) of soil quality in the households’ arable land as a function of land quality as described by respondents in semi-structured interviews (N = 47).
Table 3.
Frequency (n) of soil quality in the households’ arable land as a function of land quality as described by respondents in semi-structured interviews (N = 47).
| Soil Condition | Field 1 | Field 2 | Field 3 | Field 4 | Field 5 |
|---|---|---|---|---|---|
| Poor | 12 | 4 | 0 | 0 | 0 |
| Good | 32 | 22 | 11 | 3 | 2 |
| Excellent | 1 | 1 | 1 | 0 | 0 |
Source: Fish farming survey data, 2016.
Table 4.
Frequencies (n) and proportions (%) of annual water access for irrigation and earthen fishponds as described by respondents in semi-structured interviews (N = 47) between June 2015 to May 2016.
Table 4.
Frequencies (n) and proportions (%) of annual water access for irrigation and earthen fishponds as described by respondents in semi-structured interviews (N = 47) between June 2015 to May 2016.
| Month | Irrigation | Earthen Ponds | ||
|---|---|---|---|---|
| No Flow | Flow | No Flow | Flow | |
| June | 18.5 | 81.5 | 16.3 | 83.7 |
| July | 18.5 | 81.5 | 18.6 | 81.4 |
| August | 25.9 | 74.1 | 23.3 | 76.7 |
| September | 33.3 | 66.7 | 39.5 | 60.5 |
| October | 44.4 | 55.6 | 41.9 | 58.1 |
| November | 40.7 | 59.3 | 39.5 | 60.5 |
| December | 22.2 | 77.8 | 30.2 | 69.8 |
| January | 22.2 | 77.8 | 14.0 | 78.7 |
| February | 18.5 | 81.5 | 7.0 | 93.0 |
| March | 18.5 | 81.5 | 9.3 | 90.7 |
| April | 22.2 | 44.7 | 11.6 | 88.4 |
| May | 18.5 | 81.5 | 11.6 | 88.4 |
Source: Fish farming survey data, 2016.
Table 5.
Livestock ownership (mean, maximum, and minimum) as described by respondents in semi-structured interviews (N = 47).
Table 5.
Livestock ownership (mean, maximum, and minimum) as described by respondents in semi-structured interviews (N = 47).
| Livestock | Mean | Maximum | Minimum |
|---|---|---|---|
| Cattle | 0.23 | 6 | 0 |
| Goats | 2.21 | 11 | 0 |
| Sheep | 0.4 | 11 | 0 |
| Pigs | 0.6 | 11 | 0 |
| Chicken | 6.8 | 55 | 0 |
Source: Fish farming survey data, 2016.
Table 6.
Factors affecting the current fish farming participation (N = 47).
| Variable | Correlation Coefficient (r) |
|---|---|
| Bicycle taxi | −0.33 ** |
| Participated in fish farming before and currently not | −0.88 ** |
| Amount of compost applied in ponds | −0.38 ** |
| Amount of rice bran applied in ponds | −0.35 ** |
| Participation in Ganyu in October | −0.29 * |
| Buying staple food in December | 0.37 ** |
| Water availability | 0.51 ** |
| Money spent on other foods not staple food | 0.45 ** |
| Amount of cassava planted | 0.38 ** |
| Number of fish harvest at one time during partial harvesting | 0.32 ** |
Source: Fish farming survey data, 2016. *, ** Pearson and Spearman correlation, significant at 5% and 1% respectively.
Table 7.
Proportions (%) of household food sufficiency (N = 47) between June 2015 to May 2016 as described by respondents in semi-structured interviews.
Table 7.
Proportions (%) of household food sufficiency (N = 47) between June 2015 to May 2016 as described by respondents in semi-structured interviews.
| Month | Enough Food | Lack of Protein Only | No Staple Food | No Food | Buy Staple Food | |
|---|---|---|---|---|---|---|
| Yes | No | |||||
| June | 78 | 4 | 9 | 9 | 15 | 85 |
| July | 83 | 4 | 4 | 9 | 13 | 87 |
| August | 81 | 2 | 6 | 11 | 17 | 83 |
| September | 77 | 2 | 64 | 15 | 21 | 79 |
| October | 68 | 15 | 0 | 17 | 32 | 68 |
| November | 62 | 4 | 19 | 15 | 34 | 66 |
| December | 23 | 6 | 28 | 43 | 53 | 47 |
| January | 34 | 6 | 26 | 34 | 64 | 36 |
| February | 26 | 6 | 32 | 36 | 72 | 28 |
| March | 47 | 11 | 17 | 26 | 45 | 55 |
| April | 72 | 13 | 2 | 13 | 17 | 83 |
| May | 72 | 15 | 4 | 9 | 17 | 83 |
Source: Fish farming survey data, 2016.
Table 8.
Annual household income and expenditure proportions for the study respondents (N = 47) between June 2015 to May 2016 as described by respondents in semi-structured interviews.
Table 8.
Annual household income and expenditure proportions for the study respondents (N = 47) between June 2015 to May 2016 as described by respondents in semi-structured interviews.
| Income | Mean % |
| Formal employment | 0.5 |
| Part time employment | 1.1 |
| Business (artisan, shop, bicycle taxi) | 0.5 |
| Casual employment (off farm) | 3.8 |
| Seasonal farm employment | 9.1 |
| Remittances | 5.5 |
| Crops sales | 60.1 |
| Livestock sales | 6.8 |
| Fish sales | 9.5 |
| Rents | 1 |
| Other sources of income | 2.1 |
| Total | 100 |
| Expenditure | |
| Education | 11.4 |
| Transport | 3.6 |
| Food consumption (maize, rice and cassava) | 25.0 |
| Food consumption (fish) | 4.8 |
| Food consumption (other foods) | 21.2 |
| Building materials | 3.1 |
| Clothes and blankets | 10.1 |
| Furnishing and domestic utensils | 4.0 |
| Tools and inputs for productive activities | 11.0 |
| Luxuries | 2.34 |
| Labor | 2.5 |
| Rents | 1.0 |
| Total | 100 |
Source: Fish farming survey data, 2016.
© 2018 by the authors. Licensee MDPI, Basel, Switzerland. This article is an open access article distributed under the terms and conditions of the Creative Commons Attribution (CC BY) license (http://creativecommons.org/licenses/by/4.0/).
Share and Cite
MDPI and ACS Style
Limuwa, M.M.; Singini, W.; Storebakken, T. Is Fish Farming an Illusion for Lake Malawi Riparian Communities under Environmental Changes? Sustainability 2018, 10, 1453. https://doi.org/10.3390/su10051453
AMA Style
Limuwa MM, Singini W, Storebakken T. Is Fish Farming an Illusion for Lake Malawi Riparian Communities under Environmental Changes? Sustainability. 2018; 10(5):1453. https://doi.org/10.3390/su10051453
Chicago/Turabian StyleLimuwa, Moses Majid, Wales Singini, and Trond Storebakken. 2018. "Is Fish Farming an Illusion for Lake Malawi Riparian Communities under Environmental Changes?" Sustainability 10, no. 5: 1453. https://doi.org/10.3390/su10051453
Note that from the first issue of 2016, this journal uses article numbers instead of page numbers. See further details here.