Estimating Residential Electricity Consumption in Nigeria to Support Energy Transitions


Graduate School of Energy Science, Kyoto University, Kyoto, 606-8501, Japan
*
Author to whom correspondence should be addressed.
Sustainability 2018, 10(5), 1440; https://doi.org/10.3390/su10051440
Submission received: 27 February 2018
/
Revised: 20 April 2018
/
Accepted: 3 May 2018
/
Published: 5 May 2018
(This article belongs to the Special Issue Sustainability in the Mining, Minerals and Energy Industries)
Abstract
:Considering the challenge of accessing reliable household metering data in Nigeria, how can electricity consumption levels be determined? And how do disparities in electricity consumption patterns across the country affect the pursuit of sustainability, universal access and energy transition objectives? This study combined household-reported data on ownership of electrical appliances and energy expenditure with online sales records of household appliances to estimate current and future residential electricity demand in Nigeria, as well as the required generation capacity to achieve 100% electricity access, under various scenarios. Median residential electricity consumption was estimated at 18–27 kWh per capita but these estimates vary between the geographical zones with the North East and South West representing extremes. Under a universal access scenario, the future electricity supply system would be expected to have installed generation capacity sufficient to meet the estimated residential demand of 85 TWh. To further understand the required infrastructure investment as a whole and the approaches that might be preferred in rural versus urban areas, the disaggregated, zone-by-zone and urban/rural data may offer more insight than a whole-of-country approach. The data obtained is useful for identifying specific transitions at the sub-national level that can minimize the required investment while maximizing households’ energy access.
1. Introduction
Access to energy has been identified as the “missing development goal,” and its importance in facilitating economic development, reducing poverty, broadening the reach of education and improving health has been well explored [1,2,3,4,5]. For developing countries in particular, the residential sector is important for the design of sustainable energy systems, since it accounts for more than a quarter of non-OECD countries’ final electricity consumption and even up to 60% in countries such as Nigeria [6]. Yet, according to the International Energy Agency (IEA), over 1 billion people remained without access to electricity in 2014, most of which were in India, Nigeria, Ethiopia, Democratic Republic of Congo and Bangladesh [7].
To meet the anticipated future demand and ensure universal access, it is necessary to consider what drives electricity consumption, any observable spatial or regional consumption patterns as well as the barriers to electricity access, for which residential energy use data is particularly critical. For many developing countries across Asia and Sub-Saharan Africa however, the availability of disaggregated data is often limited due to the underdeveloped nature of electricity supply systems, as reflected in inadequate generation and distribution infrastructure, low number of power plants, access to finance and investment as well as low consumer prices [8]. Moreover, households themselves, facing low and inadequate supply of electricity, often rely on non-commercial traditional energy sources such as biomass [9]. Even among households with electricity connections, tracking residential electricity consumption is often problematic due to privacy concerns as well as the challenge of unmetered households—residences that consume electricity from the public utility but have faulty or no meters to record electricity consumption for billing purposes. Meters also provide household electricity consumption data that is important for energy policy formulation and implementation. The inability to obtain data for policy and investment planning is a potentially serious issue in Nigeria, for example, which had the second highest number of people in the world without electricity access in 2016, estimated at about 74 million, or 39% of the population [9].
To address such data limitations, various approaches and data sources have been employed to determine household electricity consumption: direct readings from households’ electricity meters either as reported by the utility, or by researchers [10,11]; electricity utility bills [12,13]; self-reported household data in the form of personal interviews [14]; and survey questionnaires [11,13,15]. As new technologies have emerged, some studies have used sub-metering techniques as well as smart meter monitoring [15,16,17]. A few studies have combined these methods, for instance taking readings from smart meters supplemented by questionnaires [15] or energy audits by building professionals together with self-reported phone interviews [18]. Nevertheless, these studies are almost entirely reliant on data from meter readings in developed economies while less attention has been given to developing regions particularly those with less-sophisticated data, policy and energy infrastructure. In estimating residential electricity consumption, some studies have attempted to overcome the measurement constraint using related indicators such as stock of buildings [19].
This raises two questions: how can electricity consumption levels be determined without metering data? And how do disparities in energy consumption patterns across the country affect the pursuit of sustainability, universal access and energy transition objectives? In the context of this paper, universal access is defined as all households having an electricity connection and uninterrupted power supply.
Considering the non-availability of household level disaggregated data on electricity consumption patterns across the country, the goal of this paper is to estimate the current level of residential electricity consumption using a household survey. To overcome the limitation of the absence of electricity meters, the study adopts two alternate methods to estimate household electricity consumption: online sales data of electrical appliances and household-reported energy expenditures. The electricity consumption estimates are then considered in the context of three other energy access indicators (electricity access rate, duration of electricity supply and electricity expenditure) to describe the current landscape of residential electricity demand in Nigeria, make projections about future level of electricity demand as well as the required generation capacity to achieve 100% electricity access, under various scenarios.
The focus on Nigeria comes from the fact that it is home to the highest number of people without electricity access in Africa [9,20]. According to the Nigerian Electricity Regulatory Commission, only 45% of electricity customers have meters [21]. The absence of meters and accurate utility bills for consumers has often resulted in over-billing for electricity used, resulting in consumers’ refusal to honor the bills, utility service disconnections and, in turn, community protests. Ultimately, utility providers incur large outstanding bills and debts which constrain their future ability to supply electricity [22]. Therefore, the design of Nigeria’s future energy system, driven by adequate knowledge of residential consumption patterns supported by disaggregated household level data, will contribute to addressing the energy access problem both in Nigeria and on the global scale.
Nigeria is a lower middle income country with per capita income at $2790 and poverty rate of 53% [20]. It is among the 10 largest oil exporting countries in the world but agriculture is the most common income-generating activity, followed by household non-farm enterprise and waged employment [23]. However, rapid industrialization and economic growth have been hindered by several factors especially its underdeveloped energy infrastructure. According to the IEA, annual per capita electricity consumption was 140 kWh in 2015, or roughly 12 kWh per capita per month [6]. By 2030, Nigeria’s population is expected to rise to 264 million, the third largest in the world [24]. With increased population, economic expansion and expected future lifestyle changes, energy demand is also expected to increase significantly but over 100 million may still not have access to electricity going by the current access rate. Over the past four decades, meeting the electricity demand of the population has been a major policy goal for Nigeria but this has remained unachievable for several reasons. First the country’s energy supply infrastructure failed to expand as rapidly as population growth due to poor public investment over several years [25]. Further, the quality of spending remained low with numerous cases of weak financial management and public corruption prevalent in the electricity sector. Specifically, the shift to private sector control following the 2005 power sector reforms was marked by process infractions in the management of the privatization process [26].
Moreover, Nigeria’s electricity system is dominated by gas-fired power plants (80%) while hydropower plants account for the remaining. But the commercial attractiveness, preference for exporting natural gas to international markets and susceptibility of gas pipelines to frequent vandalisation have together constrained the availability of gas supply to electric power plants [25]. Even then, there has been no sustained roll-out strategy or systematic plan to extend electrification or ensure universal access over time. In sum, financing limitations, weak energy planning capacity and poor governance are some of the constraints that have hindered the achievement of universal energy access in Nigeria.
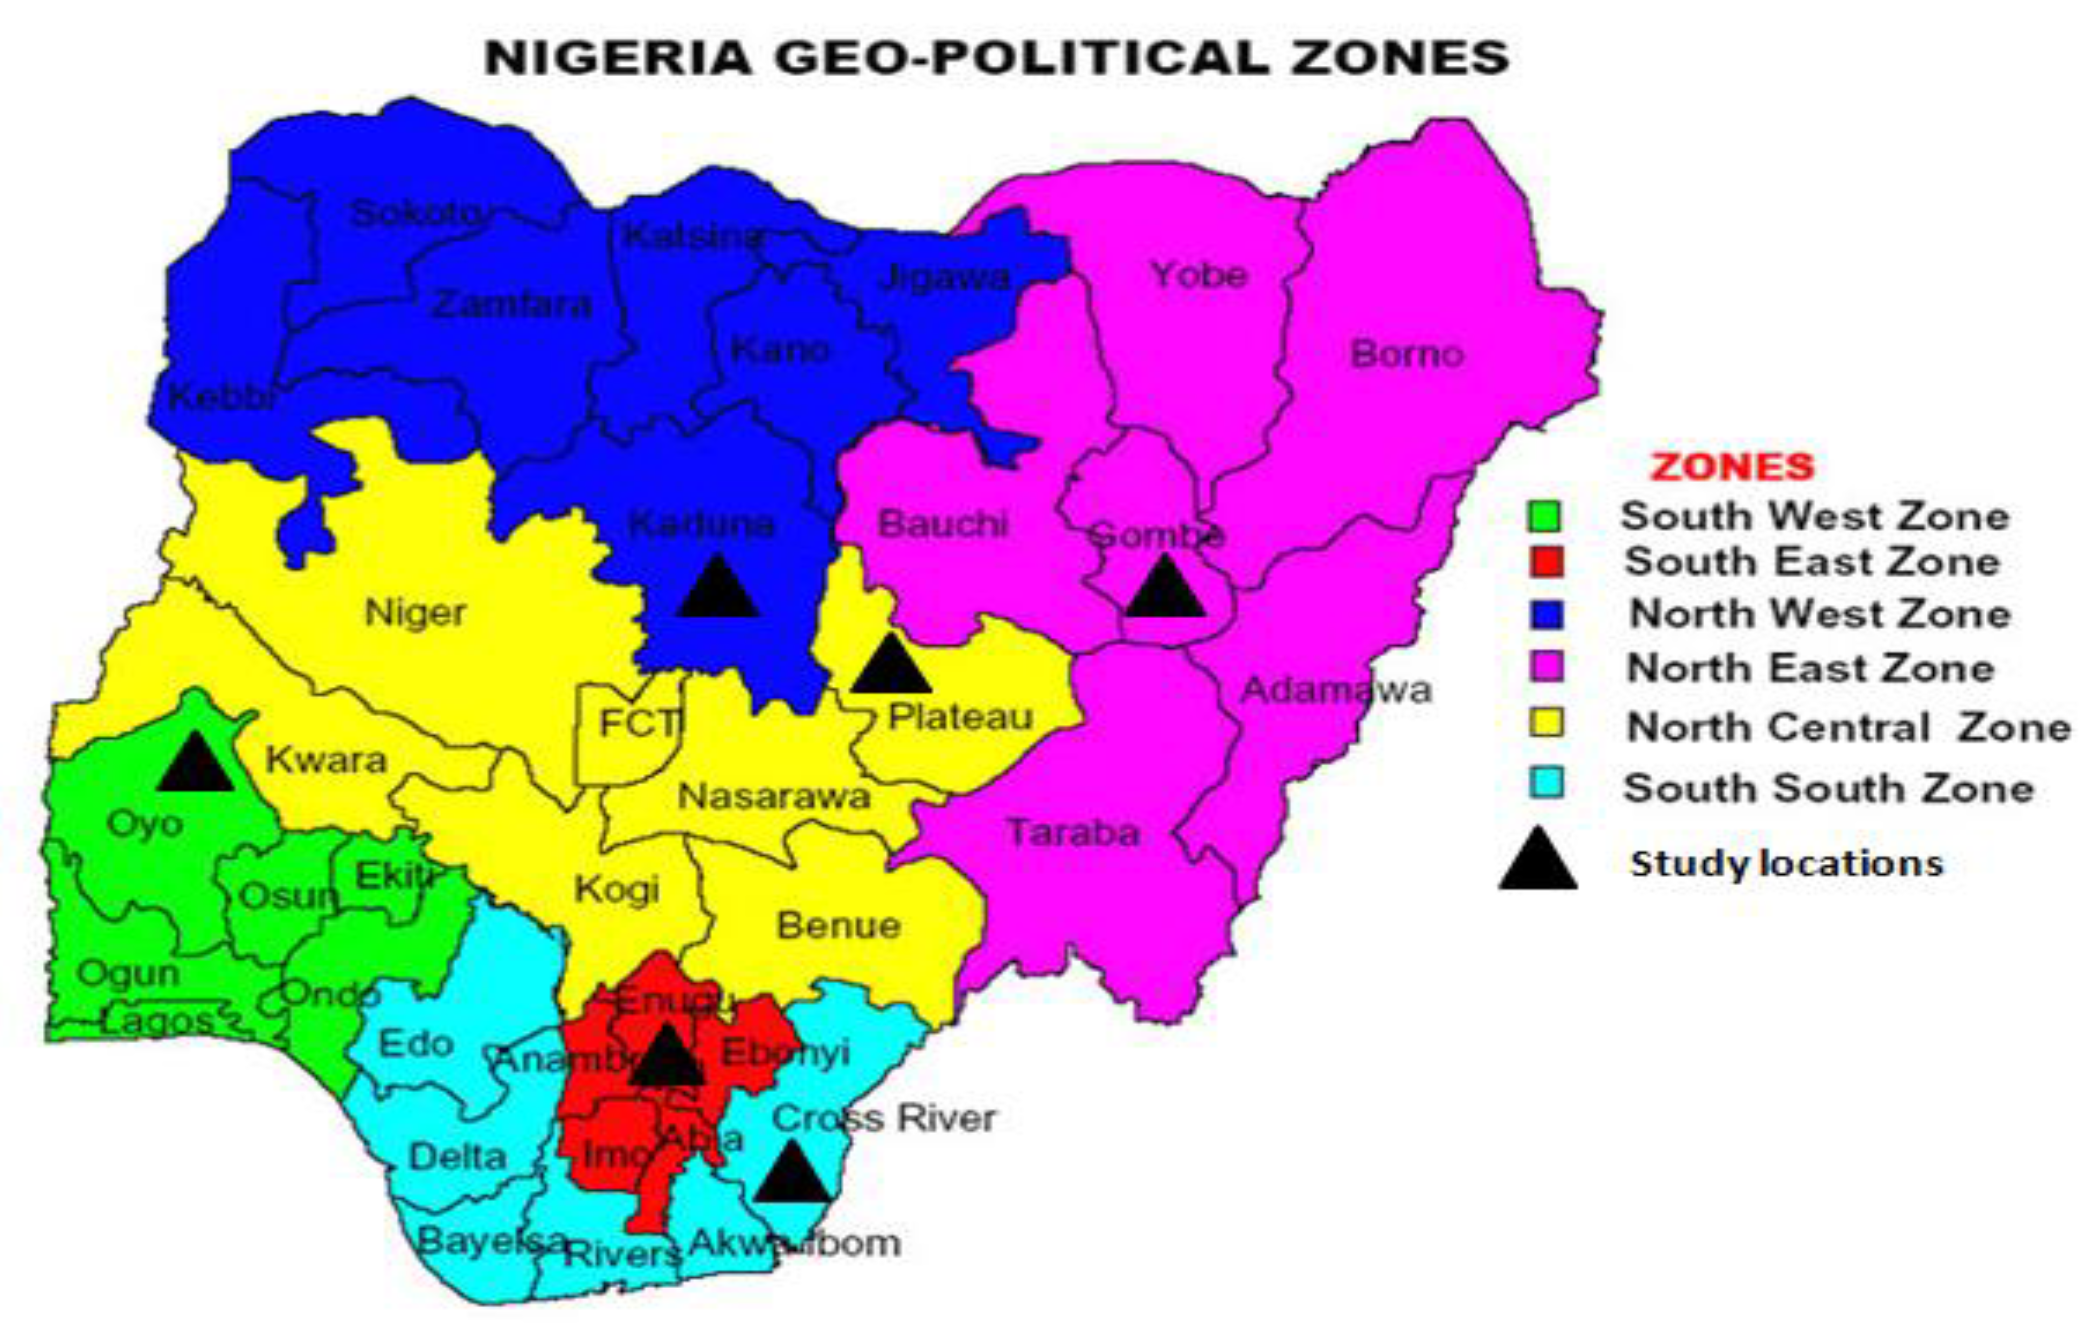
The country is divided into six geo-political zones: North Central (NC), North East (NE), North West (NW), South East (SE), South South (SS) and South West (SW). Selected socio-economic indicators of each zone are presented in Table 1.
Table 1 suggests the Northern and Southern regions exhibit different geographic, demographic and socio-economic characteristics, which may also affect, or be affected by, the level of access to electricity. Studies show that high population density, large family size and higher incomes are associated with higher electricity consumption [27,28,29,30]. Therefore, it is expected that Southern households will likely have much higher electricity consumption levels than the Northern households.
In this study, household-reported data on ownership of electrical appliances and energy expenditure were combined with online sales records of household appliances to estimate residential electricity consumption, describe the electricity access situation across the country’s six regions and establish the key considerations in the design of the future energy system.
The electricity consumption estimates provided in this study represent, as far as we know, the first attempt at a geographically-diverse estimation of residential electricity consumption in Nigeria. The paper contributes to the existing literature on possible data sources and methods for estimating household electricity consumption especially in developing countries where data availability remains a challenge because households have faulty or no meters to track electricity consumption. Furthermore, the paper adds to on-going policy discussion regarding the required infrastructure to meet Nigeria’s electricity demand under a universal access scenario. The rest of this paper is arranged as follows: Section 2 describes the estimation methods applied, Section 3 presents the results while Section 4 discusses the implications of the results. Section 5 concludes the paper.
2. Materials and Methods
2.1. Selection of Sample and Local Area
Data was obtained from both primary and secondary sources. Primary data was based on a questionnaire administered to households drawn from the six geopolitical zones of the country. Figure 1 shows a map of Nigeria’s six geopolitical zones and the study sites where the sample households are located.
One state from each of the six zones was selected based on relative population size, as well as socio-political and cultural importance in the region. Next, 24 households were randomly selected from each of the six states (12 from urban areas and 12 from rural areas) using an official roster of households provided by the National Bureau of Statistics to yield a total of 144 households with 682 residents. Table 2 identifies the specific localities from which households were drawn.
2.2. Determining Power Ratings of Appliances
The questionnaire requested basic household information including membership, age distribution, educational attainment, occupation and total monthly income. It further inquired about the households’ ownership of electrical appliances, duration of usage and energy expenditure (covering gasoline and electricity). A total of 28 household appliances were identified. Data on power ratings of appliances was compiled using sales data for various sizes and models of household electronics sold on a popular Nigerian online shopping website, Konga (www.konga.com). Table 3 presents the list of appliances and associated rating using this approach.
For each appliance, this website displays total sales by multiple sellers of various models. The models with the highest sales volumes were first identified across multiple sellers and the power rating of each determined and verified from the manufacturers’ websites, where available. The power rating of the model with the highest sales volume among observed sellers (that is, the mode) is then adopted for this study. For a few appliances, additional data were obtained from the websites of the US Department of Energy and a private energy company, Wholesalesolar Inc. An assumption in this study, therefore, is that all households use the same model of appliances. Relying on secondary data, rather than direct measurements from the appliances actually owned by households, was necessary to avoid unusual intrusion into respondents’ privacy. Moreover, as noted earlier, the non-availability of electricity meters in households necessitates alternative means of estimating residential electricity consumption.
2.3. Estimating Electricity Consumption
Two approaches are used to determine household electricity consumption. These are the appliance usage approach and the expenditure-price approach. Each is briefly described below.
2.3.1. Appliance Usage Approach
The method involves summing up end-use energy consumed by various electrical appliances in the course of common household activities [31] (pp. 101–103). As shown in Table 3, the appliances are grouped under five activities as follows: lighting, cooking, entertainment, laundry (cleaning & personal use) and cooling. The level of household electricity consumption is given as the product of the power rating of each appliance, duration of use and the number of appliances owned. Thus, for a household with n number of appliances, electricity consumption is given by:
where Eha is total electricity consumed by a household (kWh); R is the power rating of an appliance (W); H is the duration of operation of an appliance (h); and Q is the unit quantity of the appliance, i. The reported daily data is converted to monthly figures assuming a 30-day month.
2.3.2. Expenditure-Price Approach
This uses household-reported monthly electricity expenditure and electricity price data to estimate electricity consumption in kWh. Electricity consumption for each household is defined as:
where Ehe is total monthly electricity consumed by a household (kWh); X is monthly household electricity expenditure (Naira) for the kth household and p is average price of electricity supplied by the utility (Naira/kWh). When evaluated for the same time period and if the results are 100% accurate, we expect for each household:
The estimates obtained from both approaches are compared with estimates derived from two sources: the International Energy Agency [6] and the Nigerian National Bureau of Statistics’ General Household Survey (NBS) [23]. IEA provides annual national per capita electricity consumption estimates. The IEA obtains electricity consumption data from a variety of data sources—primarily household surveys (including national censuses) and in a few cases, utility data. This is converted to monthly, household and per capita figures, by assuming an average household size of five persons. The assumption of a five-person household is close to the sample mean of our survey but is also the figure used by NBS.
On the other hand, NBS [23] does not explicitly report on electricity consumption; rather it reports average annual household electricity expenditure and average household size for each geopolitical zone and the national aggregate as obtained from the general household survey which covers 5000 households across the country (2015/2016). The equivalent electricity consumption for each zone is obtained and converted to monthly and per capita figures by dividing by electricity price, and dividing further by household size, per capita electricity consumption is derived. This is what is denoted as NBS electricity consumption figures in this study.
2.3.3. Households with Generators
For households that rely mainly on petrol generators for electricity supply rather than the electric utility company covering their location, total energy expenditure and the average price of petrol in that state over the period January to March 2017 reported by the National Bureau of Statistics [32] were used to determine the households’ petrol consumption in liters (as in Equation (2)). Electricity generated, however, depends on the heat content of the fuel and the efficiency or heat rate of the generator. Using the US Energy Information Administration (EIA) energy conversion factors (1 L is equivalent to 34 MJ; 3.6 MJ is equivalent to 1 kWh) [33] and assuming the average gasoline generator has an efficiency rate of 30%, 1 L of gasoline was estimated to provide 2.8 kWh of electricity. Table 4 presents the average prices for both electricity and petrol (gasoline) for each zone.
2.4. Electricity Access
In order to determine what proportion of the population had access to electricity and hence the electricity supply-demand gap, respondents were asked two related questions: first, whether the residence was connected to public utilities (electricity, gas & water); second, what source of electricity was most relied on in any given week. Comparable figures on electricity access are obtained from NBS [23] and IEA [9]. NBS reports the proportion of households that have electricity in their dwelling at zonal level, while IEA reports utility connections data as electrification rates at national, urban and rural levels.
2.5. Duration of Electricity Supply
As an indication of the quality of households’ electricity access situation, the average duration (in hours of the day) for which households had electricity for use in a given day was computed and compared with data derived by the NBS.
2.6. Data Collection
The household interviews were conducted by twelve trained personnel from 6–17 March 2017. Data analysis was undertaken using Stata 11 (StataCorp, College Station, USA) and Excel 2010 (Microsoft Corp., Redmond, USA). All questionnaires distributed were satisfactorily completed and retrieved, resulting in a 100% retrieval rate. Electricity price data for each zone was obtained from the Nigerian Electricity Regulatory Commission (NERC) [34,35], while population distribution and urbanization rate data were obtained from the National Population Commission.
3. Results
3.1. Electricity Consumption
The estimation of residential electricity consumption based on both the appliances and the expenditure approaches are reported on per capita basis in Table 5, using the median average. Per capita electricity consumption here is derived on the basis of each household’s size. The 95% confidence intervals for the median are obtained using the binomial exact (or Clopper-Pearson) interval function in Stata. The lower 95% confidence interval is given by (n/2) − [(1.96 × n1/2)]/2th ranked value, while the upper 95% confidence interval is given by 1 + (n/2) + [(1.96n1/2)]/2th ranked value [36]. Comparable estimates derived from IEA [6] and NBS [23] are also reported.
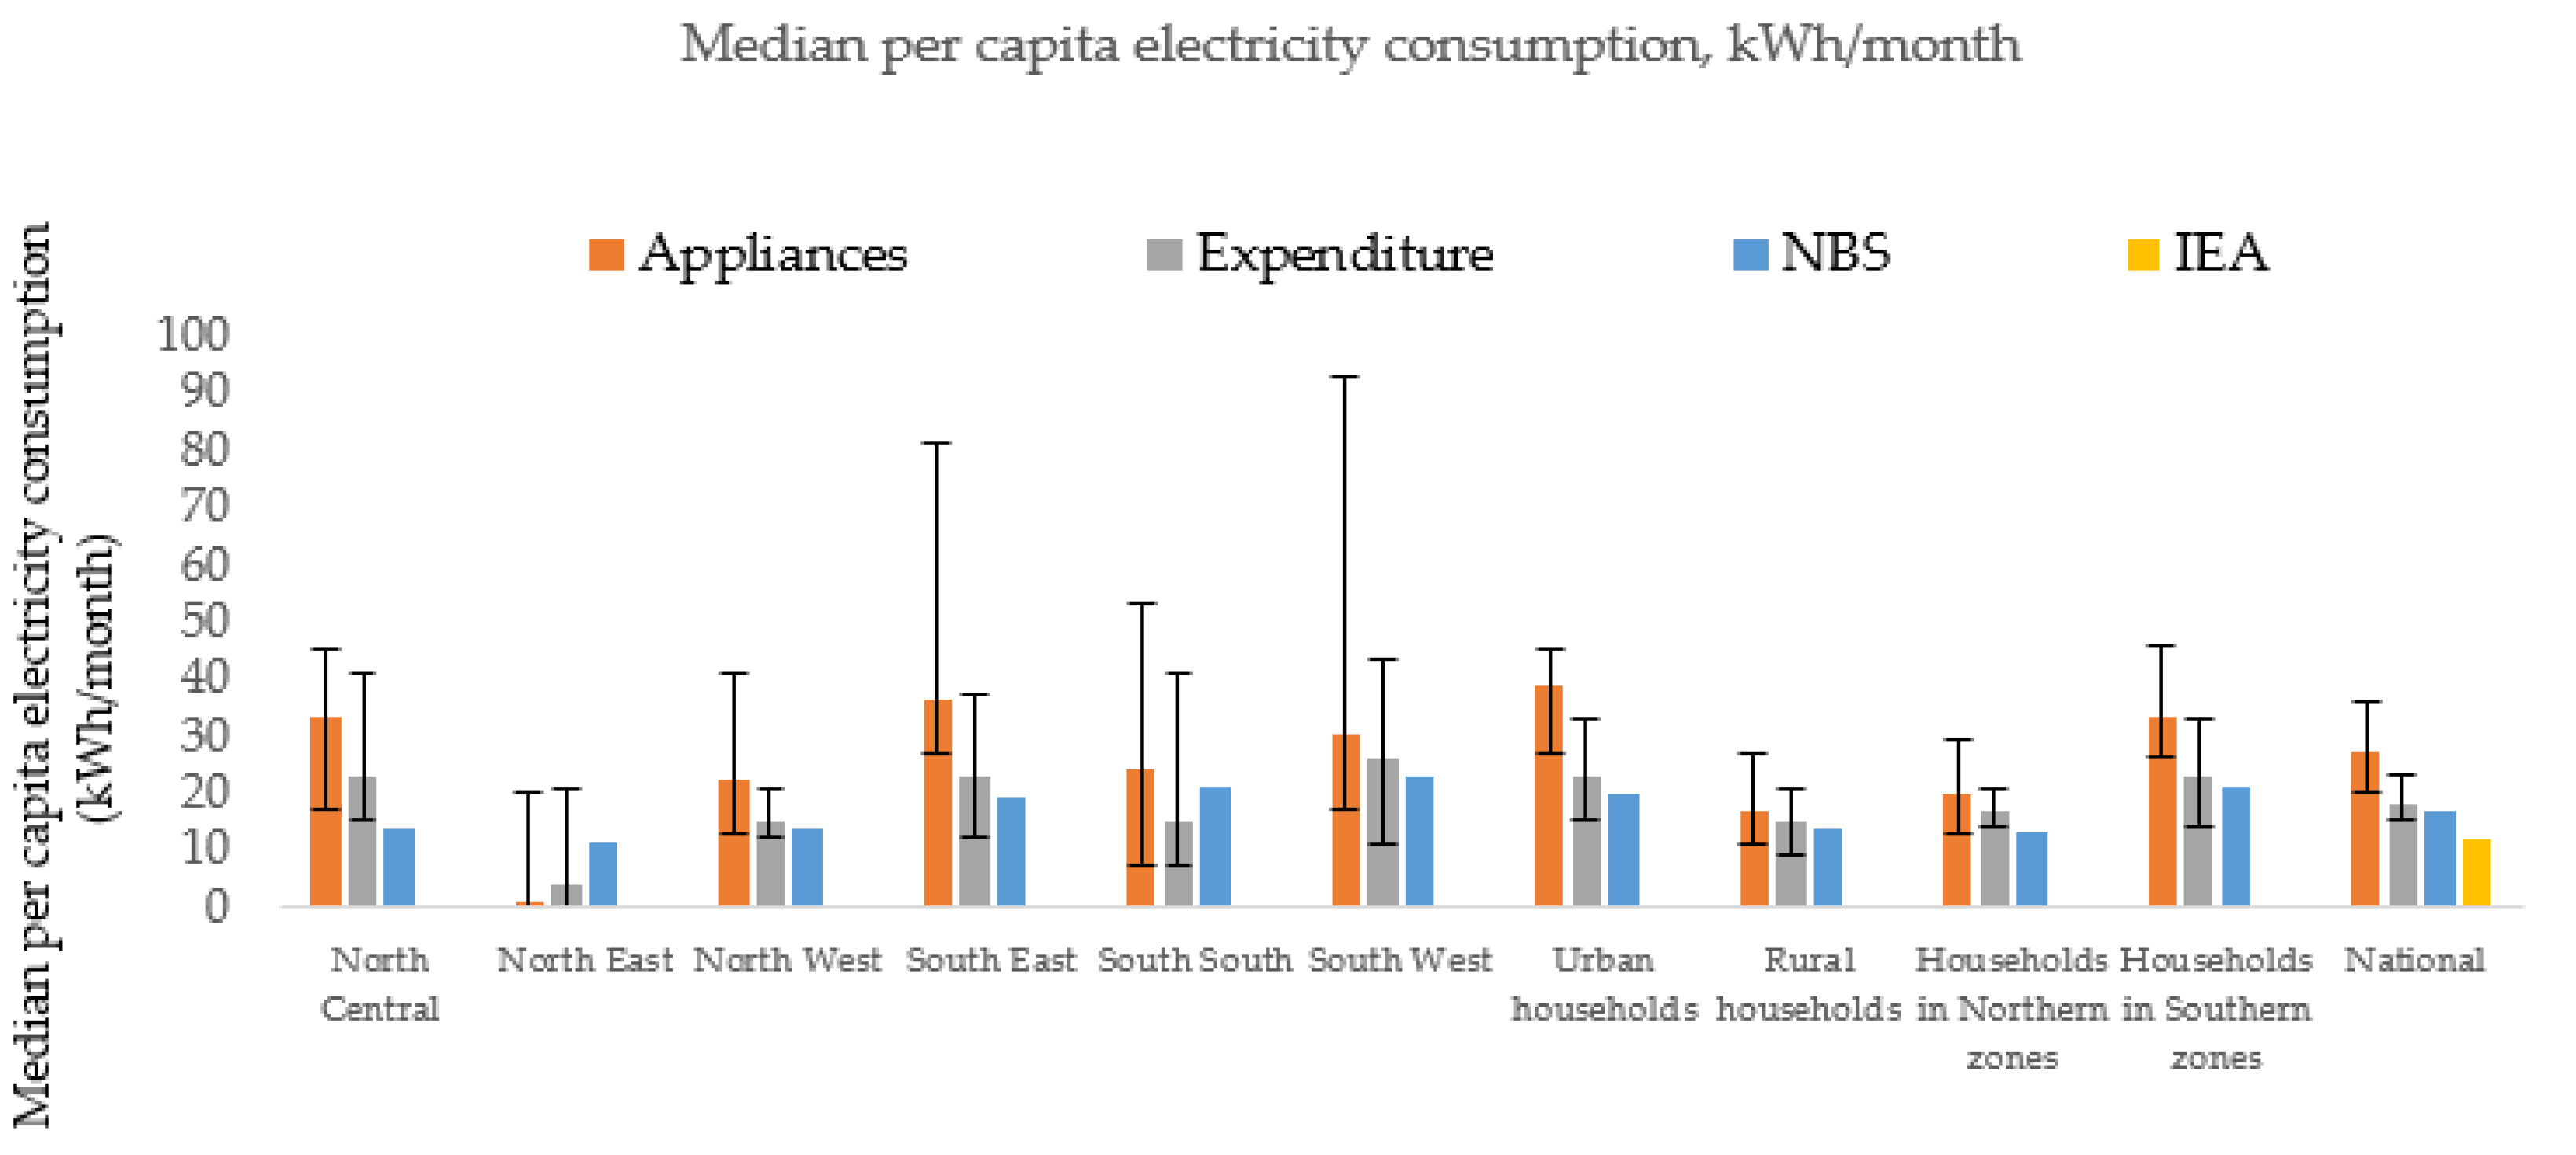
On the basis of appliances usage, per capita electricity consumption was 27 kWh per month on average at the national level. Urban residents use 39 kWh per person per month compared to 17 kWh per person per month for rural residents. Across zones, the South East had the highest per capita electricity consumption per month at 36 kWh per person while the North East had the least (at roughly 1 kWh per person). Residents in Northern households consumed less electricity (20 kWh) compared to Southern households (33 kWh), on average.
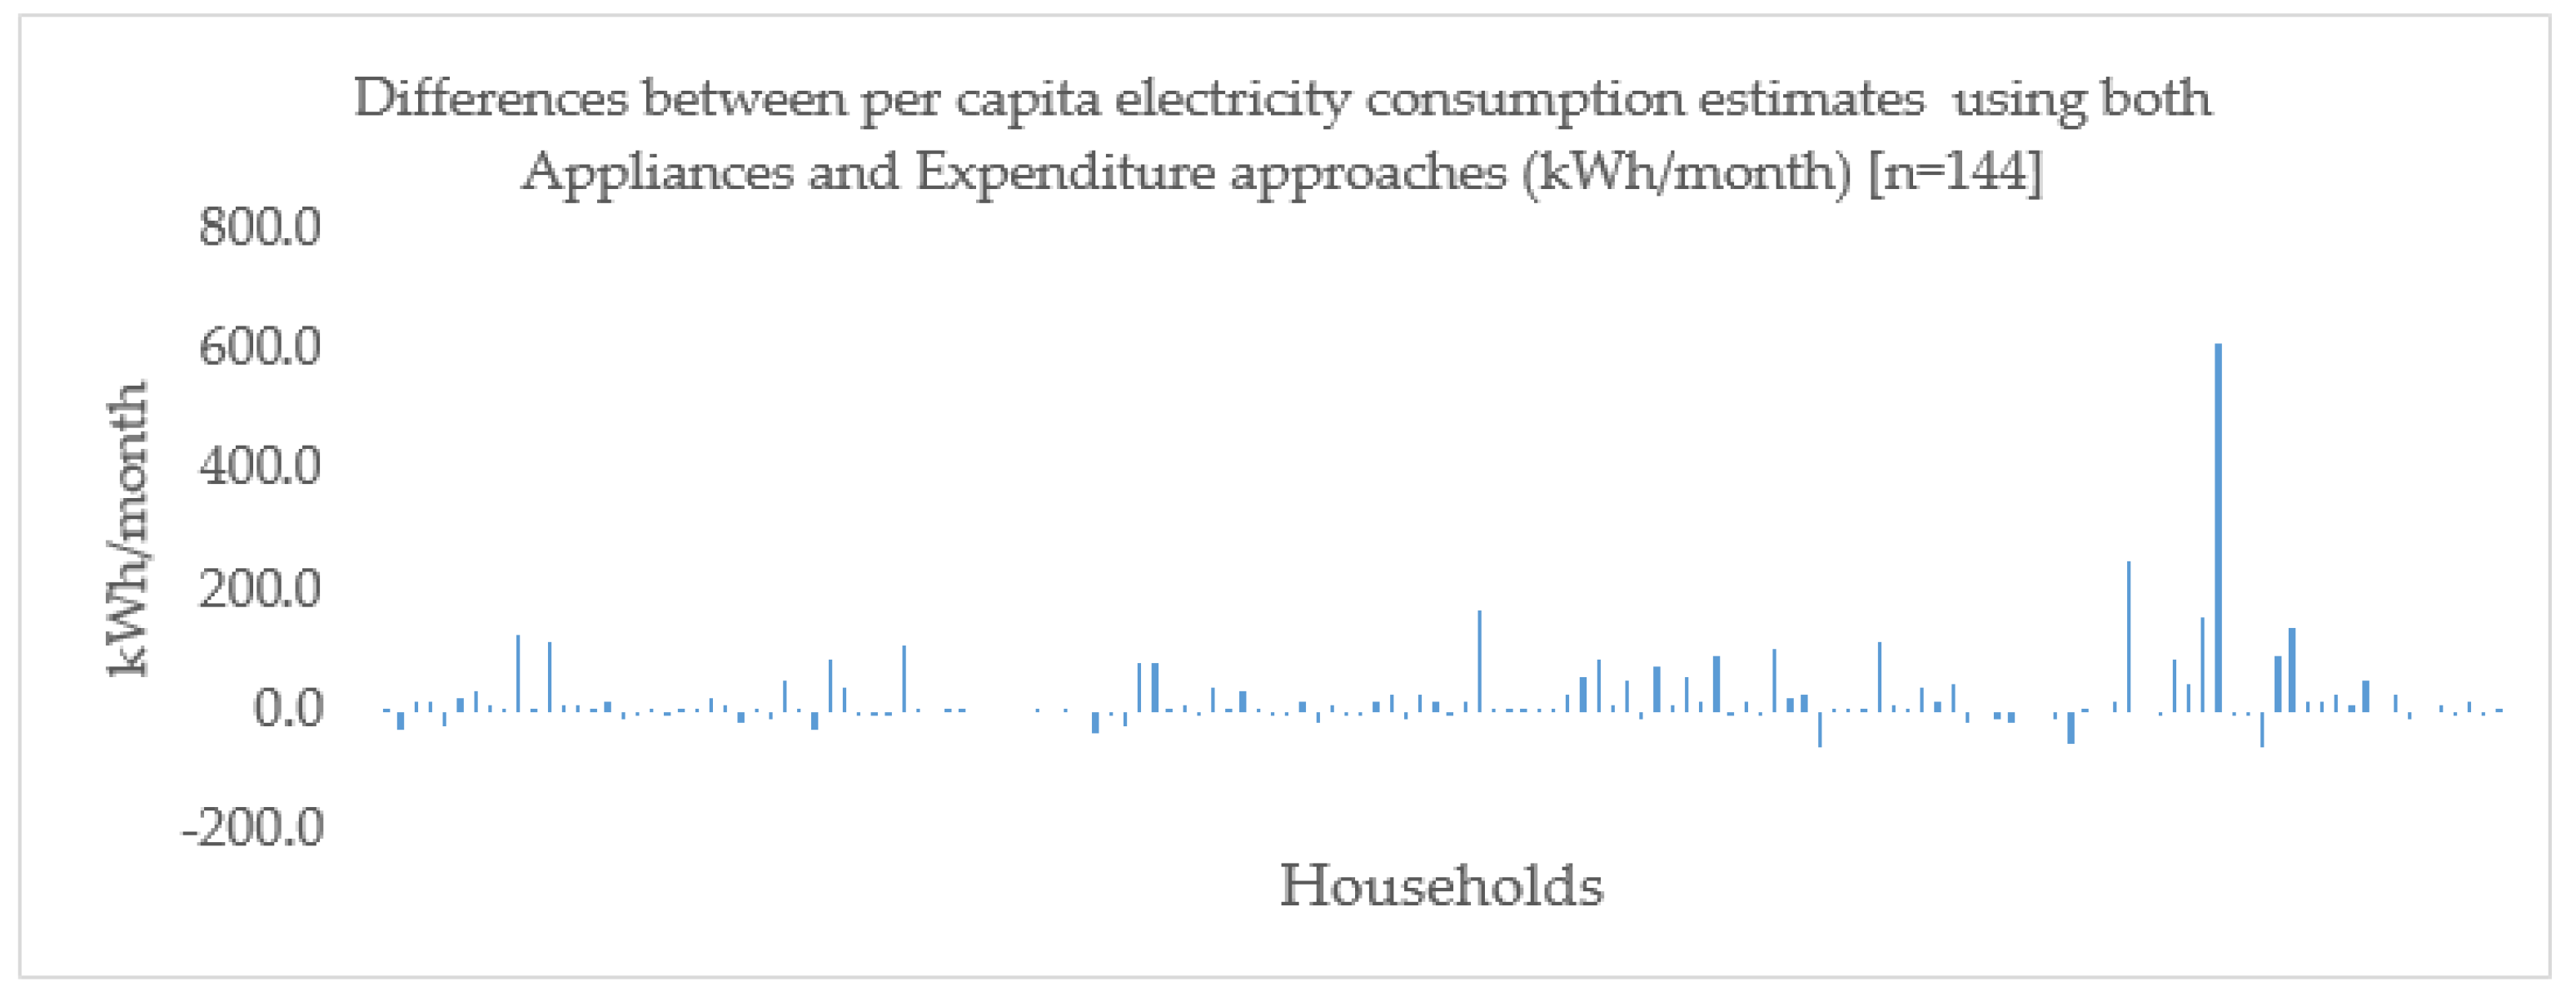
Using the expenditure approach, the figures differ from the appliances method but typically only in a small amount in absolute terms (a few kWh) at the aggregate level. Moreover, the lower/upper confidence intervals from both approaches, for each aggregate, indicate overlapping ranges for the median estimates. This difference could be significant though, when considering the use of these statistics to estimate individual household demand. Nevertheless, the difference was not consistent in one direction implying that the error was random (Figure A1 in Appendix).
Estimates derived from NBS were observed to be generally lower than estimates from both the appliances usage and the expenditure approaches. The IEA indicates average per capita electricity consumption at 12 kWh per month but is only comparable at the national level.
The results presented above indicate that the two approaches yield similar estimates of residential per capita electricity consumption. Some broad observations can be made. First, the approaches suggest that the IEA estimates may be understated, possibly because it relies mainly on utility connections data, while this study includes households with alternative electricity sources such as petrol/diesel generators. Second, the approaches both show that electricity consumption is higher for households in the Southern zones than those in the Northern zones. In particular, the estimates show that the South West (or the South East) had the highest consumption levels while the North East had the least. As observed in Section 1, this may be attributable to the underlying socio-economic conditions that appear to favor Southern households. Lastly, urban residents tend to consume higher electricity than rural residents, as can be expected.
Thus, while the outputs of the different approaches may not match exactly, the confidence interval indicates overlap for the estimates and when considered on a broader level, they illustrate similar patterns of electricity consumption across the zones. The 95% interval range further suggests that the NBS estimates are well within range of both approaches but the IEA estimates appear lower than the estimated ranges in this study. In the same vein, the confidence intervals reveal that electricity consumption across the zones may not be significantly different from each other, given the wide ranges estimated. This would suggest that there are no disparities in electricity consumption between zones (Figure A4 depicts this graphically).
To further assess the level of consistency, these estimates are used to describe residential electricity consumption patterns based on household electricity expenditure, electricity access and duration of electricity supply.
3.2. Electricity Expenditure
Table 6 shows average (median) annual per capita electricity expenditure self-reported by households in each zone, as well as national aggregates, using both appliances and expenditure approaches. The 95% confidence interval for the median is also reported.
From the above, all three approaches indicate that urban residents have higher per capita electricity expenditures than rural residents, the average resident in the Southern zones spends about 50% more on electricity consumption as residents in the Northern zones and the North East shows the lowest electricity expenditure per capita while residents in the South East spend the most. For further insights, electricity expenditure is measured as a proportion of reported household income, as illustrated in Figure 2 below.
Using the appliances approach, the average electricity consumer spends about 7% of per capita income to obtain electricity, while rural and urban residents respectively spend 5% and 8%. However, among zones, there are slight variations. Residents in the North West spend as much as 11% of per capita income on electricity while residents in the South West spend as little as 5% and North East, 1%. Overall, it can be seen that the average resident in the Northern zone spends about 7% of per capita income on electricity, compared to the average resident in the Southern zones that spends about 6%.
Based on the expenditure approach, on average, per capita electricity expenditure as share of income per capita was 4% for the average electricity consumer at the national level. Residents in the North-West zone paid the highest share of income for electricity (9%), while residents in the South West and North East paid the least (about 3%). Although the South West and North-East residents appear to have similar energy expenditure shares, the reasons for these are likely different in the sense that South West residents have much higher per capita incomes than North East residents. The average resident in the Northern zones spends 6% of per capita income on electricity while the average resident in the Southern zones spends about 4% of per capita income on electricity. Rural residents’ expenditure share of income is about half of urban residents’ electricity expenditure.
In sum, although subject to wide uncertainty, within the limits of the study both approaches indicate consistent estimates of per capita electricity expenditure as a share of income across households. Northern households spend a higher share on electricity as a share of their income compared to Southern households, while urban residents spend more than rural residents. However, as with the estimates of electricity consumption across zones discussed earlier, the computed 95% confidence intervals suggest that these expenditure estimates overlap with each other and disparities between the zones cannot be unequivocally stated.
3.3. Electricity Access
Table 7 presents the distribution of households that are connected to the public electricity utility (grid), those that depend mainly on the grid, as well as comparable data from the NBS and IEA.
From Table 7, nearly three quarters of households have access to electricity through connections to the public utility. More urban households are connected to the public utility (93%) compared to just over half of rural households (57%). Across zones, connection to the public utility is most common among households in the North West (96% of households) and South West (92%). On the other hand, only half of the households in the South South and North East indicated they were connected to the public utility. The proportion of households across the three Southern zones that had electricity access, as measured by utility connections, was estimated at 74%, slightly less than 76% estimated for households across the three Northern zones.
By another measure, however, not all households with a utility connection appear to rely on this source of electricity. As seen in the second column of Table 7, only 68% of households claimed to rely on public utility as their main source of electricity, with the remaining relying on petrol/diesel generators and very few on solar panels. The gap is much wider among urban than rural households: nearly all rural households rely mainly on the public utility but in urban areas 81% of households do. Across the zones, while nearly all households with utility connection in the Northern zones relied on the public electricity source, fewer households in the Southern zones relied on the public utility as the main source of electricity.
The estimates were also compared with figures reported in NBS as well as IEA. According to NBS, 59% of households had electricity in their dwellings while the IEA reports electrification rate at 61%. Thus, while the estimates from this study appear close, both the NBS and the IEA report much lower figures. The estimates from this study are higher most likely as a result of the comparatively smaller sample size, rather than as a result of significant improvements in access rate over the one-year time gap between the studies. In addition, differences may arise due to the reliance on household self-reported data.
In summary, Southern households tend to rely less on the public electricity utility than Northern households even though Northern households appear to be better connected to the grid. Furthermore, although official figures suggest that a greater proportion of Southern households had access to electricity than Northern households, this study finds otherwise: that fewer households in the Southern zones had electricity access compared to Northern households.
3.4. Duration of Electricity Supply
Table 8 shows the average number of hours of electricity received in a given day and the maximum number of hours an appliance was reported used by households. Households were asked how many hours of electricity supply was available to them per day, as well as the number of hours they operated each of the surveyed appliances (where applicable). These two pieces of information are useful not only for the determination of electricity consumption but also to cross-check the validity of state operation of appliances and hours of electricity.
At the national level, the median number of hours of electricity received by households was about 8 h per day. Urban households tend to have longer hours with electricity (8 h) than rural households (6 h), on average. The North Central and South-East zones received the longest average hours (10 or more hours), while the North East received the least (only 4 h per day). Hours received by households in the Southern zones was also higher than for households in the northern zones.
According to the NBS however, average number of hours received were generally lower across all categories, possibly again as a result of the smaller sample in this study. While most appliances are operated for only a few hours, appliances such as refrigerators and freezers are typically left running where possible. Yet, only in the South West was a full day of operating an appliance recorded; most of the zones had about half a day of maximum appliance operation while the North East had a maximum operation of only 5 h.
To summarize, two conclusions can be made on the duration of electricity supply: rural households tend to have shorter hours of electricity supply than urban households, while Southern households also have shorter duration of supply than Northern households.
4. Discussion
The starting point for the design of the energy (supply) system is ascertaining the level of energy demand that such a system is intended to satisfy [37]. This has remained a challenge due to the prevalence of unmetered households. The results obtained in the preceding section using new data sources provide some insight into the nature of residential electricity consumption across Nigeria, with consequent implications for sustainability, energy use, measurement, policy and future energy system design. First, overall electricity consumption appears low, estimated at 18–27 kWh per capita per month, or 90–135 kWh per month for an average household with five members. In practical terms, this level of consumption translates to a household in the urban area of Enugu (South East) using, in one day, 2 incandescent bulbs for 5 h, refrigerator or freezer for 5 h, TV for 4 h, radio for 1 h, CD player for 2 h, a fan for 5 h and pressing iron for 20–30 min. Given the appliance ratings in Table 3 and assuming the same usage pattern for a 30-day month From this perspective, it is clear that while households may own a number of appliances, the energy services derived from those appliances is severely constrained by the duration of daily power supply which limits their productivity, restricts opportunities for household based commercial activities and lowers standard of living [37].
Despite this generally low picture of electricity consumption, there appear to be some disparities between the broad geographic regions: households in the Southern zones tend to use more electricity than households in the Northern zones. This can be expected since living standards appear to be higher across the Southern zones as reflected in more favorable socioeconomic and demographic characteristics such as lower poverty rate, higher literacy rate and smaller household size (see Table 1). As an example, the city-state of Lagos in the South West is the commercial center of the country, has the lowest poverty rate and relatively well-developed transport and living conditions compared to the rest of the country. Relatively higher income among Southern households also means they are able to spend 50% more on electricity use, while still maintaining a lower share of their income as energy expenditure. With higher standards of living, households in the South are also able to afford alternative options to the public grid. A large proportion of households indicated they relied less on public electricity, possibly due to the shorter duration of power supply, compared to Northern households which are better connected to the public utility.
The particularly dire energy access and broader socio-economic condition of the North East is worth noting, as that region has experienced significant terrorist attacks that have greatly diminished living conditions since 2011. Even excluding this region, the consumption patterns indicate that the nature of the energy challenge differs between the Southern and Northern zones of the country as have been shown to exist in other countries [38,39]. Such disparities may influence how, whether and when the objectives of universal access and transition to sustainable energy will be achieved.
What do these results imply for the design of sustainable energy systems? It is clear that the current electricity supply system, which is only able to supply 18–27 kWh (expenditure and appliance approaches respectively) of electricity per capita per month is grossly insufficient. This is evident from the fact that households typically access electricity for only about a third of the day, as reported in Table 8. In addition, from a macro perspective, Nigeria’s per capita electricity consumption ranks at the lower end when compared with countries with similar per capita income [6,20].
What is required, therefore, is an electricity system that is able to meet the consumption needs of the population both in terms of quantity (providing access to sufficient electricity for 100% of the population) and quality (uninterrupted supply). These two requirements can be considered as requirements to be met under a national-development perspective of universal access scenario. In other words, under one ideal universal access interpretation, the proportion of households with connection to public electricity supply (Table 7) would reflect that 100% of households have connection to, at least, the public utility, while daily hours with electricity supply (Table 8) would rise to 24 h. These will have implications for the level of electricity consumption (Table 5) and consequently, the required generation capacity of the future energy system. In fact, the required installed generation capacity would need to be considerably higher not only to meet demand but also to account for technical losses, the capacity factor of the system and, if it is based on renewable energy, intermittency of energy sources.
Considering, for a start, the urban/rural disparity. Table 7 shows that urban areas are generally much better connected to public electricity (93%) than rural areas (57%) but rural households tend to rely more on public supply than do urban households. This suggests that energy access is a more serious challenge for the rural areas than urban areas. Furthermore, low rural household income likely plays an influential role in limiting access to alternative electricity sources, hence their heavy reliance on public electricity. Therefore, to increase electricity access rate to 100%, public provision of electricity (grid extension) possibly subsidized below market price, may be the most likely pathway in the case of rural households. Nevertheless, while subsidized grid expansion may be a likely pathway towards 100% rural electrification, decentralized technologies may be economically-feasible from a macroeconomic perspective considering the high cost of grid infrastructure expansion. For urban households on the other hand, less reliance on the public utility and higher per capita electricity expenditure share suggest that urban households have access to alternative sources other than the public utility. In this case, it is reasonable to introduce alternative (decentralized) electricity sources to urban households and allow a greater degree of market-determined electricity price to prevail, rather than the current policy of a flat and subsidized electricity price.
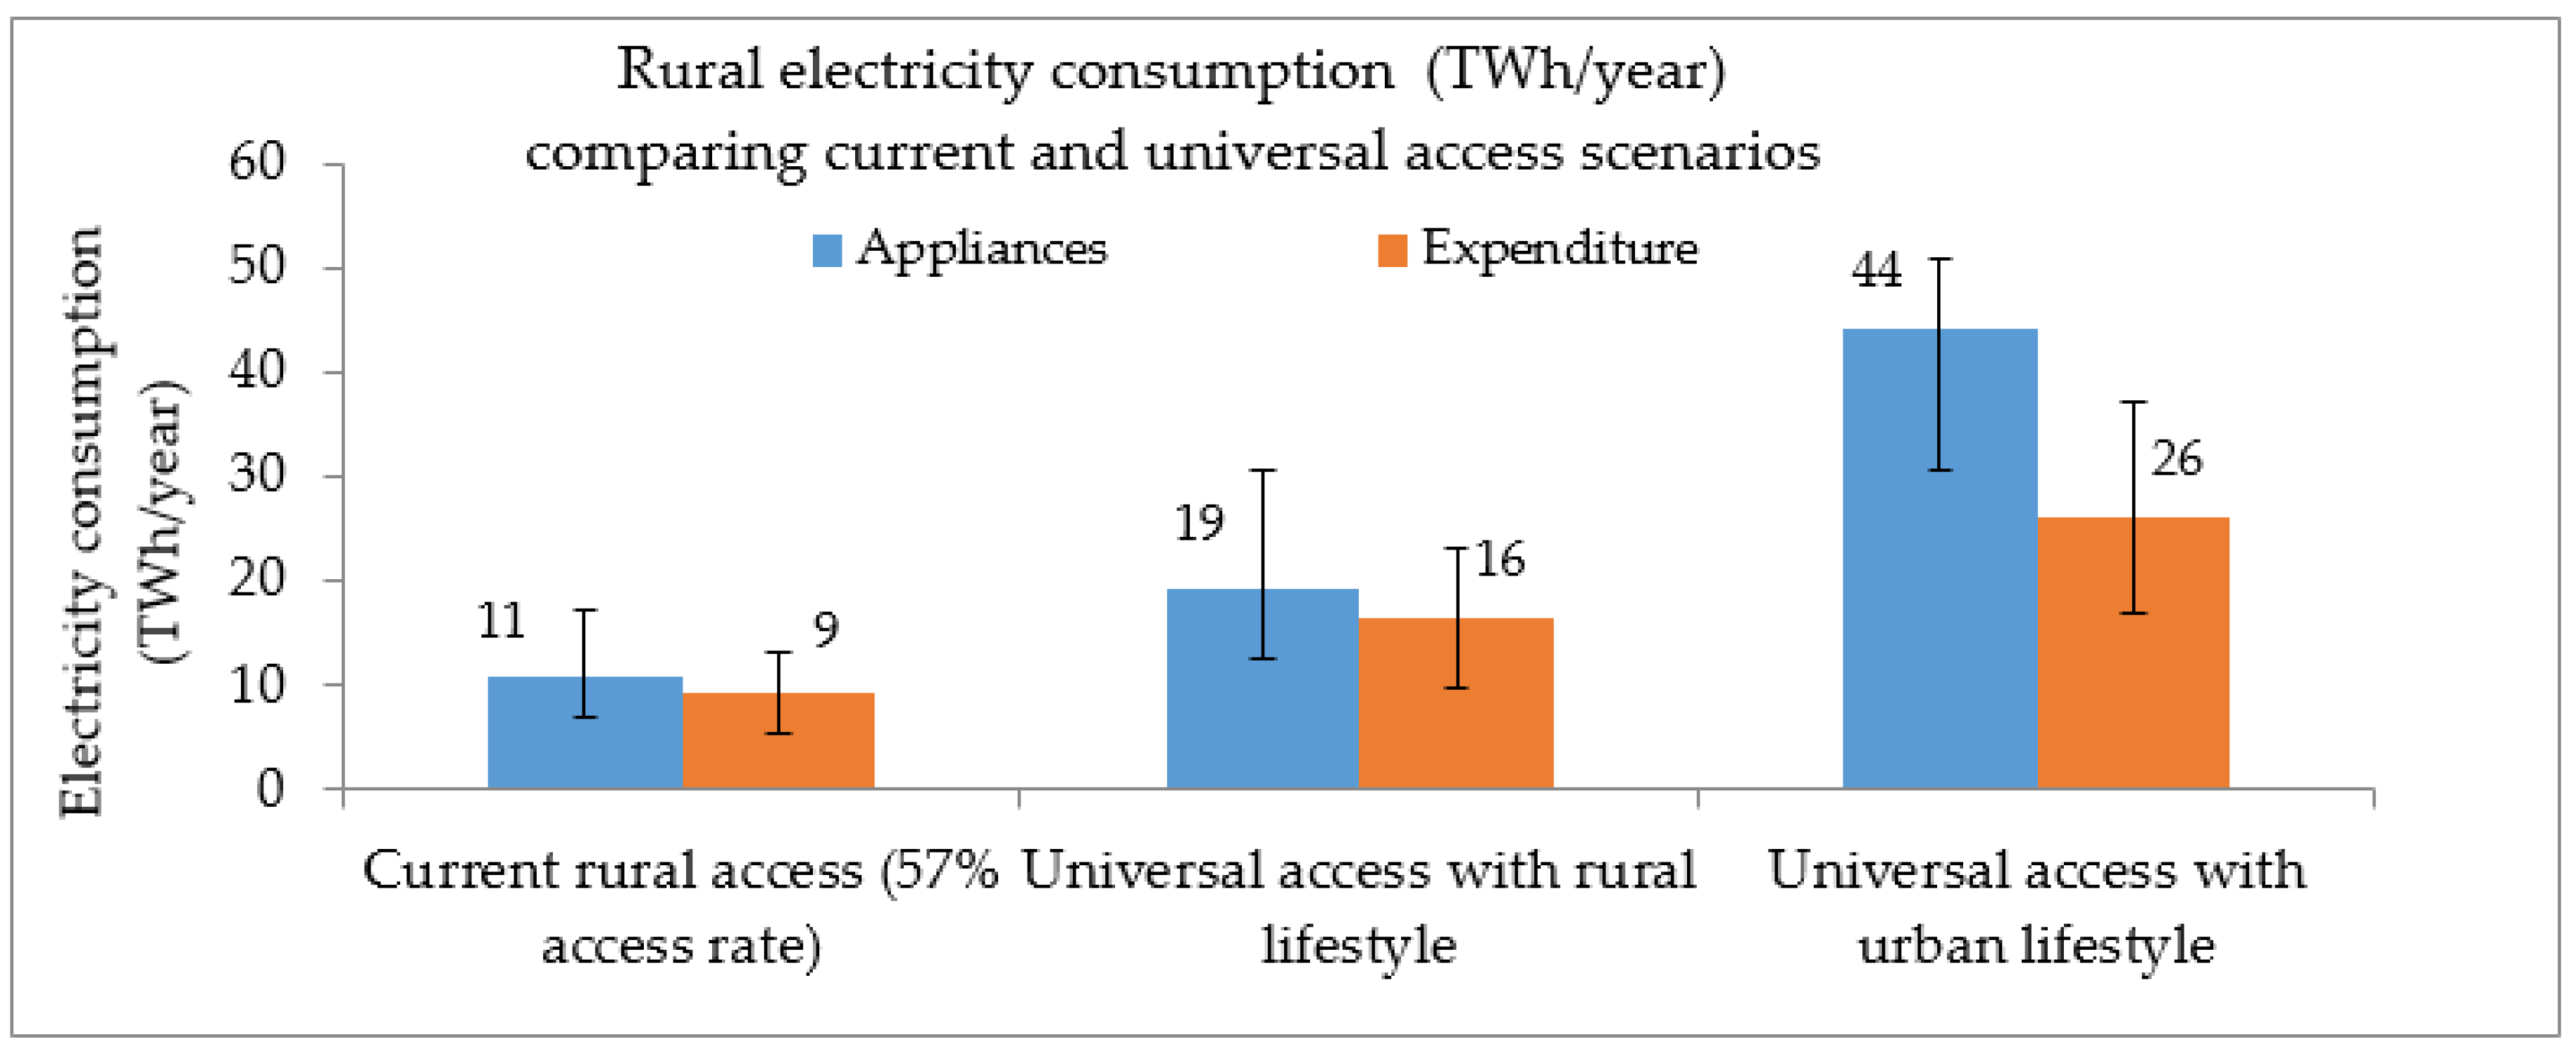
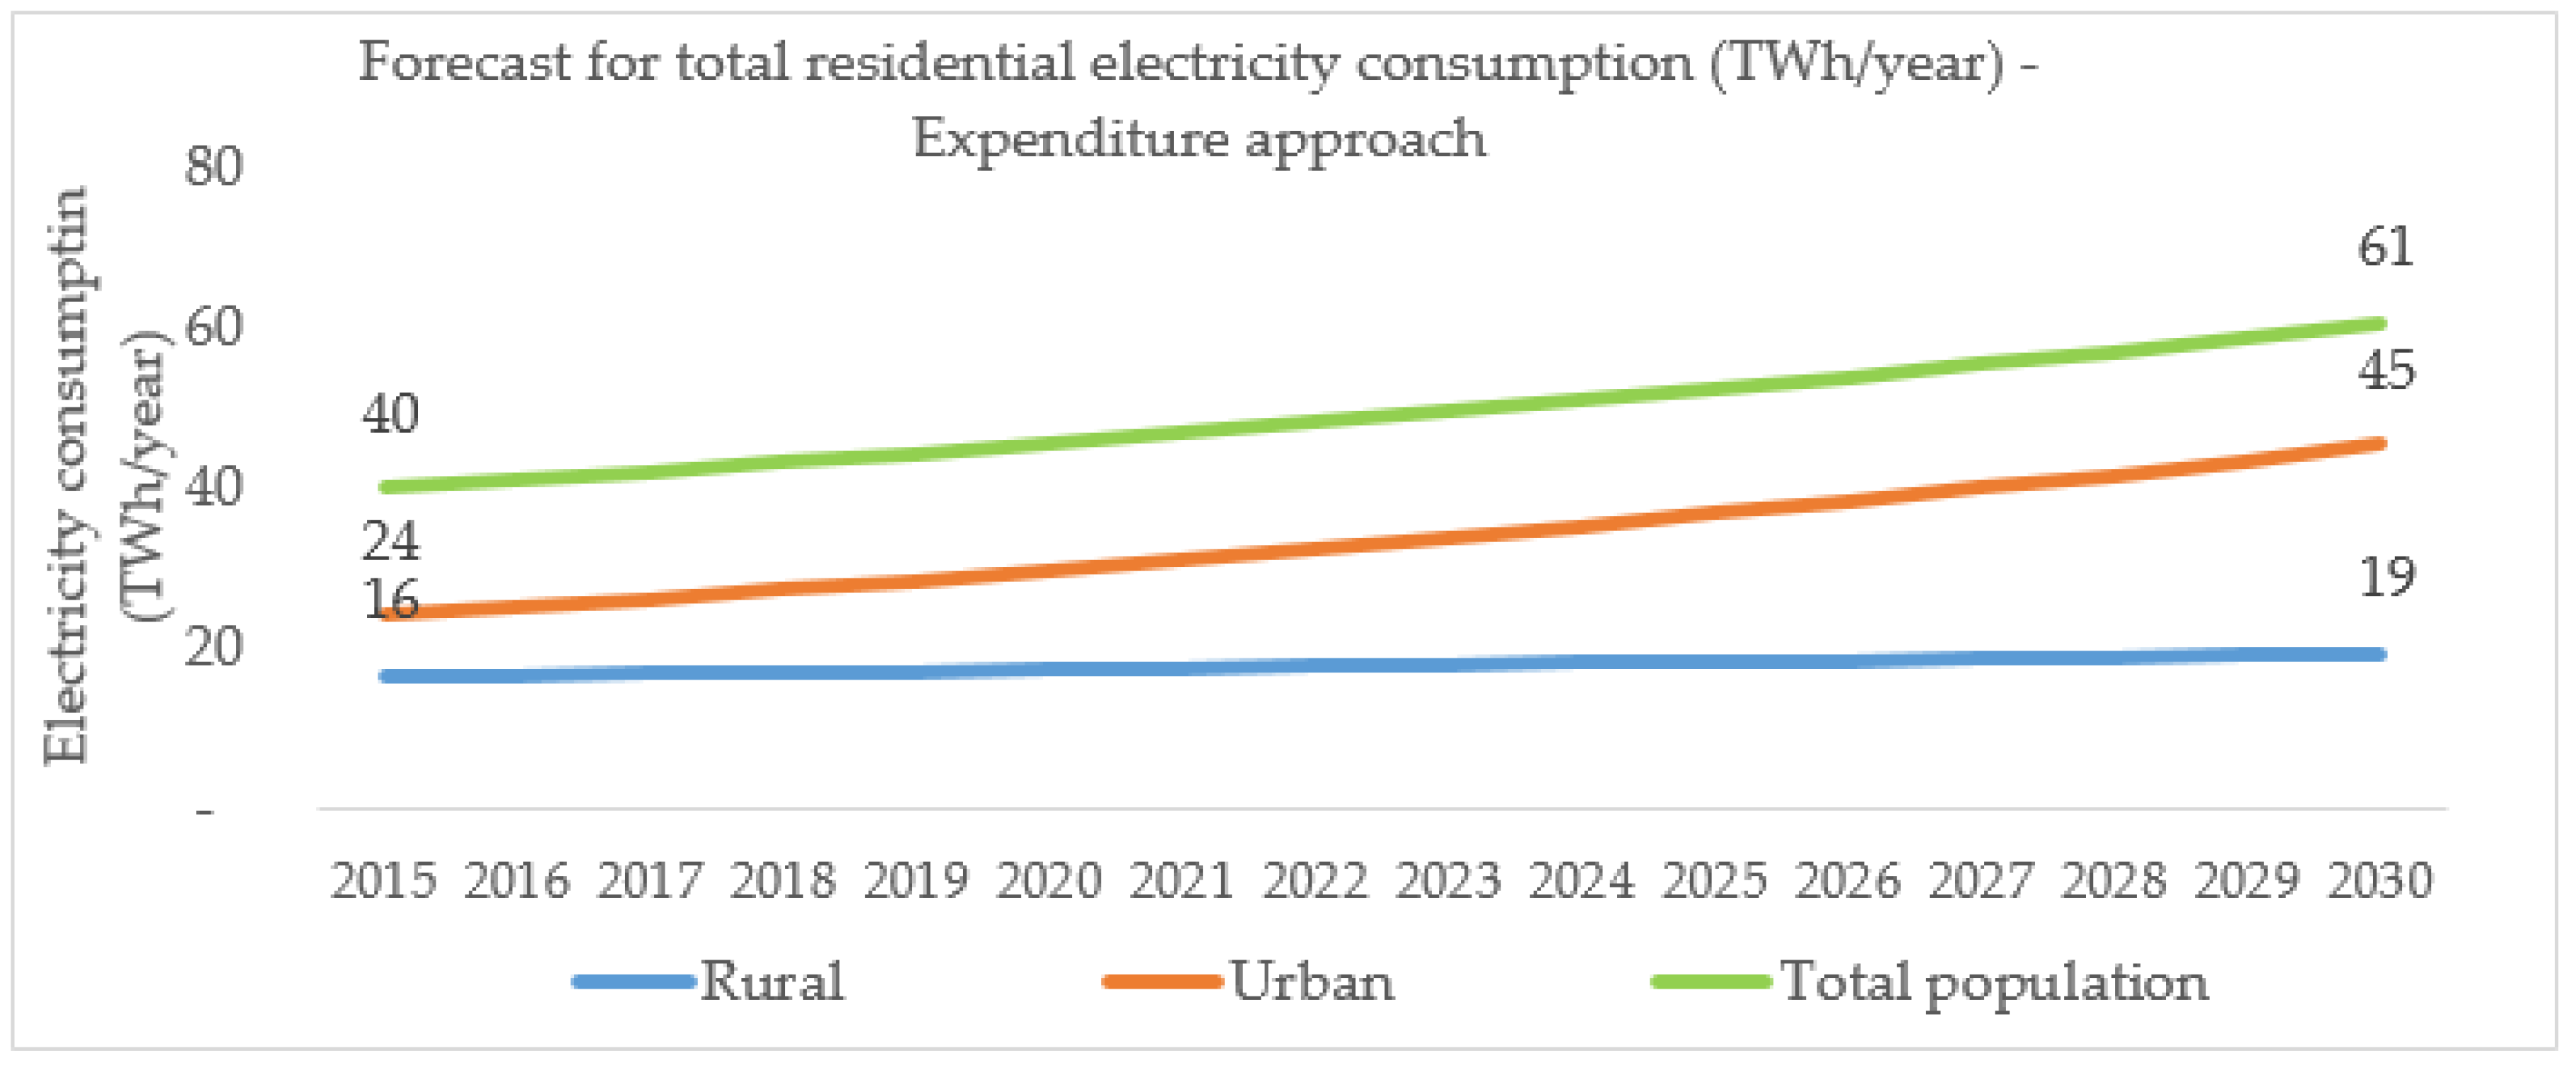
The urban/rural disparity can also be evaluated in terms of its implications for electricity consumption levels in the future. This is examined by assuming rural incomes and electricity usage patterns change to current urban patterns, under universal electricity access. This approach is considered here since urban households currently have near universal access (93%), although not 24 h electricity supply. Imputing urban access and consumption levels to rural households would imply that per capita electricity consumption in rural areas increases from between 9 kWh and 27 kWh per capita per month (with a median of 15–17 kWh), to between 15 kWh and 45 kWh per capita per month (with a median of 23–39 kWh), representing about 66% increase. Assuming no population changes, for the total rural population estimated at 94.1 million, this would amount to annual electricity consumption of between 17 TWh and 51 TWh (with a median of 26–44 TWh) per year. As shown in Figure 3, this represents about three-fold increase when compared to the current rural consumption of between 6 TWh and 17 TWh (with a median of 10–11 TWh), based on the current estimated rural electricity access rate of 57%.
These figures provide a range of values for the required electricity generation capacity under the scenario of universal electricity access in the rural areas in the future. Specifically, the upper limit of these demand estimates (i.e., 51 TWh) can be considered as the target rural residential electricity demand to be met under the scenario of universal electricity access in the rural area as defined here. To deliver this consumption target through solar PV for example, it would require around 23 GW of installed capacity (assuming a capacity factor of 25%).
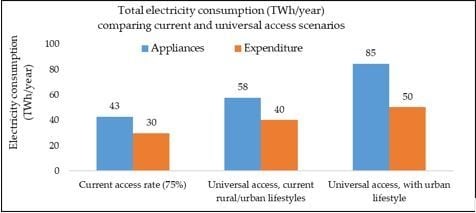
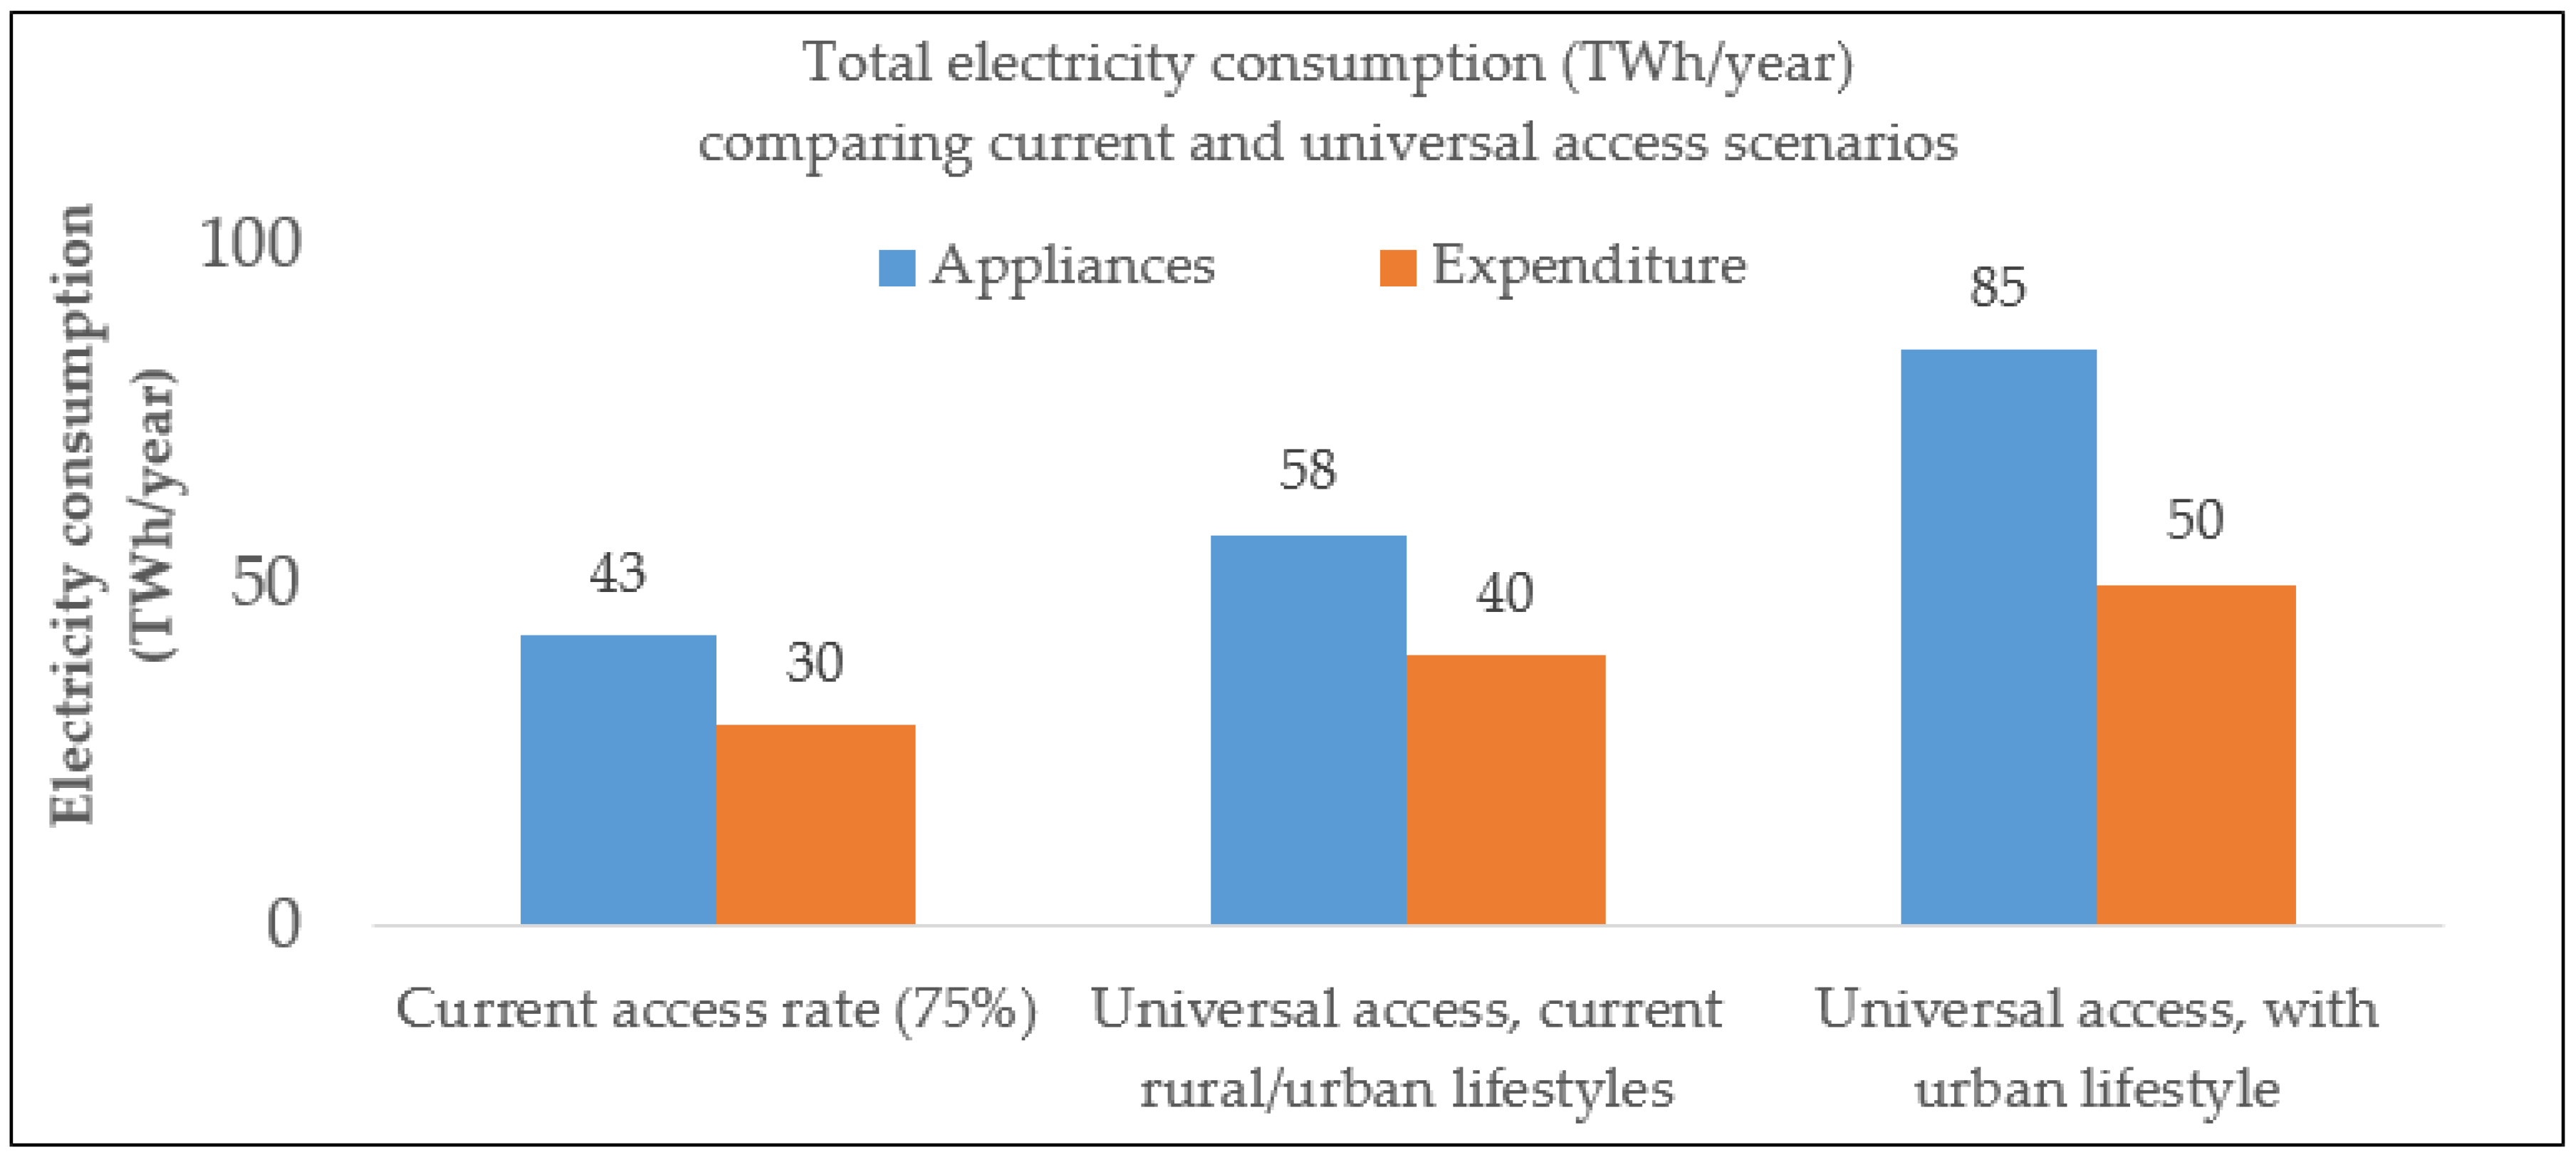
To assess the required electricity generation capacity for the total population under the universal access scenario, the total electricity consumption can be evaluated. Using the estimates of electricity consumption at the national level from Table 5 and considering a universal (100%) access scenario for the population of 181 million, total electricity consumption is estimated to yield a median of 40–58 TWh (by expenditure and appliances usage respectively). This is based on the current usage patterns and lifestyles of urban and rural households. In the future, rural households could be expected to move towards similar lifestyles as urban households and the rural population declines, electricity consumption under a 100% access scenario with current urban lifestyle and consumption pattern would reach a median of 50–85 TWh per year. In Figure 4, these results are compared to current consumption estimated in this study with median 30–43 TWh but for which only 75% of the population have electricity access.
Therefore, the future electricity supply could be expected to have installed generation capacity sufficient to meet the upper limit of the universal access scenario with urban lifestyle, that is 85 TWh. Such level of demand could potentially be met through, for example, a natural-gas powered combined cycle power plant with total installed capacity of about 17GW, assuming the plant operates with a capacity factor of 55.5%, or 39 GW of solar PV capacity with capacity factor of 25% [33]. Demand management measures should focus on behavioral changes to household electricity use through education, public enlightenment and advocacy efforts. This is to sensitize energy users to the need for electricity conservation and the promotion of energy efficient appliances at least until a state of stable supply is achieved. Such efforts could include reduced use of air conditioners and washing machines. However, whether households would be willing to adopt these practices may also be determined by factors such as location (urban/rural), standard of living (high/low income) and housing type (single unit or multi-level housing unit). Furthermore, encouraging the use of energy efficient appliances through regulation and promoting higher standards for electrical appliances would be an effective demand management policy. This would need to be targeted at high-income high-consumption households, although the policy may also be limited by the dominant share of low-income households in the population who may be unable to afford more expensive energy efficient appliances. Nevertheless, the study results suggest that household and per capita electricity consumption is currently low and this may hinder both current and future economic growth and sustainable development. As such, the policy options would likely be towards improving access to electricity, rather than curtailing demand, since there is significant currently unmet electricity demand. What do the regional disparities with respect to electricity consumption, access, expenditure and duration of supply mean for sustainable development? A lack of access to affordable grid electricity, or when electricity is only available for a short duration, impacts negatively on the economic opportunities available to households, especially given the fact that most households are dependent on non-farm enterprises (such as neighborhood kiosks and retail stores) typically associated with low-income households [23]. Moreover, it imposes an additional cost on households who are forced to divert a greater share of the household budget to electricity, or when they use alternative electricity sources (such as petrol/diesel generators and battery inverters). Yet, even these sources are not often guaranteed given the high initial set-up costs. Therefore, for those zones with relatively high poverty and lower incomes, the lack of energy access only further exacerbates the reality of inequality, social exclusion and deprivation for households.
In addition to this direct economic cost borne by households, there is the indirect environmental cost as a result of running generators which comes in form of noise pollution, risk of fires from unsafe fuel storage, or the inhalation of particulates such as PM10. According to the World Health Organization (WHO), in 2016 four Nigerian cities—3 in the South East and 1 in the North West—were listed among 20 cities in the world with the highest concentrations of particulate matter (PM10), an ambient air pollutant that can be traced to combustion of fuels [40]. As seen in Table 5, the South East is also one of the highest electricity consuming zones and this could potentially be one source of PM10 concentration especially given the short duration of electricity supply (Table 8). The use of fuelwood concurrently with modern energy has been observed among households in Northern Nigeria and is thus likely to continue in the absence of improved electricity access, a situation that would further worsen the state of deforestation in that region [41]. Therefore, the disparate access to affordable and stable electricity across regions, resulting in continued use of less efficient and more expensive energy sources, has broader implications for environmental sustainability across the regions.
The social aspect of sustainability can also be negatively affected by disparities in access to affordable, stable and reliable electricity, as household enterprises not only provide income and livelihood but also facilitate social interaction within communities. They are uniquely placed to provide commercial services often beyond regular daytime hours in low-income neighborhoods. Therefore, availability of both residence-based and streetlights can foster increased commercial services and the consequent social interaction.
The usefulness of the estimates provided in this study can be evaluated based on their importance to achieving the goals of national energy policy and the design of the future energy system towards universal energy access. Estimates of residential electricity consumption are critical to the design of the future energy system. Specifically, this study points to spatial differences in electricity consumption patterns and raises the prospects of introducing renewable energy technologies into the current gas-dominated energy system, leading the way for Nigeria’s energy transition to renewables. For example, the higher electricity consumption levels in the Southern zones can be a major consideration for the design of a local grid specifically for the zone, rather than a highly centralized national grid that involves high costs of transmission across the Northern and Southern zones. Moreover, consumers’ willingness to pay is likely to be higher among Southern residents since their electricity expenditure share of income is fairly low (at 4% compared to 7% for Northern households). Therefore, raising energy price to finance the energy transition would be more feasible in the South than in the North. Distributed generation system that utilizes local renewable energy resources in each region would help to facilitate a quicker energy transition.
Nevertheless, while the approaches demonstrated in this study are able to produce aggregate estimates of residential electricity consumption which are useful for energy policymaking typically considered at macro (aggregate) level, they present some limitation. First, these estimates exhibit wide variability at disaggregated (household) level. As a result, they may be less applicable in their current state for determining individual household electricity consumption, or in replacing actual meter readings for billing purposes. Specifically, because the expenditure approach involves having households recollect their monthly electricity expenditures, there is the possibility of inaccurate recollection without reference to records such as billing notices, purchase receipts or invoices. Similarly, the appliances method requires households to recall their ownership and daily use of electrical appliances but this may also be affected by the difficulty of detailed recollection. In addition, seasonal variations in use of appliances, for example using air conditioners for longer duration during the hot and dry months were not considered. The observed divergence between estimates from both approaches at household level could also be related to this study’s assumption that all units of an appliance have the same ratings and are in use at the same time for the same duration, all of which could influence the estimates one way or the other. However, since the objective of this study relates to energy system design (at macro level), the aggregate estimates are deemed sufficient.
Lastly, in considering the relative performance of both approaches, it was observed that the appliance approach estimates show wider dispersion and variability (higher standard deviation) than estimates from the expenditure approach. This is likely a result of the fact that the appliance approach relies on secondary data on appliance ratings and the assumption that all available quantities of each appliance are in operation for the same time, likely overstating electricity consumption. On the other hand, the expenditure approach estimates are entirely household-reported and is therefore likely to be more consistent. Further efforts are required to reduce the divergence between the approaches, so that the estimates from both approaches can be considered as a “consumption range.”
With regards to planning an energy transition to a situation of 100% electricity access in Nigeria, while there are many other factors to consider it is important to acknowledge the uncertainties even in existing energy consumption data. With the two approaches shown here, a range of estimates for current and, if extrapolated using population estimates and potentially economic or energy access improvement indicators, future electricity demand can be developed. In order to further understand the required infrastructure investment as a whole and the approaches that might be preferred in rural versus urban areas, the disaggregated, zone-by-zone and urban/rural data may offer more insight than a whole-of-country approach. Utilizing the data obtained in the current study to identify specific transitions at the sub-national level that can minimize the required investment while maximizing the access to energy is a target in the authors’ ongoing work.
Further work will also use the household electricity consumption estimates obtained in this study to evaluate household characteristics, energy-related behavior and preferences. Some of the questions to be considered include:
- -
- What energy behaviors and lifestyles are currently associated with households with different characteristics (e.g., income, electricity expenditure, access to electricity, level of consumption)?
- -
- What behaviors are necessary under the condition of universal access in order to ensure the sustainability of the future electricity system?
- -
- How can policy influence or motivate the required behavioral changes under the universal access scenario?
Specifically, since the residential sector represents the largest electricity demand sector, households’ socio-economic conditions, lifestyle and behavioral characteristics with respect to energy use, which affect electricity demand, will also be important considerations in the future electricity system design.
5. Conclusions
The availability of data on residential electricity consumption remains a major stumbling block for policymakers in developing countries where several households do not have electricity meters, meters are faulty, or electricity bills may be unreliable for determining household electricity consumption. Using household survey data, median residential electricity consumption is estimated at 18–27 kWh per capita but these estimates vary between the geographical zones with the North East and South West representing extremes. Under a universal access scenario, the future electricity supply system would be expected to have installed generation capacity sufficient to meet the estimated demand of 85 TWh. Such level of demand could potentially be met through, for example, a natural-gas powered combined cycle power plant with total installed capacity of about 17 GW assuming the plant operates with a capacity factor of 55.5%.
For energy policymaking at macro (aggregate) level, these estimates serve as input for the design of future energy systems especially as it could affect the financial viability of the energy supply system as well as equity considerations related to electricity access in Nigeria. However, the estimates may be less suited in their current state for determining individual household electricity consumption or substituting for actual meter readings for billing purposes.
The observed regional disparities in electricity consumption, access, expenditure and duration of supply also raise important implications for sustainable development, universal access and energy transition objectives. Such disparities, as well as the underlying economic conditions of consumers, should be important considerations in designing the future energy system to ensure long term sustainability. Nevertheless, reducing the variability in the estimates produced by the two approaches applied in this study and incorporating the estimates in the design of renewable energy based distributed generation systems are areas considered for further study.
Author Contributions
Kayode Olaniyan, Benjamin C. McLellan, Seiichi Ogata and Tetsuo Tezuka conceived and designed the study; Kayode Olaniyan performed the field survey, analyzed the data and wrote the paper.
Funding
This research was funded through a doctoral scholarship provided by the Ministry of Education, Sports and Culture (MEXT), Japan while funding for data collection was provided by the Graduate School of Energy Science, Kyoto University.
Acknowledgments
The authors are grateful to the three anonymous reviewers and the Editor for helpful comments to improve the paper.
Conflicts of Interest
The authors declare no conflict of interest.
Appendix A
Figure A1.
Differences between estimated per capita electricity consumption using Appliances and Expenditure approaches (Eha less Ehe).
Figure A1.
Differences between estimated per capita electricity consumption using Appliances and Expenditure approaches (Eha less Ehe).
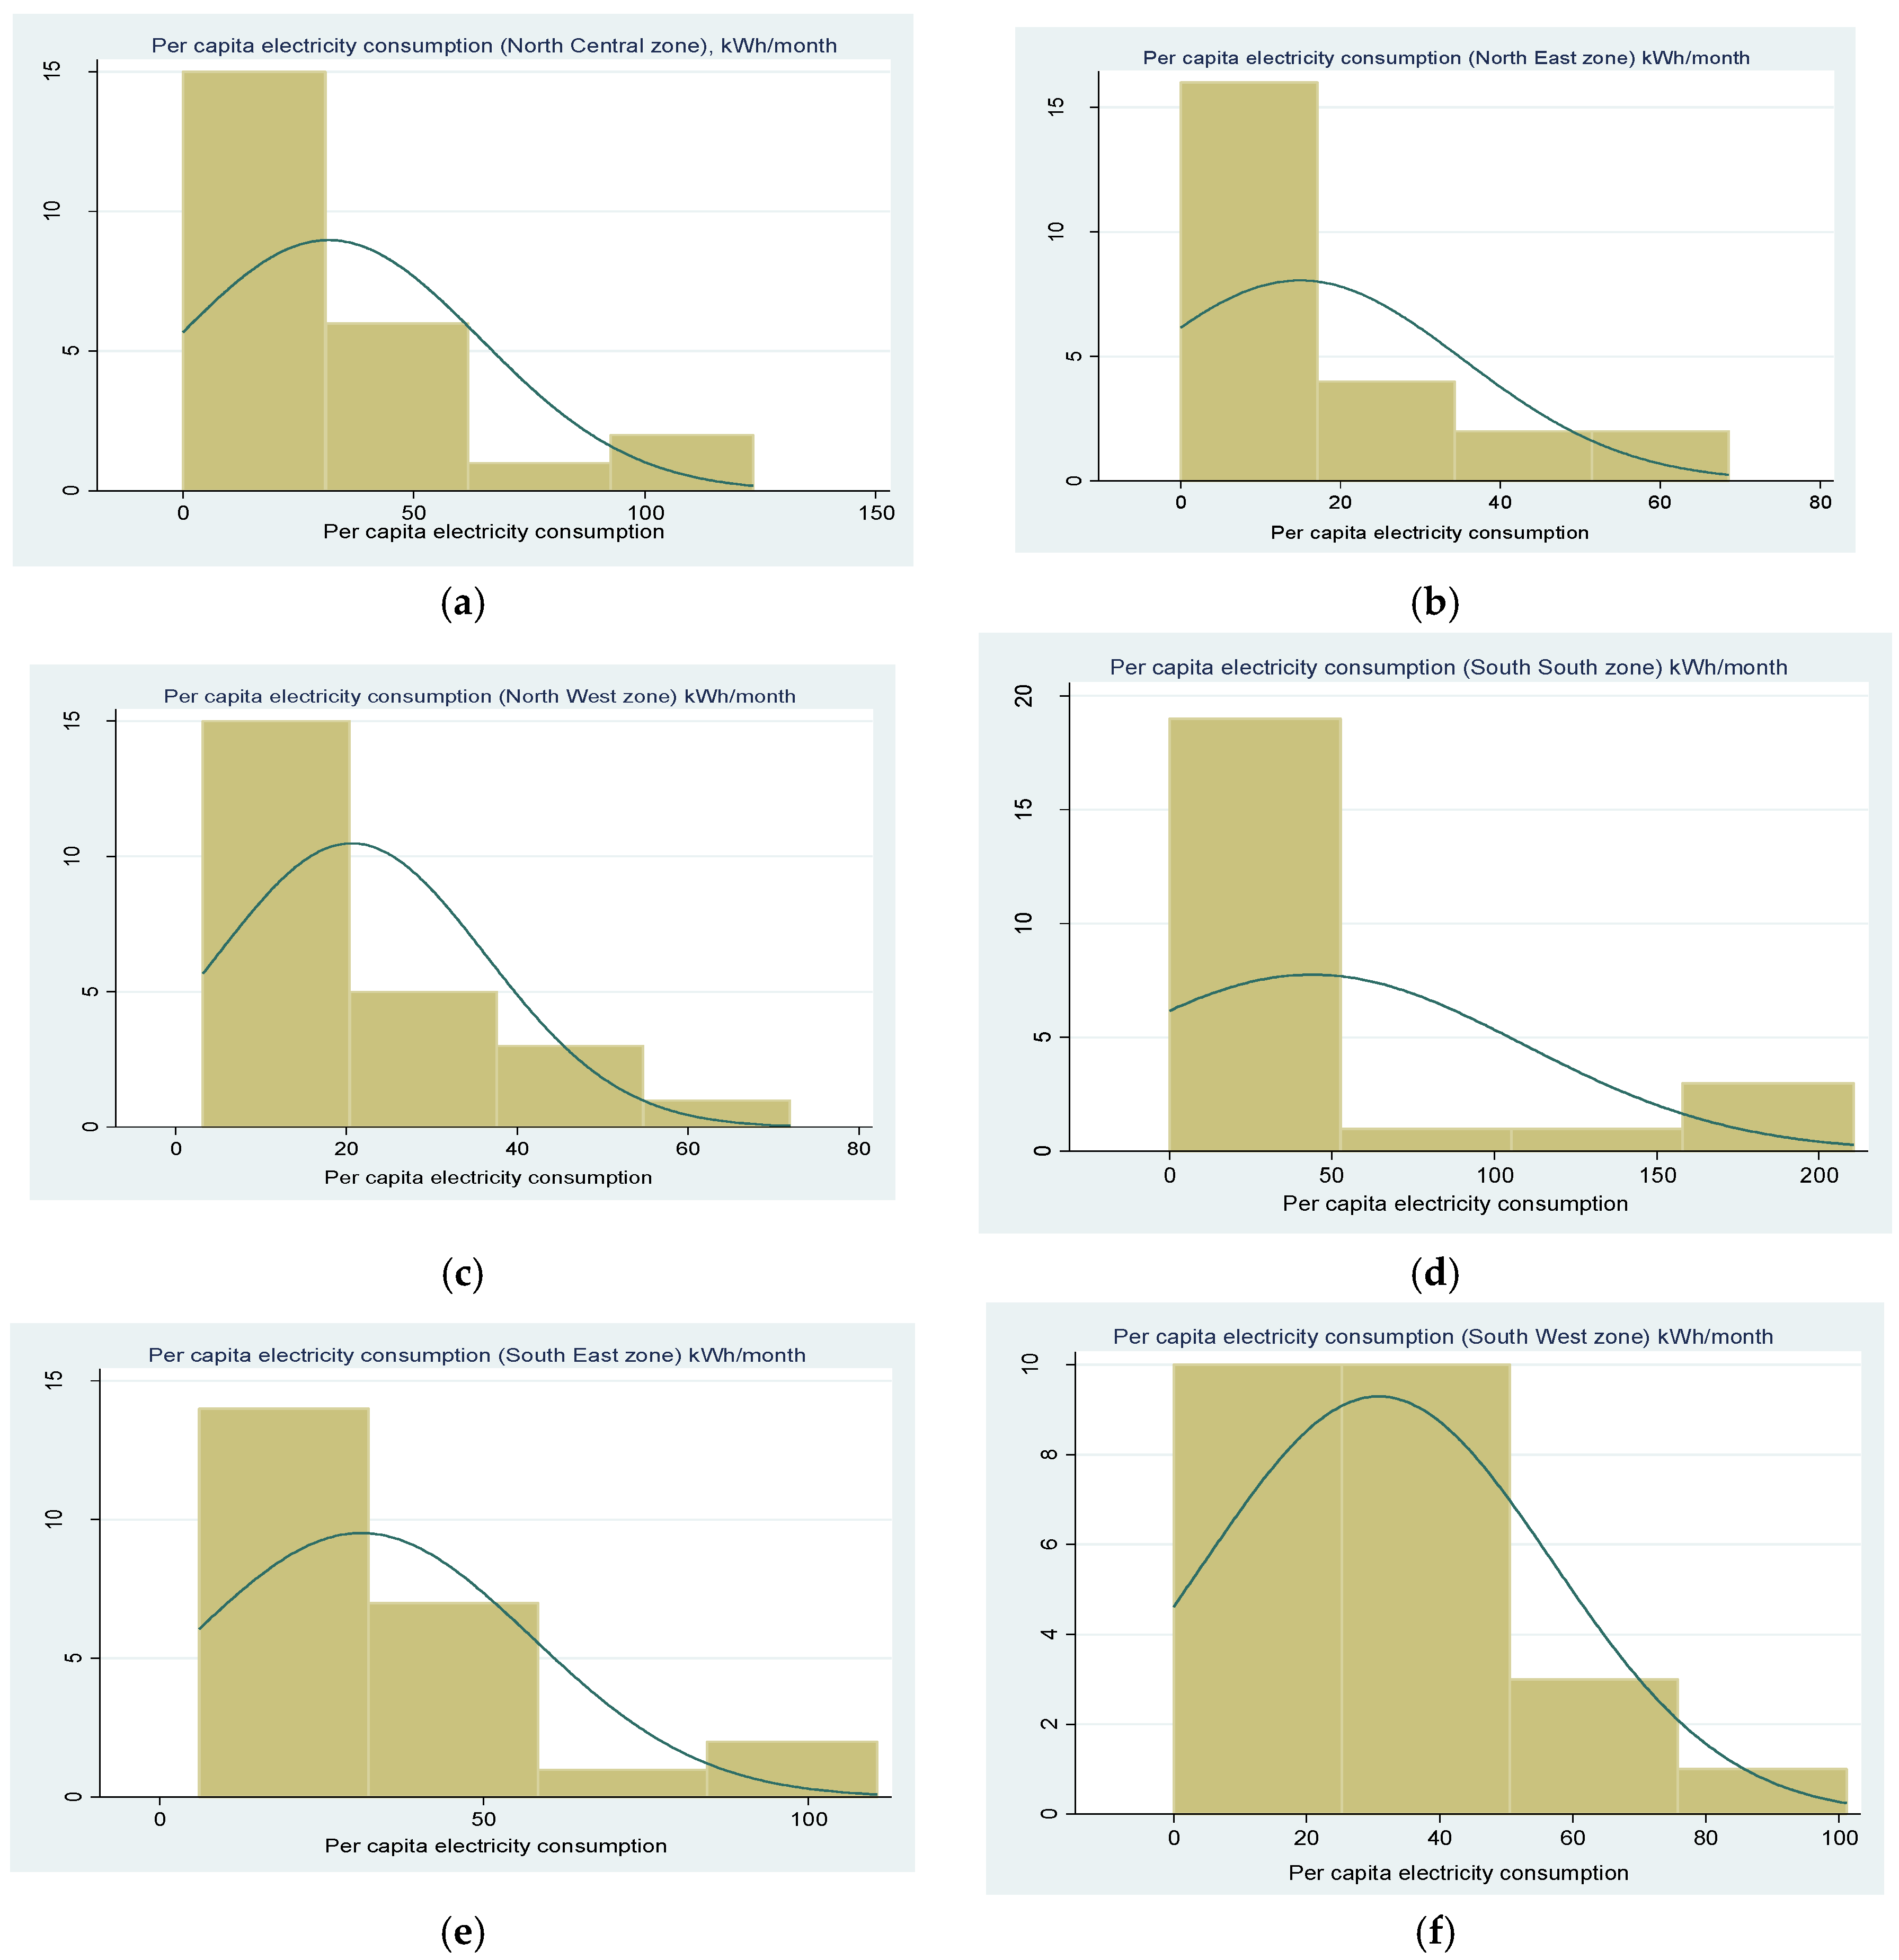
Figure A2.
Distribution of estimated electricity consumption per capita (kWh/month) by appliances usage approach for (a) North Central zone (b) North East zone (c) North West zone (d) South East zone (e) South South zone (f) South West zone (n = 24).
Figure A2.
Distribution of estimated electricity consumption per capita (kWh/month) by appliances usage approach for (a) North Central zone (b) North East zone (c) North West zone (d) South East zone (e) South South zone (f) South West zone (n = 24).

Figure A3.
Distribution of estimated electricity consumption per capita (kWh/month) by expenditure approach for (a) North Central zone (b) North East zone (c) North West zone (d) South East zone (e) South South zone (f) South West zone (n = 24).
Figure A3.
Distribution of estimated electricity consumption per capita (kWh/month) by expenditure approach for (a) North Central zone (b) North East zone (c) North West zone (d) South East zone (e) South South zone (f) South West zone (n = 24).
Figure A4.
Median per capita electricity consumption with 95% confidence intervals, kWh/month.
Figure A5.
Forecast of total residential electricity consumption (Numbers shown are median estimates from the Expenditure approach).
Figure A5.
Forecast of total residential electricity consumption (Numbers shown are median estimates from the Expenditure approach).
References
- Bazilian, M.; Nussbaumer, P.; Eibs-Singer, C.; Brew-Hammond, A.; Modi, V.; Sovacool, B.; Ramana, V.; Aqrawi, P.K. Improving Access to Modern Energy Services: Insights from Case Studies. Electr. J. 2012, 25, 93–114. [Google Scholar] [CrossRef]
- Ulsrud, K.; Winther, T.; Palit, D.; Rohracher, H. Village-level solar power in Africa: Accelerating access to electricity services through a socio-technical design in Kenya. Energy Res. Soc. Sci. 2015, 5, 34–44. [Google Scholar] [CrossRef]
- Groh, S. The role of energy in development processes—The energy poverty penalty: Case study of Arequipa (Peru). Energy Sustain. Dev. 2014, 18, 83–99. [Google Scholar] [CrossRef]
- Pachauri, S.; van Ruijven, B.J.; Nagai, Y.; Riahi, K.; van Vuuren, D.P.; Brew-Hammond, A.; Nakicenovic, N. Pathways to achieve universal household access to modern energy by 2030. Environ. Res. Lett. 2013, 8, 24015. [Google Scholar] [CrossRef]
- WHO. The Energy Access Situation in Developing Countries; UNDP WHO: New York, NY, USA, 2009; p. 142. [Google Scholar]
- International Energy Agency. Key World Energy Statistics; International Energy Agency: Paris, France, 2017. [Google Scholar]
- International Energy Agency (IEA) and the World Bank. Sustainable Energy for All 2017 Global Tracking Framework—Progress toward Sustainable Energy; World Bank: Washington, DC, USA, 2017. [Google Scholar]
- Urban, F.; Benders, R.M.J.; Moll, H.C. Modelling energy systems for developing countries. Energy Policy 2007, 35, 3473–3482. [Google Scholar] [CrossRef]
- IEA. Energy Access Outlook 2017: From Poverty to Prosperity; IEA: Paris, France, 2017; p. 144. [Google Scholar]
- Wyatt, P. A dwelling-level investigation into the physical and socio-economic drivers of domestic energy consumption in England. Energy Policy 2013, 60, 540–549. [Google Scholar] [CrossRef]
- Bartusch, C.; Odlare, M.; Wallin, F.; Wester, L. Exploring variance in residential electricity consumption: Household features and building properties. Appl. Energy 2012, 92, 637–643. [Google Scholar] [CrossRef]
- Sanquist, T.F.; Orr, H.; Shui, B.; Bittner, A.C. Lifestyle factors in U.S. residential electricity consumption. Energy Policy 2012, 42, 354–364. [Google Scholar] [CrossRef]
- Genjo, K.; Tanabe, S.; Matsumoto, S.; Hasegawa, K.; Yoshino, H. Relationship between possession of electric appliances and electricity for lighting and others in Japanese households. Energy Build. 2005, 37, 259–272. [Google Scholar] [CrossRef]
- Tso, G.K.F.; Yau, K.K.W. Predicting electricity energy consumption: A comparison of regression analysis, decision tree and neural networks. Energy 2007, 32, 1761–1768. [Google Scholar] [CrossRef]
- Kavousian, A.; Rajagopal, R.; Fischer, M. Determinants of residential electricity consumption: Using smart meter data to examine the effect of climate, building characteristics, appliance stock and occupants’ behavior. Energy 2013, 55, 184–194. [Google Scholar] [CrossRef]
- McLoughlin, F.; Duffy, A.; Conlon, M. Characterising domestic electricity consumption patterns by dwelling and occupant socio-economic variables: An Irish case study. Energy Build. 2012, 48, 240–248. [Google Scholar] [CrossRef]
- Ozawa, A.; Furusato, R.; Yoshida, Y. Determining the relationship between a household’s lifestyle and its electricity consumption in Japan by analyzing measured electric load profiles. Energy Build. 2016, 119, 200–210. [Google Scholar] [CrossRef]
- Ndiaye, D.; Gabriel, K. Principal component analysis of the electricity consumption in residential dwellings. Energy Build. 2011, 43, 446–453. [Google Scholar] [CrossRef]
- Dergiades, T. Estimating residential demand for electricity in the United States, 1965–2006. Energy Econ. 2008, 30, 2722–2730. [Google Scholar] [CrossRef]
- World Bank. World Development Indicators 2017; World Bank: Washington, DC, USA, 2017. [Google Scholar]
- Sunday, S.E. Electricity: Over 50 % Customers Unmetered 4yrs after Privatisation. Daily Trust Newspapers. 3 October 2017. Available online: https://www.dailytrust.com.ng/electricity-over-50-customers-unmetered-4yrs-after-privatisation.html (accessed on 3 October 2017).
- Ndujihe, C. Ejigbo Community Insists on Pre-Paid Meters. Vanguard Newspapers. 2017. Available online: https://www.vanguardngr.com/2017/03/ejigbo-community-insists-pre-paid-meters/ (accessed on 27 February 2018).
- National Bureau of Statistics. LSMS-Integrated Surveys on Agriculture General Household Survey Panel 2015/2016; National Bureau of Statistics: Abuja, Nigeria, 2016.
- United Nations Department of Economic and Social Affairs Population Division. World Population Prospects: The 2017 Revision; Key Findings and Advance Tables; Working Paper No. ESA/P/WP/248; United Nations: New York, NY, USA, 2017. [Google Scholar]
- Iwayemi, A. Nigeria’s Dual Energy Problems: Policy Issues and Challenges. Int. Assoc. Energy Econ. 2008, 53, 17–21. [Google Scholar]
- Ogunleye, E.K. Political Economy of Nigerian Power Sector Reform; UNU-WIDER: Helsinki, Finland, 2016. [Google Scholar]
- Jones, R.V.; Lomas, K.J. Determinants of high electrical energy demand in UK homes: Socio-economic and dwelling characteristics. Energy Build. 2015, 101, 24–34. [Google Scholar] [CrossRef] [Green Version]
- Zhou, S.; Teng, F. Estimation of urban residential electricity demand in China using household survey data. Energy Policy 2013, 61, 394–402. [Google Scholar] [CrossRef]
- Leahy, E.; Sean, S.L. Energy use and appliance ownership in Ireland. Energy Policy 2010, 38, 4265–4279. [Google Scholar] [CrossRef]
- Nerini, F.F.; Broad, O.; Mentis, D.; Welsch, M.; Bazilian, M.; Howells, M. A cost comparison of technology approaches for improving access to electricity services. Energy 2016, 95, 255–265. [Google Scholar] [CrossRef]
- Bhattacharyya, S.C. Energy Economics: Concepts, Issues, Markets and Governance; Springer: London, UK, 2011. [Google Scholar]
- National Bureau of Statistics. Premium Motor Spirit (Petrol) Price Watch for April 2017; National Bureau of Statistics: Abuja, Nigeria, 2017.
- U.S. Energy Information Administration. Monthly Energy Review; U.S. Energy Information Administration: Washington, DC, USA, 2017; pp. 193–217.
- Nigerian Electricity Regulatory Commission. How Much Do I Pay for Electricity? 2017. Available online: http://nerc.gov.ng/index.php/home/consumers/how-much-do-i-pay-for-electricity (accessed on 3 October 2017).
- Nigerian Electricity Regulatory Commission. Enugu Disco Tariffs. 2017. Available online: http://nerc.gov.ng/nercdocs/tariffs/enugu-tariff.pdf (accessed on 27 February 2018).
- UCL Centre for Applied Statistics Courses. Confidence Intervals for a Median. 2010. Available online: http://www.ucl.ac.uk/ich/short-courses-events/about-stats-courses/stats-rm/Chapter_8_Content/confidence_interval_single_median (accessed on 30 December 2017).
- Bhatia, M.; Angelou, N. Beyond Connections Energy Access Redefined; World Bank: Washington, DC, USA, 2015; pp. 58–177. [Google Scholar]
- Sun, X.; Li, J.; Qiao, H.; Zhang, B. Energy implications of China’s regional development: New insights from multi-regional input-output analysis. Appl. Energy 2017, 196, 118–131. [Google Scholar] [CrossRef]
- Yu, H. The influential factors of China’s regional energy intensity and its spatial linkages: 1988–2007. Energy Policy 2012, 45, 583–593. [Google Scholar] [CrossRef]
- World Health Organization. Ambient Air Pollution Database. 2016. Available online: http://www.who.int/phe/health_topics/outdoorair/databases/cities/en/ (accessed on 3 October 2017).
- Baiyegunhi, L.J.S.; Hassan, M.B. Rural household fuel energy transition: Evidence from Giwa LGA Kaduna State, Nigeria. Energy Sustain. Dev. 2014, 20, 30–35. [Google Scholar] [CrossRef]
Figure 1.
Map of Nigeria showing six geopolitical zones and study locations.

Figure 2.
Per capita electricity expenditure as share of income per capita.
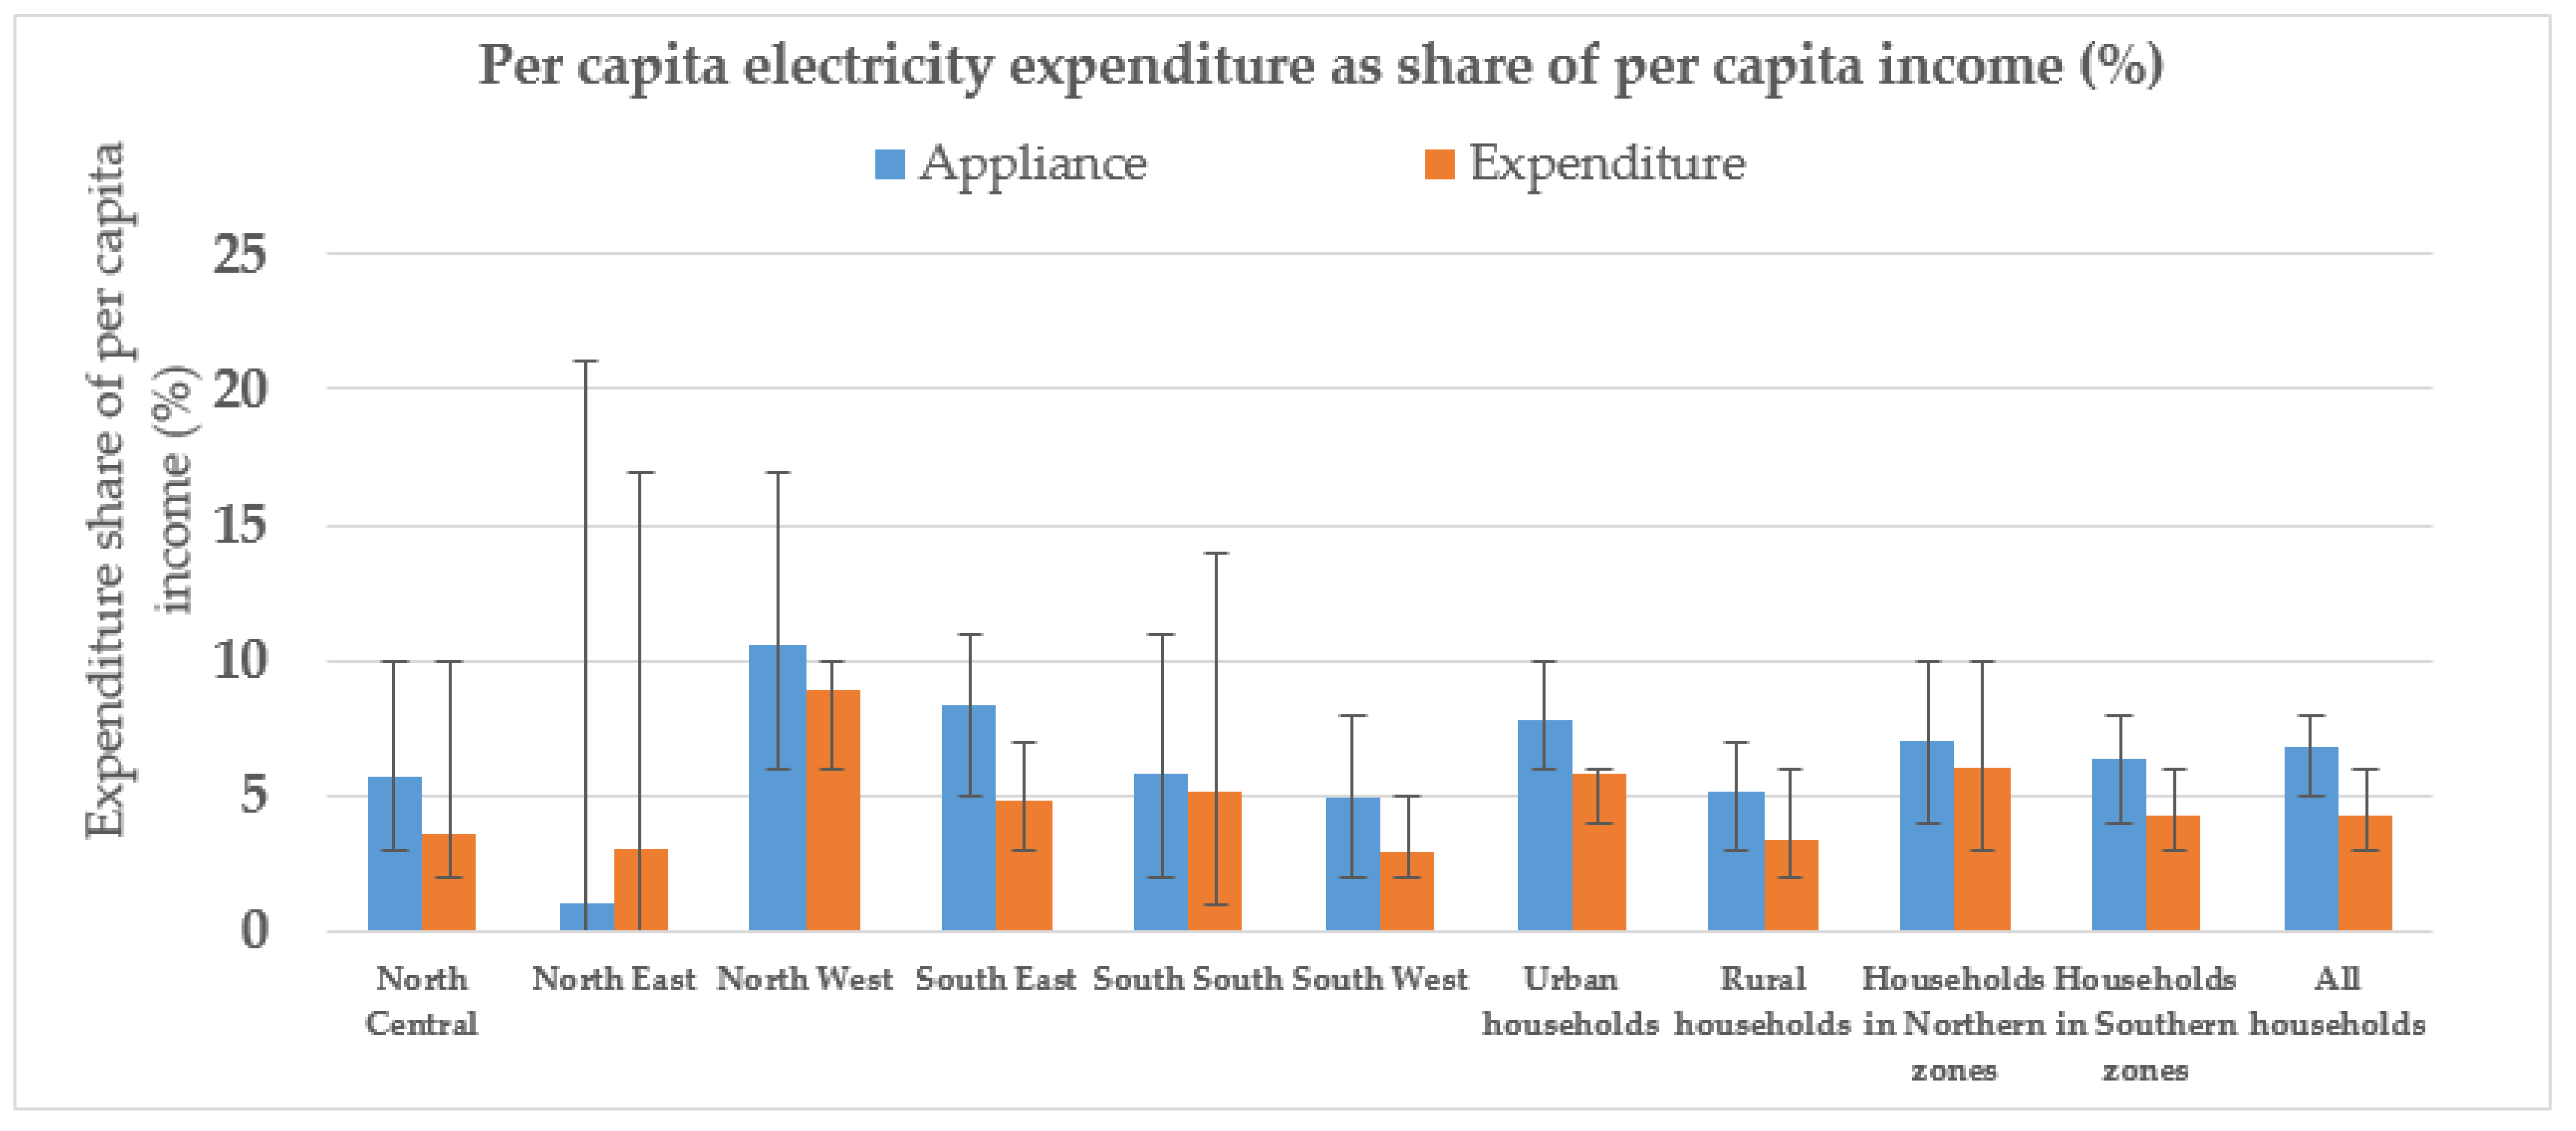
Figure 3.
Estimates of rural electricity consumption under 3 different scenarios (Numbers shown are median estimates from the Appliances usage and Expenditure approaches and error bars indicate 95% confidence interval).
Figure 3.
Estimates of rural electricity consumption under 3 different scenarios (Numbers shown are median estimates from the Appliances usage and Expenditure approaches and error bars indicate 95% confidence interval).
Figure 4.
Estimates of total residential electricity consumption under 3 different scenarios (Numbers shown are median estimates from the Appliances usage and Expenditure approaches).
Figure 4.
Estimates of total residential electricity consumption under 3 different scenarios (Numbers shown are median estimates from the Appliances usage and Expenditure approaches).

Table 1.
Selected indicators of Nigeria’s six geopolitical zones.
| Indicator | North Central | North East | North West | South East | South South | South West |
|---|---|---|---|---|---|---|
| 2015 Population (million) * | 27 | 24 | 46 | 21 | 27 | 36 |
| Pop density (000/km2) | 0.7 | 0.4 | 1.3 | 2.9 | 1.8 | 3.9 |
| Av. household size | 6 | 8 | 7 | 4 | 5 | 4 |
| Literacy rate (%) | 58 | 51 | 56 | 81 | 82 | 85 |
| Av. Poverty rate (%) | 66 | 76 | 75 | 57 | 53 | 50 |
| Electricity access (%) | 45 | 26 | 39 | 71 | 82 | 75 |
Table 2.
Study areas and sampling.
| Zone | State | Local Government Area (Municipality) | Number of Selected Households | ||
|---|---|---|---|---|---|
| Rural | Urban | ||||
| 1 | North Central | Plateau | Jos North | 12 | 12 |
| 2 | North East | Gombe | Akko | 12 | 12 |
| 3 | North West | Kaduna | Chikun | 12 | 12 |
| 4 | South East | Enugu | Enugu North | 12 | 12 |
| 5 | South South | Cross River | Calabar Municipal | 12 | 12 |
| 6 | South West | Oyo | Akinyele | 12 | 12 |
| Total number of households | 144 | ||||
Table 3.
Appliance categories and power ratings.
| S/N | Category | Appliance | Power Rating (Watts) | |||
|---|---|---|---|---|---|---|
| Range | Mean | Mode | Median | |||
| 1 | Lighting | Incandescent lamps 1,** | 60–100 | 80 | 80 | 80 |
| 2 | Fluorescent lamps | 9–18 | 10 | 9 | 9 | |
| 3 | Compact fluorescent | 3–85 | 11 | 5 | 8 | |
| 4 | Cooking | Rice cooker | 450–1500 | 946 | 1000 | 1000 |
| 5 | Water dispenser | 500–670 | 607 | 640 | 640 | |
| 6 | Food blender | 250–700 | 323 | 300 | 300 | |
| 7 | Refrigerator 1,* | 225 | 225 | 225 | 225 | |
| 8 | Freezer | 277–386 | 286 | 277 | 277 | |
| 9 | Toaster | 700–1300 | 754 | 750 | 750 | |
| 10 | Coffee machine | 700–1300 | 983 | 700 | 1000 | |
| 11 | Microwave oven | 600–1550 | 814 | 700 | 800 | |
| 12 | Boiling ring | 1000 | 1000 | 1000 | 1000 | |
| 13 | Electric kettle | 800–3000 | 1832 | 2000 | 1800 | |
| 14 | Hot plate | 1000–1500 | 1215 | 1000 | 1000 | |
| 15 | Electric cooker/oven | 1000–2000 | 1215 | 1000 | 1000 | |
| 16 | Entertainment | Mobile phones (charging) 1,** | 2–4 | 3 | 3 | 3 |
| 17 | TV 1,** | 70–339 | 205 | 205 | 205 | |
| 18 | PC (desktop) 1,** | 80–120 | 100 | 100 | 100 | |
| 19 | Radio 1,** | 60 | 60 | 60 | 60 | |
| 20 | CD/DVD player 1,* | 17 | 17 | 17 | 17 | |
| 21 | PC (laptop) (charging) 1,* | 60–250 | 155 | 155 | 155 | |
| 22 | Laundry | Washing machine | 200–460 | 228 | 200 | 200 |
| 23 | Iron | 800–2400 | 1254 | 1200 | 1200 | |
| 24 | Hair dryer | 850–2200 | 1069 | 1000 | 1000 | |
| 25 | Vacuum cleaner | 700–2300 | 1709 | 1600 | 1600 | |
| 26 | Water heater | 1500–5000 | 1916 | 1500 | 1500 | |
| 27 | Cooling | Fan | 47–140 | 80 | 75 | 75 |
| 28 | Air conditioner | 845–12,500 | 1872 | 1200 | 1230 | |
Data sources: Konga Online (www.konga.com); * US Department of Energy (www.energy.gov); ** Wholesalesolar Inc. (www.wholesalesolar.com); 1 Mean, mode and median are taken as midpoint of range.
Table 4.
Average energy prices.
| Average Energy Prices | North Central | North East | North West | South East | South South | South West | Ref. |
|---|---|---|---|---|---|---|---|
| Petrol (Naira/L) | 148 | 145 | 149 | 151 | 148 | 151 | [32] |
| Electricity (Naira/kWh) | 24 | 24 | 24 | 27 | 24 | 23 | [34] |
| Petrol (US cents/L) | 41 | 40 | 41 | 42 | 41 | 42 | |
| Electricity (US cents/kWh) | 7 | 7 | 7 | 8 | 7 | 6 |
Note: 1.00 United States dollar = 360.00 Nigerian Naira (as at 31 October 2017; Source: www.xe.com).
Table 5.
Median per capita residential electricity consumption with confidence intervals, kWh/month.
Table 5.
Median per capita residential electricity consumption with confidence intervals, kWh/month.
| Household Category | n | Appliances | Expenditure | NBS [23] | IEA [6] | ||||
|---|---|---|---|---|---|---|---|---|---|
| Median | Lower CI | Upper CI | Median | Lower CI | Upper CI | ||||
| North Central | 24 | 33 | 17 | 45 | 23 | 15 | 41 | 14 | - |
| North East | 24 | 1 | 0 | 20 | 4 | 0 | 21 | 11 | - |
| North West | 24 | 22 | 13 | 41 | 15 | 12 | 21 | 14 | - |
| South East | 24 | 36 | 27 | 81 | 23 | 12 | 37 | 19 | - |
| South South | 24 | 24 | 7 | 53 | 15 | 7 | 41 | 21 | - |
| South West | 24 | 30 | 17 | 93 | 26 | 11 | 43 | 23 | - |
| Urban households | 72 | 39 | 27 | 45 | 23 | 15 | 33 | 20 | - |
| Rural households | 72 | 17 | 11 | 27 | 15 | 9 | 21 | 14 | - |
| Households in Northern zones | 72 | 20 | 13 | 29 | 17 | 14 | 21 | 13 | - |
| Households in Southern zones | 72 | 33 | 26 | 46 | 23 | 14 | 33 | 21 | - |
| National | 144 | 27 | 20 | 36 | 18 | 15 | 23 | 17 | 12 |
Note: n indicates sample size (Table 2); CI indicates 95% confidence interval.
Table 6.
Average annual per capita electricity expenditure (US$ per year).
| Household Category | Appliances Approach | Expenditure Approach | NBS [23] | ||||
|---|---|---|---|---|---|---|---|
| Median | Lower CI | Upper CI | Median | Lower CI | Upper CI | ||
| North Central | 27 | 14 | 37 | 18 | 13 | 33 | 11 |
| North East | 1 | 0 | 16 | 3 | 0 | 17 | 9 |
| North West | 18 | 10 | 34 | 13 | 11 | 17 | 12 |
| South East | 30 | 22 | 66 | 29 | 14 | 33 | 17 |
| South South | 19 | 6 | 43 | 23 | 6 | 41 | 17 |
| South West | 24 | 14 | 75 | 20 | 8 | 33 | 18 |
| Urban households | 32 | 21 | 37 | 20 | 17 | 33 | 16 |
| Rural households | 14 | 9 | 22 | 12 | 8 | 17 | 12 |
| Households in Northern zones | 16 | 10 | 23 | 14 | 11 | 17 | 11 |
| Households in Southern zones | 27 | 21 | 37 | 20 | 17 | 33 | 17 |
| All households | 21 | 16 | 29 | 17 | 13 | 20 | 14 |
Note: CI indicates 95% confidence interval.
Table 7.
Measures of households’ electricity access (percentage).
| Household Category | Households Connected to Public Utility (%) | Households that Rely Mainly on Public Utility (%) | Electricity in Dwelling (NBS) (%) [23] | Electrification Rate, (IEA) (%) [9] |
|---|---|---|---|---|
| North Central | 83 | 83 | 45 | - |
| North East | 50 | 50 | 26 | - |
| North West | 96 | 92 | 39 | - |
| South East | 79 | 67 | 71 | - |
| South South | 50 | 38 | 82 | - |
| South West | 92 | 79 | 75 | - |
| Urban households | 93 | 81 | 86 | 86 |
| Rural households | 57 | 56 | 41 | 34 |
| Households in Northern zones | 76 | 75 | - | - |
| Households in Southern zones | 74 | 61 | - | - |
| All households | 75 | 68 | 59 | 61 |
Table 8.
Reported duration of electricity supplied and used.
| Household Category | Hours with Electricity in a Day | Maximum Hours of Operating an Appliance in a Day | |||||
|---|---|---|---|---|---|---|---|
| Median | Lower CI | Upper CI | NBS [23] | Median | Lower CI | Upper CI | |
| North Central | 11 | 7 | 14 | 6 | 8 | 6 | 10 |
| North East | 4 | 3 | 4 | 5 | 2 | 0 | 2 |
| North West | 8 | 7 | 10 | 4 | 6 | 5 | 12 |
| South East | 10 | 8 | 12 | 4 | 7 | 6 | 8 |
| South South | 3 | 0 | 5 | 4 | 4 | 2 | 5 |
| South West | 8 | 6 | 12 | 7 | 8 | 5 | 8 |
| Urban households | 8 | 6 | 10 | 6 | 6 | 5 | 8 |
| Rural households | 6 | 4 | 8 | 4 | 5 | 4 | 6 |
| Households in Northern zones | 7 | 5 | 8 | 5 | 6 | 5 | 6 |
| Households in Southern zones | 8 | 6 | 9 | 5 | 6 | 5 | 7 |
| All households | 8 | 6 | 8 | 5 | 6 | 5 | 6 |
Note: CI indicates 95% confidence interval.
© 2018 by the authors. Licensee MDPI, Basel, Switzerland. This article is an open access article distributed under the terms and conditions of the Creative Commons Attribution (CC BY) license (http://creativecommons.org/licenses/by/4.0/).
Share and Cite
MDPI and ACS Style
Olaniyan, K.; McLellan, B.C.; Ogata, S.; Tezuka, T. Estimating Residential Electricity Consumption in Nigeria to Support Energy Transitions. Sustainability 2018, 10, 1440. https://doi.org/10.3390/su10051440
AMA Style
Olaniyan K, McLellan BC, Ogata S, Tezuka T. Estimating Residential Electricity Consumption in Nigeria to Support Energy Transitions. Sustainability. 2018; 10(5):1440. https://doi.org/10.3390/su10051440
Chicago/Turabian StyleOlaniyan, Kayode, Benjamin C. McLellan, Seiichi Ogata, and Tetsuo Tezuka. 2018. "Estimating Residential Electricity Consumption in Nigeria to Support Energy Transitions" Sustainability 10, no. 5: 1440. https://doi.org/10.3390/su10051440
Note that from the first issue of 2016, this journal uses article numbers instead of page numbers. See further details here.