Article

Farmers’ and Consumers’ Preferences for Drinking Water Quality Improvement through Land Management Practices: The Case Study of the Soyang Watershed in South Korea

1
Professorship of Ecological Services, Faculty of Biology, Chemistry and Earth Sciences, BayCEER, University of Bayreuth, Universitaetsstrasse 30, 95440 Bayreuth, Germany
2
Department of Sustainable Development Research, Korea Environment Institute, Sejong 30147, Korea
3
Institute for Environmental Economics and World Trade, Leibniz University Hannover, 30167 Hannover, Germany
4
Department of Agricultural and Resource Economics, Kangwon National University, Chuncheon 24341, Korea
*
Author to whom correspondence should be addressed.
Sustainability 2018, 10(5), 1419; https://doi.org/10.3390/su10051419
Submission received: 31 January 2018 / Revised: 27 April 2018 / Accepted: 30 April 2018 / Published: 3 May 2018
(This article belongs to the Special Issue Degradation and Sustainable Management of Land)

Abstract

:
The drinking water quality along the Soyang watershed has been affected negatively by the intensive agricultural practices in the upstream area. Our study used a choice experiment method in order to estimate the values that the upstream water providers (i.e., farmers) and downstream water users (i.e., consumers) attach to the following attributes, namely, the agricultural profits, water quality, and biodiversity level of the Soyang watershed in South Korea. The preferences of the upstream water providers and downstream water users were presented by a conditional logit model and with interactions. The results from the conditional logit model specifications revealed that water quality is the most important attribute that is preferred by the downstream water users and upstream farmers. Both the upstream farmers and downstream water users have put substantial values on the protection of water bodies in the Soyang watershed, and are concerned about the consequences of water usage on the environment and human health. The respondents in each income group and in different local communities with income levels seemed to have different implicit costs for the water quality improvement in the Soyang watershed. Our study has provided robust results regarding the benefits of water improvement using sustainable land management and can be considered as a fundamental input for aiding the sustainable water–land nexus policies. We suggest that the government carefully designs a policy so as to compensate the highland farmers for their income losses as a result of the changing farming practices.

1. Introduction

The nexus of land resources, human activities, and climate are connected with the productive and sustainable management of a land-use system. Sustainable land management is essentially a part of natural resource management and integrated landscape management. The previous literature on the ecosystem services valuation, via the realization of the complex linkages between ecosystem services and human activities, has stressed the importance of the integrated social, ecological, and monetary aspects of the values of ecosystem services [1,2]. The assessment of the trade-off and synergies for the pluralistic values on the ecosystem services has been conducted, with the aim to achieve sustainability [3,4]. To support the decision-making process, an integrated valuation, covering monetary and non-monetary valuation, has gained particular attention for both the temporal and spatial scales and for multiple stakeholders.
Furthermore, sustainable water resource management is important in order to support human life and agricultural production processes, as well as to provide water-related ecosystem services [5,6]. As water quality degradation is becoming more serious in some parts of the world, particular attention has been increasingly paid to protecting the water quality of the watershed at multiple scales. In an upstream watershed, improper farm management can lead to land degradation, soil depletion, and water pollution in a river basin [7]. Given the harmful effects of water quality degradation through inappropriate land use management, it is imperative that we consider relevant options for improved land use management and sustainable water management [8]. For example, changes in farm management, such as the adoption of advanced farming methods, can have the potential to mitigate negative impacts on the environment, as well as gain various benefits from the environment.
The Soyang Lake is the deepest artificial reservoir in South Korea [9]. The Lake has a considerable significance as it is a major drinking water source for the downstream area, especially the capital city of South Korea. However, the water quality level was extremely reduced from the upstream areas, in the Gangwon Province, during Typhoon ‘EWINER’, in 2006. Gangwon Province (latitudes 37°02′ N–38°37′ N and longitudes 127°05′ E–129°22′ E) has the most intensively managed highland farming of Chinese cabbages and radishes, with an intensive use of chemical fertilizers and pesticides. From the agricultural intensification, the nitrate and phosphorus that leached through the surface runoff into the river was significantly high during summer time with the heavy rainfall, which was as a result of the monsoon climate. This has been blamed for an increase in eutrophication [10]. The reduction of water pollution is relevant for upstream and downstream households, because ensuring access to clean water in the watershed is of a very high priority.
Moreover, as a result of the extremely steep topography in the upstream area, this resulted in soil erosion; high levels of turbidity, about four times as much when compared with other years; and the sediment yields were high. Accordingly, since 2006, the districts were designated as initial nonpoint source management areas, as part of an effort to reduce the sediment yields and to maintain clean water quality in the upstream area. The maintenance of the clean water quality in the upstream areas of this lake has been one of the most critical issues for several years, in order to ensure healthy aquatic ecosystem services.
In this regard, the information on the monetary values of the environmental resources can be attained using nonmarket valuation techniques, such as stated preferences. The stated preference techniques are mainly applied so as to estimate their non-use values for nonmarket goods and services with no price tag. Within the stated preference techniques, the choice experiment (CE) method easily demonstrates the respondents’ choices among the presented alternatives. It offers a flexible design with respect to hypothetical scenarios, through the use of surveys. Furthermore, it derives the welfare estimates via the marginal willingness to pay (WTP) or willingness to accept (WTA) estimations for policy implications. The CE method can estimate various benefits that might be used for several governmental interventions.
The number of existing studies using CE method have shown the importance of improving the water quality in diverse geographical scales. The previous research was focused on the reduction of eutrophication [11,12]; on the individuals’ WTP for reducing the environmental health risks, which are related to the water quality [13,14]; and the biodiversity levels for water quality improvement, with the existence of preference heterogeneity [15]. Several studies examined the households’ preferences of the heterogeneous water attributes [16] and estimated their marginal WTP using CE [17]. Some studies elicited a WTA compensation for the conversion from conventional to environment-friendly agricultural practices, and compared this with the WTP for the water quality [18,19]. However, few studies have investigated the willingness to accept the water quality improvement by providing hypothetical scenarios with several choice sets simultaneously, to both the upstream resource managers and downstream water users. Moreover, in Asia, specially South Korea, there were few attempts, using CE method, that estimated the WTA/P for the water quality conservation, through sustainable land management.
Accordingly, in valuing environmental changes in the water quality and biodiversity levels, through different agricultural practices, their preferences between the upstream farmers and downstream water users might be different, even though they both perceive the importance of safe drinking water resources. Therefore, our study focused on the following questions: What do the upstream and downstream respondents prefer, given the trade-offs between agricultural practices with different agricultural profits and the environmental conservation that is involved? Is there a difference in their preferences?
Specifically, the first purpose of this study was to analyze the upstream and downstream respondents’ preferences in the Soyang watershed of South Korea, providing for the agricultural profit options with different environmental attributes, including water quality and biodiversity levels. Its second purpose was to examine the upstream and downstream households’ WTA, by eliciting their preferences using the conditional logit model (CLM) and CLM with interactions in the CE method.

2. Method

2.1. Study Region

The Soyang Lake flowed mainly from three districts, namely, Inje, Hongcheon, and Yanggu in Gangwon Province, into the metropolitan areas of South Korea, in particular, Seoul (Figure 1). The Soyang watershed (2694.35 km2) was the largest tributary located to the north of the Han River in South Korea. The watershed was used as a key drinking water source for the downstream area, Seoul, and metropolitan areas in South Korea. The Seoul had a high population density, consisting of 48.3% of the total population in South Korea [9].
In Gangwon Province, there were three districts, namely, Hongcheon-gun, Inje-gun, and Yanggu-gun, which were the major regions where most of the farmers did intensive farming activities in the mountainous areas, which affected the water quality. The water quality around the three districts, which were environmentally sensitive areas, was significantly affected by the intensive farming activities. The districts occupied 82.7% of the watershed, affecting the farming management and accounted for the majority of the highland upland areas [20].
The water quality of the watershed was generally of a good condition. However, when the heavy rains in the summer monsoon seasons fell, the watershed quality degraded from the most clean drinking water quality—namely grade 1, which was used in South Korea—to a seriously low water quality, namely grade 3, which was not acceptable for tap water use. This led to a reduction in biodiversity and posed a serious threat to the aquatic ecosystem. Therefore, the issues regarding the water quality protection of the Soyang watershed have emerged as critical, at both a local and national scale in South Korea.

2.2. Choice Experiment Method

The CE method weighted the individual behaviors by statistically estimating the parameters of the models, which were derived from the random utility theory (RUT) [21]. According to Lancaster [22], the consumers had obtained their utility from their attributes and not from the goods themselves. This was identified by asking the respondents to state their own preferences for the alternative choice sets, including different attribute levels. Based on RUT [21,22,23], the selected sequence in the offered choice sets was employed in the maximum likelihood estimation among the alternatives, which could present the probability of a chosen alternative through an econometric analysis. In the random utility models, the welfare measures could be estimated using the individual WTA/P compensation for a change in the offered attributed levels.
An individual, n, was faced with a choice among j; j was only selected if the following occurred, Uj > Ui; ji, where i is the other alternatives. The assumed utility function, Uj, was classified under two components, namely, an observable component or representative utility (Vj), and an unobservable component ( ε j), as follows:
Uj = Vj + εj
where Vj = k β k X j k , and where X j k are a set of the attributes of the alternative j, containing alternative attributes, and β k are estimated coefficients. A typical assumption was that they were independent and identically distributed (i.i.d.), with an extreme-value (Weibull) distribution. This distribution for the error term meant that the probability of any particular alternative being chosen based on the most preferred choice option could be expressed in terms of the logistic distribution, which led to a specification, which was known as the conditional logit model (CLM) [24].
In econometric analysis, this basic CLM was used in the initial stage of the CE method. The recent frontier of the analysis tended to utilize the econometric model’s relaxing strict assumption of the conditional model, which reflected the heterogeneity, such as CLM, with interactions [25,26]. This was because the classic CLM imposed the i.i.d. assumption, including the homogeneous preferences, across the alternatives with a strict independence of irrelevant alternatives (IIA) property. This property was derived from the independence of the error terms across the different options that were included in the choice set.
The calculation of the marginal willingness to accept (MWTA) was based on an interpretation of the parameter of the profit attribute, which was equal to the marginal utility of the income [27,28]. The specific formula can be written as follows:
MWTA = β / α ,
where α is the parameter estimate of the profit variable P and β is the parameter estimate of the specific attribute X [28].
In our study, the socio-economic variables, interaction terms regarding income levels (low/middle/high income), and districts (upstream/downstream) were included. In a two-way interaction, the basic attribute variables (agricultural profit, water quality, and biodiversity) interacted with the three income levels. For example, the interaction term—low income level*agricultural profit—was used, based on the income percentiles of the total sample.
Moreover, in order to identify the different preferences of the local communities in the three income levels, upstream and downstream variables were used along with three-way interactions. Associated with the hypothetical changes in the attributes in the Soyang watershed—which were calculated by the low, middle, and high income groups—the MWTA for the individual attribute, k, could be estimated as follows:
Low   income   level :   MWTA k l o w = β l o w k β l o w p r i c e Middle   income   level :   MWTA k m i d d l e = β m i d d l e k β m i d d l e p r i c e High   income   level :   MWTA k h i g h = β h i g h k β h i g h p r i c e
Regarding three-way interactions, this included the MWTA for individual attribute, k and this can be written as below:
Upstream :   MWTA k u p s t r e a m = β u p s t r e a m k β u p s t r e a m p r o f i t Downstream :   MWTA k d o w n s t r e a m = β d o w n s t r e a m k β d o w n s t r e a m p r o f i t

2.3. Survey Design and Data Collection

One consistent set of questionnaires was designed for both upstream farmers in Gangwon Province and downstream water users in Seoul. The farm households’ survey was administrated between March and April 2011. The downstream households’ survey was administrated in March 2012. The surveys were undertaken through face-to-face interviews by a professional survey company with trained interviewers in order to avoid any misunderstanding of the survey questions. Before the main questions were asked, the guidelines for attribute levels, alternative in choice sets and the number of choice questions were introduced. The total sample size of the respondents was 240 including 125 upstream farmers and 115 downstream consumers, as used minimum sample size presented by Hensher et al. [29]. The socio-economic background characteristics of the sample were provided in Table A1.
The three selected attributes were designed to maintain the same or to increase/decrease levels. The specific levels is chosen from the focus group interview and reports published in South Korea. Based on the attributes and levels, it is possible to make a universe of 3 3 ×   3 3 ×   3 3 combinations. A total 27 choice sets are divided into 9 sets of 3 were generated by the sample. A sample choice card is presented in Table 1. The current level in the base option was agricultural profit KRW 15.60 million, grade 2 of water quality and no change compared to current level of biodiversity).
Detailed information about the attributes were developed, based on the officially investigated data in South Korea. For example, the standard agricultural profit was the average agricultural income of Gangwon Province in 2011. The water quality levels were classified in accordance with the current grades (grade 1, 2, and 3) that were used by the South Korean government. The biodiversity level included three levels, which were compared to the level that showed the current number of amphibian, reptile, and fish species when the water quality was grade 2 (see the detail in Table A2).
Before the survey was undertaken, this study had a focus group meeting with the local government staff and a representative from the households who participated in the farming activities in the upstream areas, in order to validate the questions in the questionnaire. Based on the feedback from the focus groups meeting, the questionnaire was revised so as to ensure accurate responses.

3. Results

3.1. A Basic Conditional Logit Model

Table 2 shows the conditional logit results for a basic model, which included the alternative specific constant (ASC) and attributes. The variable ASC was positive and statistically significant, which implied that the respondents preferred their current situation to the econometric model’s relaxing strict hypothetical scenario. It was interesting to observe that both the agricultural profit and water quality coefficients were statistically significant at the 1% significance level, while the biodiversity level was statistically insignificant. This suggested that agricultural profit and water quality variables played important roles in respondents’ decisions for their choices. The signs on the attributes were, in general, shown as was expected. With respect to the environmental attributes, both the agricultural profit and water quality level were positively affected, with the latter having had a much higher impact on their decisions than the former.

3.2. Conditional Logit Model with Interactions

Table 3 contains the results of the three income levels when they had interacted with the attributes. Their coefficients were investigated as explanatory variables for the respondents’ monetary valuation. The ASC was statistically significant. The interaction terms with each income and water quality were significant explanatory variables, which indicated that the respondents within each income level presented higher values for water quality improvement in the Soyang watershed. As expected, the coefficients of these variables were positive and highly statistically significant. It was interesting to observe that the interaction terms with the biodiversity did not have an influence on the choice of the respondents. The interaction terms—low income level*agricultural profit, middle income level*agricultural profit, and high income level*agricultural profit—represented the marginal utility of income for each level. Unlike the general assumption of the negative relationship in the marginal utility of income, however, the agricultural profits that were examined in our study showed a positive relationship with the marginal utility.
Table 4 shows the result for the upstream and downstream households with three income groups. This included the three-way interaction terms, upstream/downstream areas, and low/middle/high income. All of the models had a good statistical model fit with a McFadden’ pseudo R2 of about 0.3. The three-way interaction presented R2 0.298 among the three models, which meant that this model was better in its explanation than the other models that were mentioned above. The model fit was improved by adding income and districts through three-way interactions. The log likelihood had the better fit from −588.32 to −556.16, in Table 2. The pseudo R2 increased from 0.256 to 0.298.
The coefficient estimates in the model followed their expected signs, except for the variables on the interactions with the biodiversity. Regarding the agricultural profit variable, the upstream and downstream respondents that interacted with the low and middle income levels were positive and extremely statistically significant. Since all of the coefficients of the interactions that were related to the water quality were positive and extremely statistically significant, it might have been considered as a substantial determinant for all of the respondents. The interaction term, upstream*high income level*agricultural profit, was, however, statistically significant at the 10% significance level, while the interaction term, downstream*high income level*agricultural profit, was statistically insignificant.

3.3. Marginal Willingness to Pay Results for Attributes in Three Income Levels

Table 5 shows the MWTA results for the water quality for the different income levels. The MWTAs for the water quality were calculated based on the parameter estimates from Table 4, which indicated that the water quality was a significant factor for each income level. The calculated value of the middle income level was the lowest, while the estimated MWTA of the high income level was the highest. The calculated results for the water quality were significantly influenced by the districts and income levels. The annual MWTAs for the upstream respondents ranged from KRW 3,484,673 to KRW 9,616,920. Regarding the upstream, the difference between the low and middle income levels was relatively small. With respect to the high income level, however, its MWTA was about 2.6~2.8 times higher than those of the other two levels. In the downstream respondents, the MWTA of the high income level respondents was about three times as high as that of the low income level group, while the MWTA of the latter was about 1.4 times higher than that of the middle income level. With respect to the difference between the upstream and downstream respondents, the high income level of upstream respondents was higher than that of the downstream area by about 1.8 times, and the middle level of the upstream respondents was higher about 1.5 times than the downstream respondents.

4. Discussion

4.1. A Basic Conditional Logit Model

In a basic specification, all of the coefficients of the choice attributes showed the expected signs. The three variables of interest, namely, the agricultural profits, water quality, and biodiversity levels, had positive signs. Unlike the other studies that used the costs/prices attribute in order to estimate the expected WTPs [30,31,32], our study included the agricultural profit as a proxy variable, which meant an increase in the potential compensation costs. Interestingly, the variable biodiversity was, however, not statistically significant. This was inconsistent with the result, which showed the importance of biodiversity [30,31]. It seemed that the upstream and downstream respondents had higher concerns about the conservation of the drinking water quality about the biodiversity level.

4.2. A Conditional Logit Model with Two-Way Interactions

The result of model 2 could have given further insight into how income level affected the option choice. The signs of the agricultural profit that were to be interacted with for all of the income levels was positive. The variables, namely, low income level*agricultural profit and middle income level*agricultural profit, were highly statistically significant at the 1% significance level. The variable, high income level*agricultural profit, was statistically significant at the 5% significance level. It implied that the low and middle income households were sensitive to the agricultural profits. The variable, ASC, was positive and statistically significant, which meant that the respondents preferred the current status to the hypothetical scenarios. The biodiversity attribute for each income group was not statistically significant. This meant that the biodiversity in the interaction with the income levels was not a significant determinant of the option choice. This was in contrast to the results, which showed that the economic value, regarding the biodiversity attribute, could offer a reliable information in order to estimate the welfare losses by the reduction of the biodiversity levels [30,31,32]. However, the interaction terms, low/middle/high income level*water quality, were highly statistically significant. It implied that the water quality in all of the income levels was an important factor for the choice option of the respondents. This was in line with the previous studies, which showed that the customer placed a high value on maintaining a clean water supply [15,16,17,18,19]. The concern for the water quality of the watershed in the study regions, as well as the lack of significant differences in the MWTA between the upstream and downstream residents, could have been explained by the importance of the drinking water use.
Furthermore, the coefficients for the water quality, with the interactions of the upstream farm and downstream households, and with income levels, were highly statistically significant, with a positive sign. It implied that the respondents were prone to being significantly concerned about the water quality in the economic characteristics and districts that affected the water quality of the Soyang watershed. This result could be explained by the fact that, even though the roles of the respondents were different along the Soyang watershed, they were especially concerned about the water quality level in the Soyang watershed. This was in line with the result, which showed the importance of the socio-economic determinants in the heterogeneous choice of the respondents [33,34,35,36,37,38,39,40,41,42,43,44].
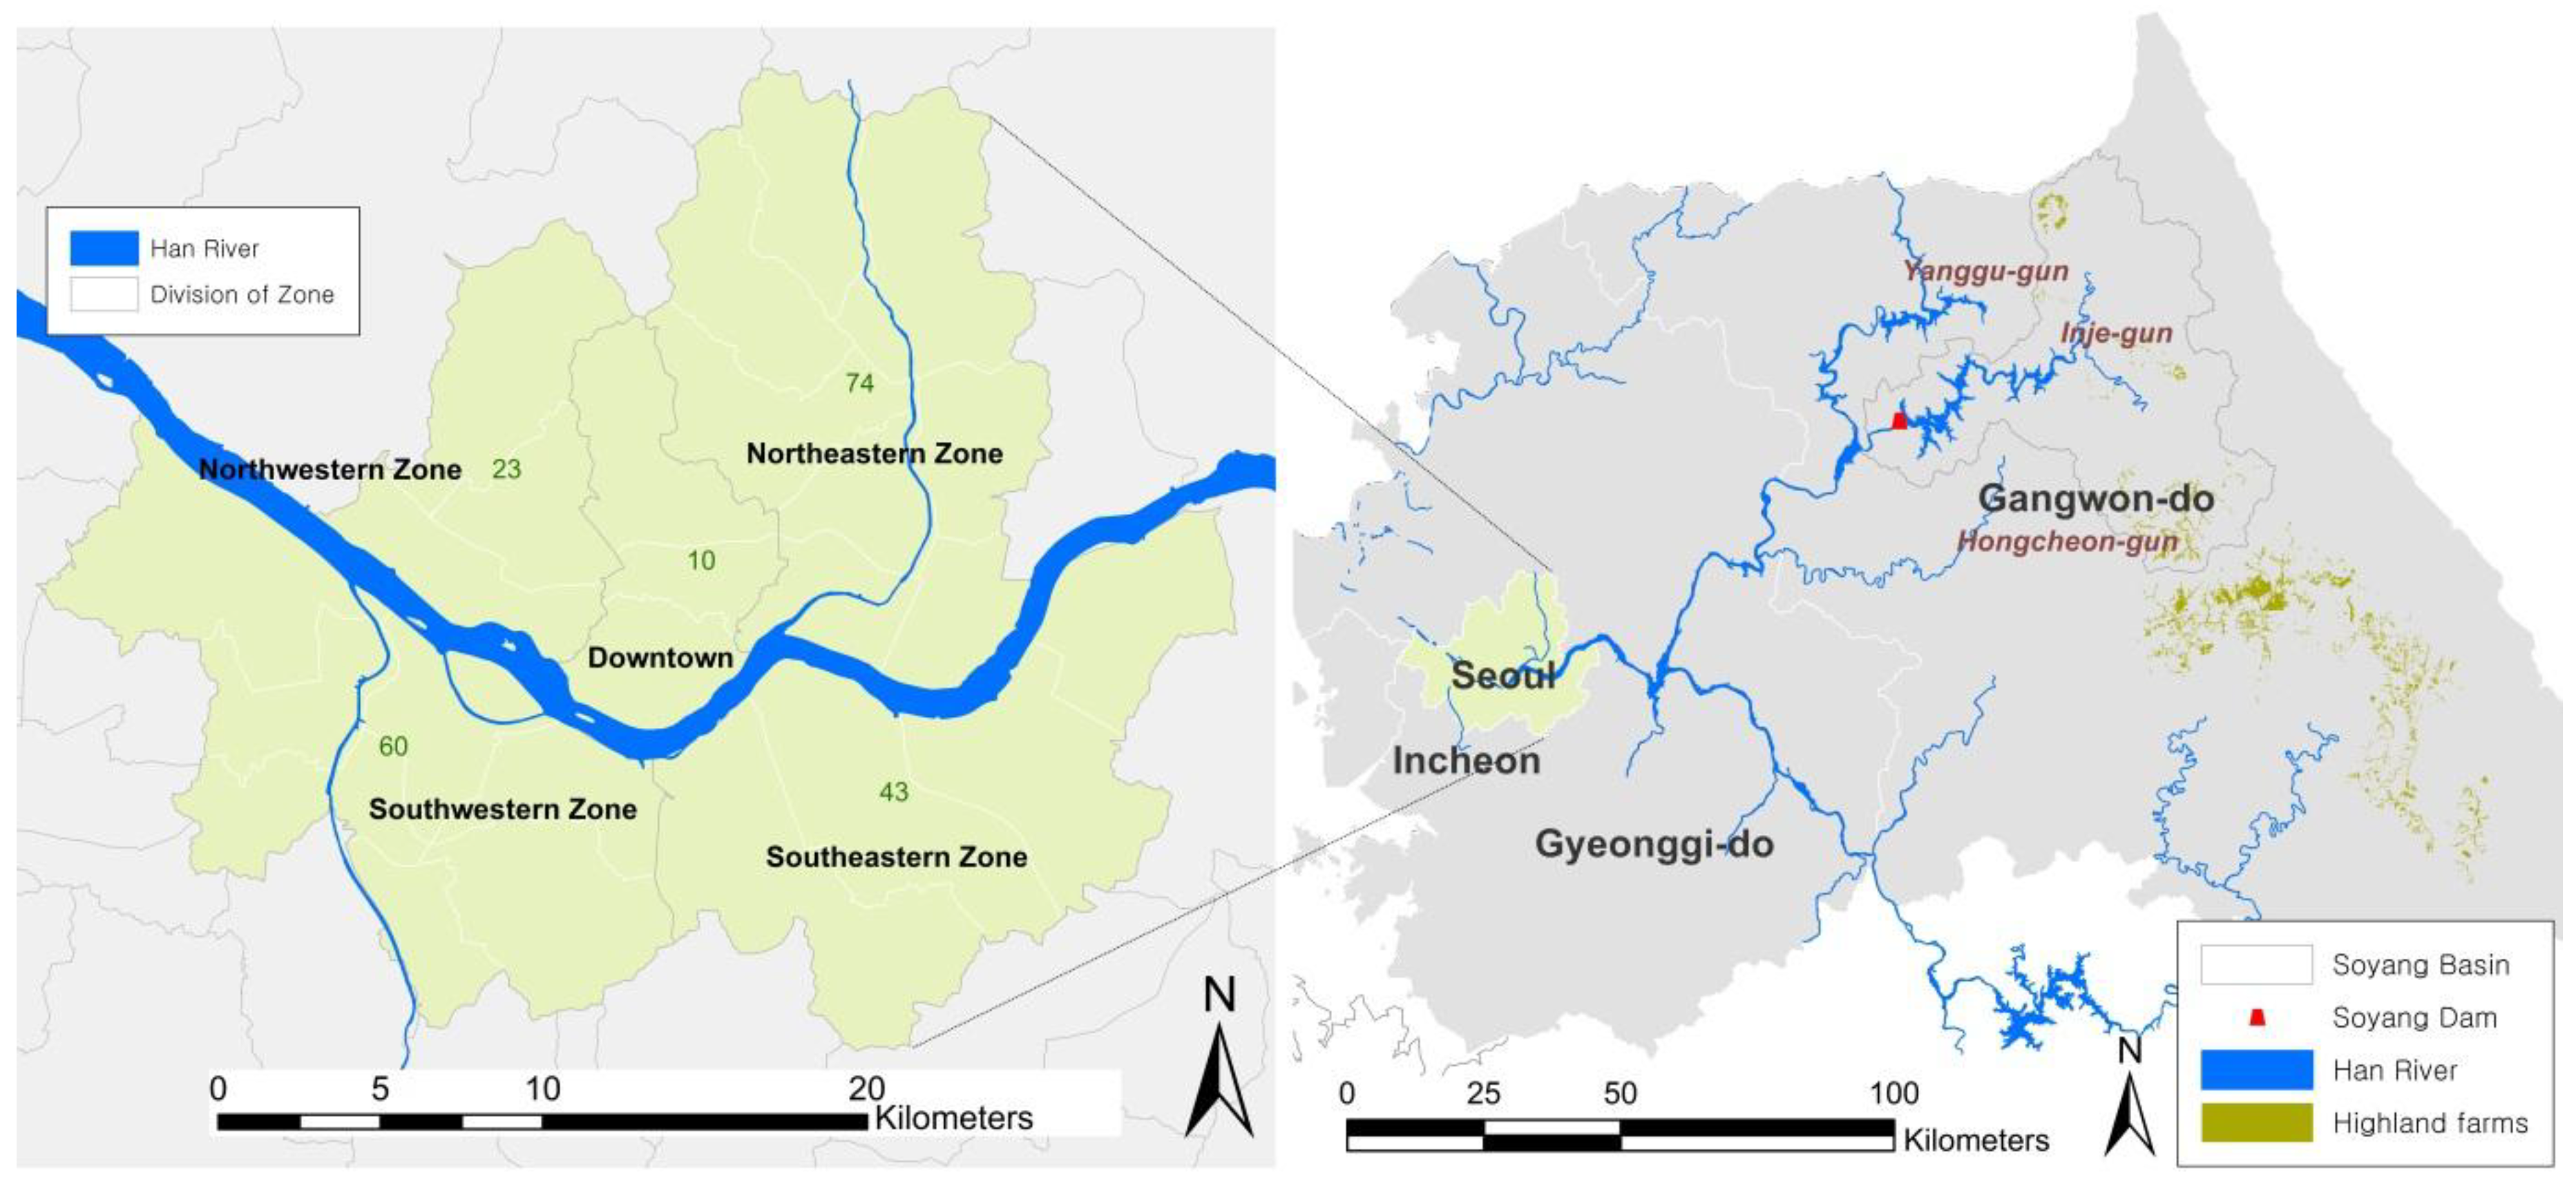
We further considered the estimation results by the MWTA, in order to identify the preference for water quality, which was differentiated by each income range. The implicit costs were calculated using the coefficient of the agricultural profits. In the case of the Soyang watershed, the MWTA values for the water quality implied a change from one water quality level to another, which meant that the increase in one unit of improved water quality was as a result of the reduction of fertilizers and pesticides, which led to a reduction in agricultural production. With respect to the low, middle, and high income levels, the calculated annual MWTAs of the respondents ranged from KRW 2,874,638 to KRW 7,415,775, for the reduction of the water pollution from advanced agricultural farming practices. The result implied that the MWTA for the water quality was significantly different between the low, middle, and high income levels. They suggested that the improvement in water quality was considerably important for each income level and district in South Korea.

4.3. A Conditional Logit Model with Three-Way Interactions

The results with the three-way interactions showed that the coefficients of the upstream/downstream*low/middle income level*agricultural profit were statistically significant at the 1% significance level. The parameter of the upstream*high income level*agricultural profit was statistically significant at the 10% significance level. The coefficient of the downstream*high income level*agricultural profit, was, however, not statistically significant. It implied that the upstream and downstream respondents in the low and middle income levels tended to prefer the increase of water quality of the Soyang watershed. This meant that the improvement of water quality was not a significant determinant of the downstream high income respondents, regarding the choice. Moreover, the parameters that were related to the biodiversity level with the three-way interactions were not a significant determinant on the choice of the upstream and downstream respondents, for each income group. This might have been explained by the different local communities that had less perception about biodiversity conservation.
Moreover, we estimated the implicit costs, or MWTAs, for each of the water quality attributes in the different income levels by the interaction with the different stakeholders. When the two respondent groups were compared, it could be seen that the marginal values of the attributes were different at different income levels. The annual MWTAs of the upstream respondents, for the water quality range, were from KRW 3,484,673 (low), KRW 3,746,120 (middle), to KRW 9,616,920 (high), while those for the downstream respondents, for the water quality, varied from KRW 1,773,511 (low), KRW 2,532,524 (middle), to KRW 5,420,074 (high). Regarding the result from the upstream respondents, the difference between the low and middle income levels was relatively small. The upstream respondents with the high income level had the highest costs for improving the water quality. With respect to the downstream respondents, however, the implicit costs of the upstream respondents were shown to be about three times higher between the low and high income levels, while the implicit cost of the low income level was different to that of the middle income level, by about 1.4 times. Overall, the difference of the implicit costs between the low and middle income levels was relatively small in the upstream and downstream respondents. With respect to the high income level, the result of the MWTA showed a big difference. Their disparity was larger in the interaction terms that were associated with the districts (upstream/downstream households) and income levels. It implied that the estimated marginal values were different in each income level and each district. The MWTA disparity between the upstream and downstream householders in each income group was based on the fact that the downstream citizens had a higher annual income than upstream farmers’ annual net income.
This result provided meaningful insights for the policy makers, with the importance of income-specific and district-specific differences that were associated with environment protection through agriculture in further researches. Moreover, in South Korea, less studies focused on the use of CE and research that was related with biodiversity stated preferences was needed to enhance the perception of public. Further research could have investigated the non-market benefits of biodiversity conservation and elicited the WTP/A for the biodiversity attributes, which used the CE method, considering the income and district effects among the different stakeholders.
As both the upstream and downstream residents utilized the clean water, many studies highlighted the importance of the appropriate water use charge that the downstream citizen and metropolitan areas had to pay for the water protection areas and to compensate the upstream residents who were regulating the economic activities, such as housing and farming [37]. The water use charge that was obtained from the downstream citizens could be applicable to support for upstream low income farmers suffering from economic restriction and change in farming techniques. However, despite the continuous change in the water policy of South Korea and the attempts to solve the reclusive water quality conflicts, over the water rights between the upstream and downstream regions, which were as a result of the non-point source pollution in the highland areas, the Gangwon Province had less support and excluded the resident support programs that had received support from the water use charge. This was in line with the result, which showed that it was necessary to improve the institutions and laws that were associated with the residents’ support program created by the Han River Management Fund [37,38].
Methodologically, it was a limitation that our study considered only CLM and CLM with interactions. In order to compare the results with the advanced models, we recommended the advanced models, such as error component models, which allowed for the control of the heteroscedasticity over the choice sets, should be utilized. This suggested, therefore, the use of different model specifications that accounted for the heterogeneous preferences, with careful construction of the choice sets and effective data collection. More importantly, the incorporated preferences’ differences, between the districts at different income levels, should have been investigated in the decision-making for the sustainable water management.
Once the specific costs and WTP in the CE model had been provided to the policy decision makers, the specific monetary values for the environment could be the reference points for the sustainable water management planning and designing. Thus, we suggested that the inclusion of a cost attribute, such as direct payments or agricultural program participation, should be done with care in the choice experiment, in order to elicit monetary values for the environmental improvement. Further studies should focus on how the choice experiment could be used to provide both welfare estimates, which corresponded to the policy changes involving one or more attributes with offered direct payments, and community ranking of multiple policy options.
Regarding the sustainable water and land management, a recent study provided a win-win strategy and was challenged under the nexus of the water–energy–food perceptive, as demonstrated by the synergies and trade-offs for implementing the efficient governance and institutions [39,41]. With the emphasis on soil conservation measures, some studies focused on quantifying the costs and benefits for sustainable land use management practices [42,43]. Previous studies addressed land use and land cover changes in the spatial and temporal changes in the watershed as well as sustainable land use management [44].
With respect to the effectiveness and efficiency of the sustainable use of resources and services, an integrated water management interconnected land use was needed. Regarding the environmental issues with excessive abundant nutrients, many studies highlighted the water pollution treatment for water quality improvement and for efficient diffuse source management, under different land-use practices [45,46,47]. Moreover, further studies will be needed to implement urban water management into future urban water infrastructure, which is associated with sustainable land use changes and planning.
Many studies have considered cost-effective solutions for combating the eutrophication of coastal ecosystems in sustainable land management [48,49,50,51,52,53]. In addition, with an attempt to provide various policy programs for cost-effective conservation practices, a focus on the water quality trading markets, trading costs in the river basin were necessary for improving the water quality. Further studies could elicit the preferences of multiple stakeholders for different positive nitrogen management practices, which would show the trade-off between the land use change and economic consequences.

5. Conclusions

Our study estimated that the annual MWTAs of the upstream farmers and downstream citizens, for water quality improvement along the Soyang Lake, using the choice experiment method. The estimated MWTAs from the conditional logit models with interactions were varied with different income levels and local communities. The results revealed that the water quality is the most significant attribute for both upstream water providers, farmers, and downstream water users, consumers.
From intensive agriculture in the upstream areas, in Gangwon Province, a decrease in the water quality had a negative influence on the clean water supply to the downstream metropolitan areas, especially Seoul in South Korea. As a result of the irregular rain events in the monsoon season under climate change, the decrease in upstream water quality from the intensive highland agriculture could still exist. The highland upstream farmers were under several regulations with economic consequences. To promote the adoption of sustainable agricultural practices in the upstream areas, a monetary compensation for changing their farming method should be considered, so that the highland farmers can avoid their income losses. A sustainable land use management policy, combined with the water quality, is necessary. This means that a carefully designed policy that will compensate the highland farmers for their income losses as a result of changing farming practices, is recommended. In this regard, our study provided robust results on the benefits of water improvement with sustainable land management, to make such a policy successful, and can be considered a fundamental input for aiding the sustainable water–land nexus policies.

Author Contributions

Saem Lee collected, analyzed the data and wrote the manuscript. Hyun-No Kim contributed to the data analysis and reviewed the manuscript. Trung Thanh Nguyen, Hio-Jung Shin and Thomas Koellner reviewed and edited the manuscript.

Acknowledgments

This study was carried out as part of the International Research Training Group TERRECO (GRK 1565/1), which was funded by the Deutsche Forschungsgemeinschaft (DFG) at the University of Bayreuth, Germany and by the Kangwon National University, Chuncheon, South Korea. This publication was funded by the German Research Foundation (DFG) and the University of Bayreuth in the funding program, Open Access Publishing.

Conflicts of Interest

The authors declare no conflict of interest.

Appendix A

Table A1. Descriptive statistics of characteristics.
CharacteristicsDescriptionUpstream (N: 125)Downstream (N: 115)
N (%)N (%)
Age1: 20s9 (0.67)81 (5.18)
2: 30s15 (1.11)342 (21.85)
3: 40s267 (19.78)438 (27.99)
4: 50s597 (44.22)405 (25.88)
5: >60s462 (34.22)299 (19.11)
EducationPrimary282 (20.89)18 (1.15)
Secondary483 (35.78)75 (4.79)
High444 (32.89)746 (47.67)
University141 (10.44)726 (46.39)
Income a [Unit = Million in KRW]1: <10552 (40.89)NA
2: 10–20171 (12.67)54 (3.45)
3: 21–30192 (14.22)303 (19.36)
4: 31–40132 (9.78)342 (21.85)
5: 41–50138 (10.22)537 (34.31)
6: 51–6048 (3.56)254 (16.23)
7: 61–7018 (1.33)57 (3.64)
8: 71–8015 (1.11)18 (1.15)
9: 81–9021 (1.56)NA
10: 91–1009 (0.67)NA
11: >100054 (4.00)NA
a Unit US $ 1.00 = KRW 1055.4, at the time of the survey (2013).
Table A2. Definition of the variables used in conditional logit models.
VariableDefinition
ASCAlternative specific constant; 1 for current situation, 0 otherwise
Agricultural profitAgricultural profit (KRW a million) in year 2011; Gangwon Province statistics applied (13.56, 15.60, 17.64)
Water quality1 for bad water quality level, 2 for tap water quality level, 3 for clean water quality level
BiodiversityRate of biodiversity level; the level increases by 0, 15, and 30%. (Hongcheon: 2009: amphibian: 6 species; reptile: 3 species; fish: 22 species. Inje: 2008: amphibian 10 species; reptile: 6 species; fish: 20 species. Yanggu: 2008: amphibian 7 species; reptile: 5 species; fish: 32 species)
Low income level1 for low income level (less than 33rd centiles of real income), 0 otherwise
Middle income level1 for middle income level (between 33rd and 66th centiles), 0 otherwise
High income level1 for high income level (more than 66th centiles), 0 otherwise
Low income level*agricultural profitInteraction between low income level and agricultural profit
Middle income level*agricultural profitInteraction between middle income level and agricultural profit
High income level*agricultural profitInteraction between high income level and agricultural profit
Low income level*water qualityInteraction between low income level and water quality
Middle income level*water qualityInteraction between middle income level and water quality
High income level* water qualityInteraction between high income level and water quality
Low income level*biodiversityInteraction between low income level and biodiversity
Middle income level*biodiversityInteraction between middle income level and biodiversity
High income level*biodiversityInteraction between high income level and biodiversity
Upstream1 for upstream districts in Gangwon Province (Inje, Yanggu, and Hongcheon), 0 otherwise
Downstream1 for upstream districts in Seoul, 0 otherwise
Upstream*low/middle/high income level*agricultural profit/water quality/biodiversityInteraction among upstream, low/middle/high income level, and each attribute (agricultural profit/water quality/biodiversity)
Downstream*low income level*agricultural profit/water quality/biodiversityInteraction among downstream, low/middle/high income level, and each attribute (agricultural profit/water quality/biodiversity)

References

  1. TEEB Synthesis. Mainstreaming the Economics of Nature: A Synthesis of the Approach, Conclusions and Recommendations of TEEB; Earthscan: London, UK; Washington, DC, USA, 2010. [Google Scholar]
  2. Millennium Ecosystem Assessment (MEA). Ecosystems and Human WellBeing: Synthesis; Island Press: Washington, DC, USA, 2005. [Google Scholar]
  3. Nelson, E.; Mendoza, G.; Regetz, J.; Polasky, S.; Tallis, H.; Cameron, D.R.; Chan, K.M.A.; Dailey, G.C.; Goldstein, J.; Dareiva, P.M.; et al. Modeling multiple ecosystem services, biodiversity conservation, commodity, production, and tradeoffs at landscape scales. Front. Ecol. Environ. 2009, 7, 4. [Google Scholar] [CrossRef]
  4. Costanza, R.; dArge, R.; de Groot, R.; Farber, S.; Grasso, M.; Hannon, B.; Limburg, K.; Naeem, S.; Oneill, R.V.; Paruelo, J.; et al. The value of the world’s ecosystem services and natural capital. Nature 1997, 387, 253–260. [Google Scholar] [CrossRef]
  5. OECD. Water Resource Management: Integrated Policies; OECD: Paris, France, 1989. [Google Scholar]
  6. Hooper, B.P. Integrated Water Resources Management and River Basin Governance. Univ. Counc. Water Resour. 2003, 126, 12–20. [Google Scholar]
  7. Holden, J.; Haygarth, P.M.; MacDonald, J.; Jenkins, A.; Sapiets, A.; Orr, H.G.; Dunn, N.; Harris, B.; Pearson, P.L.; McGonigle, D.; et al. Agriculture’s impacts on water quality. Glob. Food Secur. 2015, 1, 21. [Google Scholar]
  8. Dabrowski, J.M.; Murray, K.; Ashton, P.J.; Leaner, J.J. Agricultural impacts on water quality and implications for virtual water trading decisions. Ecol. Econ. 2009, 68, 1074–1082. [Google Scholar] [CrossRef]
  9. Lee, S.; Nguyen, T.T.; Poppenborg, P.; Shin, H.J.; Koellner, T. Conventional, Partially Converted and Environmentally Friendly Farming in South Korea: Profitability and Factors Affecting Farmers’ Choice. Sustainability 2016, 8, 704. [Google Scholar] [CrossRef] [Green Version]
  10. Nguyen, T.T.; Ruidisch, M.; Koellner, T.; Tenhunen, J. Synergies and tradeoffs between nitrate leaching and net farm income: The case of nitrogen best management practices in South Korea. Agric. Ecosyst. Environ. 2014, 186, 160–169. [Google Scholar] [CrossRef]
  11. Kosensius, A.K. Heterogeneous preferences for water quality attributes: The case of eutrophication in the Gulf of Finland. Ecol. Econ. 2010, 69, 528–538. [Google Scholar] [CrossRef]
  12. Shrestha, R.K.; Alavalapati, J.R.R. Valuing environmental benefits of silvopasture practice: A case study of the Lake Okeechobee watershed in Florida. Ecol. Econ. 2004, 49, 349–359. [Google Scholar] [CrossRef]
  13. Georgiou, S.; Langford, I.; Bateman, I.; Turner, K. Determinants of individuals' willingness to pay for perceived reductions in environmental health risks: A case study of bathing water quality. Environ. Plan. 1998, 30, 577–594. [Google Scholar] [CrossRef]
  14. Travisi, C.M.; Nijkamp, P. Valuing Environmental and health risk in Agriculture: A choice experiment approach to pesticides in Italy. Ecol. Econ. 2008, 67, 598–607. [Google Scholar] [CrossRef]
  15. Eggert, H.; Olsson, B. Valuing multi-attribute marine water quality. Mar. Policy 2009, 33, 201–206. [Google Scholar] [CrossRef]
  16. Lee, D.E.; Hosking, S.G.; du Preez, M. A choice experiment application to estimate willingness to pay for controlling excessive recreational fishing demand at the Sundays River Estuary. South Africa. Water SA 2014, 40, 39–40. [Google Scholar] [CrossRef]
  17. Dauda, S.A.; Yacob, M.R.; Radam, A. Household’s willingness to pay for heterogeneous attributes of drinking water quality and services improvement: An application of choice experiment. Appl. Water Sci. 2015, 5, 253. [Google Scholar] [CrossRef]
  18. Yacob, M.R.; Radam, A.; Samdin, Z. Willingness to Pay for Domestic Water Service Improvements in Selangor, Malaysia: A Choice Modeling Approach. Int. Bus. Manag. 2011, 2, 30–39. [Google Scholar]
  19. Sangkapitux, C.; Neef, A.; Polkongkaew, W. Willingness of upstream and downstream resource managers to engage in compensation schemes for environmental services. Int. J. Commons 2009, 3, 41–63. [Google Scholar] [CrossRef]
  20. Jeon, M. Device for Reducing Muddy Water in the Watershed of Soyang Dam; Research Institute for Gangwon: Daejeon, Korea, 2008. (In Korean) [Google Scholar]
  21. Luce, R.D. Individual Choice Behavior: A Theoretical Analysis; Wiley: New York, NY, USA, 1959. [Google Scholar]
  22. Lancaster, K. A New Approach to Consumer Theory. J Political Econ. 1966, 74, 132–157. [Google Scholar] [CrossRef]
  23. Luce, R.D.; Suppes, P. Preference, Utility, and Subjective Probability. In Handbook of Mathematical Psychology; Luce, R.D., Bush, R.R., Galanter, E.H., Eds.; Wiley: New York, NY, USA, 1965; Chapter 19; Volume 3, pp. 249–410. [Google Scholar]
  24. McFadden, D. Conditional logit analysis of qualitative choice behavior. In Frontiers of Econometrics; Zarembka, P., Ed.; Academic Press: London, UK, 1974. [Google Scholar]
  25. Greene, W.H. Econometric Analysis, 4th ed.; Prentice Hall: Upper Saddle River, NJ, USA, 2003. [Google Scholar]
  26. Freeman, A.M., III. The Measurement of Environmental and Resource Values: Theory and Methods, 2nd ed.; Resources for the Future: Washington, DC, USA, 2003. [Google Scholar]
  27. Ben-Akiva, M.; Lerman, S. Discrete Choice Analysis: Theory and Application to Travel Demand, 2nd ed.; The MIT Press: Cambridge, MA, USA, 1985. [Google Scholar]
  28. Bateman, I.J.; Carson, R.T.; Day, B.; Hanemann, M.; Hanley, N.; Hett, T.; Jones-Lee, M.; Loomes, G. Economic Valuation with Stated Preferences Techniques: A Manual; Edward Elgar Publishing Ltd.: Cheltenham, UK, 2002. [Google Scholar]
  29. Hensher, D.A.; Rose, J.M.; Greene, W.H. Applied Choice Analysis: A Primer; Cambridge University Press: Cambridge, UK, 2005. [Google Scholar]
  30. Khai, H.V.; Yabe, M. Choice modeling: Assessing the non-market environmental values of the biodiversity conservation of swamp forest in Vietnam. Int. J. Energy Environ. Eng. 2014, 5, 77. [Google Scholar] [CrossRef]
  31. Atkinson, G.; Bateman, I.; Mourato, S. Recent advances in the valuation of ecosystem services and biodiversity. Oxf. Rev. Econ. Policy 2012, 28, 22–47. [Google Scholar] [CrossRef]
  32. Willis, K.G.; Scarpa, R.; Acutt, M. Assessing water company customer preferences and willingness to pay for service improvements: A stated choice analysis. Water Resour. Res 2005, 41, 2. [Google Scholar] [CrossRef]
  33. Kragt, M.E.; Bennett, J.W. Using Choice Experiments to value River and Estuary Health in Tasmania with Individual Preference Heterogeneity. Aust. J. Agric. Resour. Econ. 2011, 55, 159–179. [Google Scholar] [CrossRef]
  34. Blazy, J.M.; Alain, C.; Alban, T. The willingness to adopt agro-ecological innovations: Application of choice modelling to Caribbean banana planters. Ecol. Econ. 2011, 72, 140–150. [Google Scholar] [CrossRef]
  35. Yamada, K.; Sato, M.; Nakamoto, Y. Measurement of Social Preference from Utility-Based Choice Experiments. Discussion Paper. No. 759. 2009. Available online: http://www.iser.osaka-u.ac.jp/library/dp/2009/DP0759.pdf (accessed on 22 January 2018).
  36. Lee, S.; Nguyen, T.T.; Kim, H.N.; Koellner, T.; Shin, H.J. Do Consumers of Environmentally Friendly Farming Products in Downstream Areas Have a WTP for Water Quality Protection in Upstream Areas? Water 2017, 9, 511. [Google Scholar] [CrossRef]
  37. Choi, I.-C.; Shin, H.-J.; Nguyen, T.T.; Tenhunen, J. Water Policy Reforms in South Korea: A Historical Review and Ongoing Challenges for Sustainable Water Governance and Management. Water 2017, 9, 717. [Google Scholar] [CrossRef]
  38. Jeon, M. Improvement Plan of the Regions for Support Program by the Han River Watershed Management Fund; Research Institute for Gangwon: Daejeon, Korea, 2013. (In Korean) [Google Scholar]
  39. Reddy, V.R.; Cunha, D.G.F.; Kurian, M. A Water–Energy–Food Nexus Perspective on the Challenge of Eutrophication. Water 2018, 10, 101. [Google Scholar] [CrossRef]
  40. Rasul, G. Managing the food, water, and energy nexus for achieving the Sustainable Development Goals in South Asia. Environ. Dev. 2016, 18, 14–25. [Google Scholar] [CrossRef]
  41. Mainali, B.; Luukkanen, J.; Silveira, S.; Kaivo-oja, J. Evaluating Synergies and Trade-Offs among Sustainable Development Goals (SDGs): Explorative Analyses of Development Paths in South Asia and Sub-Saharan Africa. Sustainability 2018, 10, 815. [Google Scholar] [CrossRef]
  42. Tesfaye, A.; Brouwer, R.; Van der Zaag, P.; Negatu, W. Assessing the costs and benefits of improved land management practices in three watershed areas in Ethiopia. J. Soil Water Conserv. 2016, 4, 20–29. [Google Scholar] [CrossRef]
  43. Nguyen, T.T.; Hoang, V.; Seo, B. Cost and environmental efficiency of rice farms in South Korea. Agric. Econ. 2012, 43, 369–378. [Google Scholar] [CrossRef]
  44. Tadesse, L.; Suryabhagavan, K.V.; Sridhar, G.; Legesse, G. Land use and land cover changes and Soil erosion in Yezat Watershed, North Western Ethiopia. J. Soil Water Conserv. 2017, 5, 85–94. [Google Scholar] [CrossRef]
  45. Roebeling, P.C.; Cunha, M.C.; Arroja, L.; van Grieken, M.E. Abatement vs. treatment for efficient diffuse source water pollution management in terrestrial-marine systems. Water Sci. Technol. 2015, 72, 730–737. [Google Scholar] [CrossRef] [PubMed]
  46. Gren, I.-M. Resilience value of constructed coastal wetlands for combating eutrophication. Ocean Coast Manag. 2010, 53, 358–365. [Google Scholar] [CrossRef]
  47. Laukkanen, M.; Huhtala, A. Optimal Management of a Eutrophied Coastal Ecosystem: Balancing Agricultural and Municipal Abatement Measures. Environ. Resour. Econ. 2008, 39, 139–159. [Google Scholar] [CrossRef]
  48. Roebeling, P.C.; Van Grieken, M.E.; Webster, A.J.; Biggs, J.; Thorburn, P. Cost-effective water quality improvement in linked terrestrial and marine ecosystems: A spatial environmental–economic modelling approach. Mar. Freshw. Res. 2009, 60, 1150–1158. [Google Scholar] [CrossRef]
  49. Elofsson, K. Cost-effective reductions of stochastic agricultural loads to the Baltic Sea. Ecol. Econ. 2003, 47, 13–31. [Google Scholar] [CrossRef]
  50. Gren, I.M.; Savchuk, O.P.; Jansson, T. Cost-Effective Spatial and Dynamic Management of a Eutrophied Baltic Sea. Mar. Resour. Econ. 2013, 28, 263–284. [Google Scholar] [CrossRef]
  51. Lescot, J.M.; Bordenave, P.; Petit, K.; Leccia, O.A. spatially distributed cost-effectiveness analysis framework for controlling water pollution. Environ. Model. Softw. 2013, 41, 107–122. [Google Scholar] [CrossRef]
  52. Laukkanen, M.; Ekholm, P.; Huhtala, A.; Pitkänen, H.; Kiirikki, M.; Rantanen, P.; Inkala, A. Integrating ecological and economic modeling of eutrophication: Toward optimal solutions for a coastal area suffering from sediment release of phosphorus. Ambio 2009, 38, 225–235. [Google Scholar] [CrossRef] [PubMed]
  53. Payeur-Poirier, J.L.; Nguyen, T.T. The inclusion of forest hydrological services in the sustainable development strategy of South Korea. Sustainability 2017, 9, 1470. [Google Scholar] [CrossRef]
Figure 1. Study map of the upstream and downstream regions.
Sustainability 10 01419 g001
Table 1. An example of choice sets.
CharacteristicsABCurrent Level
Agricultural profits (unit: million)KRW a 13.56KRW 15.60KRW 15.60
Water qualityGrade 1Grade 3Grade 2
BiodiversityNo changeThe level increases by 10% increaseNo change
Which would you prefer to choose?
a Unit US$ 1.00 = KRW 1055.4, at the time of the survey (2013).
Table 2. The conditional logit result for a basic model, regarding estimates of the determinants of option in choice.
VariablesCoefficientStd. Err.
ASC0.270 ***0.117
Agricultural profit0.056 ***0.005
Water quality1.847 ***0.158
Biodiversity0.0050.017
LogL−588.32
N2160
Pseudo R 20.256
Note: *** indicates statistical significance at the 1% level.
Table 3. The conditional logit model for interactions with income levels.
VariablesCoefficientStd. Err.
ASC0.300 ***0.122
Low income level*agricultural profit0.062 ***0.007
Middle income level*agricultural profit0.070 ***0.008
High income level*agricultural profit0.019 **0.009
Low income level*water quality1.922 ***0.247
Middle income level*water quality2.014 ***0.243
High income level*water quality1.404 ***0.303
Low income level*biodiversity−0.0190.025
Middle income level*biodiversity0.0300.027
High income level*biodiversity0.0170.034
LogL−574.30
N2160
Pseudo R 20.274
Note: *** indicates statistical significance at the 1% level; ** indicates statistical significance at the 5% level.
Table 4. The conditional logit result for the upstream farmers and downstream consumers, regarding the estimates of the determinants of the option in choice.
VariablesCoefficientStd. Err.
ASC0.288 ***0.132
Upstream*low income level*agricultural profit0.060 ***0.008
Upstream*middle income level*agricultural profit0.116 ***0.026
Upstream*high income level*agricultural profit0.024 *0.015
Downstream*low income level*agricultural profit0.068 ***0.013
Downstream*middle income level*agricultural profit0.063 ***0.008
Downstream*high income level*agricultural profit0.0190.012
Upstream*low income level*water quality2.010 ***0.295
Upstream*middle income level*water quality4.345 ***0.954
Upstream*high income level*water quality2.344 ***0.579
Downstream*low income level*water quality1.203 ***0.438
Downstream*middle income level*water quality1.604 ***0.243
Downstream*high income level*water quality1.009 ***0.361
Upstream*low income level*biodiversity−0.0350.030
Upstream*middle income level*biodiversity0.0310.075
Upstream*high income level*biodiversity0.0710.057
Downstream*low income level*biodiversity0.0060.046
Downstream*middle income level*biodiversity0.0350.031
Downstream*high income level*biodiversity−0.0100.041
LogL−556.16
N2160
Pseudo R 20.298
Note: *** indicates statistical significance at the 1% level; * indicates statistical significance at the 10% level.
Table 5. The marginal willingness to accept (MWTA) results in KRW for attributes in three income levels.
RespondentsAttributeLow Income LevelMiddle Income LevelHigh Income Level
Upstream farmersWater quality3,484,6733,746,1209,616,920
Downstream consumersWater quality1,773,5112,532,5245,420,074
Unit US $ 1.00 = KRW 1055.4, at the time of the survey (2013).

