The Association between Ambient Temperature and Acute Diarrhea Incidence in Hong Kong, Taiwan, and Japan


1
Research Center for Humanities and Social Sciences, Academia Sinica, Taipei 115, Taiwan
2
Department of Real Estate and Built Environment, National Taipei University, San Shia District, New Taipei City 237, Taiwan
3
Institute of Population Health Sciences, National Health Research Institutes, Zhunan 350, Taiwan
*
Author to whom correspondence should be addressed.
Sustainability 2018, 10(5), 1417; https://doi.org/10.3390/su10051417
Submission received: 31 March 2018
/
Revised: 27 April 2018
/
Accepted: 1 May 2018
/
Published: 3 May 2018
(This article belongs to the Special Issue Spatial and Spatio-Temporal Planning for Urban Health and Sustainability)
Abstract
:While studies have examined the association between weather variables and acute diarrhea in a city, region, or country, less evidence is available on the temperature effect across countries. The objective of this study is to elucidate the nonlinear and lagged association between ambient temperature and acute diarrhea in Hong Kong, Taiwan, and Japan. We collected weekly surveillance statistics on acute diarrhea with the corresponding meteorological data from 12 regions of Hong Kong, Taiwan, and Japan during 2012–2016. Firstly, we fitted the region-specific counts of acute diarrhea in a distributed lag nonlinear model (DLNM) which accounts for the non-linearity and lagged effect of temperature. Secondly, we applied meta-analysis to pool estimates across 12 regions. A total of 5,992,082 acute diarrhea cases were identified. We found that (1) the pooled overall cumulative relationship between the relative risk (RR) of acute diarrhea and temperature was the greatest (RR = 1.216; 95% CI: 1.083, 1.364) at 11 °C; (2) a pooled predictor-specific summary association at lower temperatures (12 °C or 25th percentile) began immediately and vanished after four weeks. Predictions and error analysis for new onsets of acute diarrhea in 2017 were evaluated. An early warning system based on the information of temperature variation was suggested for acute diarrhea control management.
1. Introduction
According to the estimates from Global Burden of Disease 2015 Study, diarrhea was responsible for more than 1.31 million deaths around the world in 2015 [1]. Although the burden of acute infectious diarrhea is greatest in low-income countries, it is a common cause of outpatient visits and hospital admissions in high-income countries [2].
The Asia Pacific region is home to more than half of the world’s population and is regarded as one of the most vulnerable areas under the influence of extreme weather. As the impact of extreme weather events (either heat waves or cold waves) becomes more intense, we expect meteorological factors might affect the timing and intensity of infectious diseases in these areas [3].
Prior studies have shown local weather factors like temperature [4,5], relative humidity [4], and rainfall [6] to be linked to diarrhea-associated morbidity. Global climatic factors like the Indian Ocean Dipole (IOD) and El Niño Southern Oscillation (ENSO) are also considered to influence the transmission of infectious gastroenteritis [7]. Elucidation of the relationship between weather/climatic factors and infectious diarrhea is important for disease control and prevention. For example, if we expect a cold temperature effect on infectious diarrhea, an early warning system based on temperature forecast could be implemented.
Ambient temperature may be important in the spread of infectious diarrhea [8,9,10]. However, the study area of the previous studies focused on a city [8,9], region, or country [10]. In addition, few studies considered the nonlinearity and lagged effect of temperature [11]. Meta-analysis within a distributed lag nonlinear model (DLNM) [12] provides a useful framework to quantify the temperature-morbidity association for acute diarrhea in different regions. The objective of this study is to elucidate the nonlinear and lagged association between temperature and acute diarrhea in Hong Kong, Taiwan, and Japan. With a better understanding of the effect that ambient temperature may have on acute diarrhea in different countries, integrated surveillance of acute diarrhea among these countries will facility early warning and timely disease control [13].
2. Materials and Methods
2.1. Data
Acute diarrhea (AD) surveillance datasets during 2012–2016 were obtained from the Department of Health in Hong Kong (http://www.dh.gov.hk/eindex.html), Taiwan Centers for Disease Control (TCDC) (http://www.cdc.gov.tw/rwd/english), and National Institute of Infectious Diseases (NIID) in Japan (https://www.niid.go.jp/niid/en/). The weekly consultation rate (per 1000 consultations) of AD is reported by general practitioners in Hong Kong. In Taiwan, TCDC collects emergency visits for AD (defined by the International Classification of Diseases, Ninth Revision, Clinical Modification, ICD-9-CM) weekly from the surveillance system. Infectious gastroenteritis counts are updated from NIID every week by prefecture.
We divided the study areas into 12 regions: one in Hong Kong, three (southern, central, and northern regions) in Taiwan, and eight (Kyushu, Shikoku, Chugoku, Kansai, Chubu, Kanto, Tohoku, and Hokkaido) in Japan. To obtain the estimated weekly count of AD in Hong Kong from the consultation rate of AD, we assumed the confirmation rate of AD among the total inhabitants (around 7,000,000) in Hong Kong was 0.01. For the other 11 regions, the corresponding region-specific total population of 2016 was specified as the denominator to estimate the approximate weekly incidence rate for every region. The study period was from week 31 of 2012 to week 52 of 2016 (total 231 weeks). The corresponding weekly meteorological data, including mean temperature (degrees Celsius, ), mean wind speed (meters per second, m/s), mean visibility (kilometers, km) and mean relative humidity (%) of the 12 regions were estimated from the National Climatic Data Center (NCDC) of the National Oceanic and the National Oceanic and Atmospheric Administration (NOAA, http://www.noaa.gov/). For each region, the weather station located closest to the maximum population center of the region was chosen. Weather information from a total of 12 stations was analyzed.
2.2. Statistical Analysis
To capture the nonlinear and delayed relationship between temperature and AD, we used DLNM [12] to examine their association. Firstly, we specified a generalized linear model (quasi-Poisson family) to the time series of AD counts for each region. The region-specific model is defined as (1):
where indicates the expected weekly AD counts in week t, cb denotes the cross-basis matrix for weekly mean temperature with 3 degrees of freedom (df) [10] and a maximum lag time of up to 7 weeks (the lowest quasi-likelihood Akaike Information Criteria value), means the natural cubic spline of relative humidity with degrees of freedom = 3 [10], denotes the natural cubic spline of wind speed with df = 3, and represents the natural cubic spline of visibility with df = 3. The natural cubic spline of time, denotes as , has df = 3 to control for the effects of seasonality and long-term trends. We also added an autoregressive term () [14] and an offset term ( to adjust for the effect of temporal autocorrelation on count and size effect of population, respectively. Sensitivity analysis on the value of degrees of freedom and estimates of autocorrelation (partial autocorrelation function) were conducted.
Secondly, we applied meta-analysis to pool the 12 region-specific estimates to obtain the overall cumulative association between temperature and AD counts. We further examined the pooled predictor-specific temperature-morbidity relationship at a lower or higher temperature. The cut points for low and high temperatures were 12 °C and 25 °C respectively, since the corresponding 25, 50, and 75 percentiles of temperature in the whole study areas were 12 °C, 20 °C, and 25 °C.
Finally, to assess the accuracy of our model, we used real weekly cases of 2017 for validation. For each region, mean absolute errors (MAE) (2) and root mean squared errors (RMSE) (3) were applied as performance indices:
where is the real count of 2017 in week t and is the predicted value in week t of 2017 according to Equation (1). We specified t and n as 9 and 52 respectively since there were no predictions in week 1 to week 8 of 2017 (the maximum lag equals 8 weeks in the DLNM model). All analyses were conducted using the R software [15] version 3.3.3 with DLNM [16] and MVMETA [17] packages.
3. Results
3.1. Descriptive Statistics
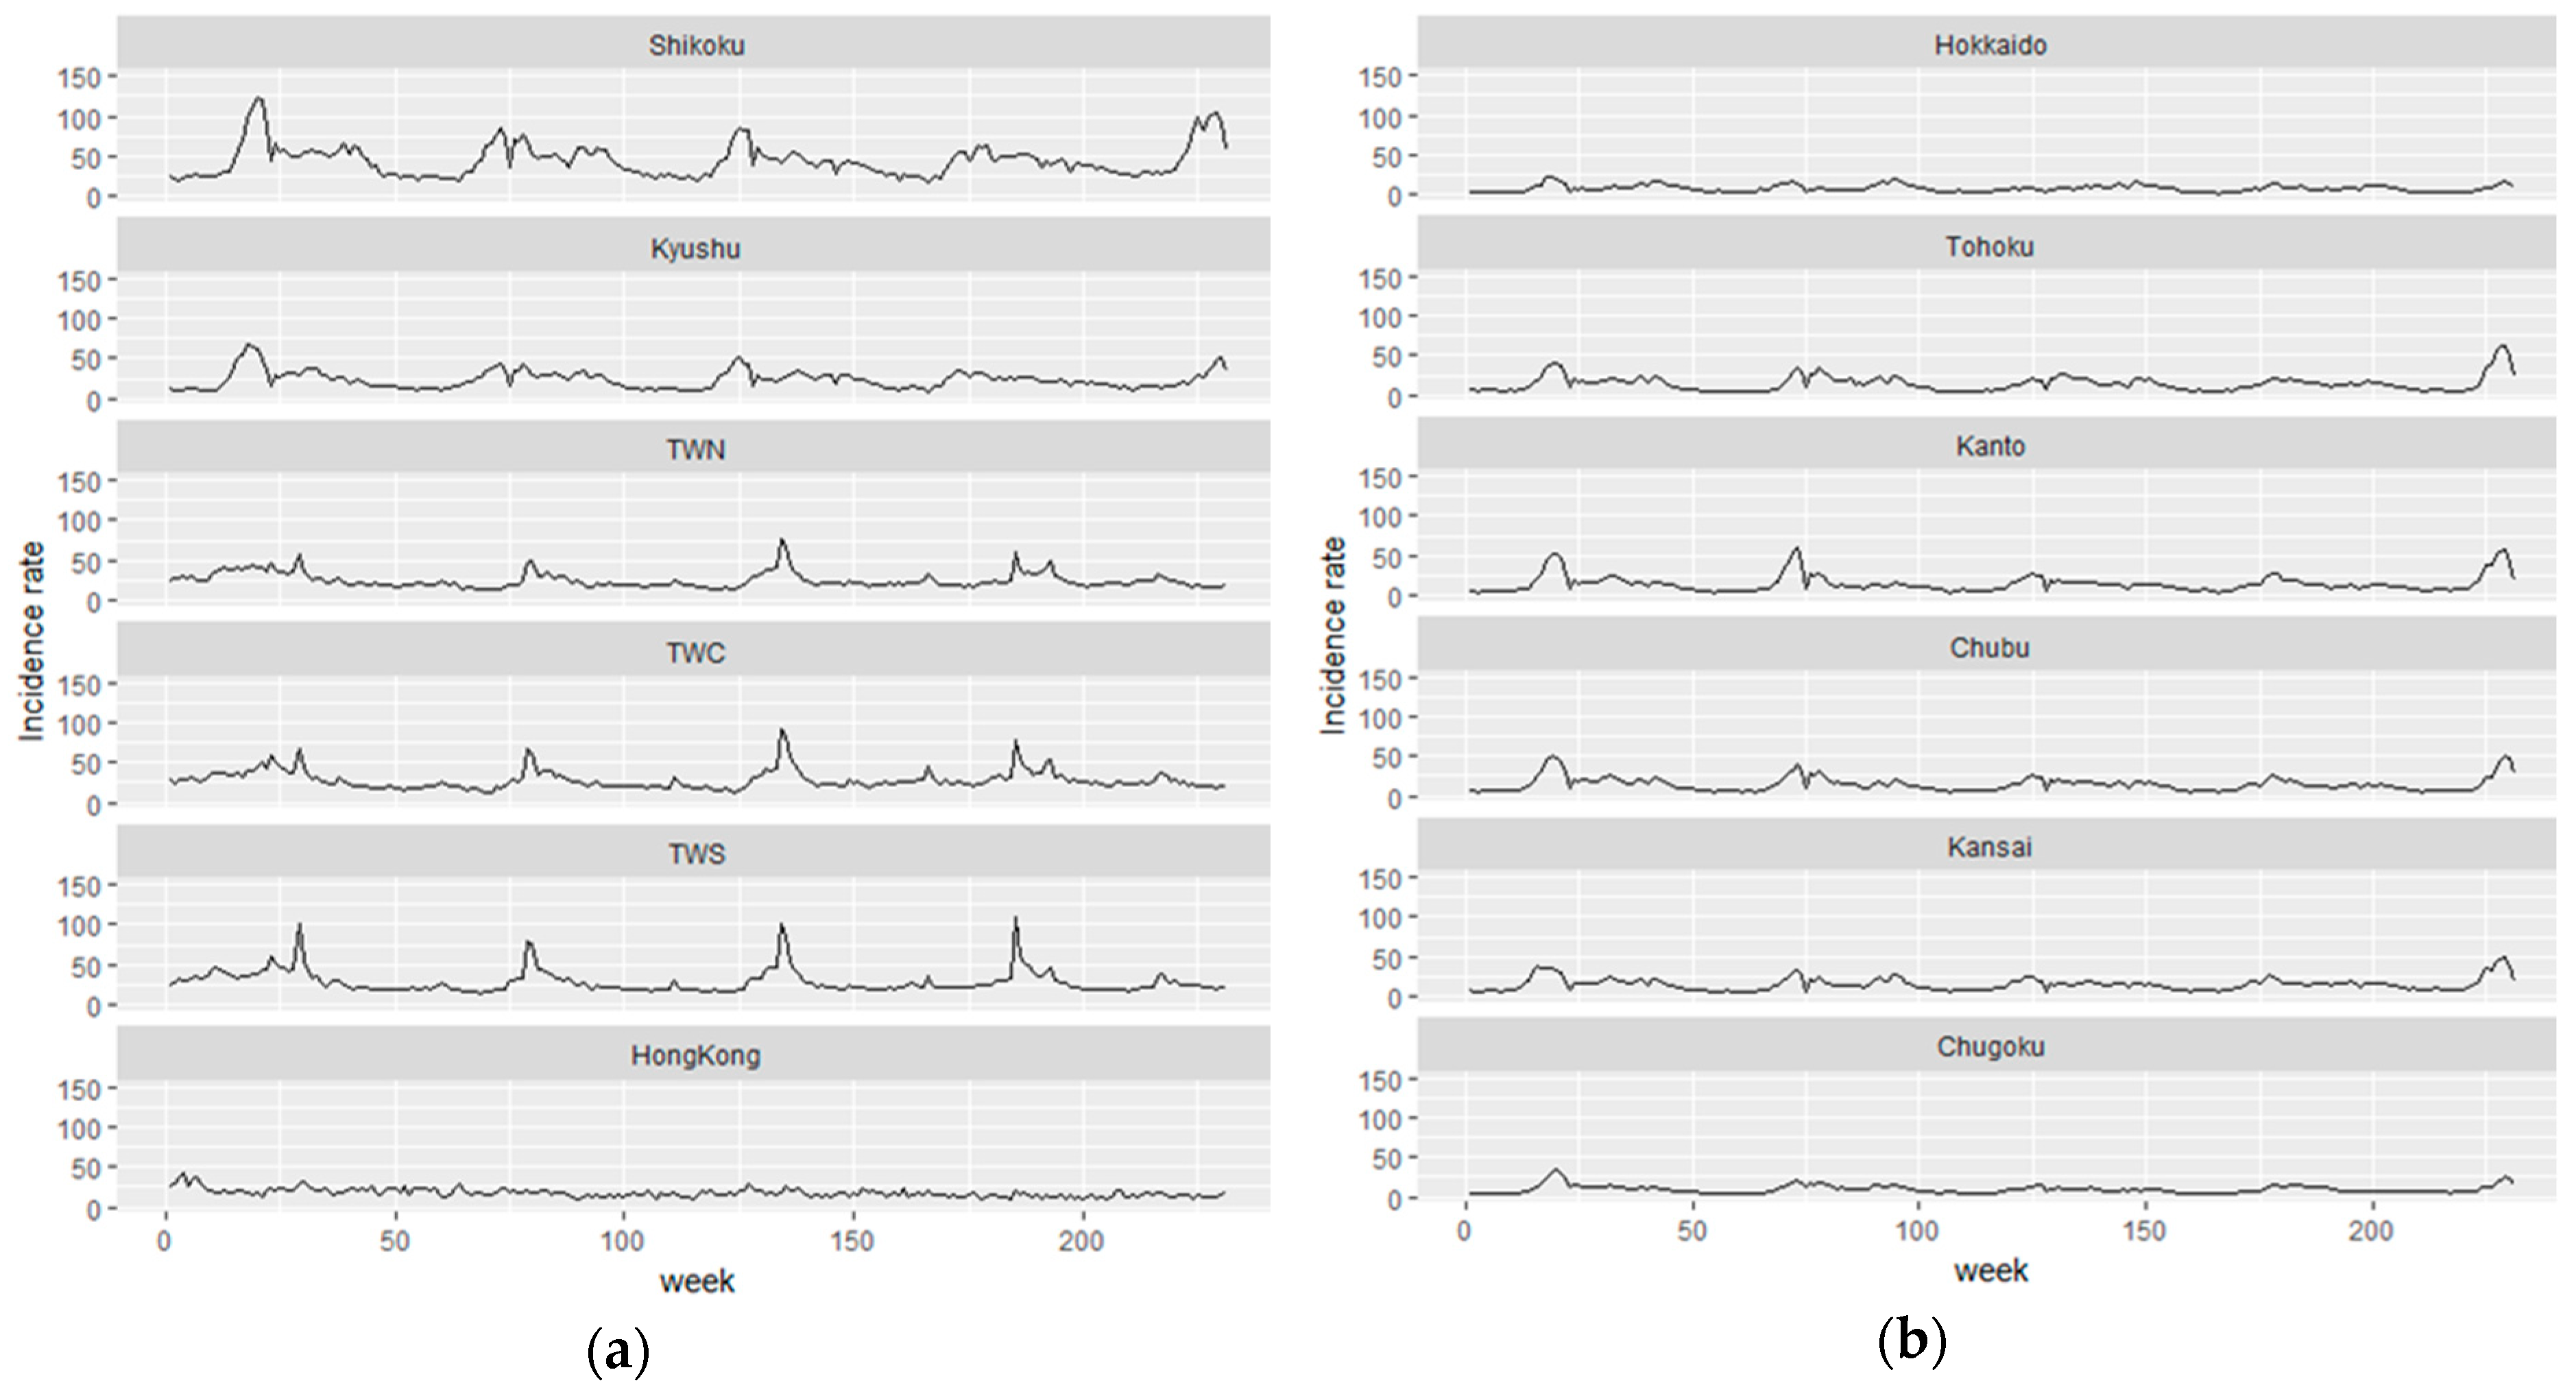
We studied a total of 5,992,082 AD cases occurring between 2012 and 2016 in Hong Kong, Taiwan, and Japan. The weekly mean temperature across the 12 regions was 18.618 ± 8.546 (°C), the weekly mean wind speed was 6.910 ± 2.360 (m/s), the weekly mean visibility was 9.122 ± 3.827 (km), and the weekly mean relative humidity was 67.824 ± 9.482 (%) (Table 1). The weekly average number of AD cases for a region was 2161 ± 2259 (patients). Overall, we observed at least 4–5 waves of AD epidemics in regions like Shikoku during the study period, while less fluctuation of epidemics was observed in Hong Kong, based on the time series of weekly approximate incidence rates (Figure 1).
The heat map of weekly approximate incidence rates (per 100,000 population) of AD by region (Hong Kong, Taiwan, and Japan) during week 31, 2012 to week 52, 2016 are also visualized in Figure 2. Overall, we observed a trend of negative slope by year, indicating an early outbreak in higher-latitude areas.
3.2. DLNM and Meta-Analysis
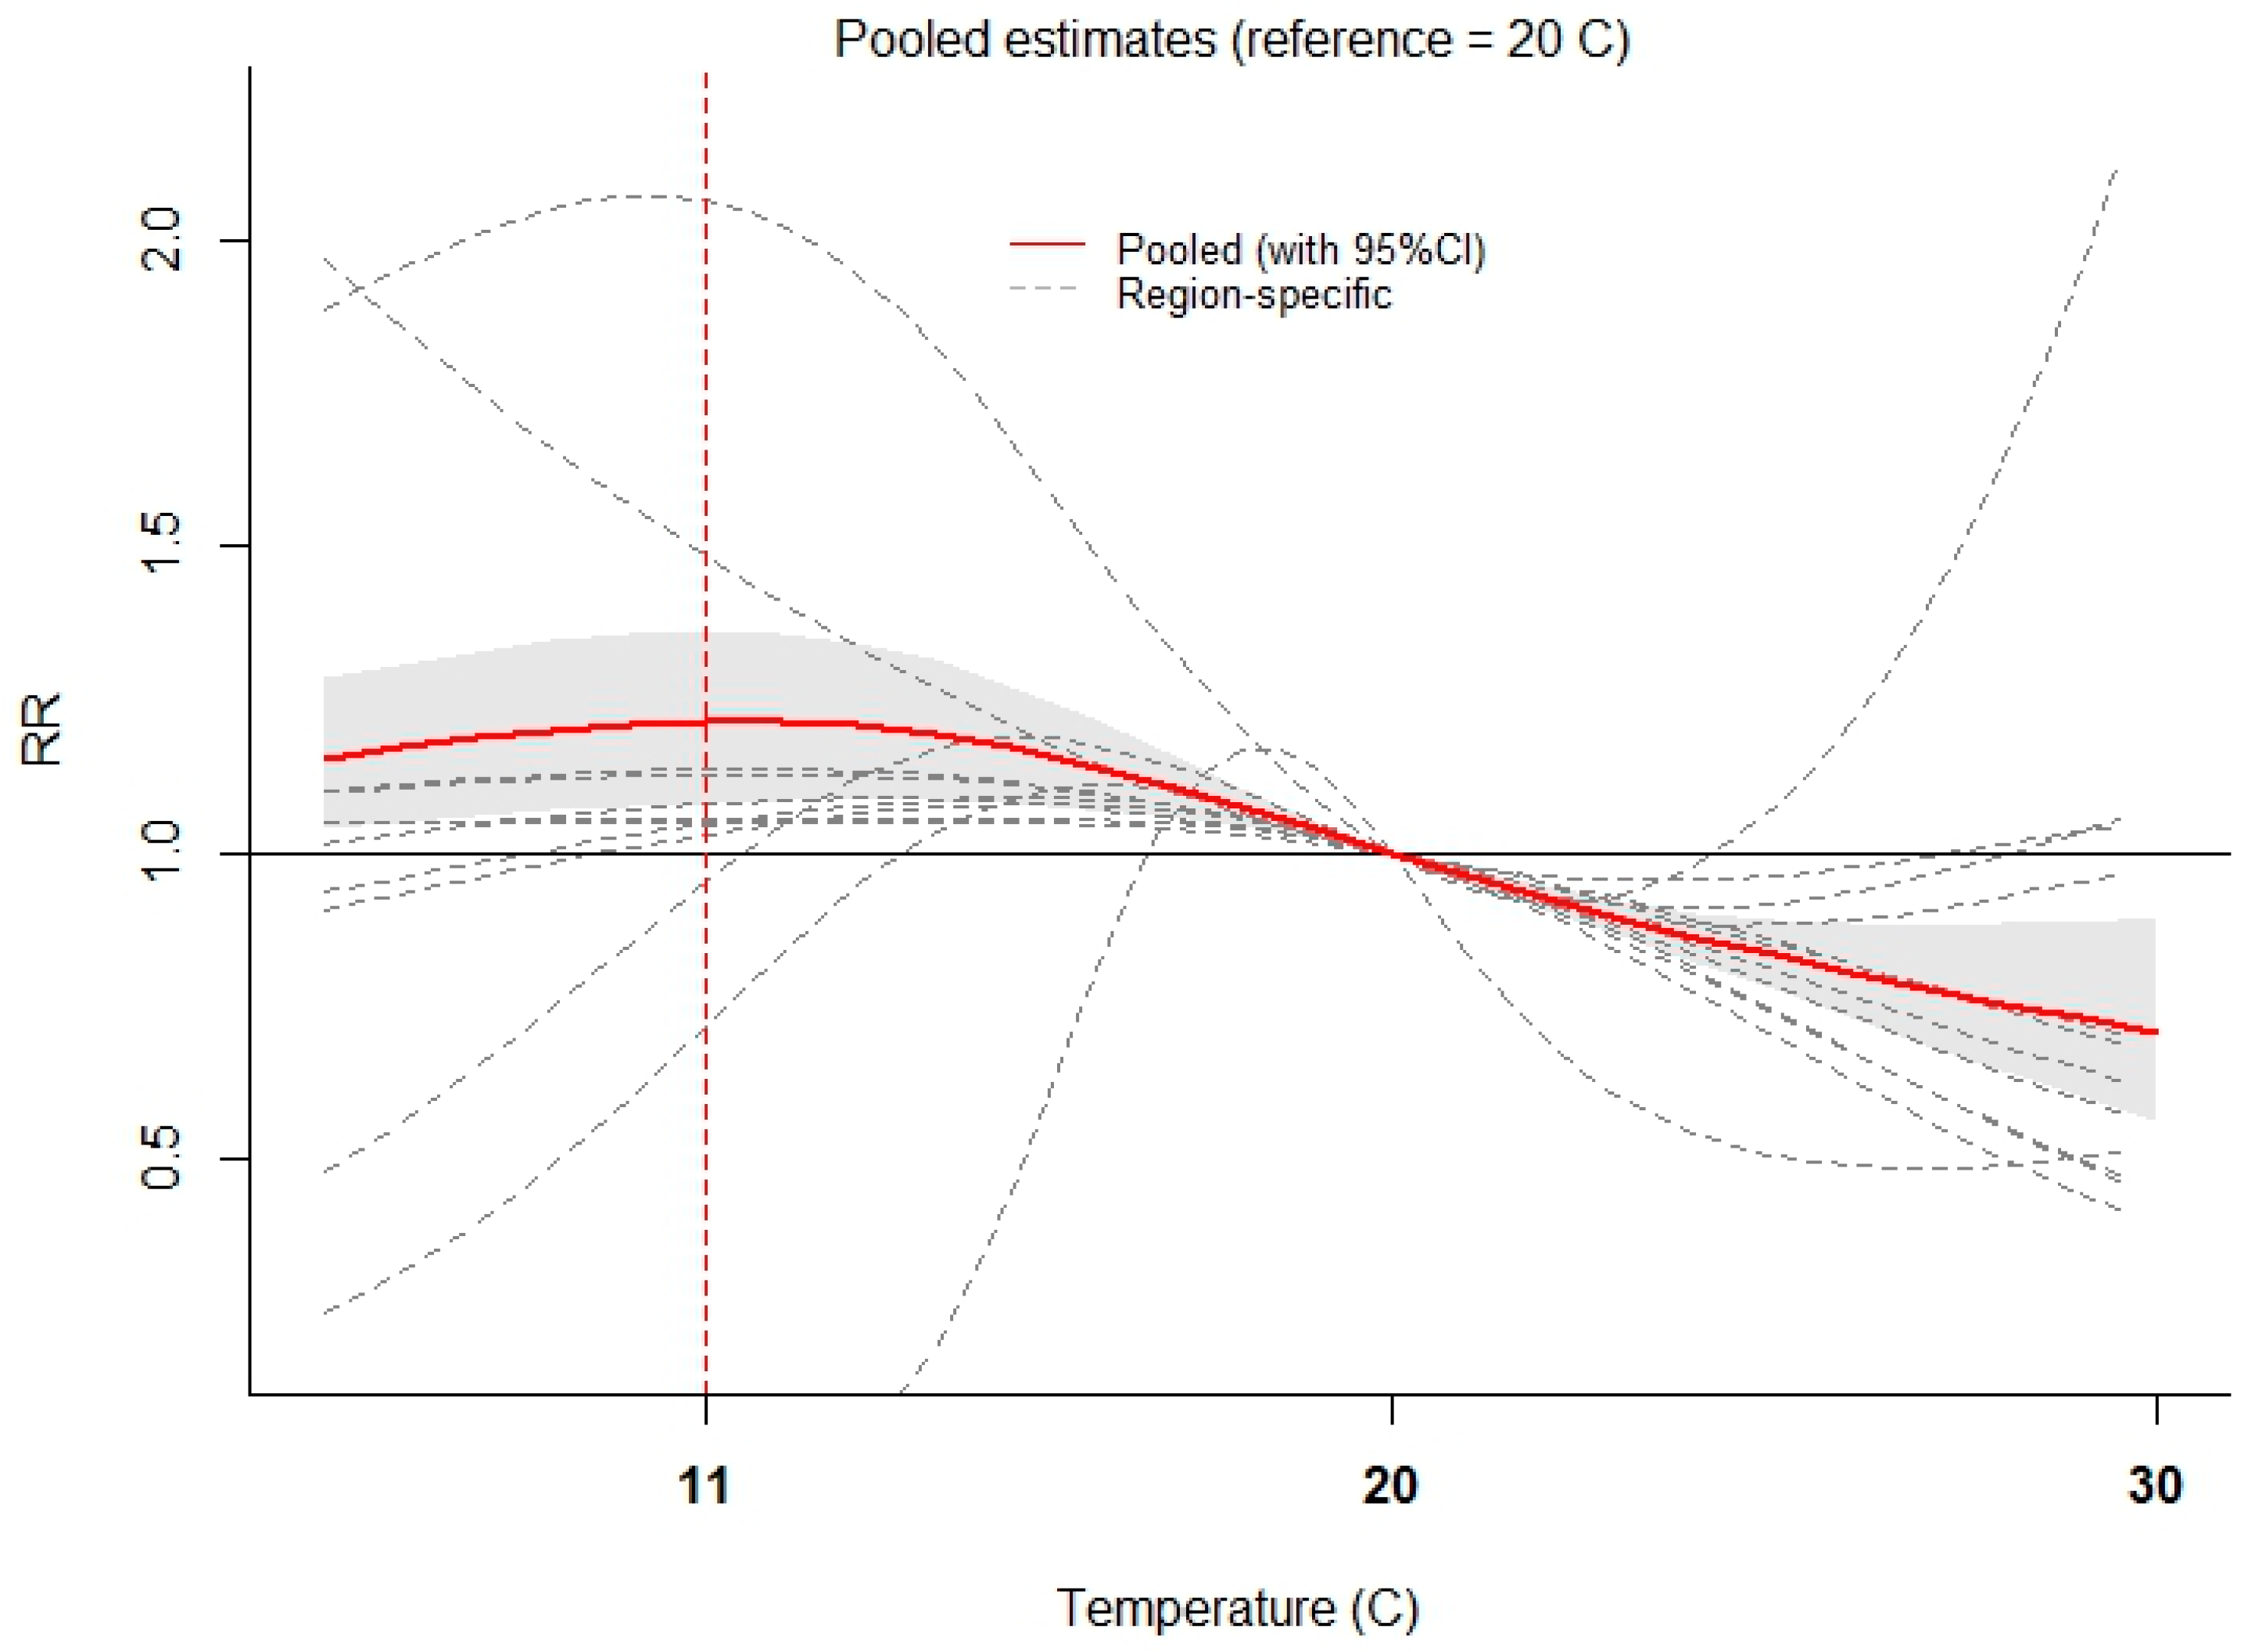
The pooled overall cumulative relationship between relative risk (RR) of AD and temperature is portrayed in Figure 3. Taking 20 °C (50th percentile) as the reference, we identified the highest pooled overall RR = 1.216 (95% CI: 1.083, 1.364, red line) where temperature = 11 °C (vertical dashed red line). Furthermore, the pooled predictor-specific summary association at a higher (25 °C) and a lower (12 °C) temperature are depicted in Figure 4a,b, respectively. Setting 20 °C as the reference, we observed a cold effect on AD (Figure 4b), which started immediately (for example, for one-week lag, RR = 1.054 (95% CI: 1.039, 1.069)) and disappeared after 4 weeks. In contrast, we did not identify a heat effect when conditioning on 25 °C (Figure 4a). The multivariate Cochran Q tests for overall (Figure 3), heat (Figure 4a), and cold effects (Figure 4b) were highly significant (p < 0.001). The related statistics, indicating percent of the variability due to true heterogeneity between regions, were 82.3%, 67.0%, and 60.3%, respectively.
3.3. Prediction and Error Analysis
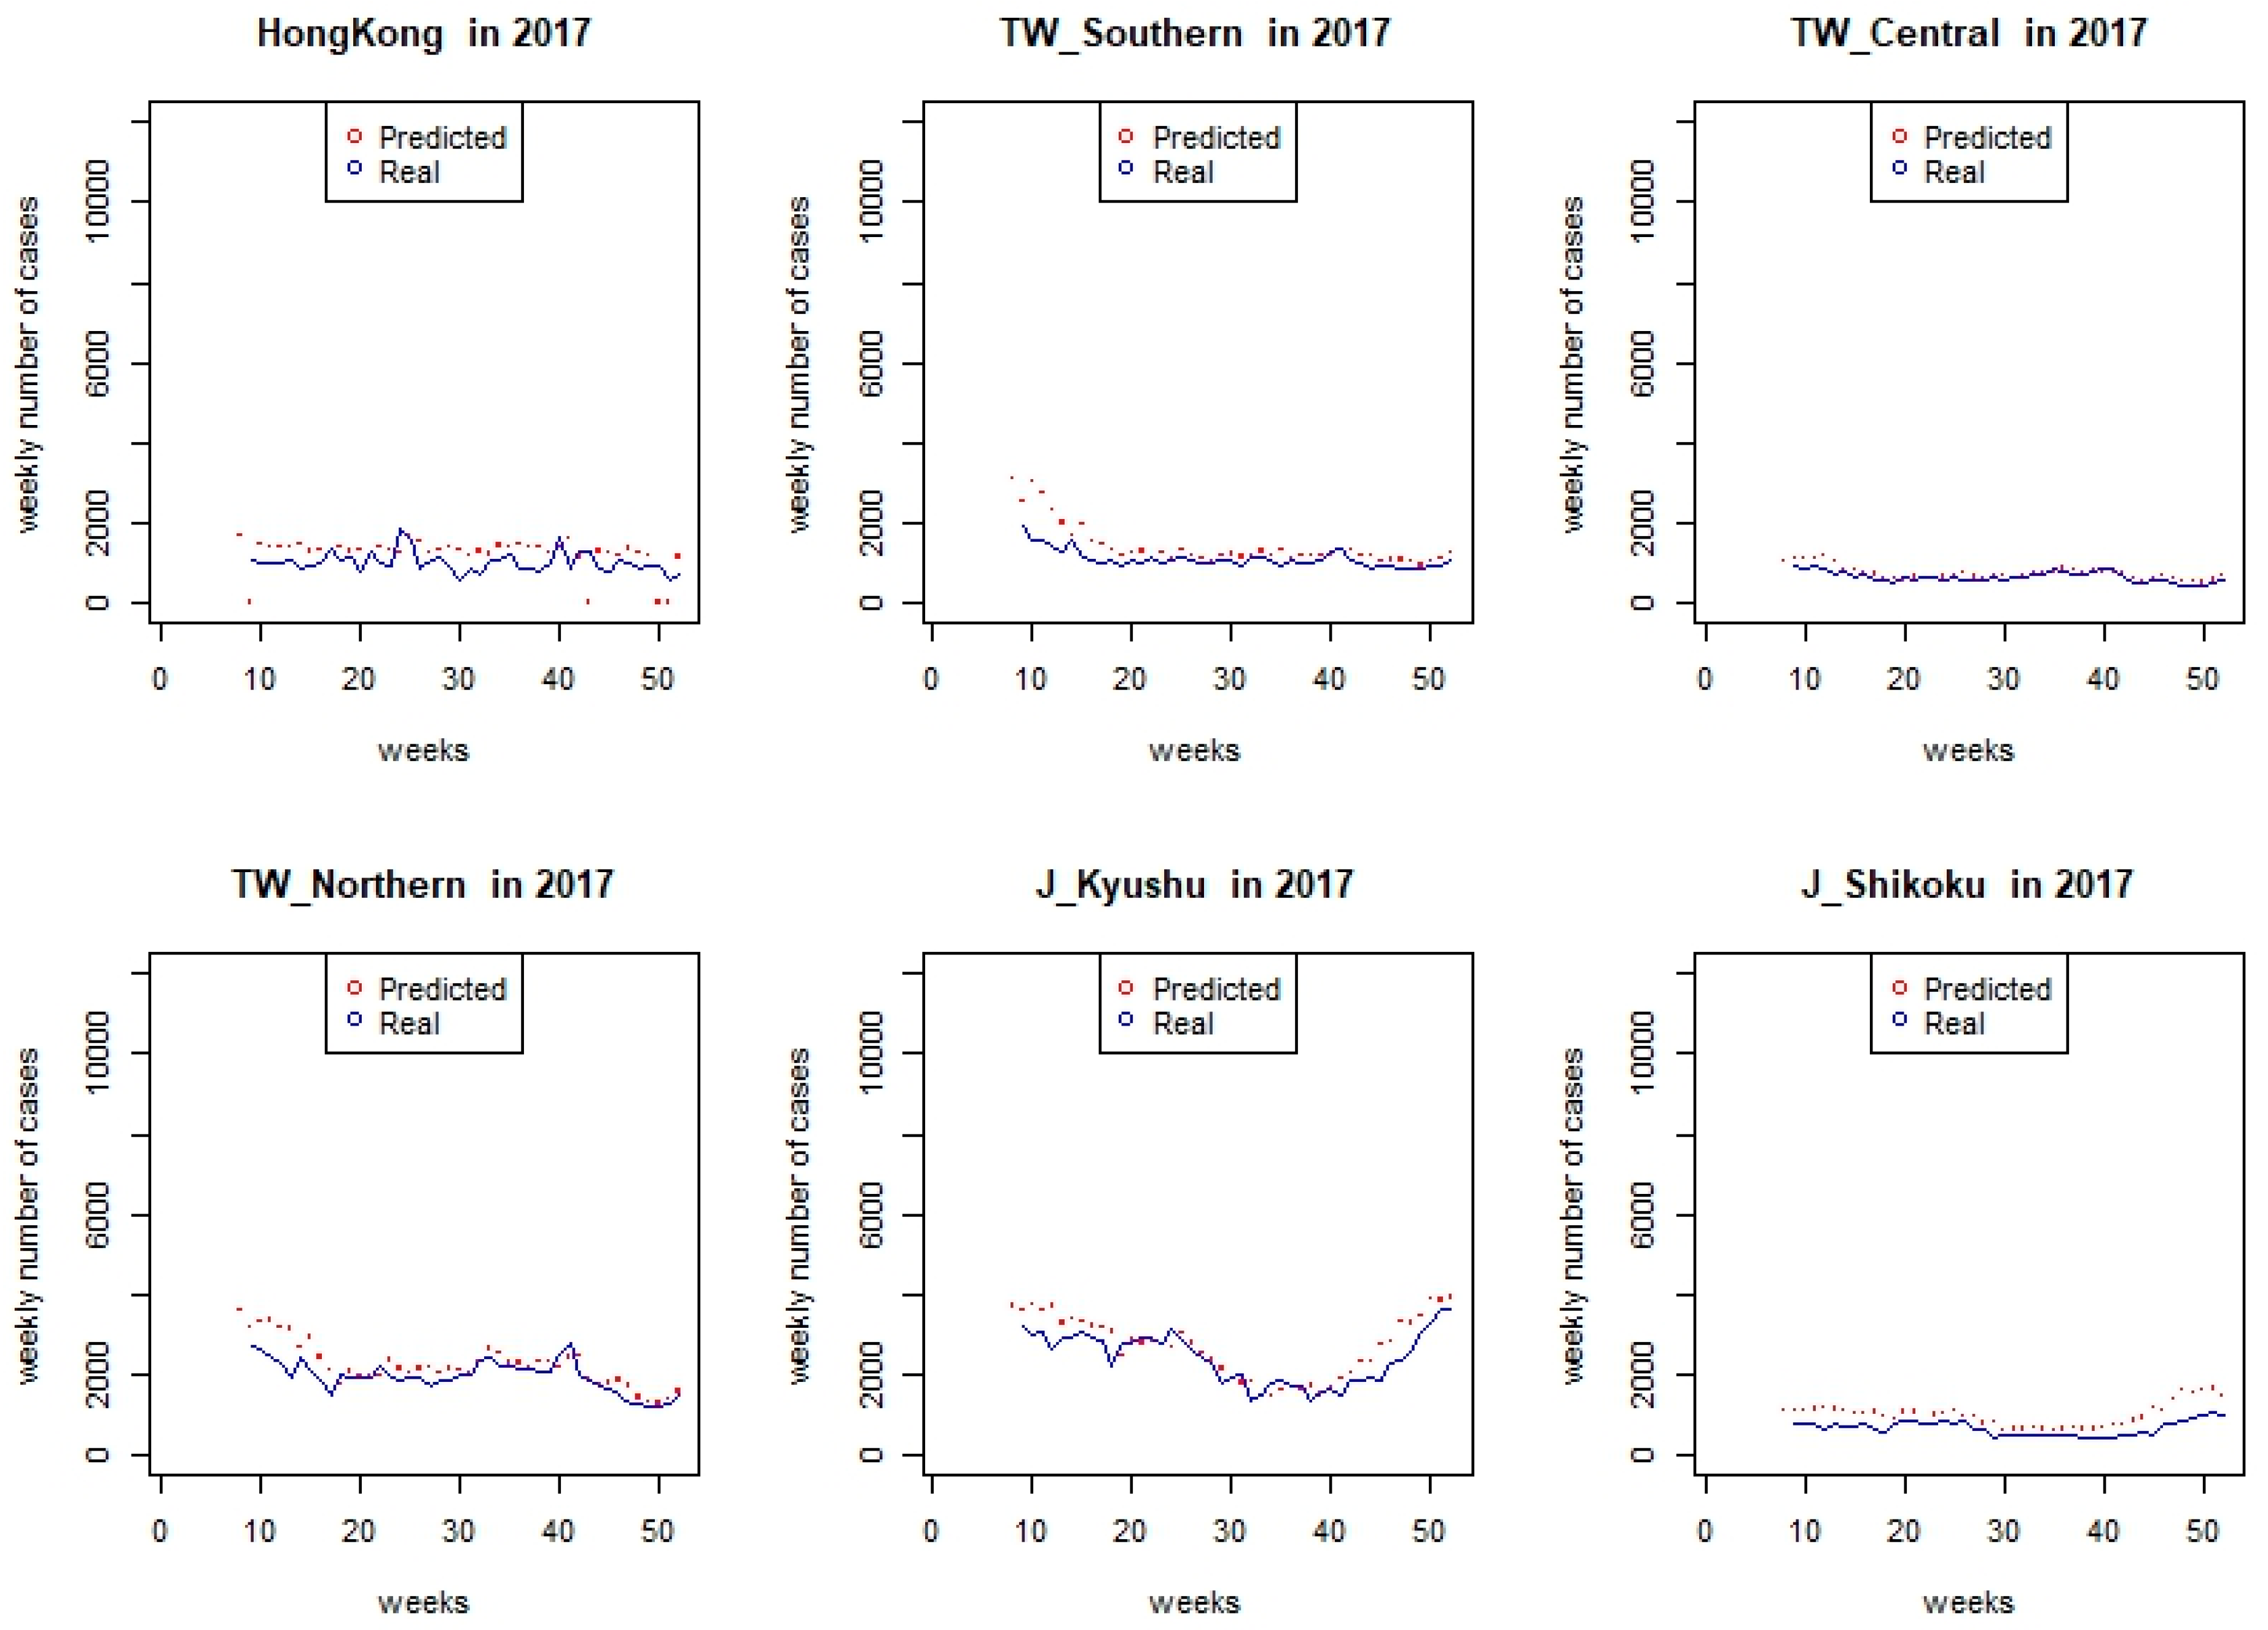
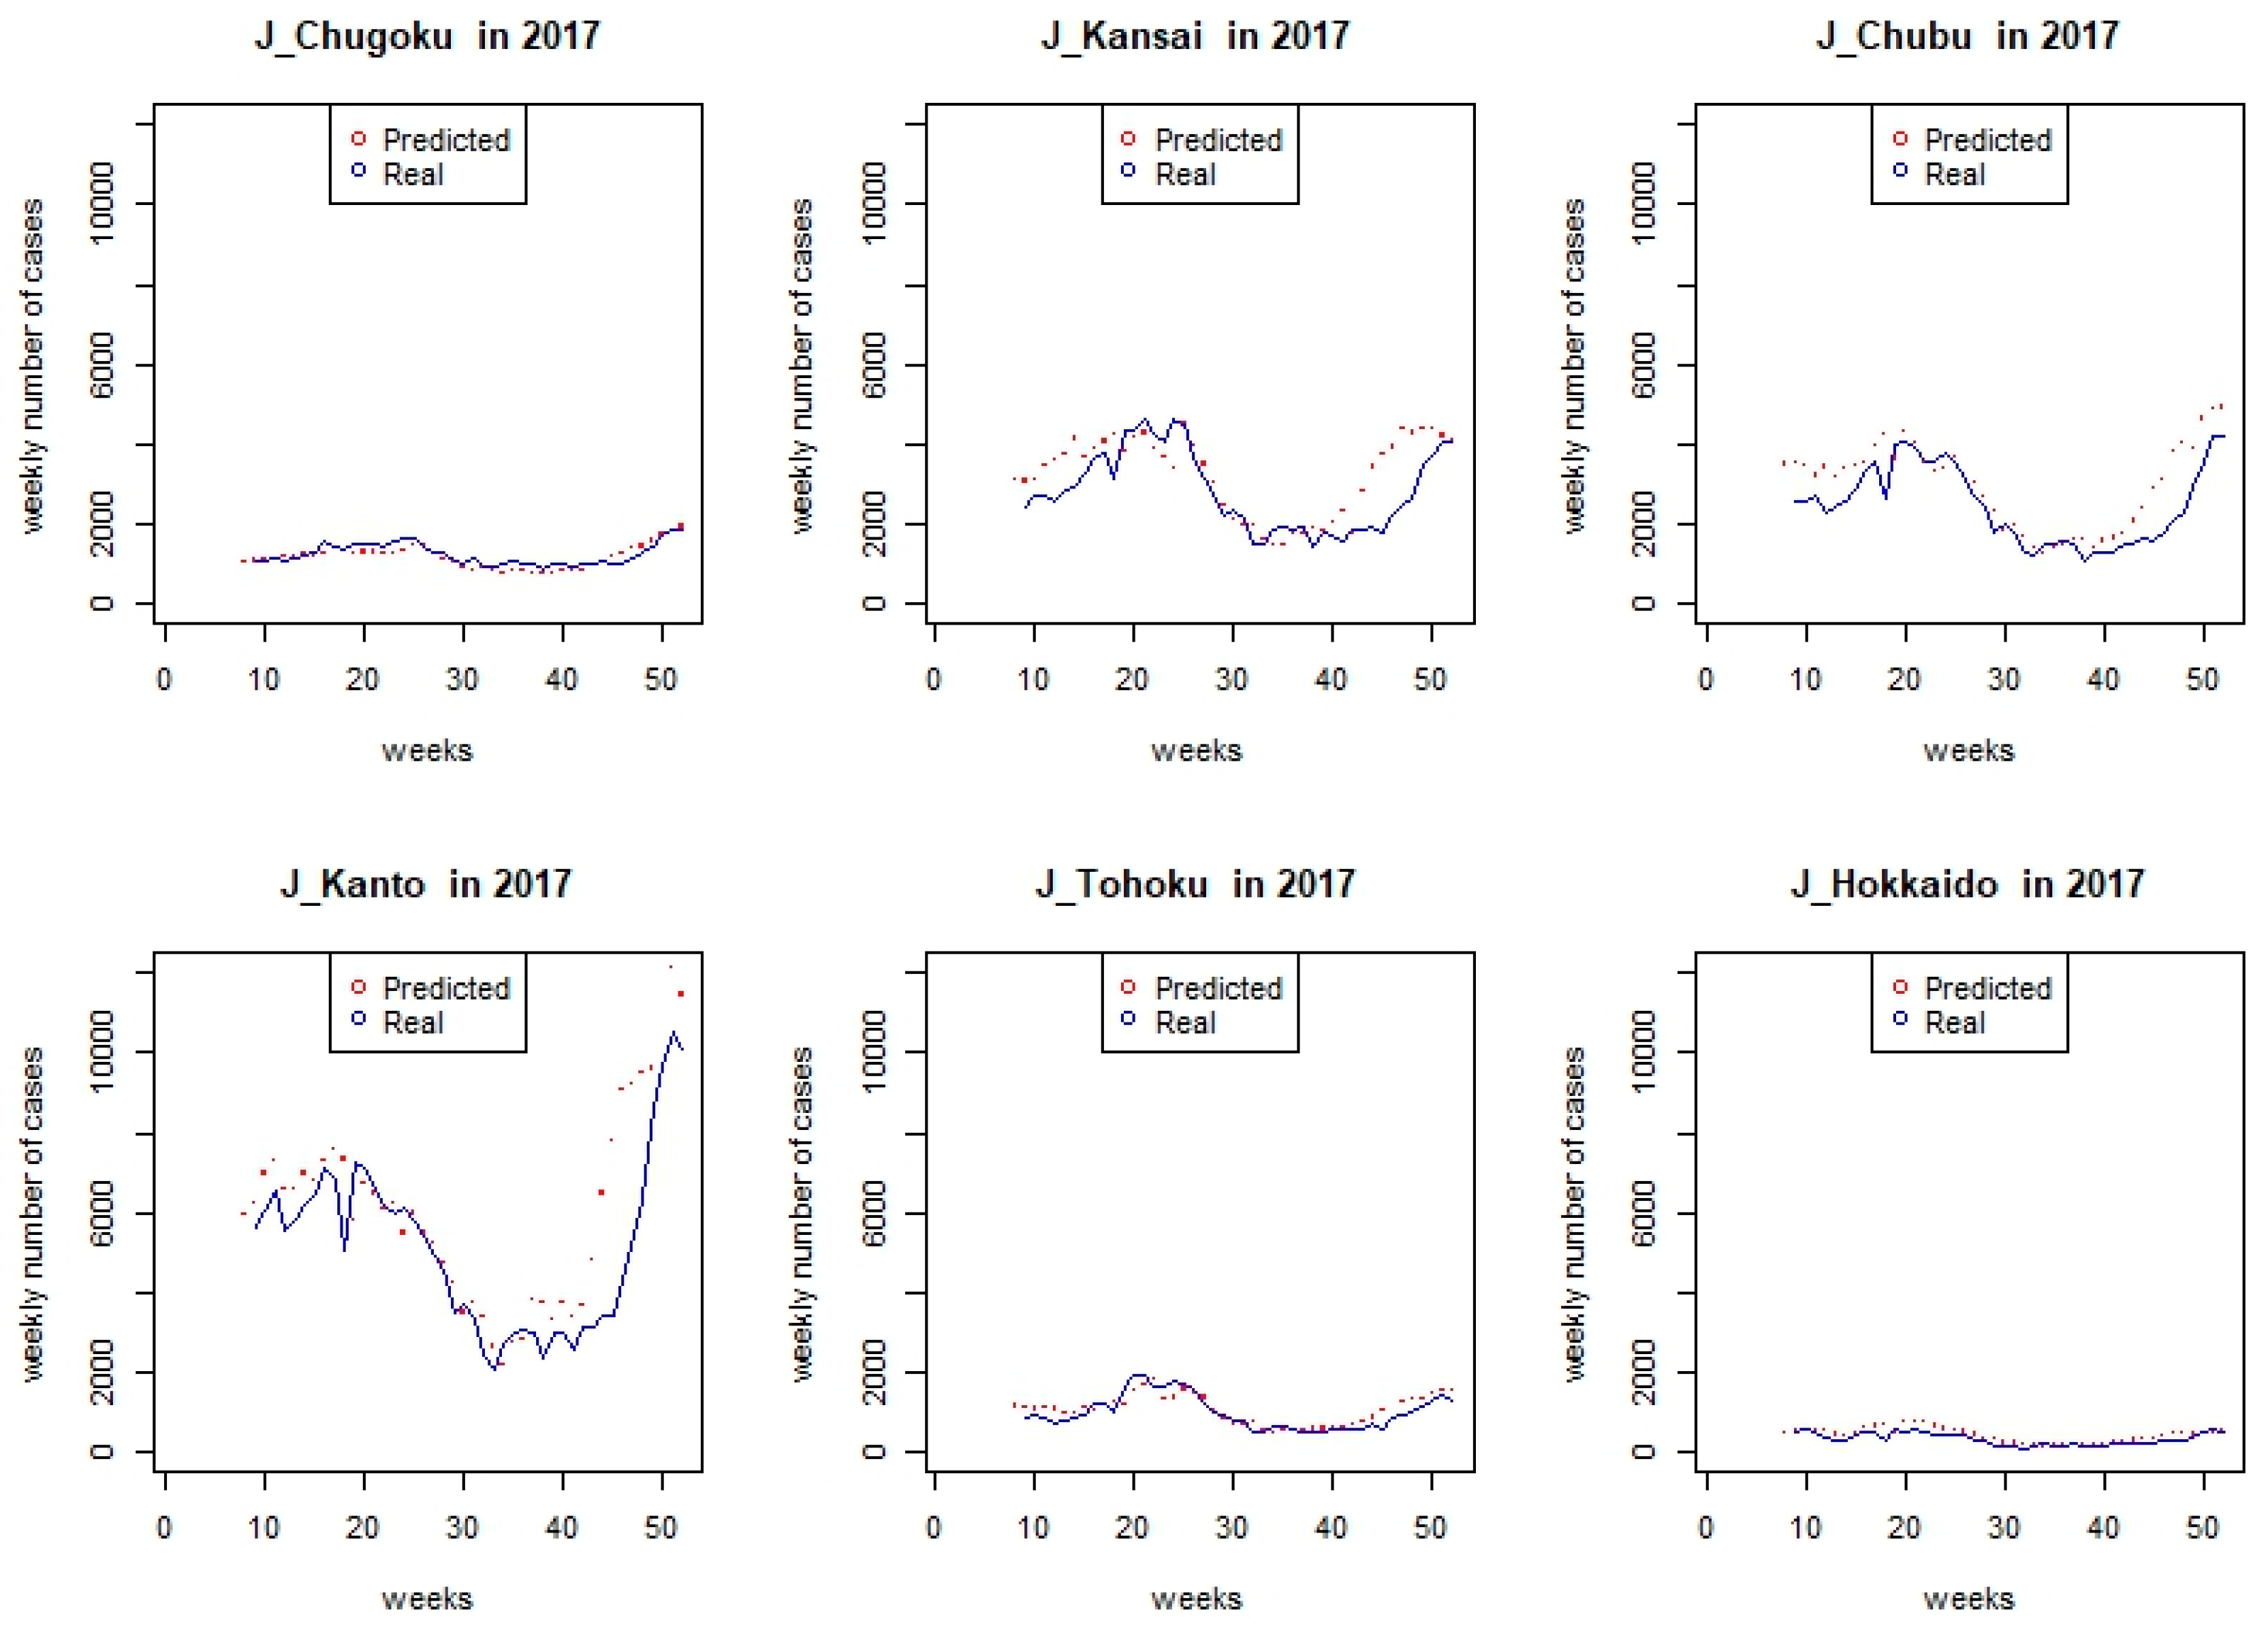
The predicted (red points) and the real weekly case number (blue lines) for 12 regions from week 9 to week 52 in 2017 are depicted according to the region-specific DLNM model (Figure 5). Overall, the trend of weekly count was captured by the model, although the degree of discrepancy was different in each region. To assess the discrepancy, MAE and RMSE are portrayed by region in Table 2 respectively. We observed that Kanto of Japan was the region with the largest MAE (1097) and RMSE (1591) among the 12 regions due to peaking cases at the end of 2017 in Kanto. However, the surging trend of the epidemic can be captured by our current model.
4. Discussion
We examined the overall cumulative effect of temperature on 5,992,082 AD cases from Hong Kong, Taiwan, and Japan during 2012–2016 and observed the pooled predictor-specific temperature-morbidity association under the scenario of low (12 °C) and high (25 °C) temperatures. To the best of our knowledge, this is the first cross-country study which elucidates the association between temperature and AD. We found that the pooled overall cumulative relationship between relative risk (RR) of AD and temperature was the greatest at 11 °C; a pooled predictor-specific summary association was observed at lower temperatures (12 °C or 25th percentile) (Figure 4b), which began immediately and disappeared after four weeks.
Similar to Onozuka and Hagihara’s work in 2015 [10] which investigated temperature-morbidity association in 47 Japanese prefectures, we identify a cold temperature effect on AD. Lower temperatures are associated with increased viral diarrhea-like transmission and incidence of rotavirus and norovirus [5,18,19,20].
In contrast, we did not observe a hot temperature effect on AD as Onozuka and Hagihara did [10]. A possible interpretation would be that inhabitants in Hong Kong and Taiwan are more adapted to hot temperatures. Rotavirus or norovirus activity has also been found to be negatively associated with temperature [20,21].
Based on our findings, we would suggest setting up an early warning system based on the information of temperature variation [22]. The integration of temperature-based early warning systems into existing action plans might facilitate timely interventions of AD during cold seasons [23]. Our results might also help health workers to predict cases and prepare for extreme cold-related hospital admission in each region [24]. Although we observed a trend (negative slope) of weekly incidence rate by year among the 12 regions (Figure 1), further rigorous methods to assess whether early outbreaks start at higher latitudes are warranted.
Limitations of the present study include: (1) we adopted an intercept-only model in the meta- regression. Due to time constraints on this exploratory study, we were not able to add factors relating to heterogeneity of the temperature-morbidity relationship. Effect modifiers such as latitude might be included in multivariate meta-regression in future studies [12]; (2) other meteorological factors like precipitation were not considered, due to missing value of rainfall information in the study areas. Since rainfall might direct pathogen transport at higher temperatures [4], we might underestimate the heat effect in our study; (3) we did not control for potential confounding on AD like demographics, vulnerable subpopulations, and socioeconomic status in our model. Therefore, the interpretation of findings should be done cautiously.
5. Conclusions
Our study reveals that the negative association between risk of AD and temperature was the greatest at 11 °C in Hong Kong, Taiwan, and Japan during 2012–2016. Cold temperature effects on AD were immediate but vanished after four weeks. An early warning system during winter seasons might be implemented in these countries for effective acute diarrhea control management.
Author Contributions
T.-C.C. and P.-H.C. conceived the idea for the study design. C.-C.C. and L.P. carried out the statistical analyses and C.-C.C. wrote the first manuscript draft. T.-C.C., B.-C.L. and P.-H.C. reviewed the manuscript and provided guidance on all issues related to the analysis. All authors contributed to the intellectual content and approved the final manuscript.
Acknowledgments
This research was supported by a grant titled “Multidisciplinary Health Cloud Research Program: Technology Development and Application of Big Health Data” from Academia Sinica. We would like to thank Daphanie Shih for her assistance in data analysis. We would also like to express our sincere gratitude to Kent M. Suárez for his English editing.
Conflicts of Interest
The authors declare that we do not have any competing interests related to this study.
References
- GBD 2015 Mortality and Causes of Death Collaborators. Global, regional, and national life expectancy, all-cause mortality, and cause-specific mortality for 249 causes of death, 1980–2015: A systematic analysis for the Global Burden of Disease Study 2015. Lancet 2016, 388, 1459–1544. [Google Scholar]
- GBD Diarrhoeal Diseases Collaborators. Estimates of global, regional, and national morbidity, mortality, and aetiologies of diarrhoeal diseases: A systematic analysis for the Global Burden of Disease Study 2015. Lancet Infect. Dis. 2017, 17, 909–948. [Google Scholar]
- Hashim, J.H.; Hashim, Z. Climate Change, Extreme Weather Events, and Human Health Implications in the Asia Pacific Region. Asia Pac. J. Public Health 2016, 28 (Suppl. 2), 8S–14S. [Google Scholar] [CrossRef] [PubMed]
- Chou, W.C.; Wu, J.L.; Wang, Y.C.; Huang, H.; Sung, F.C.; Chuang, C.Y. Modeling the impact of climate variability on diarrhea-associated diseases in Taiwan (1996–2007). Sci. Total Environ. 2010, 409, 43–51. [Google Scholar] [CrossRef] [PubMed]
- D’Souza, R.M.; Hall, G.; Becker, N.G. Climatic factors associated with hospitalizations for rotavirus diarrhoea in children under 5 years of age. Epidemiol. Infect. 2008, 136, 56–64. [Google Scholar] [CrossRef] [PubMed]
- Mellor, J.; Kumpel, E.; Ercumen, A.; Zimmerman, J. Systems Approach to Climate, Water, and Diarrhea in Hubli-Dharwad, India. Environ. Sci. Technol. 2016, 50, 13042–13051. [Google Scholar] [CrossRef] [PubMed]
- Onozuka, D. Effect of non-stationary climate on infectious gastroenteritis transmission in Japan. Sci. Rep. 2014, 4, 5157. [Google Scholar] [CrossRef] [PubMed]
- Xu, Z.; Huang, C.; Turner, L.R.; Su, H.; Qiao, Z.; Tong, S. Is diurnal temperature range a risk factor for childhood diarrhea? PLoS ONE 2013, 8, e64713. [Google Scholar] [CrossRef] [PubMed]
- Zhou, X.; Zhou, Y.; Chen, R.; Ma, W.; Deng, H.; Kan, H. High temperature as a risk factor for infectious diarrhea in Shanghai, China. J. Epidemiol. 2013, 23, 418–423. [Google Scholar] [CrossRef] [PubMed]
- Onozuka, D.; Hagihara, A. Nationwide variation in the effects of temperature on infectious gastroenteritis incidence in Japan. Sci. Rep. 2015, 5, 12932. [Google Scholar] [CrossRef] [PubMed]
- Xu, Z.; Liu, Y.; Ma, Z.; Sam Toloo, G.; Hu, W.; Tong, S. Assessment of the temperature effect on childhood diarrhea using satellite imagery. Sci. Rep. 2014, 4, 5389. [Google Scholar] [CrossRef] [PubMed] [Green Version]
- Gasparrini, A.; Armstrong, B. Reducing and meta-analysing estimates from distributed lag non-linear models. BMC Med. Res. Methodol. 2013, 13, 1. [Google Scholar] [CrossRef] [PubMed]
- Guo, Y.; Gasparrini, A.; Armstrong, B.; Li, S.; Tawatsupa, B.; Tobias, A.; Lavigne, E.; de Sousa Zanotti Stagliorio Coelho, M.; Leone, M.; Pan, X.; et al. Global variation in the effects of ambient temperature on mortality: A systematic evaluation. Epidemiology 2014, 25, 781–789. [Google Scholar] [CrossRef] [PubMed]
- Xiao, X.; Gasparrini, A.; Huang, J.; Liao, Q.; Liu, F.; Yin, F.; Yu, H.; Li, X. The exposure-response relationship between temperature and childhood hand, foot and mouth disease: A multicity study from mainland China. Environ. Int. 2017, 100, 102–109. [Google Scholar] [CrossRef] [PubMed]
- R: A Language and Environment for Statistical Computing. Available online: http://www.R.-project.org (accessed on 1 March 2018).
- Gasparrini, A. Distributed lag linear and non-linear models in R: The package dlnm. J. Stat. Softw. 2011, 43, 1–20. [Google Scholar] [CrossRef] [PubMed]
- Gasparrini, A.A.B.; Kenward, M. Multivariate meta-analysis for non-linear and other multi-parameter associations. Stat. Med. 2012, 31, 3821–3839. [Google Scholar] [CrossRef] [PubMed]
- Atchison, C.J.; Tam, C.C.; Hajat, S.; van Pelt, W.; Cowden, J.M.; Lopman, B.A. Temperature-dependent transmission of rotavirus in Great Britain and The Netherlands. Proc. Biol. Sci. 2010, 277, 933–942. [Google Scholar] [CrossRef] [PubMed]
- Pitzer, V.E.; Viboud, C.; Simonsen, L.; Steiner, C.; Panozzo, C.A.; Alonso, W.J.; Miller, M.A.; Glass, R.I.; Glasser, J.W.; Parashar, U.D.; et al. Demographic variability, vaccination, and the spatiotemporal dynamics of rotavirus epidemics. Science 2009, 325, 290–294. [Google Scholar] [CrossRef] [PubMed]
- Lopman, B.; Armstrong, B.; Atchison, C.; Gray, J.J. Host, weather and virological factors drive norovirus epidemiology: Time-series analysis of laboratory surveillance data in England and Wales. PLoS ONE 2009, 4, e6671. [Google Scholar] [CrossRef] [PubMed]
- Hervas, D.; Hervas-Masip, J.; Rosell, A.; Mena, A.; Perez, J.L.; Hervas, J.A. Are hospitalizations for rotavirus gastroenteritis associated with meteorologic factors? Eur. J. Clin. Microbiol. Infect. Dis. 2014, 33, 1547–1553. [Google Scholar] [CrossRef] [PubMed]
- Wang, Y.; Zhang, T.P.; Xiao, H.L.; Qi, H.Y.; Yin, C.H. Formulation of an early warning infectivity score system for adult patients with acute bacterial diarrhea. Biomed. Environ. Sci. 2014, 27, 65–69. [Google Scholar] [PubMed]
- Lowe, D.; Ebi, K.L.; Forsberg, B. Heatwave early warning systems and adaptation advice to reduce human health consequences of heatwaves. Int. J. Environ. Res. Public Health 2011, 8, 4623–4648. [Google Scholar] [CrossRef] [PubMed]
- Thompson, C.N.; Zelner, J.L.; Nhu Tdo, H.; Phan, M.V.; Hoang Le, P.; Nguyen Thanh, H.; Vu Thuy, D.; Minh Nguyen, N.; Ha Manh, T.; Van Hoang Minh, T.; et al. The impact of environmental and climatic variation on the spatiotemporal trends of hospitalized pediatric diarrhea in Ho Chi Minh City, Vietnam. Health Place 2015, 35, 147–154. [Google Scholar] [CrossRef] [PubMed]
Figure 1.
Comparison of weekly incidence rates (per 100,000 population) in 12 regions: (a) Hong Kong, Southern Taiwan, Central Taiwan, Northern Taiwan, Kyushu, Shikoku and (b) Chugoku, Kansai, Chubu, Kanto, Tohoku, Hokkaido during week 31, 2012–week 52, 2016.
Figure 1.
Comparison of weekly incidence rates (per 100,000 population) in 12 regions: (a) Hong Kong, Southern Taiwan, Central Taiwan, Northern Taiwan, Kyushu, Shikoku and (b) Chugoku, Kansai, Chubu, Kanto, Tohoku, Hokkaido during week 31, 2012–week 52, 2016.

Figure 2.
Weekly incidence rates (per 100,000 persons) of acute diarrhea in 12 regions (Hong Kong, Southern Taiwan, Central Taiwan, Northern Taiwan, Kyushu, Shikoku, Chugoku, Kansai, Chubu, Kanto, Tohoku, Hokkaido) during week 31, 2012–week 52, 2016.
Figure 2.
Weekly incidence rates (per 100,000 persons) of acute diarrhea in 12 regions (Hong Kong, Southern Taiwan, Central Taiwan, Northern Taiwan, Kyushu, Shikoku, Chugoku, Kansai, Chubu, Kanto, Tohoku, Hokkaido) during week 31, 2012–week 52, 2016.

Figure 3.
The pooled (95% as grey area) overall cumulative relationship between relative risk (RR) of acute diarrhea and temperature (reference at 20 °C).
Figure 3.
The pooled (95% as grey area) overall cumulative relationship between relative risk (RR) of acute diarrhea and temperature (reference at 20 °C).

Figure 4.
The pooled (95% as grey area) predictor-specific temperature-morbidity association in Hong Kong, Taiwan, and Japan, summaries at (a) higher (25 °C) and (b) lower (12 °C) temperatures (reference at 20 °C).
Figure 4.
The pooled (95% as grey area) predictor-specific temperature-morbidity association in Hong Kong, Taiwan, and Japan, summaries at (a) higher (25 °C) and (b) lower (12 °C) temperatures (reference at 20 °C).

Figure 5.
Predicted and real weekly counts in 2017 by region (TW and J stand for Taiwan and Japan, respectively).
Figure 5.
Predicted and real weekly counts in 2017 by region (TW and J stand for Taiwan and Japan, respectively).


Table 1.
Mean and standard deviation of meteorological factors in 12 regions during 2012–2016.
| Region | Temperature (°C) Mean ± SD | Wind Speed (m/s) Mean ± SD | Visibility (km) Mean ± SD | Relative Humidity (%) Mean ± SD |
|---|---|---|---|---|
| Hong Kong | 24.646 ± 5.278 | 8.977 ± 1.668 | 5.872 ± 0.650 | 69.830 ± 8.785 |
| Southern Taiwan | 25.563 ± 3.631 | 6.209 ± 1.105 | 4.742 ± 0.881 | 76.092 ± 6.267 |
| Central Taiwan | 23.2627 ± 5.292 | 11.332 ± 3.307 | 5.414 ± 0.717 | 74.747 ± 7.192 |
| Northern Taiwan | 23.480 ± 5.164 | 7.532 ± 1.872 | 5.707 ± 0.526 | 70.776 ± 6.541 |
| Kyushu | 17.702 ± 7.608 | 5.526 ± 0.987 | 10.352 ± 2.059 | 68.276 ± 8.910 |
| Shikoku | 17.645 ± 7.285 | 7.669 ± 2.123 | 5.965 ± 0.484 | 66.702 ± 8.848 |
| Chugoku | 16.872 ± 8.218 | 6.4770 ± 1.026 | 12.281 ± 2.650 | 64.662 ± 7.231 |
| Kansai | 17.380 ± 8.169 | 4.686 ± 0.793 | 15.102 ± 2.833 | 62.585 ± 7.130 |
| Chubu | 16.674 ± 8.379 | 5.914 ± 1.067 | 10.676 ± 1.908 | 62.890 ± 8.498 |
| Kanto | 16.897 ± 7.811 | 5.626 ± 1.029 | 11.673 ± 3.151 | 62.484 ± 12.288 |
| Tohoku | 13.485 ± 8.303 | 6.124 ± 1.161 | 11.600 ± 2.795 | 68.030 ± 10.156 |
| Hokkaido | 9.806 ± 9.536 | 6.843 ± 1.484 | 9.789 ± 2.163 | 66.797 ± 7.915 |
| All 12 regions | 18.618 ± 8.546 | 6.910 ± 2.360 | 9.122 ± 3.827 | 67.824 ± 9.482 |
Table 2.
Mean absolute errors (MAE) and root mean squared errors (RMSE) in 2017 by region.
| Region | Mean Absolute Errors (MAE) | Root Mean Squared Errors (RMSE) |
|---|---|---|
| Hong Kong | 423 | 493 |
| Southern Taiwan | 281 | 411 |
| Central Taiwan | 95 | 125 |
| Northern Taiwan | 298 | 401 |
| Kyushu | 344 | 434 |
| Shikoku | 306 | 349 |
| Chugoku | 135 | 169 |
| Kansai | 600 | 791 |
| Chubu | 558 | 724 |
| Kanto | 1097 | 1591 |
| Tohoku | 168 | 209 |
| Hokkaido | 101 | 129 |
© 2018 by the authors. Licensee MDPI, Basel, Switzerland. This article is an open access article distributed under the terms and conditions of the Creative Commons Attribution (CC BY) license (http://creativecommons.org/licenses/by/4.0/).
Share and Cite
MDPI and ACS Style
Chen, C.-C.; Lin, B.-C.; Yap, L.; Chiang, P.-H.; Chan, T.-C. The Association between Ambient Temperature and Acute Diarrhea Incidence in Hong Kong, Taiwan, and Japan. Sustainability 2018, 10, 1417. https://doi.org/10.3390/su10051417
AMA Style
Chen C-C, Lin B-C, Yap L, Chiang P-H, Chan T-C. The Association between Ambient Temperature and Acute Diarrhea Incidence in Hong Kong, Taiwan, and Japan. Sustainability. 2018; 10(5):1417. https://doi.org/10.3390/su10051417
Chicago/Turabian StyleChen, Chien-Chou, Bo-Cheng Lin, Liwei Yap, Po-Huang Chiang, and Ta-Chien Chan. 2018. "The Association between Ambient Temperature and Acute Diarrhea Incidence in Hong Kong, Taiwan, and Japan" Sustainability 10, no. 5: 1417. https://doi.org/10.3390/su10051417
Note that from the first issue of 2016, this journal uses article numbers instead of page numbers. See further details here.