Structural Equation Model for Evaluating Factors Affecting Quality of Social Infrastructure Projects
by
 ,
,
Shahid Hussain
1,* ,
,
Zhu Fangwei
1,*,
Ahmed Faisal Siddiqi
2,
Zaigham Ali
3 and
Muhammad Salman Shabbir
4 1
Faculty of Management and Economics, Dalian University of Technology, Dalian 116024, China
2
Institute of Business & Management, University of Engineering & Technology, Lahore 54000, Pakistan
3
Department of Business Management, Karakoram International University, Gilgit-Baltistan 15100, Pakistan
4
OYA Graduate School of Business, Universiti Utara Malaysia, Sintok Kedh 06010, Malaysia
*
Authors to whom correspondence should be addressed.
Sustainability 2018, 10(5), 1415; https://doi.org/10.3390/su10051415
Submission received: 12 March 2018
/
Revised: 29 April 2018
/
Accepted: 30 April 2018
/
Published: 3 May 2018
(This article belongs to the Section Economic and Business Aspects of Sustainability)
Abstract
:The quality of the constructed social infrastructure project has been considered a necessary measure for the sustainability of projects. Studies on factors affecting project quality have used various techniques and methods to explain the relationships between particular variables. Unexpectedly, Structural Equation Modeling (SEM) has acquired very little concern in factors affecting project quality studies. To address this limitation in the body of knowledge, the objective of this study was to apply the SEM approach and build a model that explained and identified the critical factors affecting quality in social infrastructure projects. The authors developed a quantitative approach using smart-PLS version 3.2.7. This study shed light on the views of different experts based on their experience in public construction projects in Pakistan. Particularly, the authors aimed to find out the relationships between construction, stakeholders, materials, design, and external factors, and how these relate to project quality. The findings of this study revealed that the R2 value of the model was scored at 0.749, which meant that the five exogenous latent constructs collectively explained 74.9% of the variance in project quality. The Goodness-of-Fit of the model was 0.458. The construction related factor was the most important out of the five constructs. This study determined that better planning and monitoring and evaluation should be developed to better address and control the quality defects by decision-makers, project managers as well as contractors. These findings might support practitioners and decision makers to focus on quality related problems that might occur in their current or future projects.
1. Introduction
Time, cost and quality have been accepted as key factors of project success [1]. Among these three generally accepted constraints, the quality dimension is studied as the least explicit feature of project success. Quality is currently becoming as imperative a distinguishing factor as cost and time of public infrastructure project. In order to accomplish the time and cost objectives, project quality is mostly ignored [2,3]. Turk [4] indicated that quality might sometimes be overlooked by the contracting parties in the construction industry to cut back the project costs and schedule. Better quality in construction projects is a well-known factor in resulting success and sustainability of projects by public construction industry globally. In the construction industry, quality is defined as the effective and successful accomplishment of contracted project goals between client and the service provider or main contractor [5] and conformance with requirements [6]. Quality requires proper supervision in every phase of the project which is the particular accomplishment of the quality assurance system [7]. In general, currently, quality is given extra attention to client’ expectations of quality are increasing [8] because it relates to the durability and sustainability of the project.
Social infrastructure projects (SIP) (hospitals, prisons, courts, educational institutions, government accommodation, and others) are the combination of sub-sectors that facilitate social development and enhance quality of life [9], particularly constructed to serve the community at large. The quality of building projects generally implies satisfying the users’ expectations and meeting the quality requirements [10]. Traditionally, time, cost and quality have been considered as the “triple constraint” in the field of project management. Most importantly, in contemporary times, quality is assumed as an additional consideration as the end users’ beliefs in quality are growing. Quality management has gradually been implemented by public construction organizations as a mechanism to figure out quality problems and to fulfil the requirements of the end-users [11,12]. The public construction industry plays a vital role for the betterment of the society as the public construction industry is dynamic and complex in its nature as it involves vast numbers of participants as clients, service providers (contractors), consultants, communities, regulators, and others [13]. Furthermore, a construction project is a multifaceted process including a number of different phases throughout which various parts influence the quality performance of projects. A number of participants are included in the construction process, all of them seeking to care for their particular agenda [14]. In spite of this complication, the public construction industry plays an imperative role in the improvement and accomplishment of organizational as well as societal goals. In construction work, an industry’s capability to execute a quality outcome in a safe manner is a fundamental necessity for business success [15] and is a substantial benefit to the community. The success of quality management is governed by management practices such as the commitment of the project team towards site supervision [16,17], the contractor commitment to quality management [18], and combining continuous improvement measures towards the strategic goals throughout the complete project cycle [16].
In spite of the numerous benefits of project quality, it seems that quality implementation techniques have not yet been effectively realized in the public construction industry, specifically in the context of developing nations such as Pakistan. The lack of quality in public social infrastructure projects is more critical for Pakistan. However, there is currently no finalized research in the case of Pakistan to provide a key to the lack of quality in public social infrastructure projects. The public construction sector in Pakistan has suffered from lack of quality projects for several years. Therefore, it is extremely important to enhance the quality of social infrastructure project in developing nations like Pakistan. Lack of quality in SIP have received a lot of attention recently. The most key feature in lack of quality in SIP analysis is to find the key constructs and, consequently, the sustainability and durability of SIP projects. Therefore, finding potential constructs of lack of quality is imperative in determining quality problems before they actually happen. In particular, this study tried to find out the answer to the question of how project quality is influenced by the considerations of construction, stakeholder, design, material, and external factors. This was achieved by building a conceptual model by using smart-PLS (v3.2.7) using construction, stakeholder, design, material, and external factors as exogenous latent constructs and project quality as the endogenous latent construct. Based on earlier literature, project quality is influenced by numerous factors, and different authors have suggested different recommendations for improving and overcoming the quality glitches. To our knowledge, very little or no research has been provided with a complete conceptual framework that justifies how these exogenous latent constructs influence the project quality and which construct is the most important one affecting the project quality. This study attempted to establish an empirical model that will benefit not only researchers, but also practitioners seeking to understand how critical factors (exogenous constructs) directly impact the project quality (endogenous constructs).
The following sections describe the literature review, the conceptual model of the study, the methodology used in this study, data analysis, discussion of the results, and conclusions of this study.
2. Literature Review
In previous studies, it has been found that the successful completion of project objectives and success deals with the quality of the final product [19,20,21]. Indeed, factors affecting the quality of construction projects have been identified in previous studies such as Arditi and Gunaydin [22], who classified factors, for example, management commitment to continuous quality improvement, personnel training, efficient and effective teamwork among and between parties involved in the project, as common factors that affected project process quality. Likewise, the Hong Kong construction industry is also affected by quality problems. By examining and analyzing the factors affecting the quality of building projects, Chan and Tam [23] surveyed Hong Kong building projects. They determined that the management activities of the project staff were the most dominant quality influencing factor, followed by the client’s view on the importance of quality. Oyedele et al. [24] highlighted empirical research in Nigeria that showed that the poor quality of materials delivered to the site, low level of skill and labor experience, poor inspection and testing, poor site installation procedures, and the lack of quality assurance were the top five most vital factors. They also suggested that there was a need for the awareness and understanding of project quality among all construction parties through different educational programs and courses. A study was carried out by Refaat and Abdel-Razek [17] on factors affecting building construction projects in Egypt. A Delphi technique was employed by the author and it was found that design, contract, material, labor, equipment, site staff, and execution were the main quality influencing factors. A study done by Bubshait and Al-Atiq [25] showed the contractor’s quality assurance system and verified that consistent quality was imperative in averting quality related matters as well as the repetition of problems. The authors also found that the majority of the contractors were unfamiliar with the quality record system. Jha and Iyer [2] managed research in India on critical factors affecting quality performance in construction projects and revealed the competencies of project managers and administrative support as the essential factors that influenced the quality of the project.
Human and organizational errors are recognized as the key contributors to the need for rework and quality defects [26]. Lack of experienced labor and lack of on-site monitoring during construction are noteworthy attributes that affects project quality [27]. Mandal et al. [28] developed a quality process model combining the human resources, technical, and quality improvement system, where the human resources factor was found as one of the three subsystems affecting the quality. Rustom and Amer [19] used a fuzzy triangle methodology and revealed that the most significant parameters influencing the quality of projects were skilled and experienced personnel in the teams of both the owner and contractor and the efficiency of the owner’s assessment team. Furthermore, construction quality could be improved by increasing the skilled and experienced labor on a project site [29]. Tam et al. [18] found that the lack of monitoring the performance quality of contractors and labor turnover were the factors that impacted public housing construction in Hong Kong. The authors further introduced a Performance Assessment Scoring Scheme to measure the standard and performance, and showed that the expected continuous improvement in construction quality had not been fulfilled over a particular period, as well as the quality of projects seemed far away on paper when compared to the actual work done on the project site. In the Gaza Strip, Rustom and Amer [30] observed that the quality of construction projects was substantially influenced by better site layout design, complete design documents, skilled human resources on site, proper installation of equipment and materials, and the contractor’s financial position. A framework introduced by Juran [31] was comprised of three key dimensions such as quality planning, quality control, and quality improvement. The author further stressed that statistical tools and techniques could be incorporated to eradicate the quality deficiencies. Rowlinson and Walker [32] revealed that the construction industry was described by its non-standardization and there was no universally accepted standard to measure the construction quality. Furthermore, the authors argued that changes that were often made in the design of a project may be the resulting delay in the construction project and that quality was also usually at risk due to these changes. If the design of the construction project is to improve substantially during the pre-construction phase and there was proper monitoring during buildability, then quality management and quality standards would be improved [33]. Auchterlounie [34] observed that 57% of 300 UK houses that were examined moderately or completely failed to fulfil the owners’ expectations. The key cause for the client’s dissatisfaction was associated with quality defects. Yeoh and Lee [35] found that the most key factors affecting the construction quality management system are lack of management commitment, inconclusive interpretation of standard requirements and lack of training policies.
Table 1 shows the methodologies and data sources of previous studies worldwide. From Table 1, the results suggest that most studies acquired information through questionnaire surveys and most of them used the relative importance index (RII) and factor analysis. Some of them used multiple regression using SPSS. Furthermore, a thorough consideration of Table 1 further showed that the sample sizes were insufficient when compared to the variables the researchers aimed to survey as the smallest sample size must be five times larger than the sum of the total exogenous (observed) variables [36]. Moreover, past researchers have endeavored to ascertain the critical factors (only observed variables) affecting project quality in the construction industry; a model has yet to be established for this purpose. Therefore, this study surveyed the factors affecting quality in the public construction industry by using a larger sample size, and a multivariate analysis method of partial least squares (PLS) path model was used to validate the structural equation modeling (SEM).
Previous research as exhibited in Table 1 regarding factors affecting quality of construction projects has primarily used the same methodology in different countries and regions. As an extension of the previous studies, this study introduced a method for quantifying the factors affecting the quality of social infrastructure projects. The primary purpose of this study was to examine the main constructs affecting quality in SIP, especially in the context of the public construction industry in Pakistan. Therefore, this study built and tested a conceptual model conducted by previous literature related to quality and presented a complete picture of the contributory factors that influenced project quality. Furthermore, this study aimed at identifying the most significant construct that affected the quality of public projects from the owner’s perspective, which has been ignored in previous studies. Nevertheless, the public construction industry in Pakistan is still faced with poor quality. Therefore, quality defects are a crucial problem in the public construction industry in Pakistan, which needs severe consideration in improving project quality as it affects overall stakeholder satisfaction and sustainability of the project. In many developing nations, the quality of public infrastructure projects is still inadequate [37]. It is significant to ascertain the causative factors affecting the quality to effectively improve the quality performance of the projects. This study applied an advanced multivariate analysis method of the PLS path model for the quality influencing factors and examined the causal relationship based on the conceptual framework, with statistical analysis conducted using smart–PLS software to examine and validate the conceptual model. This is a very effective method for examining the cause-effect relationships between variables [38]. The findings of the conceptual model are presumed to give insights into the factors affecting the quality in SIP. The quality was evaluated based on the perspectives of public sector construction experts. This study addressed the main quality challenges faced by the SIP with reference to the Pakistani public construction industry.
3. Conceptual Model
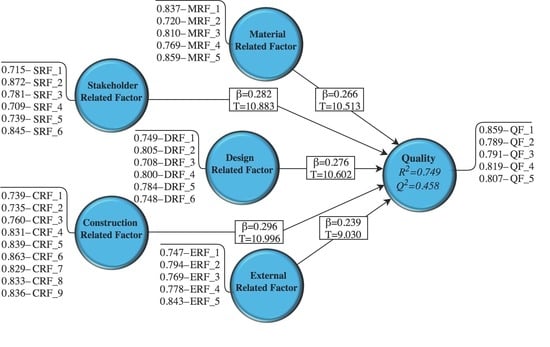
In evaluating the factors that affect project quality, the Partial Least Square Structural Equation Modeling (PLS-SEM) was used, and a conceptual model designed. PLS-SEM is used for causal predictive analysis and both reflective and formative variables [48]. This method is nonparametric in nature, which means that this method does not need any supposition concerning the distribution of the data. The PLS-SEM is common multivariate analysis method to calculate variance-based structural equation models, particularly in social sciences fields [49]. Nevertheless, PLS-SEM presents an opportunity to resolve multifaceted procedure of associations and causal relationships that are otherwise hard to uncover. PLS-SEM handle the data to assessment the path coefficient. The most commonly used application for PLS-SEM in current era is more suitable for the analysis of quantitative data. In addition, PLS-SEM handles a distribution from the data using bootstrapping technique to find out the significance value of path coefficient. The aim of this study is to apply PLS-SEM to better understand the public construction projects quality influencing factors. The proposed model is analyzed in two different stages, first the models comprises of latent variables (measurement models) that define the relationships between latent indicators and their manifest variables, and second, a structural model comprises of the relationships between the latent variables. The conceptual model explicated the relationships between the latent variables and their related manifest variables. By using the SEM technique, a model was developed, and a total of 31 quality affecting factors were also named as the observed variables, which were finalized from the literature and categories into five groups. The five groups were called exogenous latent constructs such as the construction related factor, stakeholder related factor, material related factor, design related factor, and external related factor. Whereas, the endogenous latent variable (Quality) consisted of five observed variables. The conceptual model presenting the relationship between the exogenous latent constructs and endogenous latent constructs are exhibited in Figure 1. Thus, project quality is influenced by the five major constructs. The study hypotheses are as follows:
Hypothesis 1 (H1).
Construction factor has a significant and positive effect on project quality.
Hypothesis 2 (H2).
Stakeholder factor has a significant and positive effect on project quality.
Hypothesis 3 (H3).
Design factor has a significant and positive effect on project quality.
Hypothesis 4 (H4).
Material factor has a significant and positive effect on project quality.
Hypothesis 5 (H5).
External factor has a significant and positive effect on project quality.
4. Research Methods
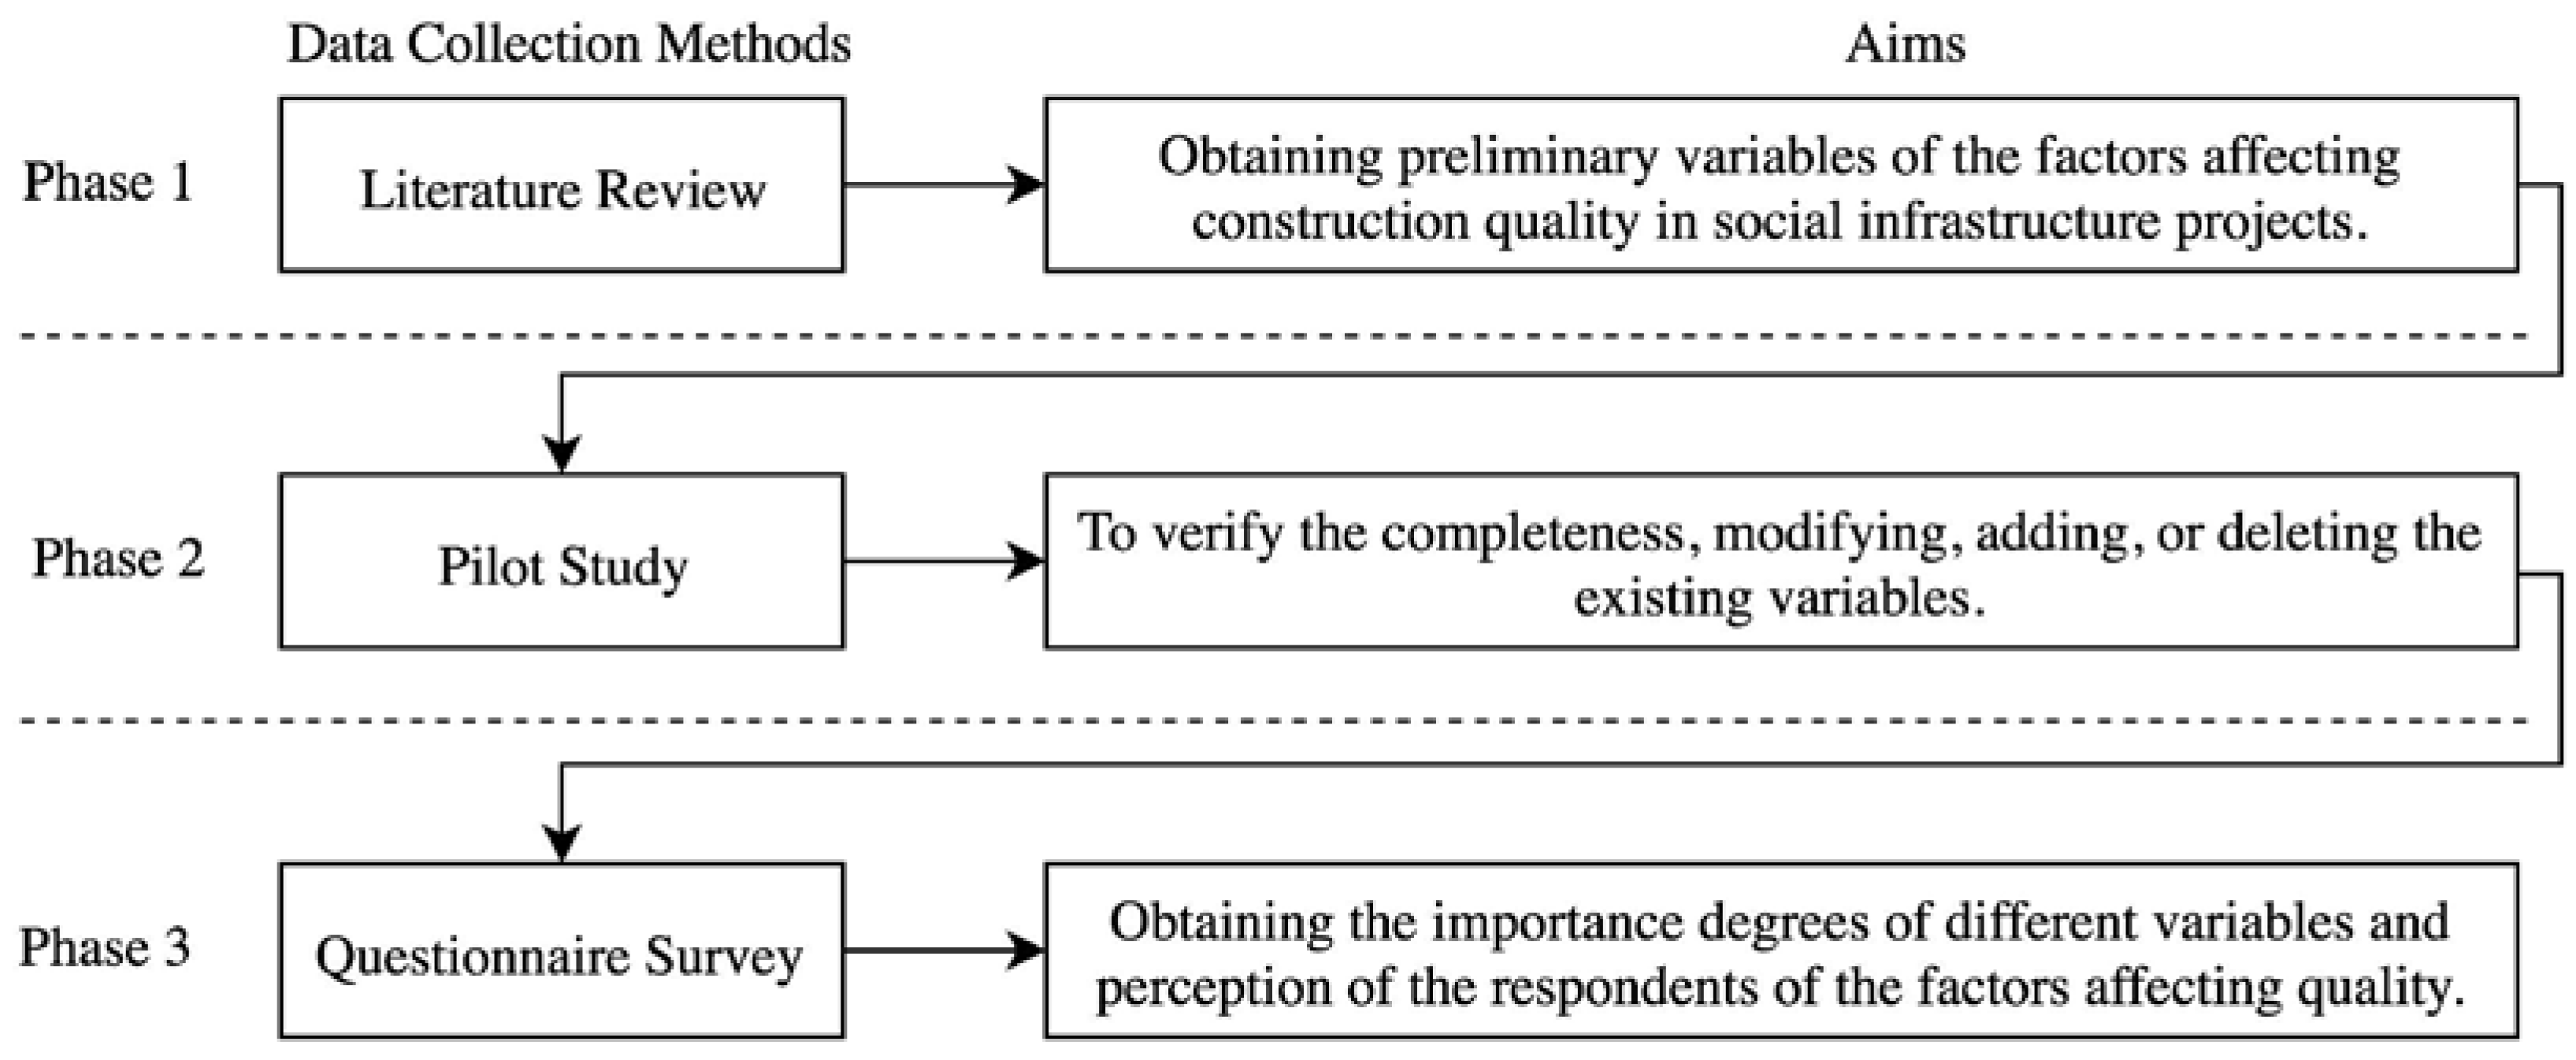
The data collection procedures involved three important steps, as exhibited in Figure 2. In the first step, we obtained the preliminary variables of the factors affecting construction quality in social infrastructure projects. Then, we conducted a pilot study to gain a better understanding and completeness as well as modify the questionnaire. Finally, we conducted a questionnaire survey, obtaining the importance degrees of different variables and perception of the respondents of the factors affecting quality.
4.1. Preliminary List of Factors
After a comprehensive and detailed literature review was conducted, the critical factors affecting the quality of SIP are depicted in Table 2. The questionnaire was comprised of two sections. The first section consisted of the respondents’ personal information, while section two consisted of the main part of the questionnaire. Section two was categorized into six groups in accordance with the nature of the factor: construction related factor (CRF), stakeholder related factor (SRF), material related factor (MRF), design related factor (DRF), external related factor (ERF), and quality factors (QF).
4.2. Pilot Study and Questionnaire Design
The survey method was adopted to test the hypotheses proposed in this study. A preliminary list of factors that affected the quality was revealed in the initial research period, and this list of questions was given to professionals in the public construction industry through interviews. Interviews were requested and organized with different project parties with experience of more than 16 years in the public construction industry including executives, project managers, and assistant project managers; on average the construction experts had handled more than 30 projects in the current fiscal year. The questionnaires were self-administered to obtain instructions on the factors affecting quality from the experts. During this stage, we obtained valuable suggestions from the experts, their suggestions were incorporated, and the survey questionnaire was polished based on the pilot survey responses.
4.3. Respondents’ Profile
Table 3 shows the demographic information of the respondents. The respondents were selected from a wide range of professionals engaged in the Pakistani public construction industry (City Development Authority (CDA), Public Work Department (PWD), Defense Housing Authority (DHA), Water and Power Development Authority (WAPDA), National Logistics Cell (NLC), and the Water and Sanitation Agency (WASA)). Table 3 shows that 23% of the respondents were executives, 14% of the respondents were managerial personnel, 19% were designers/architects, and the majority of them were project managers (44%), and most of them were involved in the execution and monitoring phases of the project. Furthermore, most of the respondents had more than 20 years of professional work experience in the public construction industry, which is an indication of the good response rate, as the respondents have related the experience of the subject area.
4.4. Sampling and Data Collection
The data collection was conducted by practitioners who were involved in public construction projects. This sample group was selected from a list of Pakistani public construction industries. The participants were public construction experts. A total of 800 public construction participants were chosen at random to answer the survey questionnaire. The emails and face-to-face interviews were the core sources used in collecting data for this study [58,59]. A questionnaire survey was conducted with public construction practitioners to examine their perceptions. The respondents were selected from publicly available organization records, which were also mostly available on the company’s website.
The final questionnaire was split into two key sections. Section 1 contained the respondents’ profile such as years of experience, educational qualification, role in the organization, and industry type. Section 2 consisted of the final list of the questions on a five-point Likert scale ranging from 1 (Strongly disagree) to 5 (Strongly agree). The questionnaires were sent to the practitioners by email or meeting with a supplementary covering letter that described the purpose of the survey and the privacy of the responses. Respondents were asked to answer the survey questions on the basis of their experience and the most current completed project that they were involved in and were faced with quality issues. From 800 distributed questionnaires, 466 questionnaires were returned. Fifteen questionnaires were incomplete or contained inaccurate information. A total of 451 completed questionnaires were obtained for the final analysis, equating to a 56.3% response rate. The respondents had enough experience to understand the importance of the study. To further improve and better understand the survey results, ten selected respondents who had rich experience in construction quality were interviewed after analyzing the survey data.
5. Data Analysis
The simulation work in calculating the effect of the observed variables and their latent constructs on construction quality was drawn in smart-PLS version 3.2.7 [60]. PLS-SEM is mostly used for theory development in exploratory research [61]. Major applications of SEM contain path analysis, confirmatory factor analysis, second-order factor analysis, regression models, covariance structure models, and correlation structure models [62]. Moreover, SEM permits the analysis of the linear relationships between the latent constructs and manifest variables. It also has the ability to create accessible parameter estimates for the relationships between unobserved variables. In general, SEM permits several relationships to be tested at once in a single model with various relationships instead of examining each relationship individually. The hypothesized structural model in Figure 1 was analyzed using Smart-PLS version 3.2.7, which has advantages over regression-based methods in evaluating several latent constructs with various manifest variables [63]. PLS contains a two-step procedure as recommended by Henseler et al. [64], which involves the evaluation of the outer measurement model and evaluation of the inner structural model. Moreover, PLS-SEM is currently known and selected within social sciences studies as a technique that is the best appropriate method for a multivariate analysis [65,66].
Appendix A provides a comprehensive explanation of the descriptive statistics such as mean, standard deviation, kurtosis, and skewness. The kurtosis and skewness (values lie between −1 and +1) results showed that the data were normally distributed.
5.1. Evaluation of Outer Measurement Model
The outer measurement model is aimed to calculate the reliability, internal consistency, and validity of the observed variables (measured through the questionnaire) together with unobserved variables [67]. Consistency evaluations are based on single observed and construct reliability tests whereas convergent and discriminant validity are used for the assessment of validity [49].
A single observed variable reliability describes the variance of an individual observed comparatively to an unobserved variable by evaluating the standardized outer loadings of the observed variables [68]. Observed variables with an outer loading of 0.7 or greater are believed to be greatly acceptable [49], while the outer loading with a value less than 0.7 should be discarded [69]. Notwithstanding this, for this study, the cut-off value accepted for the outer loading was 0.7. From Table 4, the outer loadings ranged between 0.708 and 0.872. Cronbach’s alpha and Composite Reliability (CR) were used for internal consistency evaluation in the construct reliability. Nevertheless, compared to the Cronbach’s alpha, CR is believed to be a better assessment of internal consistency as it retains the standardized loadings of the observed variables [70]. Although, the analysis of the Cronbach’s alpha and CR value was the same. Table 4 shows that the Cronbach’s alpha and CR for all constructs were greater than 0.80. Thus, the Cronbach’s alpha and CR showed that the scales were reasonably reliable and indicated that all the latent construct values exceeded the minimum threshold level of 0.70. To verify the convergent validity of the variables, each latent construct’s Average Variance Extracted (AVE) was calculated [70]. The lowest 50% of the variance from the observed variable should be taken by the latent constructs in the model. Hence, this indicates that the AVE for all constructs should be above 0.5 [38,71]. From Table 4, it is seen that all of the AVE values were more than 0.5, so convergent validity was confirmed for this study model. These results confirmed the convergent validity and good internal consistency of the measurement model.
The next attempt was the discriminant validity of the latent constructs. Discriminant validity defines that the manifest variable in any construct is distinct from other constructs in the path model, where its cross-loading value in the latent variable is greater than that in any other constructs [72]. The Fornell and Larcker criterion and cross-loadings were used to evaluate the discriminant validity [70]. The suggested standard is that a construct should not show the same variance as any other construct that is more than its AVE value [72]. Table 5 shows the Fornell and Larcker criterion test of the model where the squared correlations were compared with the correlations from other latent constructs. Table 5 shows that all of the correlations were smaller relative to the squared root of average variance exerted along the diagonals, implying satisfactory discriminant validity. This proved that the observed variables in every construct indicated the given latent variable confirming the discriminant validity of the model, whereas, Table 6 shows that the cross-loading of all observed variables was more than the inter-correlations of the construct of all the other observed variables in the model. Therefore, these findings confirmed the cross-loadings assessment standards and provided acceptable validation for the discriminant validity of the measurement model.
As a result, the suggested conceptual model was supposed to be acceptable, with confirmation of adequate reliability, convergent validity, and discriminant validity and the verification of the research model.
5.2. Evaluation of the Inner Structural Model
We confirmed that the measurement model was valid and reliable. The next step was to measure the Inner Structural Model outcomes. This included observing the model’s predictive relevancy and the relationships between the constructs. The coefficient of determination (R2), Path coefficient (β value) and T-statistic value, Effect size (ƒ2), the Predictive relevance of the model (Q2), and Goodness-of-Fit (GOF) index are the key standards for evaluating the inner structural model.
5.2.1. Measuring the Value of R2
The coefficient of determination measures the overall effect size and variance explained in the endogenous construct for the structural model and is thus a measure of the model’s predictive accuracy. In this study, the inner path model was 0.749 for the quality endogenous latent construct. This indicates that the five independent constructs substantially explain 74.9% of the variance in the quality, meaning that about 74.9% of the change in the project quality was due to five latent constructs in the model. According to Henseler et al. [64], and Hair et al. [65], an R2 value of 0.75 is considered substantial, an R2 value of 50 is regarded as moderate, and an R2 value of 0.26 is considered as weak. Hence, the R2 value in this study was substantial.
5.2.2. Estimation of Path Coefficients (β) and T-statistics
The path coefficients in the PLS and the standardized β coefficient in the regression analysis were similar. Through the β value, the significance of the hypothesis was tested. The β denoted the expected variation in the dependent construct for a unit variation in the independent construct(s). The β values of every path in the hypothesized model was computed, the greater the β value, the more the substantial effect on the endogenous latent construct. However, the β value had to be verified for its significance level through the T-statistics test. The bootstrapping procedure was used to evaluate the significance of the hypothesis [69]. To test the significance of the path coefficient and T-statistics values, a bootstrapping procedure using 5000 subsamples with no sign changes was carried out for this study as presented in Table 7.
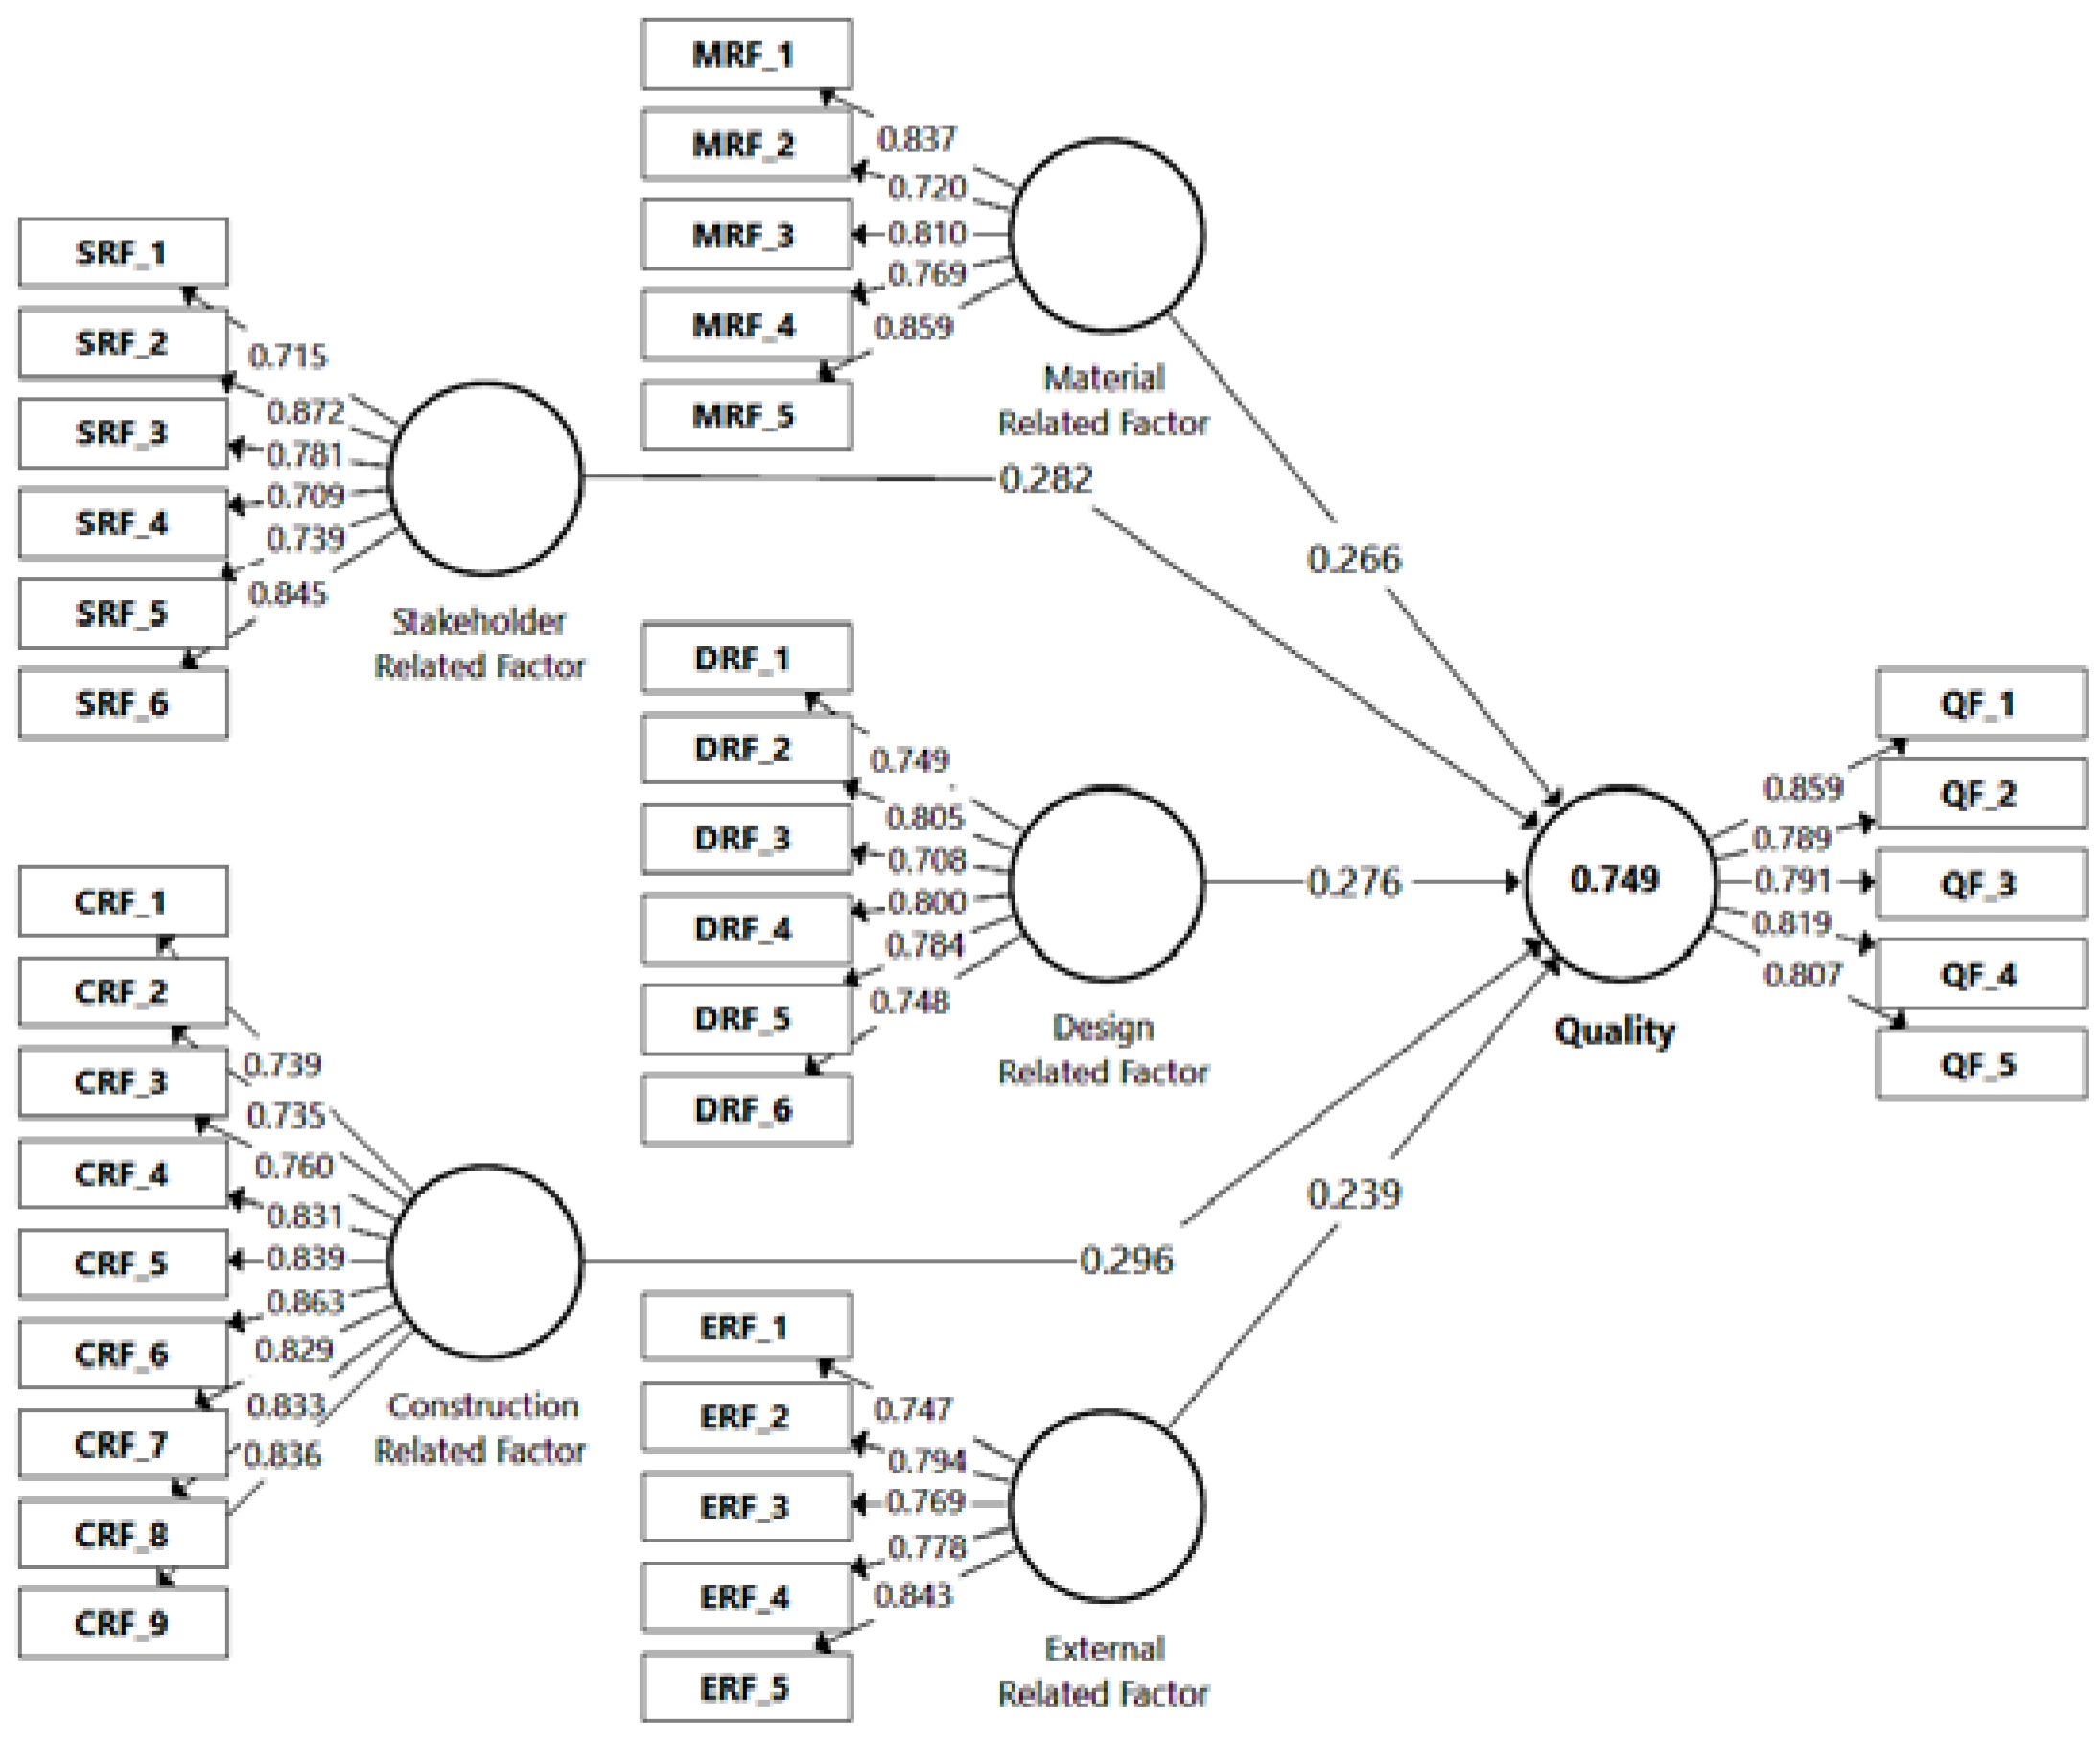
In H1, we predicted that the construction factor would significantly and positively influence project quality. As predicted, the findings in Table 7 and Figure 3 confirmed that the construction related factor significantly influenced project quality (β = 0.296, T = 10.996, p < 0.000). Hence, H1 was robustly supported. Furthermore, when observing the direct and positive influence of the stakeholder related factor on project quality (H2), the findings from Table 7 and Figure 3 endorsed that the stakeholder related factor positively influenced project quality (β = 0.282, T = 10.883, p < 0.000), and confirmed H2. The influence of the design related factor on project quality was positive and significant (β = 0.276, T = 10.602, p < 0.000), showing that H3 was supported. The effect of the material related factor on project quality was significant (β = 0.266, T = 10.513, p < 0.000), therefore supporting H4. Similarly, the findings in Table 7 provided empirical support for H5, where the influence of the external related factor on project quality was positive and significantly affected the project quality (β = 0.239, T = 9.030, p < 0.000), confirming hypothesis (H5).
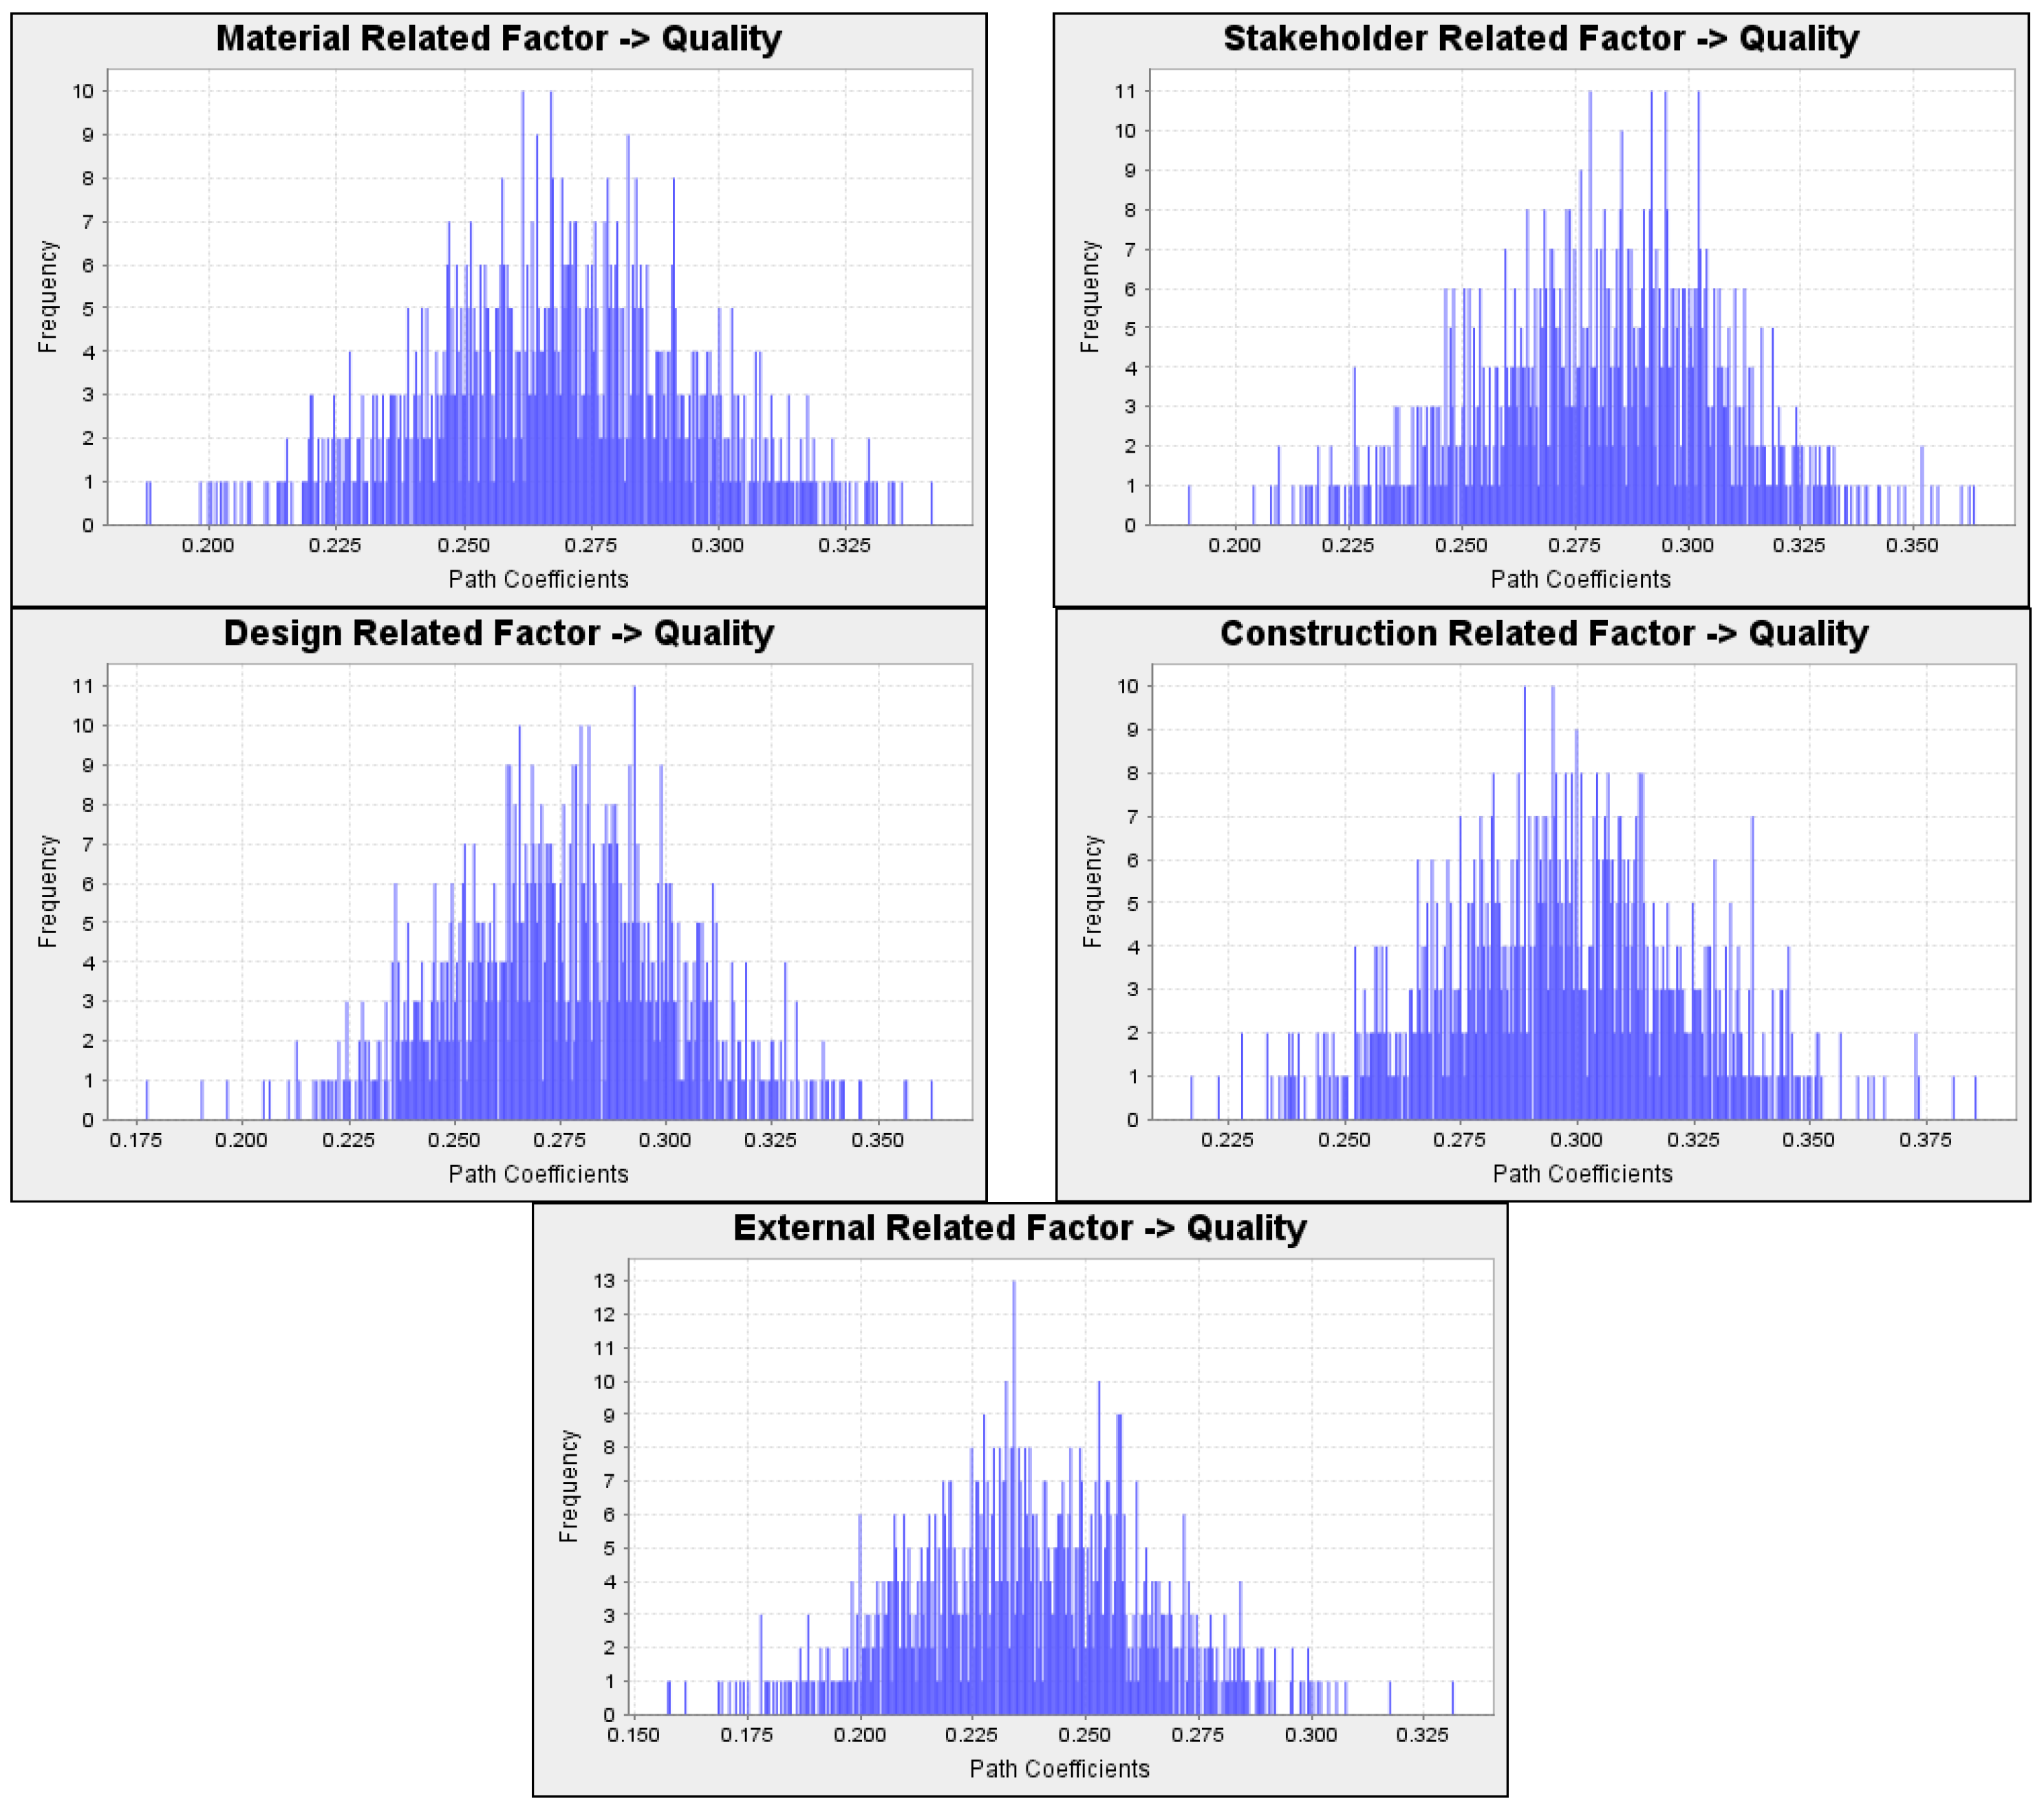
The greater the beta coefficient (β), the stronger the effect of an exogenous latent construct on the endogenous latent construct. Table 7 and Figure 3 showed that the construction related factor had the topmost path coefficient of β = 0.296 when compared to other β values in the model, which showed that it had a greater value of variance and high effect with regard to affecting the quality of social infrastructure projects. Whereas, the external related factor had the least effect on project quality with β = 0.239. Figure 4 shows the graphical representation of all path coefficients of the model.
5.2.3. Measuring the Effect Size (ƒ2)
The ƒ2 is the degree of the impact of each exogenous latent construct on the endogenous latent construct. When an independent construct is deleted from the path model, it changes the value of the coefficient of determination (R2) and defines whether the removed latent exogenous construct has a significant influence on the value of the latent endogenous construct. The ƒ2 values were 0.35 (strong effect), 0.15 (moderate effect), and 0.02 (weak effect) [73]. Table 8 shows the ƒ2 from the SEM calculations. As shown in Table 8, the effect size for construction, stakeholder, design, material, and external related factor on project quality were 0.301, 0.268, 0.257, 0.240, and 0.194, respectively. Hence, according to Cohen’s [73] recommendation, the ƒ2 of all five exogenous latent constructs on project quality had a moderate effect on the value of R2. Furthermore, all the five independent latent constructs in this study participated relatively to the greater R2 value (74.9%) in the dependent variable.
5.2.4. Predictive Relevance of the Model (Q2)
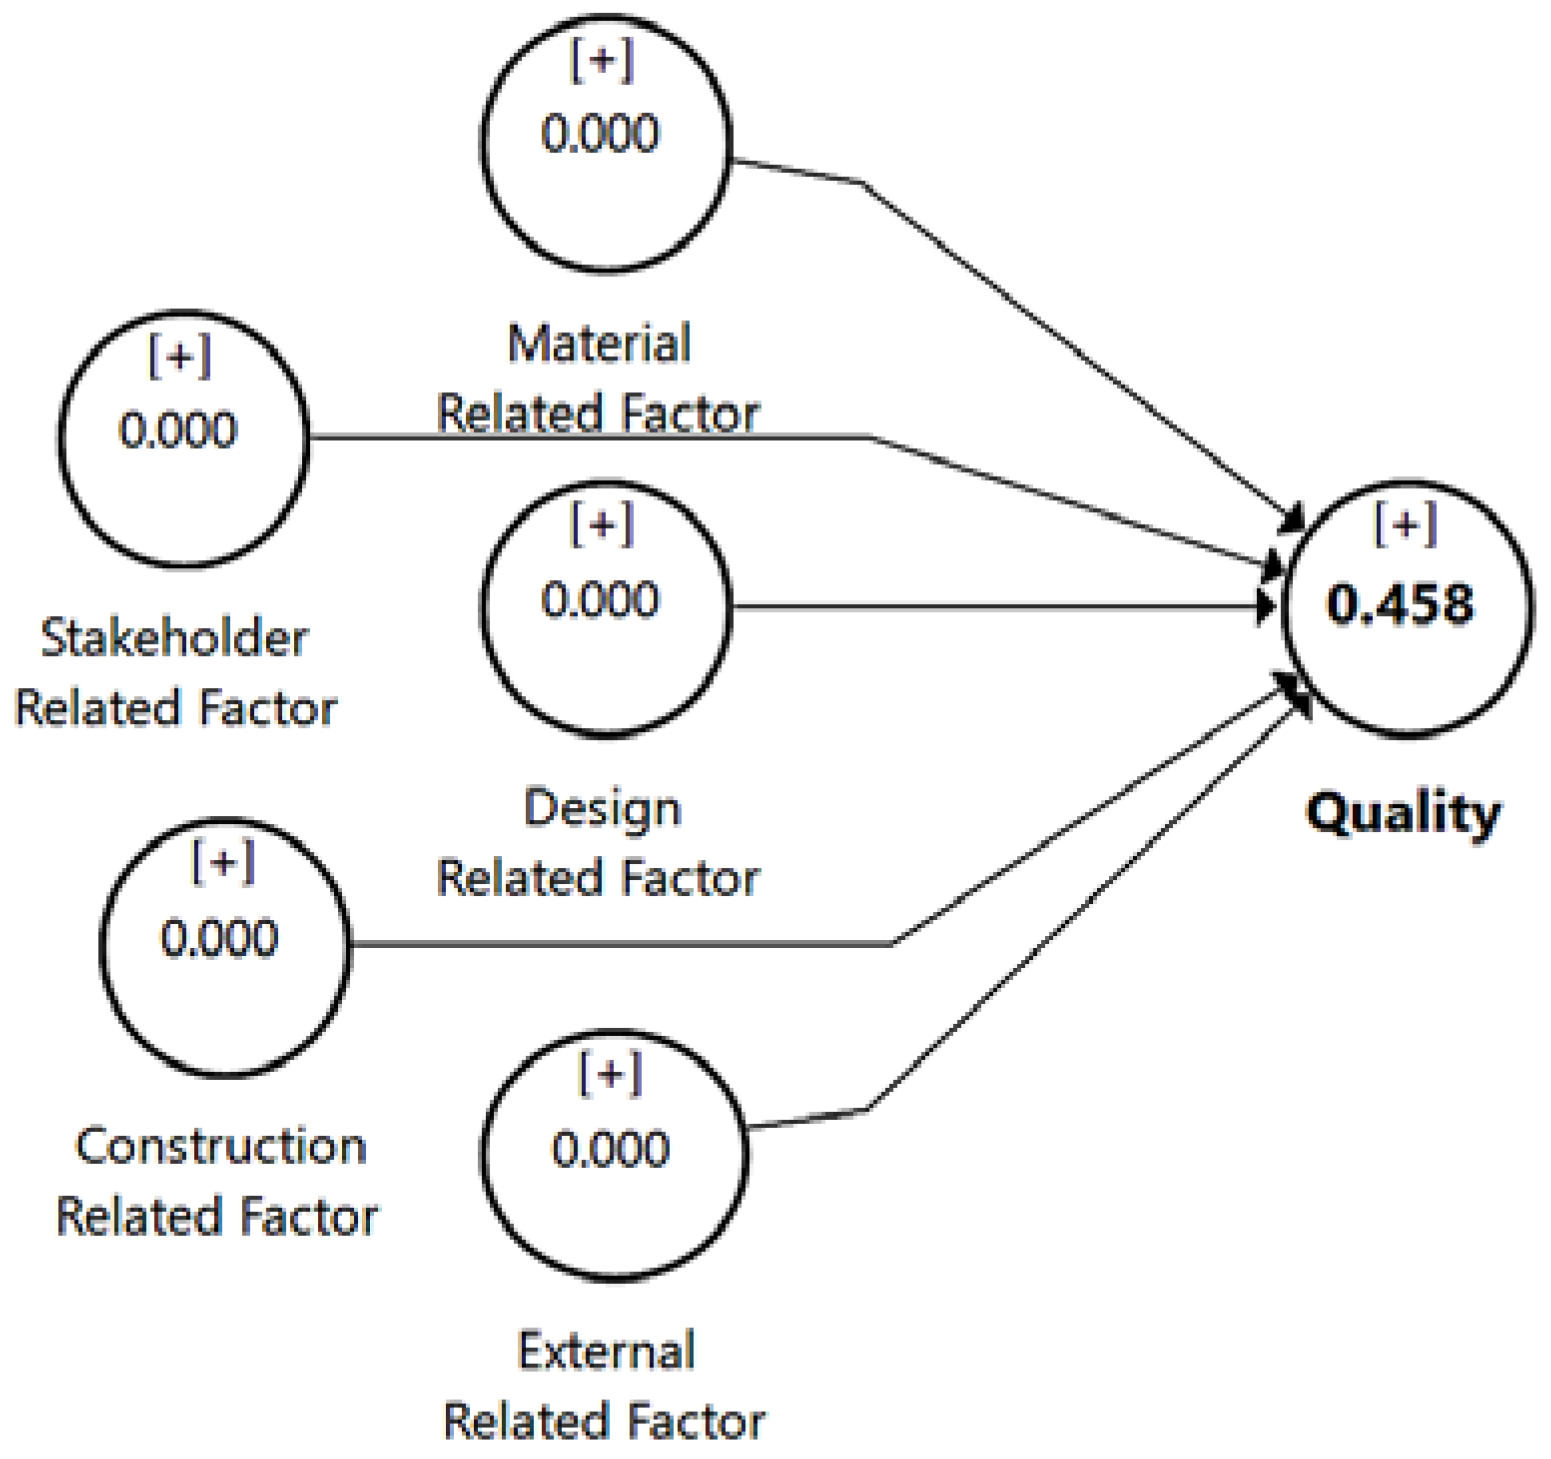
Q2 statistics are used to measure the quality of the PLS path model, which is calculated using blindfolding procedures [74], and cross-validated redundancy was performed. The Q2 criterion recommends that the conceptual model can predict the endogenous latent constructs. In the SEM, the Q2 values measured must be greater than zero for a particular endogenous latent construct. From Figure 5, it shows that the Q2 values for this study model was equal to 0.458, which was higher than the threshold limit, and supports that the path model’s predictive relevance was adequate for the endogenous construct.
5.2.5. Goodness-of-Fit Index
Goodness-of-Fit (GOF) is applied as an index for the complete model fit to verify that the model sufficiently explains the empirical data [74]. The GOF values lie between 0 and 1, where values of 0.10 (small), 0.25 (medium), and 0.36 (large) indicate the global validation of the path model. A good model fit shows that a model is parsimonious and plausible [75]. The GOF is calculated by using the geometric mean value of the average communality (AVE values) and the average R2 value(s), and the GOF of the model is calculated by Equation (1) [74].
It was calculated from Table 9 that the GOF index for this study model was measured as 0.69, which shows that empirical data fits the model satisfactory and has substantial predictive power in comparison with baseline values.
5.2.6. The Standardized Root Mean Square Residual (SRMR)
The SRMR is an index of the average of standardized residuals between the observed and the hypothesized covariance matrices [76]. The SRMR is a measure of estimated model fit. When SRMR = <0.08, then the study model has a good fit [77], with a lower SRMR being a better fit. Table 10 shows that this study model’s SRMR was 0.05, which revealed that this study model had a good fit, whereas the Chi-Square was equal to 1917.082 and NFI equal to 0.811 was also measured.
5.3. Correlation Coefficient of Latent Variables
Finally, Table 11 shows the latent variable correlation coefficient. Table 11 shows that there was a strong correlation between the latent exogenous constructs and the latent endogenous construct.
In accordance with the complete analysis of the measurement models and structural model, it was determined that both models were confirmed. All of the hypotheses were statistically significant and hence were all accepted. The results of this study support a richer and accurate picture of the factors affecting the quality of social infrastructure project and can support building a set of strategies to overcome the quality barriers.
6. Discussion
The key contribution of this study was to empirically reveal the constructs that affected social infrastructure project quality using the PLS-SEM technique and a closer examination of the fundamental quality affecting constructs observed by construction practitioners in Pakistan. PLS-SEM is a very effective technique for developing and analysis of complex models, and it also validates the complex model, and social science investigators should develop latest techniques to manage more complex model relationship of their current and future studies. The conceptual paths were tested using SEM based on the PLS technique. Descriptive statistics such as the mean value, standard deviation, skewness, and kurtosis values were measured. The results of the kurtosis and skewness values of the measurement model were between +1 and −1, which implied that there was no violation of the normality assumptions of the collected data. Moreover, the results of the study revealed that the construction related factor, stakeholder related factor, material related factor, design related factor, and external related factor had a significantly positive effect on project quality (R2 = 0.749, p = 0.000), predictive relevance (Q2 = 0.458), and a substantial GOF (GOF = 0.69). The final SEM results revealed that the construction related factor had the highest path coefficient (β = 0.296) with the overall affecting quality. Therefore, the owner and service provider (contractor) should pay more attention to construction related factors to improve the quality of public construction projects. The stakeholder related factor was found to be the second utmost factor (β = 0.282) of the overall factors affecting quality. Among the five essential quality influencing factors, the external related factor (β = 0.239) was found to have a minimum direct effect on the quality, while the design related factor (β = 0.276) and material related factor (β = 0.266) was found to have a moderate effect on the construction quality. The findings of this study showed that all suggested hypotheses were supported, and the quality of the social infrastructure project was affected by all five constructs, i.e., construction, stakeholder, material, design, and external related factors.
As shown in Table 7, the path between all five exogenous latent constructs with an endogenous latent construct (quality) showed a positive relationship and was statistically significant, thus accepting all the hypotheses proposed in this study. The relationship between these quality influencing factors suggests that there was ineffective planning and a lack of monitoring and evaluation during the construction (execution) phase that had a profound effect on the quality of the social infrastructure project and hence diminished the quality as well as the sustainability of the project. Planning and monitoring competency is an important technical contributor to accomplishing successful project completion [78]. Consequently, project owners and service providers should focus on the construction related factor to improve quality in public construction projects. This was in line with the findings of the study by Pheng and Ke-Wei [79] performed in Singapore. The service provider, nevertheless, concentrates on finishing the project works on schedule and the completion of a project within the estimated budget rather than on completing it according to the quality standard. It has been shown that a detailed understanding of the project scope, plan, proper monitoring, and implementation substantially assists in the effective quality in construction projects and hence improves the chance of better project quality and successful project completion. Consequently, a lack of experienced project managers on the construction site and poor management ability of the contractors especially in public contraction projects are not able to accomplish better quality. These results were uniform with previous research where the lack of experienced project managers on-site and the lack of experienced contractors were emphasized in order to influence the project quality [8]. This indicates that most of the on-site project managers and contractors lacked the skills of proper planning and coordination for addressing on-site problems and used it to improve the level of quality. It is recommended that the project contracting parties pays special attention to the construction related factor to achieve an enhanced project quality.
Furthermore, the results of this study recommend that the stakeholder related factor had a significant positive influence on project quality and that the quality of the project could be enhanced by proper stakeholder supervision and monitoring of the project from initiation to completion. This was in line with Luo et al. [80] who found that there lacked of a quality-supervision mechanism for the production activities, which showed key quality challenges that decreased the assurance among building stakeholders as to the quality of the projects. Inadequate site supervision and improper site decisions were part of the key significant elements influencing project quality on-site. Equally, the findings of this study showed a statistically significant positive relationship between the design related factor and project quality. In order to achieve better quality projects, the design team should prepare design on time, with accuracy, conformance to standard, and complete information in design as this can minimize the design discrepancy during the project execution. Thus, indicating that the errors and incomplete project design during the designing phase of a project leads to a lack of quality construction in the project execution. This finding was consistent with the previous results, where incomplete design information was provided by project clients, the limited design time imposed by project clients, and too many design changes during execution were highlighted to affect the project quality [55,57].
Additionally, our findings also revealed that the material related factor was statistically significant with project quality. Aggressive competition during bidding or the lowest bidder making more profit usually led to the use of poor quality materials and bad technical practices that could lead to issues of project quality. In addition, the unavailability of materials and price fluctuations in the market during the life cycle of a project, could also be risks for the lack of quality in construction projects. These findings were in line with previous studies by Jha and Iyer [2].
External factor such as changes in government regulations, a hostile environment, and political instability not only decreases productivity, but also affects the harms the quality of projects. The findings of this study showed that the external related factor had a significant influence on project quality, thus building on and providing support to the findings of Jha and Iyer [2]. External factors are generally difficult to control and are even beyond the control of the parties involved in the construction process. Their negative effect on the project can diminish the project quality, for example, a lack of quality caused by changes in government regulations, political instability, hostile economic environment, harsh climatic condition at the site, and hostile social environment.
7. Comparison of Findings with Other Countries in the World
Deficiencies in project quality is considered as one of the essential critics in project delivery throughout the world. Number of studies has been carried out on this specific topic till to date as shown in Table 12. Table 12 presents the findings of these earlier studies and large part of the identified quality influencing factors are equally applicable in Pakistan public construction industry. It can be observed from Table 12 that project quality is affected by frequently occurring project management related issues such as lack of contractor supervision, lack of experienced project manager, lack of technical guidelines, conflict among project participants, management commitment to continuous quality improvement, developing and improving quality control and assurance systems and lack of competent project managers and teams. It can be seen that most of the common quality influencing factors were related to stakeholders which are worthy of consideration in all countries in the world either it is developed or developing. As shown in Table 12 below, most of them were also found to be important in the current study.
8. Conclusions
The imperfect quality problems in the Pakistani public construction industry are both complex and risky problems, influenced by many factors during the entire project life cycle, which not only diminish the project quality, but also reduce the sustainability of the project as a whole. As quality will not improve by chance, we need strategies and policies to plan for quality improvement. Similar to sustainable development projects, this process can be initiated by identifying quality problems. Quality is a cornerstone of public infrastructure projects to improving project sustainability performance across its life cycle. This study concluded that better quality and sustainability will be enhanced when project contracting parties better understand the importance of the quality management system.
The previous literature discussing the factors affecting the quality of construction projects used the same kind of methodologies as exhibited in Table 1. The aim of this study was to present and introduce a new methodology to analyze and examine the influence of key constructs on quality in SIP. An advanced multivariate analysis technique, PLS-SEM has been employed to perform the analysis. This comprehensive multivariate statistical assessment technique can test all of the relationships between latent and manifest variables in a model simultaneously, containing measurement and structural model assessment. The technique was chosen also because it has the ability for the for the assessment of the psychometric properties of individual latent constructs. The most important constructs that affect the project quality with their fundamental causes (observed variables) were identified from the literature. A questionnaire survey was conducted with construction experts regarding factors affecting quality where the authors collected 451 valid questionnaires from construction experts in the public construction industry and used the latest statistical methods such as SEM. This study was performed to explore factors affecting quality in SIP in Pakistan. Based on the responses of the survey, it was considered that the construction related factor was the topmost factor that led to deteriorating project quality as the paperwork is implemented on the actual work at this stage. This implies that public construction industries and contractors need to make particular plans and methods to concentrate on issues of the construction (execution) phase that affect the project quality. The lack of construction techniques will increase the rate of deterioration of project quality during the construction phase as well the lack of proper quality monitoring and evaluation and the lack of quality policy and planning, which have caused problems in the quality of projects. Mostly, the findings from this study indicated that most of the glitches occurring from poor quality projects were due to a human lack of importance for quality and lack of applicable criteria and quality assurance practices. Moreover, these problems influenced the efficiency of the construction process. Confusion and misunderstanding of the project scope and lack of detailed knowledge of quality assurance issues led to a poor-quality management plan, which possibly diminished the project quality. Furthermore, the lack of experienced project managers and poor management ability of the contractors were a key determinant in accomplishing better quality in projects as the service provider’s inability to examine the underlying challenges in the construction phase is extremely damaging to the effective delivery of quality projects.
This study model validated that factors affecting the quality of public construction projects were based on various constructs that are necessary to understand to improve the quality of the project and its outcomes. The construction- and stakeholder-related factors were observed to be the most dominant constructs. Therefore, the owners and contractors should pay more attention to these two constructs with a high beta coefficient as they were imperative constructs of the public projects that should be focused on. Moreover, the material related, design related, and external related factors were also found to have a strong and positive effect on project quality. In conclusion, the factors affecting quality in a social infrastructure project in Pakistan were influenced by all five constructs, and these constructs explained 74.9% of the variance in project quality with a significant relationship explained by beta values and the GOF of the model was 0.69. A significant effect of the different quality factors on the quality of SIP was also evaluated. The current study enhanced the expansion of research in the area of quality improvement and helped gain a better understanding of the lack of quality factors in social infrastructure projects.
The findings from this study can provide decision making support for project contracting parties and policy-makers (government) by amplification their understandings of the severe factors that affect the construction quality, confirming that appropriate plans and quality management methods as well as proper monitoring can be designed and implemented to assure a better quality of SIP. Through the suggested solutions, the public construction industries need to keep an eye on flaws and control the extent of quality defects so that similar flaws may perhaps be avoided in upcoming issues in SIP.
Author Contributions
Shahid Hussain and Zhu Fangwei formulated the study design. Shahid Hussain and Ahmed Faisal Siddiqi conceived and designed the research methodology. Shahid Hussain, Ahmed Faisal Siddiqi, Zaigham Ali and Muhammad Salman Shabbir collected the data from different public construction industries in Pakistan; Shahid Hussain, Zaigham Ali and Ahmed Faisal Siddiqi analyzed the data; Shahid Hussain wrote the paper.
Funding
This research was funded by Zhu Fangwei grant number 71372085.
Acknowledgments
This research work was supported by the National Natural Science Foundation of China under Grant No. 71372085. The useful comments and suggestions from the editor and all the reviewers are extremely appreciated. Furthermore, the authors would like to thank Adnan Haider Khoja and Karamat Ali for their great help and support for the accomplishment of the data collection and the completion of the questionnaires.
Conflicts of Interest
The authors declare no conflict of interest.
Appendix A

Table A1.
Mean, Standard Deviation, Excess Kurtosis and Skewness Calculation.
| Sr. No. | Mean | Standard Deviation | Excess Kurtosis | Skewness |
|---|---|---|---|---|
| MRF_1 | 3.361 | 0.977 | −0.412 | −0.102 |
| MRF_2 | 3.224 | 1.101 | −0.523 | −0.192 |
| MRF_3 | 3.051 | 1.061 | −0.449 | −0.046 |
| MRF_4 | 3.483 | 1.062 | −0.324 | −0.447 |
| MRF_5 | 3.670 | 0.953 | −0.469 | −0.330 |
| CRF_1 | 3.639 | 0.999 | −0.596 | −0.272 |
| CRF_2 | 3.184 | 1.082 | −0.543 | −0.224 |
| CRF_3 | 2.900 | 1.068 | −0.549 | −0.063 |
| CRF_4 | 3.188 | 1.004 | −0.589 | −0.135 |
| CRF_5 | 3.102 | 1.003 | −0.514 | −0.020 |
| CRF_6 | 2.761 | 1.006 | −0.387 | 0.113 |
| CRF_7 | 3.348 | 1.001 | −0.382 | −0.236 |
| CRF_8 | 3.410 | 1.002 | −0.476 | −0.203 |
| CRF_9 | 3.188 | 0.987 | −0.245 | −0.135 |
| SRF_1 | 3.457 | 1.140 | −0.439 | −0.484 |
| SRF_2 | 3.765 | 0.996 | −0.439 | −0.448 |
| SRF_3 | 3.073 | 1.115 | −0.628 | −0.193 |
| SRF_4 | 3.568 | 1.117 | −0.426 | −0.486 |
| SRF_5 | 3.397 | 1.049 | −0.450 | −0.281 |
| SRF_6 | 2.705 | 0.985 | −0.513 | 0.032 |
| DRF_1 | 2.965 | 1.094 | −0.633 | −0.103 |
| DRF_2 | 2.468 | 1.043 | −0.311 | 0.398 |
| DRF_3 | 3.592 | 1.087 | −0.141 | −0.622 |
| DRF_4 | 2.685 | 0.996 | −0.367 | 0.312 |
| DRF_5 | 2.967 | 1.105 | −0.758 | −0.053 |
| DRF_6 | 3.242 | 1.085 | −0.611 | −0.199 |
| ERF_1 | 2.652 | 1.064 | −0.563 | 0.164 |
| ERF_2 | 2.745 | 1.042 | −0.578 | 0.112 |
| ERF_3 | 3.639 | 1.042 | −0.526 | −0.401 |
| ERF_4 | 2.898 | 1.050 | −0.595 | 0.020 |
| ERF_5 | 2.953 | 1.059 | −0.578 | 0.071 |
| QF_1 | 3.563 | 1.015 | −0.712 | −0.204 |
| QF_2 | 2.838 | 1.026 | −0.440 | 0.082 |
| QF_3 | 2.851 | 1.000 | −0.575 | 0.021 |
| QF_4 | 3.450 | 1.012 | −0.380 | −0.244 |
| QF_5 | 3.610 | 1.011 | −0.253 | −0.488 |
References
- Joslin, R.; Müller, R. Relationships between a Project Management Methodology and Project Success in Different Project Governance Contexts. Int. J. Proj. Manag. 2015, 33, 1377–1392. [Google Scholar] [CrossRef]
- Jha, K.N.; Iyer, K.C. Critical Factors Affecting Quality Performance in Construction Projects. Total Qual. Manag. Bus. Excell. 2006, 17, 1155–1170. [Google Scholar] [CrossRef]
- Atkinson, R. Project Management: Cost, Time and Quality, Two Best Guesses and a Phenomenon, Its Time to Accept Other Success Criteria. Int. J. Proj. Manag. 1999, 17, 337–342. [Google Scholar] [CrossRef]
- Turk, A.M. ISO 9000 in Construction: An Examination of Its Application in Turkey. Build. Environ. 2006, 41, 501–511. [Google Scholar] [CrossRef]
- Fan, C.N. Development of Quality Assurance in Hong Kong Construction Works. Hong Kong Contract. 1995. No. March/April. [Google Scholar]
- Samuels, A.F. Construction Facilities Audit: Quality System-Performance Control. J. Manag. Eng. 1994, 10, 60–65. [Google Scholar] [CrossRef]
- Jraisat, L.; Jreisat, L.; Hattar, C. Quality in Construction Management: An Exploratory Study. Int. J. Qual. Reliab. Manag. 2016, 33, 920–941. [Google Scholar] [CrossRef]
- Gan, Y.; Shen, L.; Chen, J.; Tam, V.; Tan, Y.; Illankoon, I. Critical Factors Affecting the Quality of Industrialized Building System Projects in China. Sustainability 2017, 9, 216. [Google Scholar] [CrossRef]
- Grimsey, D.; Lewis, M.K. Evaluating the Risks of Public Private Partnerships for Infrastructure Projects. Int. J. Proj. Manag. 2002, 20, 107–118. [Google Scholar] [CrossRef]
- Kärnä, S. Analysing Customer Satisfaction and Quality in Construction—The Case of Public and Private Customers. Nord. J. Surv. Real Estate Res. 2004, 2, 67–80. [Google Scholar]
- Kanji, G.K.; Wong, A. Quality Culture in the Construction Industry. Total Qual. Manag. 1998, 9, 133–140. [Google Scholar] [CrossRef]
- Wong, A. Total Quality Management in the Construction Industry in Hong Kong: A Supply Chain Management Perspective. Total Qual. Manag. 1999, 10, 199–208. [Google Scholar] [CrossRef]
- Navon, R. Automated Project Performance Control of Construction Projects. Autom. Constr. 2005, 14, 467–476. [Google Scholar] [CrossRef]
- Hoonakker, P.; Carayon, P.; Loushine, T. Barriers and Benefits of Quality Management in the Construction Industry: An Empirical Study. Total Qual. Manag. Bus. Excell. 2010, 21, 953–969. [Google Scholar] [CrossRef]
- Loushine, T.W.; Hoonakker, P.L.T.; Carayon, P.; Smith, M.J. Quality and Safety Management in Construction. Total Qual. Manag. Bus. Excell. 2006, 17, 1171–1212. [Google Scholar] [CrossRef]
- Kaye, M.; Anderson, R. Continuous Improvement: The Ten Essential Criteria. Int. J. Qual. Reliab. Manag. 1999, 16, 485–509. [Google Scholar] [CrossRef]
- Refaat, H. ; Abdel-Razek. Factors Affecting Construction Quality in Egypt: Identification and Relative Importance. Eng. Constr. Archit. Manag. 1998, 5, 220–227. [Google Scholar] [CrossRef]
- Tam, C.M.; Deng, Z.M.; Zeng, S.X.; Ho, C.S. Quest for Continuous Quality Improvement for Public Housing Construction in Hong Kong. Constr. Manag. Econ. 2000, 18, 437–446. [Google Scholar] [CrossRef]
- El-maaty, A.E.A.; Akal, A.Y.; El-hamrawy, S. Management of Highway Projects in Egypt through Identifying Factors Influencing Quality Performance. J. Constr. Eng. 2016, 2016, 1–8. [Google Scholar] [CrossRef]
- John, R.; Smith, A.; Chotipanich, S.; Pitt, M. Awareness and Effectiveness of Quality Function Deployment (QFD) in Design and Build Projects in Nigeria. J. Facil. Manag. 2014, 12, 72–88. [Google Scholar] [CrossRef]
- Wanberg, J.; Harper, C.; Hallowell, M.R.; Rajendran, S. Relationship between Construction Safety and Quality Performance. J. Constr. Eng. Manag. 2013, 139, 1–10. [Google Scholar] [CrossRef]
- Arditi, D.; Gunaydin, H.M. Factors That Affect Process Quality in the Life Cycle of Building Projects. J. Constr. Eng. Manag. 1998, 124, 194–203. [Google Scholar] [CrossRef]
- Chan, A.P.C.; Tam, C.M. Factors Affecting the Quality of Building Projects in Hong Kong. Int. J. Qual. Reliab. Manag. 2000, 17, 423–441. [Google Scholar] [CrossRef]
- Oyedele, L.O.; Jaiyeoba, B.E.; Kadiri, K.O.; Folagbade, S.O.; Tijani, I.K.; Salami, R.O. Critical Factors Affecting Construction Quality in Nigeria: Evidence from Industry Professionals. Int. J. Sustain. Build. Technol. Urban Dev. 2015, 6, 103–113. [Google Scholar] [CrossRef]
- Bubshait, A.A.; Al-Atiq, T.H. ISO 9000 Quality Standards In Construction. J. Manag. Eng. 1999, 15, 41–46. [Google Scholar] [CrossRef]
- Love, P.E.D.; Teo, P.; Morrison, J. Unearthing the Nature and Interplay of Quality and Safety in Construction Projects: An Empirical Study. Saf. Sci. 2018, 103, 270–279. [Google Scholar] [CrossRef]
- Griffith, A. Quality Assurance in Building; Macmillan Publishers Limited: London, UK, 1990. [Google Scholar]
- Mandal, P.; Howell, A.; Sohal, A.S. A Systemic Approach to Quality Improvements: The Interactions between the Technical, Human and Quality Systems. Total Qual. Manag. 1998, 9, 79–100. [Google Scholar] [CrossRef]
- Acıkara, T.; Kazaz, A.; Ulubeyli, S. Evaluations of Construction Project Participants’ Attitudes toward Quality Management in Turkey. Procedia Eng. 2017, 196, 203–210. [Google Scholar] [CrossRef]
- Rustom, R.N.; Amer, M.I. Modeling the Factors Affecting Quality in Building Construction Projects in Gaza Strip. J. Constr. Res. 2006, 7, 33–47. [Google Scholar] [CrossRef]
- Juran, J.M. Product Quality: A Prescription for the West. Manag. Rev. 1981, 70, 8–14. [Google Scholar]
- Rowlinson, S.M.; Walker, A. The Construction Industry in Hong Kong; Longmans Asia: Hong Kong, China, 2002. [Google Scholar]
- Love, P.E.D.; Smith, J.; Treloar, G.J.; Li, H. Some Empirical Observations of Service Quality in Construction. Eng. Constr. Archit. Manag. 2000, 7, 191–201. [Google Scholar] [CrossRef]
- Auchterlounie, T. Recurring Quality Issues in the UK Private House Building Industry. Struct. Surv. 2009, 27, 241–251. [Google Scholar] [CrossRef]
- Yeoh, S.C.; Lee, N.C. ISO 9002 in the Malaysian Construction Industry: Guide and Implementation; McGraw-Hill: New York, NY, USA, 1996. [Google Scholar]
- Reilly, J.J. Cost Estimating and Risk—Management for Underground Projects. In Proceedings of the 31st ITA-AITES World Tunnel Congress, Istanbul, Turkey, 7–12 May 2005; Allyn & Bacon/Pearson Education: Istanbul, Turkey, 2005; pp. 533–538. [Google Scholar] [CrossRef]
- Infrastructure and Growth in Developing Countries: Recent Advances and Research Challenges. Available online: https://openknowledge.worldbank.org/bitstream/handle/10986/6458/wps4460.pdf?sequence=1&isAllowed=y (accessed on 3 May 2018).
- Hair, J.F.; Ringle, C.M.; Sarstedt, M. PLS-SEM: Indeed a Silver Bullet. J. Mark. Theory Pract. 2011, 19, 139–152. [Google Scholar] [CrossRef]
- Chan, A.P.C.; Wong, F.K.W.; Lam, P.T.I. Assessing Quality Relationships in Public Housing: An Empirical Study. Int. J. Qual. Reliab. Manag. 2006, 23, 909–927. [Google Scholar] [CrossRef]
- Ling, F.; Ibbs, C.; Hoo, W. Determinants of International Architectural, Engineering, and Construction Firms’ Project Success in China. J. Constr. Eng. Manag. 2006, 132, 206–214. [Google Scholar] [CrossRef]
- Ling, F.Y.Y.; Chan, S.L.; Chong, E.; Ee, L.P. Predicting Performance of Design-Build and Design-Bid-Build Projects. J. Constr. Eng. Manag. 2004, 130, 75–83. [Google Scholar] [CrossRef]
- Nguyen, L.D.; Ogunlana, S.O.; Do Thi Xuan, L. A Study on Project Success Factors in Large Construction Projects in Vietnam. Eng. Constr. Archit. Manag. 2004, 11, 404–413. [Google Scholar] [CrossRef]
- Phua, F.T.T.; Rowlinson, S. How Important Is Cooperation to Construction Project Success? A Grounded Empirical Quantification. Eng. Constr. Archit. Manag. 2004, 11, 45–54. [Google Scholar] [CrossRef]
- Cooke-Davies, T. The “real” success Factors on Projects. Int. J. Proj. Manag. 2002, 20, 185–190. [Google Scholar] [CrossRef]
- Chua, D.K.H.; Kog, Y.C.; Loh, P.K. Critical Success Factor for Different Project Objectives. J. Constr. Eng. Manag. 1999, 125, 142–150. [Google Scholar] [CrossRef]
- Albanese, R. Team-Building Process: Key to Better Project Results. J. Manag. Eng. 1994, 10, 36–44. [Google Scholar] [CrossRef]
- Mohsini, R.A.; Davidson, C.H. Determinants of Performance in the Traditional Building Process. Constr. Manag. Econ. 1992, 10, 343–359. [Google Scholar] [CrossRef]
- Calvo-Mora, A.; Leal, A.; Roldán, J.L. Relationships between the EFQM Model Criteria: A Study in Spanish Universities. Total Qual. Manag. Bus. Excell. 2005, 16, 741–770. [Google Scholar] [CrossRef]
- Hair, J.F.; Sarstedt, M.; Ringle, C.M.; Mena, J.A. An Assessment of the Use of Partial Least Squares Structural Equation Modeling in Marketing Research. J. Acad. Mark. Sci. 2012, 40, 414–433. [Google Scholar] [CrossRef]
- Arditi, D.; Gunaydin, H.M. Total Quality Management in the Construction Process. Int. J. Proj. Manag. 1997, 15, 235–243. [Google Scholar] [CrossRef]
- Hiyassat, M.A.S. Applying the ISO Standards to a Construction Company: A Case Study. Int. J. Proj. Manag. 2000, 18, 275–280. [Google Scholar] [CrossRef]
- Yung, P.; Yip, B. Construction Quality in China during Transition: A Review of Literature and Empirical Examination. Int. J. Proj. Manag. 2010, 28, 79–91. [Google Scholar] [CrossRef]
- Zou, P.X.W.; Zhang, G.; Wang, J. Understanding the Key Risks in Construction Projects in China. Int. J. Proj. Manag. 2007, 25, 601–614. [Google Scholar] [CrossRef]
- Serpell, A. Integrating Quality Systems in Construction Projects: The Chilean Case. Int. J. Proj. Manag. 1999, 17, 317–322. [Google Scholar] [CrossRef]
- Andi; Minato, T. Design Documents Quality in the Japanese Construction Industry: Factors Influencing and Impacts on Construction Process. Int. J. Proj. Manag. 2003, 21, 537–546. [Google Scholar] [CrossRef]
- Enshassi, A.; Mohamed, S.; Abushaban, S. Factors Affecting the Performance of Construction Projects in the Gaza Strip. J. Civ. Eng. Manag. 2009, 15, 269–280. [Google Scholar] [CrossRef]
- Shammas-Toma, M.; Seymour, D.; Clark, L. Obstacles to Implementing Total Quality Management in the UK Construction Industry. Constr. Manag. Econ. 1998, 16, 177–192. [Google Scholar] [CrossRef]
- Nguyen, L.; Watanabe, T. The Impact of Project Organizational Culture on the Performance of Construction Projects. Sustainability 2017, 9, 781. [Google Scholar] [CrossRef]
- Hussain, S.; FangWei, Z.; Ali, Z.; Xu, X. Rural Residents’ Perception of Construction Project Delays in Pakistan. Sustainability 2017, 9, 2108. [Google Scholar] [CrossRef]
- Ringle, C.; Wende, S.; Becker, J. SmartPLS 3. 2015. Available online: http://www.smartpls.de (accessed on 3 May 2018).
- Bamgbade, J.A.; Kamaruddeen, A.M.; Nawi, M.N.M.; Yusoff, R.Z.; Bin, R.A. Does Government Support Matter? Influence of Organizational Culture on Sustainable Construction among Malaysian Contractors. Int. J. Constr. Manag. 2018, 18, 93–107. [Google Scholar] [CrossRef]
- Lin, C.-L.; Jeng, C.-H. Exploring Interface Problems in Taiwan’s Construction Projects Using Structural Equation Modeling. Sustainability 2017, 9, 822. [Google Scholar] [CrossRef]
- Gefen, D. Structural Equation Modeling and Regression: Guidelines for Research Practice Structural. Struct. Equ. Model. 2000, 4, 7. [Google Scholar]
- Henseler, J.; Ringle, C.M.; Sinkovics, R. The Use of Partial Least Squares Path Modeling in International Marketing. Adv. Int. Mark. 2009, 20, 277–319. [Google Scholar] [CrossRef]
- Hair, J.F.; Ringle, C.M.; Sarstedt, M. Partial Least Squares Structural Equation Modeling: Rigorous Applications, Better Results and Higher Acceptance. Long Range Plan. 2013, 46, 1–12. [Google Scholar] [CrossRef]
- Peng, D.X.; Lai, F. Using Partial Least Squares in Operations Management Research: A Practical Guideline and Summary of Past Research. J. Oper. Manag. 2012, 30, 467–480. [Google Scholar] [CrossRef]
- Ho, R. Handbook of Univariate and Multivariate Data Analysis and Interpretation with IBM SPSS; Taylor & Francis: Abingdon-on-Thames, Oxfordshire, UK, 2013. [Google Scholar]
- Götz, O.; Liehr-Gobbers, K.; Krafft, M. Evaluation of Structural Equation Models Using the Partial Least Squares (PLS) Approach. In Handbook of Partial Least Squares; Springer: Berlin/Heidelberg, Germany, 2010; pp. 691–711. [Google Scholar]
- Chin, W.W. The Partial Least Squares Approach to Structural Equation Modeling. In Modern Methods for Business Research; Lawrence Erlbaum Associates Publishers: Mahwah, NJ, USA, 1998; pp. 295–336. [Google Scholar]
- Fornell, C.; Larcker, D.F. Evaluating Structural Equation Models with Unobservable Variables and Measurement Error. J. Mark. Res. 1981, 18, 39–50. [Google Scholar] [CrossRef]
- Barclay, D.; Thompson, R.; dan Higgins, C. The Partial Least Squares (PLS) Approach to Causal Modeling: Personal Computer Adoption and Use an Illustration. Technol. Stud. 1995, 2, 285–309. [Google Scholar] [CrossRef]
- Sarstedt, M.; Ringle, C.M.; Smith, D.; Reams, R.; Hair, J.F. Partial Least Squares Structural Equation Modeling (PLS-SEM): A Useful Tool for Family Business Researchers. J. Fam. Bus. Strateg. 2014, 5, 105–115. [Google Scholar] [CrossRef]
- Cohen, J. Statistical Power Analysis for the Behavioral Sciences. NJ Lawrence Earlbaum Assoc. 1988, 2, 567. [Google Scholar]
- Tenenhaus, M.; Esposito Vinzi, V.; Chatelin, Y.-M.; Lauro, C. PLS Path Modeling. Comput. Stat. Data Anal. 2005, 48, 159–205. [Google Scholar] [CrossRef]
- Henseler, J.; Hubona, G.; Ray, P.A. Using PLS Path Modeling in New Technology Research: Updated Guidelines. Ind. Manag. Data Syst. 2016, 116, 2–20. [Google Scholar] [CrossRef]
- Chen, F.F. Sensitivity of Goodness of Fit Indexes to Lack of Measurement Invariance. Struct. Equ. Model. 2007, 14, 464–504. [Google Scholar] [CrossRef]
- Hu, L.; Bentler, P.M. Fit Indices in Covariance Structure Modeling: Sensitivity to Underparameterized Model Misspecification. Psychol. Methods 1998, 3, 424–453. [Google Scholar] [CrossRef]
- Doloi, H.; Iyer, K.C.; Sawhney, A. Structural Equation Model for Assessing Impacts of Contractor’s Performance on Project Success. Int. J. Proj. Manag. 2011, 29, 687–695. [Google Scholar] [CrossRef]
- Pheng, L.S.; Ke-Wei, P. A Framework for Implementing TQM in Construction. TQM Mag. 1996, 8, 39–46. [Google Scholar] [CrossRef]
- Luo, L.Z.; Mao, C.; Shen, L.Y.; Li, Z.D. Risk Factors Affecting Practitioners’ Attitudes toward the Implementation of an Industrialized Building System. Eng. Constr. Archit. Manag. 2015, 22, 622–643. [Google Scholar] [CrossRef]
Figure 1.
Conceptual model.
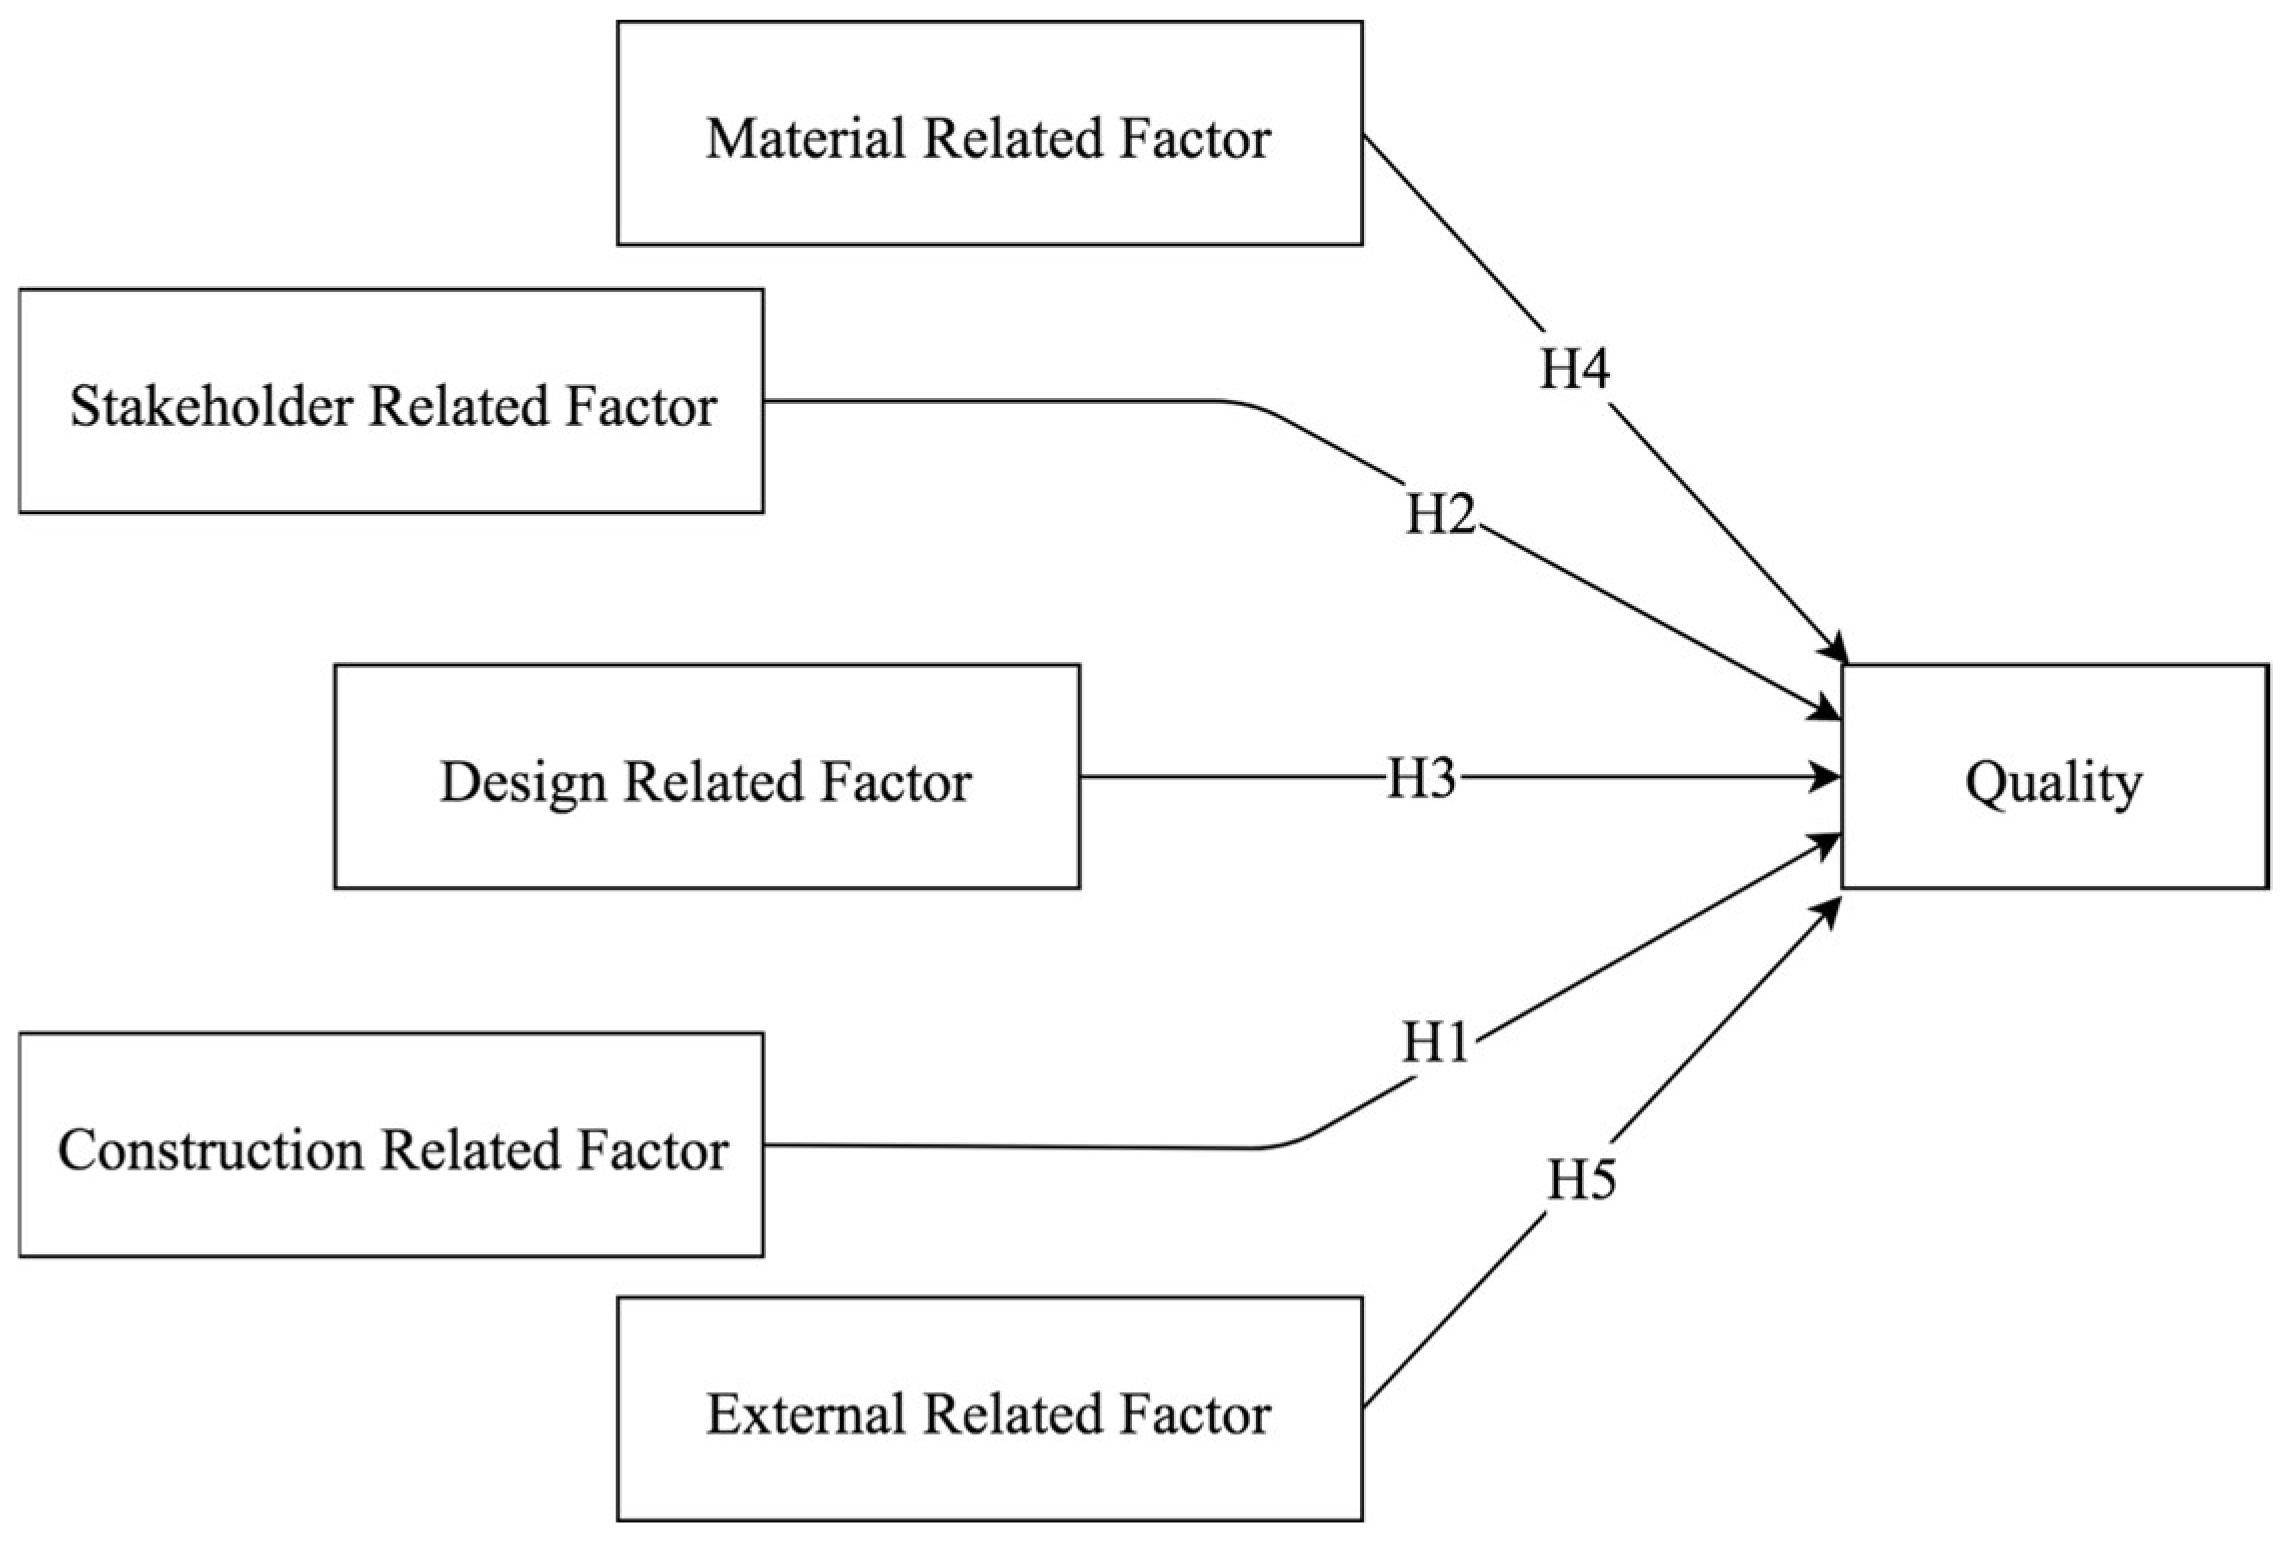
Figure 2.
Data collection process.

Figure 3.
Assessment of the structural equation model.

Figure 4.
Graphical representation of the path coefficient.

Figure 5.
Predictive relevance of the model.

Table 1.
The methodologies and data sources of previous studies worldwide.
| Sr No. | Authors | Title | Data Source | Sample Size | Methods | Country |
|---|---|---|---|---|---|---|
| 1 | Gan et al. [8] | Critical Factors Affecting the Quality of Industrialized Building System Projects in China | Questionnaire survey | 179 respondents | t-statistics and ANOVA | China |
| 2 | Jha & Iyer [2] | Critical Factors Affecting Quality Performance in Construction Projects | Questionnaire survey | 112 respondents | Factor analysis | India |
| 3 | Chan et al. [39] | Assessing quality relationships in public housing: An empirical study | Questionnaire survey | 54 respondents | Factor analysis and multiple regression analysis | Hong Kong |
| 4 | Ling et al. [40] | Determinants of international architectural, engineering and construction firms’ project success in China | Questionnaire survey and interview | 27 interviews | Correlation analysis and multiple regression | China |
| 5 | Ling et al. [41] | Predicting Performance of Design-Build and Design-Bid-Build Projects | Questionnaire survey and interview | 87 projects | Multivariate linear regression | Singapore |
| 6 | Nguyen et al. [42] | A study on project success factors in large construction projects in Vietnam | Questionnaire survey | 109 respondents | Factor analysis | Vietnam |
| 7 | Phua and Rowlinson [43] | How important is cooperation to construction project success? A grounded empirical quantification | Interviews and questionnaire survey | 29 interviews, 398 quantitative response | Factor analysis | Hong Kong |
| 8 | Nguyen et al. [42] | A study on project success factors in large construction projects in Vietnam | Questionnaire survey | 109 respondents | Factor analysis | Vietnam |
| 9 | Cooke-Davies [44] | The “real” success factors on projects | Questionnaire survey and interview | 70 large organizations | Correlation analysis | Israel |
| 10 | Chan and Tam [23] | Factors affecting the quality of building projects in Hong Kong | Interviews and questionnaire survey | 55 respondents in 110 cases | Factor analysis and multiple regression analysis | Hong Kong |
| 11 | Chua et al. [45] | Critical success factor for different project objectives | Questionnaire survey | 20 respondents | Relative importance | Singapore |
| 12 | Arditi and Gunaydin [22] | Factors that affect process quality in the life cycle of building projects | Questionnaire survey | 137 respondents | Mean scores and ranked by RII | USA |
| 13 | Abdel Razek [17] | Factors affecting construction quality in Egypt: identification and relative importance | Delphi technique | 159 respondents | Pareto analysis | Egypt |
| 14 | Albanese [46] | Team-Building Process: Key to Better Project Results | Questionnaire survey and interviews | 41 projects | Mean scores | USA |
| 15 | Mohsini and Davidson [47] | Determinants of performance in the traditional building process | Questionnaire survey | 21 respondents | Multiple regression | Canada |
Table 2.
The preliminary list of factors affecting quality of social infrastructure projects.
| Code | Factors |
|---|---|
| Stakeholder Related Factor (SRF) | |
| SRF_1 | Poor relationship and partnering among project participants [2,50] |
| SRF_2 | Lack of contractor supervision [11,22] |
| SRF_3 | Making site decisions on cost and not the value of work [24] |
| SRF_4 | Lack of Management commitment [51,52] |
| SRF_5 | Poor site installation procedure [24] |
| SRF_6 | Inadequate site supervision [2,24] |
| Construction Related Factor (CRF) | |
| CRF_1 | Lack of experienced project managers in the construction [8] |
| CRF_2 | Contractors’ poor management ability [53] |
| CRF_3 | Lack of skilled workers in the construction [8] |
| CRF_4 | Contractors’ lack of experience in the construction [54] |
| CRF_5 | Lack of coordination between on-site management personnel [8] |
| CRF_6 | Limited construction time imposed by project clients [8] |
| CRF_7 | No corrective action on the poor-quality components [8] |
| CRF_8 | Lack of construction quality criteria [8] |
| CRF_9 | Inadequate involvement of the owner during construction works [24] |
| Material Related Factor (MRF) | |
| MRF_1 | Poor quality of raw materials [8,55] |
| MRF_2 | Unavailability of construction materials [52,56] |
| MRF_3 | Price fluctuation [24] |
| MRF_4 | Change in specification and type of materials during construction [55] |
| MRF_5 | Aggressive competition during tendering [2] |
| Design Related Factor (DRF) | |
| DRF_1 | Design complexity [24] |
| DRF_2 | Incomplete design information provided by project clients [8,55] |
| DRF_3 | Flaws in design specification [8] |
| DRF_4 | Limited design time imposed by project clients [8] |
| DRF_5 | Lack of experienced designers [8,24] |
| DRF_6 | Too many design changes during execution [57] |
| External Related Factor (ERF) | |
| ERF_1 | Hostile social environment [2] |
| ERF_2 | Political instability [2] |
| ERF_3 | Hostile economic environment [2] |
| ERF_4 | Harsh climatic condition at the site [2,24] |
| ERF_5 | Changes in government regulations [55] |
| Quality Factors (QF) | |
| QF_1 | Lack of quality planning [22] |
| QF_2 | Lack of understanding the potential benefits of quality implementation [14] |
| QF_3 | Lack of quality assurance [24] |
| QF_4 | Lack of proper quality monitoring and evaluation [2] |
| QF_5 | Lack of quality policy [22] |
Table 3.
Demographic information of respondents.
| Respondents’ Profile | Number | Percent (%) |
|---|---|---|
| Working Experience | ||
| 5–10 years | 95 | 21% |
| 11–20 years | 165 | 37% |
| 21–30 years | 105 | 23% |
| >30 | 86 | 19% |
| Educational background | ||
| Diploma of Associate Engineering | 160 | 35% |
| BSc | 105 | 23% |
| MSc | 150 | 33% |
| MBA | 36 | 8% |
| Role in the organization | ||
| Chief Engineer | 7 | 2% |
| Superintendent Engineer | 9 | 2% |
| Executive Engineer | 85 | 19% |
| Assistant Executive Engineer | 90 | 20% |
| Managerial Personal | 65 | 14% |
| Assistant Engineer | 110 | 24% |
| Designer/Architect | 85 | 19% |
| Construction Industry type | ||
| DHA | 56 | 12% |
| CDA | 139 | 31% |
| PWD | 107 | 24% |
| WAPDA | 78 | 17% |
| WASA | 43 | 10% |
| NLC | 28 | 6% |
Table 4.
Construct reliability and validity.
| Main Constructs | Items | Loadings | Cronbach’s Alpha | CR | AVE |
|---|---|---|---|---|---|
| Construction Related Factor | CRF_1 | 0.739 | 0.933 | 0.944 | 0.654 |
| CRF_2 | 0.735 | ||||
| CRF_3 | 0.760 | ||||
| CRF_4 | 0.831 | ||||
| CRF_5 | 0.839 | ||||
| CRF_6 | 0.863 | ||||
| CRF_7 | 0.829 | ||||
| CRF_8 | 0.833 | ||||
| CRF_9 | 0.836 | ||||
| Design Related Factor | DRF_1 | 0.749 | 0.859 | 0.895 | 0.587 |
| DRF_2 | 0.805 | ||||
| DRF_3 | 0.708 | ||||
| DRF_4 | 0.800 | ||||
| DRF_5 | 0.784 | ||||
| DRF_6 | 0.748 | ||||
| External Related Factor | ERF_1 | 0.747 | 0.846 | 0.890 | 0.619 |
| ERF_2 | 0.794 | ||||
| ERF_3 | 0.769 | ||||
| ERF_4 | 0.778 | ||||
| ERF_5 | 0.843 | ||||
| Material Related Factor | MRF_1 | 0.837 | 0.859 | 0.899 | 0.641 |
| MRF_2 | 0.720 | ||||
| MRF_3 | 0.810 | ||||
| MRF_4 | 0.769 | ||||
| MRF_5 | 0.859 | ||||
| Stakeholder Related Factor | SRF_1 | 0.715 | 0.869 | 0.902 | 0.607 |
| SRF_2 | 0.872 | ||||
| SRF_3 | 0.781 | ||||
| SRF_4 | 0.709 | ||||
| SRF_5 | 0.739 | ||||
| SRF_6 | 0.845 | ||||
| Quality Factors | QF_1 | 0.859 | 0.873 | 0.907 | 0.662 |
| QF_2 | 0.789 | ||||
| QF_3 | 0.791 | ||||
| QF_4 | 0.819 | ||||
| QF_5 | 0.807 |
Table 5.
Fornell–Larcker criterion test.
| CRF | DRF | ERF | MRF | QF | SRF | |
|---|---|---|---|---|---|---|
| Construction Related Factor | 0.809 | |||||
| Design Related Factor | 0.230 | 0.766 | ||||
| External Related Factor | 0.258 | 0.266 | 0.787 | |||
| Material Related Factor | 0.260 | 0.242 | 0.265 | 0.800 | ||
| Quality Factors | 0.561 | 0.555 | 0.526 | 0.547 | 0.814 | |
| Stakeholder Related Factor | 0.247 | 0.290 | 0.233 | 0.258 | 0.560 | 0.779 |
Table 6.
Cross-loadings.
| CRF | DRF | ERF | MRF | QF | SRF | |
|---|---|---|---|---|---|---|
| CRF_1 | 0.739 | 0.151 | 0.203 | 0.244 | 0.419 | 0.183 |
| CRF_2 | 0.735 | 0.152 | 0.158 | 0.142 | 0.395 | 0.199 |
| CRF_3 | 0.760 | 0.154 | 0.226 | 0.165 | 0.418 | 0.179 |
| CRF_4 | 0.831 | 0.182 | 0.233 | 0.209 | 0.462 | 0.185 |
| CRF_5 | 0.839 | 0.179 | 0.227 | 0.182 | 0.465 | 0.237 |
| CRF_6 | 0.863 | 0.232 | 0.224 | 0.261 | 0.497 | 0.222 |
| CRF_7 | 0.829 | 0.244 | 0.200 | 0.264 | 0.464 | 0.191 |
| CRF_8 | 0.833 | 0.164 | 0.197 | 0.213 | 0.491 | 0.227 |
| CRF_9 | 0.836 | 0.206 | 0.202 | 0.205 | 0.459 | 0.169 |
| DRF_1 | 0.159 | 0.749 | 0.177 | 0.235 | 0.433 | 0.236 |
| DRF_2 | 0.119 | 0.805 | 0.163 | 0.187 | 0.431 | 0.242 |
| DRF_3 | 0.166 | 0.708 | 0.184 | 0.129 | 0.388 | 0.195 |
| DRF_4 | 0.193 | 0.800 | 0.215 | 0.214 | 0.454 | 0.203 |
| DRF_5 | 0.207 | 0.784 | 0.236 | 0.186 | 0.421 | 0.220 |
| DRF_6 | 0.215 | 0.748 | 0.249 | 0.155 | 0.419 | 0.237 |
| ERF_1 | 0.231 | 0.213 | 0.747 | 0.233 | 0.404 | 0.205 |
| ERF_2 | 0.181 | 0.189 | 0.794 | 0.196 | 0.417 | 0.151 |
| ERF_3 | 0.190 | 0.253 | 0.769 | 0.234 | 0.405 | 0.179 |
| ERF_4 | 0.203 | 0.186 | 0.778 | 0.142 | 0.387 | 0.173 |
| ERF_5 | 0.210 | 0.206 | 0.843 | 0.234 | 0.452 | 0.205 |
| MRF_1 | 0.214 | 0.214 | 0.268 | 0.837 | 0.500 | 0.237 |
| MRF_2 | 0.206 | 0.198 | 0.171 | 0.720 | 0.391 | 0.239 |
| MRF_3 | 0.226 | 0.233 | 0.218 | 0.810 | 0.417 | 0.202 |
| MRF_4 | 0.175 | 0.108 | 0.150 | 0.769 | 0.394 | 0.137 |
| MRF_5 | 0.221 | 0.210 | 0.237 | 0.859 | 0.472 | 0.211 |
| QF_1 | 0.522 | 0.520 | 0.491 | 0.509 | 0.859 | 0.502 |
| QF_2 | 0.517 | 0.471 | 0.476 | 0.488 | 0.789 | 0.503 |
| QF_3 | 0.394 | 0.405 | 0.399 | 0.380 | 0.791 | 0.414 |
| QF_4 | 0.417 | 0.419 | 0.391 | 0.418 | 0.819 | 0.410 |
| QF_5 | 0.405 | 0.422 | 0.358 | 0.405 | 0.807 | 0.427 |
| SRF_1 | 0.144 | 0.252 | 0.123 | 0.147 | 0.355 | 0.715 |
| SRF_2 | 0.218 | 0.215 | 0.246 | 0.213 | 0.516 | 0.872 |
| SRF_3 | 0.186 | 0.215 | 0.180 | 0.246 | 0.452 | 0.781 |
| SRF_4 | 0.161 | 0.205 | 0.097 | 0.175 | 0.378 | 0.709 |
| SRF_5 | 0.193 | 0.235 | 0.187 | 0.173 | 0.402 | 0.739 |
| SRF_6 | 0.236 | 0.246 | 0.223 | 0.238 | 0.487 | 0.845 |
Table 7.
Path coefficient and T-statistics.
| Hypothesized Path | Standardized Beta | T-Statistics | p Values |
|---|---|---|---|
| Construction Related Factor -> Quality | 0.296 | 10.996 | 0.000 |
| Design Related Factor -> Quality | 0.276 | 10.602 | 0.000 |
| External Related Factor -> Quality | 0.239 | 9.030 | 0.000 |
| Material Related Factor -> Quality | 0.266 | 10.513 | 0.000 |
| Stakeholder Related Factor -> Quality | 0.282 | 10.883 | 0.000 |
Table 8.
Effect size.
| Exogenous Latent Variables | Effect Size ƒ2 | Total Effect |
|---|---|---|
| Construction Related Factor | 0.301 | moderate |
| Design Related Factor | 0.257 | moderate |
| External Related Factor | 0.194 | moderate |
| Material Related Factor | 0.240 | moderate |
| Stakeholder Related Factor | 0.268 | moderate |
Table 9.
Goodness-of-Fit index calculation.
| Construct | AVE | R2 |
|---|---|---|
| Construction Related Factor | 0.654 | |
| Design Related Factor | 0.587 | |
| External Related Factor | 0.619 | |
| Material Related Factor | 0.641 | |
| Stakeholder Related Factor | 0.607 | |
| Quality Factors | 0.662 | 0.749 |
| Average Values | 3.77 | 0.749 |
| AVE × R2 | 0.4706 | |
| GOF = √(AVE × R2) | 0.686 |
Table 10.
Model fit summary.
| Estimated Model | |
|---|---|
| SRMR | 0.050 |
| d_ULS | 1.632 |
| d_G1 | 0.952 |
| d_G2 | 0.792 |
| Chi-Square | 1917.082 |
| NFI | 0.811 |
Table 11.
Latent variable correlation.
| CRF | DRF | ERF | MRF | SRF | Quality | |
|---|---|---|---|---|---|---|
| Construction Related Factor | 1.000 | |||||
| Design Related Factor | 0.230 | 1.000 | ||||
| External Related Factor | 0.258 | 0.266 | 1.000 | |||
| Material Related Factor | 0.260 | 0.242 | 0.265 | 1.000 | ||
| Stakeholder Related Factor | 0.247 | 0.290 | 0.233 | 0.258 | 1.000 | |
| Quality | 0.561 | 0.555 | 0.526 | 0.547 | 0.560 | 1.000 |
Table 12.
Comparison of quality influencing factors with previous studies.
| Sr. No | This Study Pakistan | Chan et al. [39] Hong Kong | Gan et al. [8] China | Jha & Iyer [2] India |
|---|---|---|---|---|
| 1 | Lack of contractor supervision | Project manager’s experience in running public housing projects | Lack of design norms and standards | Conflict among project participants |
| 2 | Aggressive competition during tendering | Proactive quality culture; the extent of using direct skilled labor | Lack of quality criteria | Hostile socio-economic environment |
| 3 | Hostile economic environment | Comprehensive subcontract inspection system | Lack of production norms and standards | Harsh climatic condition |
| 4 | Lack of experienced project managers in the construction | Competency of site labor | Lack of quality management system in production process | PM’s ignorance & lack of knowledge |
| 5 | Flaws in design specification | Client’s emphasis on quality, safety and environment | Lack of technical guidelines for the construction | Aggressive competition during tendering |
| 6 | Arditi and Gunaydin [22] USA | Abdel Razek [17] Eygpt | Nguyen et al. [42] Vietnam | Chan and Tam [23] Hong Kong |
| 7 | Management commitment to continuous quality improvement | Improving design and planning during the pre- construction phase | Competent project manager | Project management action by the project team |
| 8 | Management leadership in promoting high process quality | Developing and improving quality control and assurance systems | Adequate funding throughout the project | Effectiveness of the construction team leader |
| 9 | Quality training of all personnel | Improving the financial level and standard of living of employees | Competent project team | Client’s emphasis on quality |
| 10 | Efficient teamwork to promote quality issues at the corporate level | Improving the accuracy of estimating and tendering | Commitment to project | Client’s emphasis on time |
| 11 | Effective cooperation between parties | Proper classification of contractors, consultants and construction projects | Availability of resources | Project management actions |
© 2018 by the authors. Licensee MDPI, Basel, Switzerland. This article is an open access article distributed under the terms and conditions of the Creative Commons Attribution (CC BY) license (http://creativecommons.org/licenses/by/4.0/).
Share and Cite
MDPI and ACS Style
Hussain, S.; Fangwei, Z.; Siddiqi, A.F.; Ali, Z.; Shabbir, M.S. Structural Equation Model for Evaluating Factors Affecting Quality of Social Infrastructure Projects. Sustainability 2018, 10, 1415. https://doi.org/10.3390/su10051415
AMA Style
Hussain S, Fangwei Z, Siddiqi AF, Ali Z, Shabbir MS. Structural Equation Model for Evaluating Factors Affecting Quality of Social Infrastructure Projects. Sustainability. 2018; 10(5):1415. https://doi.org/10.3390/su10051415
Chicago/Turabian StyleHussain, Shahid, Zhu Fangwei, Ahmed Faisal Siddiqi, Zaigham Ali, and Muhammad Salman Shabbir. 2018. "Structural Equation Model for Evaluating Factors Affecting Quality of Social Infrastructure Projects" Sustainability 10, no. 5: 1415. https://doi.org/10.3390/su10051415
Note that from the first issue of 2016, this journal uses article numbers instead of page numbers. See further details here.