Accuracy Assessment of Multi-Source Gridded Population Distribution Datasets in China


1
State Key Laboratory of Resources and Environmental Information System, Institute of Geographic Sciences and Natural Resources Research, Chinese Academy of Sciences, Beijing 100101, China
2
Beijing GEOWAY Software Co., Ltd., Beijing 100043, China
3
Jiangsu Center for Collaborative Innovation in Geographical Information Resource Development and Application, Nanjing 210023, China
4
School of Civil and Architectural Engineering, Shandong University of Technology, Zibo 255049, China
5
National Science and Technology Infrastructure Center, Beijing 100862, China
*
Author to whom correspondence should be addressed.
Sustainability 2018, 10(5), 1363; https://doi.org/10.3390/su10051363
Submission received: 1 April 2018
/
Revised: 24 April 2018
/
Accepted: 25 April 2018
/
Published: 27 April 2018
Abstract
:Population is one of the core elements of sustainable development. Quantifying the estimation accuracy of population spatial distribution has been recognized as a critical and challenging task. This study aims to evaluate the data accuracy of four population datasets in China, including three global gridded population datasets, the Gridded Population of the World (GPW), Global Rural and Urban Mapping Project (GRUMP), and WorldPop project (WorldPop), and a Chinese regional gridded population dataset, the China 1 km Gridded Population (CnPop) dataset. These datasets are assessed using a specific method based on a GIS-linked 2000 census dataset at the township level in China. The results indicate that WorldPop had the highest estimation accuracy, estimating about 60% of the total population. CnPop accurately estimated about half of the total population, showing a good mapping performance. The GPW had an acceptable estimation accuracy in a few plain and basin areas, accounting for about 30% of the total population. Compared to the GPW, GRUMP accurately estimated about 40% of the total population. The relative estimation error analysis discovered the disadvantages of the generation strategies of these datasets. The conclusions are expected to serve as a quality reference for potential dataset users and producers, and promote accuracy assessment for population datasets in other regions and globally.
1. Introduction
The world population has increased dramatically from 1.6 billion in 1900 to 7.6 billion in mid-2017, and 59.66% of those people live in Asia [1,2]. The issue of population is one of the biggest problems in creating a sustainable society today. Adequate knowledge of population distributions has proven to be essential in many domains, such as environmental impact assessments, disaster prevention and mitigation, medical treatments, regional sustainable development, and climate change evaluations [3,4,5,6]. Commonly available information on population distribution and composition largely relies on demographical data, generally counted using census tracts, blocks, postcode zones, townships, and villages. In many cases, however, due to the defined spatial units used for data collection and reporting, these statistical datasets have severe limitations. First of all, in statistical data, population density in an administrative unit is a single value; hence, it does not reflect spatial distribution and internal variation [7]. Second, over time, census tracts change along with the gradual restructuring of administrative systems, making long time-series analysis difficult [8]. Third, research based on statistical population data at different scales may significantly affect spatial patterns and associations; this is also known as the modifiable areal unit problem. Statistical units are sometimes inconsistent with other natural and social zone systems. Thus, there is a need to convert the spatial resolution and structure of a statistical population to facilitate data linkage and analyses.
Gridded population distribution datasets can often supplement and act as substitutes for census data and are becoming widely used, principally due to their flexibility in integration with other spatial datasets and summarization at any chosen level of aggregation [9]. Over the past few decades, there has been increasing interest in creating large-area gridded population distribution datasets. Contemporary and widely used gridded population distribution datasets include the Gridded Population of the World (GPW) [10], the Global Rural-Urban Mapping Project (GRUMP) [11], LandScan [12], the United Nations Environment Program’s (UNEP) Global Population Databases [13,14], the WorldPop project (WorldPop) [15,16,17], and the China 1 km Gridded Population (CnPop) dataset [18]. Typical uses of these datasets include estimating the number of people impacted by development plans and health problems [19,20,21], quantifying populations threatened by infectious diseases [22,23,24,25], identifying the spatial distribution of infant mortality [26] and child hunger [27], and assessing climate change impacts [28,29].
Regarding the above research, determining the spatial and quantitative uncertainties inherent in gridded population distribution datasets has remained fundamental yet challenging. A theoretical method is to conduct accuracy assessments on the estimated model and resulting datasets. This is a difficult task because it is almost impossible to obtain sufficient true values (the exact number of people) at the grid scale given that population distributions are highly dynamic. An alternative technique is to compare the estimated population on the basis of the specific gridded dataset or modeling method with the statistical population at a lower administrative level (i.e., within a census tract) [16,30]. However, owing to policy restrictions and the cost of data collection, it is difficult to get a sufficient amount of these finer resolution boundaries and demographic data to conduct accuracy assessments, let alone to meet the requirements of random sampling. The problem is even more difficult in datasets with a wider coverage or higher spatial resolution.
Some studies have indirectly compared and discussed the generation methods, appropriate applications, uncertainties, and errors of different datasets in their evaluations of gridded population distribution datasets. Hay et al. illustrated the accuracy of UNEP/GRID, the GPW, and LandScan in determining populations at risk of various climate suitability levels for malaria infection, and the GPW had the highest evaluation accuracy [21]. Through assessing the four datasets—GRUMP, LandScan, UNEP, and GPW—Tatem et al. demonstrated the effects of spatial population dataset choice on estimates of populations at risk of falciparum malaria and their detailed country-level assessments suggested that no one dataset was consistently more accurate than the others in estimating at-risk populations [31]. Wang et al. assessed and compared the estimation accuracy of the GPW, UNEP/GRID, CnPop, and LandScan at the county level in the Heihe River Basin in China, and showed that CnPop is the most consistent with the actual data [32]. The above studies all assessed multi-source gridded population distribution datasets, but they had some insufficiencies, in that most of them addressed a single or special issue, thus leading to results that are not universal, and the research area of these studies is not representative. Overall, the limited past research inadequately addresses the accuracy and uncertainties of the current gridded population distribution datasets.
China’s population reached 1.41 billion in 2017, and the country has long been the most populous country in the world, with a profound influence on resource and environmental issues [2]. Therefore, accuracy assessments of multi-source gridded population distribution datasets in China have significant meaning. The objective of this study is to gain a comprehensive quantitative understanding of the overall quality and accuracy of CnPop, GPW, GRUMP, and WorldPop in China, which can be further used as a quality reference for relevant research and applications. In addition, on the basis of the analysis and comparison of the error distributions of these four datasets, we will attempt to identify possible regions that were difficult to simulate in a grid format, which in turn can help facilitate population distribution modeling for demographic geography.
2. Materials and Methods
2.1. Vector Boundary and Census Data at the Township Level
The administrative divisions of China are officially organized into five levels. From top to bottom, they are as follows: (1) provinces (Sheng), autonomous regions (Zizhiqu), municipalities (Zhixiashi), and special administrative regions (Tebiexingzhengqu); (2) prefectures (Shi, Diqu, Meng, and Zhou); (3) counties (Xian, Qu, and Qi); (4) townships (Xiang, Zhen, Jiedao, and Sumu); and (5) villages (Cun, Shequ, and Gacha). The spatial scale of the accuracy assessment used in this study is at the township level, which is also the finest cell for which census data can be publicly accessed in China. Xiang, Zhen, and Jiedao are three types of township: Xiang and Zhen are found in rural areas, while Jiedao are found in urban areas.
The vector boundary data at the township level were obtained from the Data Sharing Platform of Earth System Science of the National Science and Technology Infrastructure of China (http://www.geodata.cn/). The original boundary datasets were manually digitized from township division maps collected in 2000 at a scale of 1:250,000 in the different provinces of China. Data from Heilongjiang, Guangxi, Xinjiang, and Gansu provinces were unavailable; thus, the vector boundary data at the township level used in this study covered 27 provincial regions, including Liaoning, Jilin, Inner Mongolia Autonomous Region (part), Beijing, Tianjin, Shanghai, Hebei, Henan, Shaanxi, Shanxi, Ningxia, Shandong, Anhui, Jiangsu, Hunan, Hubei, Jiangxi, Zhejiang, Fujian, Guangdong, Hainan, Yunnan, Guizhou, Sichuan, Chongqing, Qinghai, and the Tibet Autonomous Region, as shown in Figure 1. The Hong Kong Special Administrative Region, Macao Special Administrative Region, and Taiwan province are not included in this study.
Census data were obtained from China’s fifth census dataset for 2000 at the township level (Xiang, Zhen, and Jiedao), which was released by the National Bureau of Statistics (http://www.stats.gov.cn/).
To ensure that the vector boundary data and census datasets could be spatially and correctly joined, several pre-processing steps were performed, such as geo-referencing, boundary adjustments, geocoding, and topology error checks. The final population spatial dataset at the township level contained 33,631 spatial units with a total population of 1,103,880,920, which accounted for 87.21% of the total population of China in 2000. The total area was 6,018,171.42 km2, representing 62.69% of the area of mainland China. The mean spatial resolution (which is equal to sqrt (area/number of units)) [11] of the township units was 13.4 km.
2.2. Gridded Population Distribution Datasets and Pretreatment
Table 1 presents the general characteristics of the four gridded population distribution datasets being assessed in this study.
The CnPop dataset was obtained from the Data Sharing Platform of Earth System Science of National Science and Technology Infrastructure of China. It is a national-scale dataset that covers mainland China with a spatial resolution of 1 km using census data at the county level and land use data at a scale of 1:100,000 as inputs [18]. There are two steps used to generate CnPop: (1) estimate the population density of each land use type using the least squares method in each sub-region; and (2) calculate the population in each grid cell on the basis of the population density and area of each land use type.
The GPWv3 and GRUMPv1 were downloaded from the Center for International Earth Science Information Network’s website (http://sedac.ciesin.columbia.edu/). The GPWv3 has a spatial resolution of 2.5 arc minutes [10]. Using tables of population counts listed by administrative area and spatially explicit administrative boundary data as two basic inputs, the population in each administrative unit was allocated to the grid cells assigned proportionally to that unit using a simple areal weighting algorithm.
The GRUMP dataset, which has a spatial resolution of 30 arc-seconds, is a ‘lightly’ modeled dataset product based on the GPW [11]. The allocation mechanism for GRUMP builds on the GPW approach but explicitly considers the populations of urban areas. In addition to data of statistical reporting units, population estimates, point allocations, and footprints for urban centers of each country were collected. Night-time satellite images were widely used to identify the urban settlements of major cities.
The WorldPop va dataset, which has a spatial resolution of 3 arc-seconds, was downloaded from the official WorldPop project website (http://www.worldpop.org.uk/). It is modeled using the MacDonald Dettwiler and Associates (MDA) GeoCover database and auxiliary data like OpenStreetMap for the correction of residential and building area distribution [33]. The population densities per land cover type were estimated by using the refined land cover layer and enumerated demographical data. Then, taking the population densities as weights, the demographical data were redistributed across each grid cell across the entire region [33,34].
The geographical reference of the four gridded population distribution datasets and the population dataset at the township level were unified to WGS 84, which is an internationally adopted geocentric coordinate system, and the Albers equal area projection, which is a conic, equal area map projection that is widely used in Asia and Europe area. For the population count layers of the GPW, GRUMP, and WorldPop, original raster layers were converted to point layers. Then, the point layers were reprojected and clipped by the Chinese mainland boundary data. The population density layers of the GPW, GRUMP, and WorldPop were masked by the Chinese mainland boundary data and converted into an Albers equal area projection using the nearest resampling technique (NEAREST), with a spatial resolution of 5 km, 1 km, or 100 m. NEAREST performs a nearest neighbor assignment, and is the fastest of the interpolation methods.
2.3. Accuracy Assessment Method
The estimated population numbers of the four datasets in each polygon of the 33,631 township units were counted separately using Zonal Statistics, a tool that calculates statistics on values of a raster within the zones of another dataset, in the ArcGIS software. Then, the absolute estimation error (AEE) and relative estimation error (REE) were calculated using Formulas (1) and (2):
where AEEij is the absolute estimation error of township j based on dataset i, Pj is the census count of township j, and PEij is the estimated population of township j based on dataset i. When i = 1, i = 2, i = 3, and i = 4, the dataset is CnPop, GPW, GRUMP, and WorldPop, respectively. In Formula (2), REEij is the relative estimation error of township j based on dataset i, which is a fractional value that has considered the population size of each township. For the convenience of mapping and in-depth analysis, REEij was classified into five categories (Table 2).
The estimation accuracy was evaluated using the following three steps. First, taking each township as an entity, the average population density of the 33,631 township units was calculated and set as the guideline for visually inspecting and comparing the mapping performance of CnPop, GPW, GRUMP, and Worldpop. Second, the scatter plots of PEij and Pj were constructed and the correlation coefficient (R), root mean square error (RMSE), mean absolute error (MAE), and mean absolute percentage error (MAPE) between PEij and Pj were calculated. Third, the REEij values were classified and mapped to identify the spatial distribution of the error and the amount and percentages of the total population and area in each REEij range were summed for the purpose of analysis and comparison.
3. Results
3.1. Visual Inspection of Mapping Performance
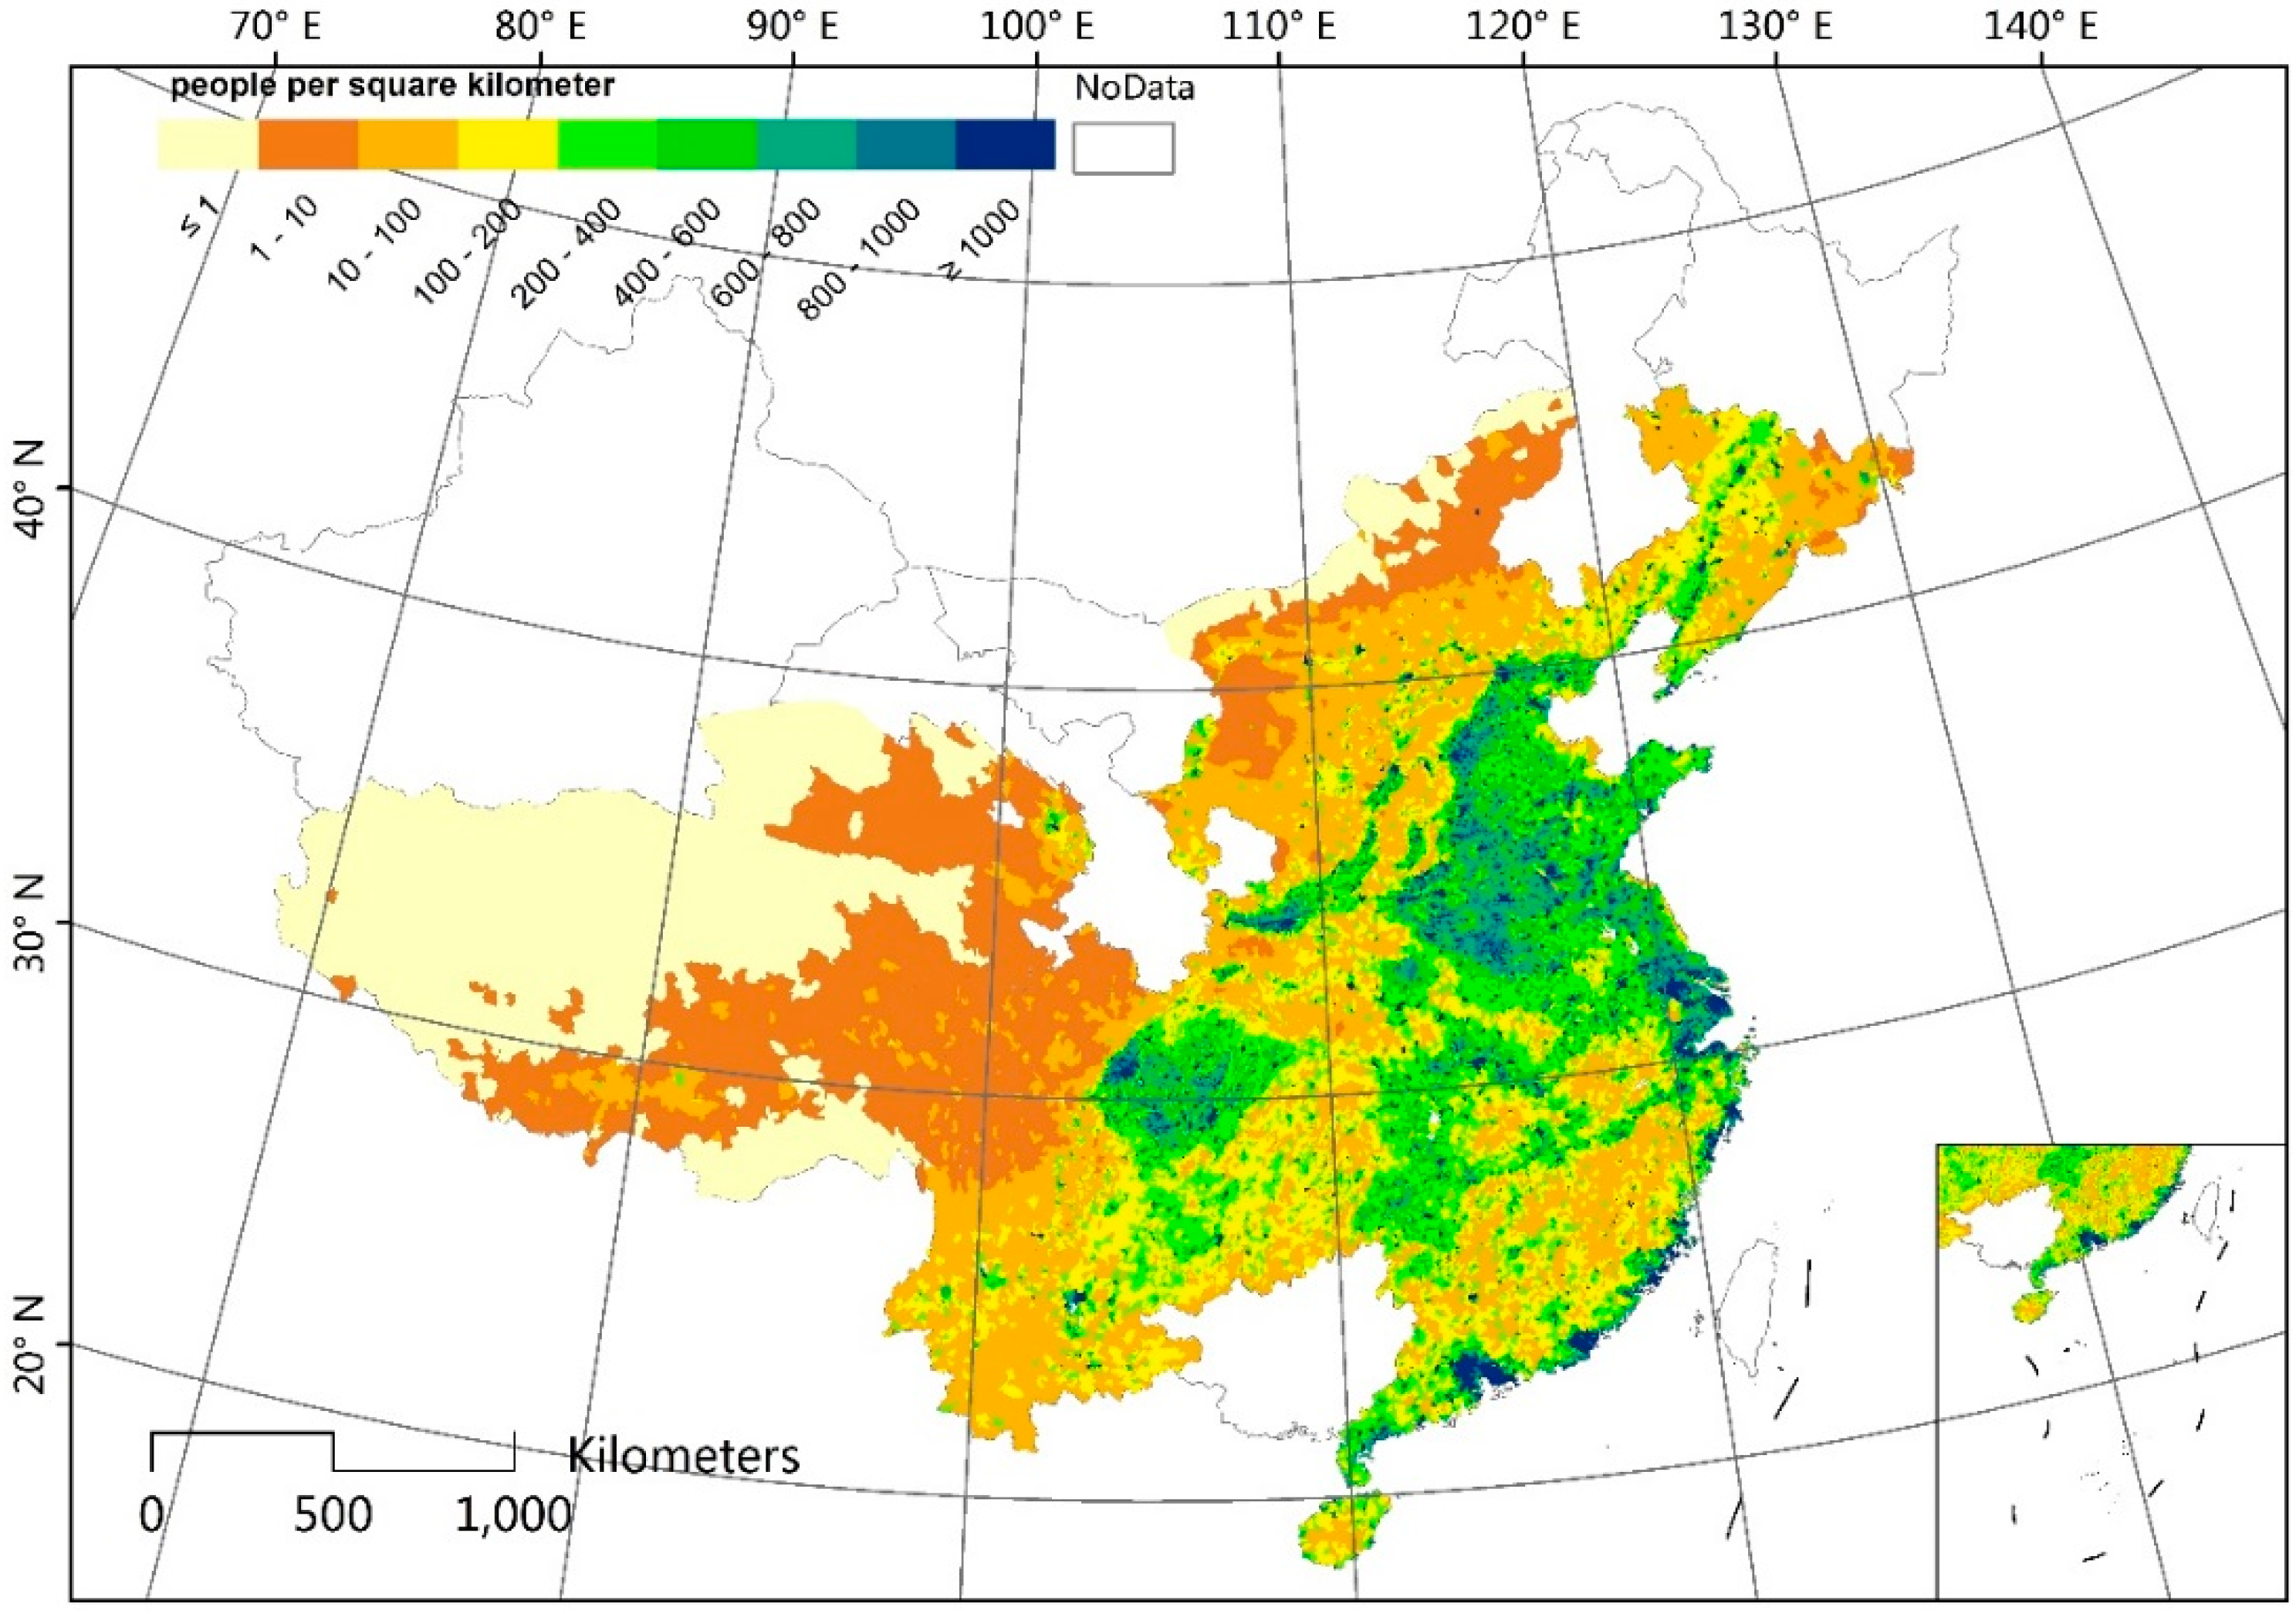
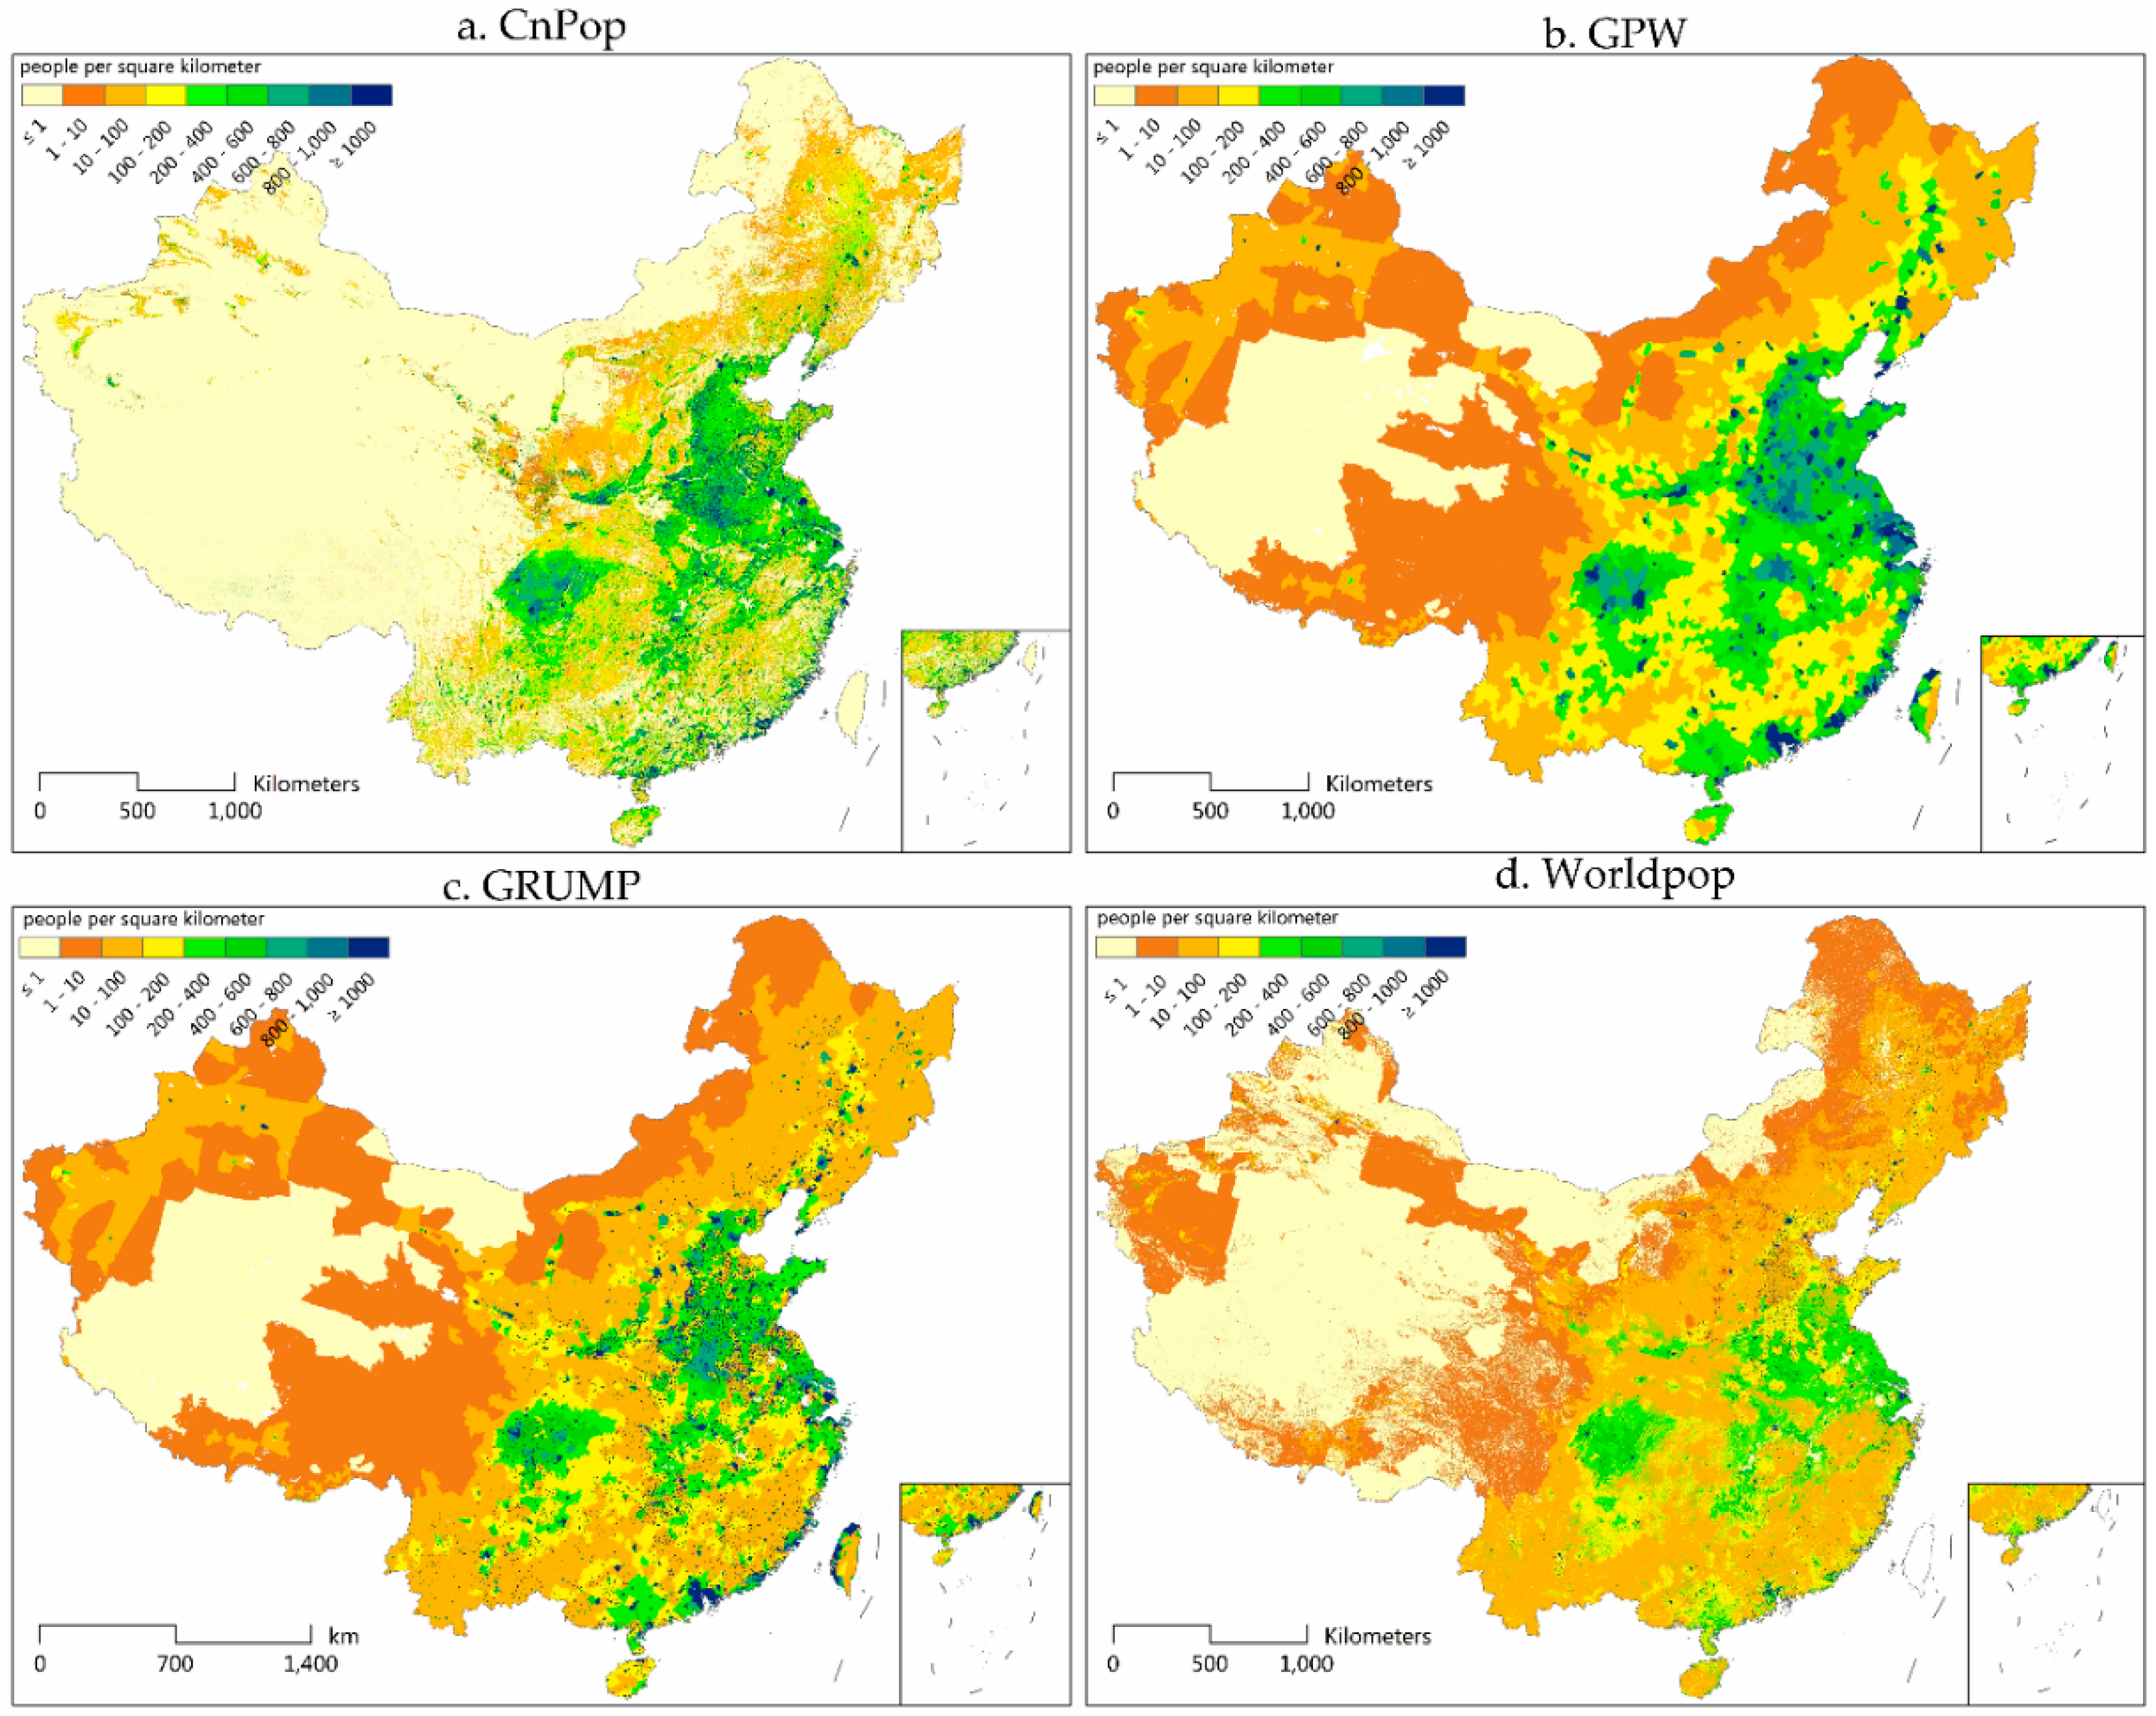
Figure 2 presents the averaged population density at the township level across 27 provinces, which shows objective and detailed population distribution characteristics at the township level in China. Figure 3a–d, respectively show CnPop, GPW, GRUMP, and WorldPop datasets on the basis of each population density layer for China. In comparison to Figure 2, the four maps in Figure 3 illustrate a similar trend: dense population distributions in the east and sparse ones in the west, although the details vary. The coastal zones, the North China plain, middle and lower reaches of the Yangtze River, Sichuan Basin, Songliao Plain, and Weihe Valley are the main densely populated regions. The Qinghai-Tibet Plateau, Inner Mongolia Plateau, Loess Plateau, and most areas in the Xinjiang Uygur Autonomous Region are sparsely populated. In addition to these generally densely or sparsely populated areas, the populations in the hilly areas, the ecotone between agriculture and animal husbandry, and the Yunnan-Guizhou Plain are scattered with a relative medium density. In the mapping performance, the GPW and GRUMP seem similar to Figure 2, and CnPop and WorldPop showed a little difference compared to that figure, which was mainly caused by the different spatial resolutions. The spatial resolutions of the averaged population density maps at the township level for 27 provinces in China, the GPW, GRUMP, CnPop, and WorldPop, were approximately 13.4 km, 5 km, 1 km, 1 km, and 100 m, respectively. The closer the spatial resolution, the more similar the mapping effect.
Just in the mapping performance of CnPop, GPW, GRUMP, and WorldPop, visual differences between the four population distribution maps were rather obvious. Both CnPop and WorldPop are modeled datasets based on land use or land cover data; thus, they offer more spatial heterogeneity details than the GPW and GRUMP. The divergence in the population distribution between rural and urban areas and across various landscapes is accurately characterized by WorldPop and CnPop, whether in the heavily populated southeast area or the sparsely populated northwest region. The population density in CnPop’s grid cells documents the gradual change from high to low values across the entire map. However, the boundaries of various population density ranges are abrupt on the WorldPop map, because of the coarse classification effect of the MDA GeoCover dataset. The GPW is roughly patched compared to the other three maps, which can be mainly attributed to its simple areal weighting method and coarse resolution. GRUMP fails to represent the spatial pattern in the sparsely populated parts of the western and northern areas. However, in the eastern and southern areas, where the extents of urban and rural regions can be identified with night-time light images or ancillary data, the population is considerably redistributed and the discrimination of the population density is significantly enhanced in comparison to the GPW. In urban areas, GRUMP shows a ring pattern in which low-density areas surround high-density ones, which is similar to the night-time light images. In sum, the ranking of the overall mapping performance from fine to coarse is as follows: CnPop, WorldPop, GRUMP, and GPW.
3.2. Statistical Analysis
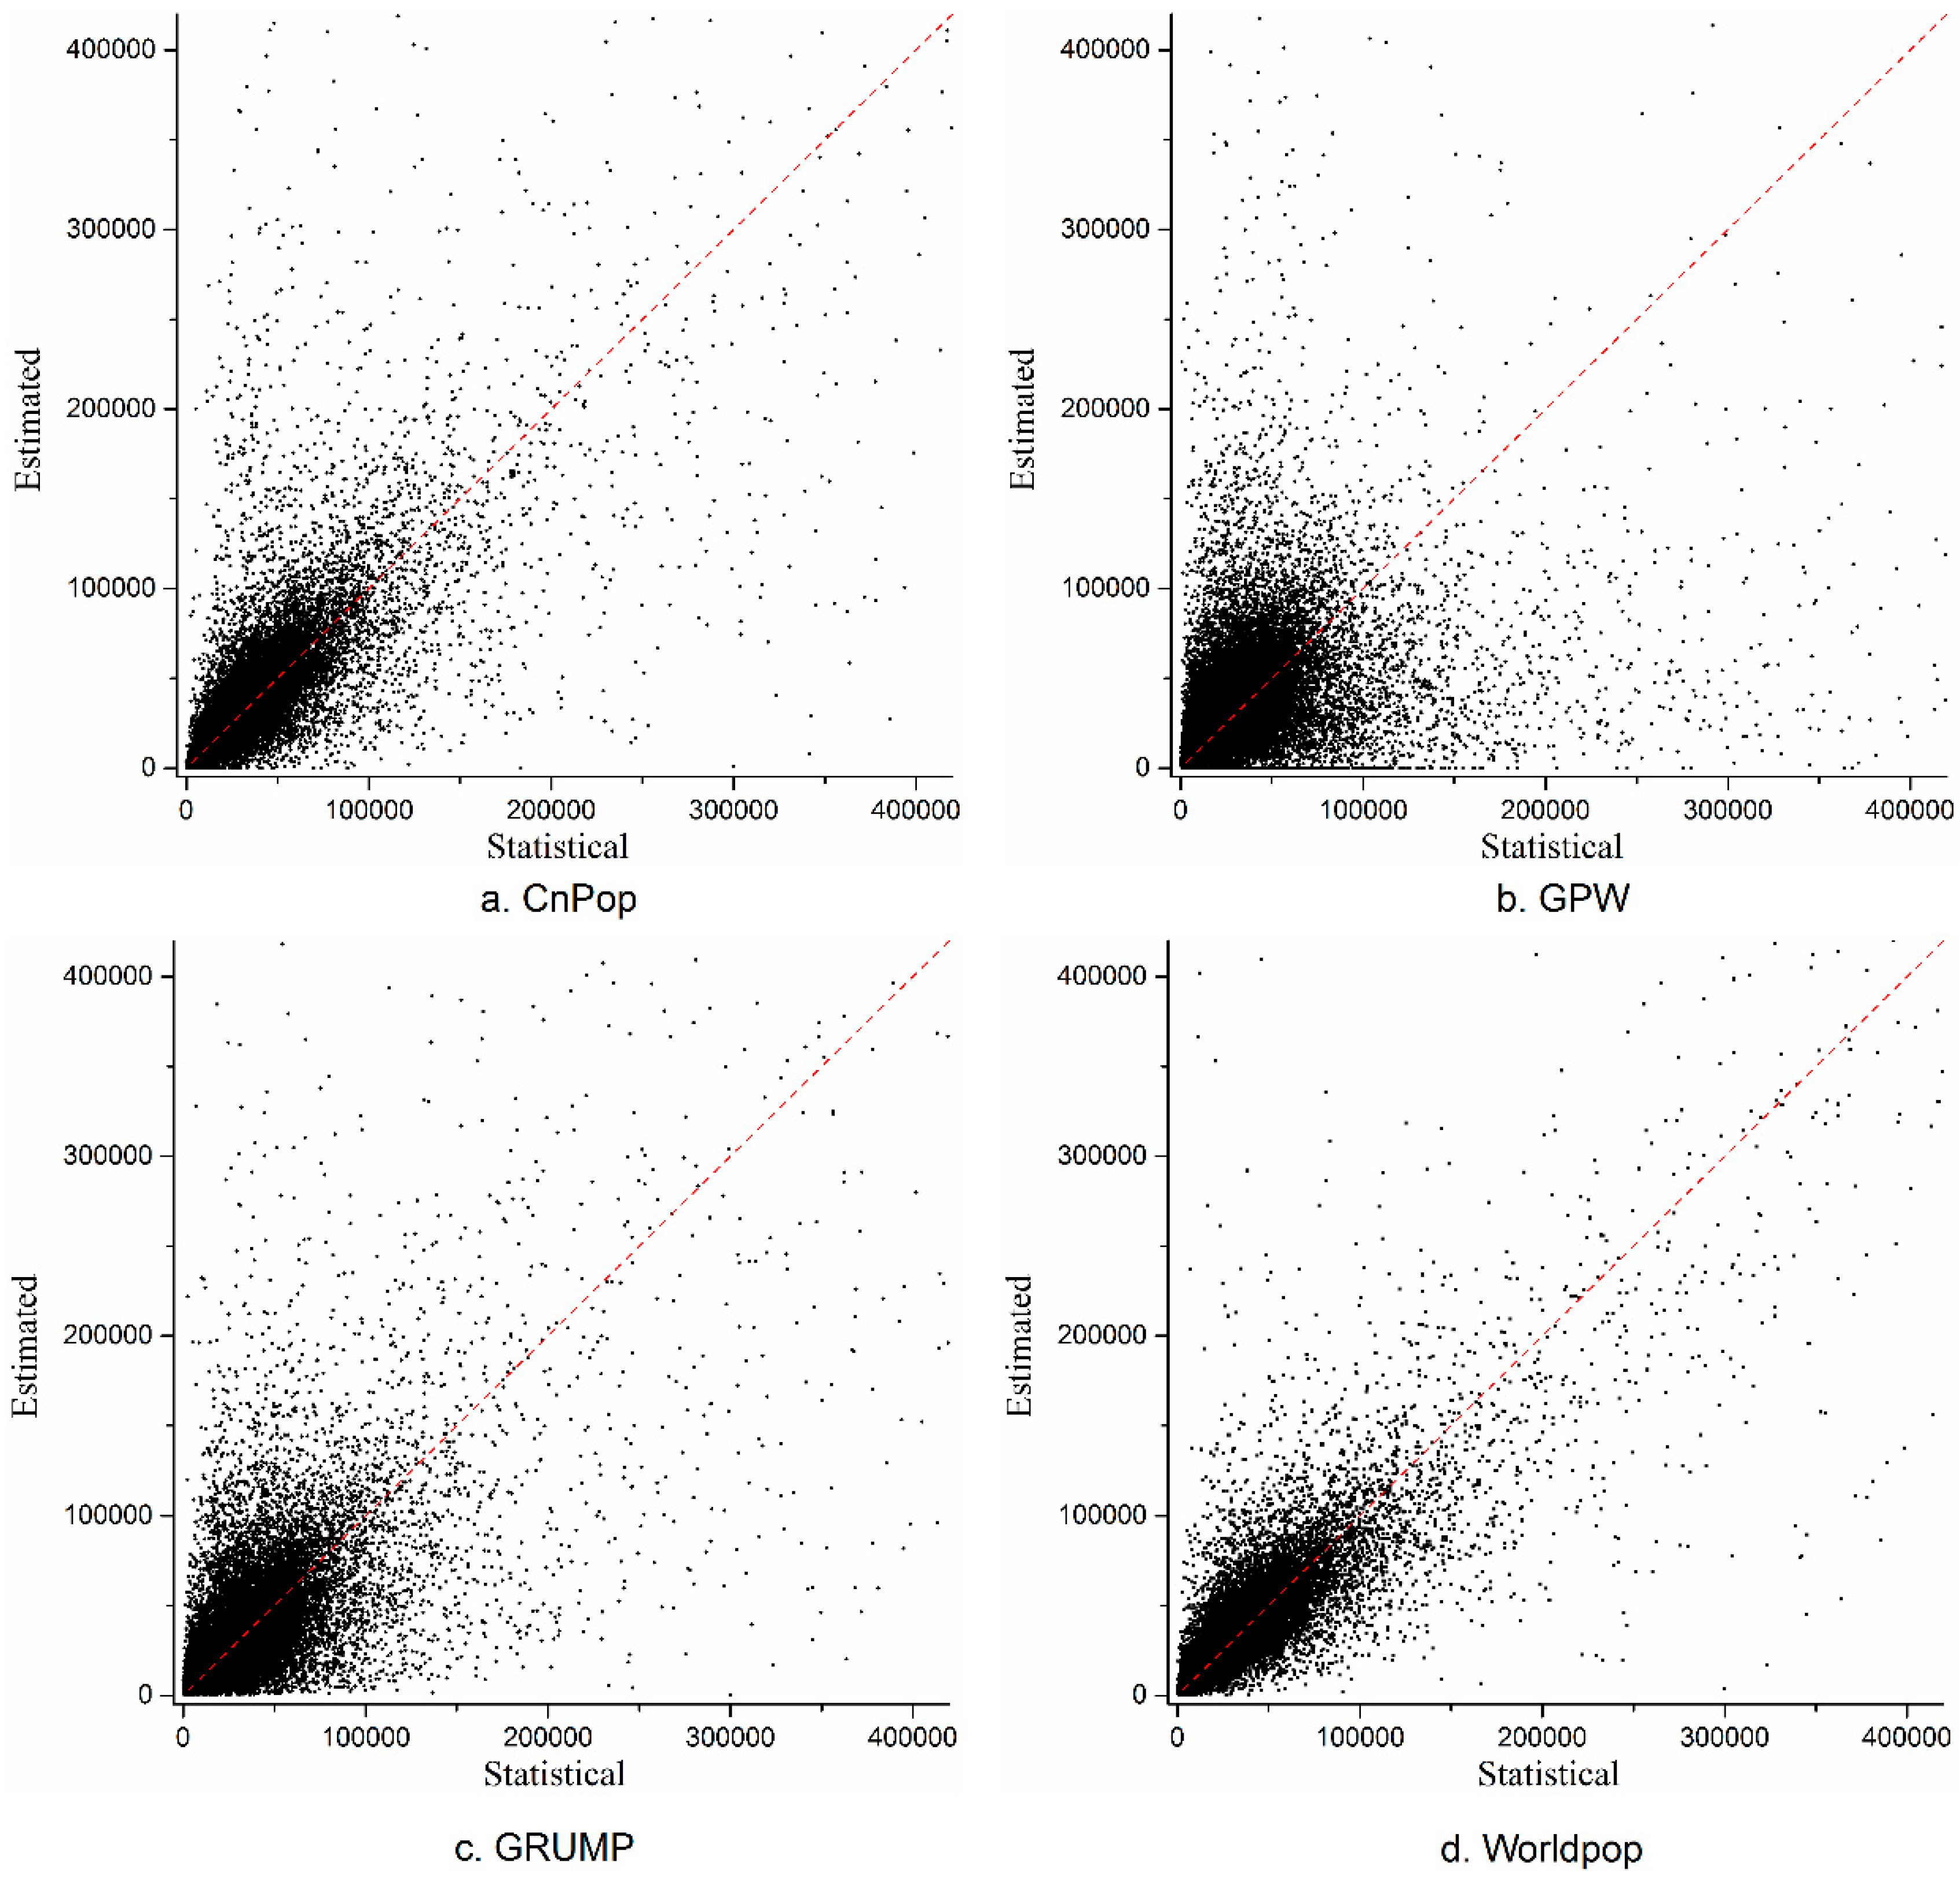
Figure 4 shows the relationships between the estimated population counts and census data in 27 provinces in China. Each point represents the estimated population count and a statistical population number at the township level. It can be seen that the relationship between the predicted populations and census populations is more linear for both WorldPop and CnPop than for the GPW or GRUMP. The WorldPop dataset has the highest correlation coefficient between the estimated and statistical values (0.906) compared to CnPop (0.772), GRUMP (0.740), and the GPW (0.499).
Table 3 shows the RMSE, MAE, and MAPE values for the estimated and demographic population counts for each dataset. Of the three indicators, WorldPop has the lowest values, followed by CnPop, GRUMP, and the GPW. The MAPE value for WorldPop (42.44%) is the smallest and is marginally smaller than that for CnPop (42.77%). This suggests that WorldPop is more accurate than CnPop, GPW, and GRUMP. However, the estimation accuracy of CnPop is close to that of WorldPop and better than that of GRUMP and the GPW. Because GRUMP distributes large populations across major urban areas and then uses areal weighting to allocate the remainder of the population to rural regions, while the GPW uniformly distributes the population across each county level administrative unit, the estimation accuracy of GRUMP is better than the GPW. It is noteworthy that the difference between the RMSE and MAE values for all four datasets was significant, which suggests that the variances in the individual errors were large and had the same various trends shown by the MAPE.
3.3. Mapping and Analysis of Relative Estimation Error
The spatial distributions of the relative estimation errors (REEs) for the four population datasets are shown in Figure 5. In all four sub-figures, it can be seen that there are several red and blue areas on the Qinghai-Tibet and Inner Mongolian Plateaus, indicating that the population distribution datasets are greatly overestimated or underestimated in these areas. In Figure 5a, green patches corresponding to the accurately estimated township units dominate the entire map, which suggests that CnPop has a good accuracy. Non-green spatial units mainly appear in regions with complex terrains, such as the Hengduan Mountains, Qinling Mountains, northern farming-pastoral ecotone, the karst mountain areas, and the hilly areas, indicating that CnPop’s modeling strategy does not simulate population distribution patterns well in these areas. In Figure 5b, more than half of the entire map area is not green, while small green patches are discretely located in large plain areas, such as the Huang-Huai-Hai region, the Jianghan Plain, and the middle and lower reaches of the Yangtze River. This suggests that the areal weight interpolation method has an acceptable accuracy for parts of the plain and basin areas in China. The green areas in Figure 5c clearly exceed those in Figure 5b. However, it is noteworthy that the greatly underestimated or overestimated patches in sparsely populated northern China do not decrease, suggesting that the method used to generate the GRUMP dataset does not improve the estimation accuracy of areas without intensive night-time light, such as the less-developed rural areas on the Qinghai Tibet and Inner Mongolia Plateaus, and some hilly regions. In comparison to Figure 5a–c, more green patches cover the east and south regions in Figure 5d with a remarkable advantage. Meanwhile, the coverage of red patches in the Hengduan Mountains regions in Figure 5d exceeds those in Figure 5a and is almost equivalent to those in Figure 5b. This shows that the WorldPop dataset simulates the population distribution well for the vast majority of towns in eastern and southern China; however, there is a considerably large error level in the hilly areas such as Hengduan Mountain.
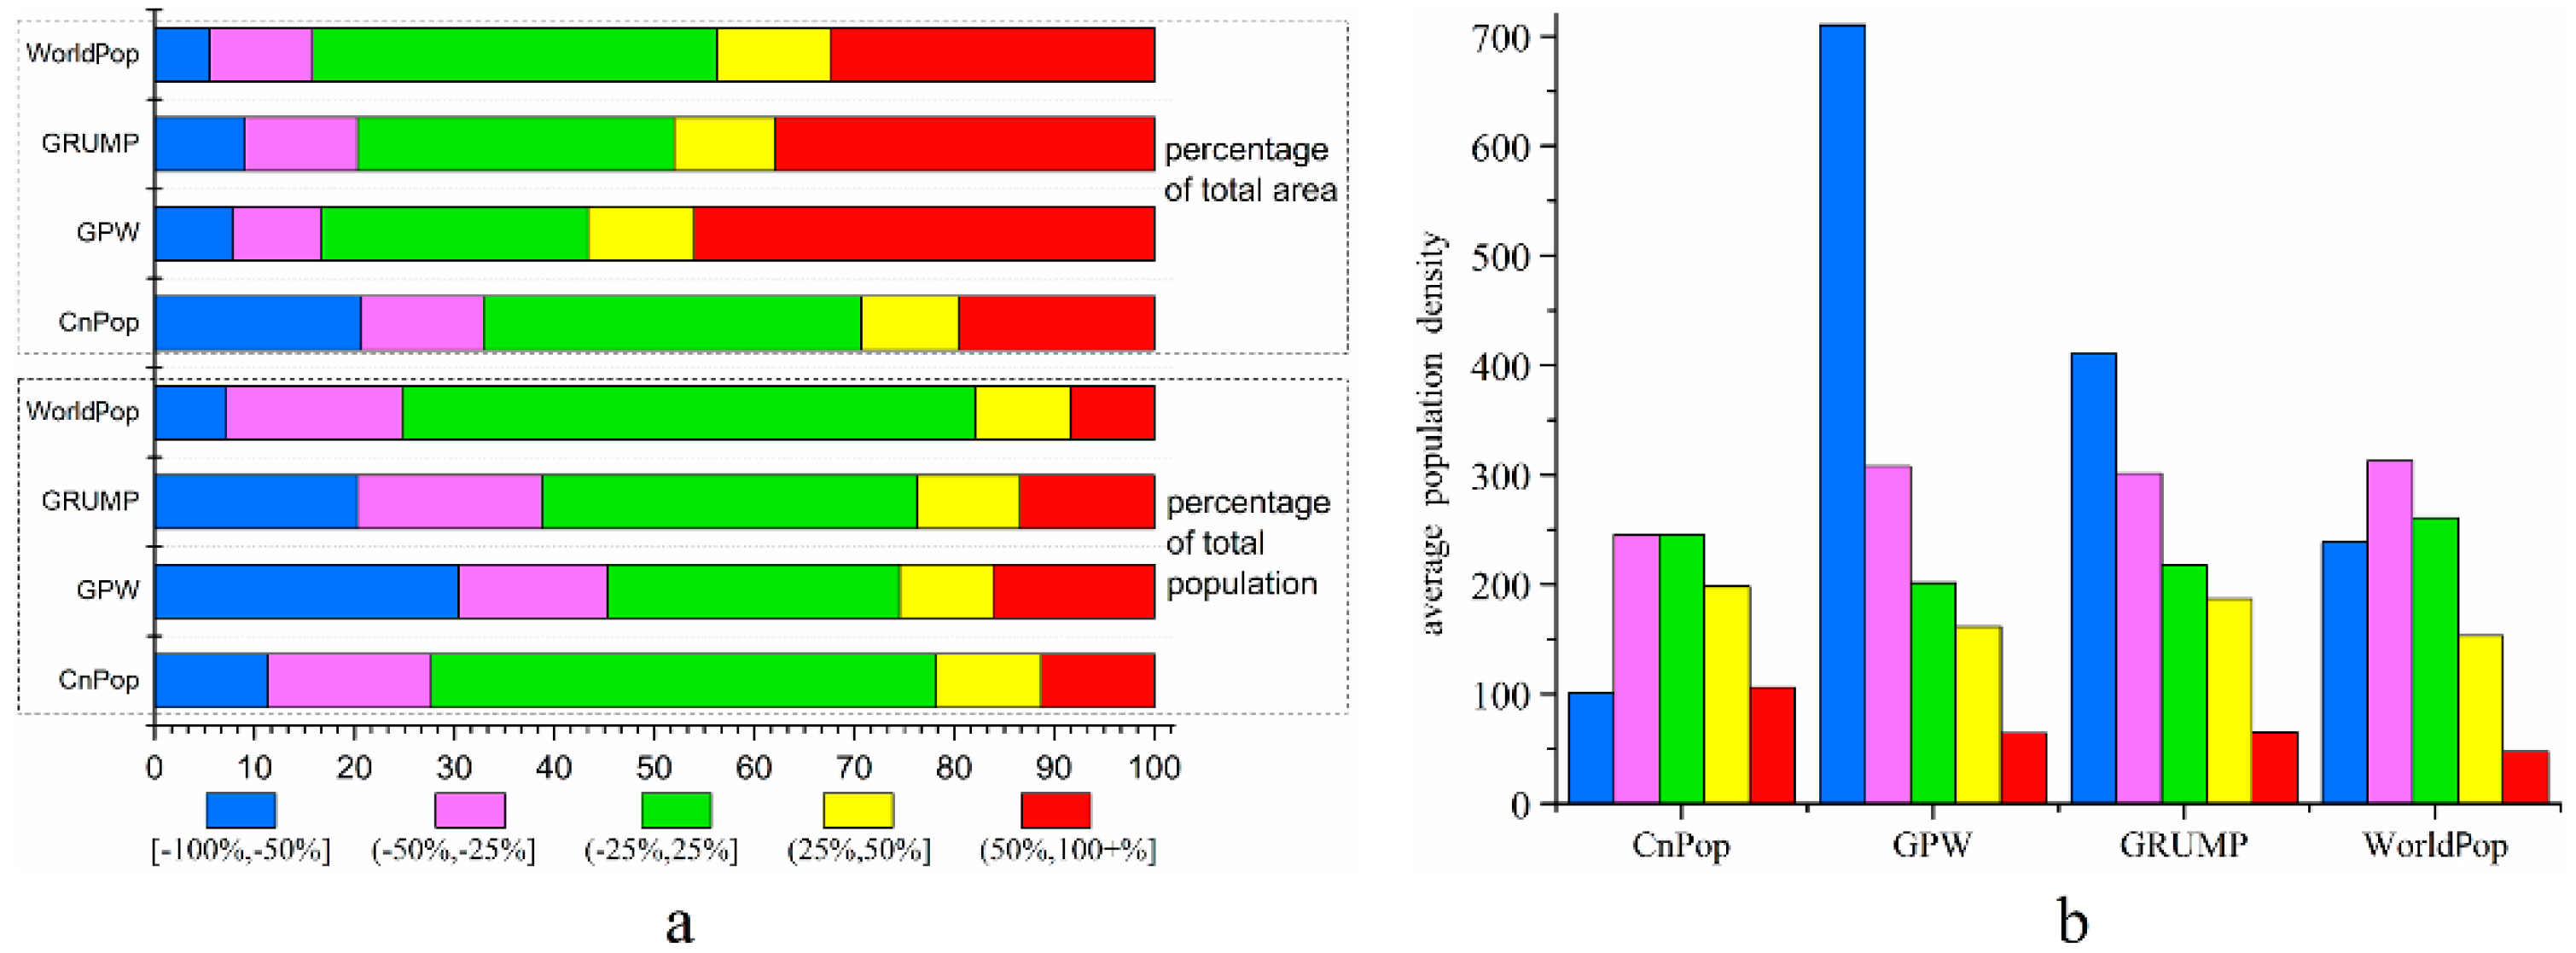
For a better understanding of the error structure of each dataset, we calculated the total population, total area, and corresponding percentages that fell within each REE range (Table 4). Figure 6a shows the percentage bar charts of the datasets in different error ranges. The REE values in the range from −25 to 25% are the township units determined to have a relatively good estimation performance. The percentages of the total population falling within this range were more than half for both CnPop (50.5%) and WorldPop (57.4%). The dominant range was the ‘accurately estimated’ category for GRUMP (37.54%) and ‘greatly underestimated’ category for the GPW (30.43%) from the perspective of total population percentage. If we divided the REE values into three simpler ranges, that is, accurately estimated (from −25 to 25%), underestimated or overestimated (from −50 to −25% or from 25 to 50%), and greatly underestimated or overestimated (≥50% or ≤−50%), the percentages of the total population that fell within the three ranges were, respectively, 50.5%, 26.85%, and 22.65% for CnPop; 29.23%, 24.25%, and 46.52% for the GPW; 37.54%, 28.78%, and 33.58% for GRUMP; and 57.4%, 27.04%, and 15.56% for WorldPop. This shows that a majority of townships in the CnPop, GRUMP, and WorldPop datasets fell within the accurately estimated category, while most townships in the GPW dataset were in the greatly underestimated or greatly overestimated category. The second majority of townships in the CnPop and WorldPop datasets fell within the underestimated or overestimated category, while that for the GRUMP dataset was in the greatly underestimated or greatly overestimated category. The percentage of town populations that fell within the greatly underestimated or greatly overestimated category in the WorldPop datasets was 15.56%, which was the smallest value of the four datasets.
Since China’s population is unevenly distributed, the total area and population for each REE range in the four datasets is not proportional. The WorldPop dataset accurately estimated the population distribution for 40.37% of the total area, while the corresponding values for CnPop, GPW, and GRUMP were 37.81%, 26.63%, and 31.67%. The total area of the greatly underestimated or overestimated townships accounted for more than one-third of the four datasets. In summary, the WorldPop dataset was the most accurate among the four datasets. Both WorldPop and CnPop provided a good estimation accuracy for more than half of the 33,631 townships, although they exhibited a low accuracy in the sparsely populated areas, which accounted for approximately 40% of the total area. The GPW’s estimation accuracy was barely satisfactory in most townships and was substantially improved by GRUMP, which increased the number of accurately estimated townships and decreased the number of greatly underestimated or overestimated townships.
To identify the unbalanced distribution pattern of the REE, the average population density of each REE range for the four datasets was calculated as i, shown in Figure 6b. For CnPop, the average population density was significantly lower in the greatly overestimated or underestimated ranges, indicating that the land use/land cover model failed to redistribute the population well in sparsely populated areas. The values of the underestimated and accurately estimated ranges were approximately the same, which shows that the heterogeneity discernibility of CnPop needs to be improved in densely populated areas. The values that corresponded to the GPW sharply decreased from the greatly underestimated range to the greatly overestimated range, suggesting that the areal weighting interpolation method cannot redistribute the population well since the average density of the administrative units can significantly magnify the population density of sparsely populated areas and suppress that of densely populated ones. In comparison to the GPW, the average population density of the greatly underestimated units of GRUMP decreased by half and those of both underestimated and greatly overestimated marginally increased, illustrating that auxiliary data such as night-time light images could discriminate some populated areas, but a few populated areas remained unidentified because the average population density of the greatly underestimated units was still relatively high. The average population density of the greatly overestimated ranges was the smallest for the WorldPop dataset, showing that this dataset greatly overestimated the population distribution over a wide range of sparsely populated areas. Meanwhile, the average population density of the underestimated, accurately estimated, and overestimated ranges progressively decreased, illustrating that the fixed estimated population densities of different land cover types could not exactly conform to the real population distribution across China. An interesting observation was that the values of the accurately estimated ranges for the four datasets were about 200–260 people per km2, which suggests that the areas within this population density value range are easy to characterize with a high accuracy.
4. Discussion
The accuracy assessment and comparisons above illustrate that the simple areal weighting method used to generate the GPW and GRUMP can lead to serious estimation errors in the Chinese context, while the modeling strategy based on land use/land cover, which was utilized to produce CnPop and WorldPop, is precise across most areas in southeastern China but leads to obvious estimation errors across northwestern China. As mentioned above, these errors are not only caused by the generation methods but also fundamentally created by the complexity of the population distribution in China. The four datasets failed to accurately characterize the spatial pattern of the population distribution in the less-developed northern and western China, including the Qinghai-Tibet and Inner Mongolia Plateaus, as well as the hilly area, karst region, and farming-pastoral ecotone. We speculate that there are three main causes for this. First, because farmland and rural settlements with small areas are sparsely dispersed across these areas, they are too difficult to extract information from and include in the land use or land cover data, leading to the uncertain distribution of the corresponding population [35]. Second, the assumption that the population density per land use type or a county is a fixed value is too coarse to reflect the heterogeneity of a real population distribution [7]. A few studies have demonstrated that zoning before modeling and multi-source data fusion can effectively enhance the modeling accuracy in these regions. The former involves dividing the research area into several sub-regions in line with natural and cultural features using a zoning or clustering algorithm initially and then constructing a prediction model for each sub-region. For example, Zeng et al. divided mainland China into eight zones using night-time light image clustering and the shortest path algorithm and markedly improved the modeling performance [8]. Zhuo et al. classified Chinese counties into four types on the basis of their night-light characteristics and modeled the population distribution both inside and outside of light patches using regression and Coulomb’s Law model. In the Coulomb’s Law model, the distribution of China’s population is treated as a ‘field’ analogous to an electric field. In this ‘field’, urban centres, where the population and socioeconomic activities are highly concentrated, have impacts on the surrounding regions in the same way that point charges exert an influence on any charged objects around them. Based on Coulomb’s Law, this paper assumed that the magnitude of the impact (i.e., the force of attraction related to the population distribution) of an urban centre imposed on a given point equals TDN/r2, where TDN represents the total digital number and r represents the distance from the urban centre [19]. The latter refers to the advantage of using multi-source environmental and geographical factors such as land use, topography, rural settlement points, traffic network, and water system data to establish a data fusion model to simulate the population distribution. For example, Dong et al. confirmed that elevation, slope, and aspect strongly influence the population distribution in Guizhou province, which is one of China’s major karst areas [36]. Liao et al. accurately transformed the population on the Qinghai-Tibet Plateau into a grid format with a spatial resolution of 1km using a multi-data fusion approach based on elevation, village settlement, traffic network, land use, and water system [37]. Third, a problem worth pointing out is that the ecological environment of these inaccurately estimated regions is fragile and responds sensitively to climate change and human activities [38,39]. For example, several infectious diseases such as the plague and tick-borne encephalitis primarily existed and spread in these regions [40,41].
The characterization year of both the four gridded population datasets being evaluated and the spatial population dataset at the township level used for assessment in this study is 2000. Despite the successive publication of several gridded population distribution datasets for China in 2010 and 2015, this study’s assessment and comparison work for 2000 retains its unique characteristics. First, since this study is the first to systematically and comprehensively evaluate the estimation accuracy of CnPop, GPW, GRUMP, and WorldPop using a wide range of spatial population datasets at the township level in China, the conclusions could deepen our spatial understanding of the four gridded datasets and provide a clear quality reference for choosing suitable datasets for related environment and resource research pertinent to 2000. Second, six nationwide censuses have been conducted in China since 1949. Of these, the fifth census in 2000 was the first to release statistical population data at the township level, while the previous four censuses only offered statistical datasets at the county level. Despite the improvement in the resolution of statistical data, the corresponding vector boundary data on the township scale are still difficult to access owing to policy restrictions and expenses, indicating that fine-scale population geography research in China has remained inadequate over the past decades. The pioneering attempt of this study, which constructed a GIS-linked 2000 census dataset at the township level covering 27 provinces, can serve as a basic and updatable dataset for fine-scale population geography research in China [42].
5. Conclusions
This study performed estimation accuracy assessments and a comparison of CnPop, GPW, GRUMP, and WorldPop over 27 provinces in China, using boundary and census data at the township level. The results showed that the estimation accuracy, error structure, and mapping performance of these four gridded population datasets varied within each dataset and between different datasets. WorldPop had the highest estimation accuracy with 60% of the population classified under the accurately estimated category. Second was CnPop, which accurately simulated the distribution of half of the population; it also showed the best mapping performance. The GPW had the lowest estimation accuracy and worst mapping performance because it only had an acceptable estimation accuracy in some plain and basin areas. The estimated accuracy and mapping performance of GRUMP were significantly better than those of the GPW because it had a higher percentage in the accurately estimated category and a lower percentage in the greatly underestimated or overestimated category. However, all four datasets failed to characterize the population distribution in northwestern China, mainly on the Qinghai-Tibet and Inner Mongolia Plateaus. In addition, there were relatively large estimation errors in regions with complex terrains such as the hilly area, karst region, and farming-pastoral ecotone in the four gridded datasets.
Thus, future work should focus on updating and constructing time-series boundary and census datasets at the township level for China in 2000 and 2010. Utilizing fine-scale geospatial population data, two sequential gridded population datasets will be produced with a high spatial resolution on the basis of the areal weighting method and data fusion method using accessibility and night-time light data. Finally, village-level boundary and demographic data are expected to be collected for the sake of calibration and validation.
Author Contributions
Juanle Wang was responsible for the research design and analysis. Zhongqiang Bai drafted the manuscript and was responsible for the data preparation, experiment, and analysis. Mingming Wang and Mengxu Gao were responsible for the data processing and archiving. Jiulin Sun guided the manuscript. All of the authors contributed to editing and reviewing the manuscript.
Funding
This study was funded by the Strategic Priority Research Program of the Chinese Academy of Sciences (XDA19040501), the National Natural Science Foundation of China (41421001), the Specific Informatization Scientific Research Science Program of the Chinese Academy of Sciences (XXH13505-07), and the Science & Technology Basic Research Program of China (2013FY114600 and 2011FY110400).
Acknowledgments
We are grateful to the data providers including the National Data Sharing Platform of Earth System Science in China, the National Bureau of Statistics in China, the Socioeconomic Data and Application Center in the United States, and the WorldPop project hosted by the GeoData Institute of the University of Southampton. We express our grateful appreciation to Yanguang Chen and the anonymous reviewers for their suggestions and comments on this article.
Conflicts of Interest
The authors declare no conflict of interest.
References
- Lee, R. The outlook for population growth. Science 1946, 333, 1–3. [Google Scholar] [CrossRef] [PubMed]
- United Nations, Department of Economic and Social Affairs, Population Division. World Population Prospects: The 2017 Revision, Key Findings and Advance Tables. ESA/P/WP/248. 2017. Available online: https://esa.un.org/unpd/wpp/Publications/Files/WPP2017_KeyFindings.pdf (accessed on 28 January 2018).
- Hay, S.I.; Guerra, C.A.; Gething, P.W.; Patil, A.P.; Tatem, A.J.; Noor, A.M.; Kabaria, C.W.; Manh, B.H.; Elyazar, I.R.; Brooker, S.; et al. A world malaria map: Plasmodium falciparum endemicity in 2007. PLoS Med. 2009, 6, e1000048. [Google Scholar] [CrossRef]
- Fang, J.; Sun, S.; Shi, P.; Wang, J. Assessment and Mapping of Potential Storm Surge Impacts on Global Population and Economy. Int. J. Disaster Risk Sci. 2014, 5, 323–331. [Google Scholar] [CrossRef]
- Chen, M.; Li, Y.; Gong, Y.; Lu, D.; Zhang, H. The population distribution and trend of urbanization pattern on two sides of Hu Huanyong population line: A tentative response to Premier Li Keqiang. Acta Geogr. Sin. 2016, 71, 179–193. [Google Scholar] [CrossRef]
- Wu, X.; Yang, J.; Zhang, H. Analyzing Spatial Autocorrelation of Population Distribution in Different Spatial Weights: A Case of China. Geomat. World 2017, 24, 32–38. [Google Scholar]
- Briggs, D.J.; Gulliver, J.; Fecht, D.; Vienneau, D.M. Dasymetric modelling of small-area population distribution using land cover and light emissions data. Remote Sens. Environ. 2007, 108, 451–466. [Google Scholar] [CrossRef]
- Zeng, C.; Zhou, Y.; Wang, S.; Yan, F.; Zhao, Q. Population spatialization in China based on night-time imagery and land use data. Int. J. Remote Sens. 2011, 32, 9599–9620. [Google Scholar] [CrossRef]
- Patel, N.N.; Stevens, F.R.; Huang, Z.; Gaughan, A.E.; Elyazar, I.; Tatem, A.J. Improving Large Area Population Mapping Using Geotweet Densities. Trans GIS 2017, 21, 317–331. [Google Scholar] [CrossRef] [PubMed]
- Deichmann, U.; Balk, D.; Yetman, G. Transforming Population Data for Interdisciplinary Usages: From Census to Grid. In Population Health Metrics-Popul Health Metrics; Center for International Earth Science Information Network: Washington, DC, USA, 2001. [Google Scholar]
- Balk, D.L.; Deichmann, U.; Yetman, G.; Pozzi, F.; Hay, S.I.; Nelson, A. Determining global population distribution: Methods, applications and data. Adv. Parasitol. 2006, 62, 119–156. [Google Scholar] [CrossRef] [PubMed]
- Dobson, J.E.; Bright, E.A.; Coleman, P.R.; Durfee, R.C.; Worley, B.A. LandScan: A Global Population Database for Estimating Populations at Risk. Photogramm. Eng. Remote Sens. 2000, 66, 849–857. [Google Scholar]
- Nelson, A. African Population Database Documentation. Available online: https://na.unep.net/siouxfalls/globalpop/africa/Africa_index.html (accessed on 28 January 2018).
- Deichmann, U. A Review of Spatial Population Database Design and Modeling. In Gis Proceedings of ACM International Symposium on Advances in Geographic Information Systems; National Center for Geographic Information and Analysis (NCGIA), University of California: Santa Barbara, CA, USA, 1996; pp. 47–52. [Google Scholar]
- Linard, C.; Alegana, V.A.; Noor, A.M.; Snow, R.W.; Tatem, A.J. A high resolution spatial population database of Somalia for disease risk mapping. Int. J. Health Geogr. 2010, 9, 45. [Google Scholar] [CrossRef] [PubMed]
- Linard, C.; Tatem, A.J. Large-scale spatial population databases in infectious disease research. Int. J. Health Geogr. 2012, 11, 7. [Google Scholar] [CrossRef] [PubMed]
- Stevens, F.R.; Gaughan, A.E.; Linard, C.; Tatem, A.J. Disaggregating Census Data for Population Mapping Using Random Forests with Remotely-Sensed and Ancillary Data. PLoS ONE 2015, 10, e0107042. [Google Scholar] [CrossRef] [PubMed]
- Jiang, D.; Yang, X.; Wang, N.; Liu, H. Study on spatial distribution of population based on remote sensing and GIS. Adv. Earth Sci. 2002, 17, 734–738. [Google Scholar]
- Zhuo, L.; Ichinose, T.; Zheng, J.; Chen, J.; Shi, P.J.; Li, X. Modelling the population density of China at the pixel level based on DMSP/OLS non-radiance-calibrated night-time light images. Int. J. Remote Sens. 2009, 30, 1003–1018. [Google Scholar] [CrossRef]
- Bhaduri, B.; Bright, E.; Coleman, P.; Dobson, J. LandScan: Locating people is what matters. Geoinfomatics 2002, 5, 34–37. [Google Scholar]
- Hay, S.I.; Noor, A.M.; Nelson, A.; Tatem, A.J. The accuracy of human population maps for public health application. Trop. Med. Int. Health 2005, 10, 1073–1086. [Google Scholar] [CrossRef] [PubMed]
- Ferguson, N.M.; Cummings, D.; Cauchemez, S.; Fraser, C.; Riley, S.; Meeyai, A.; Iamsirithaworn, S.; Burke, D. Strategies for containing an emerging influenza pandemic in Southeast Asia. Nature 2005, 437, 209–214. [Google Scholar] [CrossRef] [PubMed] [Green Version]
- Guerra, C.A.; Snow, R.W.; Hay, S.I. Defining the Global Spatial Limits of Malaria Transmission in 2005. Adv. Parasitol. 2006, 62, 157–179. [Google Scholar] [CrossRef] [PubMed]
- Rogers, D.J.; Wilson, A.J.; Hay, S.I.; Graham, A.J. The Global Distribution of Yellow Fever and Dengue. Adv. Parasitol. 2006, 62, 181–220. [Google Scholar] [CrossRef] [PubMed]
- Rao, D.M.; Chernyakhovsky, A.; Rao, V. Modeling and analysis of global epidemiology of avian influenza. Environ. Model. Softw. 2009, 24, 124–134. [Google Scholar] [CrossRef]
- Storeygard, A.; Balk, D.; Levy, M.; Deane, G. The Global Distribution of Infant Mortality: A subnational spatial view. Popul. Space Place 2008, 14, 209–229. [Google Scholar] [CrossRef] [PubMed]
- Balk, D.; Storeygard, A.; Levy, M.; Gaskell, J.; Sharma, M.; Flor, R. Child hunger in the developing world: An analysis of environmental and social correlates. Food Policy 2005, 30, 584–611. [Google Scholar] [CrossRef]
- Mcgranahan, G.; Balk, D.; Anderson, B. The rising tide: Assessing the risks of climate change and human settlements in low elevation coastal zones. Environ. Urban. 2007, 19, 17–37. [Google Scholar] [CrossRef]
- Mondal, P.; Tatem, A.J. Uncertainties in Measuring Populations Potentially Impacted by Sea Level Rise and Coastal Flooding. PLoS ONE 2012, 7, e48191. [Google Scholar] [CrossRef] [PubMed]
- Hall, O.; Stroh, E.; Paya, F. From Census to Grids: Comparing Gridded Population of the World with Swedish Census Records. Open Geogr. J. 2012, 5, 1–5. [Google Scholar] [CrossRef]
- Tatem, A.J.; Campiz, N.; Gething, P.W.; Snow, R.W.; Linard, G. The effects of spatial population dataset choice on estimates of population at risk of disease. Popul. Health Metr. 2011, 9, 4. [Google Scholar] [CrossRef] [PubMed]
- Wang, X.; Li, X.; Ma, M. Advance and Case Analysis in Population Spatial Distribution Based on Remote Sensing and GIS. Remote Sens. Technol. Appl. 2004, 19, 320–327. [Google Scholar]
- Gaughan, A.E.; Stevens, F.R.; Linard, C.; Jia, P.; Tatem, A.J. High Resolution Population Distribution Maps for Southeast Asia in 2010 and 2015. PLoS ONE 2013, 8, e55882. [Google Scholar] [CrossRef] [PubMed]
- Tatem, A.J.; Noor, A.M.; von Hagen, C.; Gregorio, A.D.; Hay, S.I. High resolution population maps for low income nations: Combining land cover and census in East Africa. PLoS ONE 2007, 2, e1298. [Google Scholar] [CrossRef] [PubMed]
- Long, H.; Li, Y.; Liu, Y.; Woods, M.; Zou, J. Accelerated restructuring in rural China fueled by ‘increasing vs. decreasing balance’ land-use policy for dealing with hollowed villages. Land Use Policy 2012, 29, 11–22. [Google Scholar] [CrossRef]
- Dong, C.; Liu, J.; Zhao, R.; Wang, G. An discussion on correlation of geographical parameter with spatial population distribution. Remote Sens. Inf. 2002, 4, 61–64. [Google Scholar]
- Liao, S.; Sun, J. GIS based spatialization of population census data in Qinghai-Tibet Plateau. Acta Geogr. Sin. 2003, 58, 25–33. [Google Scholar]
- Wang, G.; Bai, W.; Li, N.; Hu, H. Climate changes and its impact on tundra ecosystem in Qinghai-Tibet Plateau, China. Clim. Chang. 2011, 106, 463–482. [Google Scholar] [CrossRef]
- Jiao, J.; Zhang, Z.; Bai, W.; Jia, Y.; Wang, N. Assessing the Ecological Success of Restoration by Afforestation on the Chinese Loess Plateau. Restor. Ecol. 2012, 20, 240–249. [Google Scholar] [CrossRef]
- Xing-Yuan, M.; Xian-Guo, G.; Wen-Ge, D.; Ai-Qin, N.; Ti-Jun, Q.; Dian, W. Ectoparasites of Chevrier’s field mouse, Apodemus chevrieri, in a focus of plague in southwest China. Med. Vet. Entomol. 2010, 21, 297–300. [Google Scholar] [CrossRef]
- Wang, L.; Zhang, W.; Ding, F.; Sun, H.; Yu, S.; Li, S.; Chen, Z.; Huang, L.; Li, C. Deaths associated with Japanese encephalitis, China, 2005–2010. Clin. Infect. Dis. 2013, 56, 752–752. [Google Scholar] [CrossRef] [PubMed]
- Bai, Z.; Wang, J.; Yang, Y.; Sun, J. Characterizing spatial patterns of population distribution at township level across the 25 provinces in China. Acta Geogr. Sin. 2015, 70, 1229–1242. [Google Scholar] [CrossRef]
Figure 1.
Township-level boundaries across 27 provinces in China.
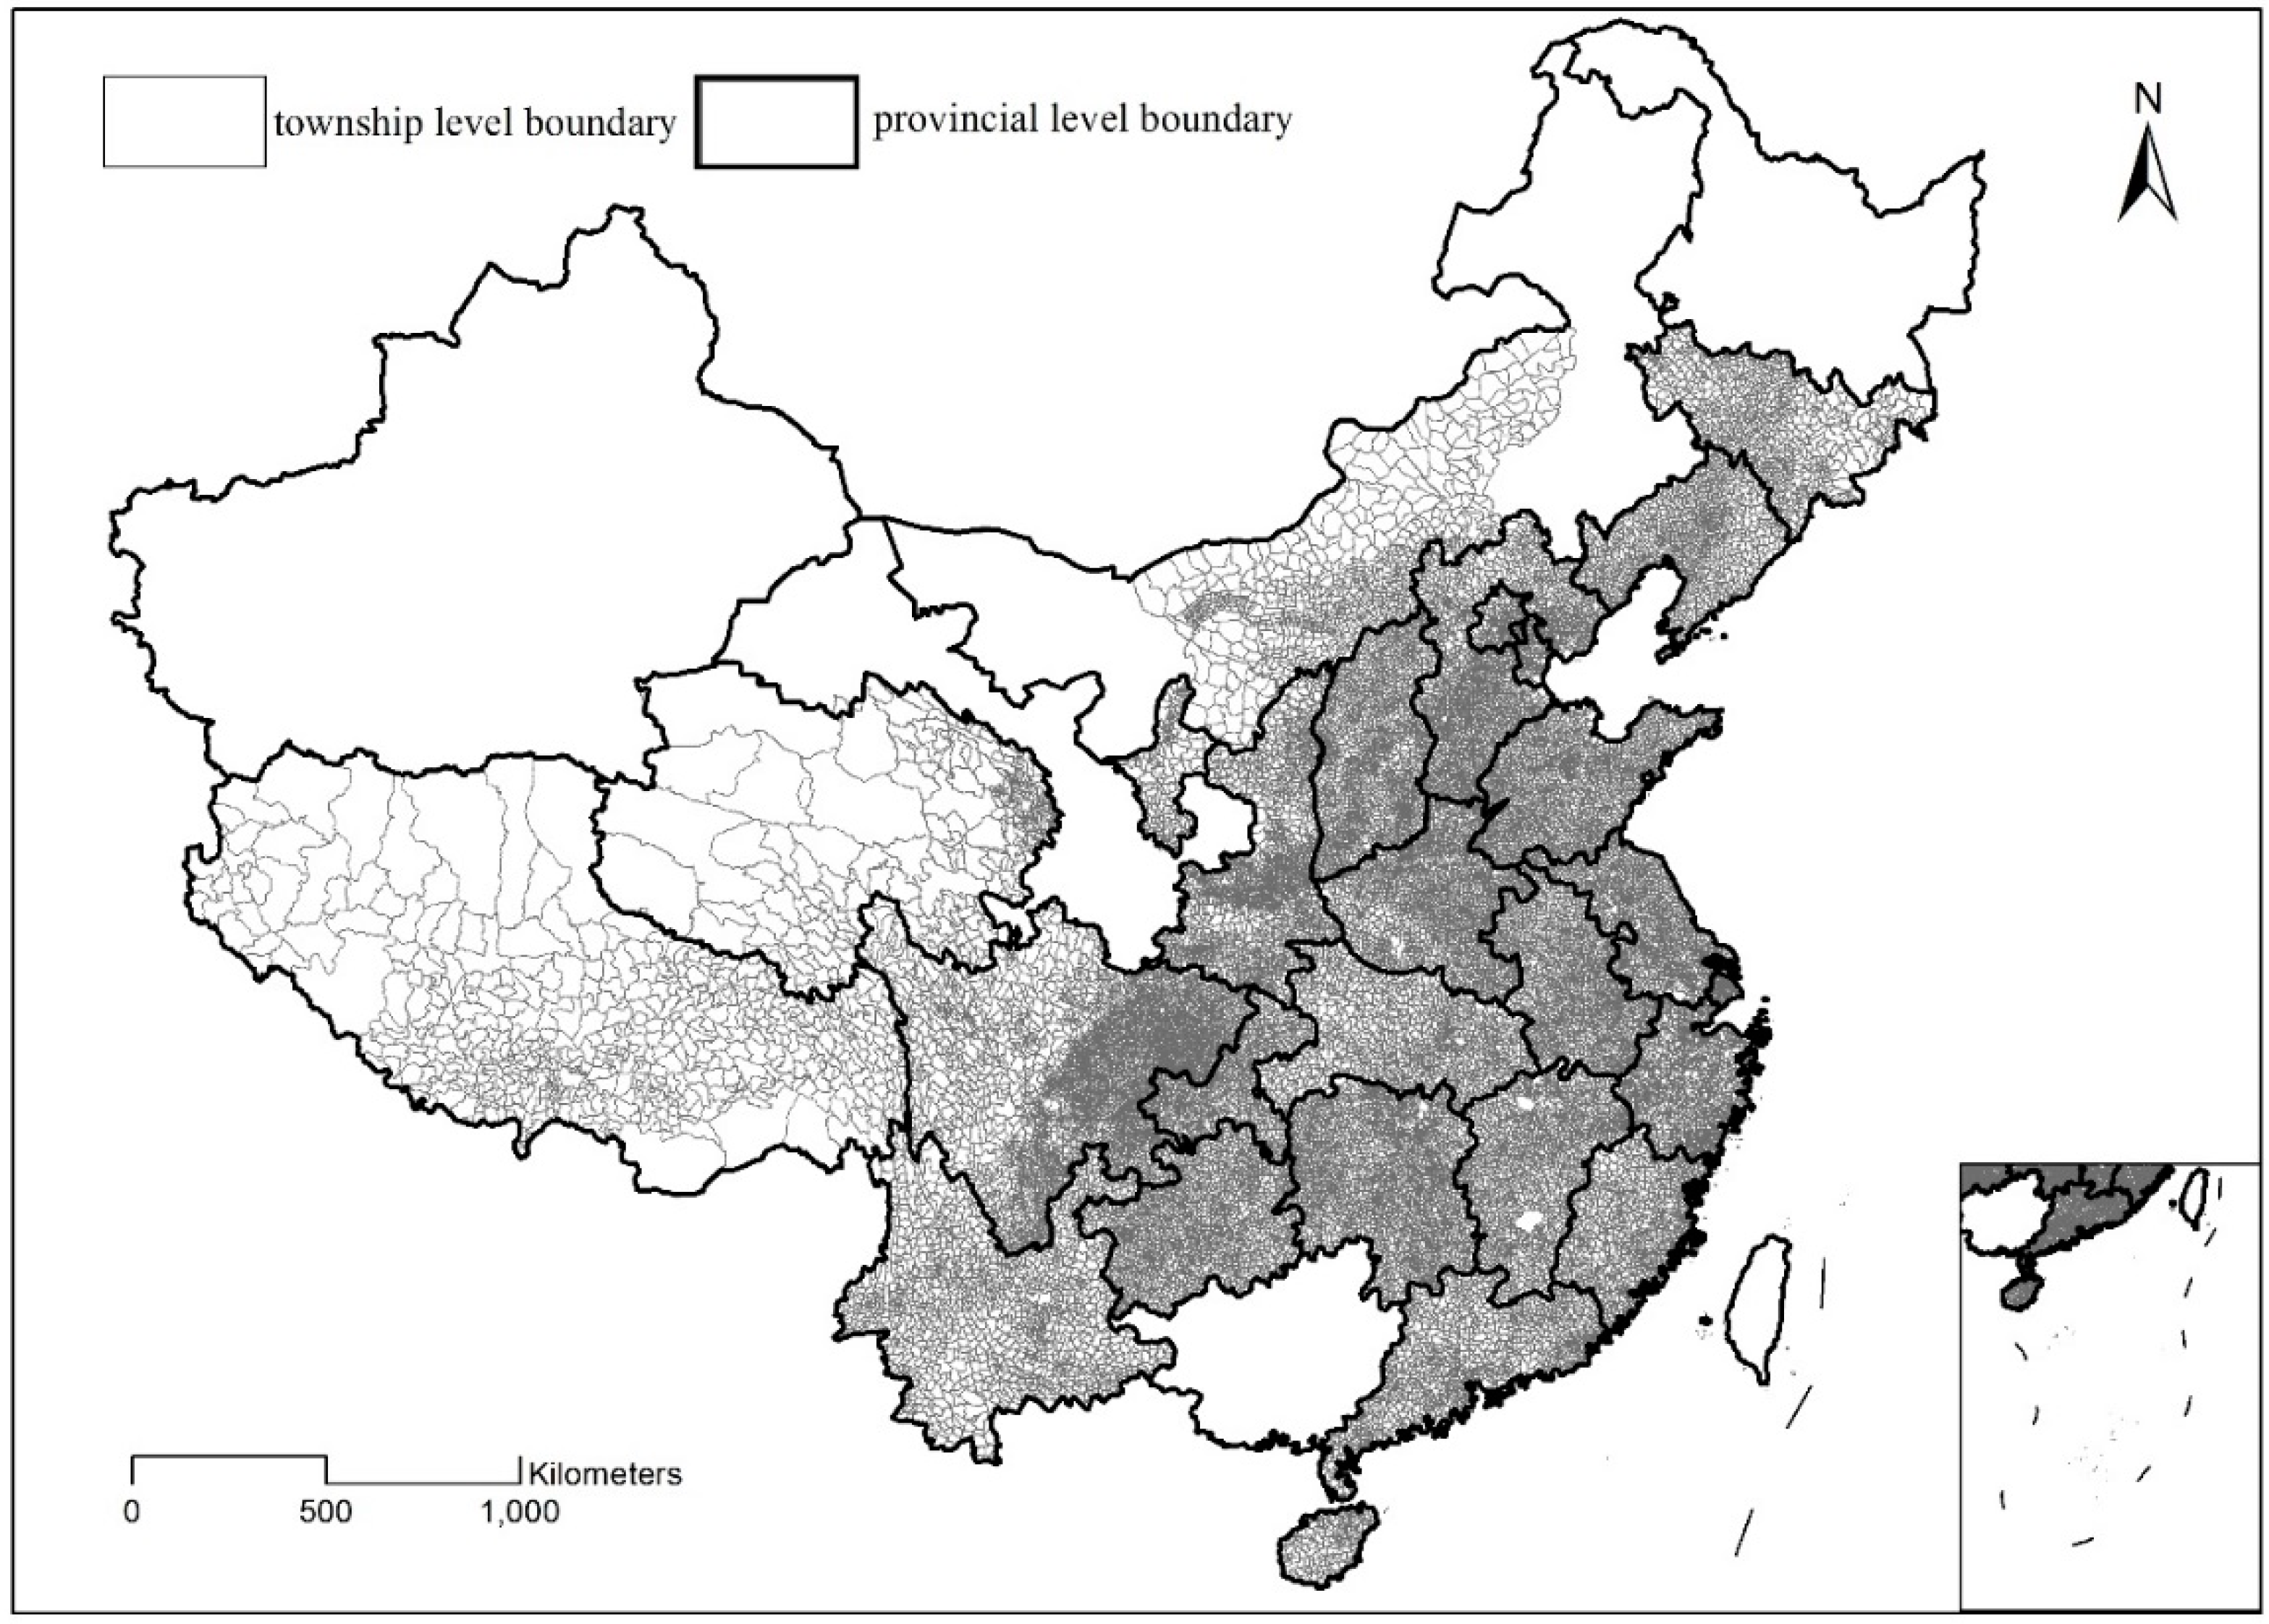
Figure 2.
Averaged population density map at the township level for 27 provinces in China.
Figure 3.
Four gridded population distribution maps for China: (a) CnPop; (b) GPW; (c) GRUMP; and (d) WorldPop.
Figure 3.
Four gridded population distribution maps for China: (a) CnPop; (b) GPW; (c) GRUMP; and (d) WorldPop.

Figure 4.
Scatter plots of estimated population based on the gridded population datasets and statistical population at the township level (2000). Data are shown for (a) CnPop; (b) GPW; (c) GRUMP; and (d) WorldPop.
Figure 4.
Scatter plots of estimated population based on the gridded population datasets and statistical population at the township level (2000). Data are shown for (a) CnPop; (b) GPW; (c) GRUMP; and (d) WorldPop.

Figure 5.
Spatial distribution of relative estimation error for (a) CnPop; (b) GPW; (c) GRUMP; and (d) WorldPop.
Figure 5.
Spatial distribution of relative estimation error for (a) CnPop; (b) GPW; (c) GRUMP; and (d) WorldPop.
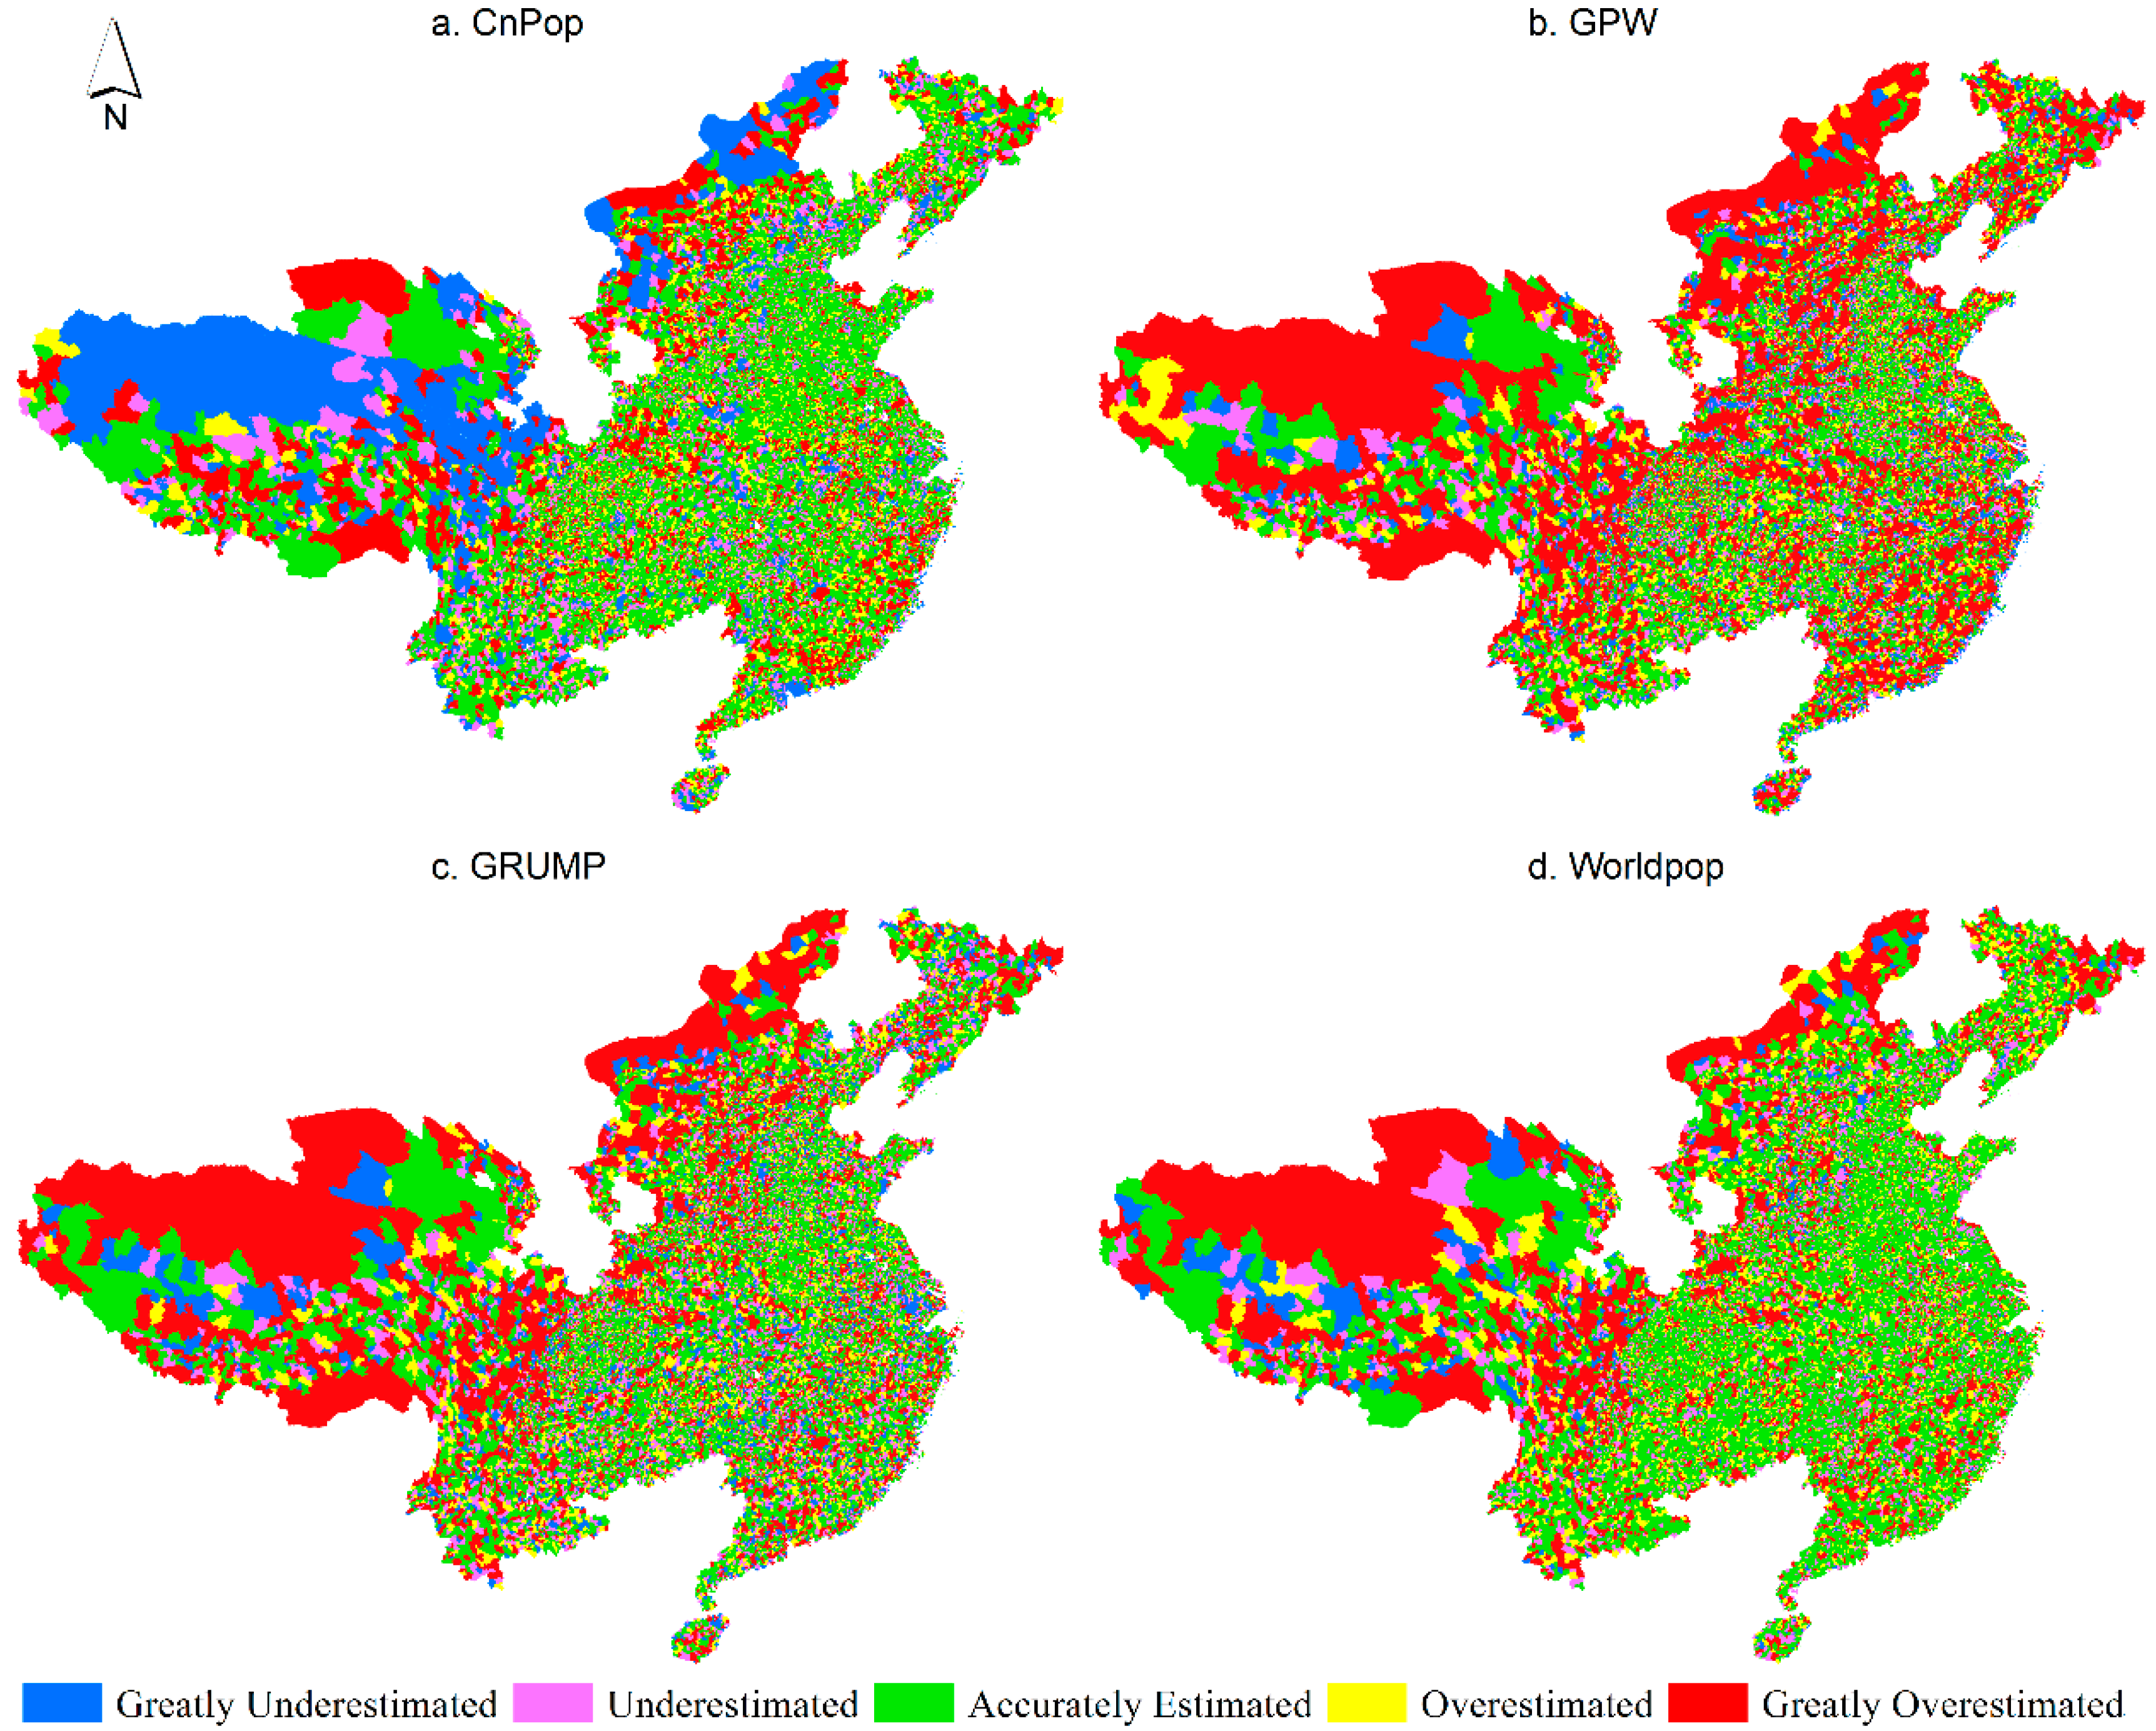
Figure 6.
Characteristics of relative estimation error for the four datasets, (a) percentages of the total population and total area in different error ranges for CnPop, GPW, GRUMP and WorldPop; (b) average population density of CnPop, GPW, GRUMP, and WorldPop in each REE range.
Figure 6.
Characteristics of relative estimation error for the four datasets, (a) percentages of the total population and total area in different error ranges for CnPop, GPW, GRUMP and WorldPop; (b) average population density of CnPop, GPW, GRUMP, and WorldPop in each REE range.


Table 1.
The four gridded population distribution datasets and their characteristics.
| Dataset | CnPop | GPWv3 | GRUMPv1 | WorldPop vα |
|---|---|---|---|---|
| Publication year | 2002 | 2005 | 2011 | 2013 |
| Years of estimation | 2000 | 1990, 1995, 2000 | 1990, 1995, 2000 | 2000, 2010 |
| Number of input units in China | 2869 | 2370 | 2370 | Unknown |
| Chinese population in 2000 | 1,265,830,000 | 1,275,130,000 | 1,275,130,000 | 1,269,975,000 |
| Demographic data source | China 5th Census | United Nations | United Nations | National Bureau of Statistics, China |
| Time of survey | 1 November 2000 | 1 July 2000 | 1 July 2000 | 1 July 2000 |
| Modeled inputs | Land use | None | Urban areas | Land cover, settlement |
| Spatial extent | Chinese mainland | Global | Global | Asia |
| Authors | RESDC, CAS, China | CIESIN & CIAT | CIESIN & IFPRI & World Bank & CIAT | Andrea E. Gaughan et al. |
| Gridded surface resolutions | 1 km | 2.5′ (~5 km) | 30″ (~1 km) | 3″ (~100 m) |
Table 2.
Classification standard for REE.
| Value Range | Category | Abbreviation |
|---|---|---|
| [−100%, −50%] | greatly underestimated | GU |
| (−50%, −25%] | underestimated | U |
| (−25%, 25%] | accurately estimated | AE |
| (25%, 50%] | overestimated | O |
| (50%, 100+%] | greatly overestimated | GO |
Table 3.
Accuracy assessment results for CnPop, GPW, GRUMP, and WorldPop.
| RMSE | MAE | MAPE (%) | R | |
|---|---|---|---|---|
| CnPop | 37,990.16 | 12,264.92 | 42.77 | 0.772 |
| GPW | 61,606.62 | 19,925.40 | 85.93 | 0.499 |
| GRUMP | 41,447.49 | 15,402.66 | 60.96 | 0.740 |
| WorldPop | 24,262.21 | 9853.00 | 42.44 | 0.906 |
Table 4.
Error analyses of CnPop, GPW, GRUMP, and WorldPop.
| REE Value Range | [−100%, −50%] | (−50%, −25%] | (−25%, 25%] | (25%, 50%] | (50%, 100+%] | |
|---|---|---|---|---|---|---|
| CnPop | Total population (people) | 125,509,487 | 179,923,286 | 557,420,811 | 116,418,616 | 124,608,720 |
| Percentage of total population (%) | 11.37 | 16.30 | 50.50 | 10.55 | 11.28 | |
| Total area (km2) | 1,245,388.12 | 734,952.73 | 2,275,487.36 | 587,808.42 | 1,174,534.8 | |
| Percentage of total area (%) | 20.69 | 12.21 | 37.81 | 9.77 | 19.52 | |
| Average population density (people/km2) | 100.78 | 244.82 | 244.97 | 198.06 | 106.09 | |
| GPW | Total population (people) | 335,862,720 | 164,011,060 | 322,615,055 | 103,708,031 | 177,684,054 |
| Percentage of total population (%) | 30.43 | 14.86 | 29.23 | 9.39 | 16.09 | |
| Total area (km2) | 472,853.9 | 532,821.3 | 1,602,648.4 | 642,171.13 | 2,767,676.7 | |
| Percentage of total area (%) | 7.86 | 8.85 | 26.63 | 10.67 | 45.99 | |
| Average population density (people/2) | 710.29 | 307.82 | 201.3 | 161.5 | 64.2 | |
| GRUMP | Total population (people) | 223,913,755 | 203,927,695 | 414,412,191 | 113,818,686 | 147,808,593 |
| Percentage of total population (%) | 20.29 | 18.47 | 37.54 | 10.31 | 13.39 | |
| Total area (km2) | 545,491.24 | 676,933.94 | 1,906,016 | 609,758.4 | 2,279,971.8 | |
| Percentage of total area (%) | 9.06 | 11.25 | 31.67 | 10.13 | 37.89 | |
| Average population density (people/2) | 410.48 | 301.25 | 217.42 | 186.66 | 64.83 | |
| WorldPop | Total population (people) | 79,459,225 | 193,561,962 | 633,672,424 | 104,920,150 | 92,267,159 |
| Percentage of total population (%) | 7.2 | 17.54 | 57.4 | 9.5 | 8.36 | |
| Total area (km2) | 333,542.24 | 619,301.2 | 2,429,326.28 | 685,434.02 | 1,950,567.73 | |
| Percentage of total area (%) | 5.54 | 10.29 | 40.37 | 11.39 | 32.41 | |
| Average population density (people/km2) | 238.23 | 312.55 | 260.84 | 153.07 | 47.3 | |
© 2018 by the authors. Licensee MDPI, Basel, Switzerland. This article is an open access article distributed under the terms and conditions of the Creative Commons Attribution (CC BY) license (http://creativecommons.org/licenses/by/4.0/).
Share and Cite
MDPI and ACS Style
Bai, Z.; Wang, J.; Wang, M.; Gao, M.; Sun, J. Accuracy Assessment of Multi-Source Gridded Population Distribution Datasets in China. Sustainability 2018, 10, 1363. https://doi.org/10.3390/su10051363
AMA Style
Bai Z, Wang J, Wang M, Gao M, Sun J. Accuracy Assessment of Multi-Source Gridded Population Distribution Datasets in China. Sustainability. 2018; 10(5):1363. https://doi.org/10.3390/su10051363
Chicago/Turabian StyleBai, Zhongqiang, Juanle Wang, Mingming Wang, Mengxu Gao, and Jiulin Sun. 2018. "Accuracy Assessment of Multi-Source Gridded Population Distribution Datasets in China" Sustainability 10, no. 5: 1363. https://doi.org/10.3390/su10051363
Note that from the first issue of 2016, this journal uses article numbers instead of page numbers. See further details here.