Article

Implementation of Cooperation for Recycling Vehicle Routing Optimization in Two-Echelon Reverse Logistics Networks

1
School of Economics and Management, Chongqing Jiaotong University, Chongqing 400074, China
2
School of Management and Economics, University of Electronic Science and Technology, Chengdu 610054, China
3
School of Civil and Construction Engineering, Oregon State University, Corvallis, OR 97330, USA
4
Department of Civil and Environmental Engineering, University of Washington, Seattle, WA 98195-2700, USA
5
Transportation Data Science Research Center, College of Transportation Engineering, Tongji University, Shanghai 201804, China
*
Authors to whom correspondence should be addressed.
Sustainability 2018, 10(5), 1358; https://doi.org/10.3390/su10051358
Submission received: 26 March 2018 / Revised: 21 April 2018 / Accepted: 24 April 2018 / Published: 27 April 2018
(This article belongs to the Section Sustainable Transportation)

Abstract

:
The formation of a cooperative alliance is an effective means of approaching the vehicle routing optimization in two-echelon reverse logistics networks. Cooperative mechanisms can contribute to avoiding the inefficient assignment of resources for the recycling logistics operations and reducing long distance transportation. With regard to the relatively low performance of waste collection, this paper proposes a three-phase methodology to properly address the corresponding vehicle routing problem on two echelons. First, a bi-objective programming model is established to minimize the total cost and the number of vehicles considering semitrailers and vehicles sharing. Furthermore, the Clarke–Wright (CW) savings method and the Non-dominated Sorting Genetic Algorithm-II (NSGA-II) are combined to design a hybrid routing optimization heuristic, which is denoted CW_NSGA-II. Routes on the first and second echelons are obtained on the basis of sub-optimal solutions provided by CW algorithm. Compared to other intelligent algorithms, CW_NSGA-II reduces the complexity of the multi-objective solutions search and mostly converges to optimality. The profit generated by cooperation among retail stores and the recycling hub in the reverse logistics network is fairly and reasonably distributed to the participants by applying the Minimum Costs-Remaining Savings (MCRS) method. Finally, an empirical study in Chengdu City, China, reveals the superiority of CW_NSGA over the multi-objective particle swarm optimization and the multi objective genetic algorithms in terms of solutions quality and convergence. Meanwhile, the comparison of MCRS method with the Shapley value model, equal profit method and cost gap allocation proves that MCRS method is more conducive to the stability of the cooperative alliance. In general, the implementation of cooperation in the optimization of the reverse logistics network effectively leads to the sustainable development of urban and sub-urban areas. Through the reasonable reorganization of the entire network, recycling companies can provide more reliable services, contribute to the reduction of environmental pollution, and guarantee significant profits. Thus, this paper provides manufacturing companies, logistics operators and local governments with tools to protect the environment, while still making profits.

1. Introduction

Owing to the diversification of customer requirements, the majority of comprehensive logistics companies usually provide both distribution and collection services. The distribution or forward logistics mainly relates to the supply and delivery of products, whereas the reverse logistics refers to the reverse flow of end-of-use and end-of-life products from the customers to the initial point for disposal or remanufacturing purposes [1]. Generally, reverse logistics is undertaken to recycle used products when the company is concerned with imminent environmental problems, or to collect goods from customers for a new distribution cycle. Under circumstances where facilities of two different echelons are included in the collection system, the entire network can be referred to as a two-echelon network [2]. For instance, the Two-Echelon Reverse Logistics Network (TERLN) can be composed of the first echelon Recycling Hubs (RHs), second-echelon Retail Stores (RS), and recycle nodes (hereafter referred to as customers). RS collect recyclable products from customers using medium size vehicles and transport them to RHs with semitrailers. RHs are in charge of recovering the collected products, proceeding to the initial treatment of the usable ones, and ensuring the connection between retailers and their respective suppliers.
In the real-world, some products are recycled by the end-users and sold to suppliers, but in many cases, the collection is carried by third-party entities on their own. A typical example is the express industry in the world which is confronted to serious problems with paper and plastic packages recycling due to end-users’ disposing manners. In fact, packages are thrown away by end-users after withdrawing their contents, and third-party recycling companies usually take the initiative to collect these containers in order to reduce waste, pollution or for economic purposes. Further, retail stores are contacted to collect end-of-use and end-of-life products from these companies. Similar cases can also be found in the recycling system of milk bottles and PET containers [3]. In this paper, end-users are not part of the TERLN, and third-party recycling companies are called customers. For operational reasons, a retail store may engage in partnership with a distant recycling hub despite the existence of a closer one, and customers may require services from a distant retailer prior to the establishment of a surrounding RS. Resulting products transportation over long distances imposes severe burdens on local governments and companies with regard to the complexity and environmental impacts the complex network. As a consequence, authorities through laws and advertisements strongly encourage companies to collaborate and implement more sustainable approaches to alleviate urban transportation complexity.
Cooperation mechanism is an effective strategy to achieve logistics network optimization in general, and solve TERLN related problems in particular. The advantages of forming alliances rely in the possibility of vehicles sharing, information sharing, warehouse sharing, joint collection, etc. The implementation of the mechanism in reverse supply chain management can improve the efficiency of the recycling networks, reduce the level of pollution caused by waste products and promote the cleaner and environment-friendly development of the world’s cities. In practice, distance is a highly influential factor which impacts the recycling of products. By evaluating their position relatively to customers, some retailers find costly recycling operations. Consequently, the neglected wastes constitute sources of severe environmental problems, and to some extent disturb the population’s daily life. Considering the specificity of recycling operations, retailers’ collaboration can improve the entire network’s efficiency, and costs as well as pollution would both reduce. Members in the cooperative alliance can share customers and vehicles, and according to the location of the last customer on a recycling route, the nearest RH or RS can serve as final destination of vehicles. Indeed, cost savings will increase by requiring recycling vehicles to end their trips at the nearest recycling facility for unloading operations, instead of returning to the origin when the latter is distant. In summary, cooperation leads to the sustainable TERLN optimization, and the total savings of the collaborative logistics network will offer consistent profits to participating recycling facilities. The specific profit allocation plan and its impact on the stability of the coalition should further be explored in detail to ensure a stable partnership.
The current state of related scientific articles shows that many researchers have done extensive work on multi-center vehicle routing problems, collaborative logistics and profit allocation problems. However, there are still research gaps addressing collaborative reverse logistics networks with vehicles sharing, and optimizing multiple-echelon reverse networks using cooperation mechanism. Besides, the integration of more dynamic profit allocation strategies constitutes one of existing literature shortcomings. Therefore, in this paper, a bi-objective programming model is proposed to optimize the TERLN. In order to highlight the multi-dimensional advantage of collaboration, the designed objective functions consist in the minimum cost and the minimum number of vehicles. The Non-Dominated Sorting Genetic Algorithm (NSGA-II) and Clarke–Wright (CW) savings algorithm are properly combined to search feasible and optimal routes. The proposed CW_NSGA-II hybrid algorithm uses CW for solutions initialization to ensure a good performance of the final solutions as well as their proximity to optimality. Finally, the reduced cost between the non-collaborative network and the collaborative one is assessed with the Minimum Cost Remaining Savings (MCRS) method for the profit distribution among facilities. Results of multiple allocation methods are further compared using a non-proportional compression method to find the most stable profit distribution approach conducive to achieve the coalition’s stability.
The structure of the paper is as follows. Existing research in interrelated fields is reviewed in Section 2. The description of the TERLN is presented in Section 3. The solution methodology is introduced in Section 4. In this section, we design a bi-objective mathematical model along with detailed notations and definitions, the proposed CW_NSGA-II routing optimization algorithm, and the MCRS method used to allocate generated profits. Practical experiments in Chengdu city, China are conducted in Section 5, and cooperative alliances are analyzed to find the best cooperation sequence. Section 6 concludes and suggests future research directions.

2. Literature Review

Both in theory and practice, reverse logistics networks are usually composed of several logistics facilities, and regarding the multitude of recycling nodes, the proposed TERLN optimization problem can be considered as a variant of the multi-echelon multi-depot vehicle routing problem [4]. The main difference between the multi-echelon reverse logistics vehicle routing problem and the Multiple-Echelon Multiple Depots Vehicle Routing Problem (ME-MDVRP) lies in the general concentration of the latter on the forward logistics. In the existing literature, the majority of the research on ME-MDVRP consisted in designing the best routing system for vehicles supplying intermediate facilities from the upstream ones as well vehicles used by intermediate facilities to serve customers. In other words, solving the ME-MDVRP is a combinatorial optimization task, and mainly searches optimal routes with the purpose of reaching corresponding objectives [5]. In practice, logistics companies’ goals vary, and while some prioritize costs, others concentrate on the minimization of travel duration [6,7]. Several researchers have conducted in-depth studies on MDVRP, considering time windows, loading and unloading costs in order to improve the relevance of the MDVRP’s solutions in real world [8,9,10]. Recently, with the enhancement of the public awareness of environmental problems, researchers have also focused on Green Vehicle Routing Problems (GVRP) for carbon emission and pollution reduction, as well as the improvement of social sustainability [11,12]. As an important strategy to reduce environmental problems, reverse logistics optimization has also become the subject of many research projects [13,14].
With regard to the importance of vehicle routing optimization as an efficient approach to solve GVRP and MDVRP in reverse logistics, different types of objective functions were designed by researchers to search for appropriate solutions. Molina et al. [15] designed a multi-objective model including cost, carbon emission and other air pollutant’s emission minimization. Based on the Clarke–Wright (CW) savings method, a heuristic algorithm was proposed to solve the vehicle routing problem. Integrating multiple trips in a single working day, Cattaruzza et al. [16] proposed an approach to meet time and capacity constraints while minimizing total travel time. Aiming at maximum profit and minimum distance objectives, Vidović et al. [17] studied the location-routing problem in two-echelon recycling logistics networks to determine the location of intermediate stations and appropriate routes for the collection of non-hazardous materials. Yu et al. [18] emphasized on minimizing costs, and designed mixed integer linear models to solve open VRPs with a cross-dock and multiple customer nodes. More recently, Huang et al. [19] developed a model for the time-dependent vehicle routing problem considering path flexibility, and studied path transformation scenarios under deterministic and stochastic traffic conditions. Investigating vehicle routing problems with time windows (VRPTW), Wang et al. [20] evaluated the cost of carbon emission, transportation costs and other related operating costs. In summary, the optimization of delivery and recycling vehicles’ routing system can improve the relevance of logistics networks, and contribute to achieve sustainable development goals. However, with the expansion of networks scale, optimization models have become more complex, calling on better solution approaches.
In line with the increasing complexity of optimization models, the rapid development of computational resources has significantly increased the efficiency of optimization tools and conduced to easily address complicated problems [21]. While some researchers implement clustering approach for the effective segmentation and optimization of logistics networks [22], others apply complex exact and heuristic algorithms to search optimal solutions. Faulin et al. [23] developed an algorithm with environmental criteria on the basis of the Mole–Jameson insertion method in order to optimize the capacitated vehicle routing problem. Kumar et al. [24] proposed the fitness aggregated genetic algorithm to solve a bi-objective vehicle routing problem. Aggregate fitness values were used as selection criteria while routes with the best cost solution were considered for crossover operations. Qi et al. [25] designed a new selection operator to address MDVRP to alleviate difficulties of multi-objective evolutionary algorithms for decomposition in case of duplicated best solution. Lee et al. [13] proposed a combination of the multi-objective hybrid genetic algorithm and fuzzy logic controller to effectively optimize reverse logistics networks. García-Nájera et al. [26] adopted an evolutionary algorithm based on similarity to solve vehicle paths variation problems considering selective backhauls. Nevertheless, time windows were not modelled, thereby reducing the suitability of the problem in real world. Zhou and Lee [27] adopted the Lagrangian relaxation method to solve the GVRP by reducing carbon emission and verified its effectiveness through empirical experiments.
Despite the extensive research on logistics networks optimization, the increase in population and the amount of waste products have led logistics companies to encounter important challenges at optimizing their reverse logistics networks and obtaining significant profits. In some circumstances, companies adopt outsourcing contracts to properly control the entire market, but difficulties still appear on the selection of reliable partners [28]. Cooperation is regarded as a reliable measure for the long-term and sustainable development [29]. Cooperative alliances are established through the consultative coordination of Logistics Service Providers (LSPs) or government entities, and operations are optimized based on alliances configurations [30,31]. For instance, Zhou and Zhou [32] proposed a strategic collaboration mechanism to form reverse logistics alliances under the organization of a third party, and in order to reduce the total operating cost. Defryn and Sörensen [33] studied horizontal cooperation among facilities of the same echelon, and proved that in spite of the existing conflict of goals, joining a horizontal alliance is beneficial for every participant.
As a powerful driving force for sustainable development in a resource-conserving and environment-friendly society, cooperation efficiency can also be improved through the incorporation of resources sharing. For instance, in recent years, vehicle sharing has been theoretically and practically researched in passengers’ transportation domain, but there is still a considerable room for its development in logistics transportation, in general, and particularly in reverse logistics operations. Among exiting articles, He et al. [34] proposed a method to improve transport efficiency by sharing internal goods and vehicles between multiple container terminals. Ma et al. [35] developed the autonomous vehicle sharing strategy and demonstrated that sharing can significantly improve vehicle utilization. Directed towards environmental protection, Tinoco et al. [36] introduced a strategy to reduce transportation costs and carbon dioxide emissions by sharing the same means of transportation. Fernández et al. [37] emphasized on customers sharing to minimize the overall operating cost of a cooperative network, and applied the branch-and-cut algorithm to solve the proposed vehicle routing problem. In brief, sharing strategy leads the cooperative alliance to more cost savings than the non-collaborative networks, but the fairness of profit allocation constitute an influential factor which define the reliability of the alliance [38].
Combined with cooperative mechanisms, the optimization of reverse logistics networks can benefit the entire network. However, the distribution of the generated profits greatly affects the stability of the alliance. Many scholars have proposed relatively equitable strategies for profit distribution and cost sharing. Özener and Ergun [39] developed a cost allocation mechanism to ensure the stability of the alliance applying the cooperative game theory. Based on the Shapley value method, Cruijssen et al. [40] followed the Shapley monotonic path to customize and distribute tariffs to participating shippers in a fair and sustainable manner. Lv et al. [41] studied a collaborative reverse logistics network, and proposed a vehicle sharing model used in case of pickup and delivery requests. Rosenthal [42] introduced the equivalent cost sharing solution method and proved that the cost allocation strategy has a non-empty core and is located at the core of the game. Wu et al. [43] designed a mathematical model for a fair distribution of profits, and concluded that the proposed method could contribute to both collective and personal profits.
Compared with previous studies, the contribution of this paper is: (1) Establishing a two-echelon cooperative reverse logistics network and taking into consideration semitrailers and vehicles sharing in the process of used products recycling; (2) Including cooperation mechanism while establishing a bi-objective programming model, and combining CW savings method with NSGA-II algorithm to solve both echelons recycling vehicle routing problems; (3) Exploring the economic and environmental importance of cooperation, as well as the influence of different profit allocation strategies on the stability of cooperative alliances; (4) Analyzing the stability of the different cooperation sequences, and finding the optimal cooperation sequence employing the strictly monotonic path selection principle and diagonal rule.

3. Problem Statement

Manufacturing or logistics companies usually have several customers spread all-over a city in need of products collection services, and vehicles daily travel long distances to visit remote customers. Obviously, traditional network optimization approaches can improve the network’s efficiency, but the process is required periodically to ensure long term reliability. Therefore, to achieve a sustainable development and conduct relevant collection operations, the reverse logistics network can be optimized through the cooperation of retail stores and the recycling hub. Retail stores can collect products from various customers by means of small or medium vehicle, and then use semitrailers to connect with the RH for treatment and wastes disposal. In this paper, the RH acts as a coordinator to achieve resource savings through the establishment of the cooperative alliance. The initial collection network and optimized network are shown in Figure 1. The thin solid lines represent the initial collection routes, and the dotted lines represent the collection routes after cooperation. The thick solid lines indicate the semitrailer collection route which consists in visiting every RS before returning to the RH.
The first column of the illustration, Figure 1a, shows the original collection network when there is no cooperative alliance. In the initial network, due to each facility’s independence, there is no connection among them, and each logistics facility is engaged with its own customers. During routing optimization, the total demand and the vehicle’s capacity generally constrain the assignment and dispatching of the transportation fleet [44]. Overload is generally forbidden and the vehicle should return to the origin after finishing services. In practice, the last visited customer can be very distant from the departure node, and returning can increase the total travelled distance. However, forming alliances among retailers and encouraging vehicle sharing can allow the collection vehicle to move to the closest RH or RS after visiting the last customer. Therefore, long-distance transportation is avoided and costs are reduced.
The optimized collection network is represented in Figure 1b. First, we observe that the irrational customers’ assignments in the network are eliminated through customers’ reallocation. Second, the last arc on each vehicle’s routes is reviewed to reduce distance by connecting the last customer with the closest RH or RS. Note that the reorganization of vehicle routes is effective just among logistics facilities in the same alliance. Finally, the collected products remaining at each RS is recovered using semitrailers and transported to the recycling hub for dispatching, treatment, and disposal operations. With vehicles’ sharing and the establishment of cooperative alliance, companies can avoid the waste of resources and reduce expenses. These factors will certainly encourage them to properly collect used products from the market, and contribute to build cleaner and more environment-friendly cities around the world.

4. Methodology

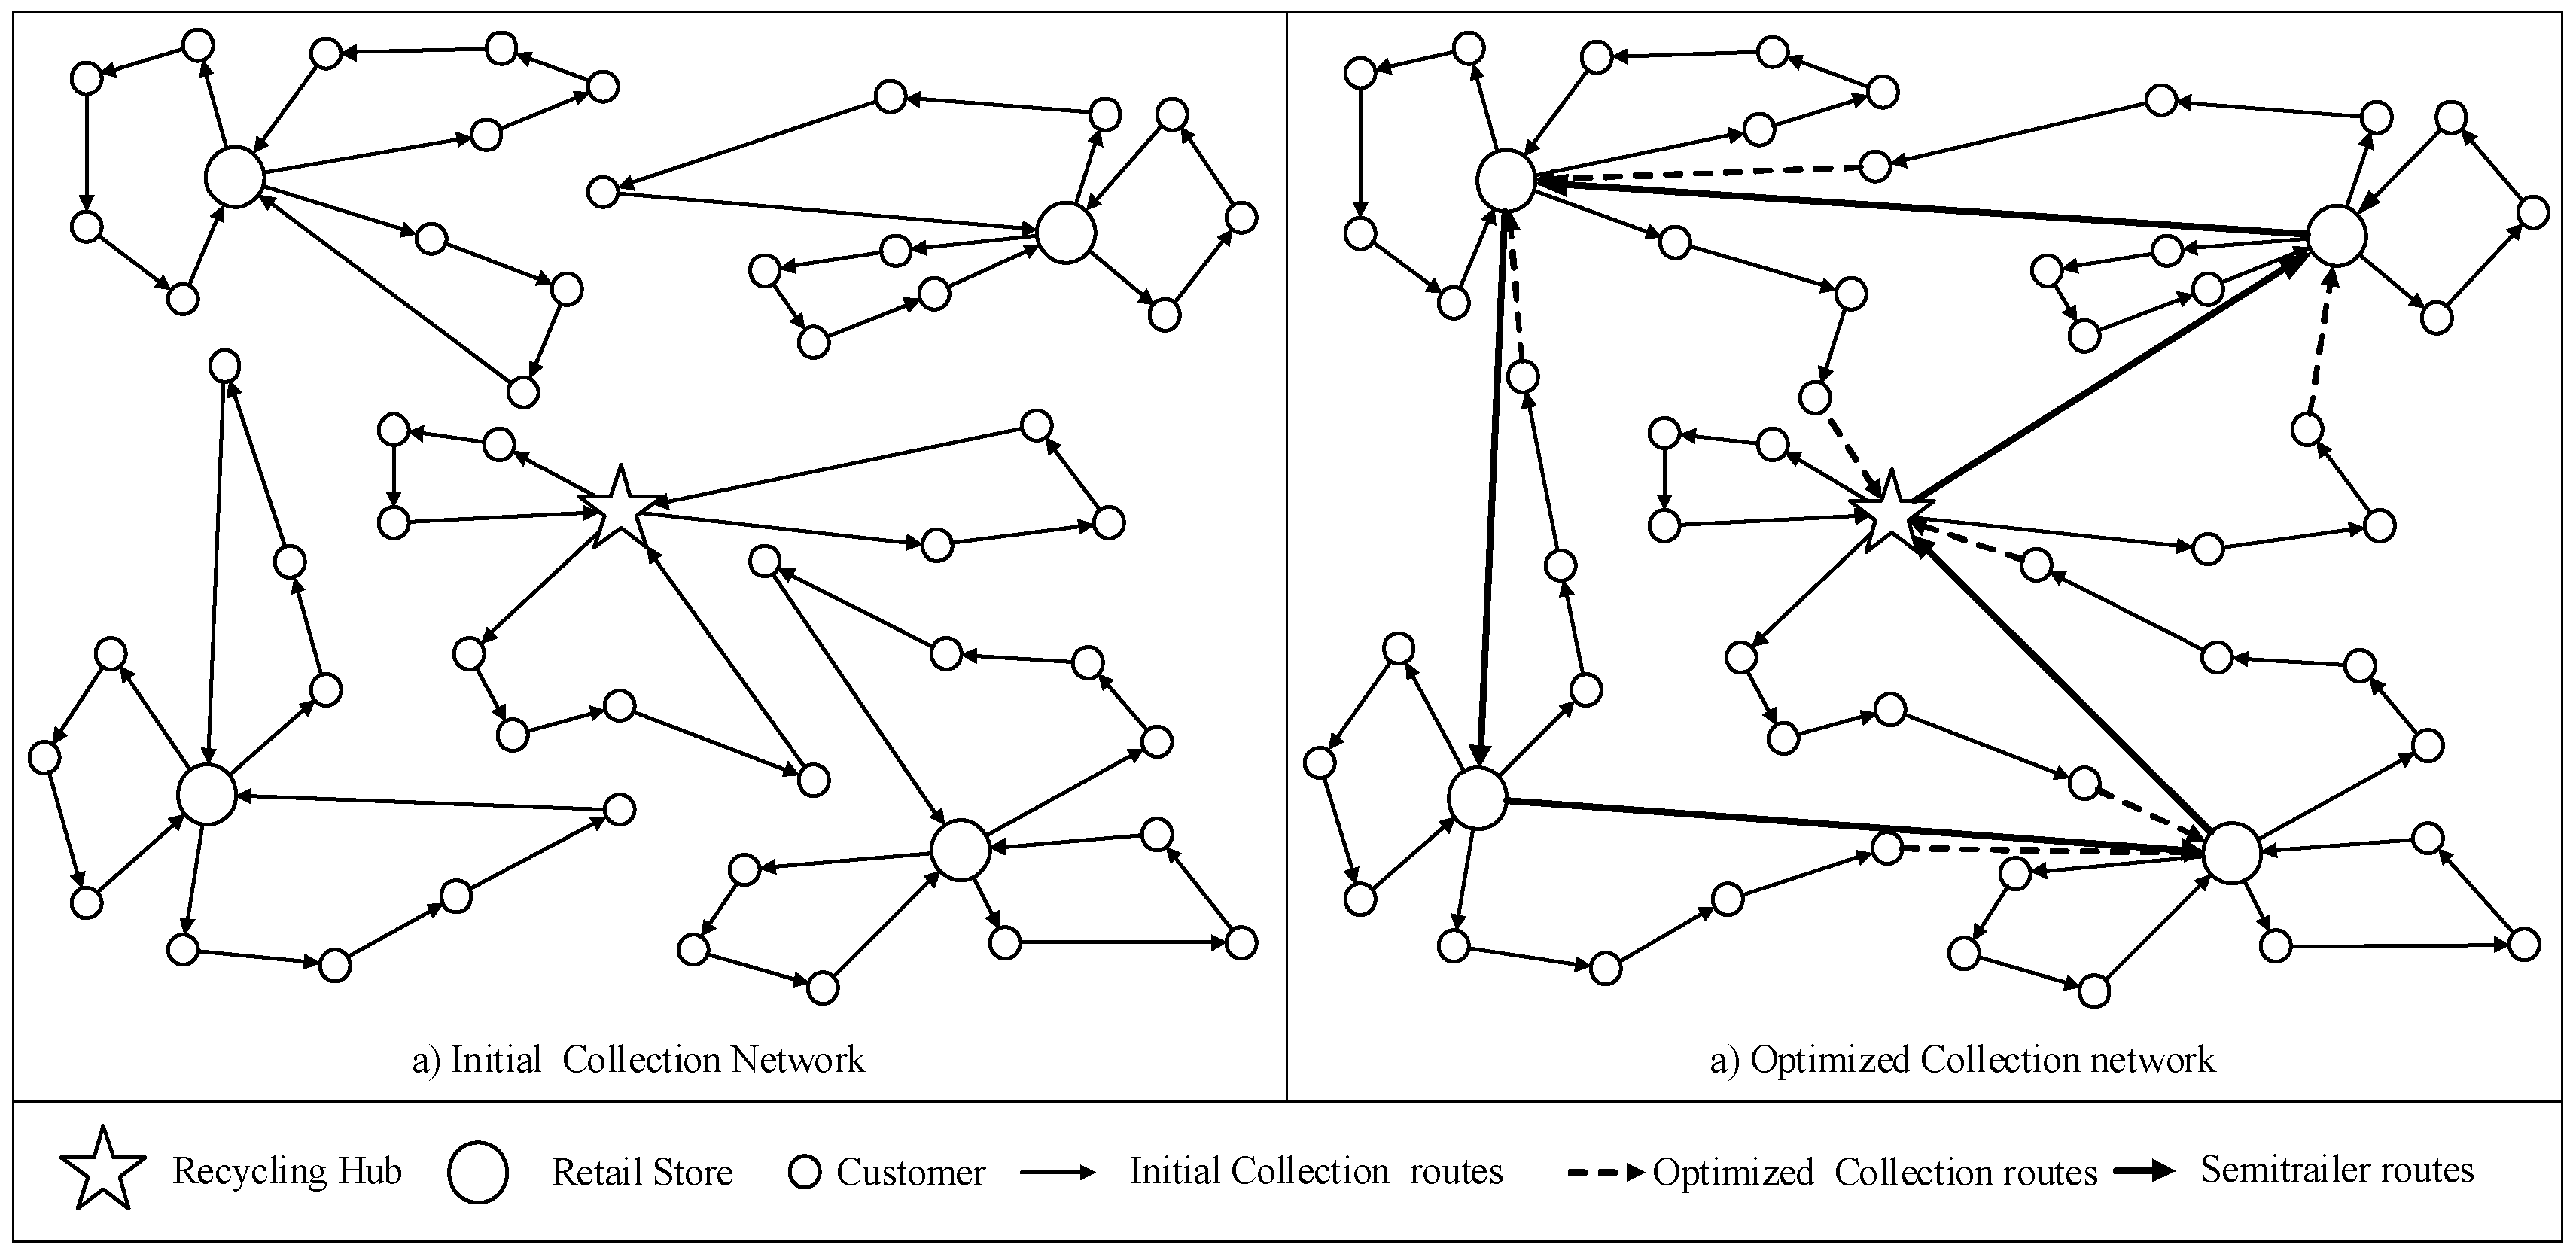
Due to the increasing quantity of produced consumer goods and machines accessories, the necessity for sustainable logistics networks to recycle used products proves imminent. However, the expansion of cities has driven urban population to spread to remote areas, thereby imposing long distance transport to logistics companies. These requirements generally lead to significant expenses, and are sometimes the cause of poor management of wastes and used products within cities. In order to resolve these managerial problems, this paper introduces collaboration among retail stores and recycling hubs, not only to improve their coverage of the entire network, but also to yield profits from a more organized network.
The solution methodology is designed to address the vehicle routing problem on the two-echelon network formed by RH and RS. The general framework is illustrated in Figure 2. The first phase consists in the design of a multi-objective mixed-integer model to interpret the implementation of collaboration in real-world TERLN. Next, the model is used to evaluate feasible vehicle routing solutions which can effectively lead to the optimization of the network. CW savings algorithm and NSGA-II are integrated to iteratively explore the first and second echelons in order to further combine their results and obtain global solutions. In the third phase, the collaborative network’s cost value is withdrawn from that of the non-collaborative network, and the minimum cost remaining savings method is employed to allocate profit to each participant.

4.1. Model Assumption

Our proposed reverse logistics network includes a RH, multiple RS and a number of customers to be visited for used-products collection. To make the proposed TERLN more suitable for practical applications, some necessary assumptions are given as follows.
Assumption 1.
Products are collected from customers by vehicles, and all the packages in the RS are transported by semitrailers to the RH for wastes processing and classification.
Assumption 2.
The quantity of recycled products is known and function of previously delivered packages. In this paper, the delivery process is not addressed. Thus, the collection quantity is given.
Assumption 3.
The TERLN is organized and coordinated by the RH. Before the collaborative network is established, logistics facilities operate independently.
Assumption 4.
The transportation cost between facilities is a linear function of collection quantity and travelled distance, and the variable costs of RH and RS are only proportional to their capacity.
Assumption 5.
Each logistics facility seeks the lowest cost, the small transportation fleet, and the most reasonable profit allocation.

4.2. Notation

In this section, we introduce the list of mathematical symbols and parameters used during the formulation of the proposed TERLN optimization model. The different sets, parameters and decision variables are presented in Table 1 along with their description.

4.3. Model Formulation

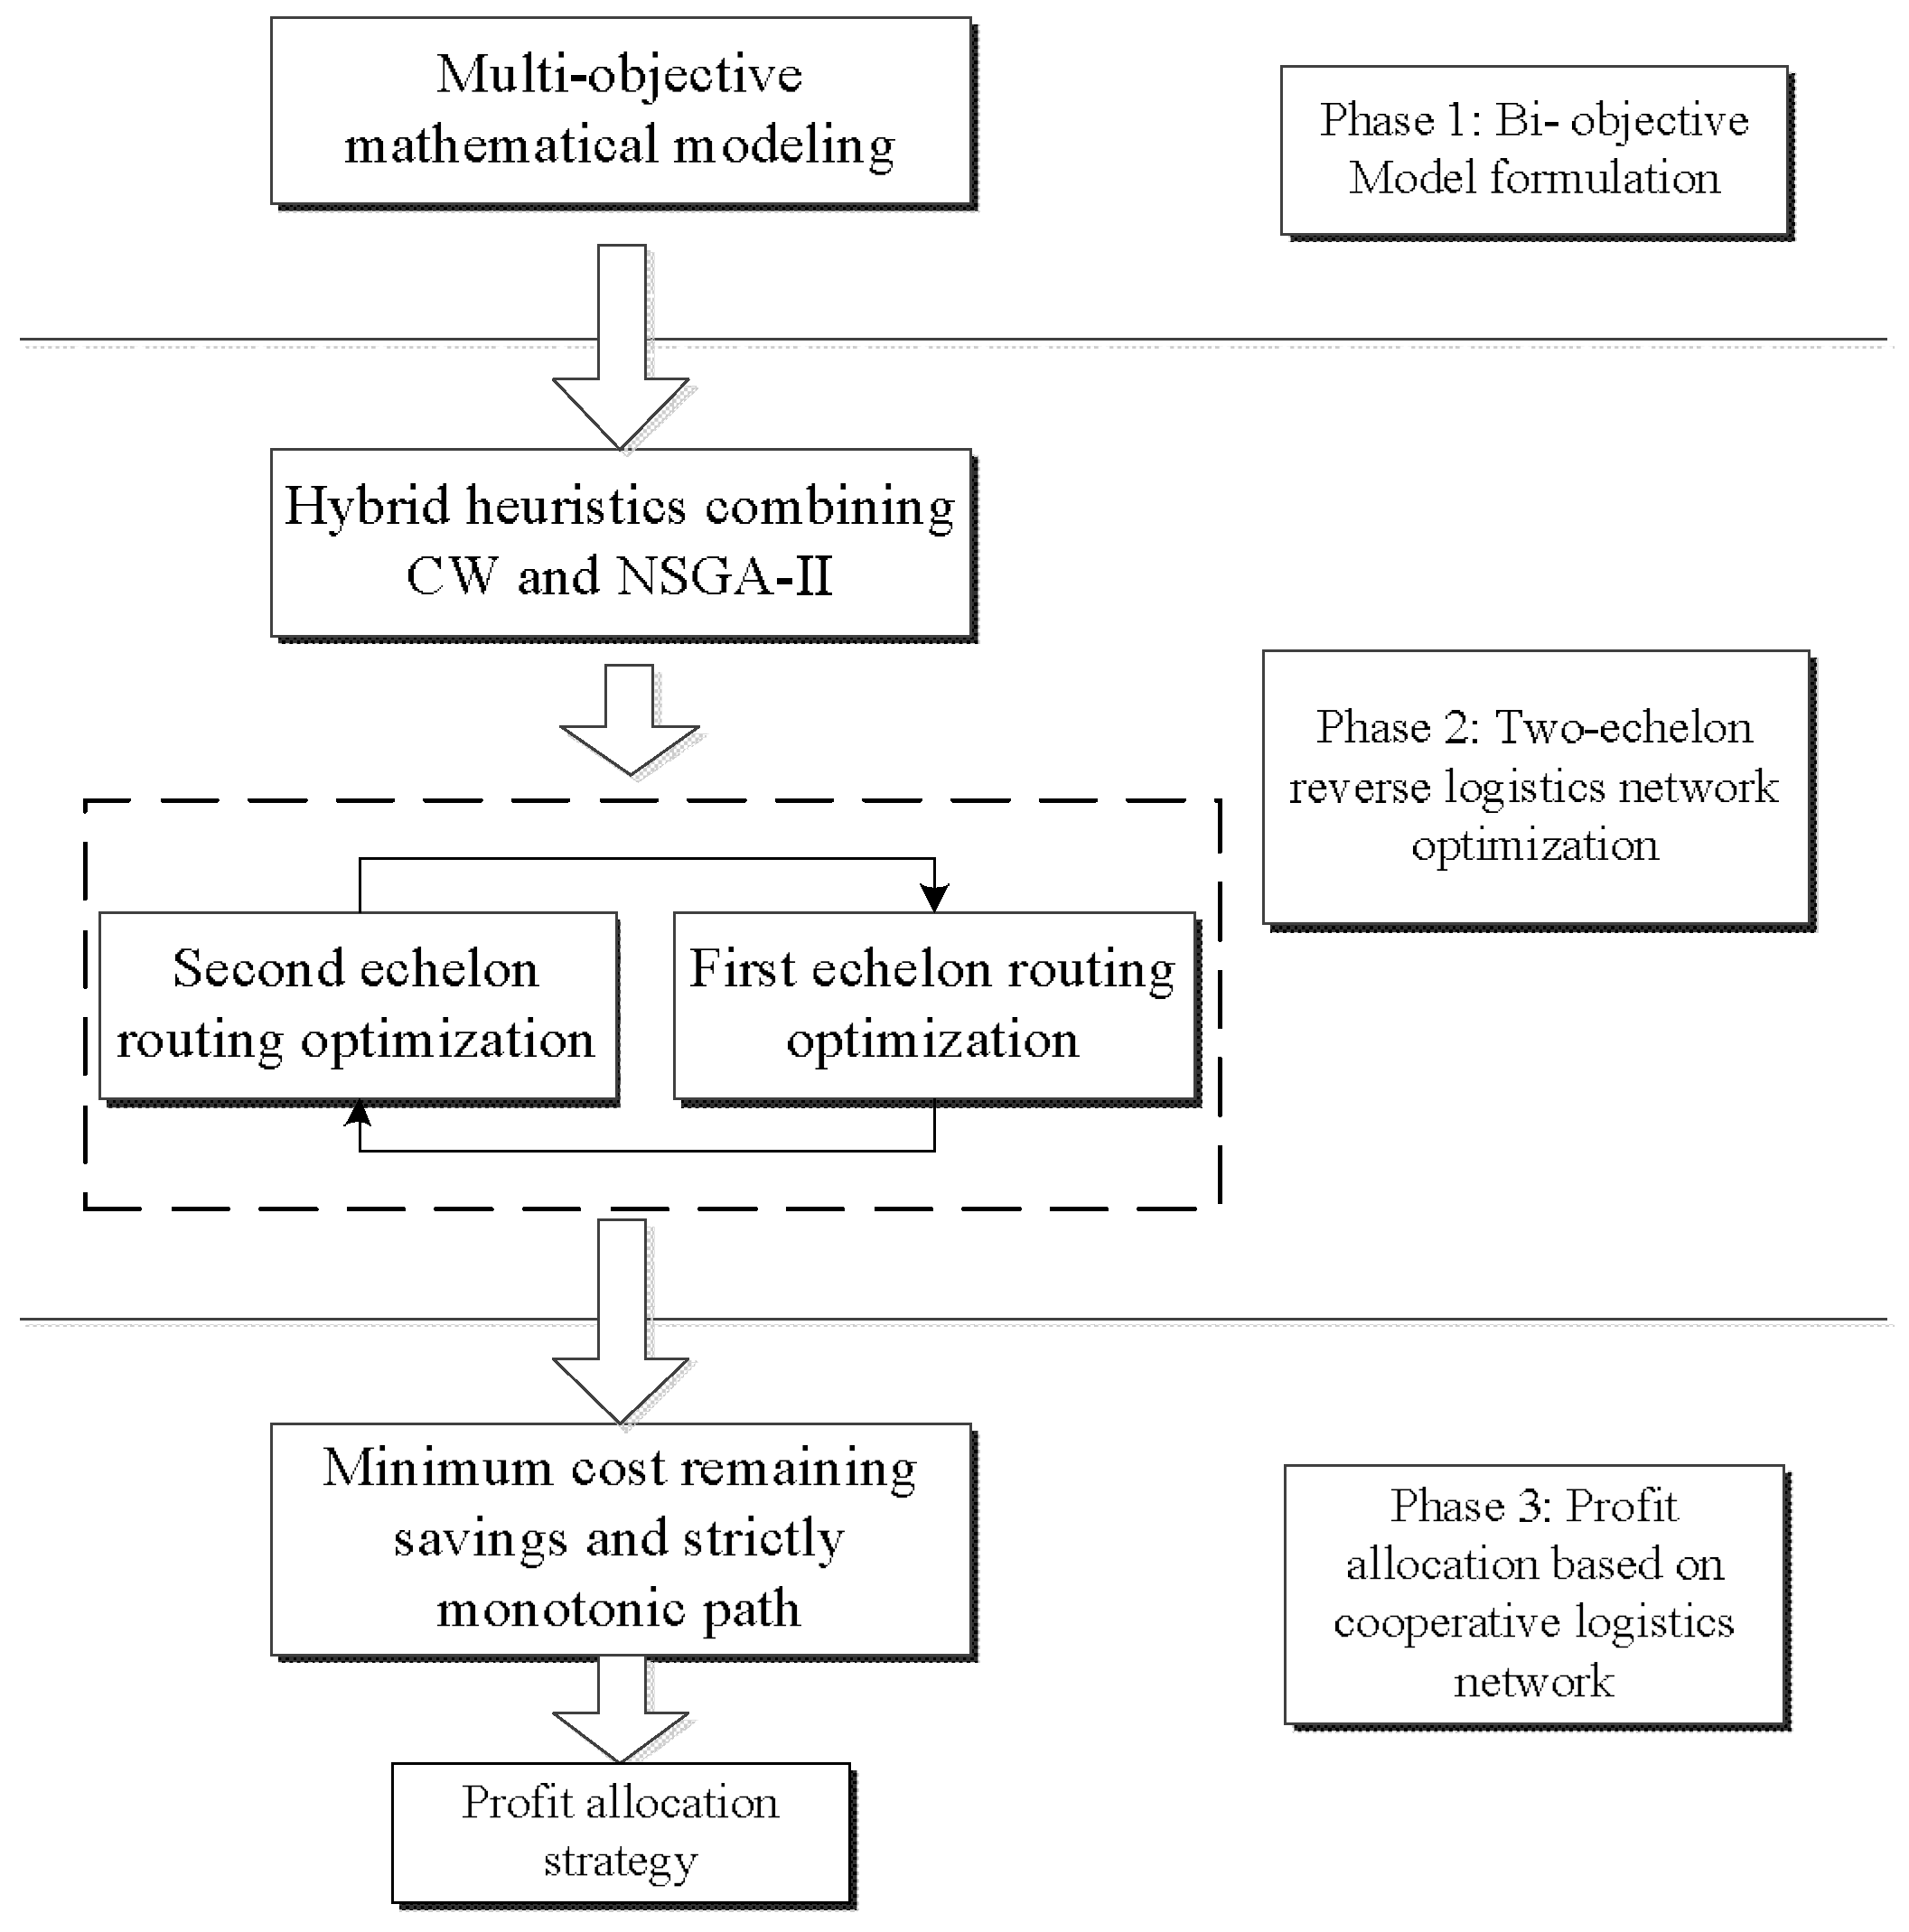
To simultaneously evaluate the influence of collaboration on the reverse logistics operations costs and the number of vehicle used for services, the proposed TERLN optimization is based on a bi-objective mixed-integer linear mathematical model. The objective functions and the constraints are presented as below.
The first objective function TC is designed to minimize the total cost of the entire TERLN.
min   T C = T C 1 + T C 2 + T C 3
The second objective function MNV aims to minimize the number of vehicles used at the second echelon of the network for collection purpose.
min M N V = i I L c i ( j J Q j Q v ) + i I L ( 1 c i ) ( x i j v j J Q j Q v )
T C 1 represents the transportation cost and maintenance cost of the vehicles which collects from different customers to RH or RS.
T C 1 = i L I j J v V x i j v ( Q j × f v r × D i j ) + j J Q j Q v × M v T
T C 2 represents the transportation cost and maintenance cost of the semitrailers which serve for collection operations from RS to the RH.
T C 2 = l L i I s S x l i s × Q i × f t r × D i l + i I i i I Q i i + i L I Q i Q s × M s T
T C 3 represents the fixed costs, variable costs, and discounts offered by the cooperative alliance to RH and RS.
T C 3 = l L ( F L + λ l W l ) + i I ( F i + λ i W i ) i L I Z i c i
Subject to
s S l L x i l s = 1 , i I
i I L j J x i j v = 1 , j J
l L i I x l i s 1 , s S
i I L j J x i j v 1 , v V
l L x l i s l L x i l s = 0 , i I , s S
i L I x i j v i L I x j i v = 0 , j J , v V
i I Q i x l i s Q s , l L , s S
j J Q j x i j v Q v , i L I , v V
u i u m + Q s x i m s Q s Q m , i , m I ; i m
u j u c + Q v x j c v Q v Q c , i , c J ; j c
Q i u i Q s , i I
Q j u j Q v , j J
x i j v = { 0 , 1 } , i L I , j J , v V
x l i s = { 0 , 1 } , l L , i I , s S
c i = { 0 , 1 } , i L I
In the proposed model, Equation (1) presents the cost minimization objective function of the TERLN, including transportation costs, vehicle and semitrailers truck maintenance costs, logistics facilities’ fixed costs, variable costs and the discount after joining the alliance. Equation (2) is the minimum number of vehicles objective function which combines both collaborative and non-collaborative networks’ number of vehicles. This approach is used to introduce facilities’ vehicle sharing advantages since customers of the same coalition’s recycling facilities can be served by any of them. Equations (3)–(5) express the different costs taken into account for the TERLN optimization. Constraints (6) and (7) respectively ensure that each customer is assigned to only one RH or RS and the latter is served by one RH. Constraints (8) and (9) assure that each vehicle visits a customer node not more than once. Constraints (10) and (11) are designed to indicate that after completing their assigned services, vehicles’ routes cannot terminate at a customer node, and a semitrailer cannot stay at a retail store after loading. Constraints (12) and (13) guarantee that the total amount of collected products does not exceed the capacity of the vehicle and semitrailer. Constraints (14)–(17) are enforced to eliminate sub-tours in the entire network. Constraints (18)–(20) express the binary variables used in the mathematical model of the investigated TERLN optimization problem.

4.4. Routing Optimization with the CW_NSGA-II Hybrid Algorithm

According to the problem statement, the proposed 2E-CRLN is a cooperative network where vehicles are not required to return to their origin as long as the latter collaborates with another facility closer to the last visited customer. Therefore, the optimal solution to the problem should consider the distance between the last customer on vehicle v’s route and the retail stores as well as the recycling hub in the same alliance.
Taking into account this possibility, a solution methodology for the multi-echelon vehicle routing optimization is developed by combining Clarke–Wright savings algorithm and NSGA-II algorithm into a hybrid heuristic algorithm called CW_NSGA-II. CW savings method is proposed by Clarke and Wright [45] to generate routes for a central depot to serve multiple customers and select those offering the maximum distance savings as best solutions. More recently, Segerstedt [46] proposed a variant of the CW method to particularly address vehicle routing problems. The non-dominated sorting algorithm-II (NSGA-II) proposed by Deb et al. [47] is an extension of the genetic algorithm. NSGA-II is a population based heuristic algorithm typically used to solve multi-objective problems, and well-known for its capability to offer high accuracy solution [48]. Therefore, the combination of these two algorithms can not only properly address our proposed bi-objective model, but can also enhance the accuracy of our routing solutions. In existing articles, CW had already been combined with other algorithms in order to obtain better results. For instance, Li et al. [5] implemented a modified version of the Clarke–Wright saving with a local search phase to study the roll-on-roll-off vehicle routing problem and confirmed the method’s relevance for waste materials logistics.
In line with studies on the usefulness of CW savings algorithm, CW_NSGA-II hybridizes these algorithms and employs CW for the generation of the initial population. As a result, the quality of initial solutions can be guaranteed and the offspring population can be generated based on good parents. The entire optimization process is design on the basic framework of the non-dominated sorting algorithm-II, and the Clarke–Wright savings algorithm is only integrated during initialization. The major steps of CW_NSGA-II are as below.
Step 1: Load the data file corresponding to the investigated network, and initialize parameters related to the algorithm such as: the population size (Ps), number of generations of the offspring population (NoG), number of objective functions (NoF), number of runs (NoR), crossover and mutation indexes (CI and MI).
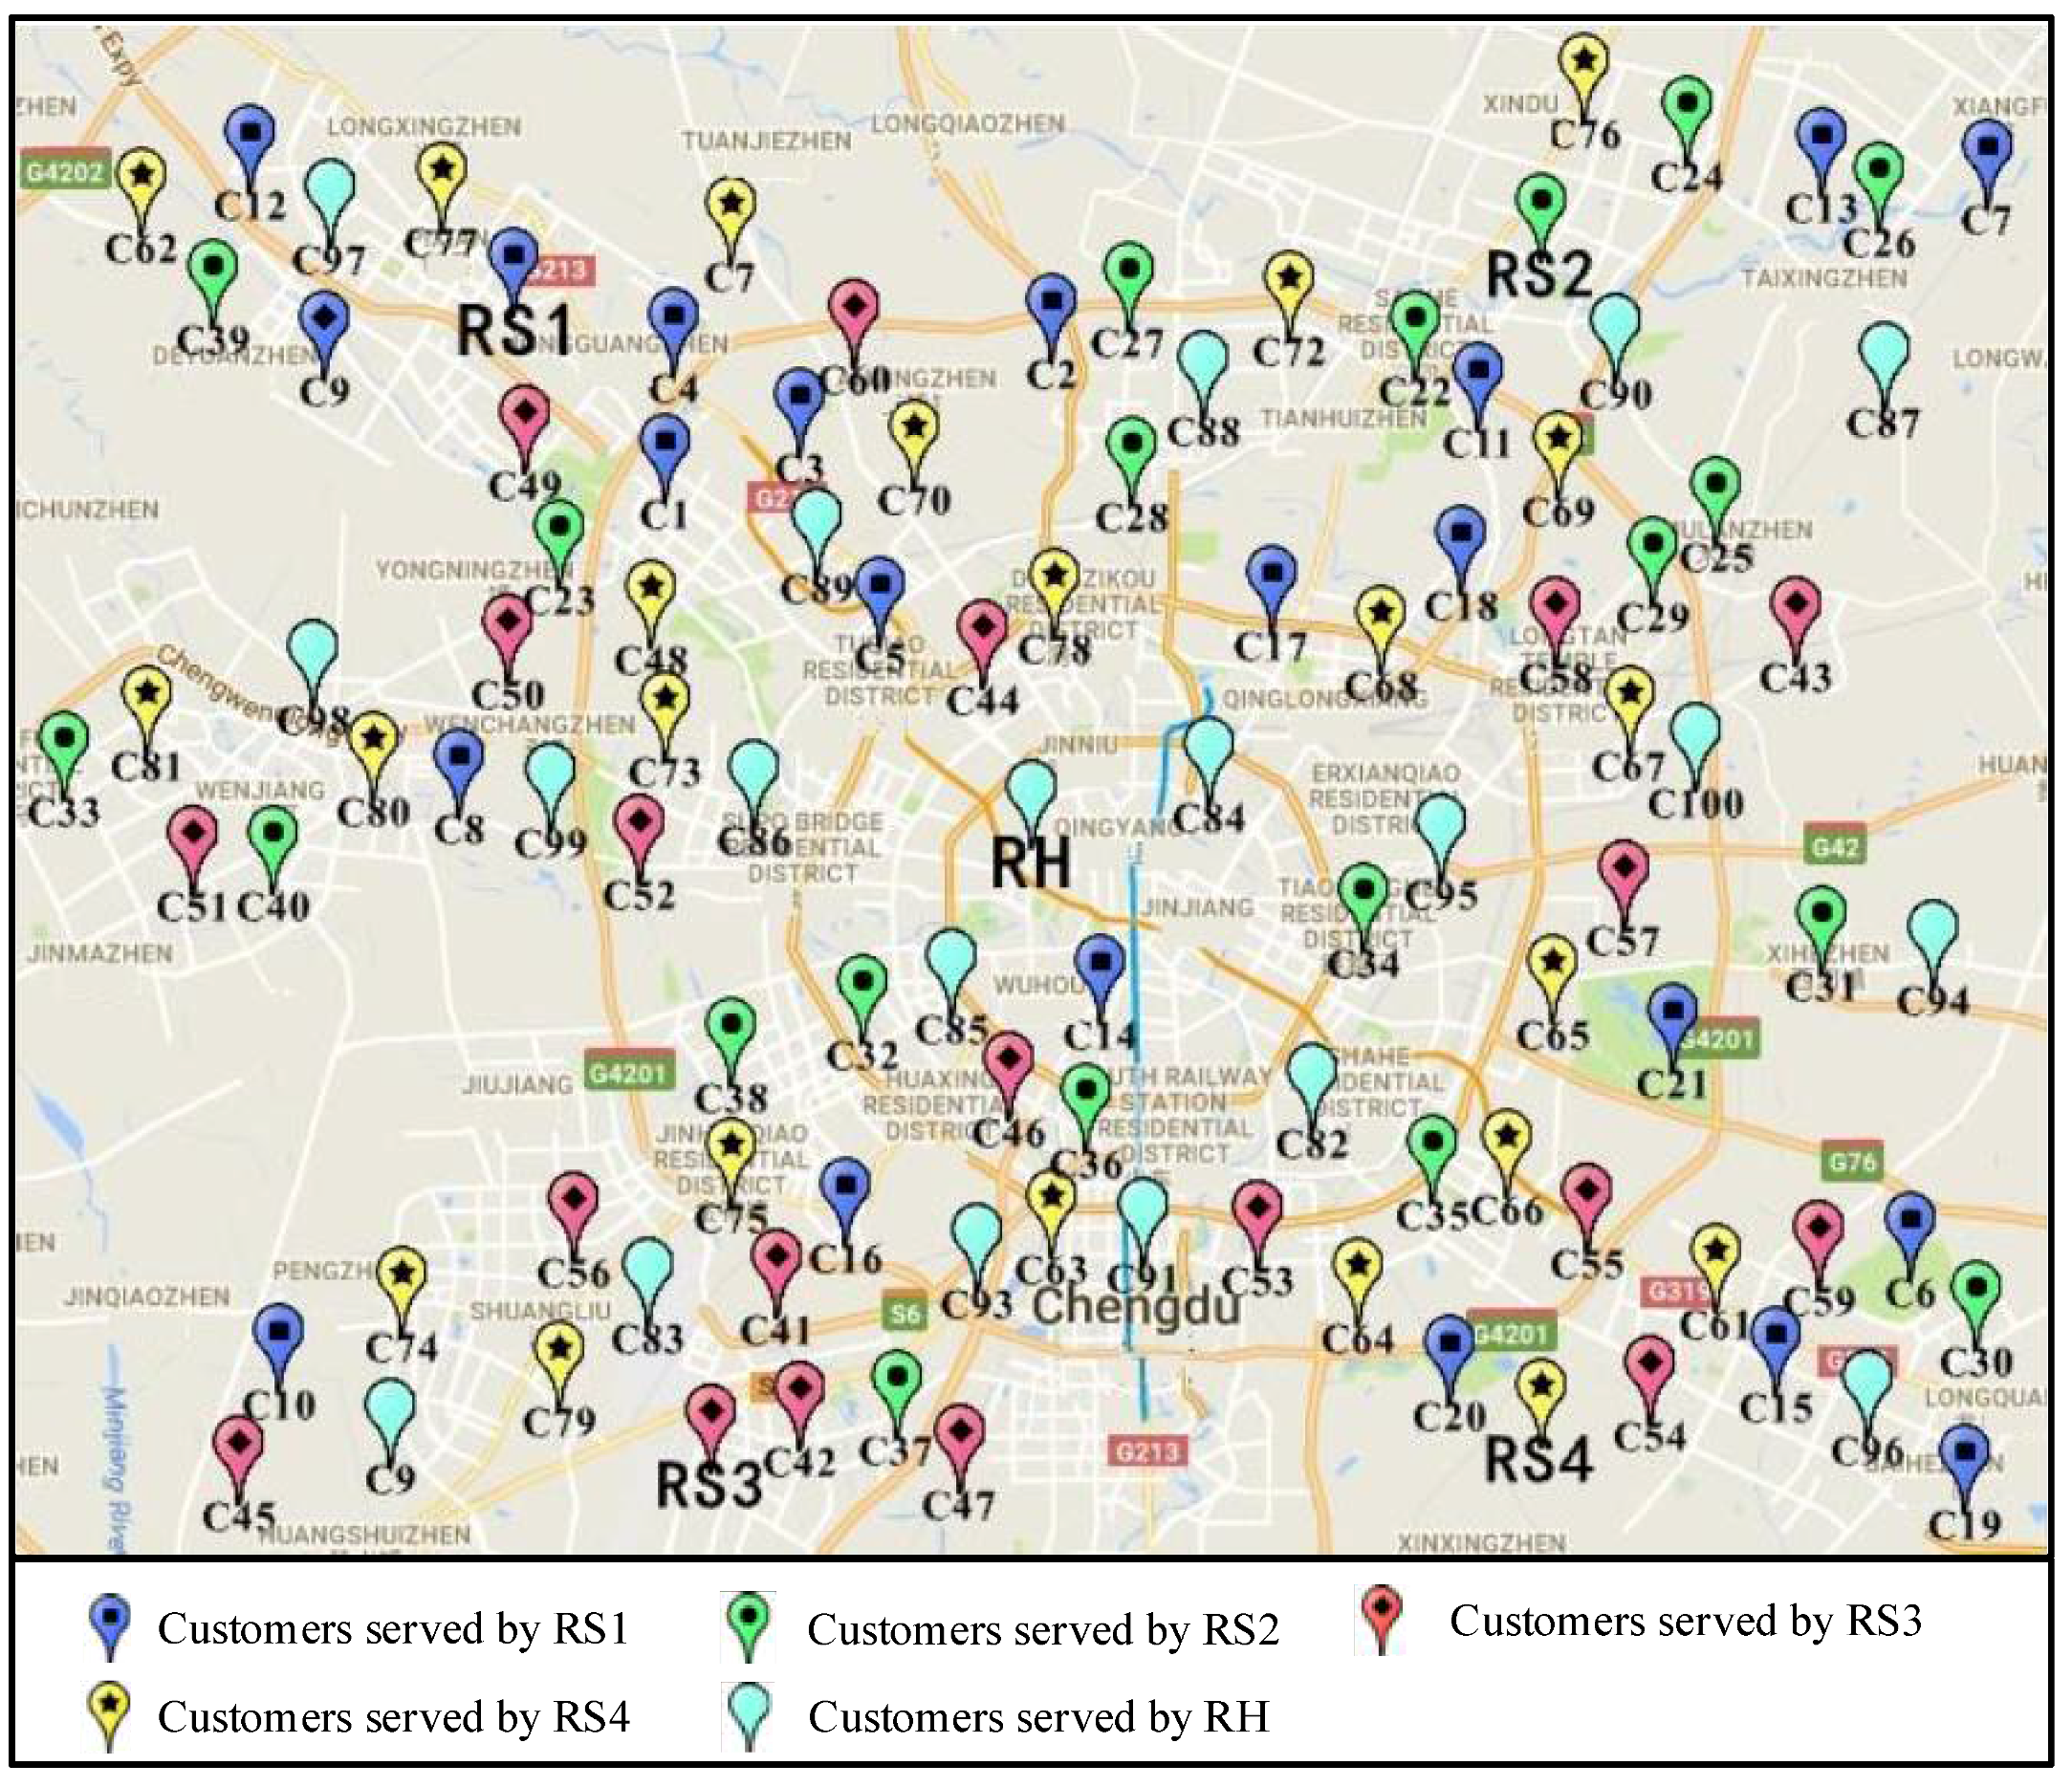
Step 2: Conduct the collaborative network’s segmentation using k-means clustering algorithm. The clustering criterion consists in the Euclidean distance between customers. Therefore, the operation can be completed using k-means packages existing on MATLAB, SPSS, or any other computation software. After generated clusters are stable, distances between final clusters centers and logistics facilities are calculated. Customers are assigned to a facility when the latter is the closest to the corresponding cluster’s center.
Step 3: From this phase, the remaining part of CW_NSGA-II procedure is implemented for each run, and the highest ranked solutions are compared after NoR runs to maintain the best one. First, initialize the chromosome population by applying CW, and randomly generate Ps-1 strings to form a population of size Ps by adding CW best solution.
Step 4: Evaluate each string in the population matrix with the proposed TERLN optimization’s objective functions. Since NSGA-II is a typical multi-objective optimization algorithm, there is no need to transform the model into a single objective formulation; therefore, for each string, CW_NSGA-II will output the corresponding cost and the number of vehicles.
Step 5: For each generation of the offspring population, proceed with Steps 5.1–5.3.
Step 5.1: Randomly select two parent strings and genetically operate on them to generate two offspring solutions. For this purpose, the partial mapped crossover and the swap mutation operators are used. Further combine the offspring and parent population in order to evaluate their suitability as solutions of the optimization model.
Step 5.2: Compare the objective functions values for each string and sort them in order of dominance. In other words, check the dominance of each string over its peers and position the non-dominated one on top.
Step 5.3: Set the first Ps strings as the non-dominated front and record their values as the best of the corresponding NoG value. Move to Step 4.1 to generate the new offspring.
Step 6: Output the highest ranked string as the best solution of the run, and move the next run.
The representation of optimization solutions and the procedure of the CW algorithm are introduced in the following sub-sections.

4.4.1. TERLN Optimization Solution Representation

The proposed TERLN optimization procedure consists in separately solving the problem at each echelon and finally combining them for the global solution’s fitness evaluation. The first echelon’s solutions are encoded with values corresponding to RH and RS, whereas second echelon’s solutions are composed of RH, RS and customers.
The NSGA-II is a heuristic algorithm designed for optimizations with different types of encoding strategies, and its original version can adapt to binary as well as real number encodings. This paper adopts a real integer-based encoding strategy. Suppose the coalition contains one recycling hub, three retail stores (denoted by P 1 P 3 ). A Real integer encoded route for one vehicle originating from P 2 to serve 5 customers (denoted by C 1 C 5 ) can be represented as below in Table 2.
The above illustration represents the state of the string before the evaluation of objective functions. In other words, the section preceding the origin node 0 is added right before the completion of Step 4 in CW_NSGA-II procedure. During the fitness evaluation, the total distance will be obtained by adding the minimum distance among those of arcs C 2 - RH , C 2 - P 1 , C 2 - P 3 and C 2 - P 2 to the total distance on route and P 2 - C 2 . After yielding corresponding objective functions values, the original form will be recovered for the selection of parents in Step 5.1 of CW_NSGA-II.

4.4.2. Initialization with Clarke–Wright Savings Algorithm

Clarke–Wright (CW) savings algorithm is a heuristic algorithm proposed by Clarke and Wright [45], and usually used in the transportation engineering domain to solve shortest path problems. The solution approach is designed to assess NP problems and has as primary goal to search the shortest way to link an origin node to the destination while respecting vehicles payload constraints. CW is usually applied for its simplicity and its computational speed. Its integration in NSGA-II aims at using CW to propose a local sub-optimal routing solution, and in order to avoid the probabilistic failure of randomly generated solutions. In fact, the original version of NSGA-II is based on randomly generated population, and obtaining good solutions can sometimes be lengthy in terms of time. Therefore, CW plays a significant role by providing a good solution as part of the initial solutions. The main steps in the algorithm’s implementation procedure are as follows:
Step 1: Initially consider a link between the retail store and one customer, and calculate the corresponding distance d i 1 . For ease of computation, CW algorithm solutions are constrained to return to the origin. In consequence, distances should be multiplied by 2, and D i 1 = 2 × d i 1 . Though the proposed mathematical model allows returning to any other facility in the coalition, this assumption would not impact the global solution’s accuracy since the solution constitutes just one string of the initial population.
Step 2: Introduce a new customer, and calculate its distance D i 2 to the retail store. As in Step 1, the corresponding distance has to be multiplied by 2.
Step 3: Compute the total saved travelled distance S d in this network with the two customers using formula S d = ( D i 1 + D i 2 ) D 12 .
Step 4: Continue to insert new customers to the computation following step 1–3 until all the nodes in the network are considered.
After this procedure, the customer sequence which has yielded the maximum savings in term of total travelled distance will be maintained as sub-optimal solutions of the CW algorithm. Subsequently, the proposed vehicle routing optimization methodology can proceed to the random generation of a population of size Ps-1, and position them behind CW solution in the initial population matrix.

4.5. Minimum Cost-Remaining Savings Method and Monotonic Path Selection

Basic conditions for a logistics facility to participate in the alliance are the possibility to obtain cost savings or extra profits, and a reasonable profit allocation which matches its contribution. Otherwise, the alliance cannot exist or the configuration can be unstable. Therefore, the organizer needs to provide a fair profit allocation strategy. This paper adopts the minimum cost remaining savings method for its simplicity and accuracy.

4.5.1. Minimum Cost-Remaining Saving Method

The Minimum Cost-Remaining Savings (MCRS) is proposed by Tijs and Driessen [49] for quadratic assignment problems, and is often used to solve cost-sharing or profit-sharing problems in multi-agent cooperative games. This method is not only concise, but when compared to other allocation strategies, it yields results which are closer to the optimal allocation strategy. The allocated profit of each participant is calculated using Equation (21).
ϕ j ( N , v ) = p j min + p j max p j min j N ( p j max p j min ) × [ v ( N ) j N p j min ]
With
P min = { p 1 min , p 2 min , , p j min }
P max = { p 1 max , p 2 max , , p j max }
P = P min + θ ( N P max N P min )
θ = p j max p j min j = 1 n ( p j max p j min )
j = 1 n p j = v ( N )
P min P P max
p j min = v ( j )
p j max = v ( N { j } )
j S p j v ( S )
v ( S ) = j S C o ( j ) C ( S )
Equations (22) and (23) determine the upper and lower bounds of the variables. Equation (24) shows the relation between these bounds and coefficient θ , which represents the difference proportion of participant j relatively to the sum of all the members. Equation (25) computes coefficient θ . Equation (26) indicates that the sum of each participant’s profit should be equal to the collective profit. Equations (27)–(29) constrain the allocated profit, and define the maximum and minimum value of participant j ’s profit. The minimum value should be equal to the alliance’s profit with a single participant j , whereas the maximum value should be the one after all members had joined the alliance. Equations (30) and (31) ensure that a grand cooperative alliance is attractive to all members.
In practice, the organization of a cooperative alliance requires progressive negotiations and the coordination of the third-party logistics service provider or a participant in the alliance. As reward, organizers can extract part of the extra profit of the alliance. Parameter δ , also called synergy requirement, refers to the ratio of the extracted amount. The profit that participants can distribute is as follows.
v ( N ) = ( 1 δ ) ( i N C 0 ( j ) C ( N ) ) i f   i N C 0 ( j ) C ( N ) 0
In Equation (32), C 0 ( j ) is the original cost of member j before joining the alliance, and C ( N ) represents the cost of the whole alliance. Note that the formation of an alliance is not possible unless the total cost of the alliance is less than the sum of participants’ costs before collaboration, i.e., when i N C 0 ( j ) C ( N ) , v ( N ) = 0 . Besides, with the increase of the value of δ , the organizer extracts greater from the extra profit. Thus, the formation of the alliance can also be impossible when δ is too large. It is important to highlight that, under cases where a participant of the alliance acts as coordinator, the synergy requirement can be equal to zero because benefits are already obtained from the cooperative alliance; therefore, δ = 0 .

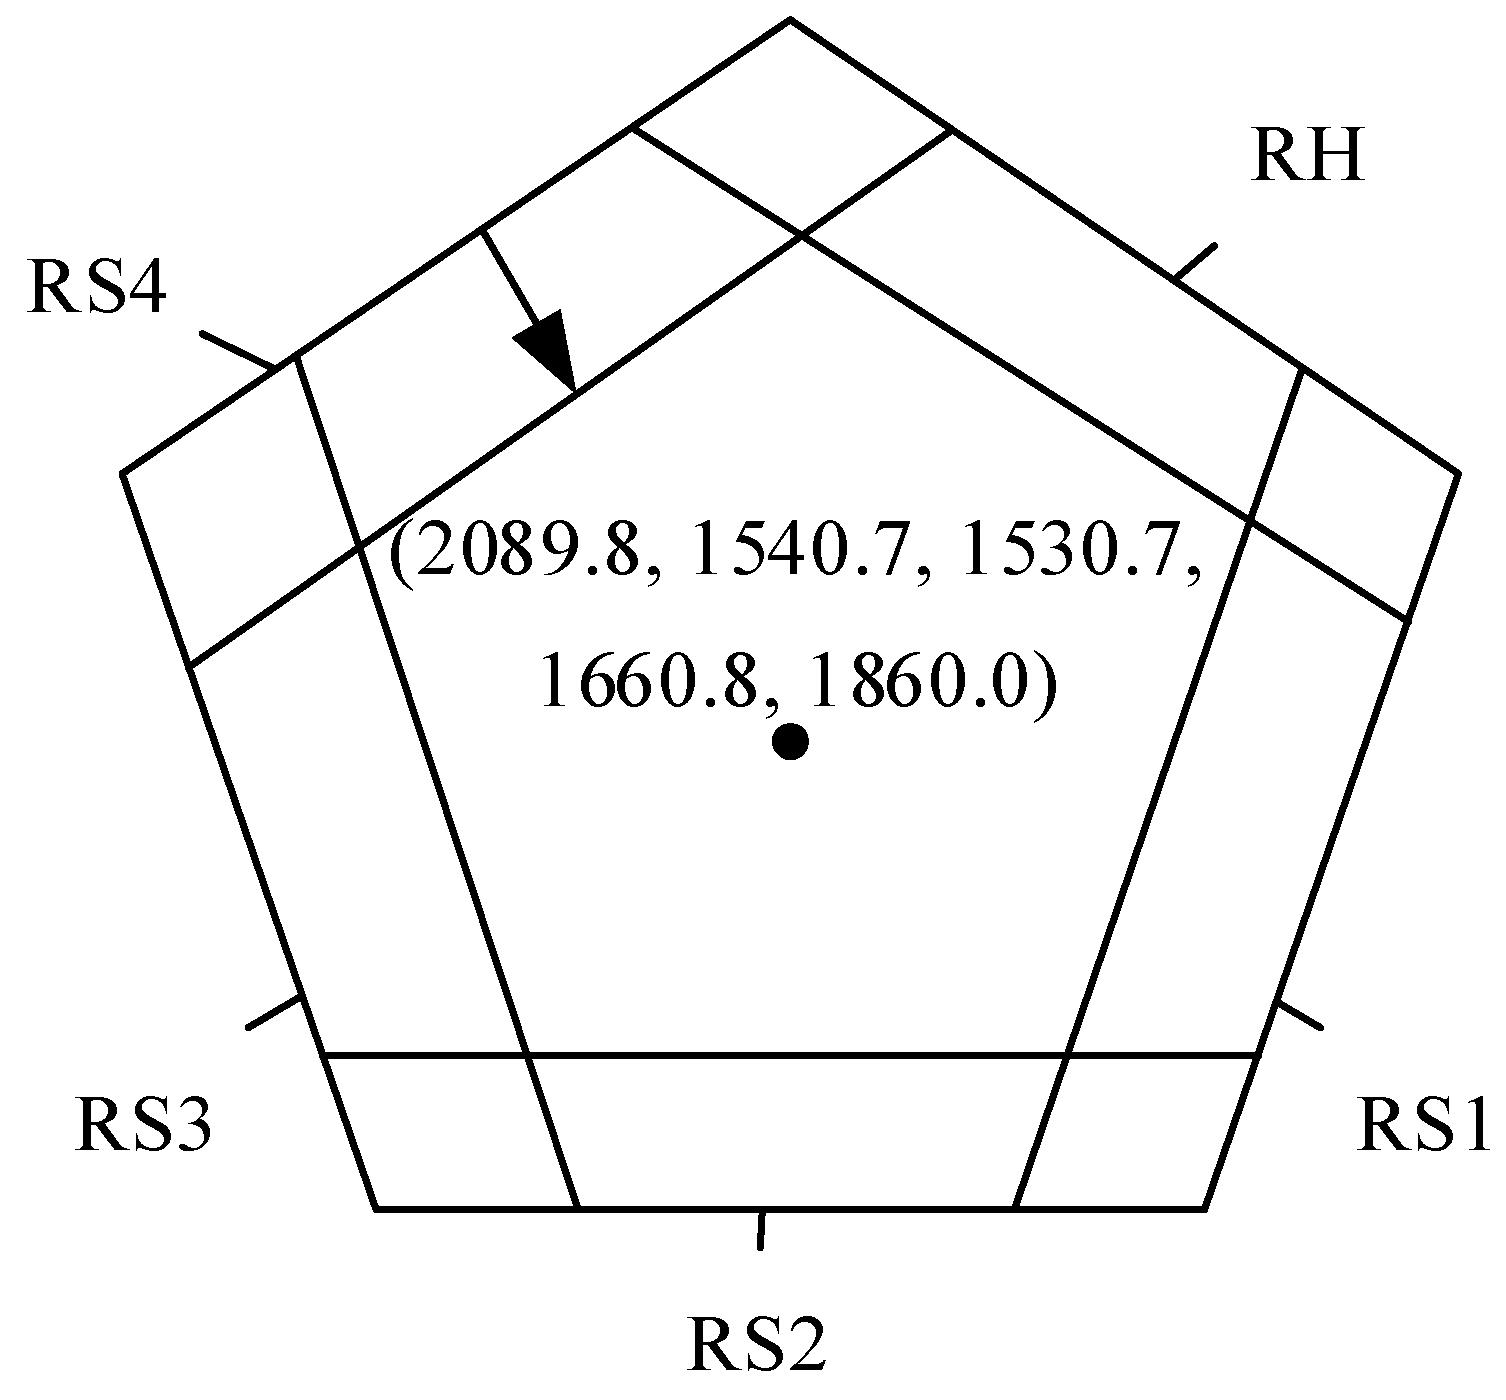
4.5.2. Core Area Calculation

Assuming M members form a cooperative alliance, the core area possesses a closed M-body. Based on the “snowball” theory [50], narrowing the core is conducive to obtain the optimal allocation strategy. Therefore, to get a more accurate plan, we compress each face of the M-body with an unequal proportion, which is defined on the basis of their marginal contribution. Finally, the center of the core is obtained, and can serve as comparison measure for the best allocation plan. The core distribution scheme is calculated using Equation (33).
k N , k j y k + β j σ = v ( N { j } )
s.t.
β j = v ( N ) v ( N { j } ) v ( N )
k N y k = v ( N )
In Equation (33), y k is the allocated profit of participant k , and β j , in Equation (34), is the compression coefficient σ . Based on the marginal contribution of participant j, β j determines the different ratio of inward compression. As stipulated in Equation (35), the sum of the allocated values in the core allocation plan should be equal to the total profit.

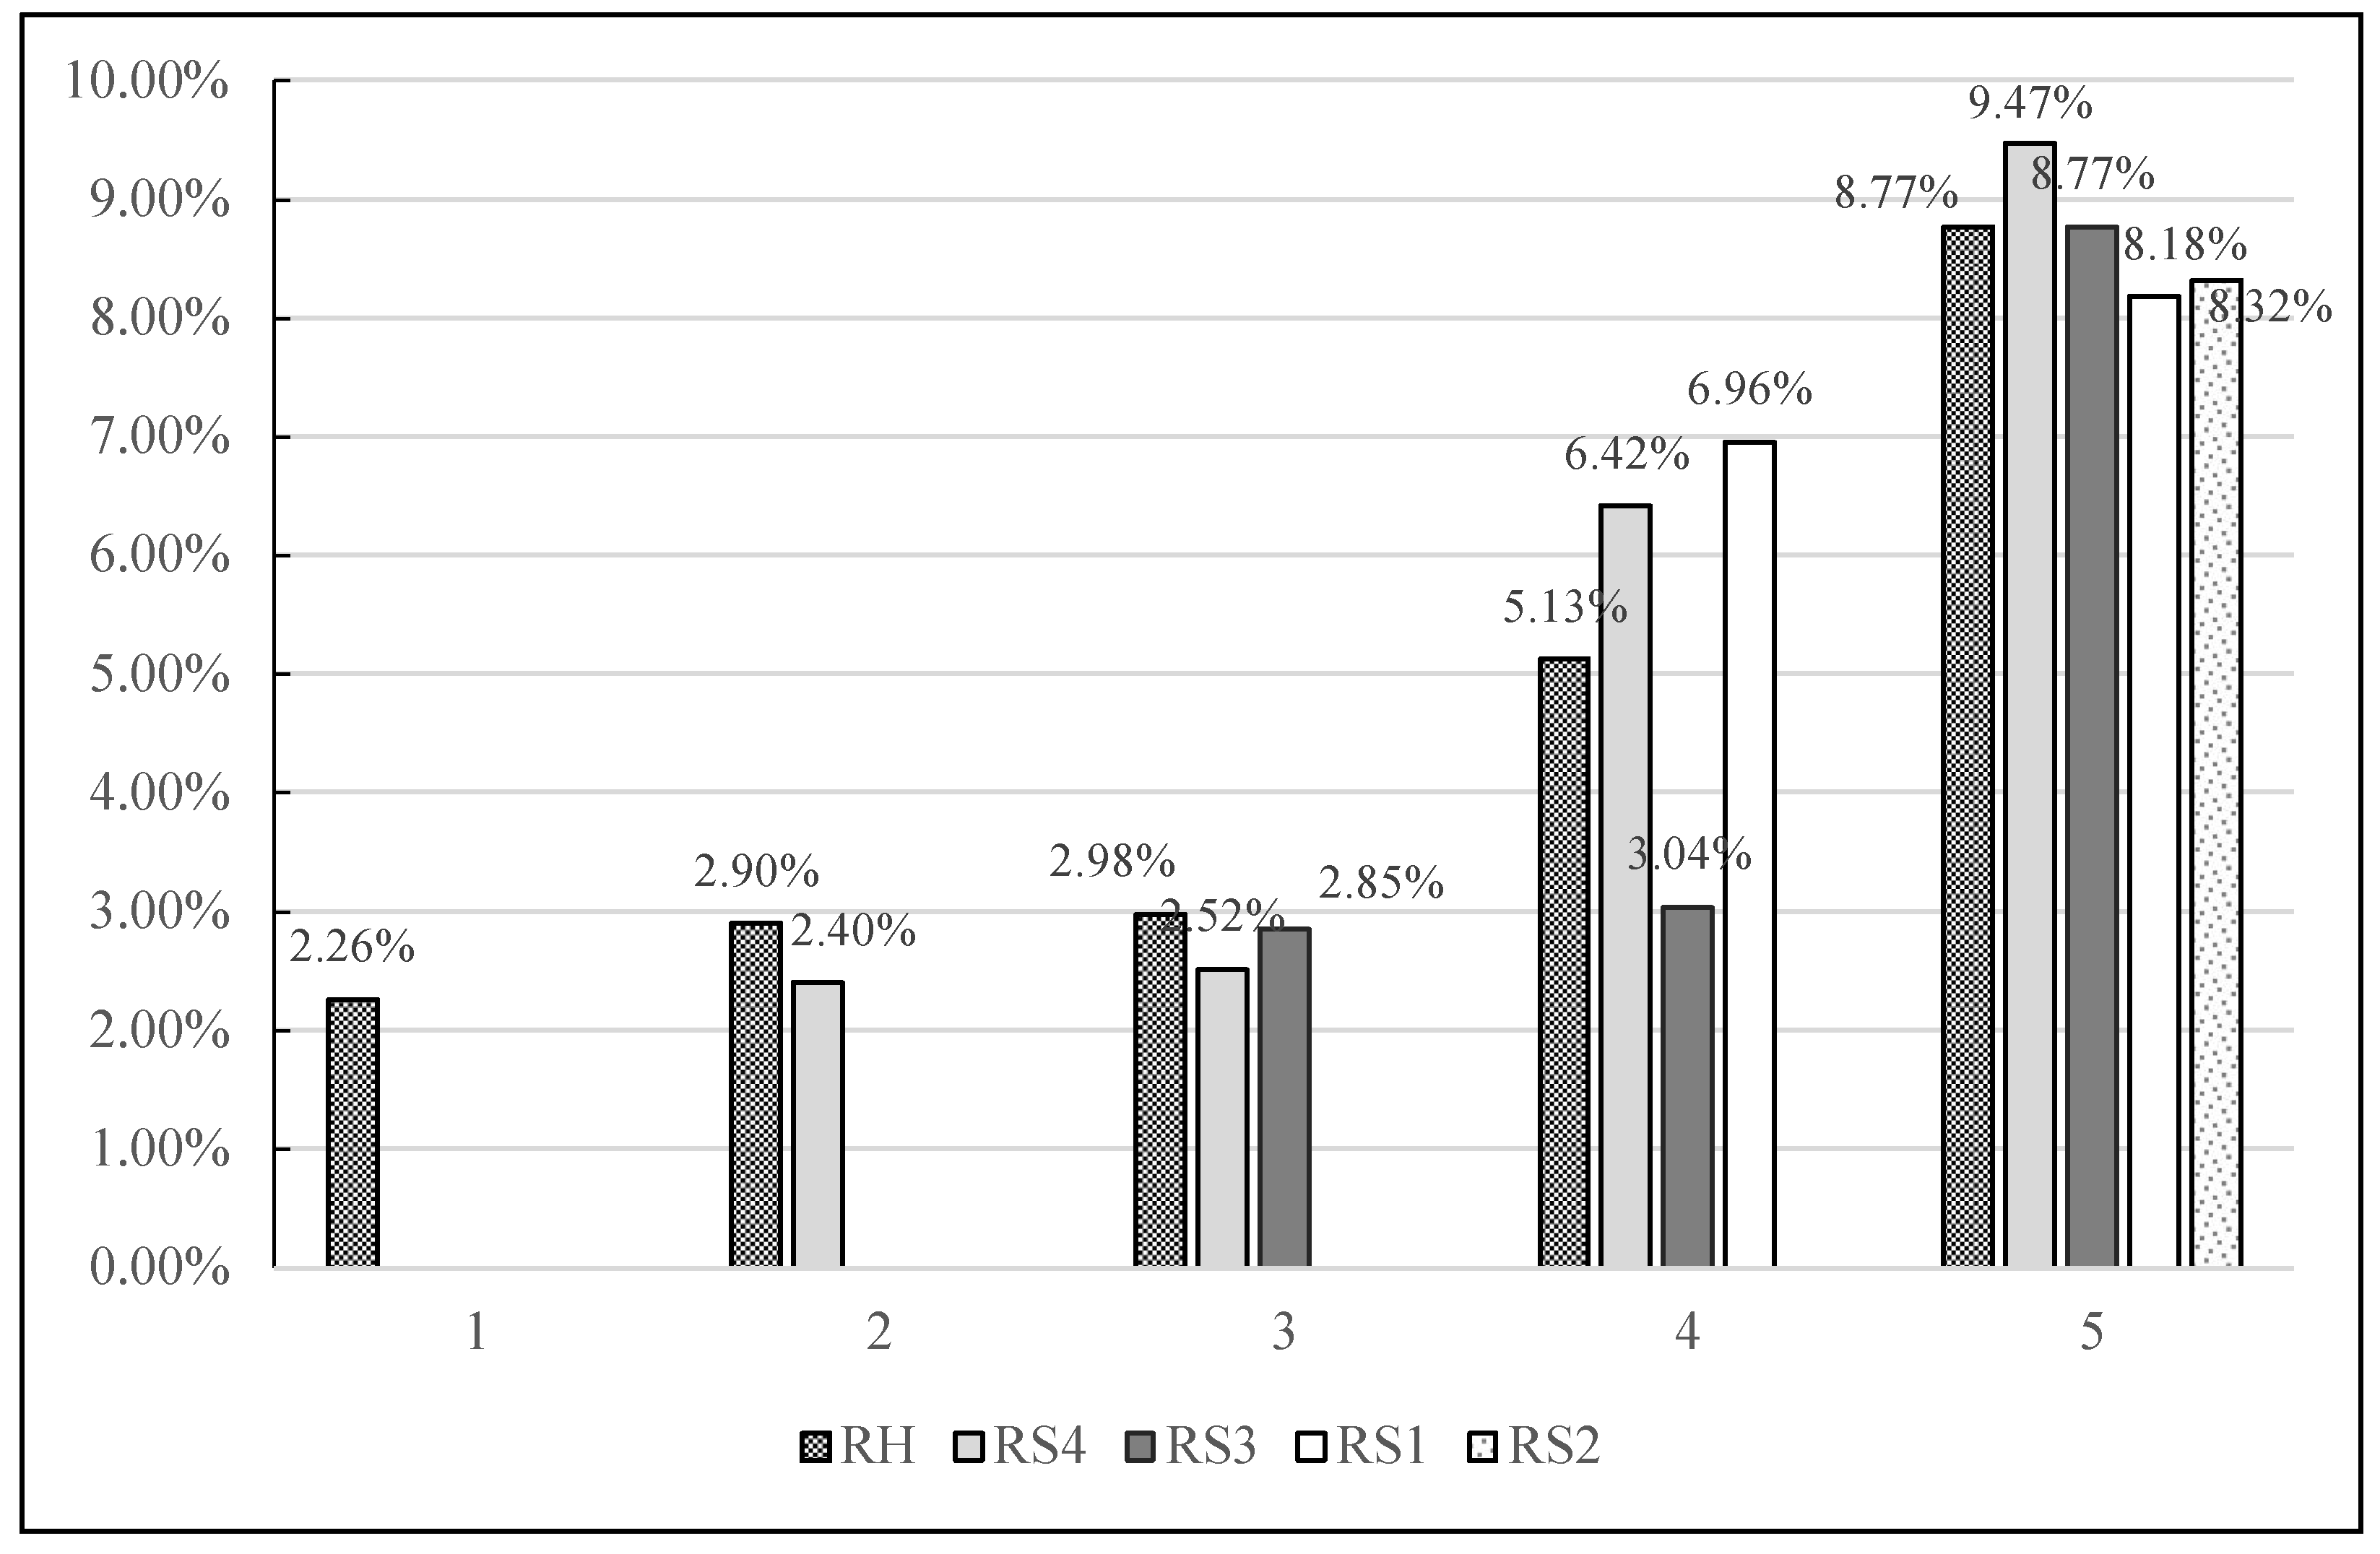
4.5.3. Monotonic Path Selection Strategy

The monotonic path selection strategy is an effective method to evaluate the stability of the alliance based on the profit allocation strategy. There are | T | ! different cooperative sequences in the grand alliance T , and each sequence exhibits varying degrees of stability. π ( i ) represents the rank of participant i in the sequence π .
η ( i , π , u ) = φ ( π ( μ ) u , μ M μ , v ) C 0 ( i ) , π ( i ) u
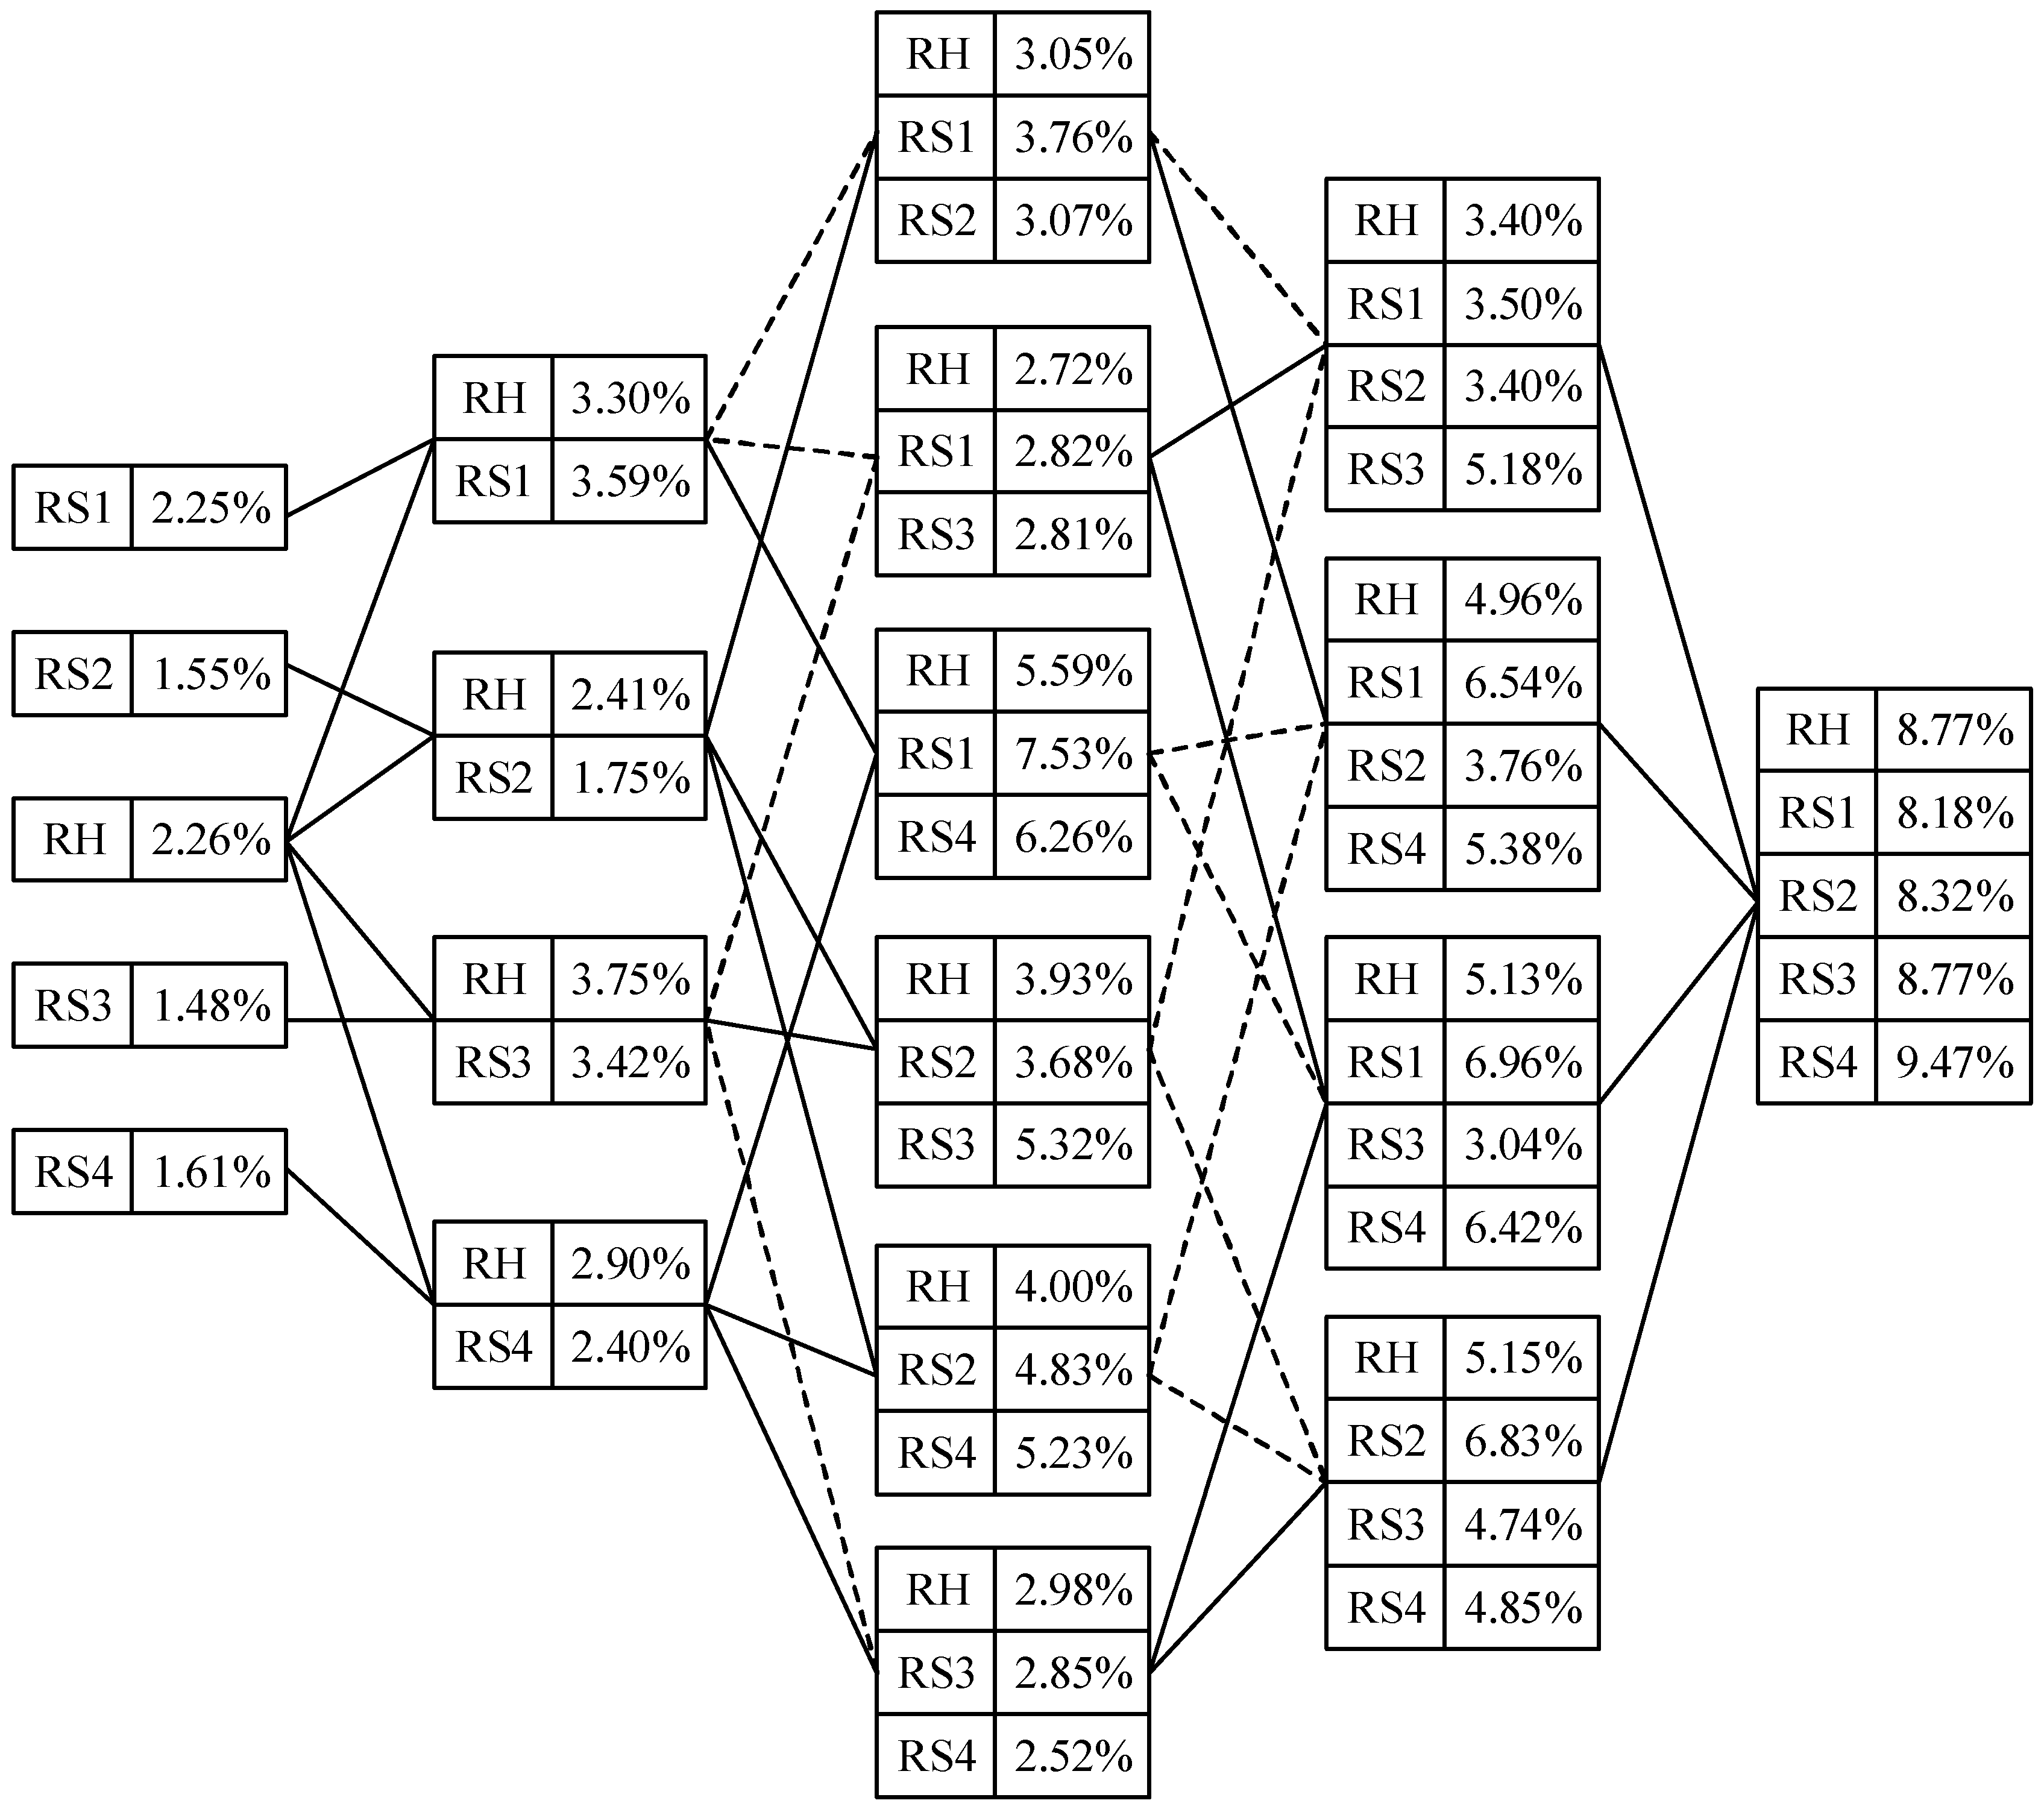
The cost reduction ratio η ( i , π , u ) of participant i in sequence π when member i joins the alliance as the u - t h 
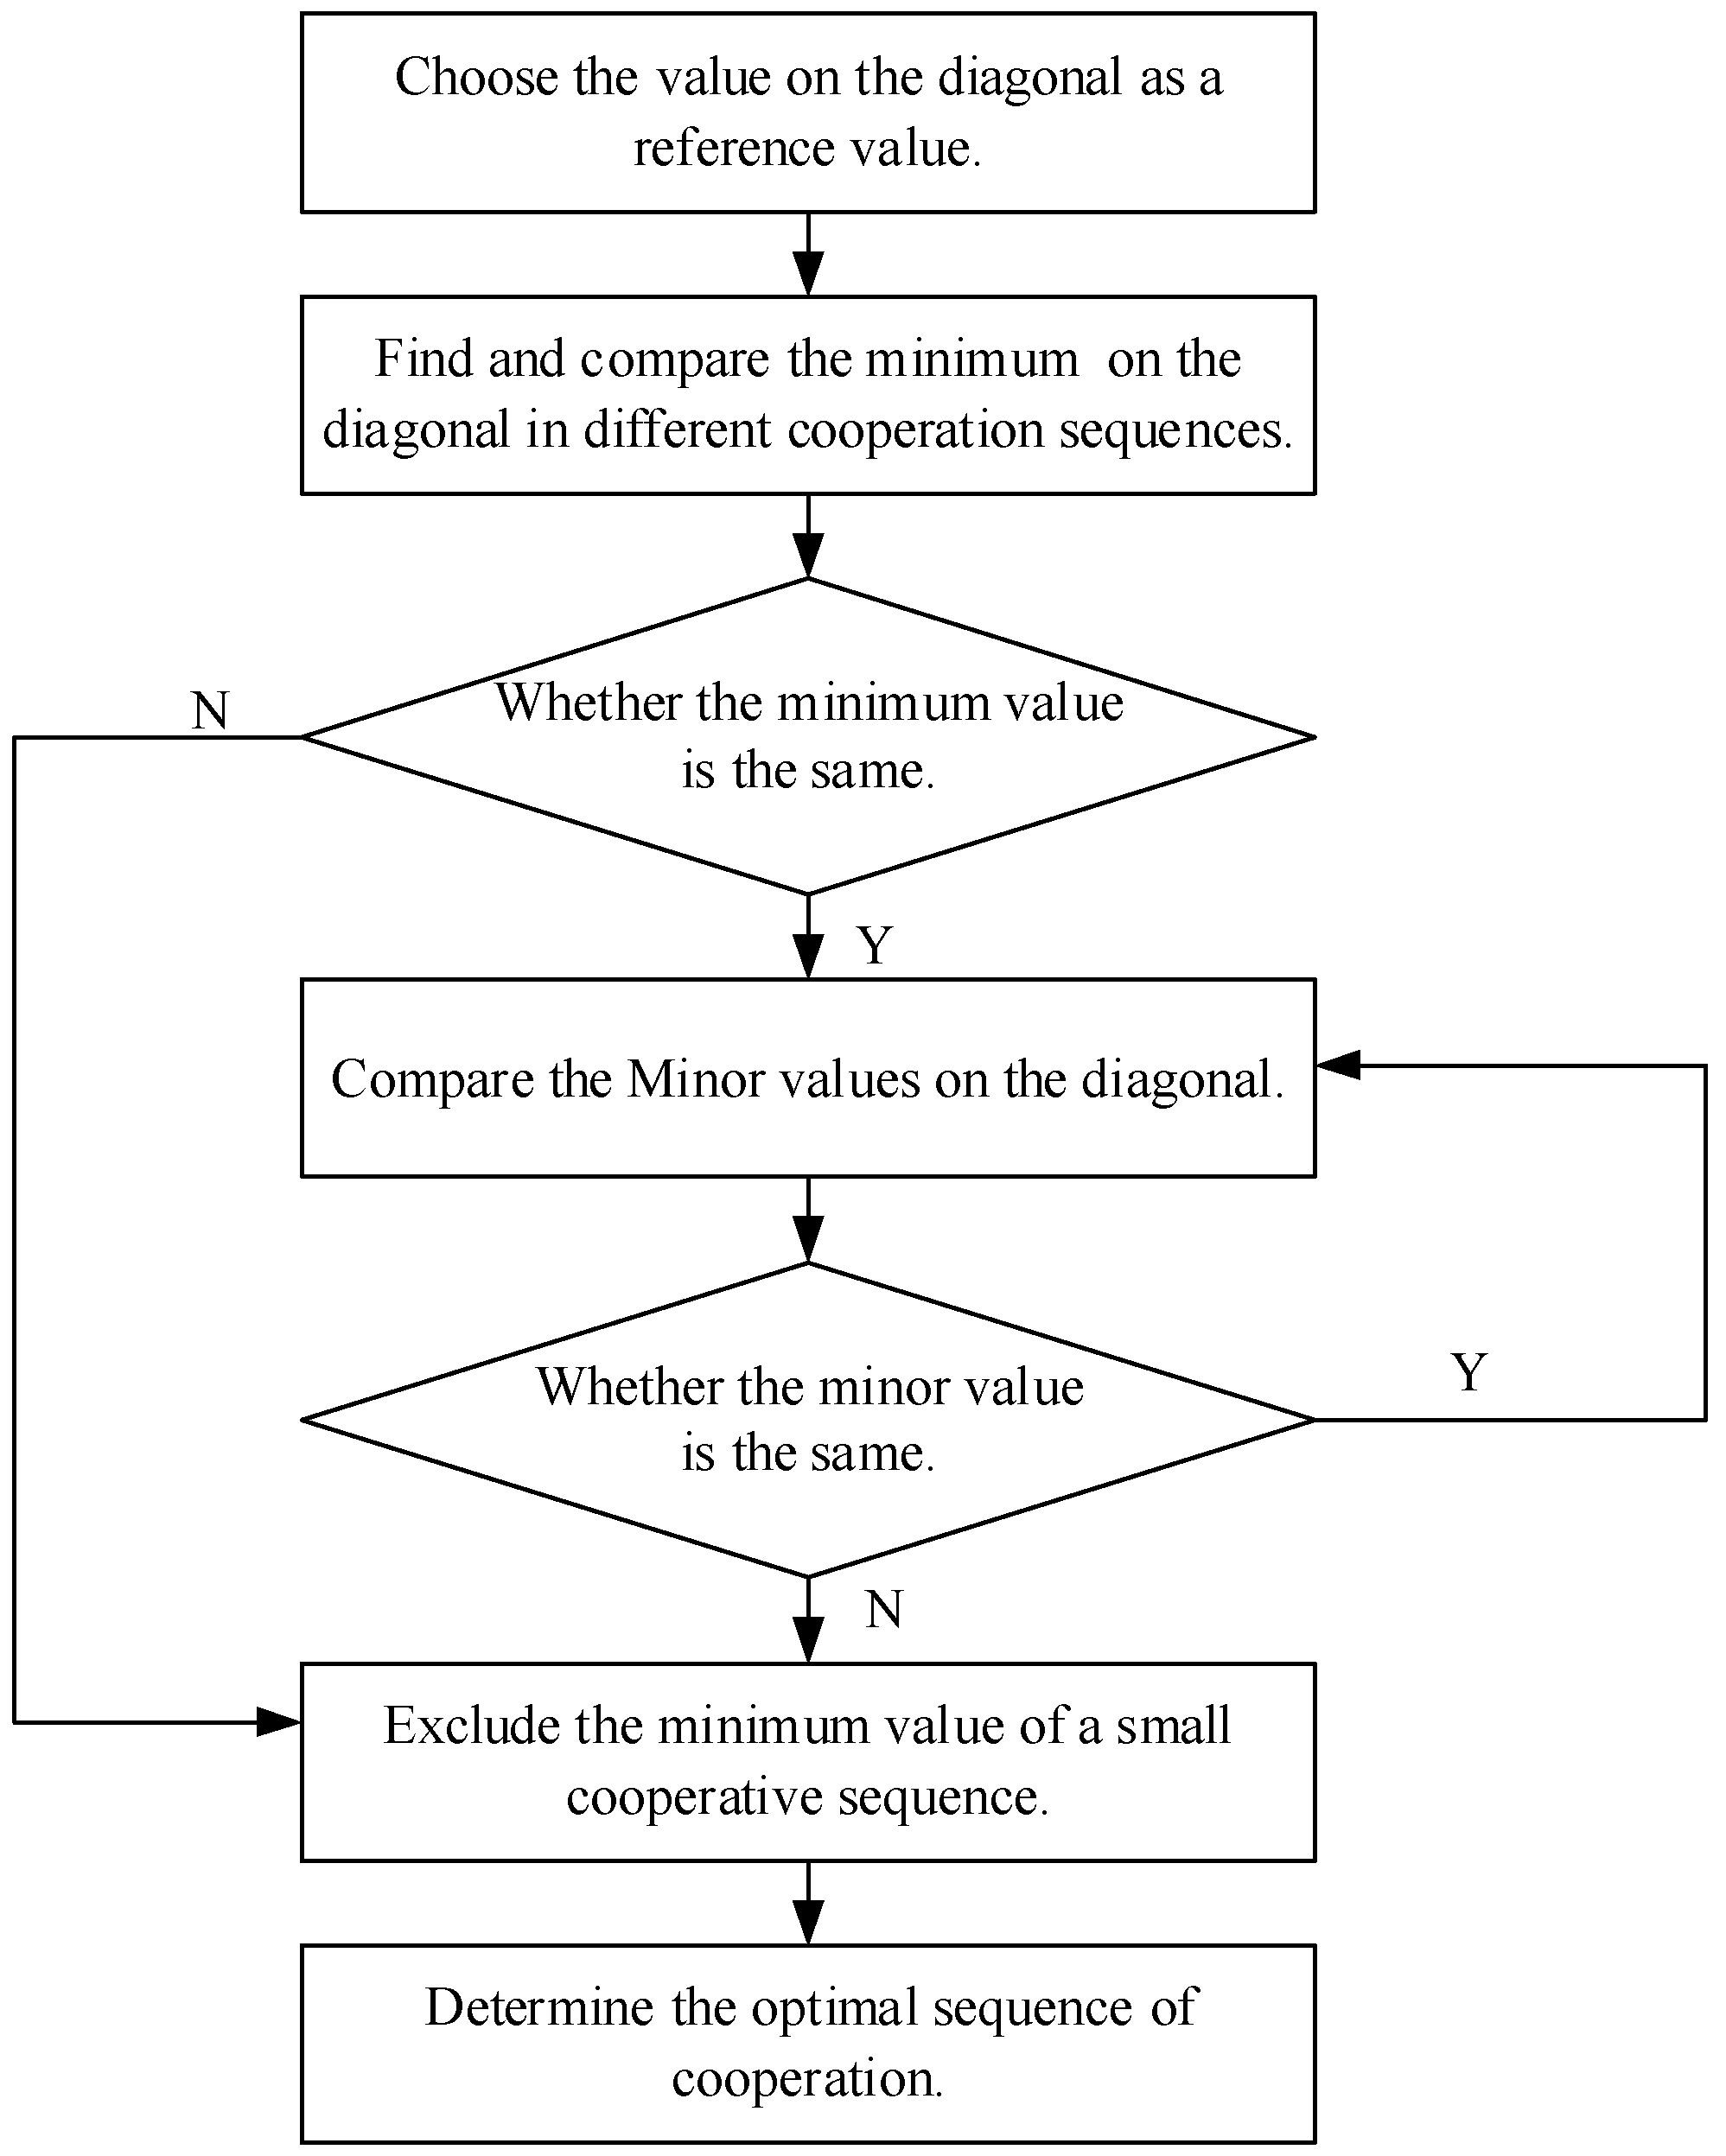
participant can be calculated by the Equation (36). The selection of the monotonic path strategy is based on the reduction percentage of each participant. The effective sequence to select should strictly increase. In other words, the best alliance formation sequence should obey the principle wherein the cost reduction rate of participant i should monotonically increase; such solution is called a Strictly Monotonic Path (SMP). In cases where multiple sequences satisfy the SMP principle, the process presented in Figure 3 can be followed to select the best.

5. Analysis and Implication

5.1. Data Source

A practical two-echelon reverse logistics network in Chengdu, China is used to evaluate the effectiveness of the designed TERLN optimization methodology. As an important city with developed logistics facilities in southwest China, Chengdu is an ideal target for this study due to its status of capital of the Sichuan province, the large number of inhabitants, and the increasing number of logistics companies. A Recycling Hub (RH) and four Retail Stores (RS) are the reverse logistics networks’ facilities, and the 100 customers (C1, C2, …, C100) which are initially assigned to different logistics facilities are marked with different symbols. As shown in Figure 4 customers served by the same logistics facilities are marked with the same symbol. For instance, green bubbles with circle are assigned to RS2. Other logistics facilities and their customers are similarly represented.
The number of collected products from each customer is converted to standard tonnage for more concise and accurate calculations. The numbers of RH and RS’s customers as well as the corresponding collection quantity are given in Table 3.

5.2. Parameter Setting and Optimization Results

To ensure the stable operation of logistics facilities, both fixed and variable costs have been included in the mathematical model. For computations, some of the parameters’ values are collected from real world operation, whereas unknown ones are extracted from previous articles. Based on existing research [51,52,53], the values of relevant parameters used in this paper are given as follows: Q v = 6t; Q s = 13t; f v r = 0.3; f t r = 0.5; T = 52; M s = 4.800; M v = 1.600; λ l = 1.9; λ i = 1.5; F R H = 1455, F R S 1 = 824; F R S 2 = 747; F R S 3 = 674; F R S 4 = 956; Z R H = 645; Z R S 1 = 586; Z R S 2 = 602; Z R S 3 = 563; and Z R S 4 = 621 (refer to Table 1 for their definitions). The storing capacity of each facility is given in Table 3. Besides, some variables are initialized for the optimization with the proposed algorithm: Ps = 150; NoG = 500; NoF = 2; NoR = 10; CI = 0.82 and MI = 0.1.
Based on the model and the parameters, the cost solutions and the numbers of vehicles before and after optimization with CW_NSGA-II are shown in Table 4.
The results in Table 4 indicate that the cost and number of vehicles are effectively saved after TERLN optimization. Since cooperation has been achieved, vehicles no longer need to carry products from distant customers back to the original RS, thus saving transportation costs and improving the efficiency of resources management. Besides, due to vehicle sharing among different logistics facilities, the minimum number of vehicles in the TERLN is also reduced in every type of alliance. Nevertheless, Table 4 shows that the cost and vehicle reductions are more prominent in the grand alliance.
A clearer picture of the relationship between the cost and the number of vehicles before and after optimization is provided in Figure 5. The cost values are displayed on the left ordinates and the number of vehicles on the right ones. We can observe from the diagram that the optimization of both cost and number of vehicles effectively leads to minimum solutions. In addition, with the increase in the number of alliance participants, the cost gaps between non-collaborative and collaborative networks progressively augment. In other words, the more a cooperative alliance covers the recycling network, the greater is the efficiency of its operations and more consistent are profits. The main reason for this improvement is the significant reorganization of the network. The reassignment of customers through clustering allows each retail store to only visit surrounding recycling nodes. We can notice that newly assigned customers can either be the corresponding store’s current customers or be reassigned from another facility in the same alliance. Considering for example RS3, in addition to some of its own customers, the established cooperation required vehicles departing from its store to visit customers of RS1, RS2, RS4 and RH which are located on their routes. Therefore, the system can reach a higher level of fluidity, increase the efficiency of recycling operations, reduce the number of vehicles, and certainly yield a lower rate of non-recovered used products.
To test the performance of the proposed CW_NSGA-II heuristics, 15 tests are conducted on the result of the grand alliance {RH, RS1, RS2, RS3, RS4}. The Multi-Objective Genetic Algorithm (MOGA) and Multi-Objective Particle Swarm Optimization algorithm (MOPSO) are selected to address the grand alliance, and are compared with the CW_NSGA-II’s solution. The application of these two well-known algorithms is supported by their capabilities at performing local and global searches and the efficiency of their solutions. Therefore, the confirmation of the superiority of our designed hybrid algorithm can effectively enhance its relevance for the current case study as well as other vehicle routing problems. Results are compared on the basis of the best cost and number of vehicles solutions yielded by each method for every run. The average values of these objective functions are also used as performance measure. The best solutions of the 15 times computations are summarized in Table 5 along with the average values.
Comparisons show that the proposed CW_NSGA-II algorithm obtains the minimum average cost and number of vehicles, and its solutions for each run are the lowest compared with MOGA and MOPSO. In addition, 5 out the 15 times computations yielded the minimum cost and a significant number of runs obtained solutions close to $90,329. Therefore, CW_NSGA-II’s results converge toward optimality. Besides, despite the similar number of vehicles from all the algorithms out of many runs, the average value gives superiority to our algorithm due to its consistency in yielding the minimum number. In summary, compared to MOGA and MOPSO, CW_NSGA-II is more appropriate to investigate real-world reverse logistics’ recycling networks, and solve vehicle routing problems in both the collaborative and non-collaborative cases.

5.3. MCRS Model Application

Following the optimization of the TERLN, the collective profit generated by forming a cooperative alliance is reasonably allocated to the participants. As mentioned above, since the recycling hub is also a participant in the alliance and already benefits from the profit sharing among facilities, the synergy requirement parameter is defined as zero. Therefore, according to the MCRS model, the profit allocation plan for each alliance is shown in Table 6.
In addition to the cost gaps before and after optimization, Table 6 also presents participants’ allocated profit obtained by MCRS model. With the arrival of new participants, the cost savings increase, and the profit of each logistics facility shows a growing trend. Consequently, the design of the grand alliance yields a larger gap and each facility observes the maximization of its profit. As a result, after all members joined the alliance, the final profit distribution is described as $2112, $1520, $1526, $1627 and $1837 respectively for RH, RS1, RS2, RS3, and RS4. However, the allocated value can vary depending on the order of adhesion. In other words, some participants in the alliance can earn lesser when a new one joins. The geographic locations of customers, the storing capacity of recycling facilities are factors which define the contribution of a reverse logistics facility and can influence the collective profit once the latter joins an alliance. In order to find out the best profit allocation plan which ensures alliance stability and sustainable operations, the evaluation of every possible adhesion sequence proves necessary.

5.4. Sequential Alliance Selection

Different sequences have distinct influences on the profit allocation plan. Therefore, determining the optimal alliance sequence based on the cost reduction percentage is an essential task after computing collective profits. The strictly monotonic path selection principle, as introduced in Section 4.5.3, is employed to examine each sequence in order to find out cases where participants profits monotonically increase. Figure 6 shows the trend of cost reduction percentages throughout the formation of the grand alliance.
The varying reduction percentages of each participant in the cooperative alliance are depicted in Figure 6. The solid lines indicate that existing facilities in the alliance can accept a new coming participant, and dotted lines indicate that the alliance may break up when a new facility joins. For example, in the first column, when retail store RS1 enters the alliance, it gains 2.25% of the cost savings. After joining RH, the cost savings of RS1 increases from 2.25% to 3.59%, while RH saves 3.30%. In view of that increase, RS1 can agree to join with RH. However, in the next stage, if RS2 joins the existing cooperative alliance, RH’s cost savings rate decreases from 3.30% to 3.05%. As a consequence, the adhesion of RS2 is not conducive to the stable operation of the alliance. Thus, such type of cooperation sequence is referred to as non-SMP based coalition. According to this analysis, we summarize in Table 7 all the sequences respecting the SMP principle.
Six cooperative sequences meet the SMP principle, and the participants in each case have achieved substantial cost savings. In Section 4.5.3, we introduced the use of the diagonal principle to handle problems with multiple feasible cooperative sequences. Subsequently with a corresponding cost reduction percentage, each facility in sequence π 2 yields the highest cost saving. Therefore, that sequence can be selected as the optimal solution. Figure 7 describes the change in the cost reduction of the optimal cooperation sequence π 2 = {RH, RS4, RS3, RS1, RS2}. The optimality of the solution can also be supported by the fact that RH as the coordinator sends a positive signal to the remaining facilities in the two-echelon reverse logistics network by agreeing to join first the alliance. Therefore, retail stores RS4, RS3, RS1 and RS2 are encouraged to successively enter, and the logistics facilities in sequence π 2 can reduce their cost by 8.77%, 9.47%, 8.77%, 8.18% and 8.32%, respectively.
To verify the rationality of sequence π 2 ’s profit allocation, four allocation methods are compared to explore the influence their respective strategy on the stability of the alliance. Shapley value model, Equal Profit Method (EPM), Minimum Costs-Remaining Savings (MCRS) and Cost Gap Allocation (CGA) [49,54,55] are selected to distribute profit among participants of the grand alliance. Results are presented in Table 8. With the snowball theory (Section 4.5.2), we calculate the core area, and the distances between the allocation methods and the core center are compared to find the most appropriate and stable strategy. The closest allocation strategy is indeed selected as the best one for the investigated reverse logistics network.
Five participants have joined the cooperative alliance, and constrain the core to form a closed pentahedron. To conveniently describe the core, we represent the pentahedron by a pentagon as illustrated in Figure 8. The five sides represent the five reverse logistics facilities in the network. By compressing each side internally with a non-equal percentage and according to the logistics facilities’ marginal contributions, the core center is reached. Using Equations (33)–(35), and with the variable σ = 1035 , we obtain as core solution: (2089.8, 1540.7, 1530.7, 1660.8, 1860.0).
Furthermore, the core center is compared with the final allocation strategies obtained by the Shapley value, EPM, MCRS and CGA methods. In Table 9, the solution provided by MCRS has the minimum distance (51.0) from the core, followed by Shapley value method with a relatively small distance (207.2). The distance between EPM or CGA and the core area, respectively 857.2 and 775.5, are very large. Therefore, selecting the proposed MCRS method is the best decision to ensure a stable and sustainable alliance.

5.5. Analysis and Implications

5.5.1. Analysis

The TERLN optimization saves the total cost of the whole network, and the participants in the cooperative alliance gain additional benefits. From our studies, we observe that the entry of a new member always affects the reliability of the cooperation among logistics facilities, and these effects can either improve or undermine the stability of the alliance. For instance, the second and third columns in Figure 6 illustrate that retail store RS1 benefits from its partnership with the recycling hub, but the adhesion of RS2 disturbs the stability of their alliance by causing the decrease of the recycling hub’s cost reduction percentage. Therefore, for the long-term and sustainable development of the reverse network, decision makers need to first consider every possible sequential coalition. Meanwhile, the evaluation of each sequence satisfaction of the SMP principle is also important to ensure the efficiency of the cooperative mechanism. Based on the diagonal rule, an optimal sequence of cooperation is found: RH first joins the cooperation before RS4, RS3, RS1 and RS2 successively enter. Compared with other cooperation sequences, the optimal sequence can allow every member increase cost savings when they join the alliance in the first place. The consistency of the profits after cooperation can attract more retailers and manufacturing companies to invest in end-of-used and end-of-life products recycling, and thereby strengthen the sustainable and environment-friendly development of urban areas.
With an increase in the number of participants in the alliance, Figure 7 reveals that the percentage increase of the existing participants is different. When RH singly joins the cooperative alliance, it only gains 2.26% of the cost savings. Further, with the agreement of RS4 to participate, RH’s savings percentage increases from 2.26% to 2.90%; another augmentation is observed after the adhesion of RS3 and reaches 2.98%. Until then, the percentage increase is slight; but when the number of participants reaches four after RS1 adhesion, RH’s cost savings almost doubles (5.13%). The same situation can be verified with other participants.
In practice, retail stores can only optimize part of their covered network with a small number of partners, and part of the collection routes still counts long-distance trips to recycle products. Consequently, the minimum cost objective is not properly attained and profits are relatively lower. However, spreading the cooperative recycling network can drive to a more comprehensive assignment of customers and the overall travelled distance can reduce. Meanwhile, the retail store can fully use shared vehicles and semitrailers for its operations, and also reduce transportation resources’ maintenance costs.

5.5.2. Implications

The TERLN optimization based on semitrailers and vehicle sharing provides a good routing system by incorporating cooperation between retail stores and recycling hubs. Cooperation mechanism is conducive to improve the effectiveness and flexibility of the collection system. In brief, logistics companies and local governments can encourage the cooperation among recycling entities for the flexible improvement of the reverse logistics network. The managerial implications of the proposed TERLN optimization methodology can be summarized as following:
  • The establishment of the cooperative alliance effectively avoids long-distance transportation in the process of products collection. Each participant can save transportation costs and gain additional benefits. Nevertheless, the reverse logistics network can also be subject to operational uncertainties [56]. Therefore, the influence of cooperation on the system’s flexibility under uncertainty can also be addressed to improve the reliability of generated cooperative alliances.
  • The proposed methodology provides reasons to manufacturing companies and local governments on the existence of sustainable ways to reduce atmospheric pollution. Through cooperation, a better recycling network is designed and every logistics facility engaged in collection activities can significantly contribute to environmental protection. Consequently, industrial waste resources management can be improved, and remanufacturing can be propelled.
  • Vehicles and semitrailer trucks sharing are important cooperative strategies which help companies achieve the efficient use of their transportation resources and contribute to reduce recycling trips. In practice, cooperation between companies does not always integrate transportation means sharing. But, based on our findings, we strongly suggest the sharing of collection vehicles among logistics facilities in order to minimize costs.
  • Vehicles sharing and semitrailer trucks sharing, to some extent, is also conducive to the sustainable development of cities. While saving the use of vehicles, logistics companies can reduce environmental pollution caused by vehicles’ trip for used products collection and decrease the complexity of the transportation system.

6. Conclusions

This paper proposes a three-phase method to address two echelons reverse logistics networks optimization problems. With regards to the numerous difficulties related to end-of-used and end-of-life products recycling operations, the proposed TERLN optimization strategy considers cooperation as well as vehicles and semitrailers sharing to enable companies recycle with less costs. A bi-objective programming model considering the existence of cooperative alliances is proposed to achieve cost savings. In addition, the number of vehicles is minimized to evaluate the importance of resources sharing as conditional clause of the cooperation contract. Moreover, collection vehicles are allowed to return to any logistics facility of the alliance as long as the latter is the closest to the last visited customer. Thereby, the minimized total distance improves the cost solution of collaborative networks, and the amount of carbon emission can decrease due to the elimination of long distance trips. This approach is conducive to the sustainable urban development as well as logistics facilities healthy economy.
The two-echelon vehicle routing optimization is achieved by reasonably integrating the Clarke–Wright savings algorithm and the non-dominated genetic algorithm-II. CW is applied during solutions initialization to obtain good quality sub-optimal solutions, and improve the results of the CW_NSGA-II. The proposed hybrid heuristics is later proven as the best approach compared to MOGA and MOPSO algorithms. Furthermore, the total cost savings from the formation of cooperative alliances is properly distributed among participating facilities. The equitable distribution of these profits is undertaken by using MCRS method. Based on the SMP principle and the diagonal rule, an optimal cooperation sequence is found to offer participants satisfactory profits. Key to the long-term stability of the alliance, the best possible allocation strategy is determined through comparisons of the solutions of four different methods: the Shapley value model, equal profit method, minimum costs-remaining savings and cost gap allocation. Finally, MCRS method is confirmed as the best allocation method because of its shortest distance to the core center. Therefore, our selected method entirely meets the requirements for a stable alliance.
From a practical aspect, this research encourages recycling hubs and retail stores to cooperate and increase the reliability of their services. As part of an alliance, these logistics facilities can easily and efficiently cover up the entire network, strengthen their influence on the market, and above all make more profits. Concerned with environmental problems, engaging in cooperative alliances can allow them to increase the amount of collected products. As a direct consequence, the size of uncovered products, source of environment pollution, is reduced. In addition, this article suggests the sharing of vehicles and semitrailer trucks as conditional clause of the cooperation’s agreement, not only to improve transportation resources management, but also reduce carbon dioxide emission.
Moreover, the proposed bi-objective mathematical model and hybrid algorithm can provide substantial support for further theoretical research and practical application. The model is established to simultaneously solve cost and vehicle number minimization objective functions, and reduce environmental impacts, whereas the algorithm is designed to enable decision makers to choose the most beneficial recycling vehicle routing solution for the sustainable development of urban and sub-urban areas. On the one hand, horizontal and vertical cooperation are fully reflected in the optimization of the TERLN, and managers can make the most favorable choice on the basis of the different profit allocation strategies. On the other hand, the savings generated by the implementation of cooperation mechanism displays the particularity of our solution methodology for environmental protection at lower costs, and can propel logistics companies waste recycling activities. Furthermore, the improvements in the network’s configuration after cooperation can serve as reference for governments’ policy makers to establish better development strategies.
Future research can be conducted from the following aspects: (1) Considering the stochasticity of the amount of collected products during each vehicle’s trip; (2) Investigating the potential relationship between vehicle sharing and alliance stability; (3) Considering the effects of real-time traffic condition on the stability of the cooperative alliance and transportation costs.

Author Contributions

Yong Wang and Kevin Assogba conceived and designed the experiments; Shouguo Peng performed the experiments; Shouguo Peng and Kevin Assogba analyzed the data; Yong Wang, Yong Liu, Haizhong Wang, Maozeng Xu and Yinhai Wang contributed reagents/materials/analysis tools; Shouguo Peng and Kevin Assogba wrote the paper. All the authors approved the final manuscript.

Acknowledgments

The authors declare that there is no conflict of interest regarding the publication of this paper. This research is supported by National Natural Science Foundation of China (Project No. 71402011, 71301180, 71471024, 41401255, 71432003), China Postdoctoral Science Foundation (Project No. 2017T100692 and 2016M600735), National Social Science Foundation of Chongqing of China (No. 2017YBGL133), Natural Science Foundation of Chongqing of China (No. cstc2015jcyjA30012), Postdoctoral Science Foundation of Sichuan Province, China (2017-22), and this research is partly supported by the key project of human social science of Chongqing Municipal Education Commission (17SKG067, 16SKGH067). In addition, the research is also partly supported by the Fundamental Research Funds for Central Universities (YWF-17-BJ-Y-04).

Conflicts of Interest

The authors declare no conflict of interest.

References

  1. Rogers, D.S.; Tibben-Lembke, R. An examination of reverse logistics practices. J. Bus. Logist. 2011, 22, 129–148. [Google Scholar] [CrossRef]
  2. Perboli, G.; Tadei, R.; Vigo, D. The two-echelon capacitated vehicle routing problem: models and math-based heuristics. Transp. Sci. 2008, 45, 364–380. [Google Scholar] [CrossRef]
  3. Hua, Z.; Wen, Z.G. The consumption and recycling collection system of pet bottles: A case study of Beijing, China. Waste Manag. 2014, 34, 987–998. [Google Scholar]
  4. Wang, Y.; Ma, X.L.; Xu, M.Z.; Liu, Y.; Wang, Y.H. Two-echelon logistics distribution region partitioning problem based on a hybrid particle swarm optimization-genetic algorithm. Expert Syst. Appl. 2015, 42, 5019–5031. [Google Scholar] [CrossRef]
  5. Li, H.Q.; Yuan, J.L.; Lv, T.; Chang, X.Y. The two-echelon time-constrained vehicle routing problem in linehaul-delivery systems considering carbon dioxide emissions. Transp. Res. Part D Transp. Environ. 2016, 49, 231–245. [Google Scholar] [CrossRef]
  6. Crevier, B.; Cordeau, J.F.; Laporte, G. The multi-depot vehicle routing problem with inter-depot routes. Eur. J. Oper. Res. 2007, 176, 756–773. [Google Scholar] [CrossRef]
  7. Ho, W.; Ho, G.T.S.; Ji, P.; Lau, H.C.W. A hybrid genetic algorithm for the multi-depot vehicle routing problem. Eng. Appl. Artif. Intell. 2008, 21, 548–557. [Google Scholar] [CrossRef]
  8. Bettinelli, A.; Ceselli, A.; Righini, G. A branch-and-cut-and-price algorithm for the multi-depot heterogeneous vehicle routing problem with time windows. Transp. Res. Part C Emerg. Technol. 2011, 19, 723–740. [Google Scholar] [CrossRef]
  9. Kuo, Y.Y.; Wang, C.C. A variable neighborhood search for the multi-depot vehicle routing problem with loading cost. Expert Syst. Appl. 2012, 39, 6949–6954. [Google Scholar] [CrossRef]
  10. Allahyari, S.; Salari, M.; Vigo, D. A hybrid metaheuristic algorithm for the multi-depot covering tour vehicle routing problem. Eur. J. Oper. Res. 2015, 242, 756–768. [Google Scholar] [CrossRef]
  11. Montoya, A.; Guéret, C.; Mendoza, J.E.; Villegas, J.G. A multi-space sampling heuristic for the green vehicle routing problem. Transp. Res. Part C Emerg. Technol. 2016, 70, 113–128. [Google Scholar] [CrossRef] [Green Version]
  12. Poonthalir, G.; Nadarajan, R. A Fuel Efficient Green Vehicle Routing Problem with varying speed constraint (F-GVRP). Expert Syst. Appl. 2018, 100, 131–144. [Google Scholar] [CrossRef]
  13. Lee, J.E.; Chung, K.Y.; Lee, K.D.; Gen, M. A multi-objective hybrid genetic algorithm to minimize the total cost and delivery tardiness in a reverse logistics. Multimed. Tools Appl. 2015, 74, 9067–9085. [Google Scholar] [CrossRef]
  14. Liao, T.Y. Reverse Logistics Network Design for Product Recovery and Remanufacturing. Appl. Math. Model. 2018, 60, 145–163. [Google Scholar] [CrossRef]
  15. Molina, J.C.; Eguia, I.; Racero, J.; Guerrero, F. Multi-objective vehicle routing problem with cost and emission functions. Procedia Soc. Behav. Sci. 2014, 160, 254–263. [Google Scholar] [CrossRef]
  16. Cattaruzza, D.; Absi, N.; Feillet, D.; Vidal, T. A memetic algorithm for the multi trip vehicle routing problem. Eur. J. Oper. Res. 2014, 236, 833–848. [Google Scholar] [CrossRef]
  17. Vidović, M.; Ratković, B.; Bjelić, N.; Popović, D. A two-echelon location-routing model for designing recycling logistics networks with profit: MILP and heuristic approach. Expert Syst. Appl. 2016, 51, 34–48. [Google Scholar] [CrossRef]
  18. Yu, V.F.; Jewpanya, P.; Redi, A.A.N.P. Open vehicle routing problem with cross-docking. Comput. Ind. Eng. 2016, 94, 6–17. [Google Scholar] [CrossRef]
  19. Huang, Y.; Zhao, L.; Woensel, T.V.; Gross, J.P. Time-dependent vehicle routing problem with path flexibility. Transp. Res. Part B Methodol. 2017, 95, 169–195. [Google Scholar] [CrossRef]
  20. Wang, S.Y.; Tao, F.M.; Shi, Y.H.; Wen, H.L. Optimization of vehicle routing problem with time windows for cold chain logistics based on carbon tax. Sustainability 2017, 9, 694. [Google Scholar] [CrossRef]
  21. Bányai, Á.; Bányai, T.; Illés, B. Optimization of consignment-store-based supply chain with black hole algorithm. Complexity 2017, 2017, 1–12. [Google Scholar] [CrossRef]
  22. Wang, Y.; Ma, X.L.; Lao, Y.T.; Wang, Y.H. A Fuzzy-based Customer Clustering Approach with Hierarchical Structure for Logistics Network Optimization. Expert Syst. Appl. 2014, 41, 521–534. [Google Scholar] [CrossRef]
  23. Faulin, J.; Juan, A.; Lera, F.; Grasman, S. Solving the Capacitated Vehicle Routing Problem with Environmental Criteria Based on Real Estimations in Road Transportation: A Case Study. Procedia Soc. Behav. Sci. 2011, 20, 323–334. [Google Scholar] [CrossRef]
  24. Kumar, V.S.; Thansekharb, M.R.; Saravananc, R.; Amalid, S.M.J. Solving multi-objective vehicle routing problem with time windows by FAGA. Procedia Eng. 2014, 97, 2176–2185. [Google Scholar] [CrossRef]
  25. Qi, Y.T.; Hou, Z.T.; Li, H.; Huang, J.B.; Li, X.D. A decomposition based memetic algorithm for multi-objective vehicle routing problem with time windows. Comput. Oper. Res. 2015, 62, 61–67. [Google Scholar] [CrossRef]
  26. García-Nájera, A.; Bullinaria, J.A.; Gutiérrez-Andrade, M.A. An evolutionary approach for multi-objective vehicle routing problems with backhauls. Comput. Ind. Eng. 2015, 81, 90–108. [Google Scholar] [CrossRef]
  27. Zhou, Y.J.; Lee, G.M. A Lagrangian Relaxation-Based Solution Method for a Green Vehicle Routing Problem to Minimize Greenhouse Gas Emissions. Sustainability 2017, 9, 776. [Google Scholar] [CrossRef]
  28. Bányai, T. Supply chain optimization of outsourced blending technologies. J. Appl. Econ. Sci. 2017, 12, 960–976. [Google Scholar]
  29. Wang, Y.; Ma, X.L.; Liu, M.W.; Gong, K.; Liu, Y.; Xu, M.Z.; Wang, Y.H. Cooperation and profit allocation in two-echelon logistics joint distribution network optimization. Appl. Soft Comput. 2017, 56, 143–157. [Google Scholar] [CrossRef]
  30. Wang, Y.; Ma, X.L.; Li, Z.B.; Liu, Y.; Xu, M.Z.; Wang, Y.H. Profit distribution in collaborative multiple centers vehicle routing problem. J. Clean. Prod. 2017, 144, 203–219. [Google Scholar] [CrossRef]
  31. Braekers, K.; Caris, A.; Janssens, G.K. Exact and meta-heuristic approach for a general heterogeneous dial-a-ride problem with multiple depots. Transp. Res. Part B Methodol. 2014, 67, 166–186. [Google Scholar] [CrossRef]
  32. Zhou, X.; Zhou, Y. Designing a multi-echelon reverse logistics operation and network: A case study of office paper in Beijing. Resour. Conserv. Recycl. 2015, 100, 58–69. [Google Scholar] [CrossRef]
  33. Defryn, C.; Sörensen, K. Multi-objective optimisation models for the travelling salesman problem with horizontal cooperation. Eur. J. Oper. Res. 2018, 267, 891–903. [Google Scholar] [CrossRef]
  34. He, J.L.; Zhang, W.M.; Huang, Y.F.; Yan, W. A simulation optimization method for internal trucks sharing assignment among multiple container terminals. Adv. Eng. Inform. 2013, 27, 598–614. [Google Scholar] [CrossRef]
  35. Ma, J.; Li, X.; Zhou, F.; Hao, W. Designing optimal autonomous vehicle sharing and reservation systems: A linear programming approach. Transp. Res. Part C Emerg. Technol. 2017, 84, 124–141. [Google Scholar] [CrossRef]
  36. Tinoco, S.V.P.; Creemers, S.; Boute, R.N. Collaborative shipping under different cost-sharing agreements. Eur. J. Oper. Res. 2017, 263, 827–837. [Google Scholar] [CrossRef]
  37. Fernández, E.; Roca-Riu, M.; Speranza, M.G. The Shared Customer Collaboration Vehicle Routing Problem. Eur. J. Oper. Res. 2018, 265, 1078–1093. [Google Scholar] [CrossRef]
  38. Agussurja, L.; Lau, H.C.; Cheng, S.F. Achieving Stable and Fair Profit Allocation with Minimum Subsidy in Collaborative Logistics. IEEE Commun. Lett. 2016, 11, 970–972. [Google Scholar]
  39. Özener, O.Ö.; Ergun, Ö. Allocating costs in a collaborative transportation procurement network. Transp. Sci. 2008, 42, 146–165. [Google Scholar] [CrossRef]
  40. Cruijssen, F.; Borm, P.; Fleuren, H.; Hamers, H. Supplier-initiated outsourcing: A methodology to exploit synergy in transportation. Eur. J. Oper. Res. 2010, 207, 763–774. [Google Scholar] [CrossRef]
  41. Lv, X.; Wang, N.; Zhen, Y.; Chen, H. Shipper collaboration with pickup and delivery requests in reverse logistics. IFAC-PapersOnLine 2016, 49, 1868–1873. [Google Scholar] [CrossRef]
  42. Rosenthal, E.C. A cooperative game approach to cost allocation in a rapid-transit network. Transp. Res. Part B Methodol. 2017, 97, 64–77. [Google Scholar] [CrossRef]
  43. Wu, Q.; Ren, H.B.; Gao, W.J.; Ren, J.X.; Lao, C.S. Profit allocation analysis among the distributed energy network participants based on Game-theory. Energy 2017, 118, 783–794. [Google Scholar] [CrossRef]
  44. Crainic, T.G.; Ricciardi, N.; Storchi, G. Models for Evaluating and Planning City Logistics Systems. Transp. Sci. 2009, 43, 432–454. [Google Scholar] [CrossRef]
  45. Clarke, G.; Wright, J.W. Scheduling of vehicles from a central depot to a number of delivery points. Oper. Res. 1964, 12, 568–581. [Google Scholar] [CrossRef]
  46. Segerstedt, A. A simple heuristic for vehicle routing—A variant of clarke and wright’s saving method. Int. J. Prod. Econ. 2014, 157, 74–79. [Google Scholar] [CrossRef]
  47. Deb, K.; Pratap, A.; Agarwal, S.; Meyarivan, T. A fast and elitist multiobjective genetic algorithm: NSGA-II. IEEE Trans. Evol. Comput. 2002, 6, 182–197. [Google Scholar] [CrossRef]
  48. Wang, Y.; Assogba, K.; Liu, Y.; Ma, X.; Xu, M.; Wang, Y. Two-echelon location-routing optimization with time windows based on customer clustering. Expert Syst. Appl. 2018, 104, 244–260. [Google Scholar] [CrossRef]
  49. Tijs, S.N.; Driessen, T.S.H. Game theory and cost allocation problems. Manag. Sci. 1986, 32, 1015–1028. [Google Scholar] [CrossRef]
  50. Lozano, S.; Moreno, P.; Adenso-Díaz, B.; Algaba, E. Cooperative game theory approach to allocating benefits of horizontal cooperation. Eur. J. Oper. Res. 2013, 229, 444–452. [Google Scholar] [CrossRef]
  51. Ghoseiri, K.; Ghannadpour, S.F. A hybrid genetic algorithm for multi-depot homogenous locomotive assignment with time windows. Appl. Soft Comput. 2010, 10, 53–65. [Google Scholar] [CrossRef]
  52. Kuo, R.J.; Han, Y.S. A hybrid of genetic algorithm and particle swarm optimization for solving bi-level linear programming problem—A case study on supply chain model. Appl. Math. Model. 2011, 35, 3905–3917. [Google Scholar] [CrossRef]
  53. Govindan, K.; Jafarian, A.; Khodaverdi, R.; Devika, K. Two-echelon multiple vehicle location-routing problem with time windows for optimization of sustainable supply chain network of perishable food. Int. J. Prod. Econ. 2014, 152, 9–28. [Google Scholar] [CrossRef]
  54. Shapley, L.S. A value for n-person games. Ann. Math. Study 1953, 28, 307–317. [Google Scholar]
  55. Kumoi, Y.; Matsubayashi, N. Vertical integration with endogenous contract leadership: Stability and fair profit allocation. Eur. J. Oper. Res. 2014, 238, 221–232. [Google Scholar] [CrossRef]
  56. Yu, H.; Wei, D.S. A carbon-constrained stochastic optimization model with augmented multi-criteria scenario-based risk-averse solution for reverse logistics network design under uncertainty. J. Clean. Prod. 2017, 164, 1248–1267. [Google Scholar] [CrossRef]
Figure 1. Logistics network with and without cooperation.
Sustainability 10 01358 g001
Figure 2. Logistics network optimization scheme.
Sustainability 10 01358 g002
Figure 3. The search process of optimal cooperation sequence.
Sustainability 10 01358 g003
Figure 4. Spatial distribution of the recycling hub, retail stores and customers.
Sustainability 10 01358 g004
Figure 5. Comparison of cost and vehicle number in before and after optimized TERLN.
Sustainability 10 01358 g005
Figure 6. Cost reduction percentages evolution during alliance formation.
Sustainability 10 01358 g006
Figure 7. Cost reduction percentage of the optimal alliance sequence.
Sustainability 10 01358 g007
Figure 8. The core area of the different allocation.
Sustainability 10 01358 g008
Table 1. Symbols and descriptions.
Set
L Set of Recycling Hubs, l L
I Set of Retail Stores, i I
J Set of customers, j J
V Set of vehicles undertaking collection tasks from customers, v V
S Set of semitrailers transporting recycled products from each RS to RH, s S
Parameters
D i l Distance between RS i and RH l
D i j Distance between RS i and customer j
f v r Freight rate of the vehicle (unit: dollar/t·km)
f t r Freight rate of the semitrailers (unit: dollar/t·km)
Q j Collected products quantity from customer j
Q i Total collected products quantity by RS i
Q v Payload of vehicle v
Q s Payload of semitrailer s
Q i i Total collected products quantity from customers which were initially assigned to RS i , but reassigned to RS i
M v Annual maintenance cost of vehicle v
M s Annual maintenance cost of semitrailer s
T Number of working periods
W l Storing capacity of RH l
W i Storing capacity of RS i
λ i Variable cost coefficient of RS i
λ l Variable cost coefficient of RH l
F i Fixed cost of RS i in each working period
F l Fixed cost of RH l in each working period
Decision variables
x i j v x i j v = 1 if vehicle v connects RH or RS ( i L I ) to customer j , otherwise x i j v = 0
x l i s x l i s = 1 if semitrailer s connects RH l to RS i , otherwise x l i s = 0
Z i Discount if RH or RS i ( i L I ) participates in the alliance
c i c i = 1 if RH or RS i ( i L I ) participates in the alliance, otherwise c i = 0
Table 2. Solution representation before fitness evaluation.
Nodes R H P 1 P 3 P 2 C 1 C 3 C 4 C 5 C 2
Representation123013452
Table 3. Characteristics of the recycling hub and four retail stores.
Logistics FacilitiesRHRS1RS2RS3RS4
Number of Customers1921192021
Periodic storing capacity (Tons)11.75311.66111.63811.82212.190
Table 4. Comparison of cost and vehicle number before and after TERLN optimization.
AlliancesInitialOptimizedGap
CostVehicleCostVehicleCostVehicle
{RH}24,080323,53525451
{RS1}18,587318,16824191
{RS2}18,341318,05722841
{RS3}18,542318,26722751
{RS4}19,401319,08933120
{RH, RS1}42,667641,205414622
{RH, RS2}42,421641,51949022
{RH, RS3}42,622641,084415382
{RH, RS4}43,481642,316411652
{RH, RS1, RS2}61,008959,010619983
{RH, RS1, RS3}61,209959,509617003
{RH, RS1, RS4}62,068958,107639613
{RH, RS2, RS3}60,963958,357626063
{RH, RS2, RS4}61,822958,960628623
{RH, RS3, RS4}62,023960,288617353
{RH, RS1, RS2, RS3}79,5501276,131834194
{RH, RS1, RS2, RS4}80,4091276,265841444
{RH, RS1, RS3, RS4}80,6101276,270843404
{RH, RS2, RS3, RS4}80,3641276,052843124
{RH, RS1, RS2, RS3, RS4}98,9511590,3291086225
Table 5. Heuristic algorithms comparative results.
CW_NSGA-IIMOGAMOPSO
RunsCostVehiclesCostVehiclesCostVehicles
192,2151093,3291193,26610
291,7581092,1401092,01210
392,9681093,2381193,12811
490,3291091,3411091,02610
591,0261093,4511194,74511
690,3291091,1201093,02910
790,4101091,0261091,93010
891,2371092,7531092,03410
990,3291090,5071091,02610
1090,4051092,3521091,32710
1190,3291091,2451091,28910
1291,3271094,3231191,32710
1390,8231091,9851090,95310
1491,2311092,1301091,23810
1590,3291091,2901091,02610
Summary91,0031092,1491191,95711
Table 6. Profit allocation in TERLN optimization (unit: USD).
AlliancesInitial CostOptimized Cost c ( S ) φ ( N , v )
{RH}24,08023,535545(545,0,0,0,0)
{RS1}18,58718,168419(0,419,0,0,0)
{RS2}18,34118,057284(0,0,284,0,0)
{RS3}18,54218,267275(0,0,0,275,0)
{RS4}19,40119,089312(0,0,0,0,312)
{RH, RS1}42,66741,2051462(794,668,0,0,0)
{RH, RS2}42,42141,519902(581,0,321,0,0)
{RH, RS3}42,62241,0841538(904,0,0,634,0)
{RH, RS4}43,48142,3161165(699,0,0,0,466)
{RH, RS1, RS2}61,00859,0101998(735,699,564,0,0)
{RH, RS1, RS3}61,20959,5091700(655,525,0,520,0)
{RH, RS1, RS4}62,06858,1073961(1347,1400,0,0,1214)
{RH, RS2, RS3}60,96358,3572606(945,0,674,987,0)
{RH, RS2, RS4}61,82258,9602862(962,0,886,0,1014)
{RH, RS3, RS4}62,02360,2881735(718,0,0,527,490)
{RH, RS1, RS2, RS3}79,55076,1313419(818,650,991,960,0)
{RH, RS1, RS2, RS4}80,40976,2654144(1195,1215,690,0,1044)
{RH, RS1, RS3, RS4}80,61076,2704340(1236,1294,0,564,1246)
{RH, RS2, RS3, RS4}80,36476,0524312(1239,0,1252,879,942)
{RH, RS1, RS2, RS3, RS4}98,95190,3298622(2112,1520,1526,1627,1837)
Table 7. Feasible cooperation sequence based on the strictly monotonic path principle
π 1 = {RH, RS2, RS1, RS4, RS3} π 2 = {RH, RS4, RS3, RS1, RS2}
Player iRHRS2RS1RS4RS3Player iRHRS4RS3RS1RS2
η ( i , π , 1 ) 2.26% η ( i , π , 1 ) 2.26%
η ( i , π , 2 ) 2.41%1.75% η ( i , π , 2 ) 2.90%2.40%
η ( i , π , 3 ) 3.05%3.07%3.76% η ( i , π , 3 ) 2.98%2.52%2.85%
η ( i , π , 4 ) 4.96%3.76%6.54%5.38% η ( i , π , 4 ) 5.13%6.42%3.04%6.96%
η ( i , π , 5 ) 8.77%8.32%8.18%9.47%8.77% η ( i , π , 5 ) 8.77%9.47%8.77%8.18%8.32%
π 3 = {RH, RS4, RS3, RS2, RS1} π 4 = {RS2, RH, RS1, RS4, RS3}
Player iRHRS4RS3RS2RS1Player iRS2RHRS1RS4RS3
η ( i , π , 1 ) 2.26% η ( i , π , 1 ) 1.55%
η ( i , π , 2 ) 2.90%2.40% η ( i , π , 2 ) 1.75%2.41%
η ( i , π , 3 ) 2.98%2.52%2.85% η ( i , π , 3 ) 3.07%3.05%3.76%
η ( i , π , 4 ) 5.15%4.85%4.74%6.83% η ( i , π , 4 ) 3.76%4.96%6.54%5.38%
η ( i , π , 5 ) 8.77%9.47%8.77%8.32%8.18% η ( i , π , 5 ) 8.32%8.77%8.18%9.47%8.77%
π 5 = {RS4, RH, RS3, RS1, RS2} π 6 = {RS4, RH, RS3, RS2, RS1}
Player iRS4RHRS3RS1RS2Player iRS4RHRS3RS2RS1
η ( i , π , 1 ) 1.61% η ( i , π , 1 ) 1.61%
η ( i , π , 2 ) 2.40%2.90% η ( i , π , 2 ) 2.40%2.90%
η ( i , π , 3 ) 2.52%2.98%2.85% η ( i , π , 3 ) 2.52%2.98%2.85%
η ( i , π , 4 ) 6.42%5.13%3.04%6.96% η ( i , π , 4 ) 4.85%5.15%4.74%6.83%
η ( i , π , 5 ) 9.47%8.77%8.77%8.18%8.32% η ( i , π , 5 ) 9.47%8.77%8.77%8.32%8.18%
Table 8. Profit allocation based on Shapley value, MCRS, EPM and CGA.
Improved ShapleyMCRSEPMCGA
RH2085.852111.952560.802595.31
RS11655.021520.731968.701234.70
RS21514.681525.681334.401233.75
RS31489.601626.861292.101393.68
RS41876.851836.781466.002164.56
Table 9. Core distances of Shapley value, MCRS, EPM and CGA.
Profit AllocationCenterDistance
Shapley(2085.85, 1655.02, 1514.68, 1489.60, 1876.85)(2089.8,1540.7,1530.7, 1660.8,1860.0)207.2
MCRS(2111.95, 1520.73, 1525.68, 1626.86, 1836.78)51.0
EPM(2560.80, 1968.70, 1334.40, 1292.10, 1466.00)857.2
CGA(2595.31, 1234.70, 1233.75, 1393.68, 2164.56)775.5

