Performance Sustainability and Integrated Reporting: Empirical Evidence from Mandatory and Voluntary Adoption Contexts


1
Department of Sciences of the Society and the Mediterranean Area Formation, University “Dante Alighieri” of Reggio Calabria, 89125 Reggio Calabria, Italy
2
Department of Economics, University of Messina, 98122 Messina, Italy
*
Author to whom correspondence should be addressed.
Sustainability 2018, 10(5), 1351; https://doi.org/10.3390/su10051351
Submission received: 20 March 2018
/
Revised: 15 April 2018
/
Accepted: 20 April 2018
/
Published: 26 April 2018
(This article belongs to the Section Economic and Business Aspects of Sustainability)
Abstract
:This paper looks at the topic of regulation of integrated reporting for listed companies, with the aim of contributing to the debate on the usefulness of introducing a mandatory regime, both from the perspective of integrated performance sustainability of companies and from that of relevance of information for providers of financial capital. The study is based on empirical research carried out on a sample composed of companies operating in territories where the adoption of integrated reporting is voluntary (Europe) and those operating in a country where adoption is mandatory (South Africa). The research shows that (a) in voluntary regimes, levels of integrated performance achieved by companies are higher; (b) mandatory regulation produces positive effects on integrated performance levels in the medium term; (c) integrated performance indicators are value-relevant, though having different levels of relevance under the two regimes examined.
1. Introduction
The adoption of an integrated reporting approach, overcoming the boundaries and limitations of traditional information systems, is expected to enhance the effectiveness of internal control systems and to support the achievement of financial, environmental and social results; in other words, the sustainability of the overall performance, thus boosting the value creation of the organization [1]. Furthermore, such an approach is expected to improve the value relevance of traditional accounting information [2,3,4].
In some countries (South Africa), the publication of an integrated report has already become mandatory for listed companies. In Europe, while the EU and the member States’ legislators are working and interacting each other on the issue of non-financial information, the number of companies voluntarily adopting integrated reporting is growing steadily and the International <IR> Framework provided by International Integrated Reporting Council (IIRC) is extending its influence in this field.
For South Africa, with reference to effects on disclosure level, evidence was found that the mandatory introduction of integrated reporting “has resulted in an increase in the extent of disclosure of human, social and relational, natural and intellectual capital information of the listed companies” [5], with a more significant increase in disclosures on intellectual capital and human capital categories if compared with relational capital disclosures [6]. Numerous studies have also considered the relevance of information and the usefulness of Integrated Reporting (IR), by assessing the capital market effects of its mandatory [4,6,7,8,9] or voluntary adoption [3,10,11]. In general terms, the results of these studies are of particular interest, because they seem to confirm that IR improves the relevance of information for providers of financial capital. With specific reference to the effects of regulation on usefulness for investors, studies have shown that the value relevance of summary accounting information (i.e., Book Value of Equity and Earnings) of listed companies improved after the mandatory adoption of an IR approach [4]. Along similar lines, Ioannou and Serafeim [12] verified that sustainability disclosure regulations positively affect company valuation.
It is useful to highlight that in our paper, as in the researches we mention, relevance is considered a qualitative characteristic of information. The information can be considered relevant if it is capable of making a difference to the decisions made by users. The studies on the value relevance of information, developed on the basis of the original Ohlson model [13], consider accounting information value relevant if it has a significant statistical relation with the market value of companies [14,15,16]. In this perspective, the existence of that significant statistical relation measures a qualitative characteristic of information which is considered relevant for the analysis, while other qualities of information (e.g., comparability, timeliness, verifiability, compliance, etc.) are deemed not important and therefore should not be considered.
With regard to the expediency of regulation, however, the debate on the effectiveness of mandatory integrated reporting is still an issue under discussion [12,13,14,17,18,19,20]. Indeed, compared to voluntary adoption, the mandatory publication of an integrated report deserves to be evaluated with some attention, since it may reduce the strategic role of integrated reporting, with the risk that this document is perceived as a further reporting obligation. For this reason, it was highlighted that laws and regulations on the integrated reporting approach “could result in a costly pooling rather than a separating equilibrium with respect to the value of sustainability disclosures and can thus eventually destroy shareholder value” [12] (p. 2).
Our paper fits into this research stream. In particular, by using certain integrated performance indicators provided by the main economic databases, this work aims to answer the following research questions:
- RQ1—Is it likely that companies that voluntarily adopt integrated reporting have a higher level of integrated performance (financial, environmental, social and governance) compared to companies forced to adopt it on the basis of a legal obligation?
- RQ2—In South Africa, has there been a generalized growth in integrated performance levels during the period following the mandatory introduction of integrated reporting?
- RQ3—Is there a statistically significant relationship between the integrated performance indicators and the market value of the companies? If that is the case, is this relationship more relevant for the companies that voluntarily adopt the integrated report?
The results of the research are deemed helpful to understand whether a voluntary integrated reporting approach
- is strategically more effective;
- is better decoded by external investors.
Thus, the research aims to provide a significant theoretical contribution to the current debate on the regulation of integrated reporting for listed companies. To the best of our knowledge, there have been no attempts to compare, with reference to certain countries with voluntary and/or mandatory adoption of an integrated reporting approach, the effects of regulation on sustainability of integrated performance and, at the same time, the value relevance of integrated performance (expressed by a valid summary indicator) in comparison with the value relevance (in comparison with that) of the summary accounting information (i.e., Book Value of Equity and Earnings).
2. Methods and Data
The study is based on empirical research conducted on a sample of European listed companies that voluntarily publish the integrated report in comparison with a sample of companies that publish it on a mandatory basis (South Africa).
2.1. Sample and Data
The two groups of companies were selected by process described in Table 1.
The results of the selection process are as follows:
- A sample of 841 companies for EU and a sample of 127 companies for SA chosen for the five years (from 2012 to 2016) under examination (i.e., 4840 company/year observations for the descriptive statistics used for RQ1 and RQ2);
- A sample of 363 companies for EU and a sample of 113 for SA chosen for the five years under examination (i.e., 2380 company/year observations for the regression models used for RQ3).
Regarding sources of data, all variables were collected from the Thomson Reuters Datastream database. In this regard, we underline that the linear price-level model used (see Section 2.2) associates the company’s market value of equity (MV) with its A4R and the classic accounting values such as book value (BV) and earnings (E). For the tests, some control variables were also used (see Table 2).
Variable A4R is used for the descriptive statistics that we carry out to examine the main differences in terms of integrated performance levels between the two contexts (see Section 2.2).
Furthermore, all the variables of the Table 2 are used for the regressions (linear price-level model). In more detail: market value per share (MVS) is the dependent variable; A4R, book value per share (BVS) and earning per share (EPS) are the independent variables; “Total liabilities” divided by “Total assets” represents the firm’s leverage, which is used as the control variable in the regression model (see Section 2.2 and Section 3.2).
In the regressions, the scale effect was mitigated by dividing each variable—excluding A4R—by the “Number of Common Shares”, which is the deflator most frequently used in literature concerning the value relevance of accounting information [16,28,29]. The accounting data refer to the financial years ending in 2012, 2013, 2014, 2015 and 2016, even when the end of the reporting period does not correspond to the calendar year. Market capitalization refers to six months after a company’s fiscal year-end, in line with studies on value relevance belonging to the category of association studies [15,16].
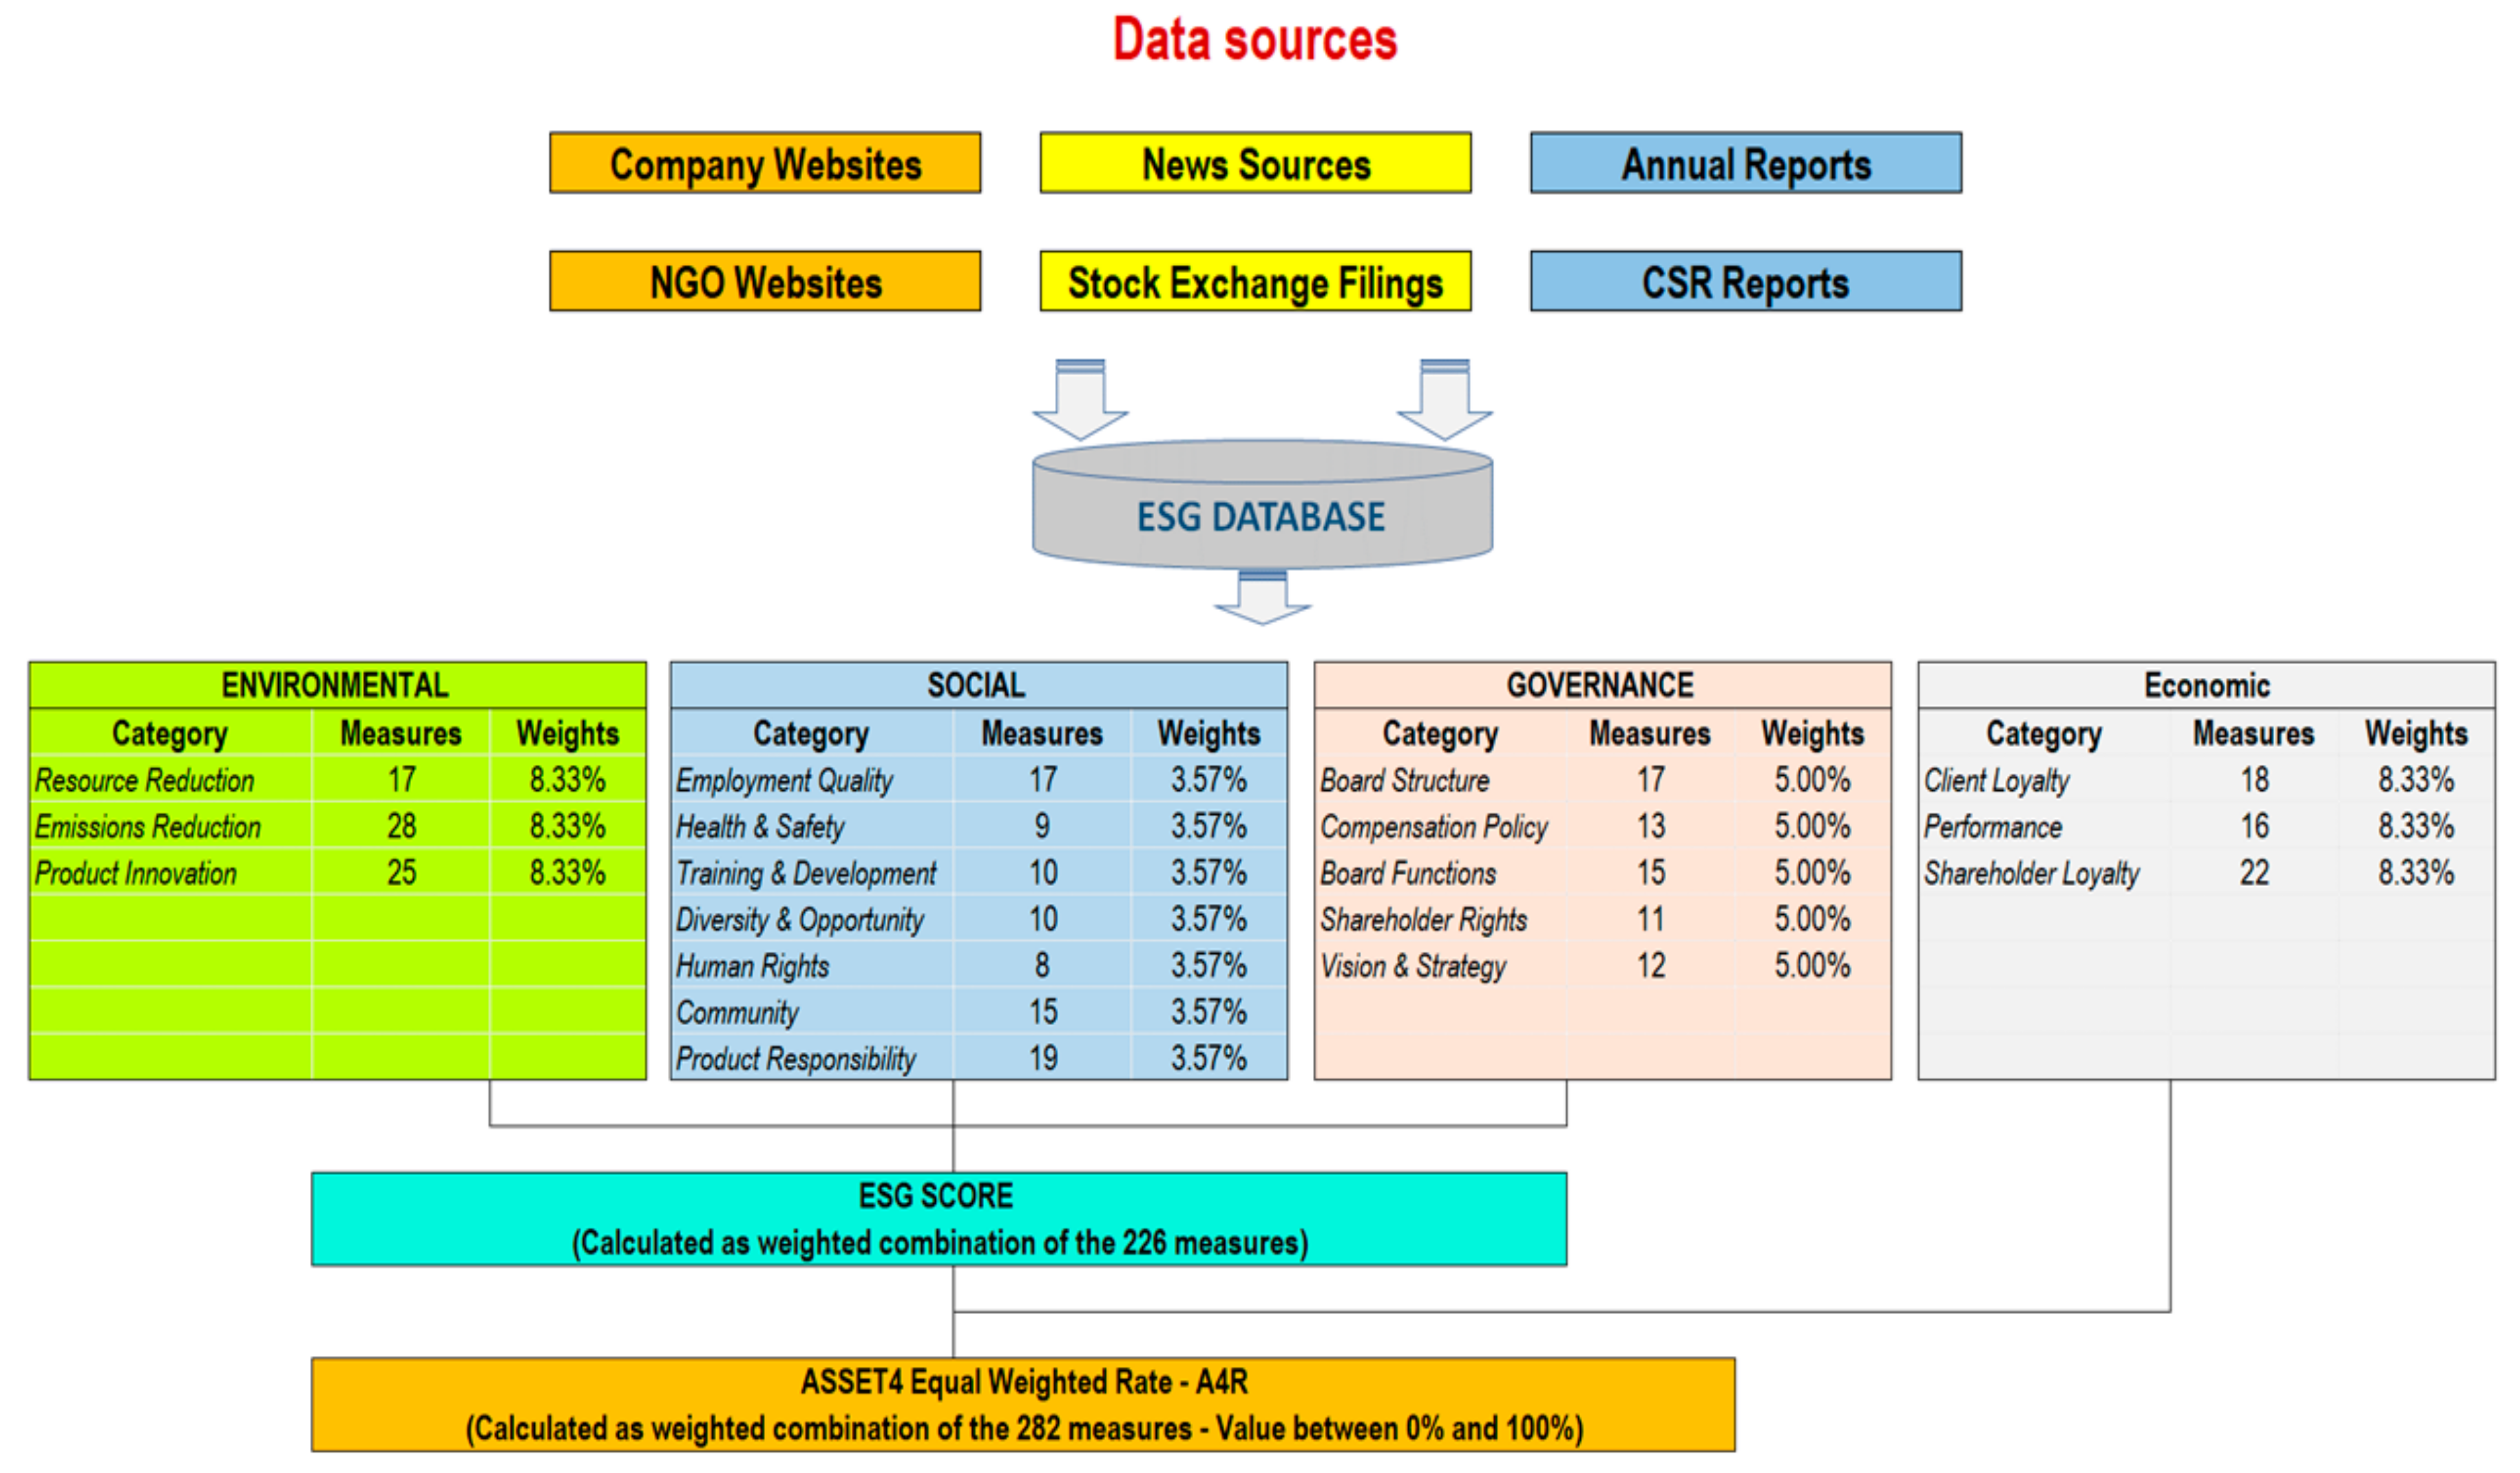
As regards ASSET4 equal weighted rate provided by Thomson Reuters Eikon, this is obtained by combining the ESG score with StarMine® Analytic Models (Economic Pillar). In particular, 282 measures are used, which are then combined into eighteen category scores (as subcomponents of the four pillars). The eighteen categories receive a score between 0 and 1. The overall company score (A4R) is derived from a roughly equal-weighted blend of the four pillar scores [30].
The process of creating the indicator is shown in Figure 1.
As described in Figure 1, the final ESG score results from the combination of 15 measures referred to the Environmental, Social and Governance performance indicators. The ESG score is built on these measures to reflect the commitment and effectiveness of the companies on the three pillars of qualitative performance. The ESG score is then combined with indicators referred to as the economic pillar to obtain the overall equal weighted rate A4R, which synthetizes the company’s ESG and economic performance. Both kinds of measures are weighted proportionately to the number of indicators pertaining to each category, selected on the basis of publicly reported information provided by each company [30].
2.2. Statistical Methods
For RQ1 and RQ2, descriptive statistics tools will be used to examine the main differences in terms of integrated performance levels expressed by A4R between our two sub-samples of companies.
The study of the stratified distribution of indicator A4 is carried out using normal summary statistical values and the differences among the distributions are observed using graphs and confirmed by applying the non-parametric ANOVA. In particular, we used Levene’s test—which is a reliable statistical measurement even for non-normal distributions, and allows the homogeneity of the variances for a stratified variable to be evaluated [31]—and the Kolmogorov-Smirnov test—which is a non-parametric test used to verify the shape of sample distributions [32]—and, to detect that the assumptions of variance homogeneity and normality were not respected, a non-parametric ANOVA was carried out using the Kruscal–Wallis [33] and Median [34] tests, which are based on ranks and medians. Substantially, the former is based on the position of observations in ordered sequences of data and not on values, while the latter is based on the median, which is considered a “robust” summary measurement. Subsequently, the post-hoc test to verify which pairs of years are significantly different from each other was carried out using the Mann–Whitney test, based on ranks [23].
For RQ3, we study the relationship between market value (MV) and level of integrated performance by a linear price-level model used in studies on the value relevance of accounting information, which considers the information value-relevant if it has a significant statistical relation with the market value of companies [13,14,15,16].
In particular, with reference to the period 2012–2016 and to the two different regimes examined (Europe and South Africa), the aim is to study the value relevance of traditional accounting values of the financial statement with the addition of the A4R integrated performance indicator. In this context, considering that the data analyzed could be heterogeneous because of the effects of both time and individuals (companies) and aiming to get an efficient and effective model that allows heterogeneity of data to be checked while minimizing the error εi,t, data is formulated using “cross sectional time series”, better known as panel data. Panel data are obtained from original values through a “pooling” operation, so that the observations can be considered bi-dimensional varying both for individual and for time period. This choice is justified by the fact that analyzing only the time series does not allow individual heterogeneity to be unbundled from the error term εi,t, while a cross section analysis would only allow it if the data revealing this heterogeneity were available.
Thus, considering that the variability of the panel data is due to time and individuals, it is possible to break down the error term into three distinct parts:
- The first is constant over time and variable from one individual to another;
- The second, on the other hand, is constant among individuals but variable over time;
- The third represents the pure error component [35].
Substantially, by using the regression with panel data, the intention is to limit the distortion caused by individuals and/or time, controlling the effect of variables not measured, which inevitably influences the estimate of variables included in the model and correlated with those that are not included.
The regression models on panel data can be divided into dummy variable models or error components models.
In the dummy variable model, λi and ωt are considered deterministic in nature; in the error component model, on the other hand, they are stochastic. The Hausman test allows verification of whether dummy variable model (H1) or the error component model is more appropriate (H0) [36].
The dummy variable model can be expressed using the equation
where λi is a fixed effect and errors are independent identically distributed, εit ~ IID(0, σ2).
In order to estimate the parameters, the least-squares dummy variables (LSDV) [37] method was used, since the ordinary least-squares (OLS) method, used for simple pooling, is inadequate for panel data regressions.
For the purpose of analysis, the use of panel data will allow more efficient estimation than cross section models, thanks to the increased degrees of liberty and to the reduction of multicollinearity among the regressors [38]. The advantage gained from the use of panel data is due to the increase in information content on which to base the estimates and the underlying logic of the panel regression, according to which, considering a collection of heterogeneous individuals, it is possible to assume that, as well as the “factors” that vary over time, there are other different “factors” for each individual.
3. Results
3.1. Research Questions 1 and 2
Firstly, it is necessary to evaluate the distribution of the A4R indicator from a temporal viewpoint.
Distinguishing the two zones of reference (EU = Europe; SA = South Africa) we will have the summary statistics that are represented in Table 3 (Europe) and Table 4 (South Africa) (The original data are shown in Tables S1–S4):
Normally, observation of the mean value of both distributions (EU; SA) would lead to the conclusion that the average trend of integrated performance measured by the A4R indicator over the five years studied highlights a better performance by European companies. It is important to specify, however, that, in order to carry out evaluations on the mean or on the variance of the data, it is necessary to consider that the companies chosen for this analysis are a sample. Therefore, it is better to refer to the confidence intervals. As could be expected, observing the differences characterising the standard deviations over the years examined, the confidence intervals of the mean (95%) have different widths, which narrow over the period observed in both geographical contexts.
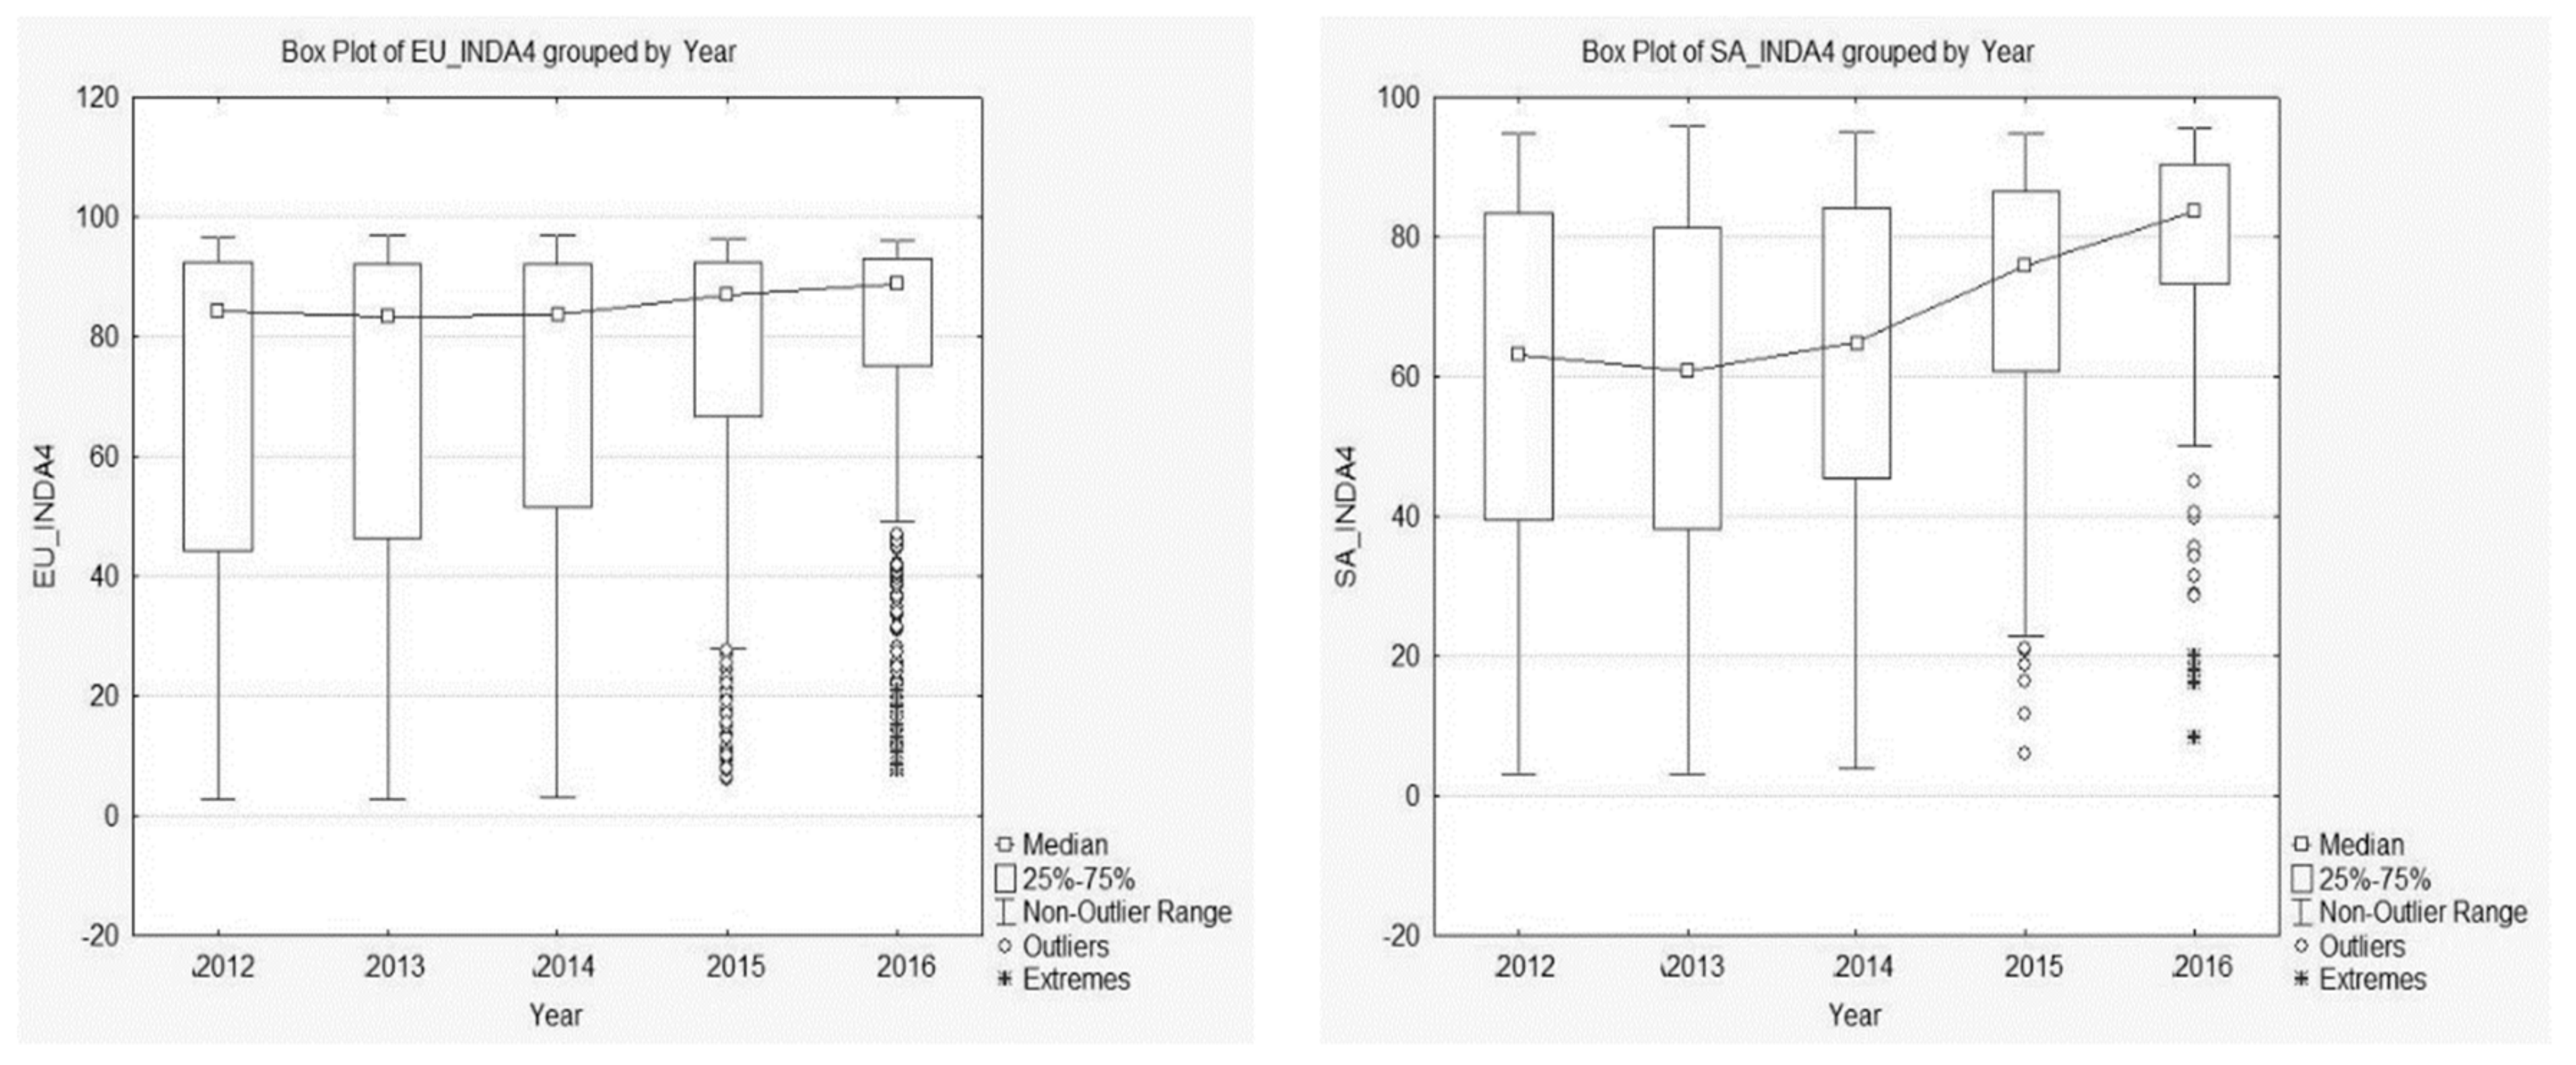
If, however, the shape of the distributions of the A4R index in the various years in the two areas examined is evaluated using box-plots (Figure 2) of the summary statistics (median-quartiles-index of asymmetry) (Table 3 and Table 4) a left asymmetry (greater concentration of higher A4R index values), which increases over the years. Thus, in these cases, the mean is not a “robust” summary measurement and it is better to refer to the median.
Observing the values of the median (Table 5), it can be seen that, unlike the mean, in the case of Europe the value decreases in 2013 and 2014 (for South Africa, only in 2013) compared with 2012. Moreover, analyzing the values of the medians and quartiles together, it is interesting to note that, without prejudice to the general improvement of the A4R performance indicator over time in both geographical zones, in 2012 50% of companies in Europe and South Africa showed an A4R value greater than 84.23 for the former and only 63.1 for the latter. In 2016, while the median value of A4R in South Africa remained lower, the situation seems to be normalizing. Indeed, the value of the median that divides the distribution in half is 87.1 for Europe and 83.5 for South Africa. Moreover, the integrated performance of companies that had an A4R index in 2012 grows considerably; indeed, 25% of companies that had an A4R value lower than 44.31 in 2012 in Europe have values below 75.0 in 2016, and in South Africa the change is from 39.7 to 73.1.
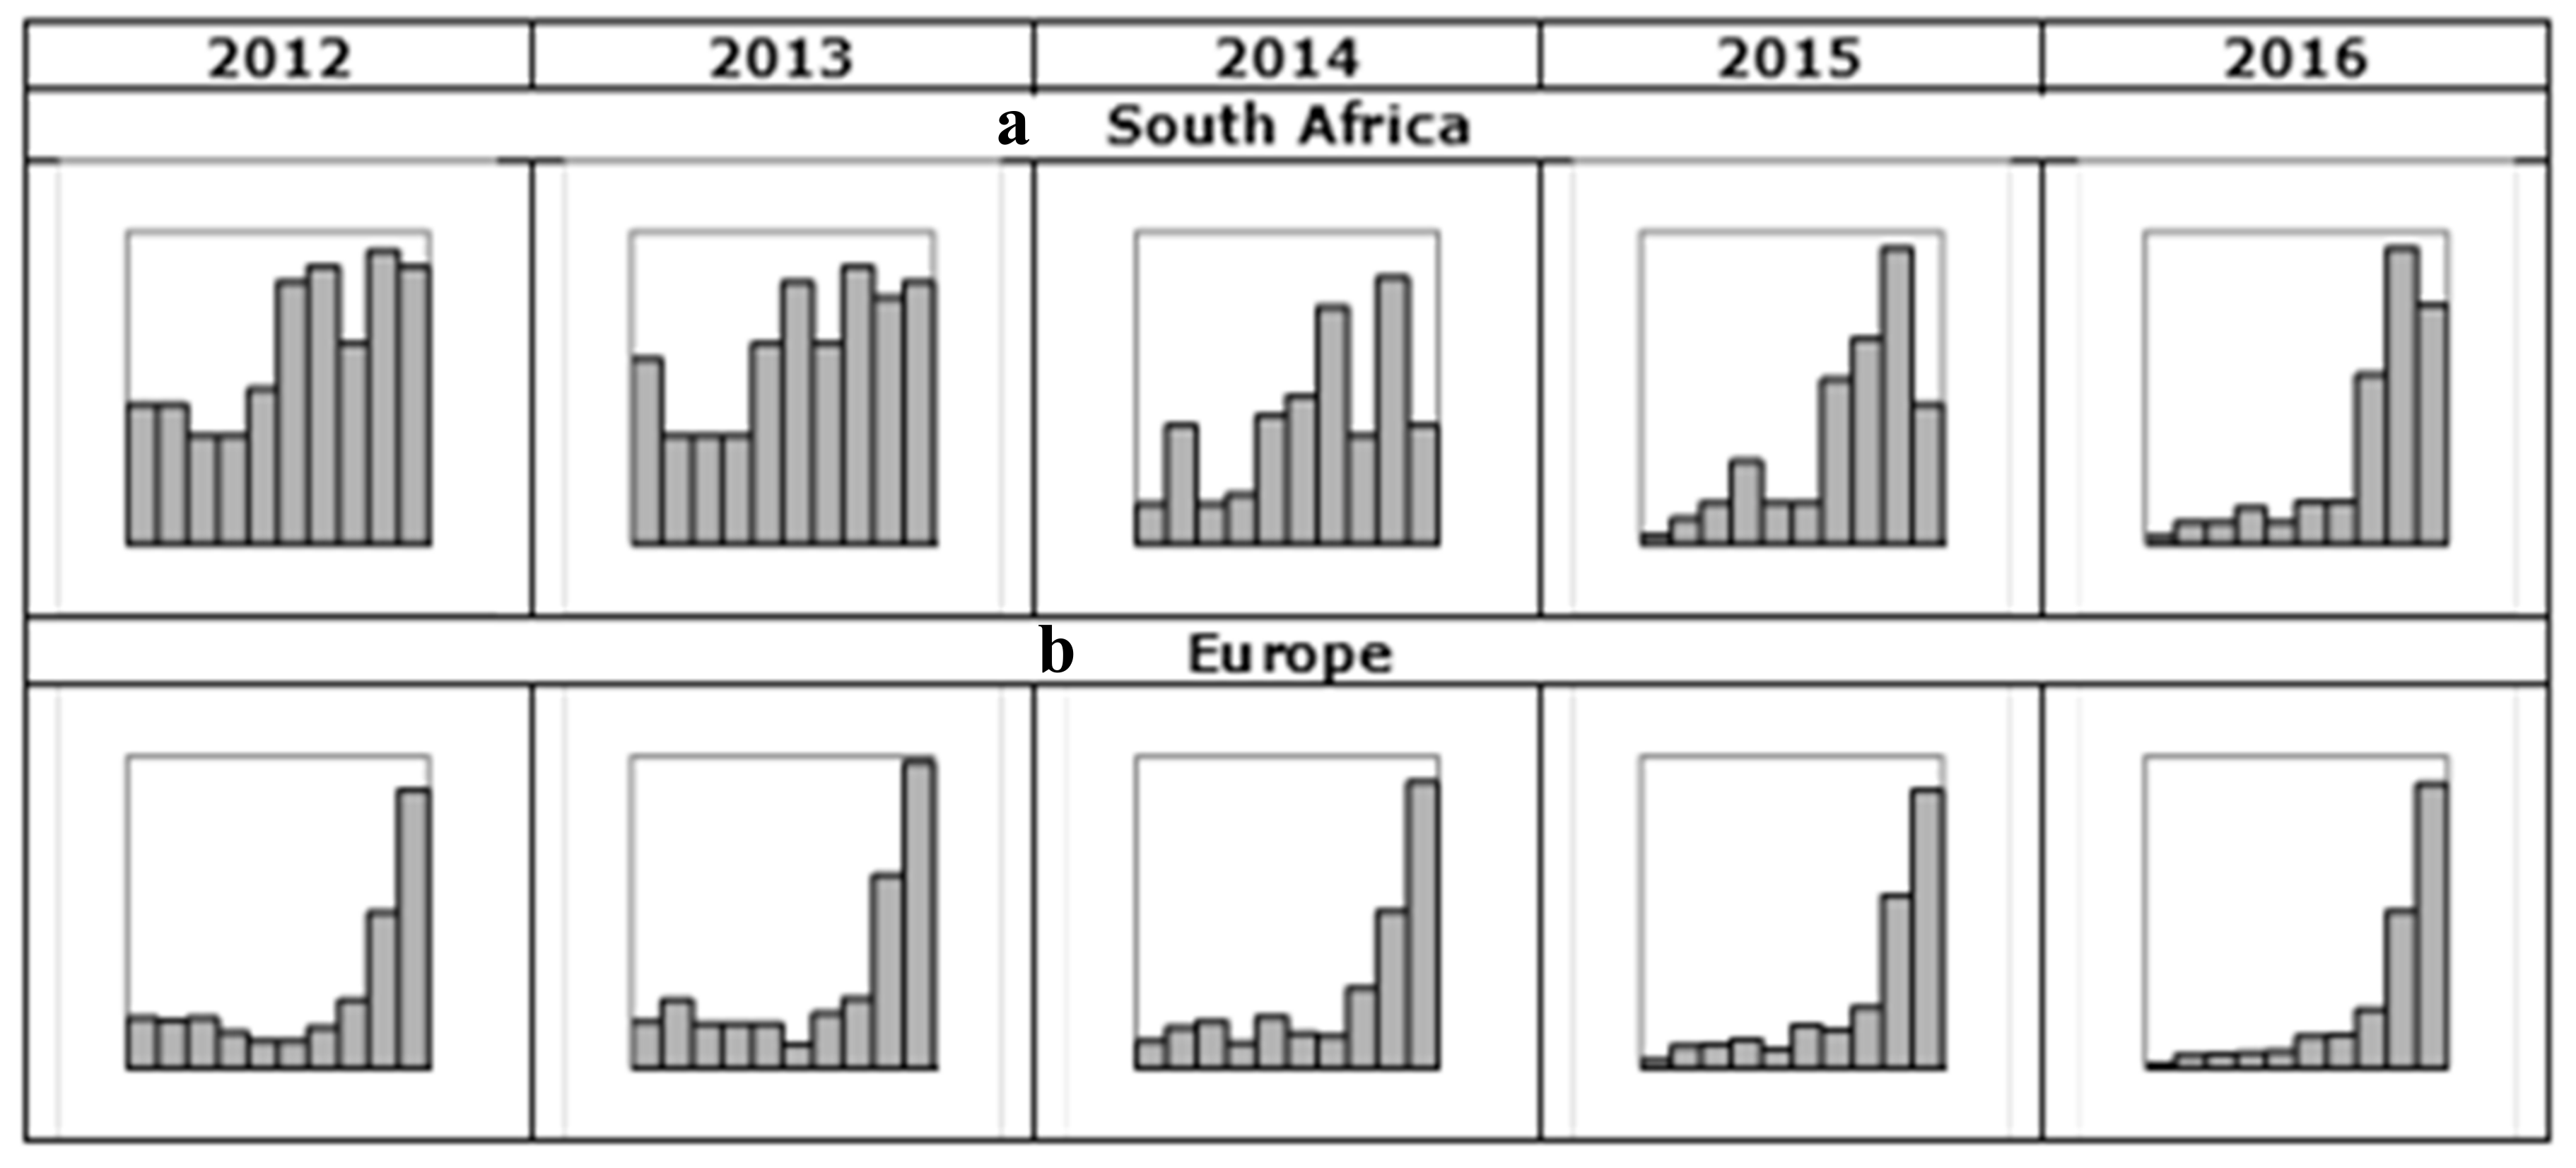
The above observations regarding the shape of the distributions of the A4R indicator in the years in question for each geographical zone can easily be seen in the histograms shown in Figure 3. The frequencies relating to the distributions of the A4R indicator (min = 0; max = 100) were subdivided into 10 classes of width 10 for South Africa (Figure 3a) and Europe (Figure 3b).
From the above graphs, it can be clearly seen that, from 2012 onwards, the distributions of the A4R indicator in Europe are heavily left-asymmetric. This means that in Europe from 2012 onwards there has been a large group of companies that have a high integrated performance index. The situation in South Africa is different, however; in 2012 and 2013 the situation is fairly flat and an increased concentration of companies in the upper area of the A4R indicator range can be noted only from 2015 onwards.
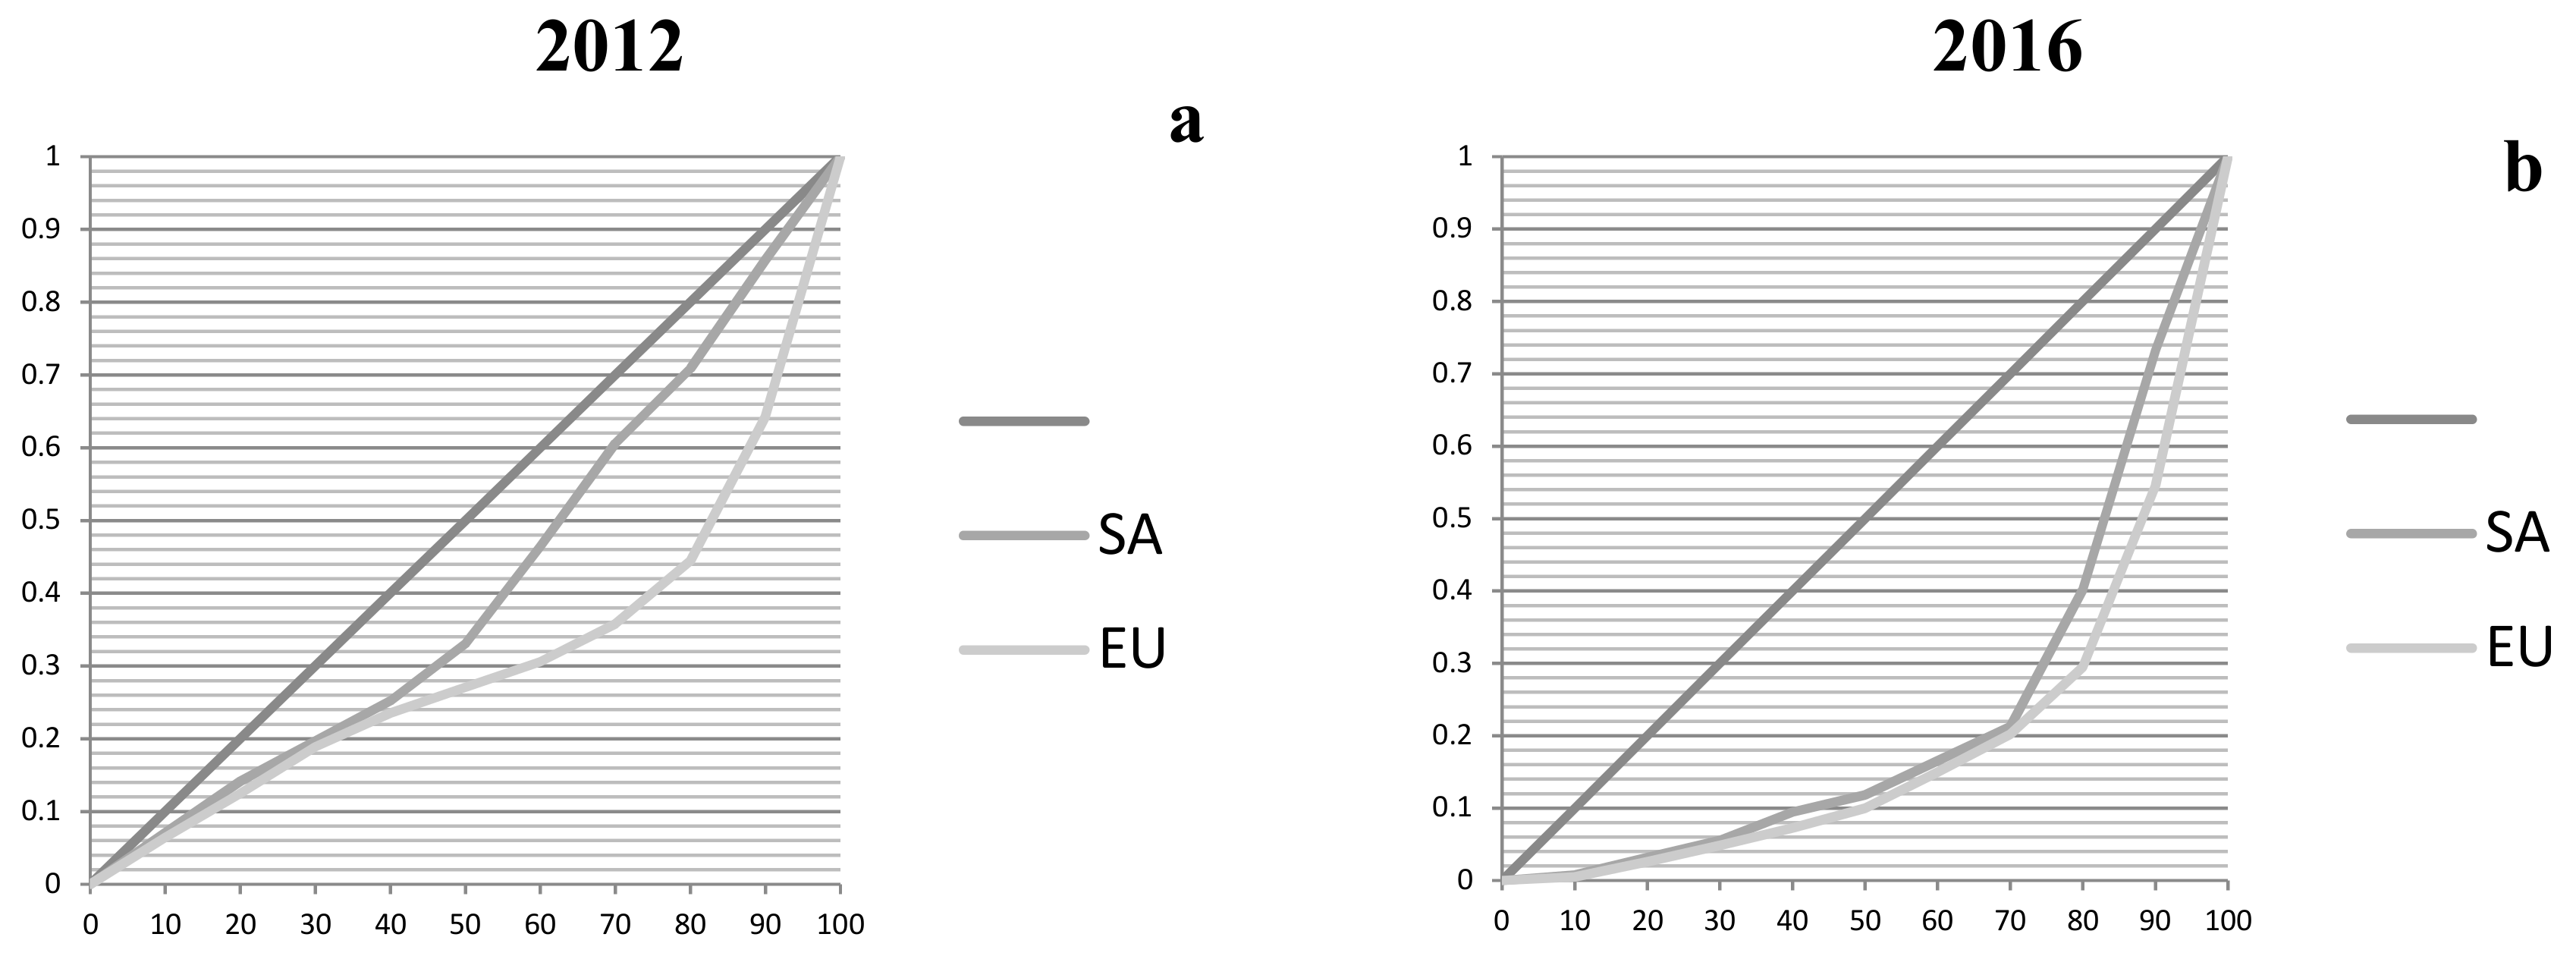
Further confirmation of these observations can be found in the concentration curves (Figure 4) relating to the years 2012 (Figure 4a) and 2016 (Figure 4b), which clearly show that in 2012 the percentage of companies with A4R below 80 is 44.5% in Europe compared with 70.9% in South Africa. As mentioned above, in 2016 the situation was still better in Europe but South Africa (40.1%) narrowed the gap compared with Europe (29.4%), which continued to improve.
The statistical tools used so far clearly indicate that there are differences between the annual mean values of the A4R indicator, both for Europe and for South Africa. In order to analyze more deeply, however, it is necessary to verify whether any differences observed are significant or not. To this end, it would be necessary to carry out a variance analysis, so as to clarify whether the mean improvement in integrated performance linked to the A4R indicator is due to time, or whether the differences found are the effect of random oscillations caused by the fact that we are considering samples. It should be remembered, however, that analysis of the ANOVA variance allows non-distorted results to be obtained if, and only if, the basic assumptions are respected (the distribution must be normal and the variances must be homogenous). In order to verify these assumptions, two statistical tests are suitable: Levene’s test and the Kolmogorov–Smirnov test. In this case, Levene’s test showed that the variances are not homogenous (Table 6), and the Kolmogorov–Smirnov test (Table 7) demonstrated a violation of the normality hypothesis:
It is, therefore, appropriate to use the non-parametric ANOVA, as its results do not depend on the hypothesis of normality, using the Kruskal-Wallis test (Table 8) and the median test (Table 9), which is a nonparametric (distribution free) test that is used when the assumptions of one-way ANOVA are not met.
In order to discover which years are significantly different from one another the non-parametric Mann–Whitney test was used, under the hypothesis of non-homogeneity of variances, obtaining the results set out in Table 10:
The test clearly shows that in both regimes the mean distribution of the A4R integrated performance indicator follows two different trends: one in reference to the period 2012–2014 and the other to the period 2015–2016.
The analyses carried out have highlighted significant differences in the A4R indicator over the period under consideration, thus in the mean levels of integrated performance in the two contexts examined.
South Africa is characterised by a lower initial mean value of the A4R indicator, which increases—as happens in Europe—over the period examined. In both contexts, moreover, variability around the mean value constantly declines over the years (see Table 4).
In general, the higher levels of integrated performance recorded by European companies can be explained by considering that these companies are part of a European population characterised by greater awareness of the process of value creation and a better capacity to manage it: in other words, they are companies with high level profiles compared with others operating in the territorial context. It was, therefore, to some extent logical to expect this result.
The study we carried out, however, brought to light that levels of integrated performance significantly improved in the years following the adoption of a mandatory integrated reporting approach, with effects that grow stronger over the medium term (see Figure 3). South African companies, therefore, after an initial phase, seem to have effectively taken on board and exploited the advantages deriving from integrated thinking. In fact, South African companies considerably reduced the gap that separated them from high level European companies that voluntarily adopted integrated reporting practices.
Research questions 1 and 2 are, thus, both verified.
3.2. Research Question 3
For data processing purposes, we used the following model:
where:
- βi are the standardized regression coefficients;
- λi represents the mean corporate effect
- εi,t represents the error, that is the mean quota of market value per share not explained by the model because of missing variables.
The other models tested with the further control variables SIZE and LEV were rejected because these variables proved to be statistically non-significant.
As concerns what was mentioned above in Section 2.2, verification of Research Question 3 was carried out using a linear price-level model with a “cross sectional time series” data formulation, better known as panel data. Considering, however, that the aim is to study the difference, in the two geographical areas studied (Europe and South Africa), of value relevance of traditional accounting values on the balance sheet, to which the A4R integrated performance indicator is added, we used a fixed effects regression model, which hypothesizes the existence of individual effects of each company constant over time.
In advance, the fixed effect panel regressions [38,39] were compared with the simple pooling models [40]. From test F it can be seen that use of fixed effects models is justified by rejection of the null hypothesis (H0 = the groups have a common intercept) of test F (Table 11):
Moreover, the Hausman test confirms that the fixed effects model is preferable to the random effects model.
In the fixed effects model, λi and ωt are considered determinant; in the random effects model, on the other hand, they are stochastic. The Hausman test allows verification of whether the fixed effects model (H1) or random effects model (H0) is more appropriate [36].
The results obtained by panel regressions are the following.
Examination of the parameters of the two fixed effect equations shows that for both geographical contexts in question the A4R integrated performance indicator is value relevant in statistically significant terms (see Table 12), and with a greater impact on investors’ choices in the European context, in which the companies in the sample studied are also characterized by a lower value relevance of the BVS and of the EPS compared with South Africa.
4. Discussion and Conclusions
In this paper, we have examined the topic of the regulation of integrated reporting for listed companies, from an economic-corporate viewpoint, with the intention of contributing to the debate on the usefulness of introducing a mandatory regime, both from the viewpoint of integrated corporate performance sustainability and that of relevance of information for providers of financial capital.
The three research hypotheses tested in our paper have been confirmed.
Firstly (RQ1): it was demonstrated that companies that adopt the integrated reporting approach voluntarily have higher levels of integrated performance. As we clarified in the paper, this result was to be expected, even though we decided to provide empirical evidence, because the companies selected in the voluntary regime area (EU) represent a “select” part of the whole population; that is, a group of companies that probably use integrated reporting practices because they have “something extra” to show compared with other companies in the same area that do not adopt these practices.
The descriptive statistics used for RQ2 showed that there has been a significant growth in the integrated performance of companies after the regulation of integrated reporting in South Africa. It is clear that this does not necessarily mean that the mandatory integrated reporting requirement is the only reason explaining that increase. Nonetheless, that empirical evidence reasonably allows us to say that the introduction of the mandatory regime has played a positive role, especially considering that the regulation of integrated reporting was one of the most important innovations of the period in South Africa. In the opposite direction, it is reasonable to exclude that the new regulation of integrated reporting has had negative effects, because the sample of South African companies significantly reduced the gap with the sample of European companies during the post-adoption period considered in the analysis.
Thus, we believe that all the above considerations allow us to say that in South Africa the introduction of a mandatory integrated reporting regime revealed to be an effective measure for improving the companies’ integrated performance. The results obtained show that the effects were mainly felt in the medium term, thus confirming the uncertainty expressed in literature on the short-term effects tied to the introduction of a mandatory regime of integrated reporting [20]. On the other hand, the study demonstrates that mandatory adoption—which in the short term could be perceived by companies as an obligation which causes difficulties due to the need to adapt the corporate culture and reporting systems, costs and new compliances—nonetheless played positive effects in the medium term.
The analyses carried out to respond to RQ3, finally, demonstrated that the A4R indicator is value relevant in statistically significant terms. The European context shows greater valorisation by the market of the A4R integrated performance indicator, in the presence of di very low regression coefficients for EPS and BVS. The A4R regression coefficient is also very high and statistically significant for South Africa, but in this context, there is a greater valorisation by the market of EPS, and above all BVS, compared with Europe. With reference to the samples and the geographical zones examined, therefore, there is a significant relationship between the integrated performance indicators and the market value of the companies, which is more relevant for companies that voluntarily adopt the integrated report. Thus, for our sample and the period under investigation, the empirical evidence proves that the level of integrated performance positively influenced investors’ choices, producing consistent benefits on the market capitalization of companies, with a low relevance of traditional accounting information (book value and earnings).
These findings have important practical implications, particularly for managers of the companies and policymakers. As regard the managers, the value relevance of the A4R indicator shows that the ESG practices are considered by investors in their investment decisions, thus they are important drivers for the enterprises’ value. Because the investors are critical stakeholders which wield considerable influence on the strategy of the companies [17], the managers should be aware of the importance of keeping a balanced view of company’s ESG performance for the shareholders’ value creation. In a wider perspective, therefore, this confirms the role of integrated reporting as a tool for achieving sustainability [13]. For the policymakers, the main issue concerns the usefulness of the mandatory adoption of integrated reporting. This aspect was addressed with various perspectives in the literature [4,8,12,17,18,19,20]. The findings of our paper provide a contribution to this debate by giving an empirical evidence of the general increase in the integrated performance level of the companies after the mandatory adoption of the integrated practices.
As regards future research directions, other statistical analyses could be addressed to explore to which extent a cause–effect relation could exist between the mandatory adoption of integrated reporting and the increase in the integrated performance (financial, environmental, social and governance) and to investigate if in the context of voluntary adoption integrated reporting shows the same positive effects on integrated thinking, as demonstrated by similar studies conducted with reference to South Africa [4,5,6,20,41,42].
Supplementary Materials
The following are available online at https://www.mdpi.com/2071-1050/10/5/1351/s1, Table S1: South Africa dataset regressions, Table S2: Europe dataset regressions, Table S3: South Africa data (2012–2016), Table S4: Europe data (2012–2016).
Author Contributions
This work is an outcome of joint efforts of the three authors. S.L. conceived the research idea, provided data and contributed in the interpretation of the results. B.R. provided statistical analysis and contributed in the interpretation of the results. D.R. reviewed the related literature and contributed in the interpretation of the results. S.L. and D.R. provided contribution on the conclusion and implications of the research. All three authors wrote the manuscript, thoroughly read, and approved the final version.
Acknowledgments
This paper has been financially supported by the MEDAlics—Research Centre for the Mediterranean Relations of the University “Dante Alighieri” of Reggio Calabria (Italy).
Conflicts of Interest
The authors declare no conflict of interest.
References
- Dumay, J.C. A critical reflection on the future of intellectual capital: From reporting to disclosure. J. Intell. Cap. 2016, 17, 168–184. [Google Scholar] [CrossRef]
- International Integrated Reporting Council. The International <IR> Framework. 2013. Available online: http://integratedreporting.org/resource/international-ir-framework/ (accessed on 11 February 2018).
- Lourenco, I.C.; Callen, J.L.; Branco, M.C.; Curto, J.D. The value relevance of reputation for sustainability leadership. J. Bus. Ethics 2014, 119, 17–28. [Google Scholar] [CrossRef]
- Baboukardos, D.; Rimmel, G. Value relevance of accounting information under an integrated reporting approach: A research note. J. Account. Public Policy 2016, 35, 437–452. [Google Scholar] [CrossRef]
- Setia, N.; Abhayawansa, S.; Joshi, M.; Huynh, A.V. Integrated reporting in South Africa: Some initial evidence. Sustain. Account. Manag. Policy J. 2015, 6, 397–424. [Google Scholar] [CrossRef]
- Ahmed Haji, A.; Anifowose, M. Initial trends in corporate disclosures following the introduction of integrated reporting practice in South Africa. J. Intell. Cap. 2017, 18, 373–399. [Google Scholar] [CrossRef]
- Eccles, R.G.; Serafeim, G. Accelerating the adoption of integrated reporting. In CSR Index; de Leo, F., Vollbracht, M., Eds.; InnoVatio Publishing Ltd.: Boston, MA, USA, 2011; pp. 70–92. [Google Scholar]
- Solomon, J.; Maroun, W. Integrated Reporting: The Influence of King III on Social, Ethical and Environmental Reporting; The Association of Chartered Certified Accountants: London, UK, 2012. [Google Scholar]
- Bernardi, C.; Stark, A.W. Environmental, social and governance disclosure, integrated reporting, and the accuracy of analyst forecasts. Br. Account. Rev. 2016, 50, 16–31. [Google Scholar] [CrossRef]
- Middleton, A. Value relevance of firms’ integral environmental performance: Evidence from Russia. J. Account. Public Policy 2015, 34, 204–211. [Google Scholar] [CrossRef]
- Lee, K.W.; Yeo, G. The association between integrated reporting and firm valuation. Rev. Quant. Finance Account. 2016, 4774, 1221–1250. [Google Scholar] [CrossRef]
- Ioannou, I.; Serafeim, G. The Consequences of Mandatory Corporate Sustainability Reporting; Harvard Business School Research; Working Paper No. 11-100; Harvard Business School: Boston, MA, USA, 2012. [Google Scholar]
- Ohlson, J.A. Earnings, Book Values and Dividends in Equity Valuation. Contemp. Account. Res. 1995, 11, 661–687. [Google Scholar] [CrossRef]
- Barth, M.E.; Beaver, W.H.; Landsman, W.R. The Relevance of the Value Relevance Literature for Financial Accounts Standard Setter: Another View. J. Account. Econ. 2001, 31, 77–104. [Google Scholar] [CrossRef]
- Kothari, S.P. Capital markets research in accounting. J. Account. Econ. 2001, 31, 105–231. [Google Scholar] [CrossRef]
- Mechelli, A. La Value Relevance del Bilancio di Esercizio. Modelli, Metodologie di Ricerca ed Evidenze Empiriche; Giappichelli Editore: Turin, Italy, 2013. [Google Scholar]
- Eccles, R.G.; Saltzman, D. Achieving sustainability through integrated reporting. Stanf. Soc. Innov. Rev. 2011, 9, 56–61. [Google Scholar]
- Doshi, A.R.; Dowell, G.W.; Toffel, M.W. How firms respond to mandatory information disclosure. Strateg. Manag. J. 2013, 34, 1209–1231. [Google Scholar] [CrossRef]
- Hung, M.; Wang, Y. Mandatory CSR Disclosure and Shareholder Value: Evidence from China. HKUST Working Paper. Available online: http://www-bcf.usc.edu/~yongxiaw/CSR_HSW_final.pdf (accessed on 8 February 2018).
- Steyn, M. Organizational benefits and implementation challenges of mandatory integrated reporting: Perspectives of senior executives at South African listed companies. Sustain. Account. Manag. Policy J. 2014, 5, 476–503. [Google Scholar] [CrossRef]
- Miralles-Quirós, M.M.; Miralles-Quirós, J.L.; Gonçalves, M.V. The Value Relevance of Environmental, Social, and Governance Performance: The Brazilian Case. Sustainability 2018, 10, 574. [Google Scholar] [CrossRef]
- Pavláková-Dočekalová, M.; Kocmanová, A. Comparison of Sustainable Environmental, Social, and Corporate Governance Value Added Models for Investors Decision Making. Sustainability 2018, 10, 649. [Google Scholar] [CrossRef]
- Sutopo, B.; Kot, S.; Adiati, A.K.; Ardila, L.N. Sustainability Reporting and Value Relevance of Financial Statements. Sustainability 2018, 10, 678. [Google Scholar] [CrossRef]
- Alshehhi, A.; Nobanee, H.; Khare, N. The Impact of Sustainability Practices on Corporate Financial Performance: Literature Trends and Future Research Potential. Sustainability 2018, 10, 494. [Google Scholar] [CrossRef]
- Timbate, L.; Park, C.K. CSR Performance, Financial Reporting, and Investors’ Perception on Financial Reporting. Sustainability 2018, 10, 522. [Google Scholar] [CrossRef]
- Singh, P.J.; Sethuraman, K.; Lam, J.Y. Impact of Corporate Social Responsibility Dimensions on Firm Value: Some Evidence from Hong Kong and China. Sustainability 2017, 9, 1532. [Google Scholar] [CrossRef]
- Gómez-Bezares, F.; Przychodzen, W.; Przychodzen, J. Corporate sustainability and shareholder wealth. Evidence from British companies and lessons from the crisis. Sustainability 2016, 8, 276. [Google Scholar] [CrossRef]
- Easton, P.D.; Sommers, G.A. Scale and the Scale Effect in Market-Based Accounting Research. J. Bus. Finance Account. 2003, 30, 25–56. [Google Scholar] [CrossRef]
- Barth, M.E.; Clinch, G. Scale Effects in Capital Markets-Based Accounting Research. J. Bus. Financ. Account. 2009, 36, 253–288. [Google Scholar] [CrossRef]
- Thomson Reuters Eikon. Thomson Reuters ESG Scores. Available online: https://financial.thomsonreuters.com/content/dam/openweb/documents/pdf/financial/esg-scores-methodology.pdf (accessed on 4 April 2018).
- Levene, H. Robust tests for equality of variances. In Contributions to Probability and Statistics: Essays in Honor of Harold Hotelling; Olkin, I., Hotelling, H., Eds.; Stanford University Press: Palo Alto, CA, USA, 1960; pp. 278–292. [Google Scholar]
- Corder, G.W.; Foreman, D.I. Nonparametric Statistics: A Step-by-Step Approach; Wiley: Hoboken, NJ, USA, 2014. [Google Scholar]
- Kruskal, W.H.; Wallis, W.A. Use of ranks in one-criterion variance analysis. J. Am. Stat. Assoc. 1952, 47, 583–621. [Google Scholar] [CrossRef]
- Giardina, B. Statistica non parametrica; Franco Angeli: Milan, Italy, 1972. [Google Scholar]
- Coletta, G. Una Guida per la Stima dei Modelli Panel Dinamici: Le Specificità dei Modelli Macroeconomici. Available online: http://www.iaea.org/inis/collection/NCLCollectionStore/_Public/37/050/37050078.pdf (accessed on 8 February 2018).
- Hausman, J. Specification Tests in Econometrics. Econometrica 1978, 46, 1251–1271. [Google Scholar] [CrossRef]
- Baltagi, B.H. Econometric Analysis of Panel Data; John Wiley & Sons: New York, NY, USA, 2001. [Google Scholar]
- Hsiao, C. Analysis of Panel Data; Cambridge University Press: Cambridge, UK, 2003. [Google Scholar]
- Maddala, G.S. Introduction to Econometrics, 3rd ed.; John Wiley & Sons: New York, NY, USA, 2001. [Google Scholar]
- Manera, M.; Galeotti, M. Microeconometria: Metodi e Applicazioni; Carocci Editore: Rome, Italy, 2005. [Google Scholar]
- Atkins, J.F.; Maroun, W. Integrated reporting in South Africa in 2012: Perspectives from South African institutional investors. Meditari Account. Res. 2015, 23, 197–221. [Google Scholar] [CrossRef]
- De Villiers, C.; Rinaldi, L.; Unerman, J. Integrated reporting: Insights, gaps and an agenda for future research. Account. Audit. Account. J. 2014, 27, 1042–1067. [Google Scholar] [CrossRef]
Figure 1.
ASSET4 environmental, social and governance (ESG) data and framework. (Our elaboration from 30).
Figure 1.
ASSET4 environmental, social and governance (ESG) data and framework. (Our elaboration from 30).

Figure 2.
Box-plots (values with a positive or negative deviation from the third or first quartile greater than 1.5 times or 3 times the range interquartile range are considered outliers and extremes, respectively).
Figure 2.
Box-plots (values with a positive or negative deviation from the third or first quartile greater than 1.5 times or 3 times the range interquartile range are considered outliers and extremes, respectively).

Figure 3.
(a) A4R histograms for South Africa; (b) A4R histograms for Europe.

Figure 4.
(a) Concentration curve in 2012; (b) Concentration curve in 2016.


Table 1.
Sample selection process.
| EU | SA | Total | |
|---|---|---|---|
| Listed companies (Value recovered from Thomson Reuters Datastream database) | 3727 | 335 | 4062 |
| Descriptive statistics on A4R indicator (RQ1 and RQ2) | |||
| Companies with A4R indicator available for all years in the period 2012/2016 | 841 | 127 | 968 |
| Company/year observations for each variable | 4205 | 635 | 4840 |
| Regressions (RQ3) | |||
| Companies with data (dependent variable and independent variables) available for all years in the period 2012/2016 | 363 | 113 | 476 |
| Company/year observations for each variable | 1815 | 565 | 2380 |
Table 2.
Variables of the models and data source.
| Models’ Variables | Identifier in Thomson Reuters Datastream | |
|---|---|---|
| 1 | Overall equal weighted rate, that reflects a balanced view of a company’s ESG (environmental, social and governance) performance (ASSET4) | A4R |
| 2 | “Market value of equity” (a)/“Number of common shares” (b) | (a) MV; (b) NOSH |
| 3 | “Book value of equity” (c)/“Number of common shares”(b) | (c) WC03995; (b) NOSH |
| 4 | “Earnings before interest and taxes” (d)/“Number of common shares” (b) | (d) WC18191; (b) NOSH |
| 5 | “Total liabilities” (e)/“Number of common shares” (b) | (e) WC03351; (b) NOSH |
Table 3.
Europe: summary statistics.
| Statistics | 2012 | 2013 | 2014 | 2015 | 2016 |
|---|---|---|---|---|---|
| N° of observations | 841 | 841 | 841 | 841 | 841 |
| Minimum | 2.860 | 2.870 | 3.130 | 6.200 | 7.510 |
| Maximum | 96.760 | 96.930 | 97.030 | 96.240 | 96.050 |
| 1st Quartile | 44.310 | 46.400 | 51.500 | 66.580 | 75.060 |
| Median | 84.230 | 83.480 | 83.610 | 87.110 | 88.750 |
| 3rd Quartile | 92.410 | 92.280 | 92.020 | 92.520 | 93.110 |
| Mean | 68.413 | 68.735 | 70.822 | 76.431 | 80.004 |
| Variance (n) | 919.642 | 885.355 | 767.734 | 540.505 | 404.372 |
| Variance (n − 1) | 920.737 | 886.409 | 768.648 | 541.148 | 404.854 |
| Standard deviation (n) | 30.326 | 29.755 | 27.708 | 23.249 | 20.109 |
| Standard deviation (n − 1) | 30.344 | 29.773 | 27.724 | 23.263 | 20.121 |
| Variation coefficient | 0.443 | 0.433 | 0.391 | 0.304 | 0.251 |
| Asymmetry (Fisher) | −0.916 | −0.934 | −1.073 | −1.475 | −1.828 |
| Kurtosis (Fisher) | −0.707 | −0.650 | −0.233 | 1.097 | 2.588 |
| Standard deviation standard of mean | 1.046 | 1.027 | 0.956 | 0.802 | 0.694 |
| Lower limit of mean (95%) | 66.359 | 66.720 | 68.946 | 74.856 | 78.643 |
| Upper limit of mean (95%) | 70.466 | 70.750 | 72.699 | 78.005 | 81.366 |
| Standard deviation of variance | 44.927 | 43.252 | 37.506 | 26.405 | 19.755 |
| Lower limit of variance (95%) | 838.657 | 807.389 | 700.125 | 492.907 | 368.762 |
| Upper limit of variance (95%) | 1015.551 | 977.687 | 847.800 | 596.873 | 446.544 |
Table 4.
South Africa: summary statistics.
| Statistics | 2012 | 2013 | 2014 | 2015 | 2016 |
|---|---|---|---|---|---|
| N° of observations | 127 | 127 | 127 | 127 | 127 |
| Minimum | 3.200 | 3.140 | 3.830 | 6.100 | 8.230 |
| Maximum | 94.800 | 95.740 | 95.130 | 94.890 | 95.480 |
| 1st Quartile | 39.790 | 38.955 | 45.875 | 61.100 | 73.140 |
| Median | 63.100 | 60.750 | 64.820 | 75.960 | 83.540 |
| 3rd Quartile | 83.275 | 80.785 | 83.930 | 86.325 | 90.380 |
| Mean | 58.457 | 58.555 | 60.942 | 69.659 | 76.114 |
| Variance (n) | 750.205 | 759.919 | 645.280 | 466.200 | 407.055 |
| Variance (n − 1) | 756.159 | 765.950 | 650.402 | 469.900 | 410.286 |
| Standard deviation (n) | 27.390 | 27.567 | 25.402 | 21.592 | 20.176 |
| Standard deviation (n − 1) | 27.498 | 27.676 | 25.503 | 21.677 | 20.256 |
| Variation coefficient | 0.469 | 0.479 | 0.417 | 0.310 | 0.265 |
| Asymmetry (Fisher) | −0.503 | −0.489 | −0.603 | −1.133 | −1.621 |
| Kurtosis (Fisher) | −0.862 | −0.875 | −0.684 | 0.364 | 1.861 |
| Standard deviation of mean | 2.440 | 2.456 | 2.263 | 1.924 | 1.797 |
| Lower limit of mean (95%) | 53.628 | 52.695 | 56.464 | 65.853 | 72.557 |
| Upper limit of mean (95%) | 63.286 | 62.415 | 65.421 | 73.466 | 79.671 |
| Standard variation of variance | 95.267 | 96.501 | 81.943 | 59.202 | 51.691 |
| Lower limit of variance (95%) | 599.362 | 607.123 | 515.534 | 372.462 | 325.209 |
| Upper limit of variance (95%) | 984.035 | 996.776 | 846.406 | 611.509 | 533.929 |
Table 5.
Summary statistics.
| Year | EU | SA | ||||||
|---|---|---|---|---|---|---|---|---|
| 1st Quartile | Median | 3rd Quartile | Mean | 1st Quartile | Median | 3rd Quartile | Mean | |
| 2012 | 44.310 | 84.230 | 92.410 | 68.413 | 39.790 | 63.100 | 83.275 | 58.457 |
| 2013 | 46.400 | 83.480 | 92.280 | 68.735 | 38.955 | 60.750 | 80.785 | 57.555 |
| 2014 | 51.500 | 83.610 | 92.020 | 70.822 | 45.875 | 64.820 | 83.930 | 60.942 |
| 2015 | 66.580 | 87.110 | 92.520 | 76.431 | 61.100 | 75.960 | 86.325 | 69.659 |
| 2016 | 75.060 | 88.750 | 93.110 | 80.004 | 73.140 | 83.540 | 90.380 | 76.114 |
Table 6.
Levene’s test for homogeneity of variance.
| Effect: Year Degrees of Freedom for all F’s: 4, 4200 | ||||
|---|---|---|---|---|
| MS | MS | F | P | |
| EU | 19862.76 | 216.7823 | 91.62538 | 0.00 |
| SA | 1665.374 | 203.8461 | 8.169762 | 0.000002 |
Table 7.
Kolmogorov–Smirnov test.
| D | p-Value | |
|---|---|---|
| EU | 0.214 | <0.0001 |
| SA | 0.117 | <0.0001 |
Table 8.
Kruskal–Wallis test.
| K (Observed Value) | K (Critical Value) | GDL | p-Value | |
|---|---|---|---|---|
| EU | 64.643 | 9.488 | 4 | <0.0001 |
| SA | 51.332 | 9.488 | 4 | <0.0001 |
Table 9.
Median test.
| Europe Chi-Square = 48.00958 df = 4 p = 0.0000 | ||||||
| 2012 | 2013 | 2014 | 2015 | 2016 | Total | |
| <=Median: observed | 442 | 470 | 451 | 397 | 345 | 2105 |
| expected | 421 | 421 | 421 | 421 | 421 | |
| obs.-exp. | 21 | 49 | 30 | −24 | −76 | |
| >Median: observed | 399 | 371 | 390 | 444 | 496 | 2100 |
| expected | 420 | 420 | 420 | 420 | 420 | |
| obs.-exp. | −21 | −49 | −30 | 24 | 76 | |
| Total: observed | 841 | 841 | 841 | 841 | 841 | 4205 |
| South Africa Chi-Square = 62.90409 df = 4 P = 0.0000 | ||||||
| 2012 | 2013 | 2014 | 2015 | 2016 | Total | |
| <=Median: observed | 80.0000 | 78.0000 | 77.0000 | 55.0000 | 28.0000 | 318.0000 |
| expected | 63.6000 | 63.6000 | 63.6000 | 63.6000 | 63.6000 | |
| obs.-exp. | 16.4000 | 14.4000 | 13.4000 | −8.6000 | −35.6000 | |
| >Median: observed | 47.0000 | 49.0000 | 50.0000 | 72.0000 | 99.0000 | 317.0000 |
| expected | 63.4000 | 63.4000 | 63.4000 | 63.4000 | 63.4000 | |
| obs.-exp. | −16.4000 | −14.4000 | −13.4000 | 8.6000 | 35.6000 | |
| Total: observed | 127.0000 | 127.0000 | 127.0000 | 127.0000 | 127.0000 | 635.0000 |
Table 10.
Mann–Whitney test.
| Z | p-Level | Significant | ||
|---|---|---|---|---|
| EU | Y2016 vs. Y2012 | 6.032353 | 0.000000 | Yes |
| Y2016 vs. Y2013 | 6.298073 | 0.000000 | Yes | |
| Y2016 vs. Y2014 | 6.098119 | 0.000000 | Yes | |
| Y2016 vs. Y2015 | 2.680851 | 0.007344 | Yes | |
| Y2015 vs. Y2012 | 3.660797 | 0.000251 | Yes | |
| Y2015 vs. Y2013 | 3.865622 | 0.000111 | Yes | |
| Y2015 vs. Y2014 | 3.516014 | 0.000438 | Yes | |
| Y2014 vs. Y2012 | 0.463869 | 0.642742 | No | |
| Y2014 vs. Y2013 | 0.599515 | 0.548830 | No | |
| Y2012 vs. Y2013 | 0.073647 | 0.941292 | No | |
| SA | Y2016 vs. Y2012 | 5.377173 | 0.000000 | Yes |
| Y2016 vs. Y2013 | 5.653027 | 0.000000 | Yes | |
| Y2016 vs. Y2014 | 5.149135 | 0.000000 | Yes | |
| Y2016 vs. Y2015 | 3.211271 | 0.001322 | Yes | |
| Y2015 vs. Y2012 | 3.160881 | 0.001573 | Yes | |
| Y2015 vs. Y2013 | 3.426492 | 0.000612 | Yes | |
| Y2015 vs. Y2014 | 2.826090 | 0.004712 | Yes | |
| Y2014 vs. Y2012 | 0.594426 | 0.552228 | No | |
| Y2014 vs. Y2013 | 0.904451 | 0.365757 | No | |
| Y2012 vs. Y2013 | 0.287818 | 0.773486 | No |
Table 11.
Test F for the group intercept difference.
| SA | EU | |
|---|---|---|
| Test F H0: ωt = 0 | 19.05 | 23.46 |
| Degrees of freedom | 112.449 | 362.1449 |
| p-value | 7.17 × 10−117 | 0.000 |
Table 12.
Panel Regression.
| Fixed Effect Panel Regression (Dependent Variable Market Value per Share: MVS) | SA | EU |
|---|---|---|
| A4R | 57.8386 | 194.689 |
| p-value | 0.00562 | 0.00273 |
| BVPS | 2.06578 | 0.00259092 |
| p-value | <0.00001 | 0.08953 |
| EPS | 0.492042 | 0.00173262 |
| p-value | 0.027423 | 0.08016 |
| const | −3217.1 | 21763.3 |
| p-value | 0.03698 | 0.00001 |
| R2 | 0.8849 | 0.8562 |
© 2018 by the authors. Licensee MDPI, Basel, Switzerland. This article is an open access article distributed under the terms and conditions of the Creative Commons Attribution (CC BY) license (http://creativecommons.org/licenses/by/4.0/).
Share and Cite
MDPI and ACS Style
Loprevite, S.; Ricca, B.; Rupo, D. Performance Sustainability and Integrated Reporting: Empirical Evidence from Mandatory and Voluntary Adoption Contexts. Sustainability 2018, 10, 1351. https://doi.org/10.3390/su10051351
AMA Style
Loprevite S, Ricca B, Rupo D. Performance Sustainability and Integrated Reporting: Empirical Evidence from Mandatory and Voluntary Adoption Contexts. Sustainability. 2018; 10(5):1351. https://doi.org/10.3390/su10051351
Chicago/Turabian StyleLoprevite, Salvatore, Bruno Ricca, and Daniela Rupo. 2018. "Performance Sustainability and Integrated Reporting: Empirical Evidence from Mandatory and Voluntary Adoption Contexts" Sustainability 10, no. 5: 1351. https://doi.org/10.3390/su10051351
Note that from the first issue of 2016, this journal uses article numbers instead of page numbers. See further details here.