Assessing the Needs and Gaps of Building Information Technologies for Energy Retrofit of Historic Buildings in the Korean Context

School of Architecture, Seoul National University of Science and Technology, Seoul 01811, Korea
Sustainability 2018, 10(5), 1319; https://doi.org/10.3390/su10051319
Submission received: 27 March 2018
/
Revised: 17 April 2018
/
Accepted: 19 April 2018
/
Published: 24 April 2018
(This article belongs to the Special Issue Cultural Heritage Conservation and Sustainability)
Abstract
:Most domestic modern buildings from the early 1900s have been constructed as heavy mass, and for many years have relied on passive measures for climate control. Since effective passive measures eventually reduce the heating and cooling loads, thus also reducing the system size, passive and hybrid measures are the most preferred Energy Conservation Measures (ECMs). In addition, the domestic situation and climate are additional constraints in energy retrofit decision making, such as a shorter budget and time, poor maintenance history, and uncertainties in vernacular lifestyle. For this reason, the performance improvement and side-effects prior to installing ECMs should be predictable, particularly in case the originality can be damaged. This complexity confirms that simulation-based Measurement and Verification (M&V) would better suit the energy retrofit of domestic historic buildings. However, many domestic investors still believe re-construction has a larger economic value than restoration. Therefore, they are even unwilling to invest in more time than a preset audit period—typically less than a week. Although simulation-based M&V is theoretically favored for retrofit decision making, its process including collecting data, modeling and analysis, and evaluating and designing ECMs could still be too demanding to domestic practitioners. While some manual, repetitive, error-prone works exist in the conventional retrofit process and simulation-based M&V, it is proposed here that enhanced Building Information Technology (BIT) is able to simplify, automate, and objectify, at least the critical steps of the retrofit project. The aim of this study is to find an efficient and effective energy retrofit strategy for domestic historic buildings that appeals to both domestic investors and practitioners by testing selective BIT tools on an actual historic building. This study concludes with the suggestion that software vendors are asked to develop enhanced features to resolve users’ pending demands. It is also suggested that, in the domestic context, how the current practice for each process of the energy retrofit of historic buildings needs to shift to take a full advantage of BIT.
1. Introduction
Most domestic modern buildings in Korea were built in the early 1900s. While the preservation of traditional Korean buildings places strong emphasis on retaining the original forms and functionality, domestic modern buildings have another option—reconstruction or restoration; since they are not actually genuine in traditional architecture and also still rentable, preserving them as an historic building or not actually depends on investor’s preference.
Compared to European countries, in which modern buildings apparently represent one of historical architectural styles, the preservation of domestic modern buildings, in particular focusing on energy conservation and improving thermal comfort, has not yet been thoughtfully addressed in Korea. Meanwhile, occupants in some aged buildings suffer from inconvenience, discomfort, energy waste, and health issues.
Reconstruction vs. Restoration. Urban regeneration involves building restoration that includes improving the built environment, preservation, and partial redevelopment according to the community and neighborhood’s demands. Obviously, not all aged buildings are deemed worthy of restoration. However, a difficult task for investors is to determine whether to perform demolition or retrofitting when an aged building needs attention. In fact, most domestic investors still believe re-construction after demolition has a greater economic value than restoration or remodeling, because the property value significantly escalates when a new building replaces an aged building, especially when the land value has already been rapidly escalating.
Even if an aged building is considered worthy of restoration, when a feasibility investigation is performed during the pre-planning phase, domestic investors are not willing to spend more than a preset budget nor extend the set time period. For example, as many domestic modern buildings have, for a long time, suffered from poor maintenance and lack of proper facility management, very few drawings, documentation, and artifacts are available. This means the baseline must be rebuilt, implying an extra cost.
From a technical perspective, most historic building restoration projects begin with redrawing drawings and estimating material properties. This is one of the most critical steps of the entire procedure, because the components that need to be retained, replaced, or removed are selected via investigations, diagnostics, and audits based on these drawings. Yet these drawings are manually performed, repetitive, error-prone, and tedious; for example, designers need to measure the dimensions with tape rulers, seek similar materials from historical documents, and determine the appropriate Energy Conservation Measures (ECMs) based on similar projects or previous experience.
In this work, it is proposed that the use of enhanced Building Information Technology (BIT) is able to remove the repetition, simplify, automate, and objectify such critical steps of the restoration project. Although a number of studies have embraced BIT tools for energy retrofit, some research works have failed to encourage practitioners to adopt BIT. This study proposes an efficient and effective energy retrofit strategy for restoring domestic modern buildings that can appeal to domestic investors through testing BIT tools on an actual aged building considered for restoration. Through a pilot test, this study presents an opportunity in which the process of restoration and energy retrofit (including collecting data, diagnostics, and evaluating and designing ECMs) can be more resilient, and thus can become more efficient and economic. Finally, this study concludes with a discussion on the need in current practice in the domestic context for each process of the energy retrofit of historic buildings to be adjusted to take advantage of BIT.
2. Energy Retrofit of Historic Buildings in the Literature and in Practice
2.1. Features of Energy Retrofit of Historic Buildings Described in the State of the Art
Industry-wide accepted energy saving verifications fall into two general categories: retrofit isolation and whole building [1]. In many cases of general energy retrofits, mechanical ECMs are considered first. This is because the Return of Investment (ROI) of mechanical ECMs is generally somewhat less than that for architectural ECMs, and energy savings by mechanical ECMs can be more prominent than those by architectural ECMs, especially in the early report period.
However, the American Society of Heating, Refrigerating and Air-conditioning Engineers (ASHRAE)’s energy efficiency guideline for historic buildings [2] advises that energy efficiency and energy conservation improvement projects and programs for historic buildings should be performed while minimizing disturbance to historical characteristics, significance, and values. Technically this refers to (i) the preservation, reconstruction or restoration of historic building materials and interior artifacts; (ii) building’s distinguishing features including specific architectural style, materials or construction technology; and (iii) floor plans describing the arrangement of spaces, and finishing features while holding reversibility of changes.
As the guideline indicates, decisions concerning the energy retrofit of historic buildings are not simply made only based on energy economics. The following is a summary of factors to be considered regarding the uniqueness of the energy retrofit of historic buildings as reported in the relevant literature [2,3,4,5,6,7,8]:
- The ECMs currently employed focus on envelope refurbishment including the addition of insulation, filling air leaks, and replacing glazing. This is because most historic buildings depend on passive measures for climate control; lagged heat dissipation by heavy structural mass, wide earth contact, natural ventilation, evaporative cooling are frequent cooling measures, while solar radiation is the primary heat source while stoves are used as an auxiliary heating. Employing mechanical ECMs needs to be carefully managed, because a new system may jeopardize the thermal balance that has lasted for a long time.
- Many historic buildings are built of stone, brick, or concrete, which are considered heavy thermal mass materials. Although the physical measurement of indoor and surface temperature enables a better understanding of the past thermal behavior of the structure, to ensure accuracy, predicting the thermal behavior in a future situation where new ECMs are installed requires a building model that incorporates the first principle of the thermal mass. For this reason, dynamic simulations based on differential equations have been proposed in many studies.
- Since heating and cooling loads depend on the heat capacity of the heavy structure, uncertainty of the volume and material properties of the structure can largely affect the energy performance of the entire facility. A precise assessment of the building mass and material properties is necessary to predict the heating and cooling loads for optimal system sizing.
- Many historic buildings have insufficient space for extra mechanical equipment due to physical constraints. Therefore, instead of a central system requiring a large space, distributed and multi-zone systems are preferred. Additionally, the first step would involve reducing the heating and cooling loads to reduce the system size.
- Considering the 15–20 year life cycle of typical air conditioning systems, historic buildings may have already undergone prior refurbishments. For buildings in which the heating, ventilation, and air conditioning (HVAC) system has been refurbished under an incomplete master plan, the removal or replacement of the HVAC systems is needed since they are contributing to the deterioration of the original architectural features, even though they are still functional.
- It is recommended that care be taken to avoid installing duct or pipe runs that cover up the architectural features of historic buildings and to avoid placing new systems at visible or significant locations.
- Sealing operable windows, filling up cracks, installing extra internal insulation, and changing air distribution patterns with new air devices can cause unexpected condensation. Failure of humidity control can accelerate the deterioration of historic materials and can exacerbate mold or mildew problems.
2.2. Singularity and Issues of Energy Retrofit of Historic Buildings in Domestic Context
Since the energy retrofit of historic buildings stresses retaining originality and reversibility, the most important prerequisite is to gather building energy data on the current building state that are of sufficient detail to construct a tangible data format (whether in a written document or digital model). However, most practitioners in the domestic market seem to be unprepared for the energy retrofit of historic buildings due to building-related constraints, unavailability of data, and lack of expertise. These issues in the domestic context are summarized as follows.
- Very few documents, drawings, and records that describe a building’s status and repair/maintenance history are available for most aged buildings. Such insufficient detail and level of building energy data eventually leads to inaccurate estimation of property profiles and values, rendering the energy audit less reliable.
- Retrofit buildings are mostly small-to-medium buildings, the owners of which may not be able to afford regular maintenance and long term monitoring due to the operation cost of the building. Investors may be more hesitant to select passive ECMs for poorly maintained buildings because, while passive ECMs are preferred over mechanical ECMs, their larger initial investment and longer ROI compared to those of well-managed buildings would not be financially viable. A cost vs. effectiveness analysis of passive and hybrid ECMs must therefore be very convincing to investors.
- Conventionally, a period of less than a week including energy audits is given to make major decisions for planning restoration and energy retrofits. As this period is not sufficient to collect energy data and to observe long-term performance, only a few days of spot measurements are allowed. Also, standard ECMs tend to be determined based on a priori data rather than on specific audits. This practice raises the argument about whether or not the energy audit result is necessary, and renders the ECMs selected via these energy audits questionable.
- Since the material vintage of both the envelope and finishing is unknown in many cases, the thermal properties of these materials deviate considerably from the rated or design value, even from the widely known range of variation. This adds further complications in quantitatively estimating the thermal behavior of the building, because as most modern buildings are of heavy construction (e.g., concrete or masonry), even small deviations in thermal properties and structural volume cause a large displacement from actual behavior.
- Most of these buildings have fallen into disrepair, have many leaks, and the occupants have relied on natural ventilation for most of the buildings’ lifetime. It is thus difficult to estimate how air flows around the building and how moisture is transported. Also, Korea experiences a very humid monsoon season lasting two months every year. Eventually, this may cause unexpected and unnoticeable condensation, mold and mildew, stuffiness, and odors, although airtightness and air circulation can be improved. It is therefore important to understand the current indoor and outdoor air behavior.
- Almost all buildings completed before the 1970s are not equipped with cooling systems. In many cases, only packaged air conditioners and auxiliary heaters are likely available because of the insufficient space available to install air handlers and pipe and duct runs. In many cases of restoration, only split systems are therefore allowed. However, the most reasonable technology that can achieve the greatest energy saving and can control moisture and condensation as well as meet the heating and cooling demands may not be always be selected due to the spatial and physical constraints.
2.3. Objectives of Study
Energy retrofit of historic buildings has more constraints and requires more care than a general energy retrofit (Section 2.1). Additionally, the domestic situation and climate affect the cost-effectiveness of the project, maintenance issues, and uncertainties occurred by vernacular context (Section 2.2). This complexity confirms the importance and role of Measurement and Verification (M&V); M&V is the practice of measuring and calculating energy savings by ECMs and verifying the improved energy performance of the post-retrofit compared to the pre-retrofit [9].
Additionally, the actual installation of ECMs in retrofit sites is often carried out without specific construction plans. Even when detailed construction plans are used at the outset, complexities of the retrofit site often hinder the accomplishment of the expected plan. In the case where installation works are believed to not satisfy the project goals or to be underperforming, the works should be stopped and the process should return to the initial state. However, if the as-is state is not recorded in sufficient detail, it is almost impossible to restore its function to the original state.
In this study, it is believed that BIT tools can alleviate the previously mentioned issues, and overcome the difficulties of the energy retrofit of domestic historic buildings. The aim of this study is therefore to present how BIT tools can facilitate acquiring energy data, simplify the entire audit process, promote the simulation-based M&V [2], support smart design and build, and finally achieve a reasonably economic and well performing energy retrofit of a historic building.
2.3.1. Simulation Based Decision Making for Energy Retrofit of Historic Building
In an energy retrofit of a historic building, more emphasis is placed on passive ECMs while maximizing the existing climate control and keeping architectural features. Therefore, simulations from pre-planning to design phases are able to provide considerable insight and information for decision makers concerning those features that can be modified and those that should not be touched. Although observation and measurement for both pre-ECM and post-ECM represent the actual state of the building, routine and non-routine fluctuations may distort the baseline. For restoration projects where complex interactions between passive and active ECMs are anticipated, a model-based (i.e., simulation-based) baseline with high fidelity inputs can therefore be more stable than a data-driven baseline.
In the case of a heavy mass structure, at least several months of observed data is required for completely capturing accurate thermal behavior and the way in which the building reacts to environmental events. As conventional domestic practice does not allow long term measurement, piece-wise observation and/or spot measurement are sometimes the only available data source in many cases. If it is the case, the model-based baseline (even if inputted with a sparse and occasional data set) can be again considered more reliable than a data-driven baseline.
Regardless, the energy data of which the resolution and history are sufficient for simulation inputs should be collected during audit. While the existing practice of collecting energy data remains expensive in terms of effort and time, the use of BIT tools is expected to be more favorable for collecting energy data for simulation. Modeling, model calibration, and analysis and comparison that are necessary to expedite simulations are also expected to become more succinct and faster if BIT tools are actively used.
Another objective of this study is to discuss the way each step of the decision-making process for the energy retrofit of an historic building needs to be adjusted to facilitate the use of BIT tools and to achieve the maximum benefits from them, especially in the domestic situation. For example, although model calibration is one of the essential procedures for simulation, well-engineered calibration still demands considerable computation and expertise, which can be a fairly large burden for practitioners. One of the aims of this study is to suggest ways in which conventions of simulation-based M&V need to be adjusted according to various situations and needs in the domestic context.
2.3.2. BIM Based Design Development for Energy Retrofit of Historic Building
Compared to general energy retrofits, the energy retrofit of a historic building imposes strong restrictions and limitations when replacing the existing building components. For example, insulation can be applied to only some parts of the exterior wall, or the pipeline between the Variable Refrigerant Flow (VRF) indoor and outdoor units can be placed only through a specific corner. In current practice, temporal field design changes due to unexpected site situations are very frequent, and thus the quantity and cost may differ significantly from their initial values estimated at the design phase. Consequently, the project is delayed.
The use of BIM is expected to promote smart design and build. It is well known that at the design phase, BIM can reduce trial and error, estimate material quantity with precision, identify incompatible components, and simulate the installation process. The aim of this study is to present the way in which BIM based design development can enhance design productivity and reduce actual construction issues for building restoration projects.
3. Building Information Technology Used for Energy Retrofit of Historic Building
The simulation M&V typically begins at the Investment Grade Audit (IGA) [10] phase, where more detailed building data are collected for in-depth diagnostics, upon which financial decisions are made. As shown in Figure 1, the simulation M&V proceeds with the acquisition of building energy data, including the building geometry, modeling and calibration, evaluation and selection of ECMs, the design and configuration of ECMs, and finally a performance verification of the chosen ECMs. In the following sections, the potentials of the building information technologies (Table 1) as well as the practitioners’ criticism and anticipation of them over the process are discussed.
3.1. Geometry Acquisition and Its Modeling
Geometry modeling is known to comprise more than 80% of the effort of running a building simulation. Although geometry models used for energy simulations do not require as much detail as those for Computational Fluid Dynamics (CFD) simulations, precisely defined geometry and construction enable the precise assessment of solar radiation, heat transfer between zones, and thermal lag.
In the conventional process of building energy modeling, the modeler first reads the floor plans and elevation of the building in question. The modeler then simplifies the geometry features and describes them in the Graphical User Interface (GUI) of the building energy simulation tools. Model simplification includes selection of the structural materials, abstraction of the complex shape, the aggregation of similar spaces and similar floors, and the removal of components that have less influence. The modeler chooses the simplification because (i) some modeling guidelines encourage abstraction and simplification [21,22,23]; (ii) GUI of the building energy simulations does not offer details of the functions; and (iii) consequently, modelers assume that model simplification is a customary procedure of building energy modeling.
If documentation or drawings illustrating the building geometry are not available, which is often the case for aged buildings, the modeler will apply the rule-of-thumb and a priori knowledge when materializing the geometry. In this case, oversimplification of a model may introduce a critical discrepancy between the model and the reality.
3D scanning and photogrammetry are emerging technologies that can digitally reconstruct actual building geometry without simplification. 3D scanning, in particular, has been actively applied for restoration, documentation, and reverse-engineering of cultural heritages [24,25]. 3D GIS offers 3D visualization of the site, roads, buildings, and structures in urban areas. All three technologies support the exporting of a 3D mass model of a building wrapped with façade images. In the case of photogrammetry and 3D GIS, however, users still need to locate interior rooms in a 3D mass model and to define the structural geometry because these technologies only capture the building exterior.
As depicted in Figure 2, in registration, one of the post-processing tasks, scenes generated by 3D scanning and photogrammetry are organized together, and are then merged into the entire building geometry. The next step involves constructing a building information model of the acquired building geometry. These two tasks are usually performed manually, whereby the modeler assigns each point a cloud object of the semantics that define the properties and behavior through drawing the building’s boundaries and selecting the most similar building element from the libraries. In the next step, the Building Information Model-to-Building Energy Model (BIM-to-BEM) [12] is used to transform the information model of the entire building into a building energy model that includes thermal context, usage profiles, and energy system configuration. This series of works is typically performed either in BIM authoring tools or in energy simulation tools.
While recent research efforts have attempted to actively apply 3D capturing technologies to building performance diagnostics and energy analysis [25], practitioners still hesitate to use them because of their considerable machine and software expenses, lack of skilled building information modelers, laborious mapping between point cloud and building library element, and the human interventions needed at each transition step. Recently, however, the more reasonable rate for renting equipment has promoted 3D scanning.
The Scan-to-BIM [11] technology extracts building elements from point cloud data. It is a semi-automated mapping tool whereby users draw a boundary over the point cloud object of interest, and scan-to-BIM then searches for the element that has a geometry that most closely resembles that of the element predefined in the library. While it saves significant modeling effort, users still need to continue to use manual operation for the following reasons:
- Semi-automation requires training to accurately draw the boundary of a target object and then to assign the most suitable building elements. The choice of building elements differs according to the scan-to-BIM tools, and is fairly dependent on individual experience.
- Identifiable elements are somewhat limited in many cases, and also require an extensive customization of standard elements.
The BIM-to-BEM technology transforms the entire building’s information model into a building energy model. It not only converts the XYZ coordinates of each building element of the BIM to those of the BEM, it also assigns data on the weather, building zones, thermal properties of the structural elements, building usage profiles, default HVAC and plant system definitions, and the energy simulation configuration. In most cases, however, its default assignment is designed to suit the ratings of new designs such as Leadership in Energy and Environmental Design (LEED). Users need to customize the BIM data to the state and setting of the existing building. Additionally, the context and defaults that are norms and de-facto standards of several countries (on which mostly in which major BIM authoring tool developers are based) are assigned through the BIM-to-BEM technologies. Therefore, in many local cases, users only take advantage of the geometry conversion of the BIM-to-BEM.
3.2. Acquisition of Building Energy Data
Along with building geometry, simulation-based M&V requires an intensive amount of building energy data. In current practice, the majority of data are gathered and collected during audits, the Level of Detail (LOD) of which [26] varies according to the purpose of the audit.
Considering the practice of most domestic energy retrofit projects, long term measurement that typically takes at least a couple of months is not likely doable, even in IGA. In many cases, only spot measurement instruments are available for audits and have already been frequently employed for energy retrofit. Table 2 summarizes the type and details of building energy data, and the current measures needed to collect the data. It also highlights alternative measures that could replace the current practice or that could be more widely employed for following energy retrofit projects.
3.2.1. Weather Data
The weather data that matches the same calendar days as those given in each utility bill should first be acquired. In most cases, practitioners manually format the obtained raw weather data in one of the standard weather file formats. While standard weather formats require several weather variables, in most cases only limited types of data on temperature, solar radiation, and humidity are available in the raw observed weather data. In addition, in most cases weather stations that provide the available weather data are located far from the building site. Due to this difficult preparation process, the only option is to select a library weather file data instead of the observed weather data.
Weather information providers supply online and on-demand weather services in the form of Application Program Interfaces (APIs). Users can conveniently access both the observed and predictive weather without manual conversions or further verifications; the users simply feed geological locations and time periods into the service, providing well formatted historical weather files with an adequate spatiotemporal resolution in a few minutes. Although all the weather data over all the international locations may not be actually observed, as their raw data are based on physical observations, the delivered weather data is interpolated and processed by scientifically validated forecast models.
3.2.2. Utility Data
Since utility data act as a benchmark when calibrating the baseline energy model, frequent metering intervals enable accurate calibration, therefore allowing accurate diagnostics in searching for adequate ECMs. However, for many aged buildings, even hourly metering is often not available unless monitoring devices have already been installed. Also, since most utilities are priced for the building stock that includes multiple aged buildings, the utilities of an individual building are usually unknown. Maintaining monthly utilities of the entire building stock and then dividing the data into manageable sizes based on the facility manager’s rule of thumb (e.g., proportional to gross building area) is a typical practice in collecting utility data.
Recently, driven by the grid providers, Advanced Metering Infrastructure (AMI) devices and smart meters have recently been installed in existing buildings. In addition to reading values, they enable two-way communications between the local device and the service provider, such that the occupant can verify their electricity use in real time and then take the appropriate action if needed. One benefit of the AMI and smart meters for M&V is that these unexpected user actions affecting the building’s energy usage profile are recorded (yet most of these are undocumented in legacy building operation logs), and can then be tracked back to the case building energy usage patterns that differing from the norms observed.
3.2.3. Building System’s Energy Flow
As plant and HVAC systems are the primary energy consumer of a building, for energy retrofits, determining the energy flows between building systems is critical. The most important system variables that should be defined for building energy simulation include energy capacity, efficiency, performance curve, set-point, and controls. Auditors typically collect the system’s design properties (e.g., rated capacity and efficiency) and current states and conditions via inspection and surveys. As the values of the other three variables (performance curve, set point, and controls) typically differ from their original design values, they need to be regressed based on the measured power consumption and energy outputs. Otherwise, the original design, nominal or simulation default values can be set to simulation if measurements are not feasible.
Although the Energy Management Control Systems (EMCSs) are useful to collect data on the power consumption, flow rate, and flow temperature of plant and refrigerators, aged buildings are rarely equipped with EMCS; typically, only spot measurements by in-situ devices are available during audits. Due to the significance of the system’s energy flows, in-situ devices for spot measurement including portable sensors, transmitters, and data loggers have been indispensable technologies for M&V; they basically include flow meters, thermometers, watt meters, etc. and a more detailed usage of the devices per monitoring variable is listed in Table 2. Some in-situ devices are employed for projects where the budget allows it.
3.2.4. Lightings, Plug and Process Loads and Occupants
Lighting Power Density (LPD), Electric Power Density (EPD) and occupant density are some of the most difficult energy data to acquire from existing buildings. In current practice for estimating LPD and EPD, auditors count the number of lights/equipment and then read their rated power draws marked in the back panel of the device. If the project budget allows, portable power meters are often used for reading actual peak power use per equipment. For estimating the occupant density, the number of occupants is generally surveyed through manager or occupant interviews. The surveyed occupancy is then assumed to operate according to standard usage profiles that vary according to the building type. Compared to the energy flows between building systems, the fluctuations and dynamics in LPD, EPD, and occupancy density tend to be considered insignificant.
However, as they are also primary energy contributors of a building, their actual use profiles may provide information for the selection of the control type ECMs, such as parasitic load controls or occupancy based light controls. Similar to building energy systems, EMCSs can determine the actual power draw of lights and plug and process loads. For aged buildings without EMCS, portable power meters can be an alternative of EMCS. These meters typically function with data logging and wireless communication, such that the actual usage profile can be easily acquired once they are installed.
3.2.5. Building Envelope and Infiltration
Although the thermal behavior of the envelope affects the building’s energy loads, the in-situ measurement of the thermal properties of the existing building’s envelope is known to be a difficult task in M&V. Because single spot measurement usually takes at least two to three days, it takes a number of days to properly measure multiple spots for a single element, e.g., average U-value of south wall. Instead of physical measurements, in current practice, either discounted nominal values that match the construction type or bottom performance values that account for a safety factor are often set to the thermal properties of the envelope in building energy simulation. In the case of infiltration, a blower door test is the only solution to precisely quantify infiltration rates. However, due to the high cost, such test is typically avoided for short audits.
Typically, heat flux and Solar Heat Gain Coefficient (SHGC) meters have recently started to be employed. The reduced purchasing cost, enhanced stability, and easier operation has motivated their use by auditors. However, in the case of measuring the U-value, at least three days is still required for a single spot. Also, as the temperature difference between indoor and outdoor decreases, measurement noises tend to increase.
3.2.6. Operation and Management Records
Although operation and management strategy, and maintenance and retrofit history are not direct inputs of simulation, they provide auditors with comprehensive information on the facility of interest. This information is usually collected through manager and operator surveys.
3.3. Model Calibration
Calibrating the building energy model of an existing building involves revising the model parameters in order to match the actual utility data of the resulting outputs [27]. The process is iterative until the statistical indices of the output differences (e.g., MBE and CV-RMSE) meet a certain tolerance. In broader terms, calibration of the building energy model is carried out in order to modify and update the building energy model with the actual operation conditions. Therefore, the availability of high quality energy data is the most important prerequisite for starting the calibration. For example,
- The availability of utility data of the building determines the baseline term of calibration. At least twelve consecutive months of utility data are required. Longer utility data renders calibration more robust.
- Depending on the temporal resolution of the available energy data, calibration targets can be varied at higher accuracy.
- The first step of calibration involves editing the observed weather period to match the utility data period, because the actual weather has the strongest impact on actual energy uses.
- However, the desired level of energy data may not be met in practice. For example, the only available actual data for the entire facility are monthly bills;
A complete actual weather record that matches the utility bill period is not available or only partial weather variables are available;
Even spot measurements are not possible due to the limitations of the audit budget.
In the case where sufficient detail on the energy data for a given audit cannot be obtained, the parameter estimation can be selected for model calibration. Alternatively, the worst-case scenario can be selected.
The parameter estimation refers to the modulation of the value of uncertain parameters within the range allowed by the statistical criteria. Basically, the parameter estimation is a mathematical optimization that attempts to find a single value for an uncertain parameter [28]. Bayesian calibration [29], used to estimate the probabilistic definition of uncertain input parameters, is a stochastic alternative against finding the deterministic value. Unfortunately, as the parameter estimation requires a number of iterations, it cannot be performed manually, and needs considerable computation power and a large computer framework, which is already beyond the practitioners’ reach.
In the worst-case scenario, the most underperforming value in the known range of uncertain input parameters is considered, such as the greatest U-value of insulation referencing when the building was initially built, or the greatest plug and process load among the reported values for the chosen building type. However, this may not be the actual calibration because it cannot meet the statistical validation criteria, but it is a risk adverse approach.
3.4. Evaluation and Selection of ECMs
During the walk-through, retrofit designers typically have a perception about the candidate ECMs that would improve the environment and performance. In a common and typical procedure of selecting ECMs, designers finalize a set of ECMs referring to the energy profiles acquired through audits as well as the conventional choices made in similar project experiences. Also, the designers refer to design guidelines for energy retrofits.
Most guidelines for the energy conservation and efficiency of historic buildings recommend first considering passive ECMs. As passive ECMs typically require a higher initial cost compared to active ECMs, initial investments should be carefully made. Also, the combined effects of active ECMs (whether a synergy or a dysynergy that cancel each other out) is an important consideration before implementing retrofits.
The period for the ROIs of passive ECMs is typically very long (e.g., ROIs in cases where the envelope insulations are replaced are known to be more than 20 years). Thus, in energy retrofits that consider passive measures, financial subsidy is typically sought. Financial subsidy is usually given for projects that are eligible, such as when mandatory ECMs are accepted or when heating and cooling loads of the existing building are evaluated as substantially reduced by more than the required percentage.
Building energy simulations are used to quantitatively assess the impacts of passive ECMs and combined impacts with active ECMs on building loads and energy use. Dynamic simulations such as DOE2 [19] are based on heat balance differential equations, such that the heat transfer analysis indicates thermal behavior of heavy capacity elements at as small as a few minutes time step. Provided model inputs are reasonably chosen, dynamic simulations are known as the best evaluation tool for passive and combined ECMs.
However, it is difficult to create a well-formed building energy model using dynamic simulations, because a high level of energy modeling expertise and a very detailed level of model inputs are indispensable. Alternatively, quasi-steady state simulations based on heat balance algebraic equations are another type of building energy simulation. They initially originated from European building energy standards ISO 52016-1:2017 [17]. In the domestic market, quasi-steady state simulations have been actively applied for the rating of energy performance of both new buildings [19] and existing facilities [20]. As they require considerably fewer model inputs, they are known to be an easier building energy simulation, which implies more common use. Some domestic public financial subsidies are given as a result of quasi-steady state simulations [30].
Although algorithms of quasi-steady state simulation are available from international standards, their implementation differs among countries, because model inputs and defaults vary according to the local situation and vernacular context. Also, as most of these algorithms were originally developed for anonymous architectural designers who assess the energy performance rating for their design, they are distributed as packaged software in which the most nation-wide input values (i.e., nominal values) have already been surveyed and documented in a library format; the most common systems in the domestic market can also be easily constructed with several mouse clicks. However, the customizing of proprietary systems, weather data, and schedules is not permitted.
Both practitioners and researchers acknowledge the usefulness of building energy simulations in making decisions for new design or retrofit projects. Both types of professionals agree on the difficulty of acquiring high fidelity input data such as measured data. Since practitioners must complete energy analyses within a limited period of time and with limited resources, they tend to choose nominal values instead of measured values; even in situations whereby specifications and design variables are unclear or nominal values can no longer represent the actual states (e.g., outdated boiler or missing nameplate), practitioners prefer the inputs used in the worst-case scenario. In the case where a calibrated model does not meet the required level of detail (such as with modified weather data or an infeasible schedule) or the efforts to calibrate or refine the model are excessive compared to the resulting significance, this practice of selecting the nominal or the worst-case values tends to be considered cost-effective among practitioners. Finally, the ECMs selected through this practical compromise could be questionable.
3.5. Design and Configuration of Active ECMs
When the ECMs have been determined, more precise sizing and design development are carried out for installing the chosen active ECMs. In current practice, the process of sizing and preparing the design development drawings and the documentation for a retrofit would not significantly differ from that for new construction. For example, the building load calculation for sizing systems is based on the same boundary condition and assumptions as those of new construction; the layout and number of required pipes and ducts is approximated by referring to existing drawings or are roughly estimated in the case where no existing drawings are available.
However, in many cases of existing building retrofits, the geometry and spaces of the existing building become design constraints. For example, aged buildings may not have sufficient room for ducts or pipes penetrating walls and floors may be prohibited. Spatial limitations can eventually distort the initial sizing and calculations, which may then cause frequent on-site design changes.
Acquiring the geometry and boundary condition for load calculations can promote more accurate sizing and design development of active ECMs. For example, solar radiation varying according to orientation can be precisely captured. Therefore, the existing heat gains can be taken into account for calculating heating and cooling loads, rendering the calculated loads even closer to the actual load variations. Construction simulations using the BIM of the existing building can provide more accurate and precise initial quantity, and can prevent clashes between elements in advance. For instance, the placement of diffusers and exhausts can be determined by analyzing air flow patterns via CFD simulations, thus it can be prevented in advance that supply air gets stuck by structure or immediately vented out through exhausts before it reaches the floor level.
4. Case Study
This study attempts to discuss the pros and cons of BIT that are introduced above by comparing them with the same or similar tasks carried out in current practice. An existing school building is chosen for case study, to which the selective technologies discussed in Section 3.1, Section 3.2, Section 3.3, Section 3.4 and Section 3.5 have been applied.
4.1. Description of Test Building
A 60-year-old, two story building (1350 m2 of floor area) on the Seoul Tech campus was chosen for the pilot test. The building was initially constructed as an office building. Due to the various needs to alter its functions over the years, class rooms, laboratories, offices, and service areas were eventually located in this building. Although this building has been managed by facility management department, no written records of the historical states of construction and systems or retrofit details are available. In 2012, this building was ranked the 8th largest energy consumer on the Seoul Tech campus.
The campus plant supplies steam which is then distributed to each room via cast iron radiators. As they are only turned on for a few hours per day during the heating seasons and can be triggered by the outdoor air temperature, most occupants complain of overheating during operation and under heating during non-operation. In particular, most occupants reply on auxiliary electric heaters at least 5 to 6 h per day during the winter. Package air conditioners are installed in only a few rooms. The occupants of the second floor complain of excessive heat from the roof in summer, even when air conditioners are operating.
Only data on the monthly electrical consumption is available, while no submetering is available. Thus, the monthly gas consumption must be estimated based on the radiator’s capacity, operating hours, and estimated thermal loss from the block use of gas.
The test building requires improved thermal comfort while its structure and space need to be retained. Although the envelope can be upgraded and air tightness can also be improved, only extra insulation is allowed and replacing an entire façade is not permitted. For structural safety, perforating or punching the façade is also not permitted. One of the requirements is the maximum possible retention of the building’s original shape.
4.2. Geometry Acquisition and 3D Modeling
4.2.1. 3D Reconstruction: 3D Scanning vs. Photogrammetry vs. 3D GIS
To digitally reconstruct the geometry, photogrammetry is first performed. About one hundred panoramic images were captured while walking around the test building; these images were then uploaded to the photogrammetry tool [31] for stitch-up. Unfortunately, only three of the six sides of the building have been reconstructed (Figure 3), and even the registered image becomes distorted and off scale because the distance between the building and the camera has not been kept uniform. They therefore cannot be used as a watermark baseline for further 3D modeling. The photogrammetry tool therefore does not seem to effectively recognize the overlapping scenes.
3D scanning was then performed, whereby about thirty scenes of the exterior and forty scenes of the interior were captured in one day. These Point Cloud images were imported into the registration tool [32]. Finally, the registered Point Cloud images were exported to the BIM authoring tool [33]. The modeler then manually constructs a complete BIM in support of the Scan2BIM tool. As expected, the internal spaces and envelop of the 3D scanned geometry have the same orientation, dimension, and scale as those of the actual building.
Lastly, 3D GIS [34] is used to obtain the exterior shape of the test building. Although the mass retrieved from the 3D GIS has almost the same shape as that of the actual building, as shown in Figure 3, a number of geometric details such as the depression and protrusion and the dimension and location of openings are still ambiguously expressed or missing.
4.2.2. Building Energy Modeling: Manual Modeling vs. BIM2BEM
Since the geometry and dimension of internal spaces can only be provided by 3D scanning, they need to be estimated and constructed by the modeler in the BIM authoring tool. The constructed BIM is then transformed to a building energy model via the BIM2BEM.
Meanwhile manual geometry is modeled directly in building simulation tools such as eQUEST [35]. To minimize the amount of manual work required, the geometry is abstracted as much as possible while attempting to retain the original shape and ratio as shown in Figure 4. For example, the gross floor area, floor height, space placement, and window wall ratio remain equivalent to the actual value. However, the abstraction results in subtle differences in the orientation, geometric depression and protrusion, zone grouping, solar radiation incident angle, and staircase opening. Eventually the synthetic effects among these abstractions could result in displacement of the zone temperature profile and building loads.
4.3. Weather Data: Standard Weather Data vs. Weather ISP
Although the observed weather data are the most critical model input, acquiring and processing the actual weather data as a simulation input requires a high level of expertise. In this case, the weather Information Service Provider (ISP) can be an alternative data source. The ambient temperature profiles by the Autodesk weather ISP [13], for the observed weather of 2014 and the standard EnergyPlus Weather (EPW) are compared. The nearest Autodesk weather station is 4 km from the site and, instead of a specific year, it is based on the multi-year synthetic temperature profiles. Although only the temperature and relative humidity of the 2014 weather are available from the site weather station, all other weather variables including solar radiation are outsourced from the Seoul city weather station. Figure 5 illustrates the ambient temperature profiles in the case of the coldest and hottest days in 2014. When the observed temperature offsets from the norm patterns, the Autodesk ISP temperature tends to more closely match the observed temperature than the EPW temperature, which implies that the ISP weather could be a good alternative when actual weather data is not available.
4.4. Building Energy Model Calibration: Automated Optimization vs. Measured Values
Parameter estimation is performed using mathematical optimization under the nominal scenario. The optimization algorithm searches for the “fitting” values within the ranges of the primary building and systems parameters listed in Table 3. The ranges described in Table 3 are composed of nominal, minimum (min), and maximum (max) values; the nominal value refers to the value supplied by the quasi-steady state simulations that are used for the ratings in the domestic market [19,20], or the condition assumed during the building load calculation and system sizing. The ranges differ from the simulation defaults because simulation defaults often represent the generic values used in specific national circumstances and phases (e.g., the eQUEST defaults refer to the U.S. industry setting). The terms min and max refer to the two edges of the nominal values collected when users select similar types to those given in the remark of Table 3. The rated value refers to the label value given on the back of the equipment.
Calibrations are performed only to the DOE2 model because the quasi-steady state model that is popular in the domestic market does not allow customizing of the input file. The baseline DOE2 model is initially built within the context described in Section 4.1 and the geometry surveyed in Section 4.2. The actual weather data in 2014 is included in the baseline models. ModelCenter [14] and its built-in optimization package were employed for the test.
Unfortunately, the first-round optimization eventually failed due to no convergence, even after adjusting the optimization criteria several times. This is because no modeling method is available that includes electric radiators as auxiliary heating to the DOE2 baseline model. Also, the flexible operation hours per each space cause considerable instability when finding the optimal solutions, and thus eventually cause computation interruptions through many trials. After accounting for the extra electricity use by radiators, implemented as a separated function of the ModelCenter and by fixing the operation hours, many runs of the second-round optimization finally converged. Table 3 lists the ranges of the value sets selected by the optimizer through several trails. A visible observation of the second-round optimization shows that, while the worst-case values tend to be selected for COP, efficiency, LPD, and EPD, the other values are varied per trial. This observation implies that the values most influential in the energy use are the most plausible factors for the optimizer, regardless of whether or not they are closer to the actual values. Indeed, Table 3 clearly shows that many of the optimized values differ from the measured values (i.e., the true values).
The Bayesian calibration is not selected for testing at this time because its implementation requires more algorithmic computations than the mathematical optimization, which is already beyond the practitioner’s reach. In addition, as the mean result from the Bayesian analysis is likely to differ from the measured “true” value (although the measured values are assumed to be located within the distribution of the resulting probability function), no apparent way is available to explain this gap, except for referring to the nature of the probability.
4.5. Evaluation and Selection of ECMs: Dynamic Simulation vs. Quasi-Steady State Simulation
The calibrated baseline (Section 4.4) indicates that the test building consumes an excessive heating energy compared to the neighbor buildings. The occupants, however, complain about cold drafts, although most occupants turn on auxiliary electric heaters. This is because the design of the heating capacity of the steam radiators was initially significantly insufficient to meet the heating demand. The fully loaded operation cannot ensure thermal comfort, which in turn causes reduced gas use compared to the expected gas use.
Apparently, excessive heating energy consumption is due to a poor envelope, such as no insulation, single glazing, and severe drafts. In addition to the cold drafts in winter, the occupants of the 2nd floor also complain about the heat emitted from the roof. The existing HVAC systems do not seem to work properly.
By referencing the design guidelines and the ECMs frequently chosen in similar domestic projects, passive ECMs that specifically enhance envelope performance have been chosen as listed in Table 4. The specification of ECMs complies with the minimum requirement as mandated local codes. Replacement of the Domestic Hot Water (DHW) is not considered in this project because the electric water heaters that were recently installed take advantage of sporadic water use with lower electricity.
Active ECMs include lighting, HVAC system, and renewable energy systems. LED lighting reduces electricity use and decreases internal heat gain. Instead of the air handling units (AHUs) that require a large machine room and wall-penetrating ducts, various types of Electric Heat Pumps (EHPs) (VRF systems are called and sold as EHPs in Korea.) are chosen as listed in Table 5. EHPs are known to be adequate for small school building retrofits because they are very flexible and can cope with variable load changes. Also, their installation is almost free of constraints. To analyze the energy supply portfolios using various sources, both gas and electricity driven heat pumps are included to the candidate arrangement. Photovoltaic panels (PVs), geothermal heat pumps, and fuel cells are considered to be relatively economical systems in the domestic renewable systems market, while applications of solar heating and wind turbines are rather limited due to vernacular constraints and fuel cells are not frequently used for schools. Therefore, photovoltaic panels are chosen to reduce the electricity peaks, and geothermal heat pumps are considered to diversify the portfolio.
All ECMs are currently available as marketed products; they are modeled by referring to their product catalog, specification, system performance curve, and shop drawings. Also, the first costs of the ECMs are compared in relative ranks for each category as listed in Table 4.
Both passive and active ECMs were applied to two types of baselines as follows:
- DOE2 baseline calibrated with measured values
- ECO-CE3 baseline defined with nominal values (i.e., current practice in the domestic retrofit market)
While the calibrated DOE2 baseline utilizes 3D scanned geometry, the observed weather, and the measured values listed in Table 3, the nominal ECO-CE3 baseline is a quasi-steady simulation of which the inputs have defaults including the properties, schedules, standard weather data, several rated values including the capacity and efficiency of the air conditioner and radiator, and LPD. Also, the geometry of the nominal ECO-CE3 baseline is built by reading legacy 2D drawings, and also by estimation and observation.
While customizing the DOE2 model is allowed, it is not possible for the ECO-CE3 model. For example, electricity consumption by auxiliary heaters is added to the heating energy of the calibrated DOE2 baseline, assuming the auxiliary heaters are turned on when the room temperature drops below 20 °C. However, since the ECO-CE3 model does not output the hourly room temperature, it is not feasible to adjust the heating energy according to the room temperature.
Table 6 lists the first and second ECM selected according to its category for each baseline; the second ECM is listed particularly for the decision maker’s reference when the Energy Use Intensity (EUI) is reduced to almost the same as that of the first ECM. The percentage in parentheses indicates the ratio of the resulting EUI compared to the baseline EUI.
Both baselines select {Cool roof with EPS, EHP with ERV, LED, PV}. However, the final ECMs and their EUIs by the ECO-CE3 model differ from those by the DOE2 model as follows:
- The EUIs obtained by the nominal ECO-CE3 models are considerably larger than those obtained by the calibrated DOE2 models; although the actual building uses considerably less heating energy, causing a severe cold draft, the ECO-CE3 model assumes that a sufficient heating energy is supplied to meet the set point temperature, which is not editable.
- For each ECM, the energy savings assessed by the ECO-CE3 models are considerably greater than those assessed by the calibrated DOE2 models (except for LED and PV); practitioners acknowledge that energy savings by passive measures tend to be slightly exaggerated.
- While EPS (the least expensive interior insulation) is sufficient for the calibrated DOE2 model, PUR (the most expensive interior insulation) is recommended for the nominal ECO-CE3 model. This is because the U-value of PUR is slightly lower than that of the EPS.
- The calibrated DOE2 model does not recommend glazing changes because high performance glazing reduces the internal heat gains, which in turn increases the heating loads. The nominal ECO-CE3 model, however, recommends replacing the glazing with low e triple glazing.
- While the saving gap between EHP and GSHP obtained by the calibrated DOE2 baseline is more than 3%, it is only within 1% obtained by the nominal ECO-CE3 baseline, which means that GSHP and EHP do not make a significant difference in terms of operation cost.
The energy savings obtained by single ECMs are illustrated in Figure 6 and Figure 7; the Selected refers that a set of ECMs with the greatest energy saving for each category are applied together. When various ECMs are applied together, the synergy savings should be greater than the arithmetic sum of the individual savings. For example, changing the glazing is not recommended in the calibrated DOE baseline due to the minimal potential to save energy. However, when double glazing is installed together with EPS insulation to exterior walls, it can result in 60% of the baseline EUI in DOE2 simulations, which means more saving than an arithmetic sum of savings by EPS and double glazing. In the ECO-CE3 model, however, the result shows that the synergy between double glazing and EPS does not make a noticeable difference in the arithmetic sum.
Quasi-steady state simulations with nominal values are frequently used as a decision-making tool for assessing the priority of ECMs and for calculating funding subsidies in the domestic retrofit market. However, compared to the dynamic simulations, it is likely that these decisions may not reflect the reality, since they are based on the nominal assumptions, and the synergy and/or dysynergy among ECMs is unclear.
4.6. Design Development of ECMs: 2D Based Quantity Take-off vs. BIM Quantity Take-off
The ECMs that are evaluated as providing the greatest saving in both the first cost and energy cost include {EPS on air-tight exterior walls, roof, and SOG, Double glazing, EHP + ERV, LED}. The cool roof with the EPS and PV are excluded because they may damage the originality of building exterior. Although the calibrated DOE2 model does not recommend any glazing changes (Table 6), double glazing is re-analyzed as providing the greatest energy saving and first cost savings when it is applied together with envelope insulation.
To develop a detailed design of the chosen ECMs and to assess the construction costs, the most uncertain design variables of the chosen ECMs are selected, including (i) the quantity of EPS panels (the insulation labor cost is very dependent on the insulation area); and (ii) the equivalent pipe length for EHP (both the actual part load performance and the capacity of the EHP critically vary according to the pressure drops and the resulting heat loss of the refrigerant flowing through the pipe between the indoor and outdoor units; also, since the pipeline can only penetrate the floor through which the radiator pipes run, the applied estimation for calculating the pipe length might no longer be effective).
However, the quantity of EPS and the equivalent pipe length can be easily calculated with higher reliability, when their actual applications are designed using BIM. EPS is applied to the exterior walls, roof, and SOG of the baseline BIM that is built with the 3D scanned geometry acquired in Section 4.2.1. Also, the indoor and outdoor units of EHP are placed on the baseline BIM. The quantity of EPS, the longest lengths of pipes, bends, and fixtures are assessed, and are then compared to those calculated based on 2D drawings.
In current practice, the quantity of required insulation is simply obtained by adding together all the opaque envelope areas shown in the plans and elevations. This value is then divided by the standard area of a factory-produced single insulation panel to obtain the number of required panels. When it is calculated in this way, the number of required panels is significantly more than the actual number obtained by tailoring the net area by the factory panel area, as listed in Table 7. This is because the approximation tends to be oversized due to the approximation in manual quantity take-off.
Also, in current practice, the equivalent pipe length is calculated by summing up the expected pressure drops between an indoor unit and the farthest outdoor unit on the plans. Typically, the vertical span of the pipe is “guestimated” with ceiling and floor heights and the expected bends are imagined. The safety factor is then applied to the pipe in the case of a contingency. Even in the case of ambiguous bends and fixtures, a generic safety factor such as 1.5 is multiplied with the calculated pressure drop acquired by the straight pipes. Thus, when the approximated pipe length is compared to the actual design pipe length as listed in Table 8, regardless of the safety factor, it can be less than the actual length, as in the south zone.
5. Discussion
5.1. Geometry Acquisition and 3D Modeling
Although designers find 3D scanning a promising technology, its use remains too difficult for the purpose of architectural design. The major reasons for this include unstable registration (as described in Section 4.2.1) and a lack of automated modeling that converts scanned point clouds into semantically tangible information/data structure, which should be provided by BIM platforms. In this paper, it is believed that neither the fully automated detection of architecture objects nor creating elements from a myriad of XYZ coordinates is a solution, because incorrect assignments (e.g., a beam is regarded as a girder) always require manual corrections by the user. Indeed, for a scan-to-BIM function, designers want to identify the geometry of a single object, rather than determine whether it is a beam or a girder; because almost all building elements and structural members of an aged building have undergone deformations such as distortion, cracks, and differential settlement, it may not be possible to identify the correct component with its predefined dimension in the library tool. Since the purpose of a restoration project is to replace, repair, and reinforce the components and/or to replace them with new members, separating the well-formed geometry of an existing single object from the tangled point cloud with a reasonable boundary and/or mesh would be the most demanding step of the scan-to-BIM functions. After all single objects have been detached, the designers are more easily able to identify the types and properties of the detached objects.
Acquiring the accurate geometry of the building is very important to select feasible ECMs, because a large structural mass has a considerable impact on the building’s thermal capacity. However, provided a reasonably accurate mass can be captured, not all the geometric details of BIM need to be transformed to a building energy model. Unfortunately, BIM-to-BEM performed by commercial BIM authoring tools does not seem to support an efficient abstraction of the given geometry. For example, structural members such as columns and beams do not necessarily need to be modeled for energy analysis, provided they can be replaced with opaque walls; even staircases can be replaced by voids for energy analysis.
5.2. Acquisition of Building Energy Data and Model Calibration
Building energy data is acquired to diagnose and assess the current state of the existing building, and to establish the baseline from which to begin the comparison of ECMs. Therefore, the uncalibrated simulation may not represent the actual state of the existing building as realistically as needed for retrofit decision making. Eventually, an accurate model calibration with sufficiently detailed energy data is the most important prerequisite for a successful M&V. Obviously, calibration performance depends on the quality of collectable energy data of an existing building. Unfortunately, in reality, collecting quality energy data may not be feasible for many aged buildings. Instead of investing in the initial data measurement, stochastic model calibration has been known to be the most reasonable method among researchers, for a situation in which only rough energy data can be collectable. Practitioners, however, prefer a deterministic calibration with nominal values or even with the worst scenario values than stochastic calibration, although their choice may be considered to be less scientific than stochastic calibration. This is because stochastic calibration is difficult to understand for practitioners, and is cumbersome to use, even if they agree with the underlying concept and theory.
It is generally recommended that system variables are calibrated first, unless modelers are sure of the building property values. This is because, while building loads are theoretical values calculated from the heat balance between outdoor and conditioned indoor spaces, system variables directly influencing energy use (e.g., plant COP and plug loads) are relatively easier starting points for calibration. In many audits, it is possible to identify the capacity and efficiency variables from the label and nameplate of the system, although they have actually become deteriorated and degraded. This means that calibrating system variables can be initiated with reasonable ground values, compared to building property values that can only be generally estimated within the reported ranges or a priori.
For historic buildings in which heavy structural mass is common, while the thermal lag has been a load shifting measure, the accurate capture of heating and cooling loads is more crucial for identifying the building elements that need to be improved or replaced. Also, passive measures commonly including natural ventilation have been major climate controllers for a long time, while auxiliary heating devices and package air conditioners have recently been installed, instead of large central air handlers.
Therefore, in most historic building audits, only some of the dynamic simulation parameters (mostly building parameters) can be obtainable. On the other hand, complex system operation such as controls and set points are unavailable parameters in general. Additionally, not all model parameters can be measured or observed depending on the situation of an aged building. This study therefore suggests the following alternative for ensuring a reasonable calibration performance according to both energy sensitivity and collectability.
Types of data source for model parameters can be categorized into Type I (observed/measured), Type II (nominal), Type III-1 (worst case value), and Type III-2 (simulation defaults). Parameter types are defined by the following rationales;
- Type I (observed/measured): the parameters should be measured or observed, because they are the most energy sensitive as well as relatively easier to be collected.
- Type II (nominal): the parameters of which the nominal values can be used, instead of actual values; because they are less energy sensitive than Type I, and measuring their actual values is relatively expensive and time consuming. Although deterioration and/or performance degrade is anticipated, provided they are visible in the model and estimable, the modeler can identify and adjust their value if necessary.
- Type III-1 (worst case value): while the parameters require some investment to measure the actual values, the measurement results can still be event-dependent, depending on the measurement location and duration. Thus, the measurement may still have a low confidence. Also, they tend to worsen rapidly and act conversely to energy performance as the building ages. Therefore, it is often safer for calibration purposes to use the worst-case value; this is a risk adverse approach.
- Type III-2 (simulation default): the parameters require a very large investment in terms of cost, time, and knowledge to measure the actual values because the values are spread out over the building and behave according to complex mechanisms and algorithms, and/or have been adjusted over a long period of time. Thus, it may not be possible to determine how their actual values are set up. Therefore, it is often safer for calibration purposes to use simulation defaults, rather than using a poorly grounded value; this is a risk adverse approach.
Table 9 lists the energy sensitive simulation parameters that are frequently referred to in the literature and typically adjusted in practical calibrations. Each parameter is assigned one of the above parameter Types, which is the main parameter Type, meanwhile measurement is still the most preferred calibration measurement. Some parameters can be assigned two parameter Types, in which case the lower parameter Type can be acceptable for each situation, although higher Types (i.e., toward the measured) are preferred.
This alternative has been tested to the pilot building; a DOE2 baseline is reconstructed with 3D scanned geometry, observed weather, rated capacity and efficiency of air conditioner and radiator, observed LPD, and observed number of occupants and occupant profiles, which are collected over seven days; the rest of parameters are given nominal or worst-case values according to Table 9. When the ECMs listed in Table 4 and Table 5 are evaluated, the first and second ECMs selected for their category for each baseline are listed in Table 6. The resulting EUIs of each ECM applied to the reconstructed DOE2 baseline are shown in Figure 8.
Although the heating energy use value of the reconstructed DOE2 baseline is still slightly larger than that of the actual baseline, the resulting EUIs appear to be more reasonable than those obtained by the nominal ECO-CE3 models. In particular, the finally selected ECMs based on the reconstructed DOE2 baseline do not significantly differ from those selected by the calibrated DOE2 baseline, which includes {Air-tight EPS on envelope, Cool roof with EPS, Double glazing, EHP + ERV, LED, PV}.
5.3. Evaluation and Selection of ECMs
Dynamic simulation vs. Quasi-steady state simulation. Although this comparison has been debated among a number of professionals working in domestic energy retrofit market, quasi-steady state simulation seems to have become a de facto standard energy analysis tool. In the above case study (Section 4.5), however, the dynamic simulation is more effective in representing the actual state of an existing building, predicting the impact of passive ECMs, and assessing the synergy and dysynergy between ECMs, which is very demanding when selecting passive ECMs in the energy retrofit of an historic building. Additionally, data exchange between the BIM authoring tool and quasi-steady state simulations is not allowed at this time.
In fact, many domestic retrofit practitioners have chosen the quasi-steady state simulation [20] because subsidizing funding bodies select it, and also its sibling simulation [19] has been used for energy performance ratings of new buildings. It is argued here that providing the domestic market chooses quasi-steady state simulation not as a result of the technical deficiencies of dynamic simulation, the poor usability of dynamic simulation can be overcome by simplifying the user interface, by supplementing the defaults with a library of the most frequently used domestic properties and systems, and eventually by formalizing the simulation expert’s knowledge and experience into a normalized simulation procedure. Indeed, dynamic simulation should evolve into an expert system.
Expert systems can solve a complex problem by providing the knowledge acquired from experts, and from the first order logic encoded, as in if-then rules; the problem of building energy modeling occurs due to the discrepancy in simulation modeling knowledge among simulation experts and engineering designers. In addition, practitioners are not familiar with simulation terms and language, while almost all building energy simulations require inputs, whereby the method of finding the value is only familiar to simulation experts; when practitioners enter an input, its impact on the result and/or interactions with other inputs is not obviously estimable.
The first step of the building energy simulation expert system involves building a knowledge base for the energy model; two different ontologies (experts’ ontology and designer’s ontology) should be compared, and the two-tier User Experience (UX) and User Interface (UI) should then be defined for each persona. In addition to the rules of the general energy modeling steps, rules regarding the design and placement of systems in rooms unfamiliar to the architectural designers should also be defined. These rules should be implemented through the inference engine.
5.4. Design Development of ECMs Using BIM
The design development of ECMs using BIM is a very promising and under-defined area of energy retrofitting of historic buildings. Compared to the schematic design phase in which candidate ECMs are determined, the design development provides a basis from which to describe construction budgets, construction documents, technical specification, and any other implementation notes. While in current practice, most design analysis and detailing works are carried out per manual flows and customs, the use of BIM has demonstrated that the ability to provide more accurate and realistic results, with a design using the least amount of trial-and-error, as tested in Section 4.6.
The main requirement to accelerate the use of BIM in design development is to acquire the geometry of the existing structure with a sufficient degree of accuracy. Advances in 3D geometry acquisition technologies have reduced the technical threshold and investment cost for designers who are not technology-oriented to obtain a background geometry. However, converting a set of point clouds into an analytically meaningful model and then determining the next step still need to be performed by engineers and domain experts, and the quality of the resulting document varies considerably depending on their knowledge level.
Indeed, modeling and design analysis costs can easily overwhelm geometry acquisition costs. For example, while it is generally known that material quantity take-off and clash detection using BIM apparently reduce the construction cost, it is recommended that trained engineers construct a BIM of the existing structure, to which they need to apply ECMs, and run prior analyses in supporting BIM platforms in order to meet the required accuracy and details for drawing construction documents. Thus, consulting or hiring experts can cost significantly more than the reduced construction cost. Unfortunately, in the domestic situation, independent BIM professionals are hired only for the last stage of the design development if the client requests the use of BIM for documentation.
Undoubtedly, since BIM authoring tools originate from design assistance tools, they will still evolve toward a more designer-friendly configuration. Additionally, it is suggested here that the active introduction of BIM is needed in the existing education curriculum for engineering designers, and the introduction of additional BIM relevant classes would help the situation in the long term. Thus far, domestic Mechanical Electrical Plumbing (MEP) designers who need to be involved in energy retrofit projects have been trained to use 2D drawings and conventional manual calculation. They appear to be unwilling to adopt this new technology, perhaps because they are not familiar with it, or they have not been offered adequate reward or motivation. However, it is apparent that they need to progress and use this new technology, similar to the way in which engineers only twenty years ago eventually needed to adopt CAD tools instead of hand drawing.
6. Summary and Conclusions
Most domestic modern buildings are constructed as a heavy mass, and have for many years relied on passive measures for climate control. Since effective passive measures eventually reduce the heating and cooling loads, thus also reducing the system size, passive and hybrid measures are the most preferred ECMs.
In addition, the domestic situation and climate are additional constraints in energy retrofit decision making, such as a shorter budget and time, poor maintenance history, and uncertainties in vernacular lifestyle. For this reason, the performance improvement and/or side-effects prior to installing ECMs should be predictable. This complexity confirms that simulation-based M&V would better suit the energy retrofit of historic buildings than data-driven M&V.
However, many domestic investors still believe re-construction has a greater economic value than restoration or remodeling. Therefore, even with a feasibility analysis, they are unwilling to invest in more time than a preset period. Although simulation-based M&V is favored for retrofit decision making, its process including collecting data, modeling and analysis, evaluating and designing ECMs, and verification could still be too demanding to domestic practitioners.
While some manual, repetitive, error-prone works exist in the conventional retrofit process and simulation-based M&V, it is proposed here that enhanced BIT is able to simplify, automate, and objectify, at least the critical steps of the retrofit project.
The aim of this study is to find an efficient and effective energy retrofit strategy for domestic historic buildings that appeals to domestic investors and practitioners by testing selective BIT tools on an actual aged building. This study concludes with the suggestion that in the domestic context, the current practice for each process of the energy retrofit of historic buildings needs to shift to take a full advantage of BIT. The core findings and discussions are as follows:
- For 3D geometry acquisition, 3D scanning provides more useful and significant geometry data, including for interior spaces, than photogrammetry or 3D GIS. However, converting and identifying the scanned point cloud to a building element still results in some errors and mismatches, and thus requires manual corrections. It is anticipated that application vendors will invest more on developing point cloud optimization algorithms and/or a reverse-engineering process based on editing the mesh.
- BIM-to-BEM model transformation minimizes the effort involved with manual energy modeling and assigning default values. Providing a reasonably accurate structural mass can be captured, it is not necessary for all geometric details to be transformed to the energy model. Unfortunately, BIM-to-BEM by commercial BIM authoring tools does not seem to support an efficient abstraction of the geometry, which eventually causes simplification of the model by the user.
- Although site-specific observed weather are the best weather data for calibration, weather data by ISP can be a reasonable alternative when observed weather is not available or a complete set of weather variables is not available.
- For calibrating the simulation model, mathematical optimizations can be performed for parameter identification. It could be resulted that while the worst-case values were chosen for COP, plat and system efficiency, LPD, and EPD, the other values have been varied per trial. This observation implies that selecting the easiest parameters that are mostly sensitive to the energy use is the most plausible method for optimizing energy reduction, regardless of whether or not the values are closer to the actual.
- Indeed, many of the optimized values clearly differ from the measured values. Also, optimizations are still significantly less affordable for practitioners, since practitioners rely on heuristics for calibrating models. This study suggests a practical alternative of calibration where parameters are classified according to energy sensitivity and collectability, which can provide a reasonable calibration performance for an aged modern building, when not all model parameters can be measured or observed for a sufficiently long period.
- Although quasi-steady state simulation is easier to use and already established with a domestic-wide user library, dynamic simulation is more effective in representing the actual state of a historic building with a heavy mass, predicting the impact of passive ECMs, and assessing a synergy and dysynergy between passive and active ECMs. Dynamic simulation therefore provides more rational design making baselines for historic buildings.
- Some practitioners agree that dynamic simulation would better suit energy retrofit of historic buildings. However, their only option is quasi-steady state simulation, because dynamic simulations are considerably harder to create a model and require extensive efforts to enter parameter values within their given project term. This study suggests that to attract more users, dynamic simulation should adopt an expert system platform as a proxy interface.
- While most design analysis and detailing works in design development of historic building restoration projects are still carried out according to each current manual flow and the customs based on 2D drawings, BIM has demonstrated its superior ability to generate more accurate and realistic results, with less need for trial-and-error.
- Despite its merits and benefits, many domestic MEP engineers still hesitate to use BIM for design development for a number of reasons. Since BIM authoring tools were intended to be design assistance tools, with the provision of more education and practical opportunities, MEP engineers would begin to design with BIM.
Acknowledgments
This research was supported by Basic Science Research Program through the National Research Foundation of Korea (NRF) funded by the Ministry of Science, ICT and Future Planning (NRF-2015R1C1A2A01053559).
Conflicts of Interest
The author declares no conflict of interest.
References
- FEMP. M&V Guidelines: Measurement and Verification for Performance-Based Contracts Version 4.0; EERE Publication and Product Library: Washington, DC, USA, 2015. [Google Scholar]
- ASHRAE. ASHRAE Guideline 34P. Energy Guideline for Historical Buildings (Second Public Review Draft); ASHRAE: Atlanta, GA, USA, 2016. [Google Scholar]
- May, N.; Rye, C. Responsible Retrofit of Traditional Buildings: A Report on Existing Research and Guidance with Recommendations; Sustainable Traditional Buildings Alliance (STBA): London, UK, 2012. [Google Scholar]
- Park, S.C. 24 Heating, Ventilating, and Cooling Historic Buildings—Problems and Recommended Approaches. 1991. Available online: https://www.nps.gov/tps/how-to-preserve/briefs/24-heat-vent-cool.htm (accessed on 24 April 2018).
- Alderson, C. HVAC Upgrades in Historic Buildings. 2009. Available online: https://www.gsa.gov/cdnstatic/HVAC.pdf (accessed on 24 April 2018).
- Evangelisti, L.; Guattari, C.; Gori, P. Energy Retrofit Strategies for Residential Building Envelopes: An Italian Case Study of an Early-50s Building. Sustainability 2015, 7, 8. [Google Scholar] [CrossRef]
- De Vita, M.; Mannella, A.; Sabino, A.; Marchetti, A. Seismic Retrofit Measures for Masonry Walls of Historical Buildings, from an Energy Saving Perspective. Sustainability 2018, 10, 984. [Google Scholar] [CrossRef]
- Basiricò, T.; Enea, D. Seismic and Energy Retrofit of the Historic Urban Fabric of Enna (Italy). Sustainability 2018, 10, 1138. [Google Scholar] [CrossRef]
- Kim, S.H. Selection of Energy Conservation Measures for Building Energy Retrofit. KIEAE J. 2016, 16, 5–12. [Google Scholar]
- Mark, D.S.; Kristen, P.; Paul, A.M. Ready to Retrofit: The Process of Project Team Selection, Building Benchmarking, and Financing Commercial Building Energy Retrofit Projects; LBNL: Berkeley, CA, USA, 2012. [Google Scholar]
- Day, M. Scan-to-BIM: A Reality Check. AEC Magazine. 2012. Available online: https://aecmag.com/technology-mainmenu-35/498-scan-to-bim-a-reality-check (accessed on 24 April 2018).
- O’Donnell, J.T.; Maile, T.; Rose, C.; Mrazović, N.; Morrissey, E.; Regnier, C.; Parrish, K.; Bazjanac, V. Transforming BIM to BEM: Generation of Building Geometry for the NASA Ames Sustainability Base BIM; LBNL: Berkeley, CA, USA, 2013. [Google Scholar]
- Kfouri, E. Climate Server: A Hidden Gem in GBS. 2013. Available online: http://blogs.autodesk.com/insight/climate-server-a-hidden-gem-in-gbs/ (accessed on 24 April 2018).
- Phoenix Integration. ModelCenter Integrate. 2018. Available online: https://www.phoenix-int.com/product/modelcenter-integrate/ (accessed on 24 April 2018).
- The U.S. Department of Energy’s (DOE) Building Technologies Office (BTO). EnergyPlus. 2018. Available online: https://energyplus.net/ (accessed on 24 April 2018).
- Hirsch, J.J. DOE-2: Building Energy Use and Cost Analysis Tool. 2017. Available online: http://doe2.com/DOE2/index.html (accessed on 24 April 2018).
- ISO. ISO 52016-1:2017. Energy Performance of Buildings—Energy Needs for Heating and Cooling, Internal Temperatures and Sensible and Latent Heat Loads—Part 1: Calculation Procedures. 2017. Available online: https://www.iso.org/standard/65696.html (accessed on 24 April 2018).
- DIN V 18599-1:2016-10. Energy Efficiency of Buildings—Calculation of the Net, Final and Primary Energy Demand for Heating, Cooling, Ventilation, Domestic Hot Water and Lighting. 2016. Available online: https://www.beuth.de/de/vornorm/din-v-18599-1/257938824 (accessed on 24 April 2018).
- Korea Energy Agency. ECO2: Evaluation Program for Building Energy Efficiency Certificate. 2017. Available online: http://building.energy.or.kr/build/CC/CCIRList.do?page=426 (accessed on 24 April 2018).
- Korea Energy Agency. ECO-CE3: Energy Audit Simulation for Existing Buildings. 2018. Available online: http://www.eco-ce3.kr/zone/index (accessed on 24 April 2018).
- DesignBuilder LTD. Simplification. 2017. Available online: https://www.designbuilder.co.uk/helpv5.0/Content/Lumping_and_merging.htm (accessed on 24 April 2018).
- COMNET. Thermal Blocks, HVAC Zones and Space Functions. Available online: http://www.comnet.org/22-thermal-blocks-hvac-zones-and-space-functions (accessed on 24 April 2018).
- IBPSA. Thermal Zoning Determination. Available online: http://bembook.ibpsa.us/index.php/Thermal_Zoning_Determination (accessed on 24 April 2018).
- Murphy, M.; Mcgovern, E.; Pavia, S. Historic Building Information Modelling—Adding intelligence to laser and image based surveys of European classical architecture. ISPRS J. Photogramm. Remote Sens. 2013, 76, 89–102. [Google Scholar] [CrossRef]
- Arayici, Y.; Counsell, J.; Mahdjoubi, L.; Nagy, G.A.; Hawas, S.; Dweidar, K. (Eds.) Heritage Building Information Modelling; Routledge: London, UK, 2017; ISBN 978-1-138-64568-4. [Google Scholar]
- Biagini, C.; Capone, P.; Donato, V.; Facchini, N. Towards the BIM implementation for historical building restoration sites. Autom. Constr. 2016, 71, 74–86. [Google Scholar] [CrossRef]
- Coakley, D.; Raftery, P.; Keane, M. A review of methods to match building energy simulation models to measured data. Renew. Sustain. Energy Rev. 2014, 37, 123–141. [Google Scholar] [CrossRef]
- Reddy, T.A.; Maor, I.; Panjapornpon, C. Calibrating Detailed Building Energy Simulation Programs with Measured Data—Part I: General Methodology (RP-1051). HVAC&R Res. 2007, 13, 221–241. [Google Scholar]
- Booth, A.T.; Choudhary, R.; Spiegelhalter, D.J. A hierarchical Bayesian framework for calibrating micro-level models with macro-level data. J. Build. Perform. Simul. 2012, 6, 293–318. [Google Scholar] [CrossRef]
- Korea Land and Housing Corporation Green Remodeling Center. Interest Subsidy Program for Green Remodeling. 2018. Available online: http://www.greenremodeling.or.kr/support/sup1000.asp (accessed on 24 April 2018).
- AUTODESK. Recap Photo. 2018. Available online: https://www.autodesk.com/products/recap/overview (accessed on 24 April 2018).
- AUTODESK. Recap Pro. 2018. Available online: https://www.autodesk.com/products/recap/overview (accessed on 24 April 2018).
- AUTODESK. Revit. 2018. Available online: https://www.autodesk.com/products/revit/overview (accessed on 24 April 2018).
- MOLIT. Vworld Map Service. 2018. Available online: http://map.vworld.kr/map/maps.do# (accessed on 24 April 2018).
- Hirsch, J.J. eQUEST. 2016. Available online: http://doe2.com/equest/index.html (accessed on 24 April 2018).
Figure 1.
Process of the simulation-based Measurement and Verification (M&V).

Figure 2.
Geometry acquisition and modeling of existing building using 3D scanning, photogrammetry, and 3D Geographic Information System (GIS).
Figure 2.
Geometry acquisition and modeling of existing building using 3D scanning, photogrammetry, and 3D Geographic Information System (GIS).

Figure 3.
Restored envelope of the test building: Photogrammetry images wrapping the 3D scanned geometry (left) and the mass provided by 3D GIS platform (right).
Figure 3.
Restored envelope of the test building: Photogrammetry images wrapping the 3D scanned geometry (left) and the mass provided by 3D GIS platform (right).

Figure 4.
Reconstructed geometry by manual modeling (left) and by automated BIM2BEM (right).

Figure 5.
Ambient temperature profiles by the observed weather, the Autodesk ISP, and the EnergyPlus Weather file (EPW) on the coldest (left) and hottest (right) days in 2014.
Figure 5.
Ambient temperature profiles by the observed weather, the Autodesk ISP, and the EnergyPlus Weather file (EPW) on the coldest (left) and hottest (right) days in 2014.

Figure 6.
EUIs of the ECMs applied to the calibrated DOE2 baseline.

Figure 7.
EUIs of the ECMs applied to the nominal ECO-CE3 baseline.

Figure 8.
EUIs of the ECMs applied to the DOE2 baseline that is reconstructed with the suggested alternative.
Figure 8.
EUIs of the ECMs applied to the DOE2 baseline that is reconstructed with the suggested alternative.


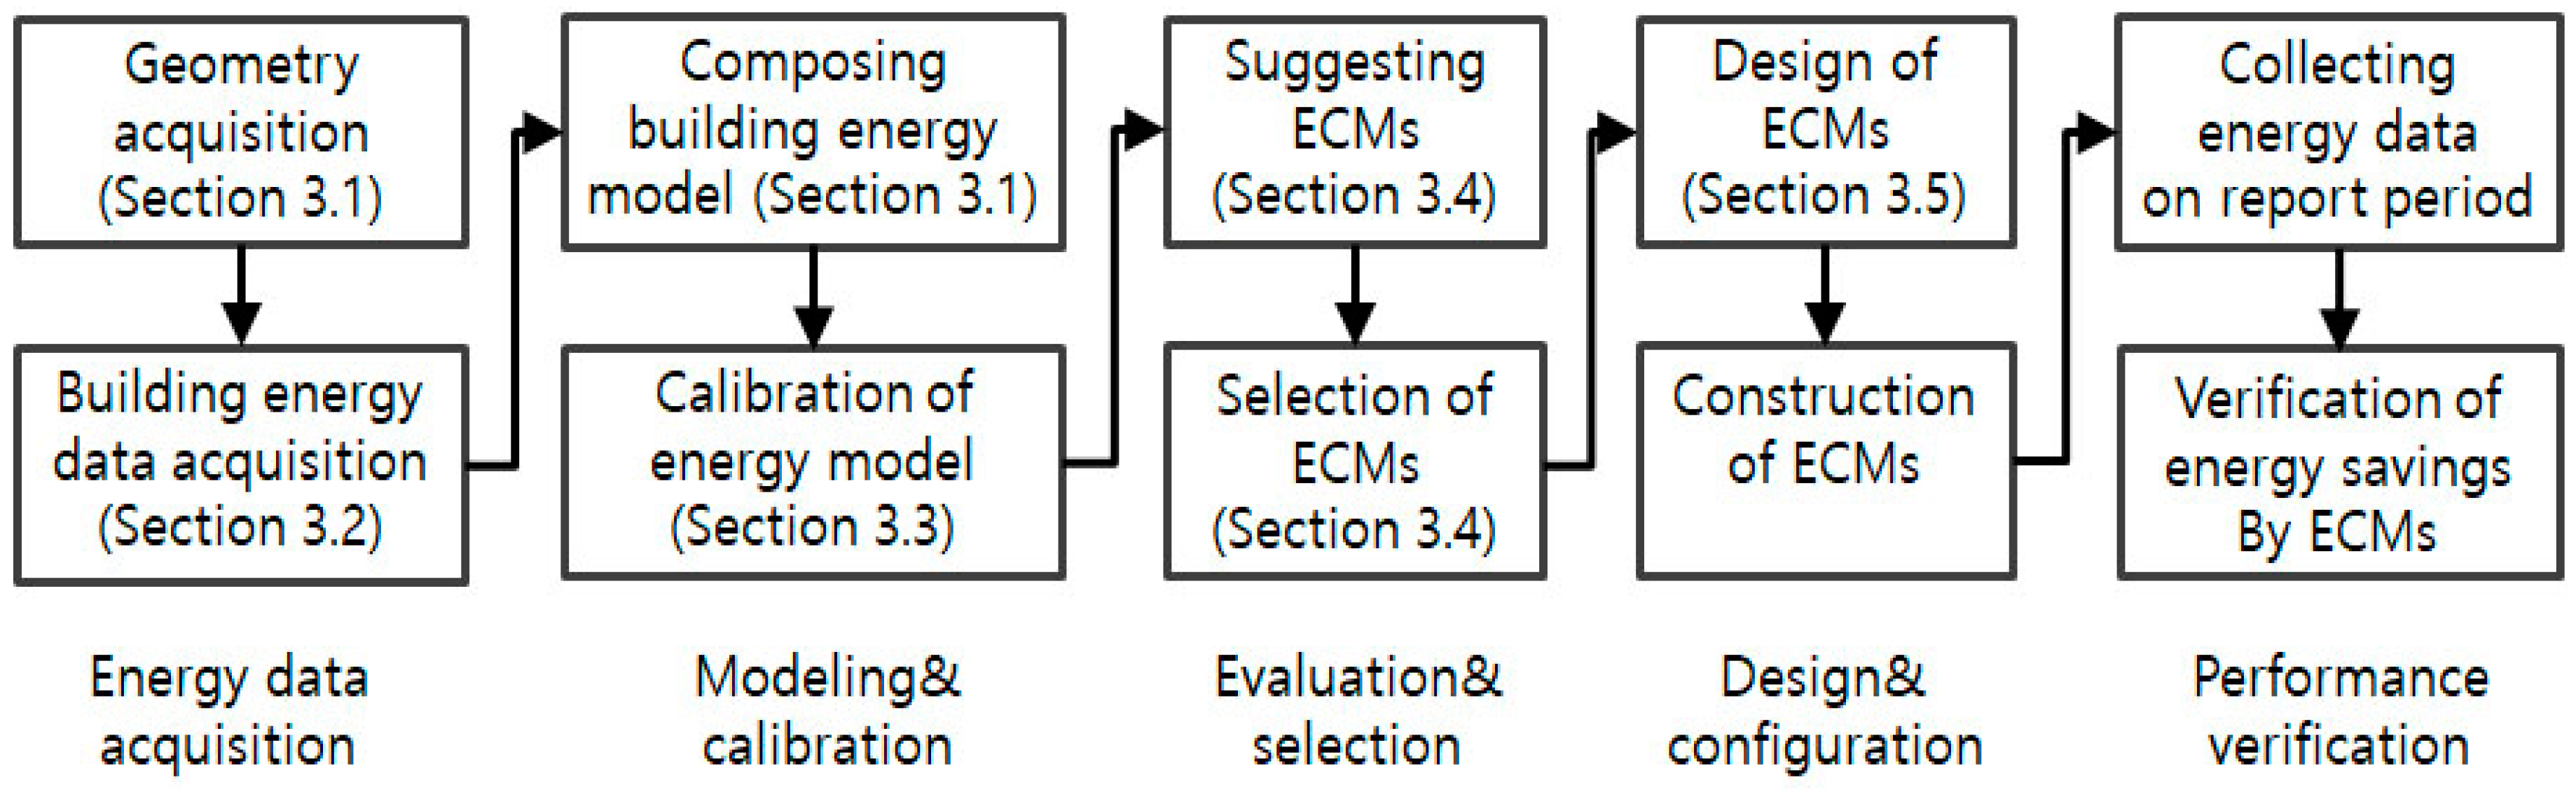
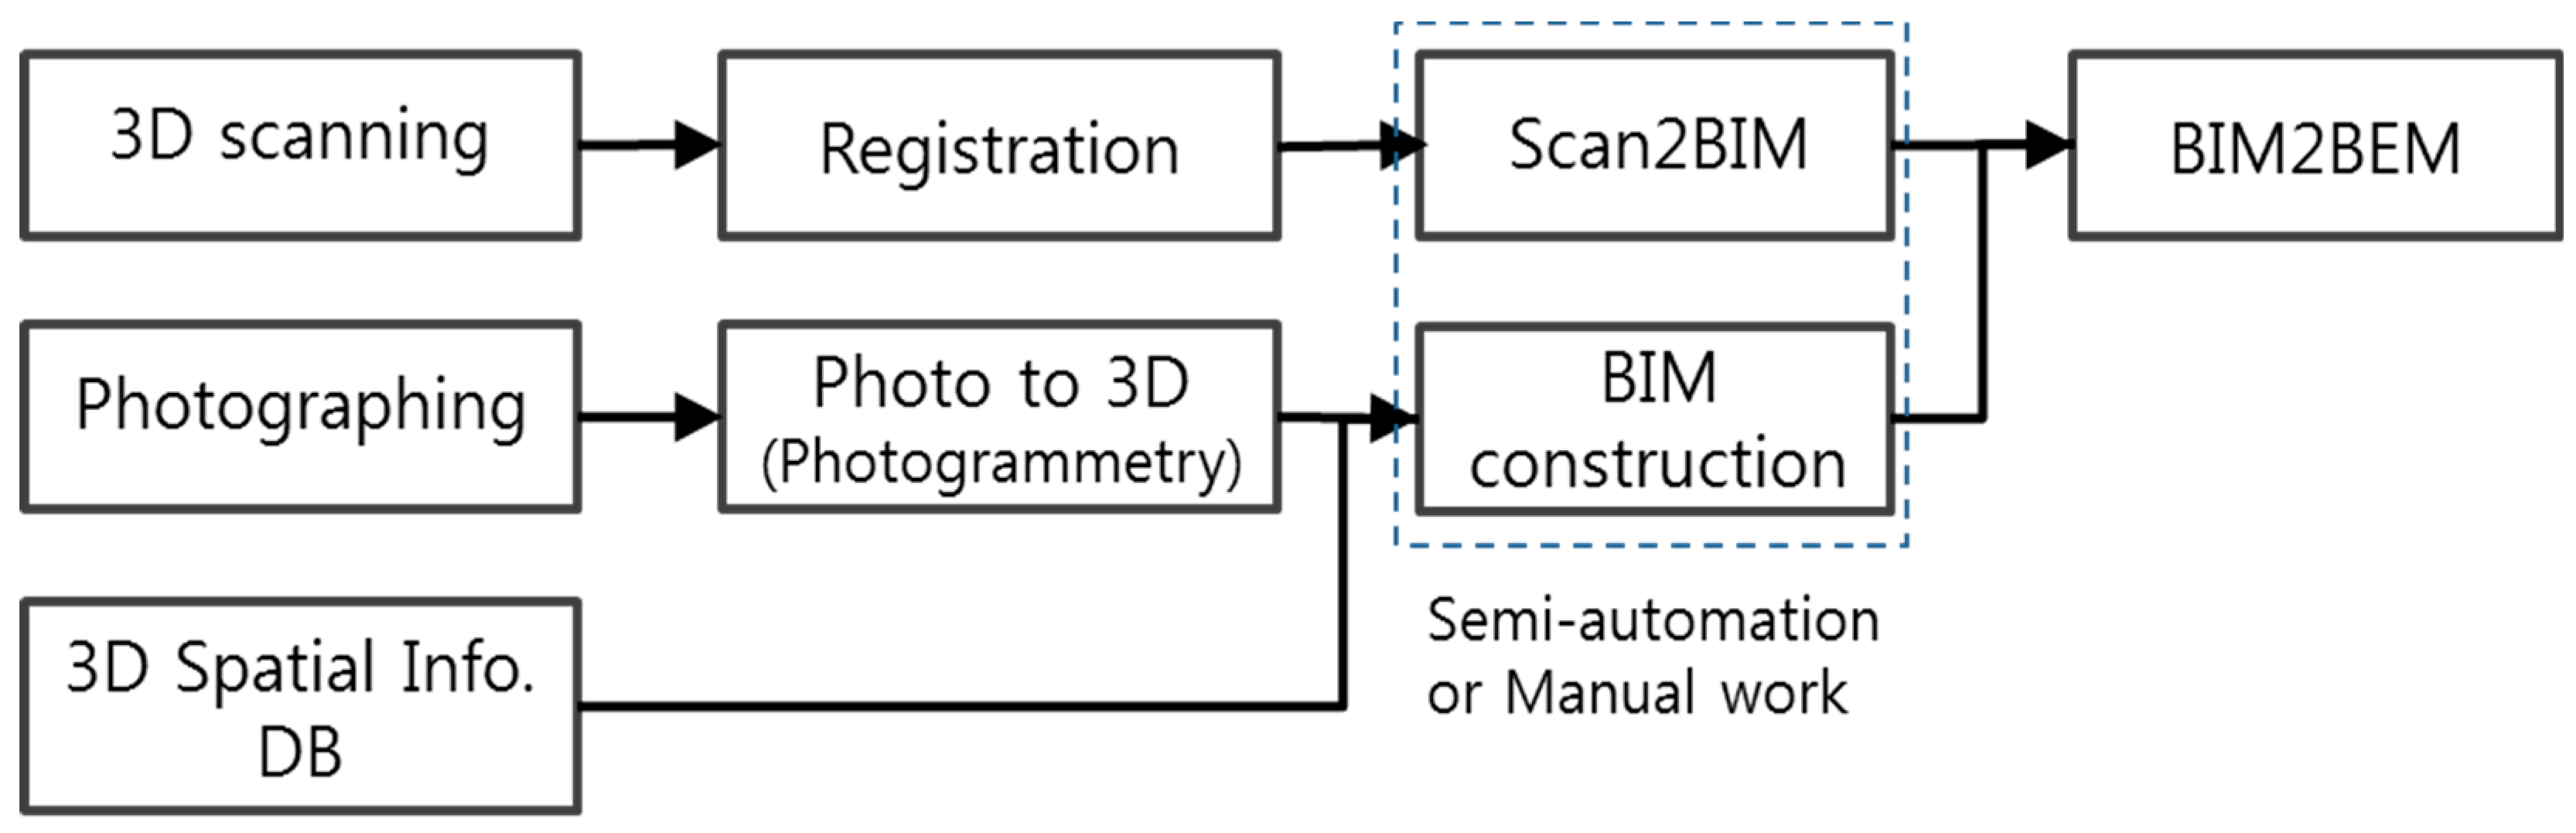
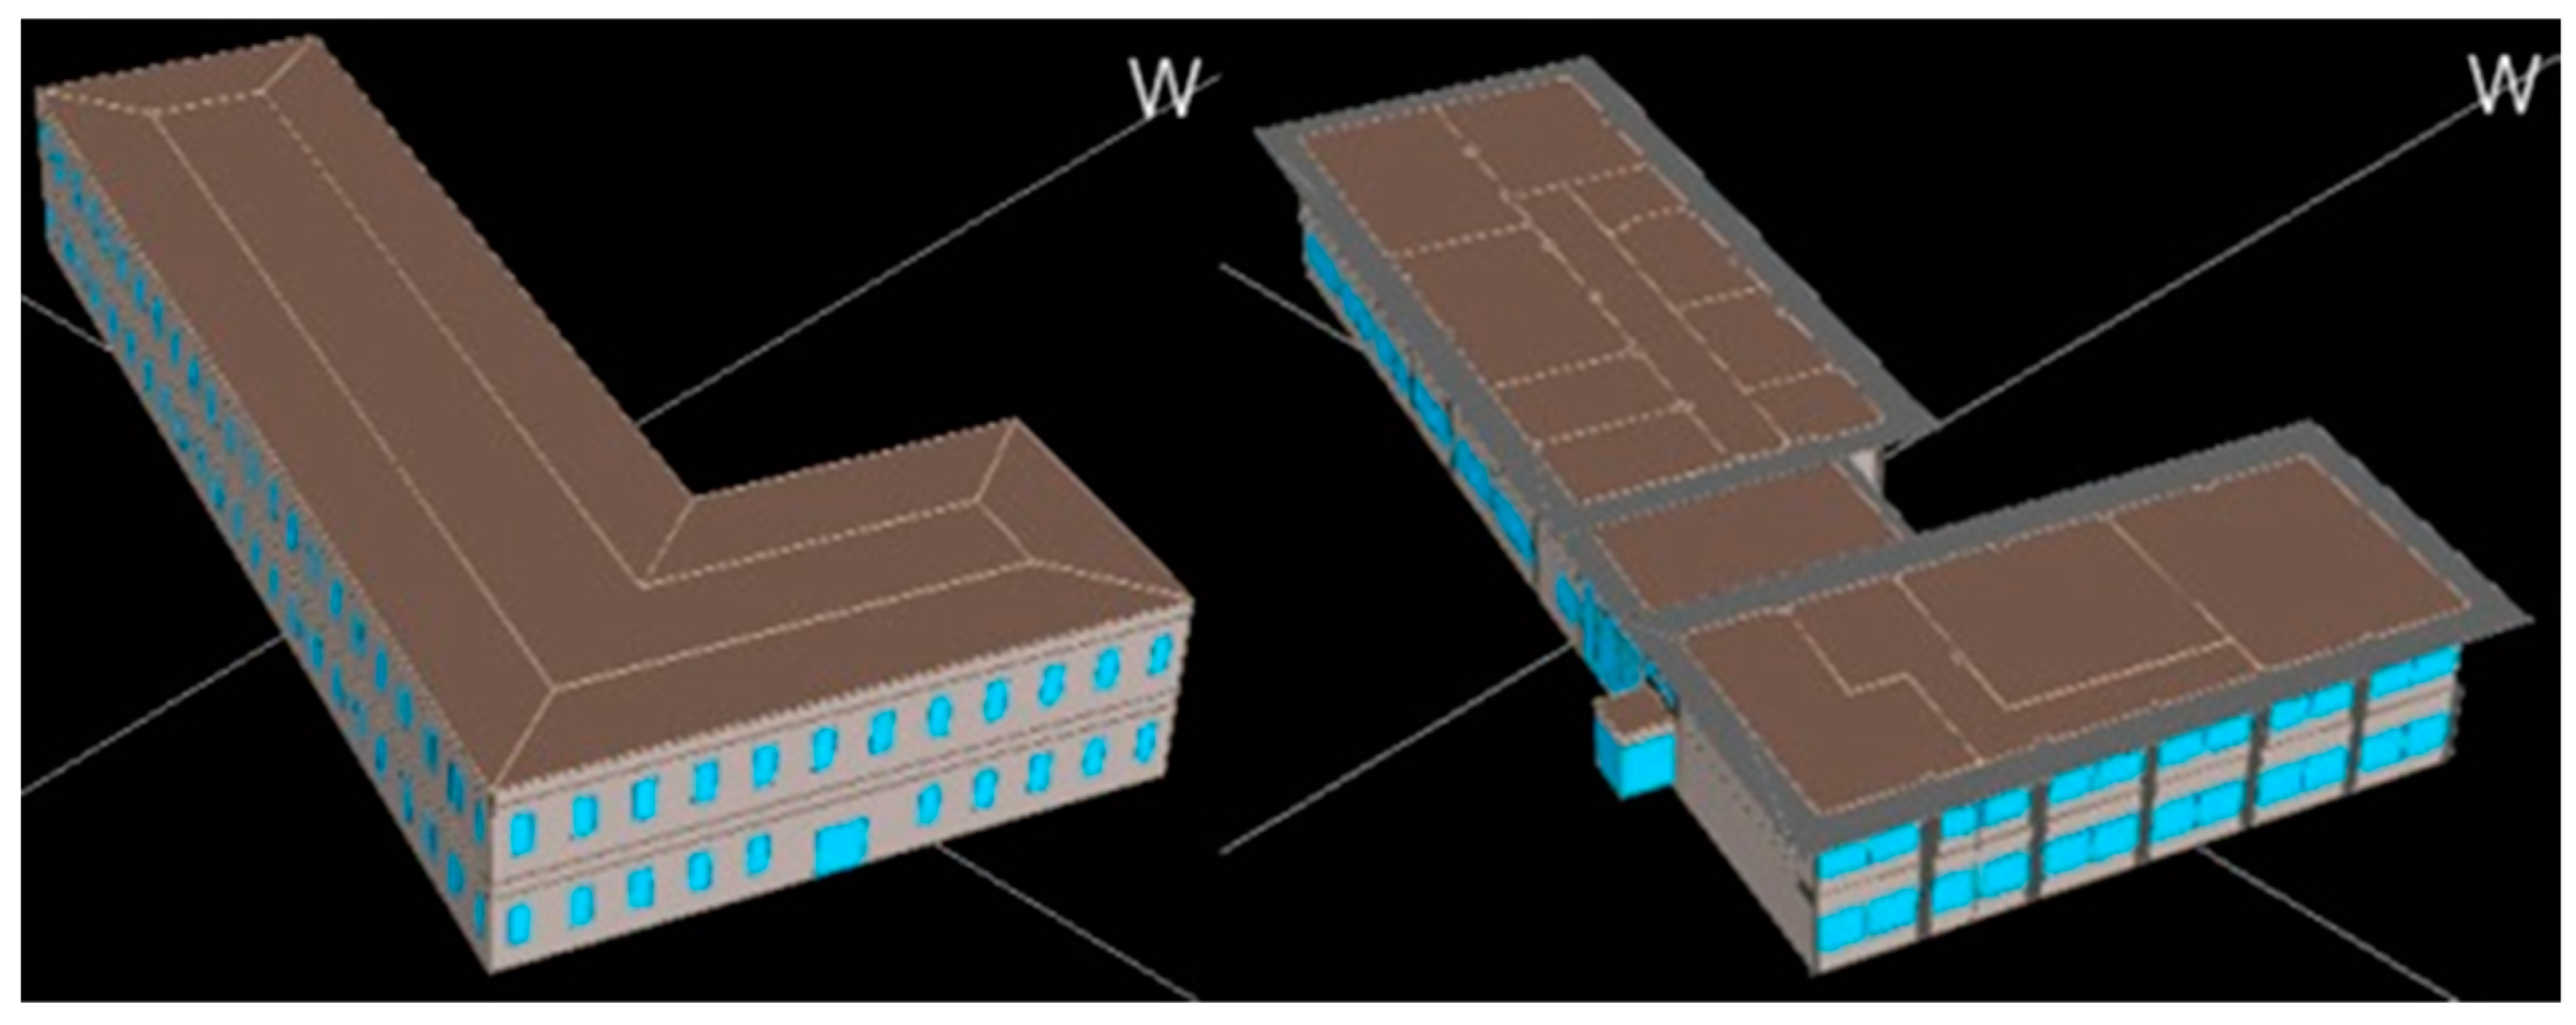
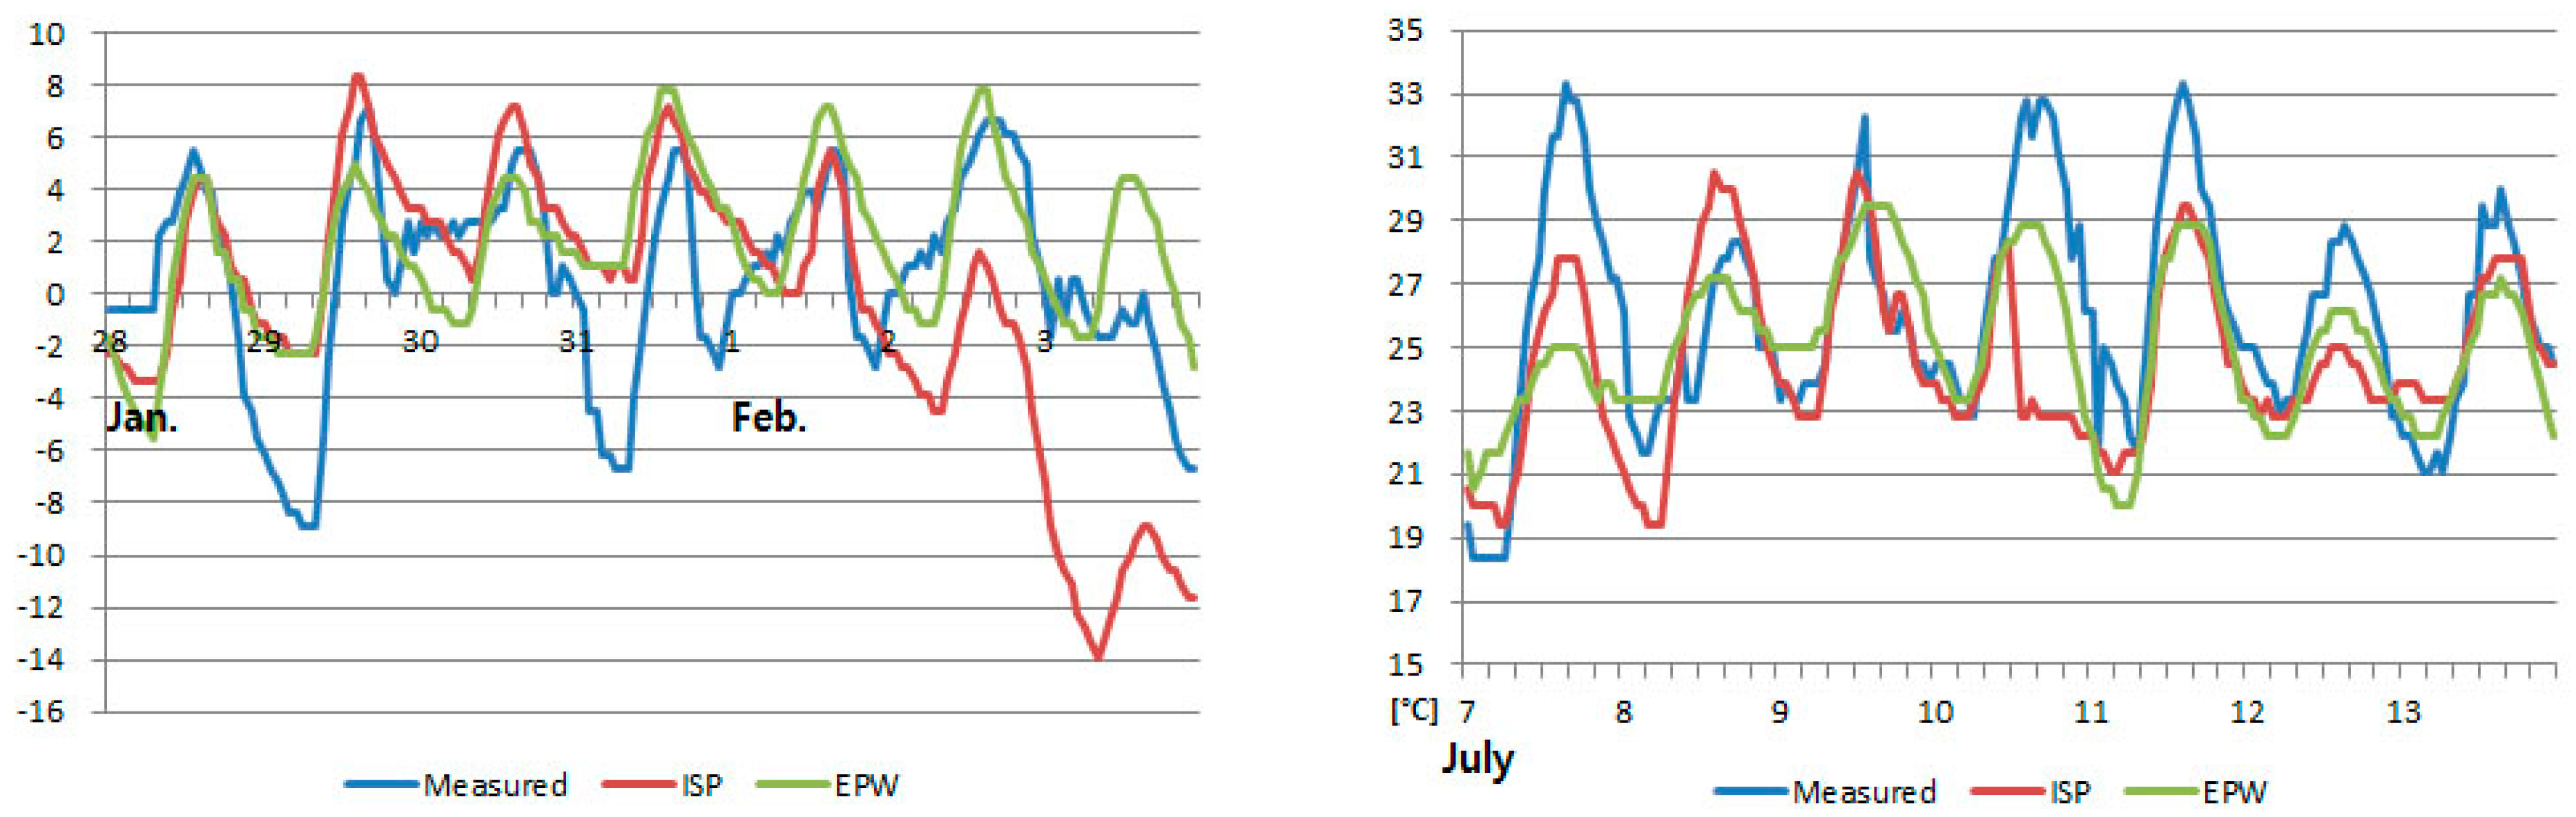
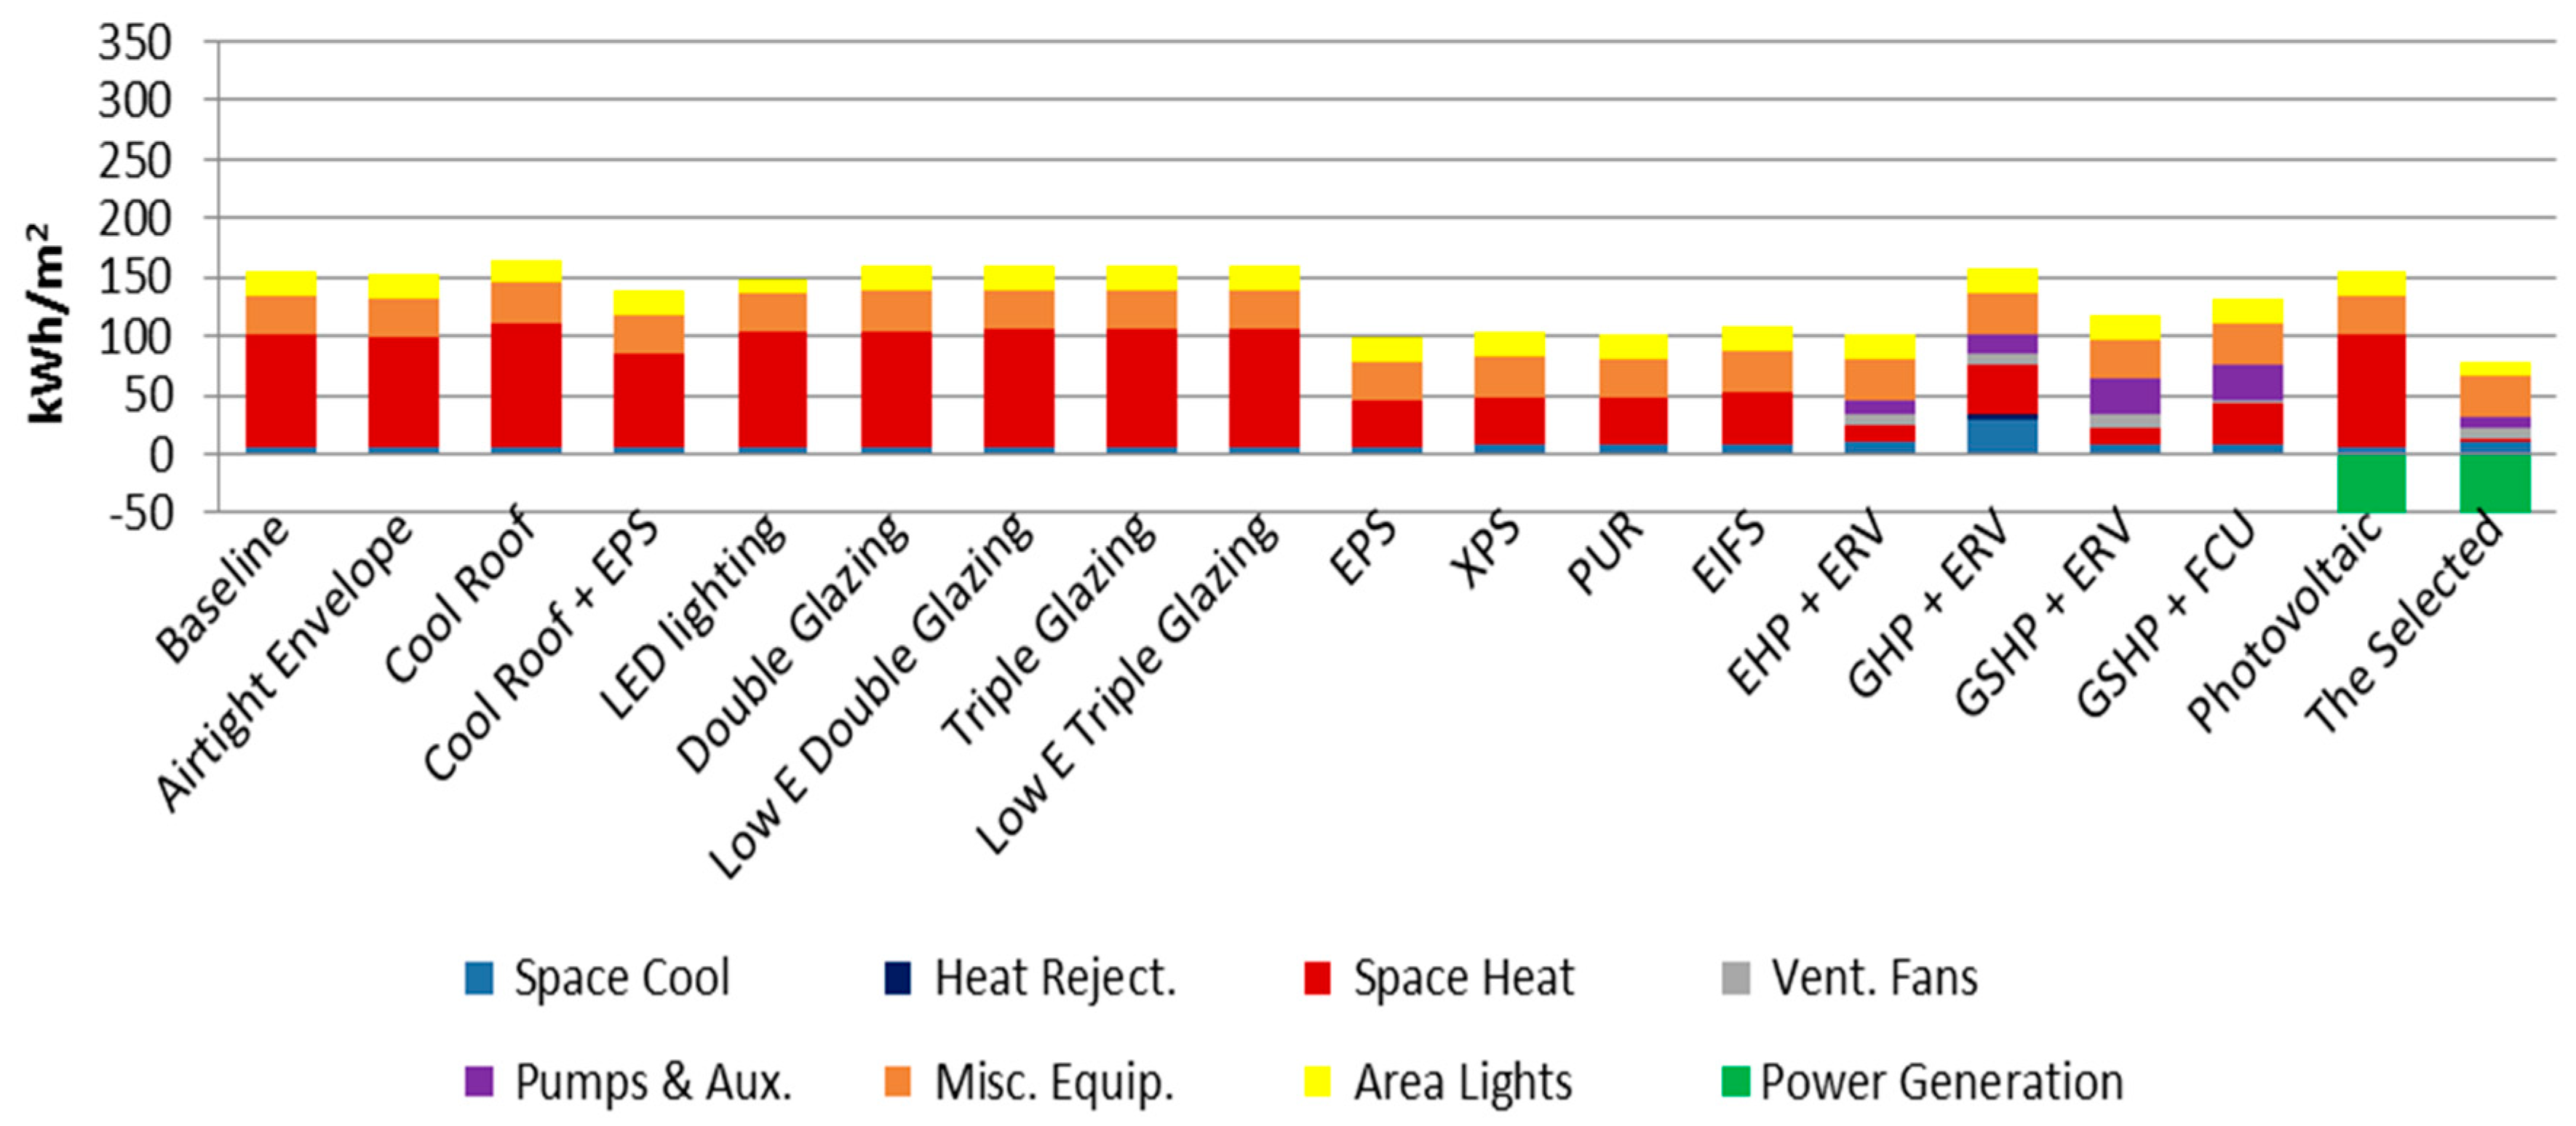
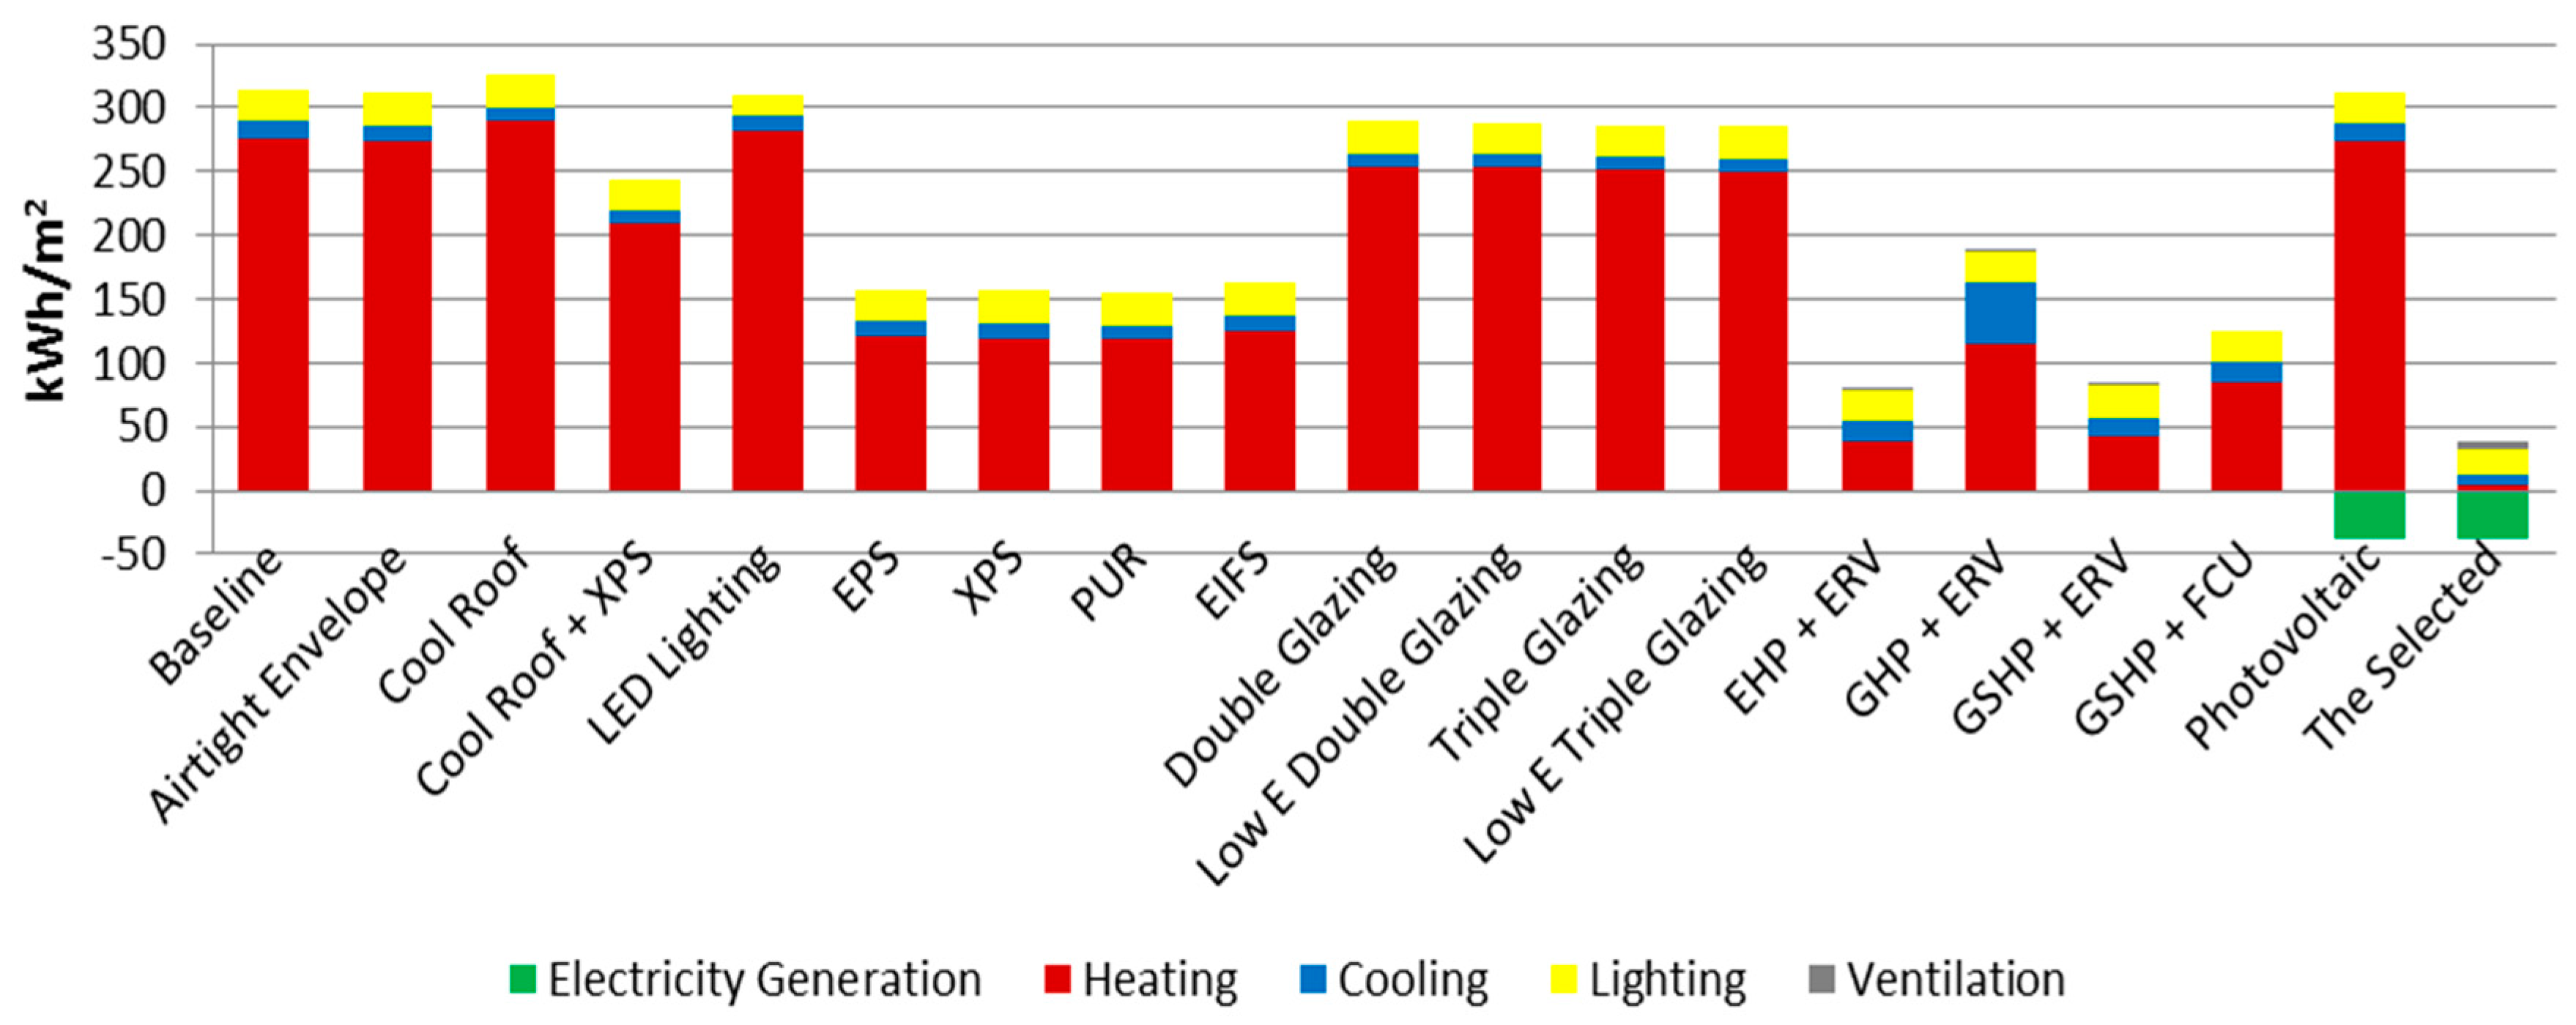
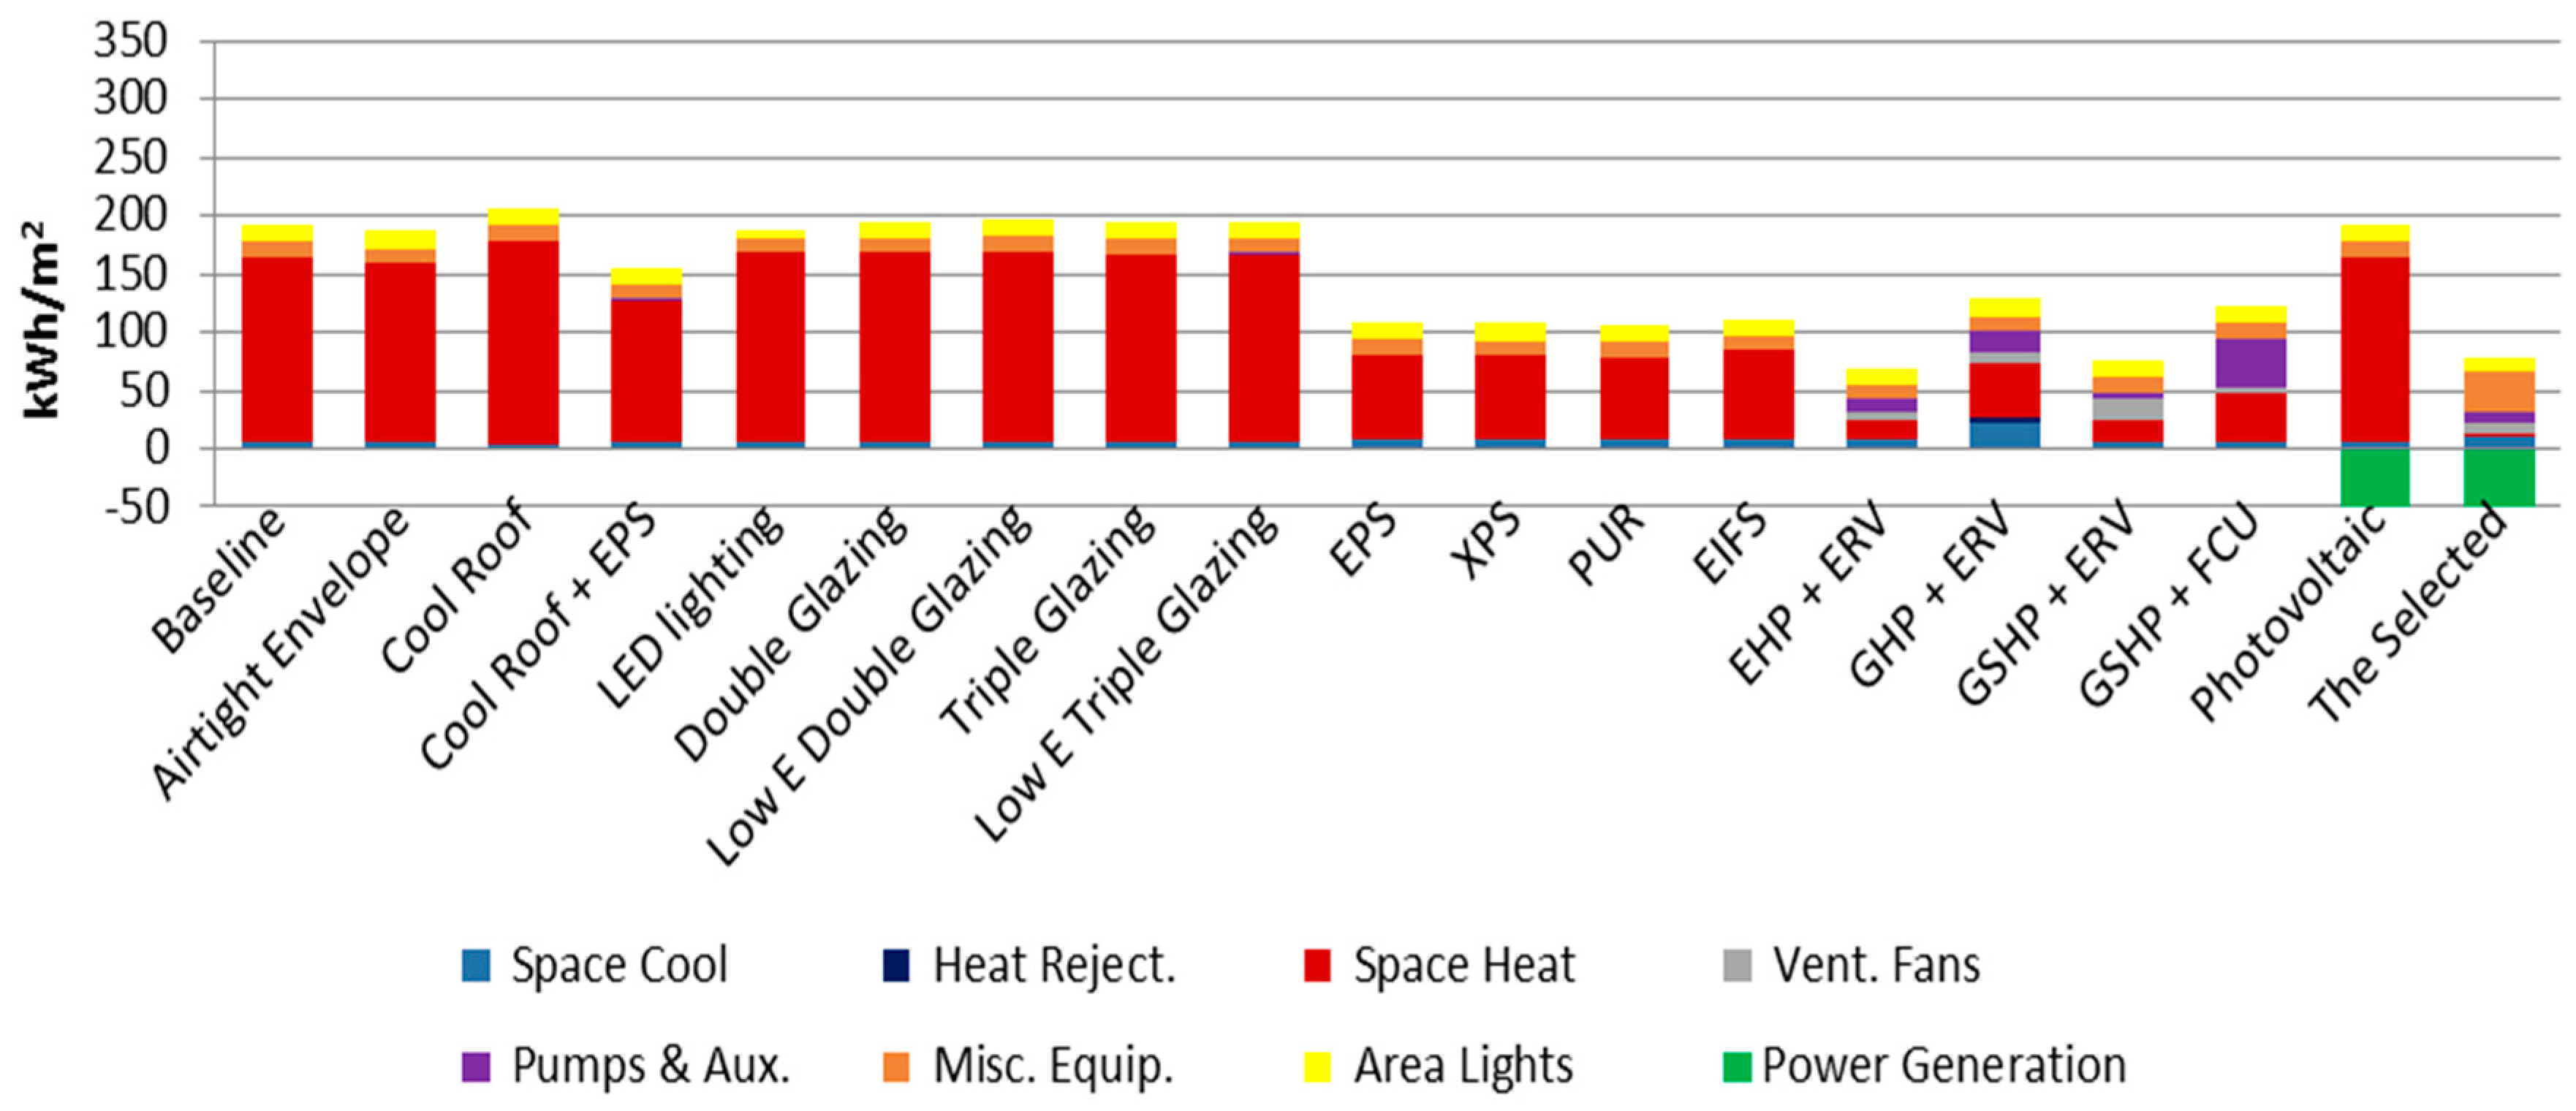
Table 1.
Building information technology that facilitates the simulation-based measurement and verification.
Table 1.
Building information technology that facilitates the simulation-based measurement and verification.
| M&V Tasks | Technology | Usage | Pros | Cons | Implementation |
|---|---|---|---|---|---|
| Geometry Acquisition | 3D scanning | Representing the object surface with Point Cloud data defined by X, Y, and Z coordinates | Accurate geometry capture with the precision of less than 1 cm; Suitable for capturing both exterior and interior surface. | Expensive; Extra modeling necessary that converts; Point Cloud to building element | 3D laser scanner, Registration software |
| Photo-to-3D (Photogrammetry) | Recovering the exact positions of the surface points in pictures based on the close-range photogrammetry | Effective capture of detailed surface geometry with an affordable expense | Not as accurate as 3D scanning; Depends on camera location, scale and shape ratio of photo images can be distorted; More suited for building exterior; Extra modeling necessary for the interior | Digital Single-Lens Reflex (DSLR) camera, Photogrammetry software | |
| 3D Geographic Information System (GIS) | 3D visualization of site, roads, buildings and structures | The cheapest method to build a 3D surface model of existing building | Not as accurate as 3D scanning; More suited for building exterior; Extra modeling necessary for the interior. | As in public platforms | |
| Geometry Modeling | Scan to BIM [11] | Semi-automated extraction of the predefined building elements from a point cloud data | Faster building information modeling of the predefined elements | Semi-automation is only available for the predefined elements; Manual modeling is still necessary in many cases. | Installed as a BIM plug-in or stand-alone tool |
| BIM to BEM [12] | Transformation of Building Information Model (BIM) to Building Energy Model (BEM) for energy analysis, provided by BIM authoring tools. | If BIM is already available, faster building energy modeling taking into account of de-facto and default values for building energy properties is feasible. | De-facto and default by BIM authoring tools may not be local values; Additional refinement is still necessary in many cases. | Built-in of the BIM authoring tool | |
| Acquisition of building energy information | Weather Information Service Provider (ISP) | Web service providing actual and processed weather data in a file format | Available for specific region and specific timeframe | Not available for all international regions; Not all weather variables are available. | Weather Application Programming Interfaces (APIs) [13] |
| Spot measuring instrument | Enables calculating as-seen system efficiency and performance coefficients by metering and measuring performance variables of systems and thermal properties of building elements | Higher fidelity than using only estimated values based on historical or manufacturer’s data | Expensive and time consuming; Spot measurements may not represent actual performance that can be verified through a long term measurement, for example, by Energy Management Control Systems (EMCS) | Thermo-hygrometer, heat flux meter, thermal imager, thermometer, flow meter, wattmeter, etc. | |
| Model calibration | Parameter identification via optimization | Mathematical optimization to determine model parameters that minimize the difference between the model outputs and the utility data (ΔU). | Convenient calibration of model parameters; Relatively stable and faster optimization convergence | Often the optimum ends with “Low hanging fruits” that may not be actual values, but more sensitive values. | Optimization package such as ModelCenter [14] |
| Bayesian calibration | Naturally incorporates parameter uncertainties in the calibration process while assuming the uncertainty still remains over the fitted parameters. | Accounts for the distribution that building and system properties that cannot be single values, but vary around. | Practitioners are not familiar with model parameters in a probabilistic expression; Calibration result varies upon the prior probability of model parameters, which requires a priori knowledge to define it. | Not commercially available yet | |
| Selection and evaluation of ECMs | Dynamic simulation | Energy analysis of the whole facility that solves the heat balance equations based on differential equations. It results in energy use and detailed breakdowns for each time step. | Very versatile and allows the accurate modeling through custom input data; Accurately assesses interactive effects between passive and active ECMs. De-facto standard | Requires extensive input data; Required extensive modeling time and expertise | EnergyPlus [15] and DOE2 [16] are recommended in most M&V guidelines. |
| Quasi-steady state simulation | Energy analysis of the whole facility that solves the heat balance equations based on algebraic equations. It results in energy use, and monthly or seasonal breakdowns. | Quicker and simpler modeling than dynamic simulations; Uses open standard algorithms such as ISO 52016-1 [17] or DIN V 18599 [18] | Limited in analyzing interactive effects between passive and active ECMs; Mostly developed for the energy rating of new designs, rather than evaluating existing buildings’ energy performance | ECO2 [19], ECO-CE3 [20] |
Table 2.
Current domestic practice of collecting energy data and alternative measures.
| Energy Data | Required Level of Details | Current Practice | Alternative Measures |
|---|---|---|---|
| Weather data | A minimum of 12 consecutive months of the observed weather data; The weather station less than 5 km away from the building; At least temperature, solar radiation, and humidity required | Processing the raw data supplied by any near weather stations into a standard weather file format; Library weather file | Weather ISP |
| Utility data | A minimum of 12 consecutive months of electricity and gas, and their bills; Peak electric demand, and accumulated electricity and gas consumptions; Smaller intervals preferred (e.g., 15 min) | Ad-hoc manual recoding by reading meters; Only monthly bills by utility provider are available in most cases | Advanced metering infrastructure (AMI) device ** |
| Plant systems | Model and serial number, design capacity and efficiency, operation schedules, vintage and conditions | If drawings, observation and inspection is unavailable, Min. code performance standard * is adopted | Nominal design value *** or simulation autosizing |
| Flow rate, flow temperature, electricity or gas consumption | EMCS **, flow meters, thermometer, manometer, watt meter, calorimeter | ||
| HVAC and secondary equipment | Model and serial number, design fan and pump type and size, design flow rate and static pressure, design motor size and efficiency, economizer, heat recovery, control type, valves and dampers; condition and characteristics | If drawings, observation and inspection is unavailable, Min. code performance standard * is adopted | Nominal design value *** or simulation autosizing |
| Flow rate, flow velocity, flow temperature and humidity, CO2 concentration, electricity consumption | EMCS **, flow meters, thermometer, anemometer, watt meter, moisture meter, thermo-hygrometer, CO2 meter | ||
| Control settings | Zoning, control set points, dead bands, reset controls, control schedule and staging and sequence, control protocols | If drawings, observation and inspection is unavailable, Min. code performance standard * is adopted | Nominal design value *** or simulation default |
| EMCS ** | |||
| Lightings | LPD, Lamp type, ballast type, lighting schedule and controls | If drawings, observation and inspection is unavailable, Min. code performance standard * is adopted | Nominal design value *** or simulation default |
| Illuminance, actual electricity consumption | Light meter, illuminance sensor, wattmeter, smart meter **, portable power meter | ||
| Occupants | Occupant density, Design population, occupation schedules | If drawings, observation and inspection is unavailable, Min. code performance standard * is adopted | Nominal design value *** or simulation default |
| Number of actual occupants | Occupancy sensor **, motion sensor ** | ||
| Plug and process load | EPD, Major electricity consumers’ capacity, operation schedule and controls | If observation and inspection is not feasible, Min. code performance standard * is adopted | Nominal design value *** or simulation default |
| Actual electricity consumption | Wattmeter, smart meter **, portable power meter | ||
| Building envelope | Construction including insulation, glazing and frame type (U-value, SHGC) | If drawings, observation and inspection is unavailable, Min. code performance standard * is adopted | Thermal imager, Heat flux meter, SHGC meter; Nominal design value *** or simulation default |
| Infiltration | Blower door tester; Nominal design value *** or simulation default | ||
| Operation and management strategy and records | General survey with manager and operator of the target building; Maintenance and retrofit history desired | If interview and survey is not feasible, Min. code performance standard * is adopted | Nominal design value *** or simulation default |
* Minimum code performance assumes a “well-commissioned” state, which does not include, for example, suboptimal/inactive controls, or degraded systems by wear and tear; ** Only if it is already installed in the facility; *** Nominal value refers to the industry-widely used design value, typically for building load analysis and system sizing.
Table 3.
Ranges of model parameters, optimized values, and measured values.
| Building and System Parameters | Ranges | Optimized Values | Measured Value | |
|---|---|---|---|---|
| Exterior wall (350 mm thick bare concrete) | U-value (W/m2K) | [2.69, 3.29] (nominal; 1.2X) | 2.40–3.10 | 3.14 1) |
| Flat roof (300 mm thick bare concrete) | U-value (W/m2K) | [3.15, 3.78] (nominal; 1.2X) | 3.15–3.60 | 3.14 1) |
| Slab On Grade (SOG) | U-value (W/m2K) | [1.82, 2.18] (nominal; 1.2X) | 1.83–2.05 | N/A |
| Glazing (6 mm clear single pane with vinyl frame) | U-value (W/m2K) | [5.30, 6.36] (nominal; 1.2X) | 5.70–6.20 | 3.40 1) |
| Packaged A/C (8.3 kW of the rated capacity) | COP | [2.40, 3.00] (0.8X; rated) | 2.40–2.50 | 2.90 2) |
| Steam radiator (4.91 kW of the rated capacity) | Efficiency | [0.62, 0.77] (0.8X; rated) | 0.62–0.64 | N/A |
| Office | Operation hours (h) | [6.30, 9.00] (min; nominal) | Fixed | 8.00–12.00 3) |
| Occupant(person/m2) | [0.09, 0.16] (nominal; max) | 0.12–0.16 | 0.01–0.11 3) | |
| EPD (W/m2) | [4.67, 14.00, 42.00] (min; nominal; 3X) | 40.00–42.00 | 22.00–43.00 4) | |
| LPD (W/m2) | [12.00, 16.00, 20.00] (min; nominal; 1.2X) | 19.00–20.00 | 5.30–15.80 3) | |
| Infiltration (ACH) | [0.60, 1.50, 3.00] (min; nominal; 2X) | 2.00–3.00 | N/A | |
| Lobby | Operation hours (h) | [1.80, 9.00] (min; nominal) | Fixed | 8.00–12.00 3) |
| Occupant(person/m2) | [0.10, 0.16] (nominal; max) | 0.13–0.16 | 0.02–0.07 3) | |
| EPD (W/m2) | [0.01, 2.67, 8.01] (min; nominal; 3X) | 7.00–8.00 | 0.00–6.70 4) | |
| LPD (W/m2) | [6.00, 8.00, 10.00] (min; nominal; 1.2X) | 9.00–10.00 | 18.00–20.00 3) | |
| Infiltration (ACH) | [3.00, 5.00, 10.00] (min; nominal; 2X) | 8.00–10.00 | N/A | |
| Class room | Operation hours (h) | [5.60, 9.00] (min; nominal) | Fixed | 5.00–8.00 3) |
| Occupant(person/m2) | [0.37, 1.22] (nominal; max) | 0.50–1.22 | 0.44–0.56 3) | |
| EPD (W/m2) | [2.22, 3.6, 10.8] (min; nominal; 3X) | 9.60–10.80 | 11.00–14.00 4) | |
| LPD (W/m2) | [15.00, 20.00, 25.00] (min; nominal; 1.2X) | 24.00–25.00 | 11.00–19.00 3) | |
| Infiltration (ACH) | [0.60, 1.50, 3.00] (min; nominal; 2X) | 1.10–2.50 | N/A | |
| Meeting room | Operation hours (h) | [4.50, 9.00] (min; nominal) | Fixed | 5.00–8.00 3) |
| Occupant(person/m2) | [0.33, 0.99] (nominal; max) | 0.80–0.99 | 0.00–0.01 3) | |
| EPD (W/m2) | [0.89, 2.22, 6.66] (min; nominal; 3X) | 6.40–6.66 | 7.00–29.00 4) | |
| LPD (W/m2) | [13.50, 18.00, 21.60] (min; nominal; 1.2X) | 19.50–21.60 | 5.00–13.00 3) | |
| Infiltration (ACH) | [0.60, 1.50, 3.00] (min; nominal; 2X) | 1.40–2.50 | N/A | |
1) Measured for 7 days and then averaged; 2) Electricity consumption has been measured while modulating setpoint temperature. Then the rated capacity is divided by the averaged power consumption; 3) Collected through a walk-through and observation; 4) Measured by portable power meters.
Table 4.
Candidate passive ECMs and their relative first cost rank.
| Passive ECMs | Composition and Specification | First Cost in Order | |
|---|---|---|---|
| Envelope | Airtight envelope | Caulking cracks and openings, and weather stripping doors and windows to meet less than 0.6 ACH (Air Change per Hour); applied to the existing façade | 5th |
| EPS | Expanded Polystyrene (EPS) insulation on the interior of external walls, roof and Slab On Grade (SOG) (125/220/105 mm) Caulking cracks and openings, and weather stripping doors and windows to meet less than 0.6 ACH | 4th | |
| XPS | Extruded Polystyrene (XPS) insulation on the interior of external walls, roof and SOG (125/220/105 mm) Caulking cracks and openings, and weather stripping doors and windows to meet less than 0.6 ACH | 3rd | |
| PUR | Polyurethane (PUR) insulation on the interior of external walls, roof and SOG (125/220/105 mm) Caulking cracks and openings, and weather stripping doors and windows to meet less than 0.6 ACH | 2nd | |
| EIFS | Exterior Insulation and Finish Systems (EIFS); EPS on the exterior of external walls and roof (80/220 mm), EPS on the interior of SOG (105 mm) Caulking cracks and openings, and weather stripping doors and windows to meet less than 0.6 ACH | 1st (The most expensive) | |
| Glazing | Double glazing | Double glazing on external windows (2.27 W/m2K, SHGC 0.494, VT 0.563); made by “H” manufacturer | 4th |
| Low E double glazing | Low E coated double glazing on external windows (2.00 W/m2K, SHGC 0.432, VT 0.563); made by “H” manufacturer | 3rd | |
| Triple glazing | Triple glazing on external windows (1.97 W/m2K, SHGC 0.46, VT 0.546); made by “H” manufacturer | 2nd | |
| Low E triple glazing | Low E coated triple glazing on external windows (1.75 W/m2K, SHGC 0.42, VT 0.504); made by “H” manufacturer | 1st | |
| Roof | Cool roof | Reflective and matt white covering material with an absorptance of 0.25 | 2nd |
| Insulated cool roof | Cool roof with EPS insulation on the interior of roof (220 mm) | 1st | |
Table 5.
Candidate active ECMs and their relative first cost rank.
| Active ECMs | Composition and Specification | First Cost in Order | |
|---|---|---|---|
| Lighting | LED bulb | Replacement with LED (Light Emitting Diode) lightings; various manufacturers upon lighting type | |
| Heat pump | EHP + ERV | Air source electric heat pump with ERV (Enthalpy Recovery Ventilation); Avg. cooling COP of 4.53 and Avg. heating COP of 4.65; made by “L” manufacturer | 4th |
| GHP + ERV | Air source Gas Heat Pump (GHP) with ERV; Avg. cooling COP of 1.35 and Avg. heating COP of 1.56; made by “L” manufacturer | 3rd | |
| GSHP + ERV | Water to air Ground Source Heat Pump (GSHP) with ERV; Avg. cooling COP of 5.0 and Avg. heating COP of 5.4; total 1630m long ground heat exchanger; made by “L” manufacturer | 2nd | |
| GSHP + FCU | Water to water GSHP with FCUs (Fan Coil Units); Avg. cooling COP of 5.6 and Avg. heating COP of 3.3; total 2000 m long ground heat exchanger; made by “T” manufacturer | 1st (The most expensive) | |
| Renewables | PV | Photovoltaic panels on the roof (463 m2 and 12% efficiency); made by “L” manufacturer | |
Table 6.
The most energy saving ECMs for each category, and their reduction ratios over the baseline EUI in parenthesis.
Table 6.
The most energy saving ECMs for each category, and their reduction ratios over the baseline EUI in parenthesis.
| ECM Category | When Applied to the Calibrated DOE2 Baseline | When Applied to Nominal ECO-CE3 Baseline | When Applied to the Reconstructed DOE2 Baseline by the Suggested Alternative (Section 5.2) |
|---|---|---|---|
| Envelope | EPS with improved airtightness (65%) | PUR with improved airtightness (48%) | PUR with improved airtightness (53%) |
| PUR with improved airtightness (66%) | XPS with improved airtightness (49%) | XPS with improved airtightness (54%) | |
| XPS with improved airtightness (67%) | EPS with improved airtightness (49%) | EPS with improved airtightness (54%) | |
| Roof | Cool roof with EPS (94%) | Cool roof with EPS (78%) | Cool roof with EPS (81%) |
| Glazing | N/A * | Low E triple glazing (91%) | N/A * |
| Triple glazing (91%) | |||
| Low E double glazing (92%) | |||
| Double glazing (92%) | |||
| Lighting | LED (99%) | LED (98%) | LED (97%) |
| HVAC | EHP with ERV (56%) | EHP with ERV (25%) | EHP with ERV (36%) |
| GSHP with ERV (60%) | GSHP with ERV (26%) | GSHP with ERV (39%) | |
| Renewables | PV (66%) | PV (87%) | PV (74%) |
* All glazing ECMs have increased EUIs compared to the baseline EUI.
Table 7.
Net applied area and number of EPS panels calculated based on 2D drawings and BIM.
| Envelopeand Slab | Based on 2D Drawings | Based on BIM Material Take-off | ||
|---|---|---|---|---|
| Net Applied Area | Number of Panels (2400 × 1200 mm) | Net Applied Area | Number of Panels (2400 × 1200 mm) | |
| 1st floor external walls | 400 m2 | 140 (134.6%) | 298 m2 | 104 (100%) |
| 2nd floor external walls | 400 m2 | 140 (111.1%) | 333 m2 | 126 (100%) |
| Roof | 675 m2 | 235 (112.4%) | 581 m2 | 209 (100%) |
| SOG | 675 m2 | 235 (112.4%) | 583 m2 | 209 (100%) |
Table 8.
The maximum pipe length calculated based on 2D drawings and BIM.
| Zoning | Based on 2D Drawings | Based on BIM |
|---|---|---|
| South zone | 38 m × 1.2 = 45.6 m (94.2%) | 48.4 m (100%) |
| North zone | 33 m × 1.2 = 39.6 m (110%) | 36.0 m (100%) |
Table 9.
Type classification of parameters upon energy sensitivity and collectability.
| Category | Simulation Parameter | Type I | Type II | Type III | |
|---|---|---|---|---|---|
| Observed/Measured | Nominal | The Worst Case Value | Simulation Defaults | ||
| Climate | Weather | V | |||
| Building physics | Geometry | V | |||
| Construction | V * | ||||
| Furniture and partitions (internal thermal mass) | V ** | ||||
| Envelope thermal property | V * | ||||
| Infiltration | V ** | ||||
| System property | COP and efficiency of plant | V | |||
| Design capacity of plant | V | ||||
| Performance curve of plant | V | ||||
| Setpoint and controls | V *** | V | |||
| Ventilation rate | V | ||||
| Design size of pumps and fans | V | V | |||
| Efficiency of pumps and fans | V | V | |||
| Performance curve of pumps and fans | V | ||||
| Internal heat gain | LPD | V | |||
| EPD | V ** | ||||
| Number of occupants | V | V | |||
| Zone operation | Operation profile | V | V *** | ||
| Setpoint temperature | V | V | |||
* A drastic change in the envelope properties can often have less impact on the energy use than the system and internal heat gain parameters do. Considering the large cost of physically measuring the envelope property values, selection of a nominal value can be a more economical way of establishing the baseline model input, provided that the modeler identifies the deterioration and degradation, and these are sufficiently reflected in the baseline; ** These parameters are known as some of the most difficult building parameters to accurately measure due to temporal and spatial fluctuations. Occasionally, even nominal values may not be able to represent the worst case; *** In many cases of calibration, modulating operation hours and controls become the last resort to meet the calibration criteria. Since their adjustment is prohibited without scientific and reasonable grounds, the use of nominal values, rather than manipulating the values to suit the desired outcome, is preferred if further measurement is no longer possible.
© 2018 by the author. Licensee MDPI, Basel, Switzerland. This article is an open access article distributed under the terms and conditions of the Creative Commons Attribution (CC BY) license (http://creativecommons.org/licenses/by/4.0/).
Share and Cite
MDPI and ACS Style
Kim, S.H. Assessing the Needs and Gaps of Building Information Technologies for Energy Retrofit of Historic Buildings in the Korean Context. Sustainability 2018, 10, 1319. https://doi.org/10.3390/su10051319
AMA Style
Kim SH. Assessing the Needs and Gaps of Building Information Technologies for Energy Retrofit of Historic Buildings in the Korean Context. Sustainability. 2018; 10(5):1319. https://doi.org/10.3390/su10051319
Chicago/Turabian StyleKim, Sean Hay. 2018. "Assessing the Needs and Gaps of Building Information Technologies for Energy Retrofit of Historic Buildings in the Korean Context" Sustainability 10, no. 5: 1319. https://doi.org/10.3390/su10051319
Note that from the first issue of 2016, this journal uses article numbers instead of page numbers. See further details here.