Ecosystem Services Management Based on Differentiation and Regionalization along Vertical Gradient in Taihang Mountain, China


1
Key Laboratory of Agricultural Water Resources, Hebei Laboratory of Agricultural Water-Saving, Center for Agricultural Resources Research, Institute of Genetics and Developmental Biology, Chinese Academy of Sciences, Shijiazhuang 050021, China
2
College of Life Sciences, University of Chinese Academy of Sciences, Shijiazhuang 050021, China
3
College of Life Sciences, Hebei Normal University, Shijiazhuang 050024, China
*
Author to whom correspondence should be addressed.
†
These authors contributed equally to the work.
Sustainability 2018, 10(4), 986; https://doi.org/10.3390/su10040986
Submission received: 22 January 2018
/
Revised: 16 March 2018
/
Accepted: 19 March 2018
/
Published: 27 March 2018
(This article belongs to the Section Environmental Sustainability and Applications)
Abstract
:The regulation and management of ecosystem services are fundamental for sustainable development in mountain areas. Although no obvious vertical band spectrum exists in Taihang Mountain region, vertical differentiation of ecological characteristics in the region is obvious. The ecosystem characteristics of vertical differentiation were analyzed using 4 typical ecological indices (land use, temperature, net primary productivity, and water yield). The ecosystem service functional pattern was determined based on analysis of the ecosystem services value per unit area. The 2 ecosystem critical zones of vertical differentiation (500–600 m and 1400–1500 m) were determined. The mountain area was divided into 3 ecological zones—sub-alpine zone (>1500 m), mid-mountain zone (600–1400 m) and hilly zone (<500 m). The ecosystem services functional pattern was as follows: provisioning services was the main ecosystem services function in the hilly zone, 4 ecosystem service functions were equally important in the mid-mountain zone, regulating, supporting and cultural services were the main ecosystem service functions in the sub-alpine zone. The model of ecosystem service regulation and management in 3 ecological zones was built based on the functional patterns to promote sustainable development.
1. Introduction
China is a mountainous country, with approximately 70% of land area of the country covered by mountains [1,2]. Mountain ecosystems provide direct and indirect services for human livelihood [3,4,5,6], but these systems are sensitive to rapid changes in global ecological and economic landscapes [7,8]. Under global climate change and economic integration, the development of mountain regions faces huge challenges, including the issue of sustainability [9,10,11]. The management and optimization of ecosystem services provides a basic measure for sustainable development of mountain regions [12,13].
Evaluation of the spatial distribution of ecosystem services has been conducted at different spatial and temporal scales. Costanza et al. [14] developed a global map of ecosystem service value. Xie et al. [15] determined the spatio-temporal dynamics of ecosystem services value for China. Also, Yang et al. [16] evaluated and mapped ecosystem service value at a river basin scale. There is also a huge amount of literature on the spatial distribution of ecosystem services in mountain regions [17]. However, vertical zonal differentiation of mountains is largely neglected in the studies of mountain ecosystem services [18]. There is even less work on the characteristics of ecosystem services along vertical gradients, thus the necessity to define the functions and patterns of ecosystem services in this regard.
Vertical zonal differentiation is a unique mountain process that forms vertical belts of geomorphology, vegetation, soil, and natural landscape 18. Altitudinal belts in mountain regions are critical for vertical zonal differentiation. Yao et al. [19] determined spectra altitudinal belts of Hengduan Mountains and delineated the main altitudinal belt lines such as forest line, dark coniferous forest line and snow line. The top-bottom spectral altitudinal belt of Qilian Mountains is given by Zhao et al. [20]. Ma et al. [21] determined spectra altitudinal soil belt but failed to delineate the altitudinal belt boundaries. Studies show that vegetation and soil are the main elements in the differentiation of spectra altitudinal belts in mountain regions. Due to the lack of a clear differentiation in vegetation and soil in mountain regions at spectral scale, spectral altitudinal belts hardly reflect the characteristics of vertical differentiation of ecosystems.
The Taihang Mountains cover an area of four longitudes and six latitudes. It is the natural dividing belt between the Loess Plateau and North China Plain (NCP), with rivers originating from the Loess Plateau flowing through Taihang Mountains to NCP. Thus, there is a strong geographical and ecological link between the Loess Plateau and NCP. Because of the generally low altitude, there is no obvious spectral altitudinal belt in the Taihang Mountains. However, detailed data on the area suggest that distinct vertical characteristics exist in Taihang Mountains. Here, we determined the critical line/zone of vertical differentiation and delineated the ecological regions in the mountain. This will lay the basis for sustainable development of ecosystem services in the ecological zones in the region.
2. Site Description
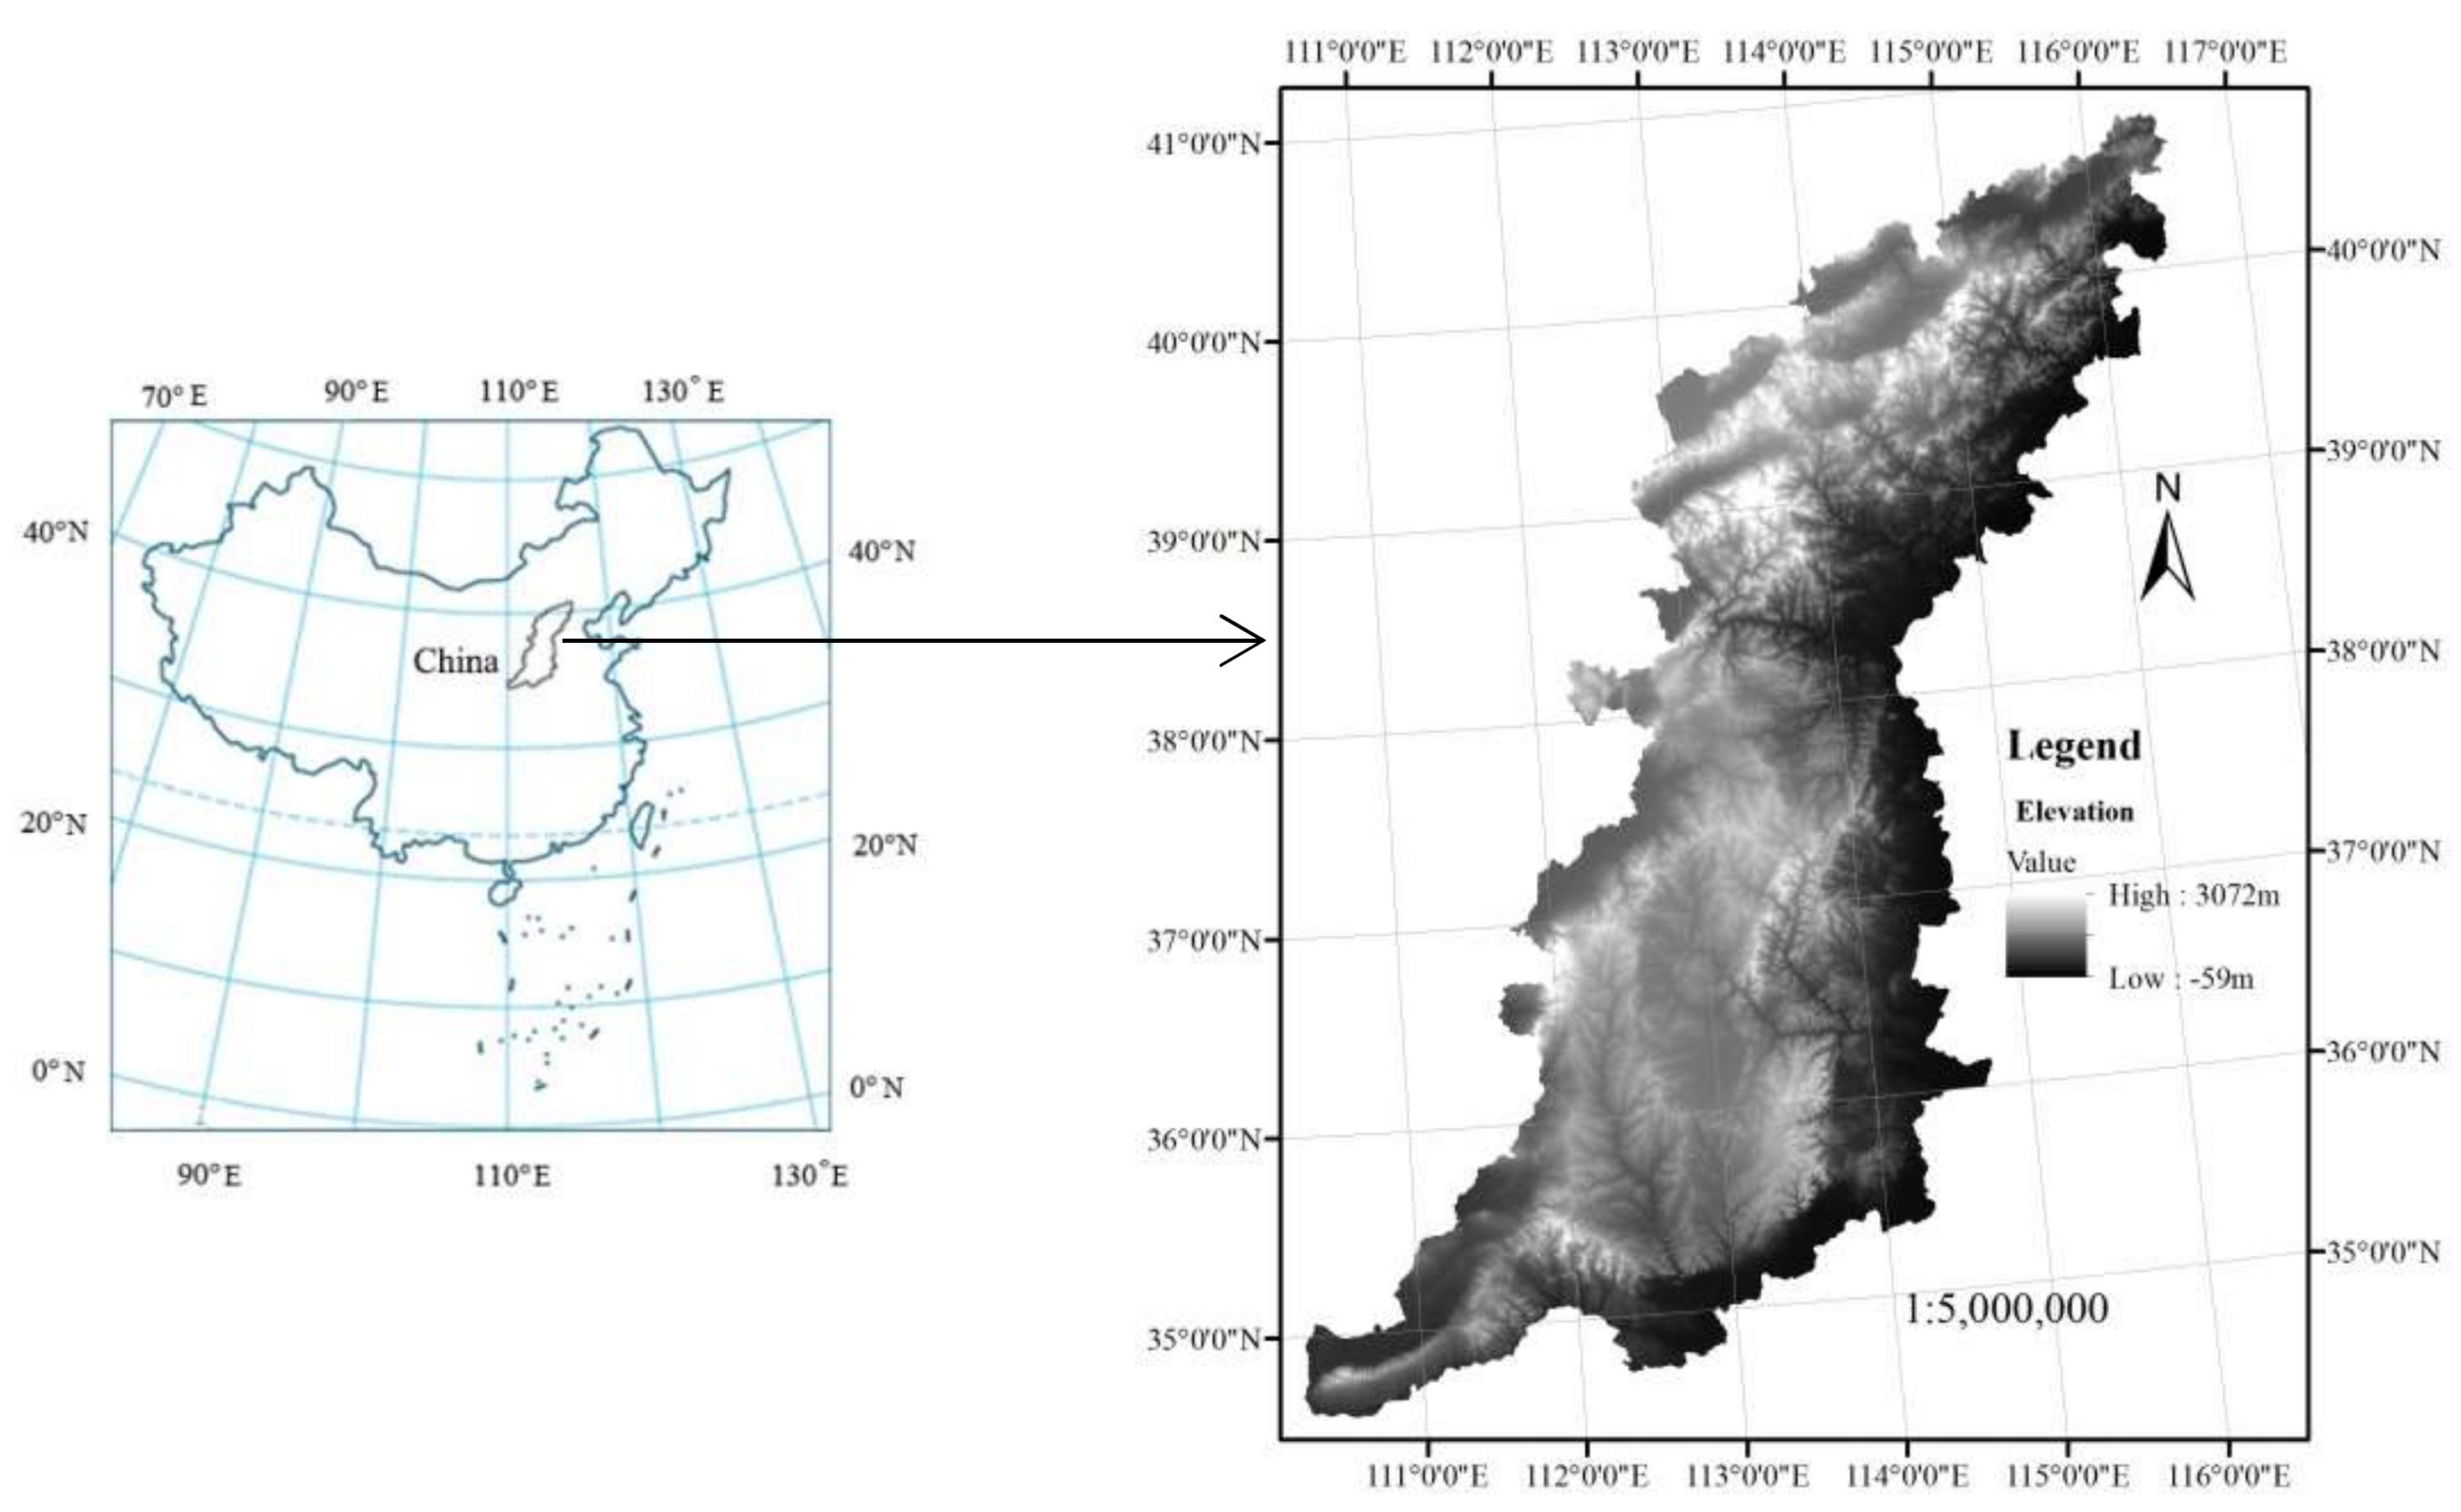
Taihang Mountain (34°36’–40°47’N, 110°42’–116°34’E) is in North China (Figure 1) and covers an area of 140,000 km2, stretching across 4 first-tier administrative regions (Beijing, Hebei, Shanxi, and Henan provinces) and 101 counties. The highest elevation in Taihang Mountain is about 3000 m and the elevation in most of the area are more than 1200 m, with the elevation decreasing from the northwest to the southeast. It has a predominantly East Asian Monsoon climate, characterized by warm rainy summers and cold dry winters. The average annual precipitation and temperature are about 570 mm and 10 °C, respectively. There are 4 main land use types (cultivated land, forest land, grassland, and construction area), accounting for over 90% of the land use in Taihang Mountain.
3. Data Source and Processing
The basic elements of an ecosystem are water, soil, temperature, and biomass. In this study, water yield, land use, temperature, and vegetation NPP were used as indicators of the basic elements of the ecosystem.
3.1. Land Use
Land use in Taihang Mountain was determined from visual interpretation of 2010 TM images with 30 m resolution (http://www.gscloud.cn/). The land use was classified into seven types—farmland, forestland, grassland, construction land, wetland, desert land, and water surface. The study verified the accuracy of interpretation by Google high-resolution image (at about 1.0 m resolution). There are 1742 sampling points of the six classes (farmland, forestland, grassland, construction land, water surface and others), with a total accuracy of 87.96%. Among them, 727 sampling points of forest were selected. The accuracy is 87.43%. 330 sampling points of farmland were selected. The accuracy is 90.21%. There are 275 sampling points for construction land, with a precision of 96.73%. The number of sampling points in the grassland was 250. The accuracy is 80.4%. The sampling points of the waters were 110, with an accuracy of 87.5%. 50 samples were other type classes, with an accuracy of 84% (Appendix Table A1).
3.2. Temperature
Temperature data (raster type) were derived from spatial interpolation of average annual temperature for the period 1961–2005 (http://cdc.cma.gov.cn). The (ordinary) kriging interpolation method was used to build the raster data at 1.0 km resolution.
3.3. Vegetation NPP
The NPP data (2000–2014) were obtained from MOD17A3 at https://ipdaac.usgs.gov. The MOD17A3 dataset is supported by the Numerical Terra-dynamic Simulation Group (NTSG)/University of Montana (UMT) and has a spatial resolution of 1.0 km and temporal resolution of 1 year. The linear regression used to determine the inter-annual variations in NPP was based on the formula:
where, S is the regression coefficient of multi-year NPP; N is the number of years; and xi is the NPP of the ith year. The regression coefficient S was used to represent the variation trend in NPP. It represents an increasing trend for S > 0 and vice versa.
3.4. Water Yield
Using water yield equation in the INVEST model, actual evapotranspiration was subtracted from precipitation [22,23,24]. Precipitation data (raster type) were derived from spatial interpolation of average annual precipitation for the period 1961–2005 (http://cdc.cma.gov.cn). The (ordinary) kriging interpolation method was also used here at a raster resolution of 1.0 km. The actual evapotranspiration data (2000–2014) were from MOD16 (https://ipdaac.usgs.gov).
3.5. DEM
The DEM (Digital Elevation Model) data were from ASTER GDEM V2 (30 m resolution data), which is available at Geospatial Data Cloud site of Computer Network Information Center, Chinese Academy of Sciences (http://www.gscloud.cn).
4. Method
Typical ecological indices of land use, temperature, net primary productivity (NPP) and water yield were used to determine the variation characteristics of vertical gradient in the study area. The Taihang Mountain area was divided into 3 ecological zones based on 2 critical lines of vertical differentiation, which were sub-alpine zone, mid-mountain zone and hilly zone. The pattern of the functions and services of the ecosystem were analyzed for the 3 zones along vertical gradient and the optimal model for sustainable development determined based on the pattern.
4.1. Critical Line/Zone Determination
The characteristics of the 4 indicators (land use, water yield, vegetation NPP and temperature) were determined at 100 m altitude gradient (and 50 m altitude gradient for water yield) as a statistical unit below 2500 m altitude, and the total area of above 2500 m altitude as a statistical unit was used to analyze the characteristics of the 4 indicators because there was small area. The critical line of vertical differentiation of land use in Taihang Mountain was determined using cluster analysis. The critical lines of vertical differentiation of vegetation NPP and water yield were determined using piecewise regression analysis.
The weighted method was used to establish the critical lines/zones of ecosystem in Taihang Mountain. The critical lines/zones of ecosystem were determined through analyzing the characteristics of vertical differentiation of the 4 indicators (land use, water yield, vegetation NPP and temperature) in Taihang Mountain. Temperature had no obvious vertical differentiation characteristics after analysis (5.1.4), so it was not given any weight. The weighted value of each of other 3 indicators (land use, water yield, vegetation NPP) was 1/3 since the indicators had equal importance [25,26].
4.2. Ecosystem Services Value
To calculate ecosystem services value of each eco-region, we used the Costanza et al. [13] ecosystem services assessment model:
where ESV is the total value of ecosystem services; and Ak and VCk are the area (ha) and ecosystem services value per hectare of ecosystem type (k), respectively. VCk is an equivalent value multiplied by equivalent ecosystem type (k). Here, the equivalent value was taken at 3406.5 Yuan [15].
4.3. Modified Equivalent Value
The ecosystem services value was calculated using Xie’s method for ecosystem service value based on equivalent value per unit area [15]. However, in this method equivalent value represents the average value of China. To apply it in Taihang Mountain area, the equivalent value must be modified which was conducted by NPP correction to accurately calculate the ecosystem services value in Taihang Mountain. The formula of correction coefficient of the equivalent value used is given as:
where CCi is the correction coefficient; NPPi is the average NPP of a land use (i) in the study area; and NPPeve is the average NPP of the corresponding land use in China. The modified ecosystem services equivalent value per unit area is given in Table 1.
4.4. Ecosystem Service Functional Index
Ecosystem service value is the value of ecosystem services per unit area multiplied by the area of the ecosystem. As the area of each zone in Taihang Mountain area was much different, the total value of the ecosystem services was much different. It cannot fully explain ecosystem service feature of each zone in Taihang Mountain. To determine the feature of ecosystem services of each zone in Taihang Mountain, ecosystem service functional index was established, calculated as:
where i = 1, 2, 3, with 1 for hilly zone, 2 for mid-mountain zone and 3 for sub-alpine zone; j = 1, 2, 3, 4, with 1 for provisioning service, 2 for regulating services, 3 for supporting services and 4 for cultural services; FI is ecosystem service functional index; ESVij is the ith region of j service value per unit area in Taihang Mountain; and ESVej is j service value per unit area of Taihang Mountain. The higher a service functional index, the more important the service.
5. Results
5.1. Ecological Vertical Differentiation
5.1.1. Land Use
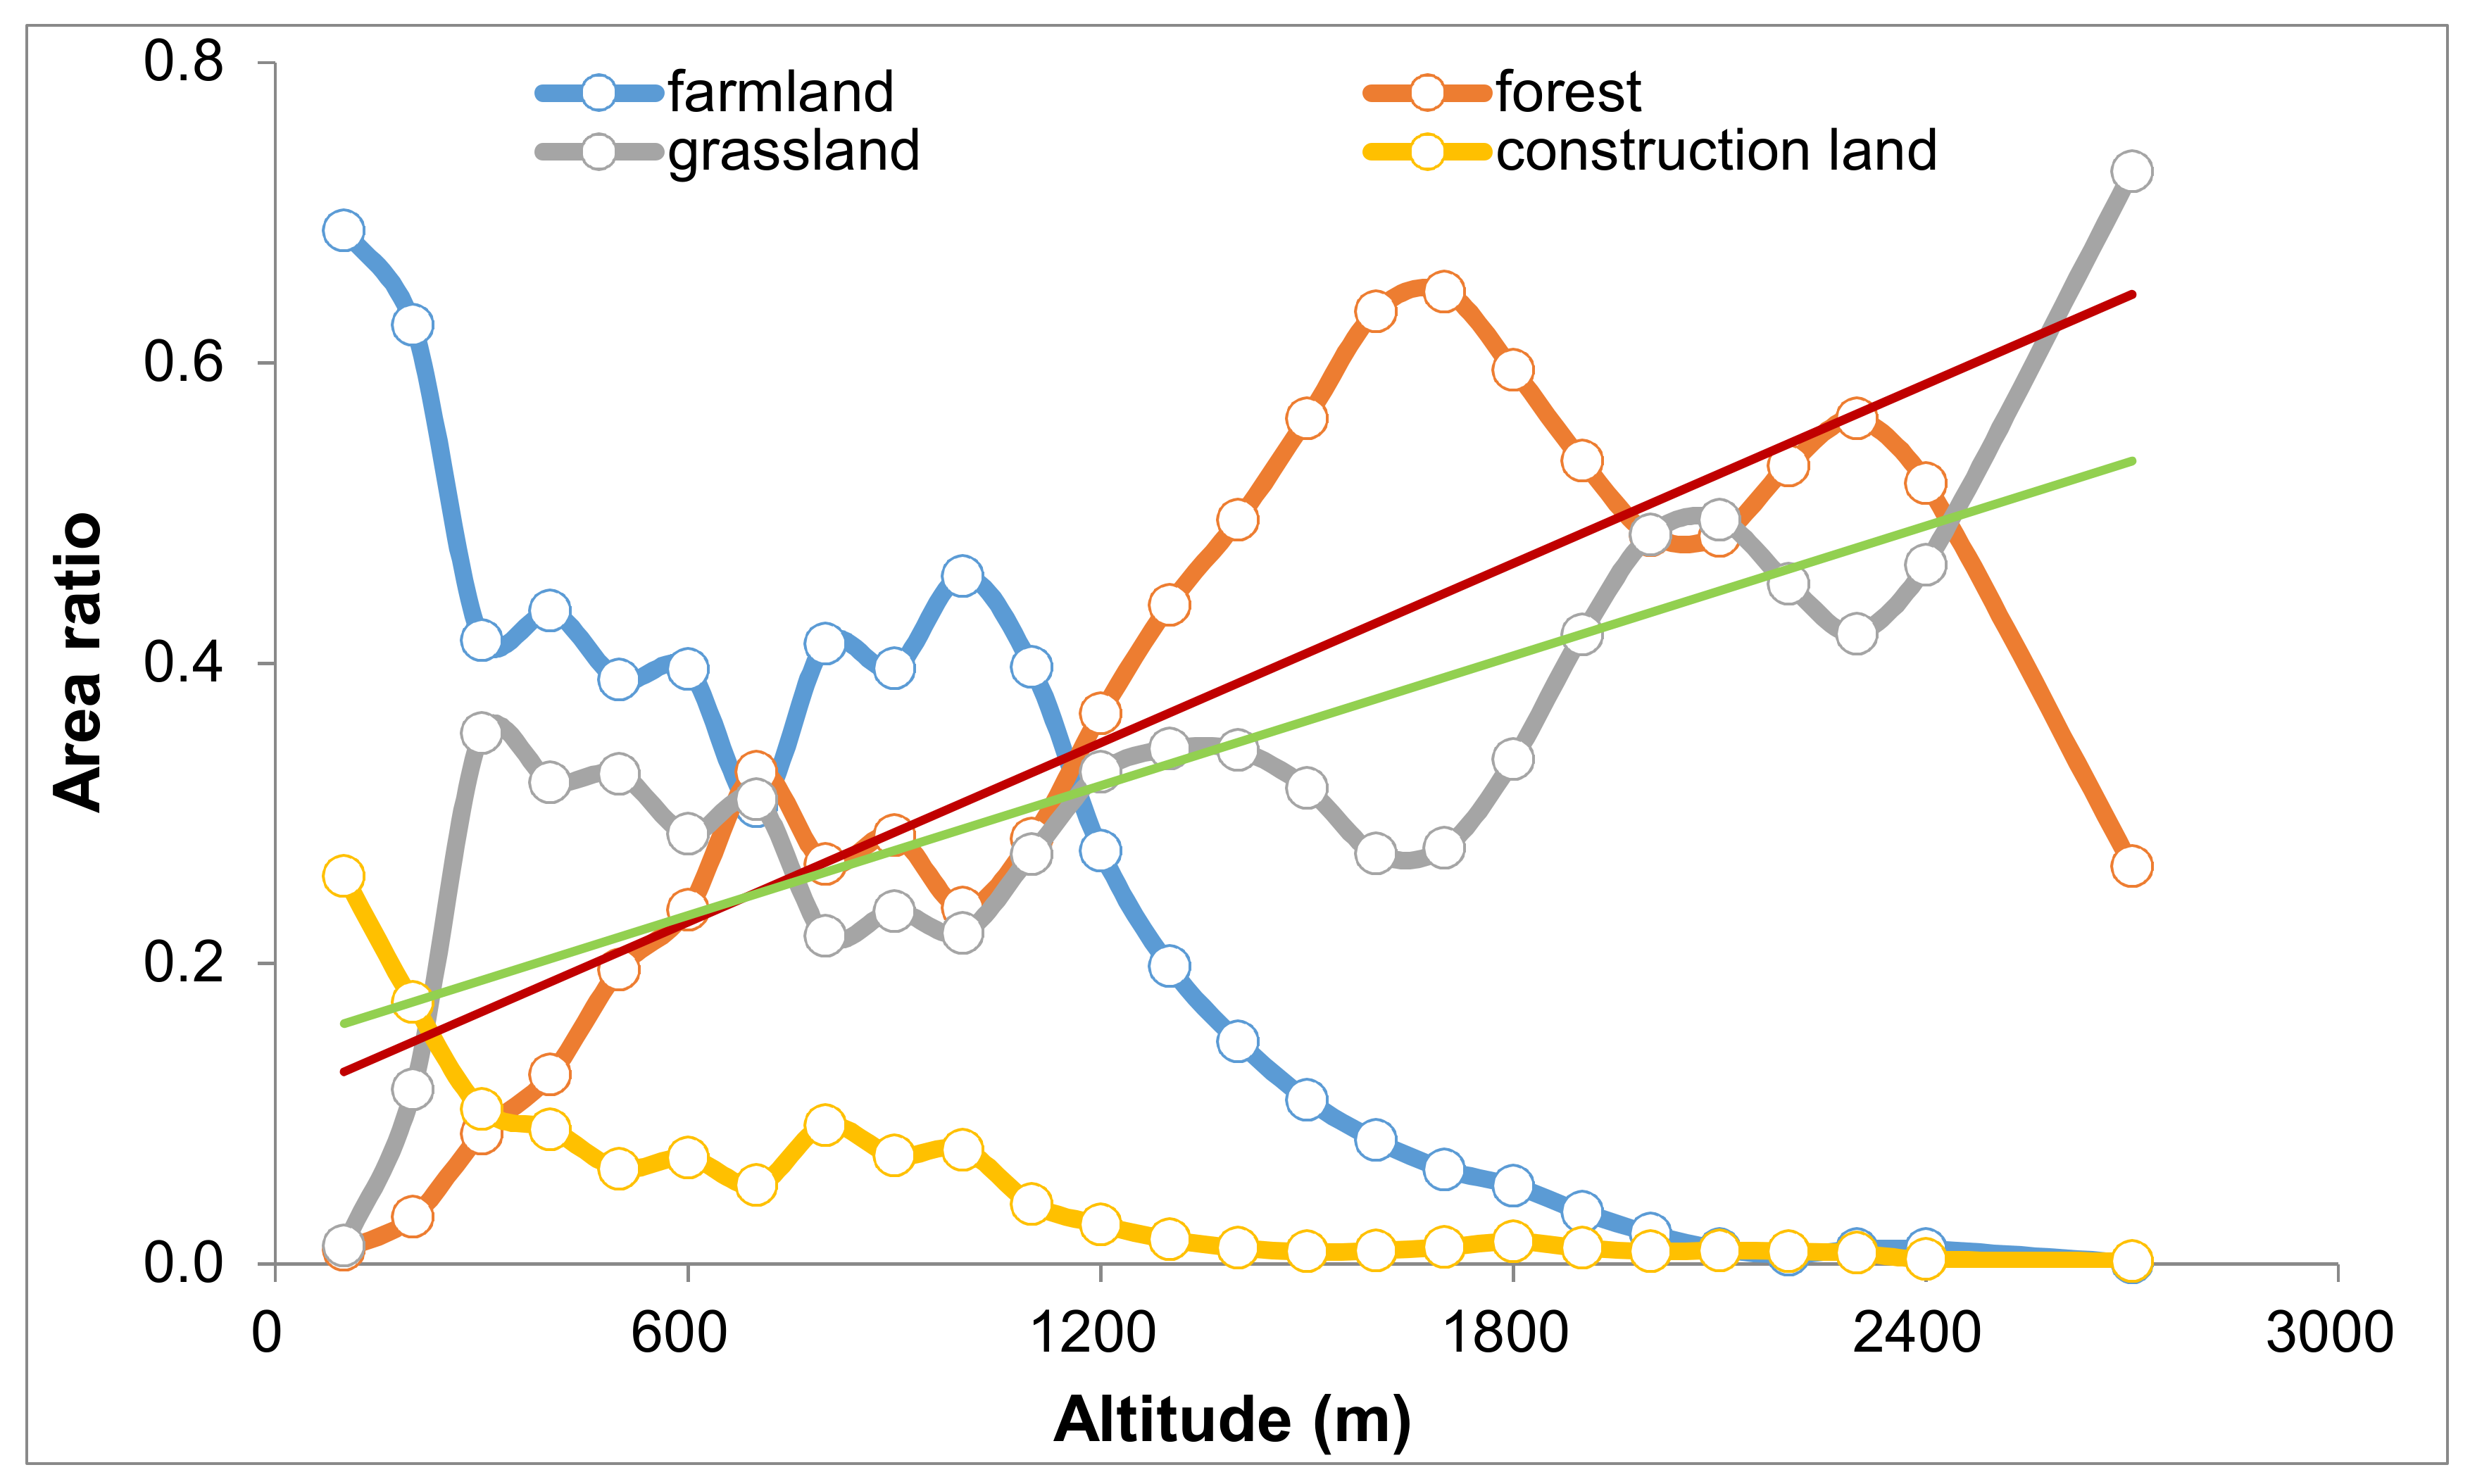
The indicators (elevation and area ratio of farmland, forest, grassland, and construction land) were divided into 3 groups (elevation < 600 m, elevation of range 600–1600 m and elevation > 1600 m). Then 600 m and 1600 m were the critical lines of vertical differentiation of land use in Taihang Mountain. The land use types were mainly farmland, forest, grassland, construction land. The proportions of farmland and construction land decreased and those of forest and grassland increased with increasing altitude across the 3 regions (Figure 2).
5.1.2. Vegetation NPP
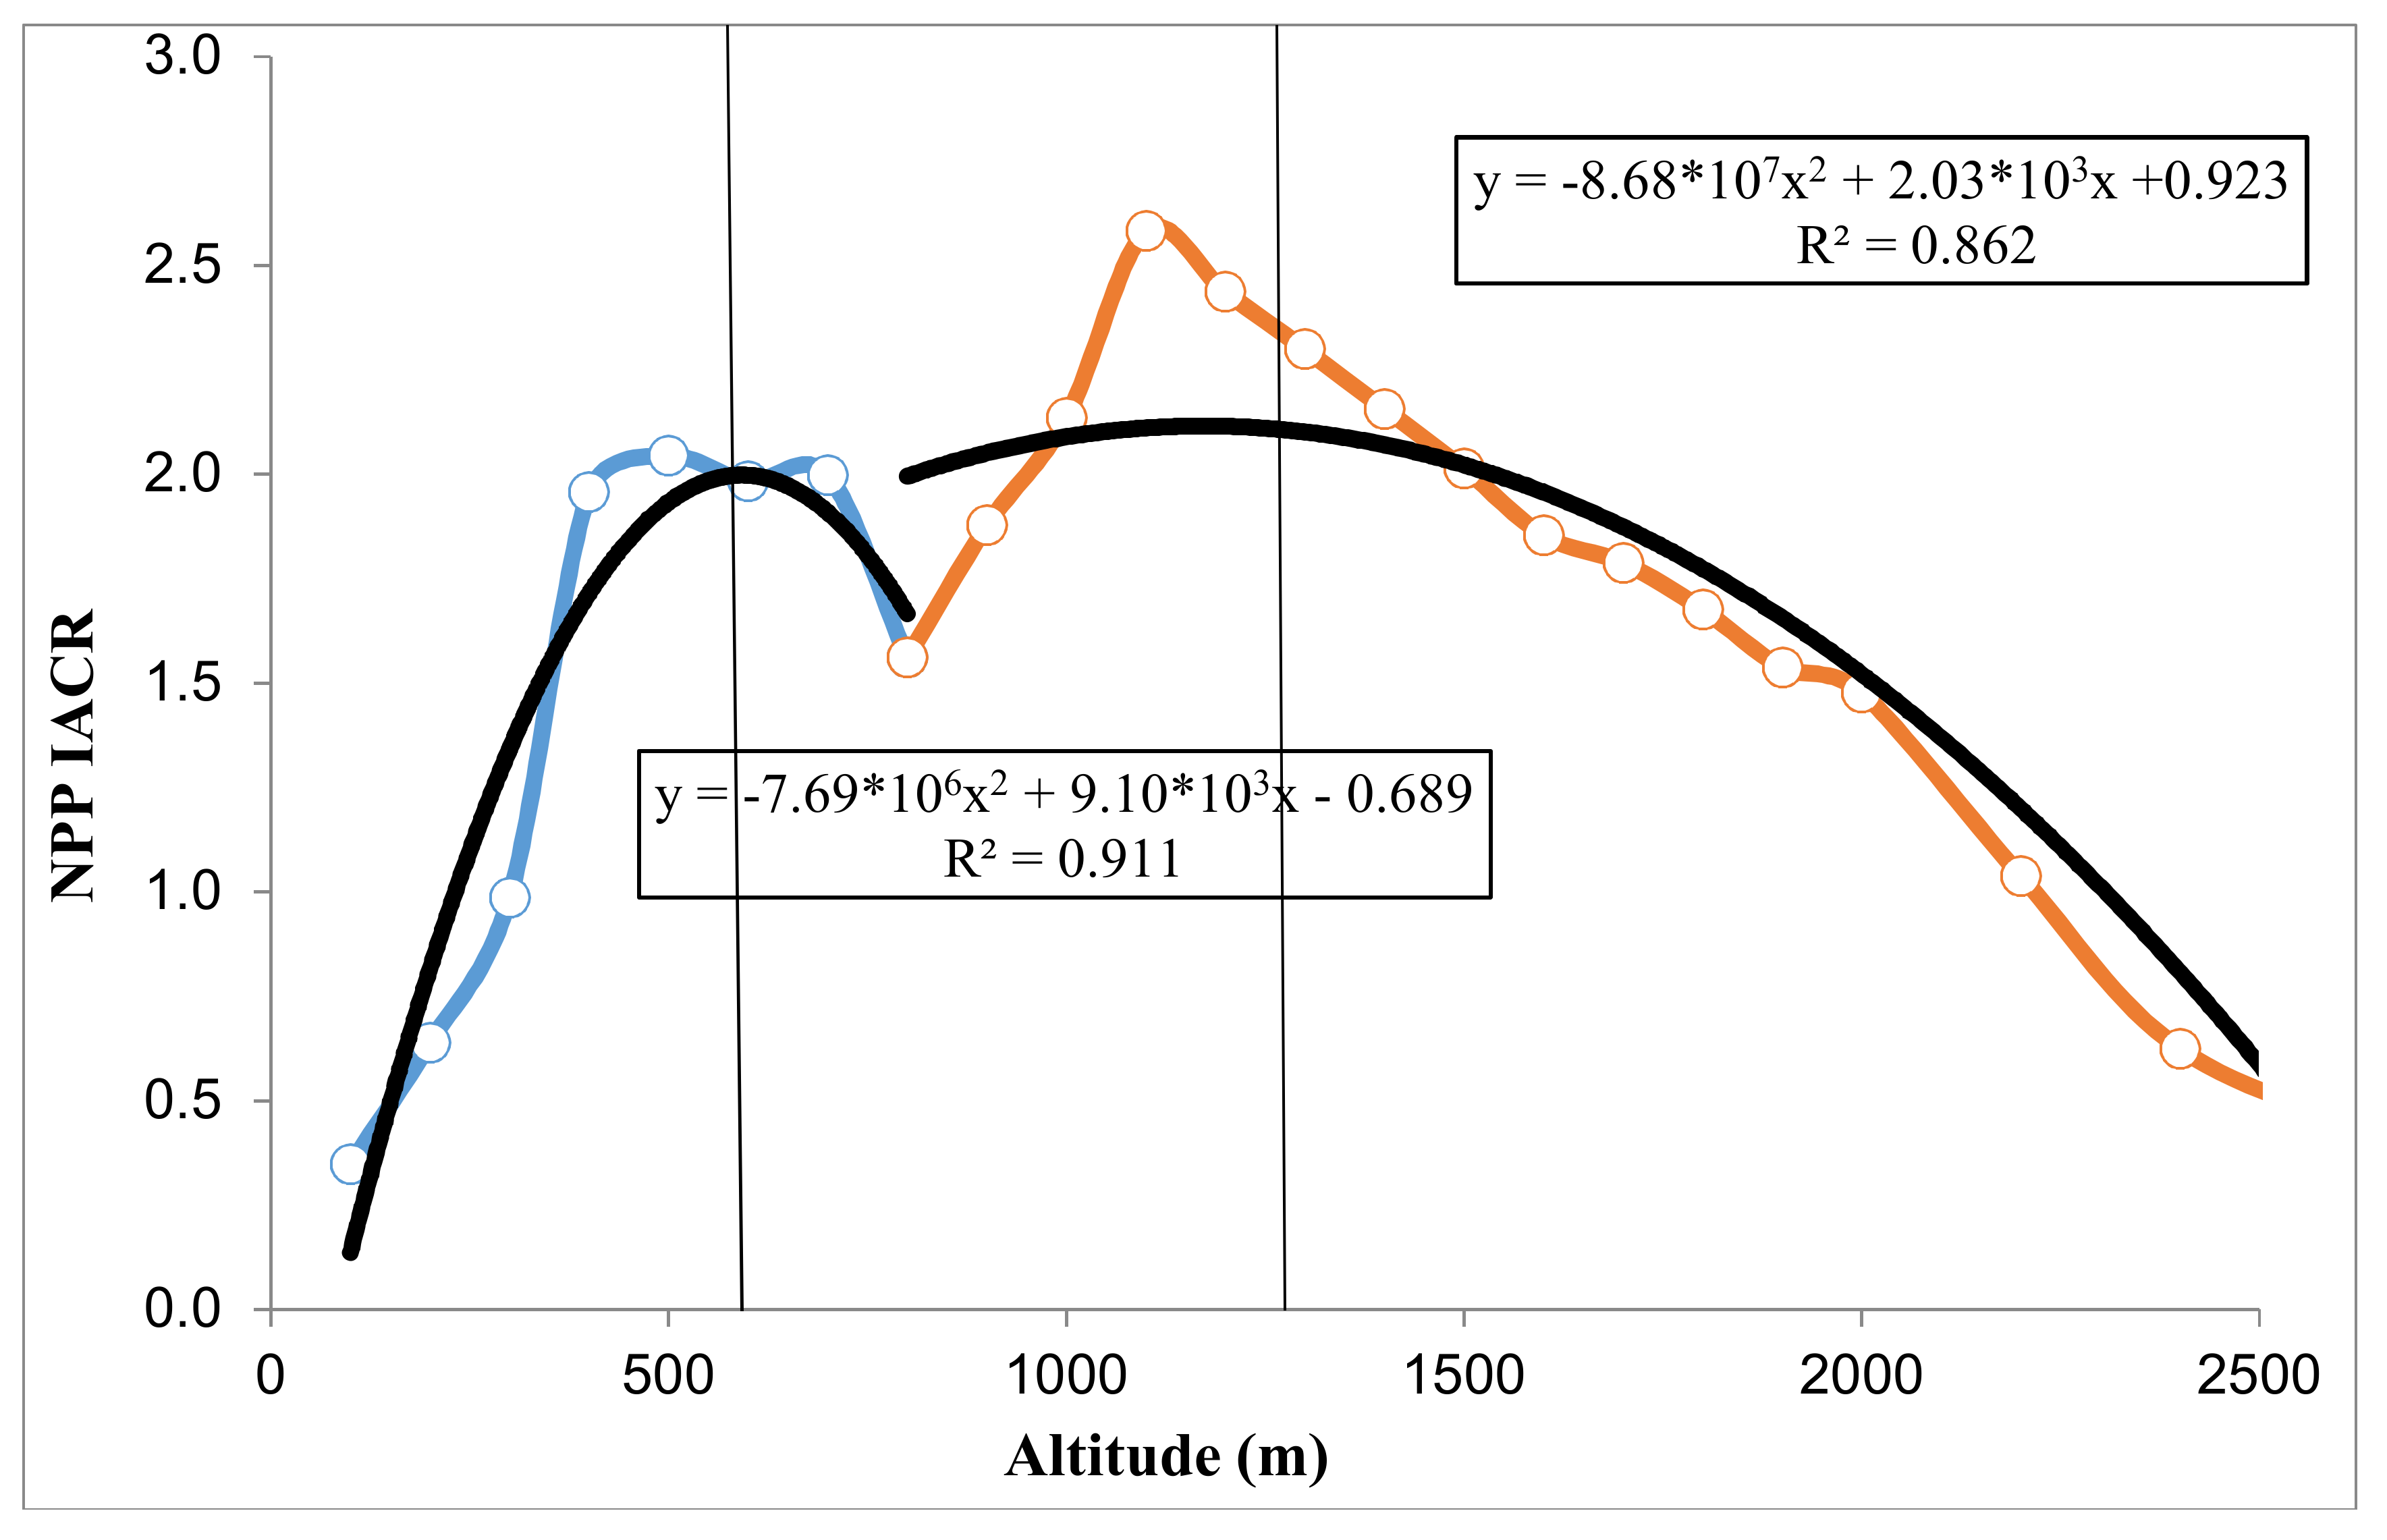
Figure 3 shows the inter-annual rate of change of NPP, which has 2 obvious peaks across the vertical gradient. The inter-annual rate of change of NPP is divided into 2 segments along the vertical gradient, with quadratic polynomial function as the best goodness-of-fit (R2 > 0.8). The altitudes of the peaks of the fitted curves were 600 m and 1300 m. It showed that inter-annual rate of change of NPP in Taihang Mountain was largest at 600 m and 1300 m, much the same as the altitude. This suggested that vegetation NPP were different in characteristics at the 600 m and 1300 m altitudes.
5.1.3. Water Yield
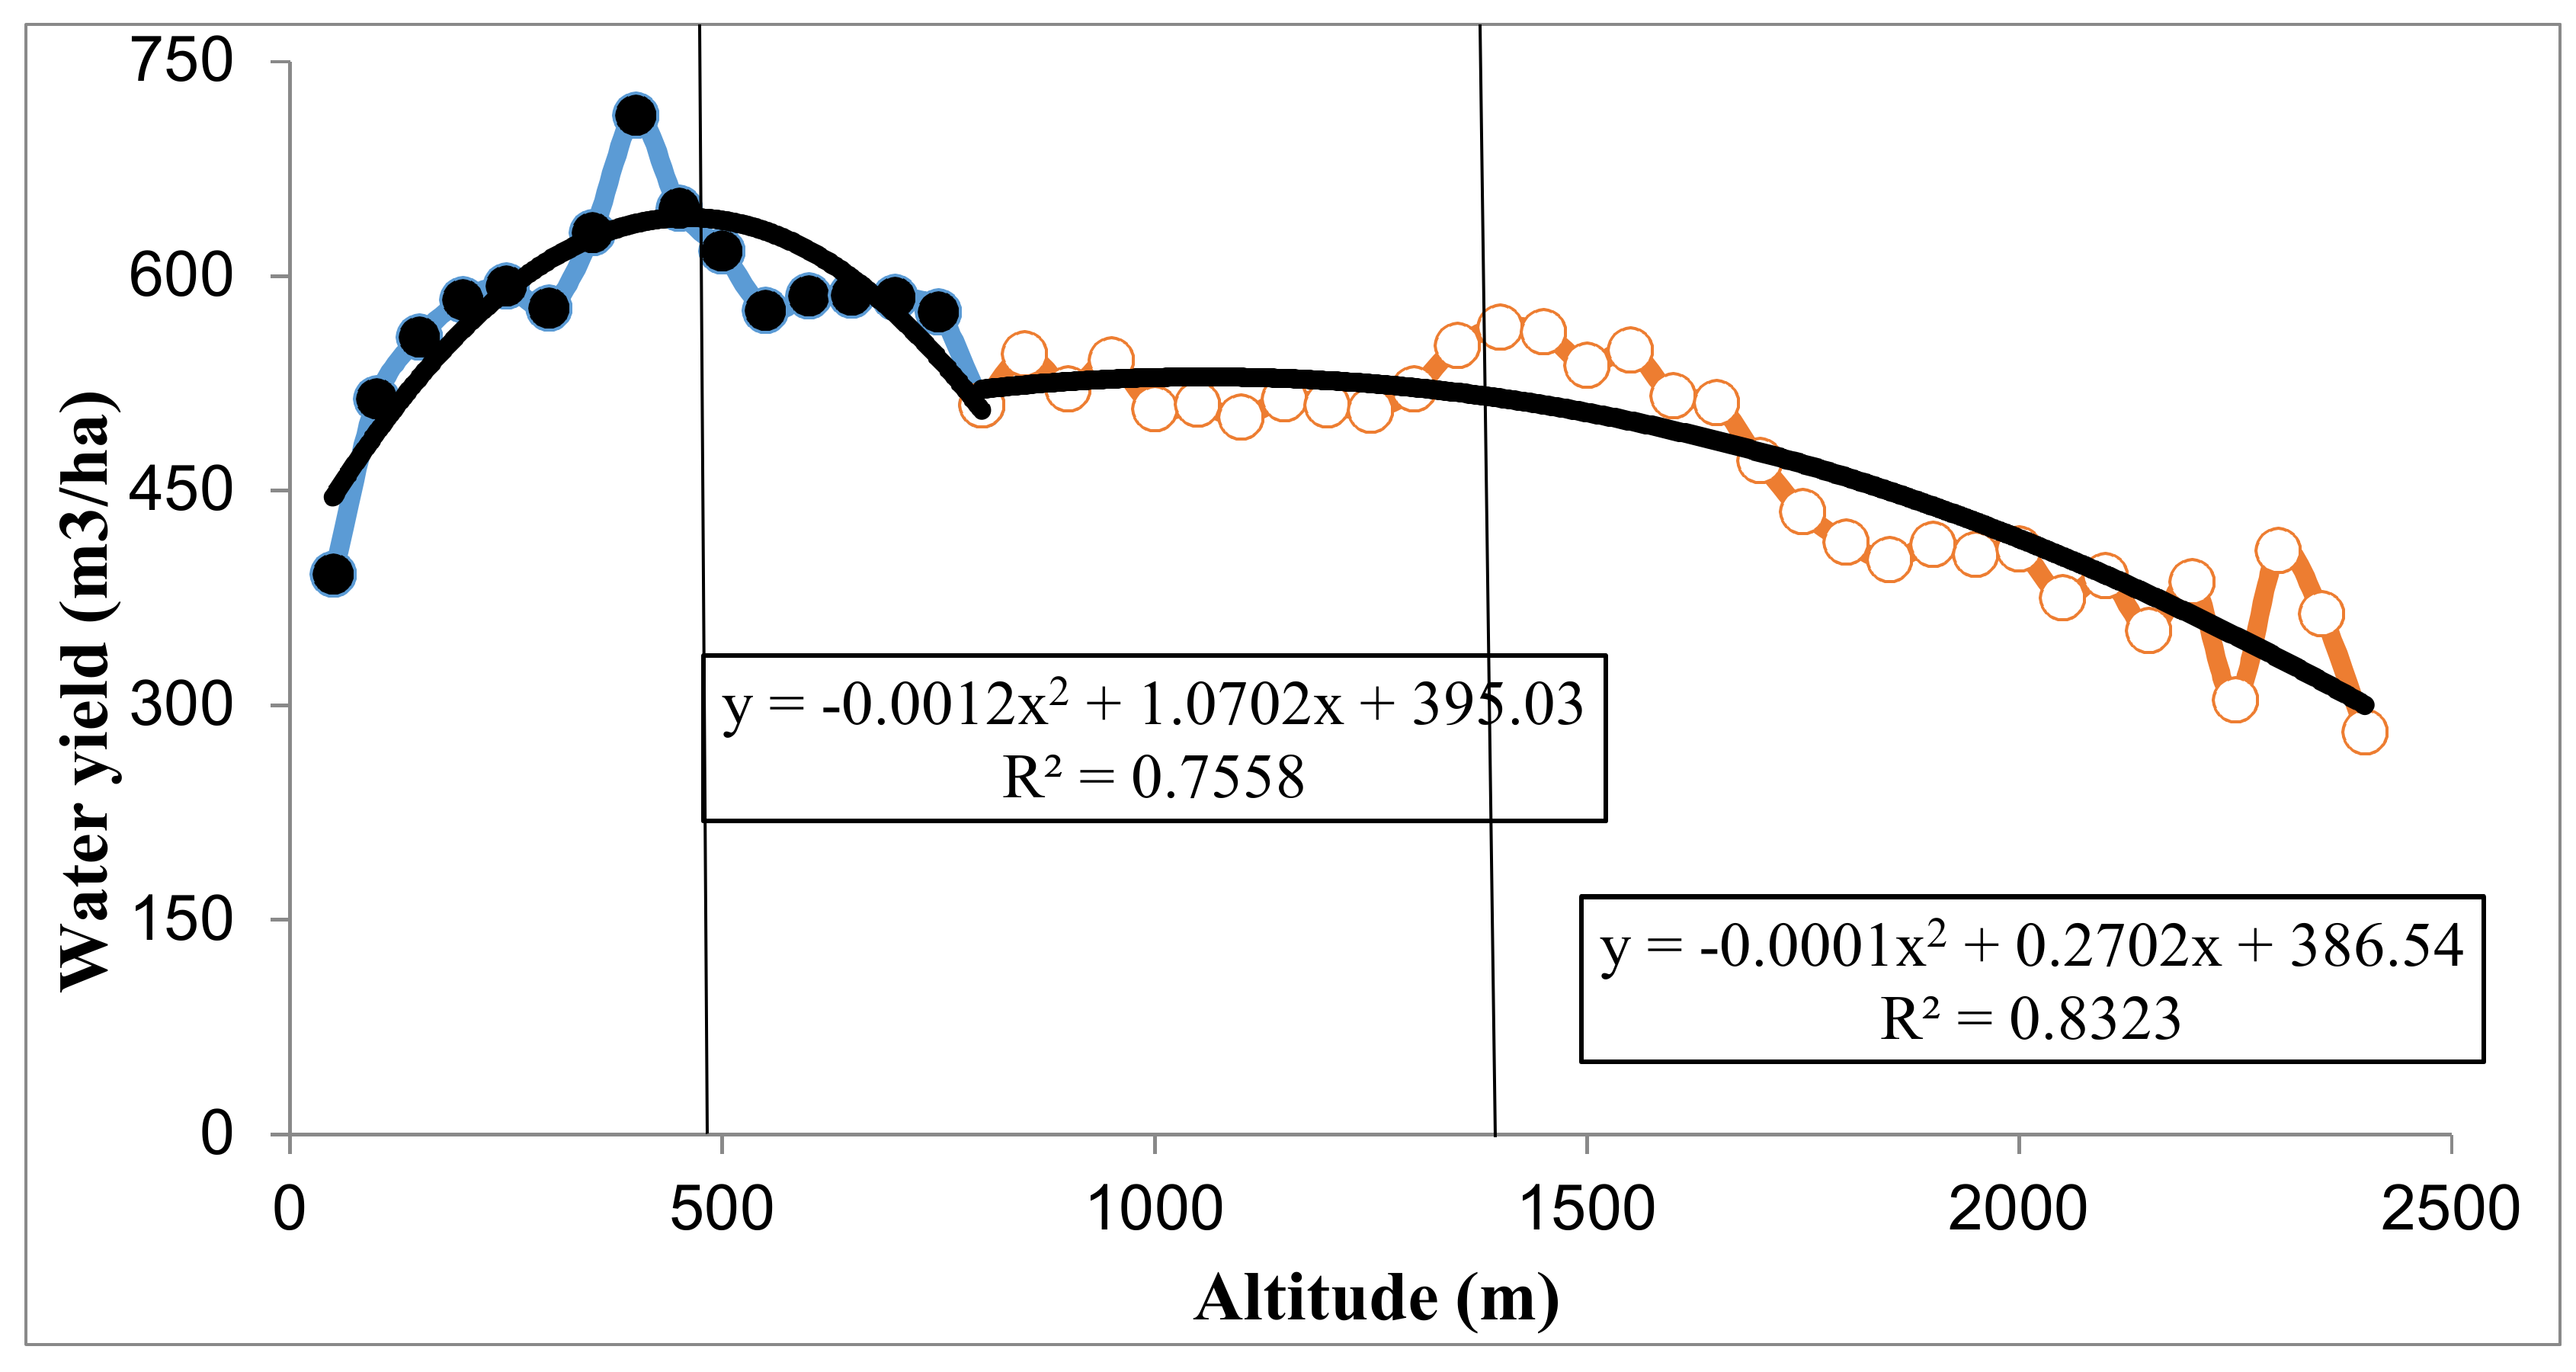
Figure 4 shows 2 obvious peaks of water yield along the vertical gradient. The water yield was divided into 2 segments along the vertical gradient, of which quadratic polynomial function had the best goodness-of-fit (R2 ≈ 0.8). The altitude values of the peaks were 500 m and 1400 m, suggesting that water yield was largest at those altitudes. This implied that the 500 m and 1400 m altitudes were the critical lines of vertical differentiation for water yield in Taihang Mountain.
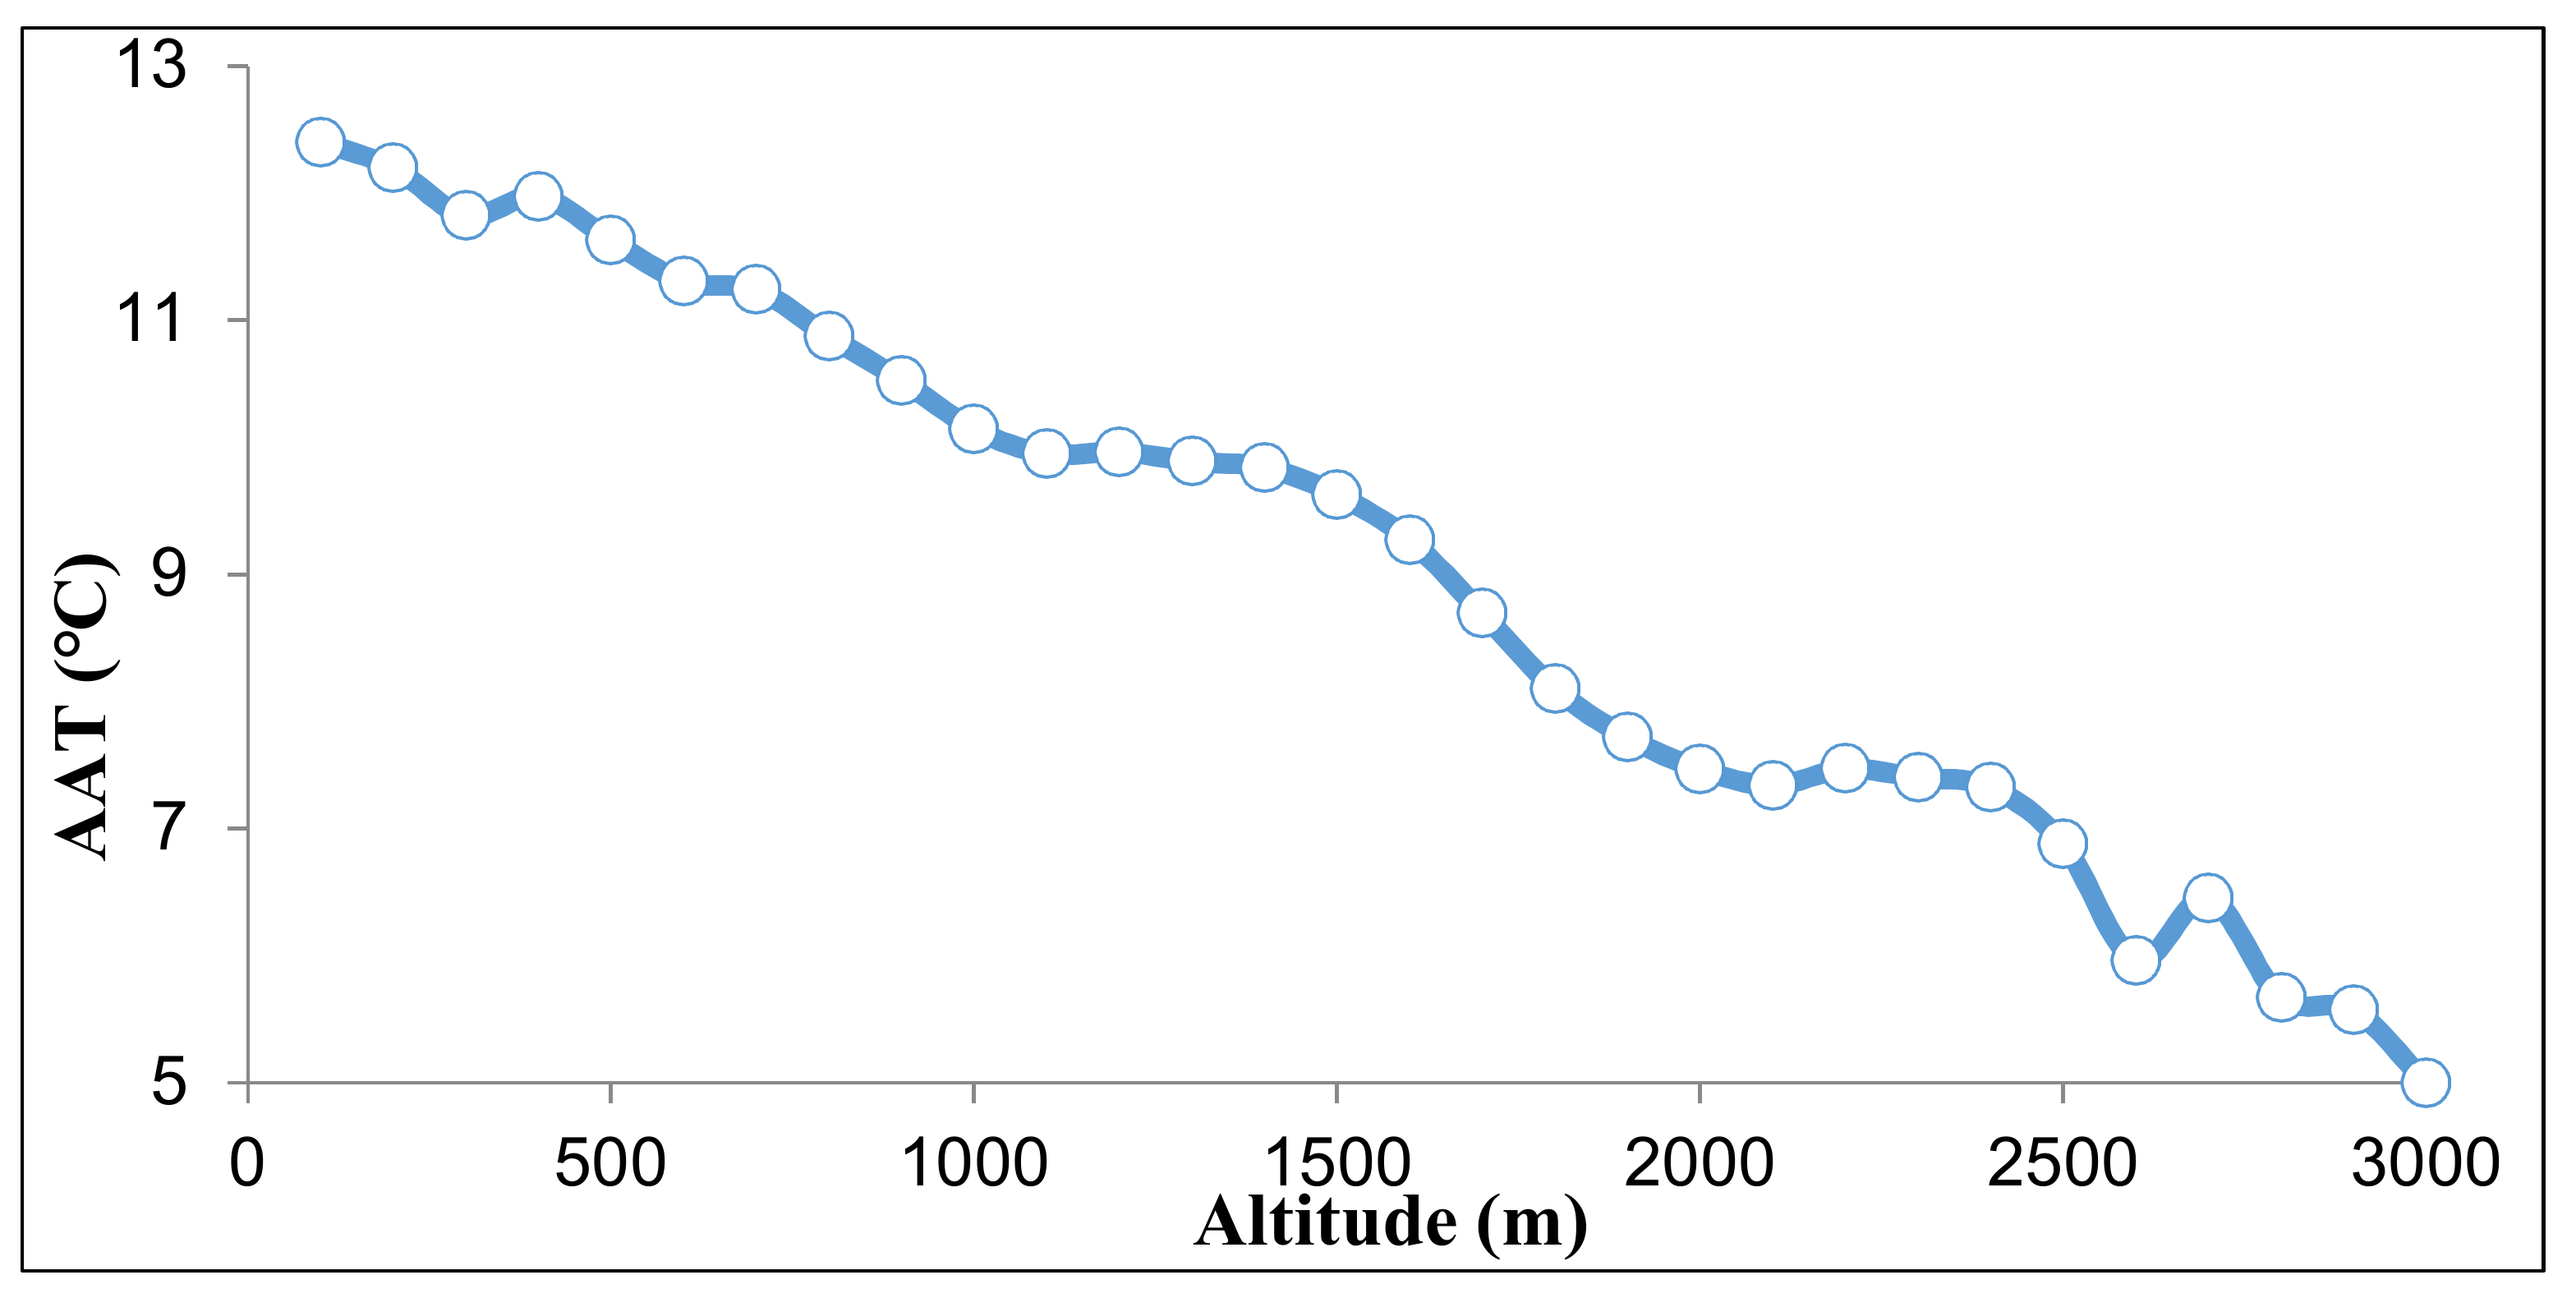
5.1.4. Average Annual Temperature
The long-term average annual temperature in Taihang Mountain was about 10 °C, which steadily declined with increasing altitude (Figure 5). Average annual temperature had no obvious difference in the vertical gradient. However, the temperature is an indispensable element of the ecological system, so it is indispensable in the determination of the vertical differentiation of the ecological system in the Taihang Mountain.
5.2. Critical Line/Zone Delineation
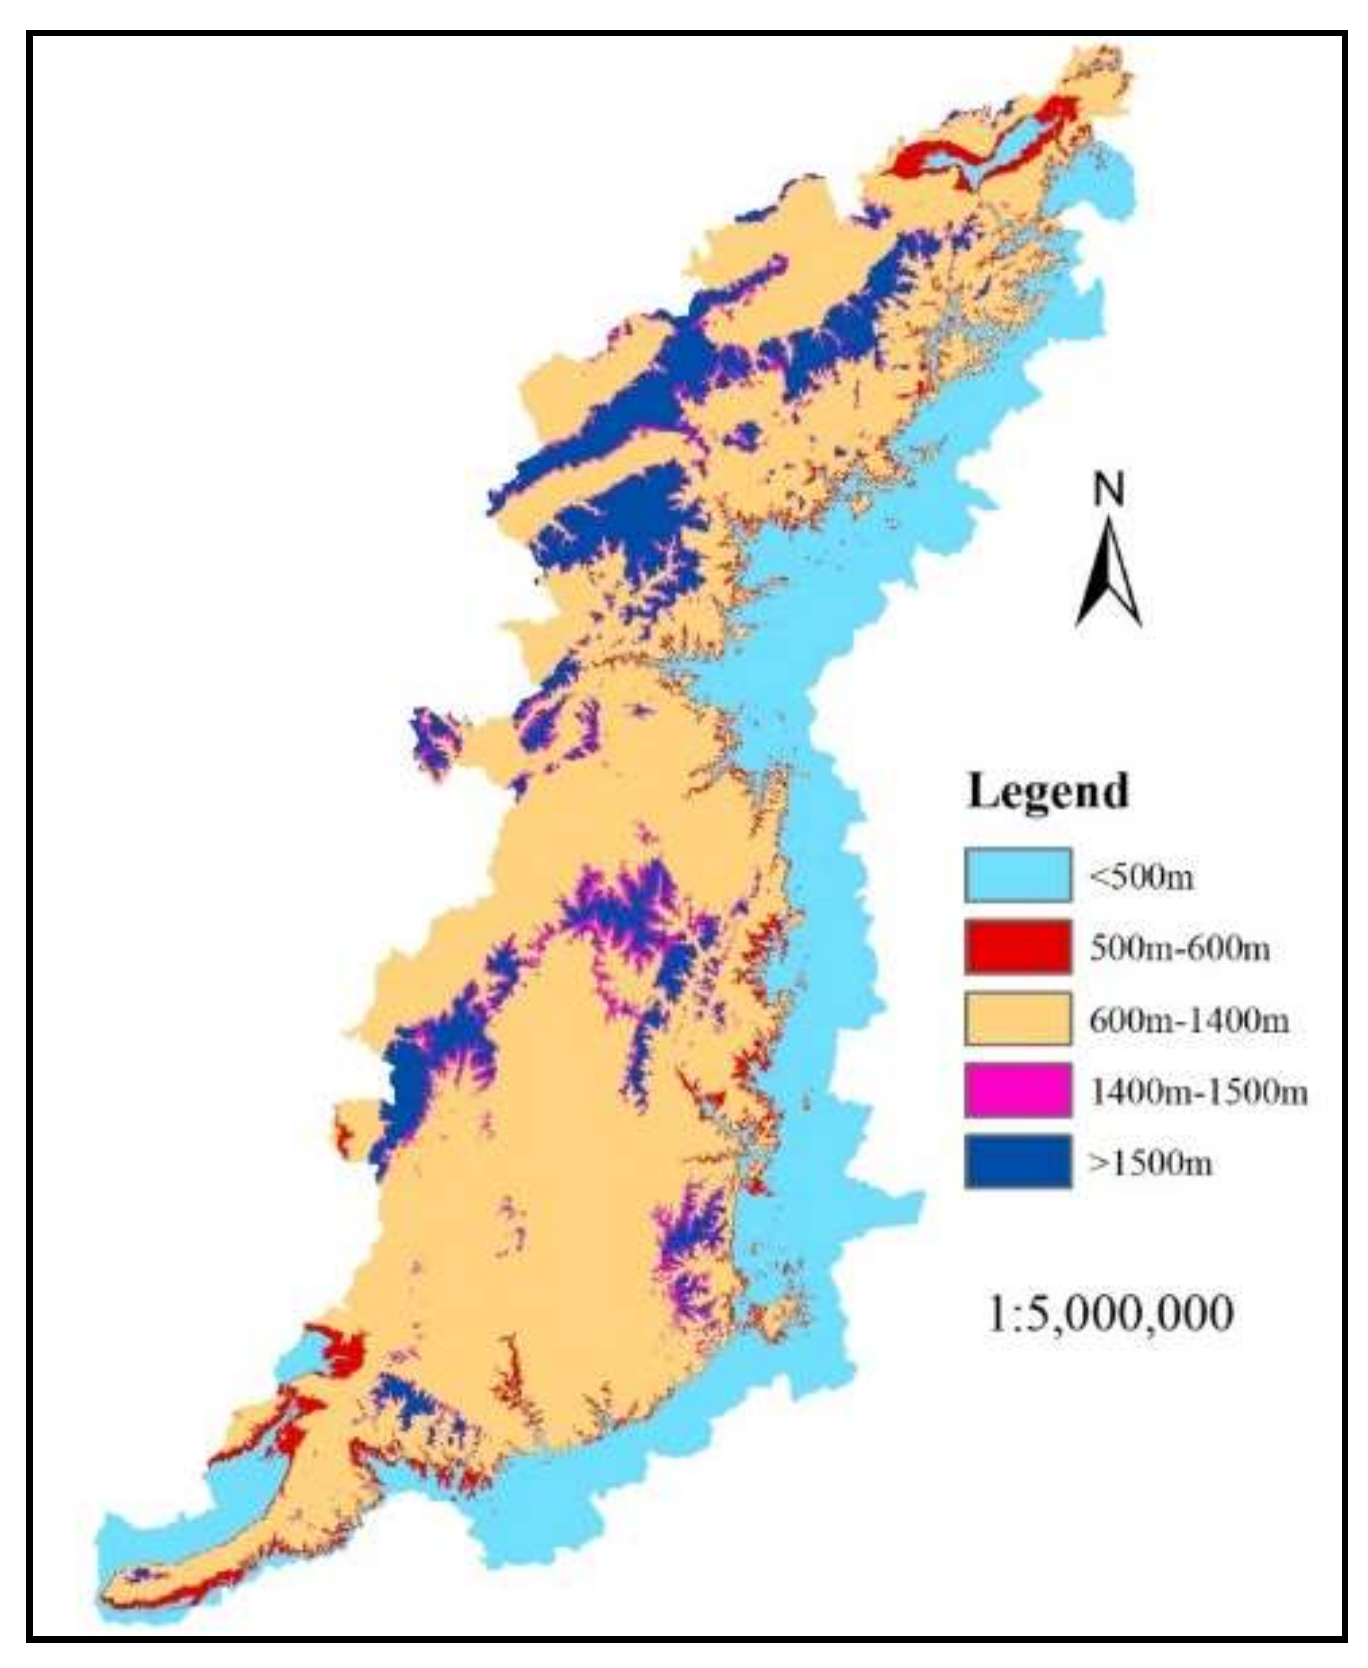
Each element of the ecosystem has a critical line of vertical differentiation that is generally unique. Using the weighted method for each element of the ecosystem, 2 critical lines (567 m and 1433 m) were obtained for Taihang Mountain. The critical zones of vertical differentiation of the Taihang Mountain ecosystem were 567 ± 50 m and 1433 ± 50 m. This yielded the 500–600 m and 1400–1500 m zones since most of the ecological elements were based on the 100 m statistical unit. The area of the 2 critical zones accounted for some 9.07% of the total area of Taihang Mountain. The 500–600 m critical zone accounted for 4.85% and the 1400–1500 m critical zone for 4.22%. The 500–600 m zone occurred mainly in the east, running in the north-south direction of the study area. Then the 1400–1500 m zone was scattered in the central and western regions of Taihang Mountain (Figure 6).
The area ratios of farmland, forest and grassland were respectively 39.62%, 23.60% and 28.65% in the 500–600 m zone and 10.95%, 56.30% and 31.71% in the 1400–1500 m zone. Hence there were 2 distinct critical zones of ecosystem structure in the study area. The vegetation NPP in the 500–600 m zone was 302.8 gC·m−2·a−1, which was close to that of farmland NPP. The vegetation NPP in the 1400–1500 m zone was 266.8 gC·m−2·a−1, which also was close to that of forest NPP. The corresponding average annual temperatures were 11.3 °C and 9.6 °C, respectively. Taihang Mountain was divided into 3 ecosystem type zones based on the 2 critical lines (500–600 m and 1400–1500 m) of vertical differentiation, which were the sub-alpine zone (>1500 m), the mid-mountain zone (600–1400 m) and the hilly zone (<500 m).
5.3. Vertical Differentiation of Ecosystem Services
5.3.1. Ecosystem Services by Vertical Gradient
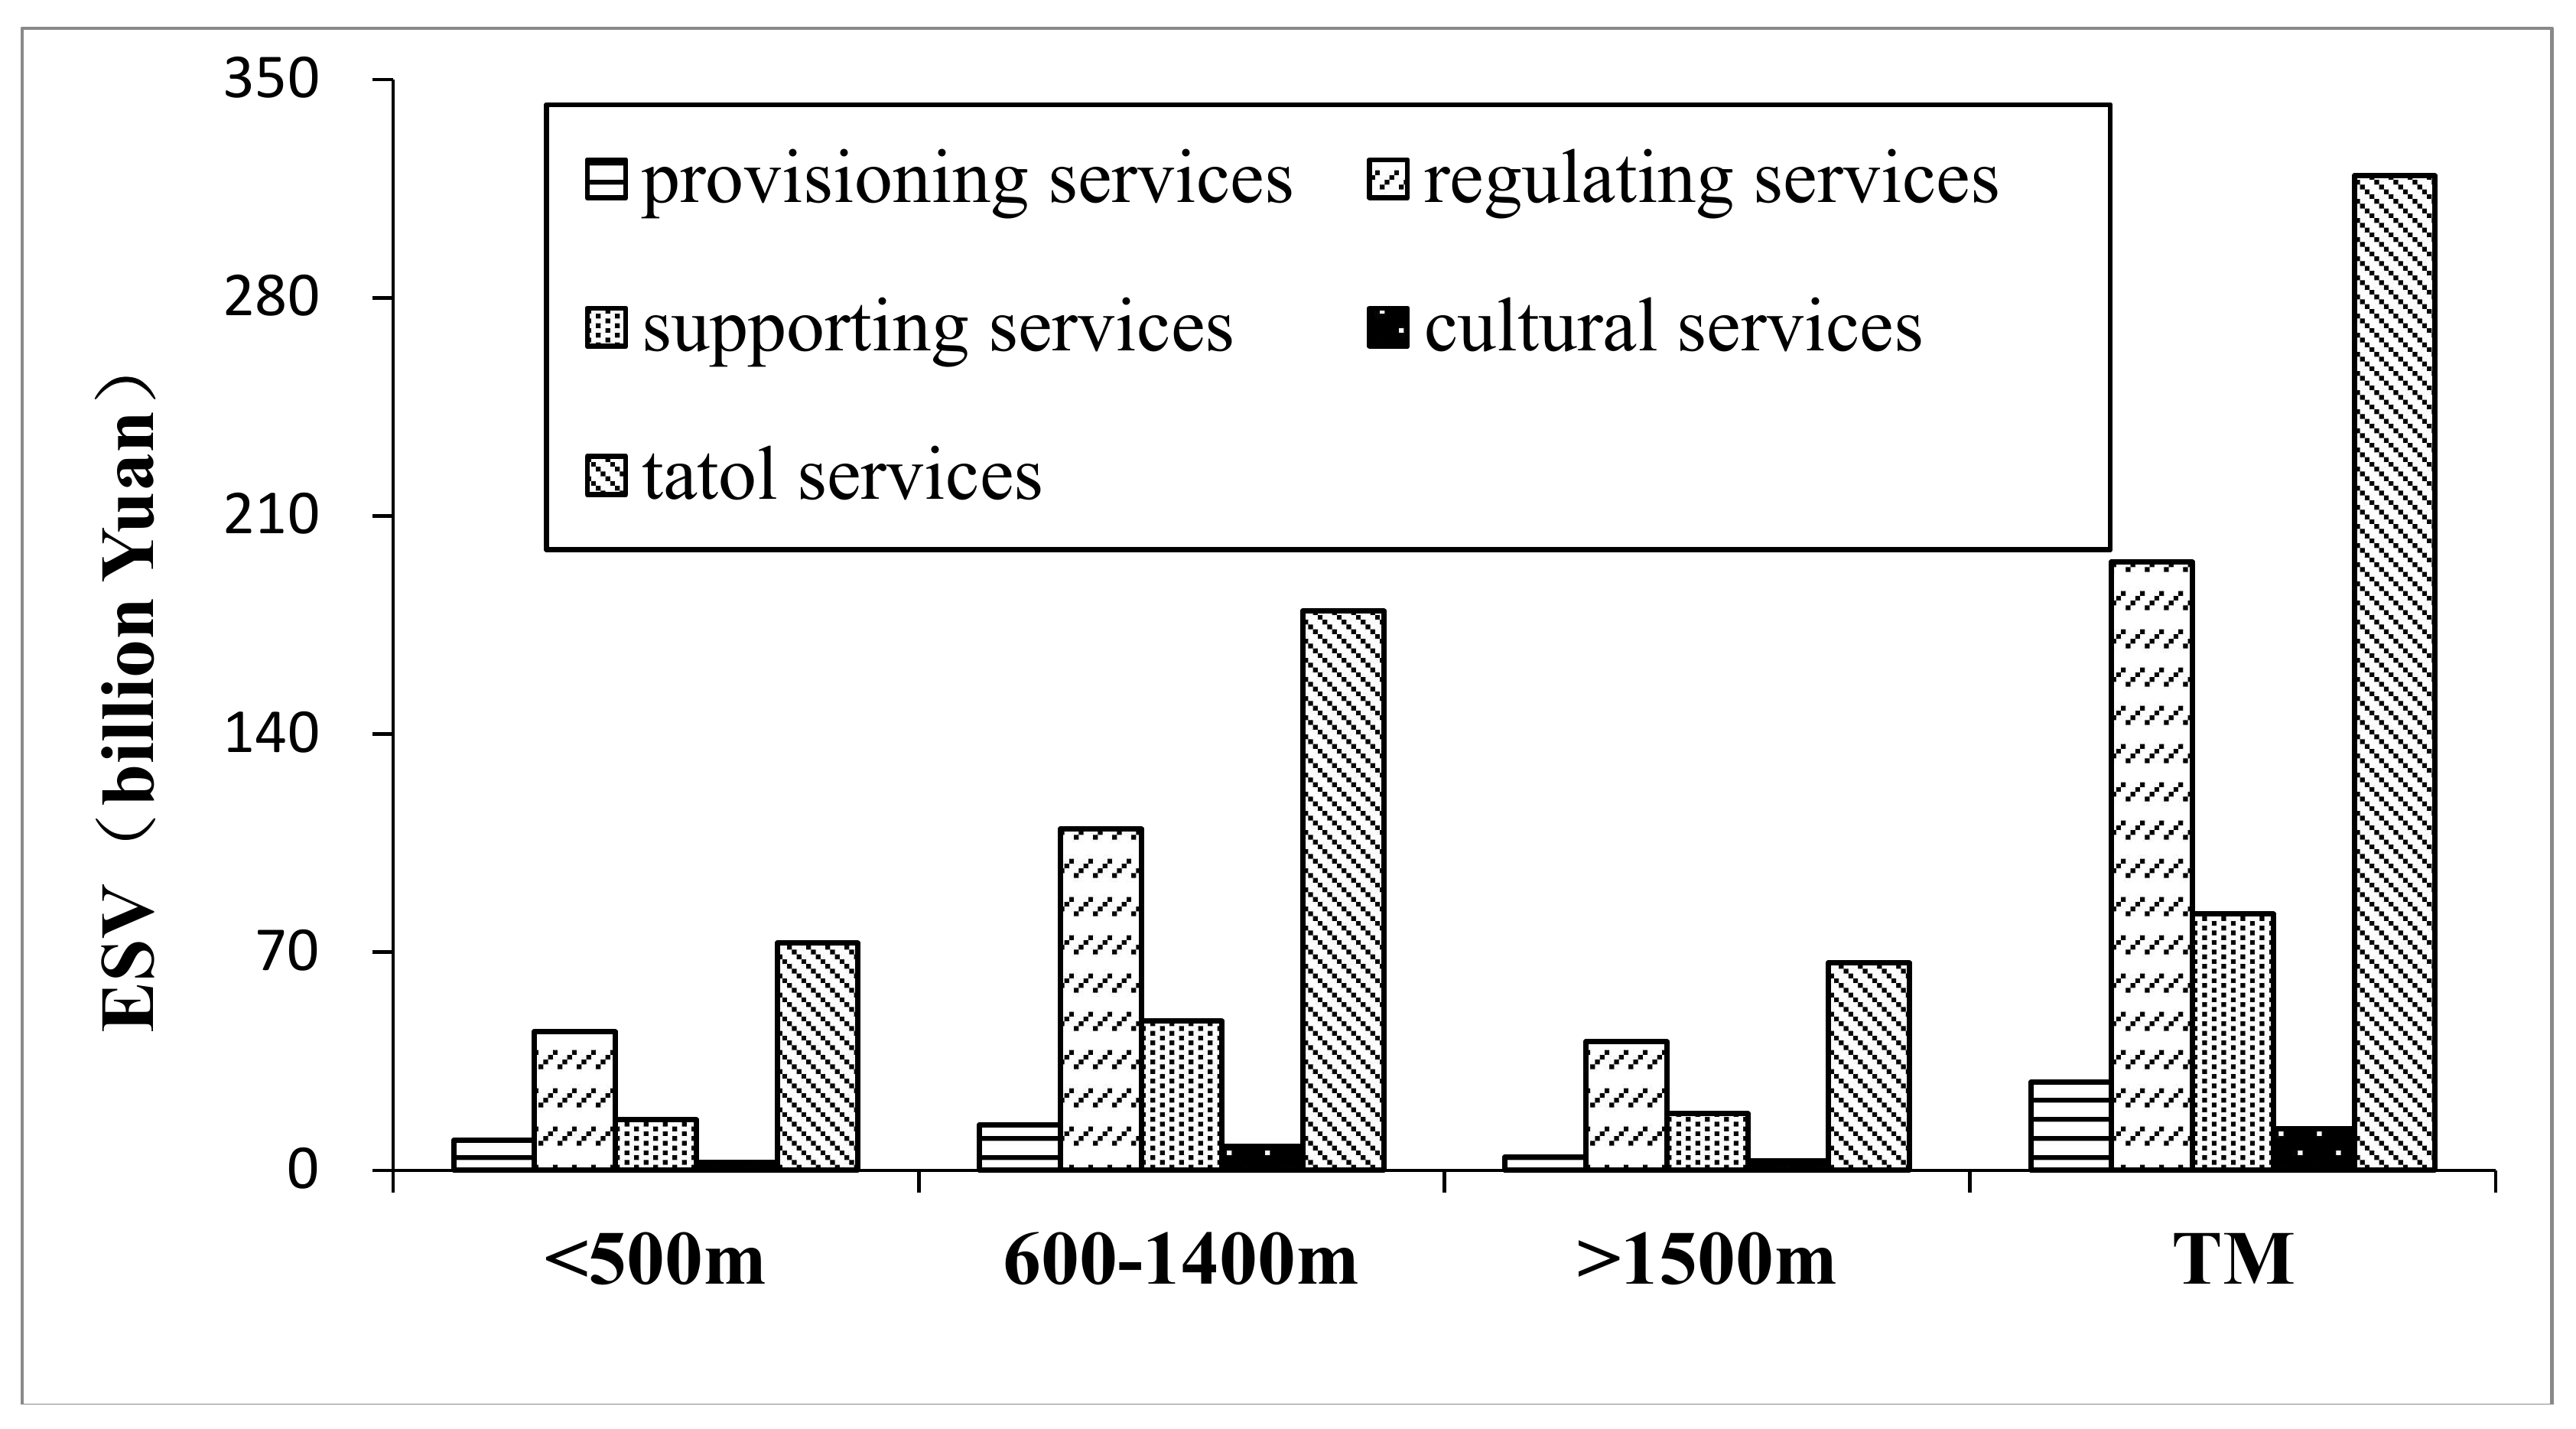
The total value of ecosystem services in Taihang Mountain was 319 billion Yuan. The values of provisioning services, regulating services, supporting services and cultural services were 28.4, 195.3, 82.3 and 13.2 billion Yuan, respectively. The values of ecosystem services were 72.9 billion Yuan in hilly area, 179.6 billion Yuan in mid-mountain zone and 66.7 billion Yuan in sub-alpine zone. The values of the 4 types of ecosystem services had the same trend order for the 3 zones: regulating services > supporting services > provisioning services > cultural services (Figure 7).
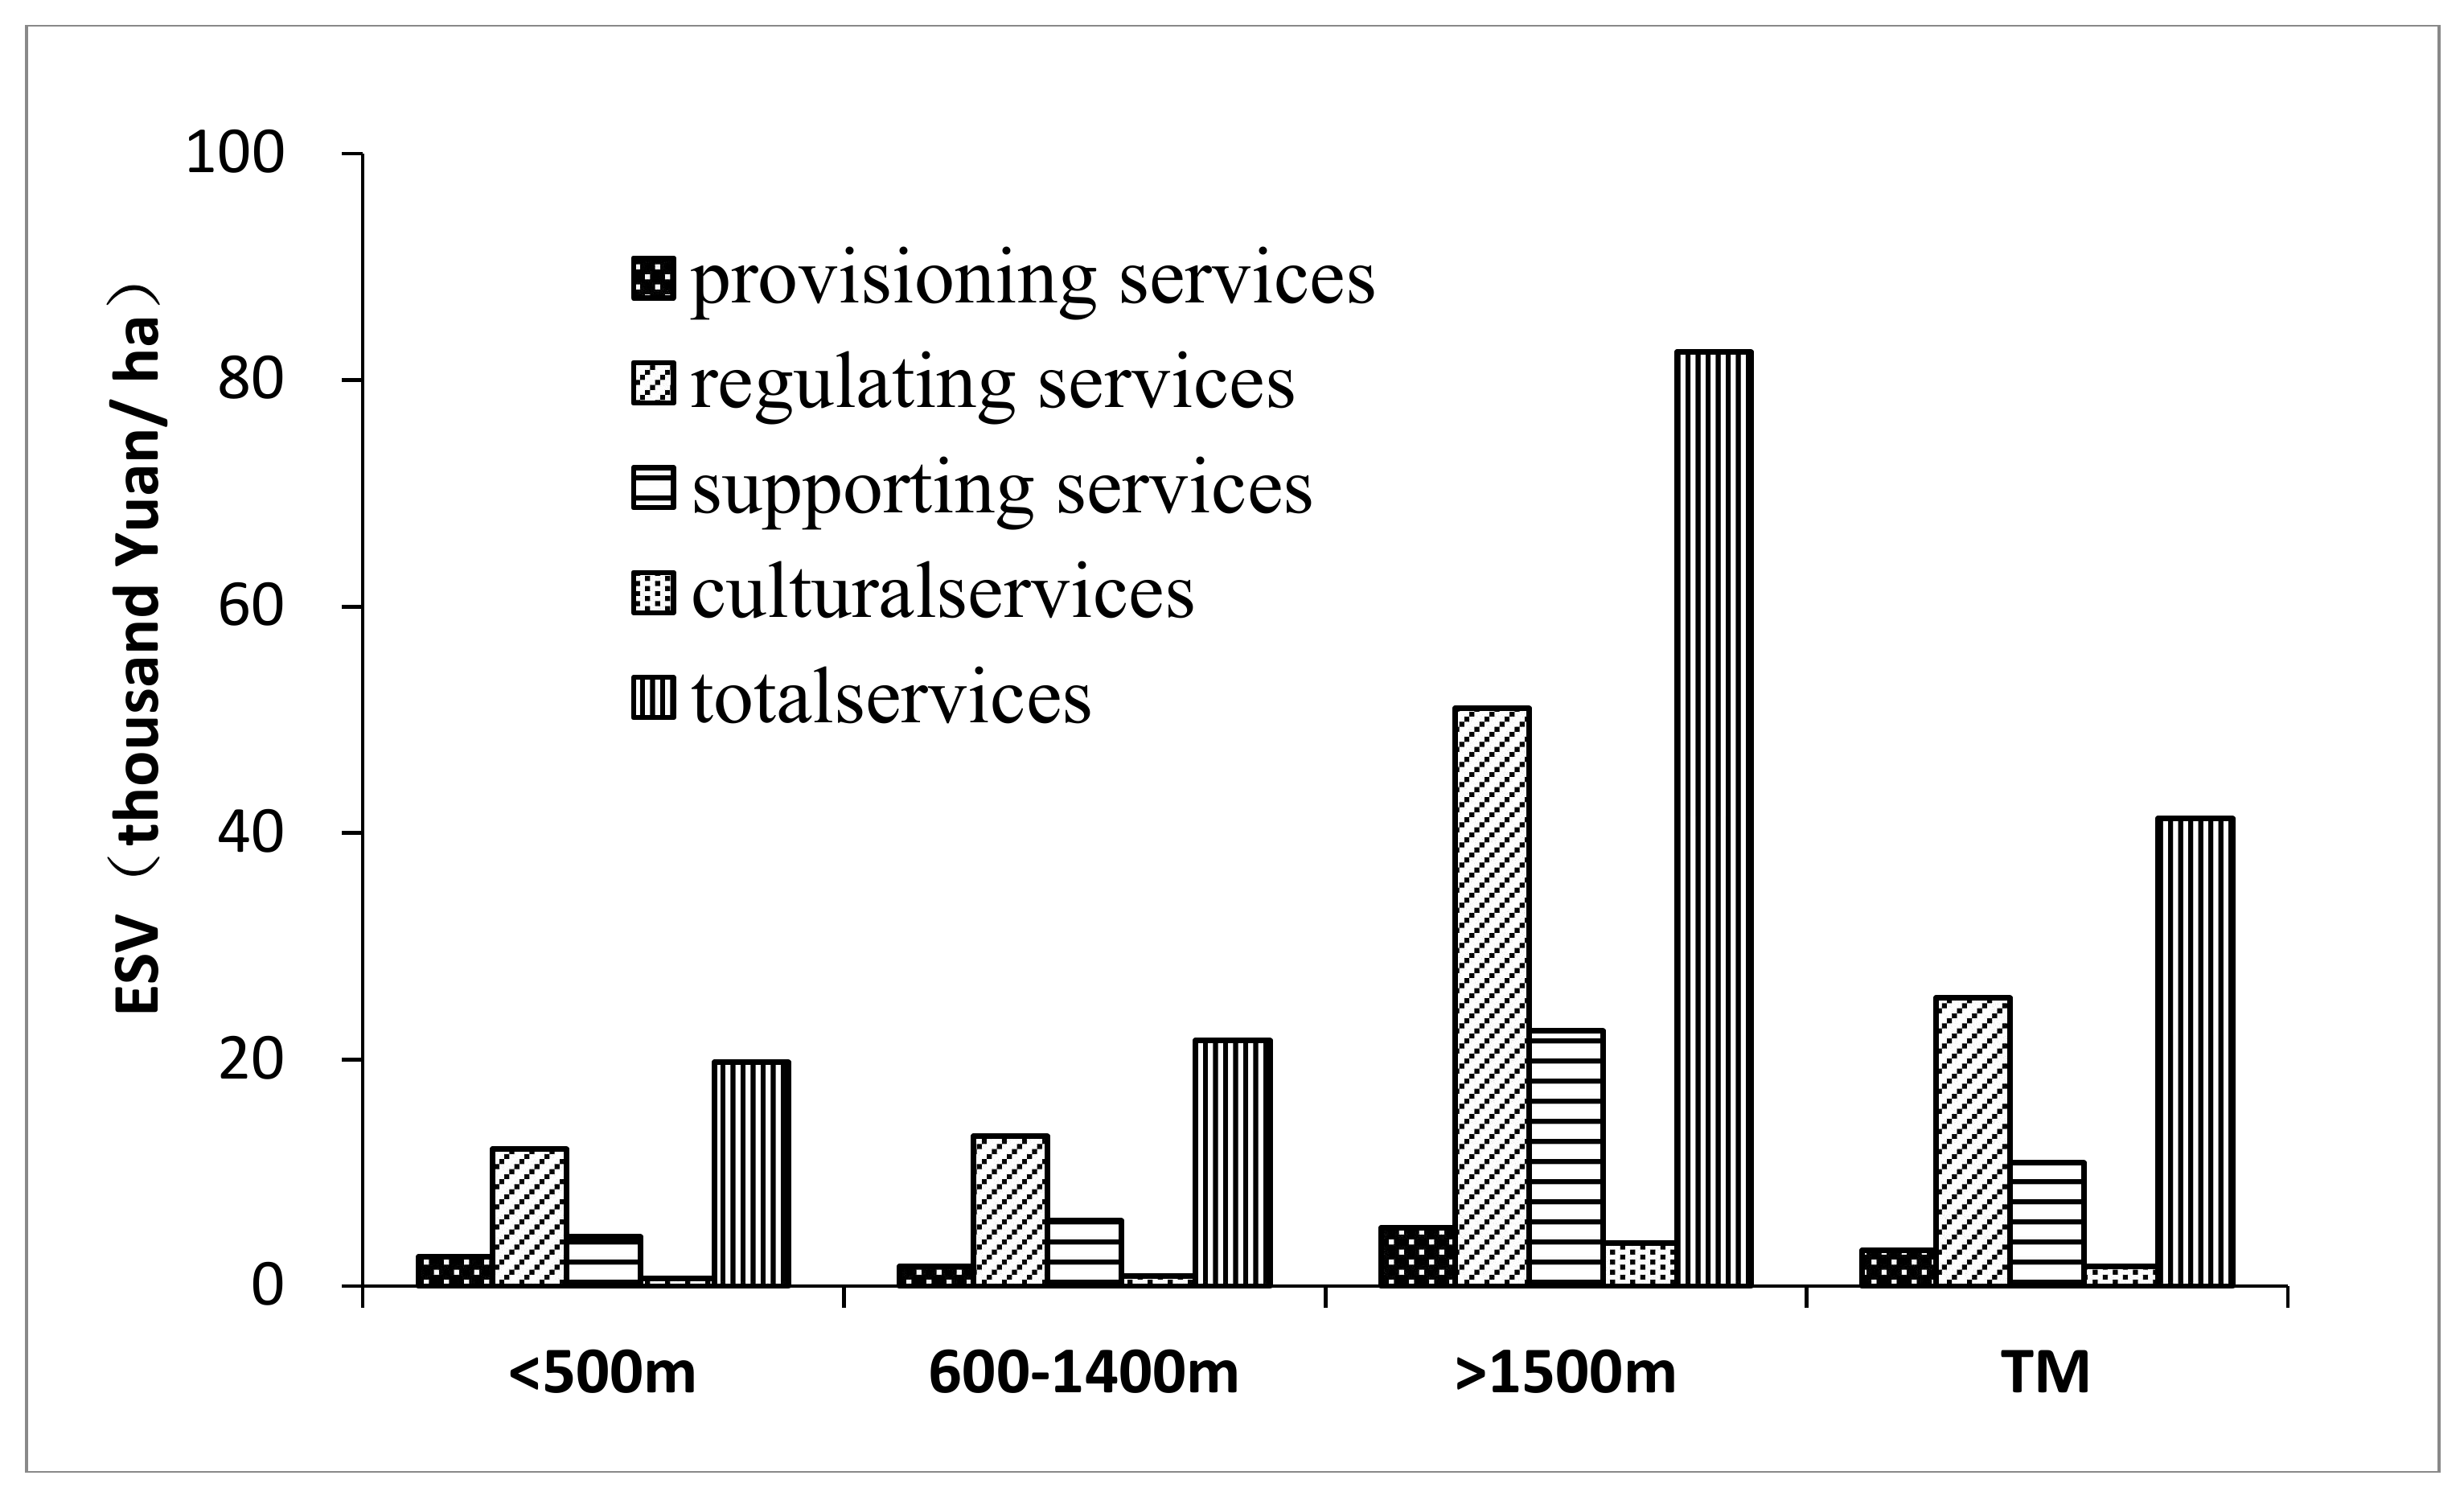
The money values of ecosystem services per unit area (ha) in the hilly zone, mid-mountain zone and sub-alpine zone were 19,788, 21,706 and 82,502 Yuan, respectively. The values of the 4 types of ecosystem services per unit area were similar in trend for all the 3 zones—regulating services > supporting services > provisioning services > cultural services (Figure 8).
The highest value of ecosystem services was for the mid-mountain zone, followed by the hilly zone and was lowest for the sub-alpine zone. This is because the area under the mid-mountain zone was larger than that under the hilly zone, which was in turn larger than that under sub-alpine zone. The order of the value of ecosystem services per unit area for sub-alpine zone was higher than that for the mid-mountain zone, which was in turn higher than that for the hilly zone. This is because the area ratio of forest increased with increasing altitude, and the area ratio of grassland also increased with increasing altitude (Figure 2), ecosystem services values per unit area of forest and grassland (except for water and wetland) were generally high.
5.3.2. Ecosystem Services Functional Pattern
In the hilly zone, the functional index for provisioning service was highest, about twice of any of the other functional indices. Thus, provisioning service was the main ecosystem service function in this zone. The indices of the 4 ecosystem service functions were all close to 0.5 for the mid-mountain zone, indicating that the 4 service functions were balanced in that zone. The functional index of provisioning services was less than 2 and those for the other 3 services were greater than 2. This suggested that in addition to provisioning service function, the other 3 services were the main service functions in the sub-alpine zone (Table 2). In other words, the functional pattern of ecosystem services in Taihang Mountain was such that it started with provisioning services being the main service function transformed into four service functions being balanced, then into regulating, supporting and cultural services being main service function with the increase of altitude.
The value of provisioning service per unit area of farmland was highest (in terms of percentage), with the area ratio of farmland also highest. Thus, the functional index of service provision was highest for hilly zone. In the mid-mountain zone, the indices of the 4 service functions were very close. This is because the area ratios of the main land use types (e.g., farmland, forest, and grassland) were roughly the same (about 30%). The value of provisioning service per unit area of farmland was highest in terms of percentage. However, as the area ratio of farmland was small, the functional index of ecosystem was smallest for sub-alpine zone. The values of regulating services per unit area of forest and grassland were high (in terms of percentage), meanwhile, as the area ratios of forest and grassland were high, so the functional index of regulating services was highest for the sub-alpine zone. The same was true for the functional index of supporting services.
6. Discussion
6.1. Human Activities Influencing Ecosystem Vertical Differentiation
Since the 1980s, “Taihang Mountain Greening Project” and “Returning Farmland to Forest and Grassland” projects have been implemented in Taihang Mountain. Some of the cultivated lands in the high-altitude area have become grassland or forest. The population in the high-altitude area have migrated to low elevation area because of social and economic development and grazing ban in the mountain area [27]. As these management measures and government policies influence land use in Taihang Mountain, a reasonable management mode is critical for sustainable land use in the area.
From Figure 3, inter-annual rate of change of NPP in Taihang Mountain was greater than 0, indicating that vegetation NPP has increased in recent years. Human factors were the dominant factors for the change in vegetation NPP because human activity was strong in low altitude areas of Taihang Mountain. The change in NPP in high altitude area was mainly driven by natural factors [27]. To enhance vegetation NPP in the region, a sustainable ecosystem optimization model was suggested for the low altitude area under which human activities can improve vegetation conditions. Nature reserve management was implemented in the high altitude area so that the inhibiting effect of human activities on vegetation can be avoided.
The recovery of vegetation reduced the amount of water yield and the amount of water yield increased with decreasing forestland area [28]. With increasing elevation in Taihang Mountain, forest area increased, and remarkable results have been achieved in vegetation restoration. This suggested that water yield in Taihang Mountain decreased with increasing altitude. Taihang Mountain provides fresh water resources for the Beijing-Tianjin-Hebei region. The recovery of vegetation means less freshwater resources for the Beijing-Tianjin-Hebei region. Therefore, vegetation restoration cannot be blindly pursued considered the freshwater supply function in Taihang Mountain.
6.2. Ecosystem Service Management
Ecosystem service evaluation is increasingly used in recent years in environmental protection, policy making and social development. Ecosystem services form the basis for policy and decision-making [29,30] for sustainable development of the environment and the economy, demonstrated in the trade-off analysis [31,32]. There is significant interest in (water tower, biodiversity and leisure) tourism in mountain areas [33,34,35]. A pattern of service function and management mode was developed based on the evaluation of ecosystem services in mountain areas, which was a critical theoretical base for sustainable development in mountain areas.
In hilly zones of Taihang Mountain, residential population accounts for 66% of the total population. There was abundant land cultivation in the hilly zone of Taihang Mountain, meant to sustain daily livelihood. Ecosystem disservices due to land cultivation were also obvious in this zone, including reduced soil organic matter content [36,37], water pollution, low biodiversity [38] and groundwater depletion [39]. There was a conflict between large population and limited land cultivation in the hilly zone of Taihang Mountain. This was required for the realization of high yield in sloping lands, but also for the protection of the environment and the control of the disservices. Agroforestry puts trees and shrubs into agricultural ecosystems after social, economic, and ecological considerations. This provided services to society and also guaranteed sustainable production of natural resources [40,41,42]. Thus, there was the need to develop agroforestry in the hilly zone of Taihang Mountain. There was also the need to develop the best mode of combination of agriculture and forestry to ensure provisioning services while concurrently ensuring sustainable development of the ecosystem.
The set of suitable development modes was based on land contraction in the mid-mountain zone of Taihang Mountain. This included setting the base planting forsythia suspensa of which the area is 667 ha in Jingxing County, modern agricultural industrial park in Pingshan County and a combined mode of agriculture, forestry, and livestock in Wuan County. In the early stage of development and utilization, there was soil disturbance and change in soil microbial community [43]. Also land use change led to changes in hydrological processes [44], seen in the reduction of total soil phosphorus due to afforestation [45], soil organic matter reduction due to deforestation [46] and increased soil erosion due to low vegetation cover [47]. To have sustainable pattern of development and utilization, there was the need to leave the soil as it was, increase vegetation cover, eliminate disservices of the ecosystem, increase service provision, grow economic development, and strengthen environmental protection.
Forest and grassland were the main land use types in the sub-alpine zone. The main ecosystem services of forest and grassland included the regulation of climate and hydrology, soil conservation and nutrient cycling [48,49,50]. Nature reserves should be established to protect forests and grasslands in the sub-alpine zone in Taihang Mountain, which could also promote tourism and enhance cultural services in the region.
7. Conclusions
The Taihang Mountain region was divided into 3 ecological zones (sub-alpine zone: >1500 m; mid-mountain zone: 600–1400 m; and hilly zone: <500 m) based on the 2 critical lines of vertical differentiation (500–600 m and 1400–1500 m). The functional pattern of ecosystem services with increasing altitude in Taihang Mountain was such that it started with provisioning services being the main service function transformed into four service functions being balanced, then into regulating, supporting and cultural services being the main service function with the increase of altitude. A sustainable development model and target ecosystem regulation service management were determined. The sub-alpine zone was a managed ecosystem services overflow region where there was non-provision of services. The mid-mountain zone was a balanced ecosystem services region where all 4 services had equal roles in the development of ecosystem service overflow corridor and there was enhanced service provision via artificial control. Then the hilly zone was mainly a provisioning service region with leading ecosystem service process control and adjustment. It laid the theoretical basis for the development of land use policy and government decision-making for sustainable development in Taihang Mountain. To develop quantitative models for sustainable development, further research and analysis is needed to choose typical study areas in the hilly zone, mid-mountain zone and sub-alpine zone.
Acknowledgments
This research was supported by the National Key Basic Research Program of China (No. 2015CB452705). The land use date was provided by the program team.
Author Contributions
Hui Gao and Jintong Liu conceived and designed the paper; Tonggang Fu and Lipu Han analyzed the data; Hongzhu Liang contributed reagents/materials/analysis tools; and Hui Gao wrote the paper.
Conflicts of Interest
The authors declare no conflict of interest.
Appendix A

Table A1.
The precision verification data of land use classification of Taihang Mountain, China.
| Type | Forest | Farmland | Construction Land | Grassland | Water | Others |
|---|---|---|---|---|---|---|
| forest | 689 | 9 | 3 | 27 | 6 | 1 |
| Farmland | 8 | 319 | 2 | 21 | 3 | 5 |
| Construction land | 0 | 1 | 266 | 0 | 1 | 1 |
| grassland | 3 | 1 | 2 | 201 | 1 | 1 |
| water | 1 | 0 | 0 | 1 | 98 | 0 |
| others | 2 | 0 | 2 | 1 | 1 | 2 |
| precision | 87.43% | 90.21% | 96.73% | 80.4% | 89% | 84% |
References
- Demg, W.; Tang, W. General directions and countermeasures for urbanization development in mountain areas of China. J. Mt. Sci. 2013, 31, 168–173. (In Chinese) [Google Scholar]
- Zhang, B.; Hongzhi, W.; Fei, X.; Xu, J.; Zhu, Y. Integration of Data on Chinese Mountains into a Digital Altitudinal Belt System. Mt. Res. Dev. 2006, 26, 163–171. [Google Scholar]
- Deng, W.; Xiong, Y.L.; Zhao, J.D.; Qiu, D.L.; Zhang, Z.Q.; Wen, A.B. Enlightenment from international mountain research projects. J. Mt. Sci. 2013, 31, 377–384. (In Chinese) [Google Scholar]
- Millennium Ecosystem Assessment (MA). Ecosystems and Human Well Being: Current State and Trends; Island Press: Washington, DC, USA, 2005. [Google Scholar]
- The Economics of Ecology and Biodiversity (TEEB). Mainstreaming the Economics of Nature—A Synthesis of the Approach, Conclusions, and Recommendations. 2010. Available online: http://www.teebweb.org/Portals/25/TEEB%20Synthesis/TEEB_SynthReport_09_2010_online.pdf (accessed on 15 October 2010).
- Khan, S.M.; Page, S.E.; Ahmad, H.; Harper, D.M. Sustainable utilization and conservation of plant biodiversity in montane ecosystems: The western Himalayas as a case study. Ann. Bot. 2013, 112, 479–501. [Google Scholar] [CrossRef] [PubMed]
- Huber, R.; Rigling, A.; Bebi, P.; Brand, F.S.; Briner, S.; Buttler, A.; Elkin, C.; Gillet, F.; GrêtRegamey, A.; Hirschi, C.; et al. Sustainable land use in mountain regions under global change: Synthesis across scales and disciplines. Ecol. Soc. 2013, 18, 36. [Google Scholar] [CrossRef]
- Munteanu, C.; Kuemmerle, T.; Boltiziar, M.; Butsic, V.; Gimmi, U.; Lúboš, H.; Kaim, D.; Király, G.; Konkoly-Gyuró, É.; Kozak, J.; et al. Forest and agricultural land change in the Carpathian region—A meta-analysis of long-term patterns and drivers of change. Land Use Policy 2014, 38, 685–697. [Google Scholar] [CrossRef]
- Borsdorf, A.; Braun, V. The European and global dimension of mountain research—An overview. J. Alp. Res. 2008, 96, 117–129. [Google Scholar]
- Brunner, S.H.; Grêt-Regamey, A. Policy strategies to foster the resilience of mountain social-ecological systems under uncertain global change. Environ. Sci. Policy 2016, 66, 129–139. [Google Scholar] [CrossRef]
- Imperiale, A.J.; Vanclay, F. Using Social Impact Assessment to Strengthen Community Resilience in Sustainable Rural Development in Mountain Areas. Mt. Res. Dev. 2016, 36, 431–442. [Google Scholar] [CrossRef]
- Zhao, D.J.; Qi, W.; Zhao, S.T.; Qu, Y.B. Landuse pattern optimization in mountainous areas at county level based on GIS. Trans. CSAE 2008, 24, 101–106. (In Chinese) [Google Scholar]
- Reger, B.; Göttlein, A.; Katzensteiner, K.; Ewald, J. Assessing the Sensitivity of Mountain Forests to Site Degradation in the Northern Limestone Alps, Europe. Mt. Res. Dev. 2015, 35, 139–151. [Google Scholar] [CrossRef]
- Costanza, R.; d’Arge, R.; de Groot, R.; Farber, S.; Grasso, M.; Hannon, B.; Limburg, K.; Naeem, S.; O’Neill, R.V.; Paruelo, J.; et al. The value of the world’s ecosystem services and natural capital. Nature 1997, 387, 253–260. [Google Scholar] [CrossRef]
- Gaodi, X.; Caixia, C.X.; Zhang, L.M.; Li, S. Improvement of the Evaluation Method for Ecosystem Service Value Based on Per Unit Area. J. Nat. Res. 2015, 30, 1243–1254. (In Chinese) [Google Scholar]
- Bai, Y.; Zhuang, C.; Ouyang, Z.; Zheng, H.; Jiang, B. Spatial characteristics between biodiversity and ecosystem services in a human-dominated watershed. Ecol. Complex. 2011, 8, 177–183. [Google Scholar] [CrossRef]
- Häyhä, T.; Franzese, P.P.; Paletto, A.; Fath, B.D. Assessing, valuing, and mapping ecosystem services in Alpine forests. Ecosyst. Serv. 2015, 14, 12–23. [Google Scholar] [CrossRef]
- Wu, G.H.; Wang, N.A.; Hu, S.X.; Tian, L.S.; Zhang, J.M. Physical Geography, 4th ed.; Higher Education Press: Beijing, China, 2008; pp. 463–481. (In Chinese) [Google Scholar]
- Yonghui, Y.; Baiping, Z.; Fang, H.; Pangy, Y. Spatial pattern and exposure effect of altitudinal belts in the Hengduan mountains. J. Mt. Sci. 2010, 28, 11–20. (In Chinese) [Google Scholar]
- Jun, Z.; Yongsheng, H.; Yinfang, S.; Long, L. Relationship between snow line change and climate change in the middle of Qilian Mountains during 2000–2012. J. Mt. Sci. 2015, 33, 683–689. (In Chinese) [Google Scholar]
- Rongzhi, M. The geographical distribution of soil in mountainous areas of China. Acta Pedol. Sin. 1965, 13, 1–7. (In Chinese) [Google Scholar]
- Yu, J.; Yuan, Y.; Nie, Y.; Ma, E.; Li, H.; Geng, X. The Temporal and Spatial Evolution of Water Yield in Dali County. Sustainability 2015, 7, 6069–6085. [Google Scholar] [CrossRef]
- Redhead, J.W.; Stratford, C.; Sharps, K.; Jones, L.; Ziv, G.; Clarke, D.; Oliver, T.H.; Bullock, J.M. Empirical validation of the InVEST water yield ecosystem service model at a national scale. Sci. Total Environ. 2016, 569, 1418–1426. [Google Scholar] [CrossRef] [PubMed] [Green Version]
- Sharps, K.; Masante, D.; Thomas, A.; Jackson, B.; Redhead, J.; May, L.; Prosser, H.; Cosby, B.; Emmett, B.; Jones, L. Comparing strengths and weaknesses of three ecosystem services modelling tools in a diverse UK river catchment. Sci. Total Environ. 2017, 584–585, 118–130. [Google Scholar]
- Du, Z.; Quansheng, G.; Xueqin, Z.; Fanneng, H.; Shaohong, W.; Qinye, Y. Regionalization in China: Retrospect and prospect. Geogr. Res. 2005, 24, 330–344. (In Chinese) [Google Scholar]
- Bojie, F.; Shiliang, L.; Keming, M. The contents and methods of integrated ecosystem assessment. Acta Ecol. Sin. 2001, 21, 1886–1892. (In Chinese) [Google Scholar]
- Li, X.R.; Gao, H.; Han, L.P.; Liu, J.T. Spatio-temporal variations in vegetation NPP and the driving factors in Taihang Mountain Area. Chin. J. Eco-Agric. 2017, 25, 498–508. (In Chinese) [Google Scholar]
- Farley, K.A.; Jobbágy, E.G.; Jackson, R.B. Effects of afforestation on water yield: A global synthesis with implications for policy. Glob. Chang. Biol. 2005, 11, 1565–1576. [Google Scholar] [CrossRef]
- Stępniewska, M. Ecosystem Service Mapping and Assessment as a Support for Policy and Decision Making. Clean Soil Air Water 2016, 44, 1414–1422. [Google Scholar] [CrossRef]
- Verhagen, W.; Van Teeffelen, A.J.A.; Compagnucci, A.B.; Poggio, L.; Gimona, A.; Verburg, P.H. Effects of landscape configuration on mapping ecosystem service capacity: A review of evidence and a case study in Scotland. Landsc. Ecol. 2016, 31, 1457–1479. [Google Scholar] [CrossRef]
- Chen, S.; Shahi, C.; Chen, H.Y.H. Economic and ecological trade-off analysis of forest ecosystems: Options for boreal forests. Environ. Rev. 2016, 24, 348–361. [Google Scholar] [CrossRef]
- Chuai, X.; Huang, X.; Wu, C.; Li, J.; Lu, Q.; Qi, X.; Zhang, M.; Zuo, T.; Lu, J. Land use and ecosystems services value changes and ecological land management in coastal Jiangsu, China. Habitat Int. 2016, 57, 164–174. [Google Scholar] [CrossRef]
- Briner, S.; Huber, R.; Bebi, P.; Elkin, C.; Schmatz, D.R.; Gret-Regamey, A. Trade-Offs between Ecosystem Services in a Mountain Region. Ecol. Soc. 2013, 18, 35. [Google Scholar] [CrossRef]
- Jourdain, D.; Boere, E.; van den Berg, M.; Dang Dinh, Q.; Cu, T.P.; Affholder, F.; Pandey, S. Water for forests to restore environmental services and alleviate poverty in Vietnam: A farm modeling approach to analyze alternative PES programs. Land Use Policy 2014, 41, 423–437. [Google Scholar] [CrossRef]
- Xiao, Y.; Xiao, Q.; Ouyang, Z.; Maomao, Q. Assessing changes in water flow regulation in Chongqing region, China. Environ. Monit. Assess. 2015, 187, 362. [Google Scholar] [CrossRef] [PubMed]
- Quijano, L.; Gaspar, L.; Navas, A. Lateral and depth patterns of soil organic carbon fractions in a mountain Mediterranean agrosystem. J. Agric. Sci. 2016, 154, 287–304. [Google Scholar] [CrossRef]
- Winowiecki, L.; Vagen, T.G.; Huising, J. Effects of land cover on ecosystem services in Tanzania: A spatial assessment of soil organic carbon. Geoderma 2016, 263, 274–283. [Google Scholar] [CrossRef]
- Swinton, S.M.; Lupi, F.; Robertson, G.P.; Hamilton, S.K. Ecosystem services and agriculture: Cultivating agricultural ecosystems for diverse benefits. Ecol. Econ. 2007, 64, 245–252. [Google Scholar] [CrossRef]
- Foster, S.S.D.; Perry, C.J. Improving groundwater resource accounting in irrigated areas: A prerequisite for promoting sustainable use. Hydrogeol. J. 2010, 18, 291–294. [Google Scholar] [CrossRef]
- Laudgren. The definition of agroforestry. Agrofor. Syst. 1982, 1, 4–7. [Google Scholar]
- Gaspar, P.; Escribano, M.; Mesias, F.J. A qualitative approach to study social perceptions and public policies in dehesa agroforestry systems. Land Use Policy 2016, 58, 427–436. [Google Scholar] [CrossRef]
- Rahman, S.A.; Sunderland, T.; Kshatriya, M.; Roshetko, J.M.; Pagella, T.; Healey, J.R. Towards productive landscapes: Trade-offs in tree-cover and income across a matrix of smallholder agricultural land-use systems. Land Use Policy 2016, 58, 152–164. [Google Scholar] [CrossRef]
- French, K.E.; Tkacz, A.; Turnbull, L.A. Conversion of grassland to arable decreases microbial diversity and alters community composition. Appl. Soil Ecol. 2017, 110, 43–52. [Google Scholar] [CrossRef]
- Woldesenbet, T.A.; Elagib, N.A.; Ribbe, L.; Heinrich, J. Hydrological responses to land use/cover changes in the source region of the Upper Blue Nile Basin, Ethiopia. Sci. Total Environ. 2017, 575, 724–741. [Google Scholar] [CrossRef] [PubMed]
- Deng, Q.; McMahon, D.E.; Xiang, Y.; Yu, C.-L.; Jackson, R.B.; Hui, D. A global meta-analysis of soil phosphorus dynamics after afforestation. New Phytol. 2017, 213, 181–192. [Google Scholar] [CrossRef] [PubMed]
- Horacio Villarino, S.; Alberto Studdert, G.; Baldassini, P.; Cendoya, M.G.; Ciuffoli, L.; Mastrángelo, M.; Piñeiro, G. Deforestation impacts on soil organic carbon stocks in the Semiarid Chaco Region, Argentina. Sci. Total Environ. 2017, 575, 1056–1065. [Google Scholar] [CrossRef] [PubMed]
- Pardini, G.; Gispert, M.; Emran, M.; Doni, S. Rainfall/runoff/erosion relationships and soil properties survey in abandoned shallow soils of NE Spain. J. Soil. Sediment. 2017, 17, 499–514. [Google Scholar] [CrossRef]
- Buma, B.; Wessman, C.A. Forest resilience, climate change, and opportunities for adaptation: A specific case of a general problem. For. Ecol. Manag. 2013, 306, 216–225. [Google Scholar] [CrossRef]
- Garciá-Nieto, A.P.; Garcia-Llorente, M.; Iniesta-Arandia, I.; Martín-López, B. Mapping forest ecosystem services: From providing units to beneficiaries. Ecosyst. Serv. 2013, 4, 126–138. [Google Scholar] [CrossRef]
- Winowiecki, L.; Vågen, T.-G.; Massawe, B.; Jelinski, N.A.; Lyamchai, C.; Sayula, G.; Msoka, E. Landscape-scale variability of soil health indicators: Effects of cultivation on soil organic carbon in the Usambara Mountains of Tanzania. Nutr. Cycl. Agroecosyst. 2016, 105, 263–274. [Google Scholar] [CrossRef]
Figure 1.
A map showing the location of Taihang Mountain in China (left) and an expanded map of the Taihang Mountain study area (right).
Figure 1.
A map showing the location of Taihang Mountain in China (left) and an expanded map of the Taihang Mountain study area (right).

Figure 2.
Plot of area ratio of land use types along vertical gradient in Taihang Mountain, China.

Figure 3.
Plot of inter-annual rate of change of NPP along the vertical gradient in Taihang Mountain, China. Note: NPP IACR means the inter-annual change rate of net primary productivity.
Figure 3.
Plot of inter-annual rate of change of NPP along the vertical gradient in Taihang Mountain, China. Note: NPP IACR means the inter-annual change rate of net primary productivity.

Figure 4.
Plot of water yield along the vertical gradient in Taihang Mountain, China.

Figure 5.
Average annual temperature in the vertical gradient in Taihang Mountain, China. Note: AAT means average annual temperature.
Figure 5.
Average annual temperature in the vertical gradient in Taihang Mountain, China. Note: AAT means average annual temperature.

Figure 6.
Plot of spatial distribution of the 2 critical lines and the 3 zones of vertical differentiation in Taihang Mountain, China.
Figure 6.
Plot of spatial distribution of the 2 critical lines and the 3 zones of vertical differentiation in Taihang Mountain, China.

Figure 7.
Plots of ecosystem services in Taihang Mountain in terms of money value. Note that ESV is ecosystem services value and TM is Taihang Mountain.
Figure 7.
Plots of ecosystem services in Taihang Mountain in terms of money value. Note that ESV is ecosystem services value and TM is Taihang Mountain.

Figure 8.
The money value of ecosystem services per unit area in Taihang Mountain, China. Note that ESV denotes ecosystem services value, TM is Taihang Mountain.
Figure 8.
The money value of ecosystem services per unit area in Taihang Mountain, China. Note that ESV denotes ecosystem services value, TM is Taihang Mountain.

Table 1.
Modified ecosystem service equivalent value per unit area in Taihang Mountain, China.
| Ecosystem Type | Provisioning Services | Regulating Services | Supporting Services | Cultural Services | MC | ||||||||
|---|---|---|---|---|---|---|---|---|---|---|---|---|---|
| First Tier | Second Tier | FP | RMP | WS | GR | CR | EC | HR | SC | NCM | BM | AL | MC |
| Farmland | Dry farm | 0.64 | 0.30 | 0.02 | 0.50 | 0.27 | 0.08 | 0.20 | 0.77 | 0.09 | 0.10 | 0.05 | 0.75 |
| Paddy field | 1.02 | 0.07 | −1.97 | 0.83 | 0.43 | 0.13 | 2.04 | 0.01 | 0.14 | 0.16 | 0.07 | 0.75 | |
| Forest | Coniferous and broad-leaved mixed | 0.21 | 0.49 | 0.26 | 1.62 | 4.85 | 1.37 | 2.42 | 1.97 | 0.15 | 1.79 | 0.79 | 0.69 |
| Broad-leaved | 0.12 | 0.27 | 0.14 | 0.89 | 2.67 | 0.79 | 1.94 | 1.09 | 0.08 | 0.99 | 0.43 | 0.41 | |
| shrub | 0.13 | 0.29 | 0.15 | 0.96 | 2.88 | 0.87 | 2.28 | 1.17 | 0.09 | 1.07 | 0.47 | 0.68 | |
| Grassland | Grassland | 0.13 | 0.18 | 0.10 | 0.65 | 1.72 | 0.56 | 1.25 | 0.79 | 0.06 | 0.72 | 0.32 | 1.28 |
| Scrub grassland | 0.37 | 0.55 | 0.30 | 1.93 | 5.11 | 1.69 | 3.74 | 2.35 | 0.18 | 2.14 | 0.94 | 0.98 | |
| Meadow | 0.28 | 0.42 | 0.23 | 1.46 | 3.87 | 1.28 | 2.83 | 1.78 | 0.14 | 1.63 | 0.72 | 1.28 | |
| Wetland | Wetland | 0.51 | 0.50 | 2.59 | 1.90 | 3.60 | 3.60 | 24.23 | 2.31 | 0.18 | 7.87 | 4.73 | 1.00 |
| Desert | Desert | 0.01 | 0.03 | 0.02 | 0.11 | 0.10 | 0.31 | 0.21 | 0.13 | 0.01 | 0.12 | 0.05 | 1.00 |
| Bare land | 0.00 | 0.00 | 0.00 | 0.02 | 0.00 | 0.10 | 0.03 | 0.02 | 0.00 | 0.02 | 0.01 | 1.00 | |
| Water area | Water area | 0.38 | 0.11 | 3.95 | 0.37 | 1.09 | 2.65 | 48.74 | 0.44 | 0.03 | 1.22 | 0.90 | 0.48 |
Note: FP means food production; RMP means raw material production; WS means water supply; GR means gas regulation; CR means climate regulation; EC means environmental cleaning; HR means hydrological regulation; SC means soil conservation; NCM means nutrient cycle maintenance; BM means biodiversity maintenance; AL means aesthetic landscape; MC means modified coefficient.
Table 2.
Functional indices of ecosystem services in Taihang Mountain, China.
| Altitude (m) | Provisioning Services | Regulating Services | Supporting Services | Cultural Service |
|---|---|---|---|---|
| Below 500 | 0.82 | 0.48 | 0.40 | 0.37 |
| For 600–1400 | 0.55 | 0.52 | 0.53 | 0.51 |
| Above 1500 | 1.62 | 2.00 | 2.07 | 2.11 |
| Taihang Mountain | 1.00 | 1.00 | 1.00 | 1.00 |
© 2018 by the authors. Licensee MDPI, Basel, Switzerland. This article is an open access article distributed under the terms and conditions of the Creative Commons Attribution (CC BY) license (http://creativecommons.org/licenses/by/4.0/).
Share and Cite
MDPI and ACS Style
Gao, H.; Fu, T.; Liu, J.; Liang, H.; Han, L. Ecosystem Services Management Based on Differentiation and Regionalization along Vertical Gradient in Taihang Mountain, China. Sustainability 2018, 10, 986. https://doi.org/10.3390/su10040986
AMA Style
Gao H, Fu T, Liu J, Liang H, Han L. Ecosystem Services Management Based on Differentiation and Regionalization along Vertical Gradient in Taihang Mountain, China. Sustainability. 2018; 10(4):986. https://doi.org/10.3390/su10040986
Chicago/Turabian StyleGao, Hui, Tonggang Fu, Jintong Liu, Hongzhu Liang, and Lipu Han. 2018. "Ecosystem Services Management Based on Differentiation and Regionalization along Vertical Gradient in Taihang Mountain, China" Sustainability 10, no. 4: 986. https://doi.org/10.3390/su10040986
Note that from the first issue of 2016, this journal uses article numbers instead of page numbers. See further details here.