Environmental Regulation, Government R&D Funding and Green Technology Innovation: Evidence from China Provincial Data

1
School of Public Policy and Administration, Xi’an Jiaotong University, Xi’an 710049, China
2
School of Management, Xi’an University of Science and Technology, Xi’an 710054, China
*
Author to whom correspondence should be addressed.
Sustainability 2018, 10(4), 940; https://doi.org/10.3390/su10040940
Submission received: 2 March 2018
/
Revised: 17 March 2018
/
Accepted: 19 March 2018
/
Published: 23 March 2018
(This article belongs to the Special Issue Environmentally Sustainable Competitive Strategies)
Abstract
:The “environmental pollution–economic development” circle is a problem in the process of national sustainable development. As a complex concept of environmental protection and technology innovation, green technology innovation is the key to cracking this strange circle. This paper divides green technology innovation into green product innovation and green process innovation and measures green technology innovation based on the perspective of energy saving and emission reduction. Furthermore, we examine the effects of environmental regulation and government R&D funding on green technology innovation. The empirical findings are as follows: (1) from the dynamic point of view, we test whether there is a significant ”U-shaped” relationship between environmental regulation and green technological innovation, and we find there exists an “inflection point” in the role of environmental regulation in green technology innovation, and China is at the stage of inhibition before the “inflection point”; (2) direct government funding and tax incentives can promote green technology innovation, but the promotion of government tax incentives to green technology innovation is not significant; (3) the interaction between environmental regulation and government R&D will promote green product innovation and inhibit green process innovation, which is closely related to the imbalance of environmental regulation intensity in energy saving and emission reduction. In addition, this paper also gives out three kinds of control variables (the level of regional development, the proportion of the regional manufacturing industry, and the development level of regional export-oriented economy) and presents their effects on green technology innovation.
1. Introduction
In recent years, although China’s GDP has leapt to second place in the world after the United States, it is accompanied by serious problems of environmental pollution and energy consumption with the rapid development of the economy. According to the joint report on the Global Environmental Performance Index (GEPI) issued by Yale University Center for Environmental Law and Policy (YCELP), Columbia University Center for International Geoscience Information Network (CIESIN) and the World Economic Forum (WEF), China ranked 94 (40th percentile), 105 (45th percentile), 121 (43th percentile), 116 (17th percentile), 118 (61th percentile) and 109 (72th percentile) in 2006, 2008, 2010, 2012, 2014 and 2016 [1,2]. The extensive industrial development model has made China fall into the “environmental pollution–economic development” circle. In this regard, green technology innovation is the key to get out of this “strange circle”.
Ernest Braun et al. (1994) suggested that green technology is a generic term for technologies, processes, or products that reduce environmental pollution and the consumption of energy and raw materials [3]. More specifically, it focuses on policy to promote innovation that reduces environmental impacts through waste minimization, thus moving us toward the goal of a minimal waste society. Moreover, Yun et al. proposed that green product innovation and green process innovation were positively correlated to corporate competitiveness and technology innovation. Norberg-Bohm V also added that technological innovation of products and processes is the key to avoiding undesirable health and ecosystem consequences [4]. In this paper, we divide green technology innovation into green product innovation and green process innovation. We propose that green technology innovation is the behavior of creating environmentally friendly new technology of product and process, pursuing economic growth benefits brought by technology innovation and seeking the green ecological benefits of energy cleaning and emission reducing. Green product innovation pays more attention to the goal of “energy saving”. It refers to the development of green products by finding new energy that could save materials and using new technology which could easily regenerate and recycle. Green process innovation pays more attention to the goal of “emission reduction”. It is devoted to reducing the amount of pollution in the production process through process renewal, equipment transformation and innovation.
Green technology innovation is committed to pursuing the “win-win” development pattern of environment and economy [5]. To achieve sustainable development, it is increasingly important to develop and strengthen green technology innovation [6,7]. Meanwhile, it also has the negative externality of environmental resources utilization and the positive externality of technology innovation. The negative externality of environmental resources utilization requires environmental regulation to play a corrective role, and the positive externality of technology innovation needs the guidance and support of the government through funding policies. In essence, the government implements environmental regulation through public means to restrain the negative externality of green technology innovation, and the government’s subsidy policy to enterprises is to create incentive effect for the research and development of green technology innovation. In a nutshell, well-designed environmental regulations may lead to a pareto improvement or a “win-win” situation, by not only protecting the environment, but also stimulating innovation through the improvement of products or production processes [8]. However, what kind of effect will be produced by government means of negative restraint and positive incentive act on green technology innovation simultaneously is a question worth studying and discussing.
Many studies have been conducted on the role of environmental regulation or government funding in technological innovation. However, there is a lack of research on the synergistic effect of these policies. This paper attempts to fill this gap. This study takes green technology innovation with dual concepts of implied environmental protection and technology innovation as research object. The compound mechanism of environmental regulation and government-funded policy tools on green technology innovation will be the focus of this research (according to Tinbergen’s Rule, the number of policy instruments should be at least equal to the number of target variables, and green technology innovation should cover both environmental protection and economic development).
This paper is organized as follows. In Section 2, we review the literature on the relationships among environmental regulation, government R&D support and green technology innovation. Thus, the hypothesis of our research is put forward and the theoretical framework is constructed. In Section 3, we explain the selection of variables and the sources of measurement and data acquisition. In Section 4, we design and fit the empirical model. In addition, we test the robustness of the empirical model and discuss the research results. Finally, in Section 5, we conclude some policy recommendations and point out the further research direction.
2. Hypothesis and Theoretical Model
2.1. Environmental Regulation and Green Technology Innovation
According to the view of traditional economics, strict environmental regulation will restrain technology innovation of enterprises [9]. Leeuwen et al. (2013) and Zhao et al. (2016) concluded that environmental regulation will restrain the efficiency of technological innovation and reduce the productivity of the manufacturing industry through empirical analysis [10,11]. Moreover, based on the analysis of externality theory, it is concluded that environmental regulation exerts constraints on the innovation behavior of enterprises, which results in the increase of environmental costs and the inhibition of enterprises’ innovation enthusiasm. In addition, the cost of environmental management is bound to squeeze out the capital investment that enterprises can use for R&D [12]. Furthermore, environmental regulation can bring forth implicit cost and explicit cost. So, the firms may choose to share and transfer the costs to the consumers based on the consideration of cost-cutting. Hence, the competitiveness of enterprises will be reduced as a result.
Environmental regulation will increase the environmental protection cost and reduce the profits of the enterprise. Feichtinger et al. (2003) argue that strict environmental policies aimed at reducing emissions have a significant inhibitory effect on the benefits of industrial development, which is contrary to the Porter hypothesis [13]. Moreover, the extra cost in the process of preventing and controlling environmental pollution will increase the cost and then affect the firm’s competitive advantage [14]. Zhao and Sun (2016) found that environmental regulation not only has a weak positive effect on enterprise innovation, but also has a negative effect on enterprise competitiveness [11]. In addition, although Leeuwen et al. (2013) confirmed the “weak” Porter hypothesis, it did not confirm the “strong” Porter hypothesis in their study [10]. Gray et al. (2001) pointed out that regulation in the entire manufacturing industry in the United States would lead to a productivity drop of 9.3% [15]. Bezdek M. (2012) added that strict air quality regulations have contributed to a 2.6% decline in the productivity of the American aircraft manufacturing industry [16]. Chintrakarn (2008) analyzed the effect of environmental regulation on technology innovation efficiency by using the data of America from 1982 to 1994. The results showed that strict environmental regulation will significantly inhibit the efficiency of technological innovation [17]. Sinn (2008) put forward the “Green Paradox” in the study of public policies to address greenhouse gas emissions. The study found that the policies to limit greenhouse gas emissions will accelerate energy extraction, thereby increasing greenhouse gas emissions. In other words, environmental regulation has not promoted the technology innovation of enterprises to deal with environmental protection constraints [18].
Based on the theory of externality, this paper holds that environmental regulation not only increases the environmental cost, but also inhibits the enthusiasm of enterprises. In addition, the cost of environmental governance would have a crowding-out effect on firm’s R&D investment. Therefore, this study holds that environmental regulation will inhibit green technological innovation. Above all, environmental regulation inhibits green product innovation and green process innovation. Hence: we propose research hypothesis H1.
Hypothesis 1 (H1).
Environmental regulation has inhibitory effect on green technology innovation.
Hypothesis 1a (H1a).
Environmental regulation has inhibitory effect on green product innovation.
Hypothesis 1b (H1b).
Environmental regulation has inhibitory effect on green process innovation.
The effect of environmental regulation on green technology innovation is of an inverted “U” type from the perspective of dynamic development. In other words, with the increase of environmental regulation intensity, the influence of environmental regulation on technology innovation will change from restraining effect to leading effect. More specifically, there is an “inflection point” of the intensity of environmental regulation, beyond which environmental regulation can play a role in promoting green technological innovation [19,20]. Some scholars also found that the effect of environmental regulation on green technological innovation is inversely U-shaped when they analyzed the environmental regulation role of different industries and regions [21]. Zhang et al. also added that environmental regulation has an inverted “U” relationship to carbon emissions: with the enhancement of environmental regulation, the role of environmental regulation has gradually changed from paradoxical utility to backward forcing effect [20].
The Porter hypothesis suggests that appropriate environmental regulation can lead to innovative effects on technology innovation. It is worth noting that this theory actually puts forward the precondition for the role of environmental regulation in promoting “technology innovation-appropriate environmental regulation”. Hence, it requires the intensity of environmental regulation and also provides evidence for the study of the inverted “U” type relationship. Therefore, from the view of the dynamic analysis of environmental regulation, this study holds that there is also an inverted “U” type relationship between environmental regulation and green technology innovation. Hence: we propose research hypothesis H2.
Hypothesis 2 (H2).
From the perspective of dynamic development, there is a significant “U” type relationship between environmental regulation and green technology innovation.
Hypothesis 2a (H2a).
From the perspective of dynamic development, there is a significant “U” type relationship between environmental regulation and green product innovation.
Hypothesis 2b (H2b).
From the perspective of dynamic development, there is a significant “U” type relationship between environmental regulation and green process innovation.
2.2. Government R&D Funding and Green Technology Innovation
Government R&D funding will promote technology innovation, which is in line with the traditional theory of market failure and government intervention. The spillover effect of technological innovation leads to insufficient investment in technological innovation of enterprises. Government R&D funding is the correction of this positive externality and promotes the technological innovation behavior to reach the level of social optimum efficiency. In essence, the promotion of government R&D funding is an incentive effect, which can stimulate innovation by reducing the cost and risk of R&D activities [22]. Ai Zhihong (2010) pointed out that the government can promote innovation through subsidies, tax incentives based on the nature of green technology innovation [23]. He Xiaogang (2014) further studied the impact of public policies such as public research, direct subsidy, tax credit and patent protection on R&D investment in green technology innovation [24]. The results showed that the government subsidy policy can help to make up for the shortage of green technology innovation in enterprises. Nevertheless, some studies have emphasized that that government R&D subsidy will have a significant crowding-out effect on enterprise R&D investment and inhibit technology innovation [25]. Therefore, from the view of the positive externality of R&D aid to correct the spillover of green technology innovation technology spill-over, this paper proposes that government R&D funding can promote green technology innovation, Hence, research hypothesis H3 is proposed.
Hypothesis 3 (H3).
Direct government subsidy policy promotes green technology innovation.
Hypothesis 3a (H3a).
Direct government subsidy promotes green product innovation.
Hypothesis 3b (H3b).
Direct government subsidy promotes green process innovation.
Theofanis (1996) arguing that public R&D subsidies could save costs but crowd out private R&D investment. Tax credits and deductions for R&D will have a significant impact on private R&D investment [26]. Moreover, tax credits and deductions for R&D will have a significant impact on private R&D investment. Thus, direct subsidy will have positive effect on enterprise R&D, and tax incentive policy will have indirect positive effect on enterprise R&D [27]. Guellec (2000) hypothesized that direct subsidy will have a positive effect on enterprise R&D and tax incentive policy will have indirect positive effect on R&D [28]. Therefore, the preferential tax policy can encourage enterprises to increase R&D investment in green technology innovation, we propose research hypothesis H4.
Hypothesis 4 (H4).
The preferential tax policy of the government promotes green technology innovation.
Hypothesis 4a (H4a).
The government tax preference promotes green product innovation.
Hypothesis 4b (H4b).
The government tax preference promotes green process innovation.
2.3. Environmental Regulation, Government R&D funding and Green Technology Innovation
At present, many scholars posit that government R&D funding (support) plays a role in regulating (green) technology innovation by environmental regulation. Jiang et al. analyzed the regulatory role of government intervention in the relationship between environmental regulation and technological innovation by using provincial panel data in China. It is concluded that the degree of government intervention leads to regional differences in the effect of environmental regulation on technological innovation by regulating the relationship between environmental regulation and technological innovation [29]. Cao et al. (2015) disputed that government support factors will have a positive regulatory effect on the relationship between regulatory regulation and technological innovation performance [30]. Furthermore, Ma et al. (2012) also supported the empirical findings [31]. Féres J. et al. (2012) found that regulatory environmental regulation would inhibit technology innovation, while the governmental financial and policy support for enterprise innovation would increase the burden on enterprises [32]. Rooij et al. (2013) pointed out that excessive government support inhibits social support, thereby reducing the potential for innovative benefits from voluntary environmental regulation [33]. However, Tang et al. (2013) indicated that government support for technological innovation activities of enterprises can alleviate the burden and loss caused by environmental regulation to some extent [34].
This paper argues that environmental regulation can also regulate the role of government R&D funding on green technology innovation through green guidance. In other words, the goal of environmental protection restriction can lead the government to fund more research projects of green environment, thus positively adjusting the role of government R&D funding in promoting green technology innovation. Hence:
Hypothesis 5 (H5).
Interaction between environmental regulation and direct government subsidy promotes green technological innovation.
Hypothesis 5a (H5a).
Interaction between environmental regulation and direct government subsidy promotes green product innovation.
Hypothesis 5b (H5b).
Interaction between environmental regulation and direct government subsidy promotes green process innovation.
Hypothesis 6 (H6).
Interaction between environmental regulation and government tax preference promotes green technological innovation.
Hypothesis 6a (H6a).
Interaction between environmental regulation and government tax preference promotes green product innovation.
Hypothesis 6b (H6b).
Interaction between environmental regulation and government tax preference promotes green process innovation.
2.4. Theoretical Model
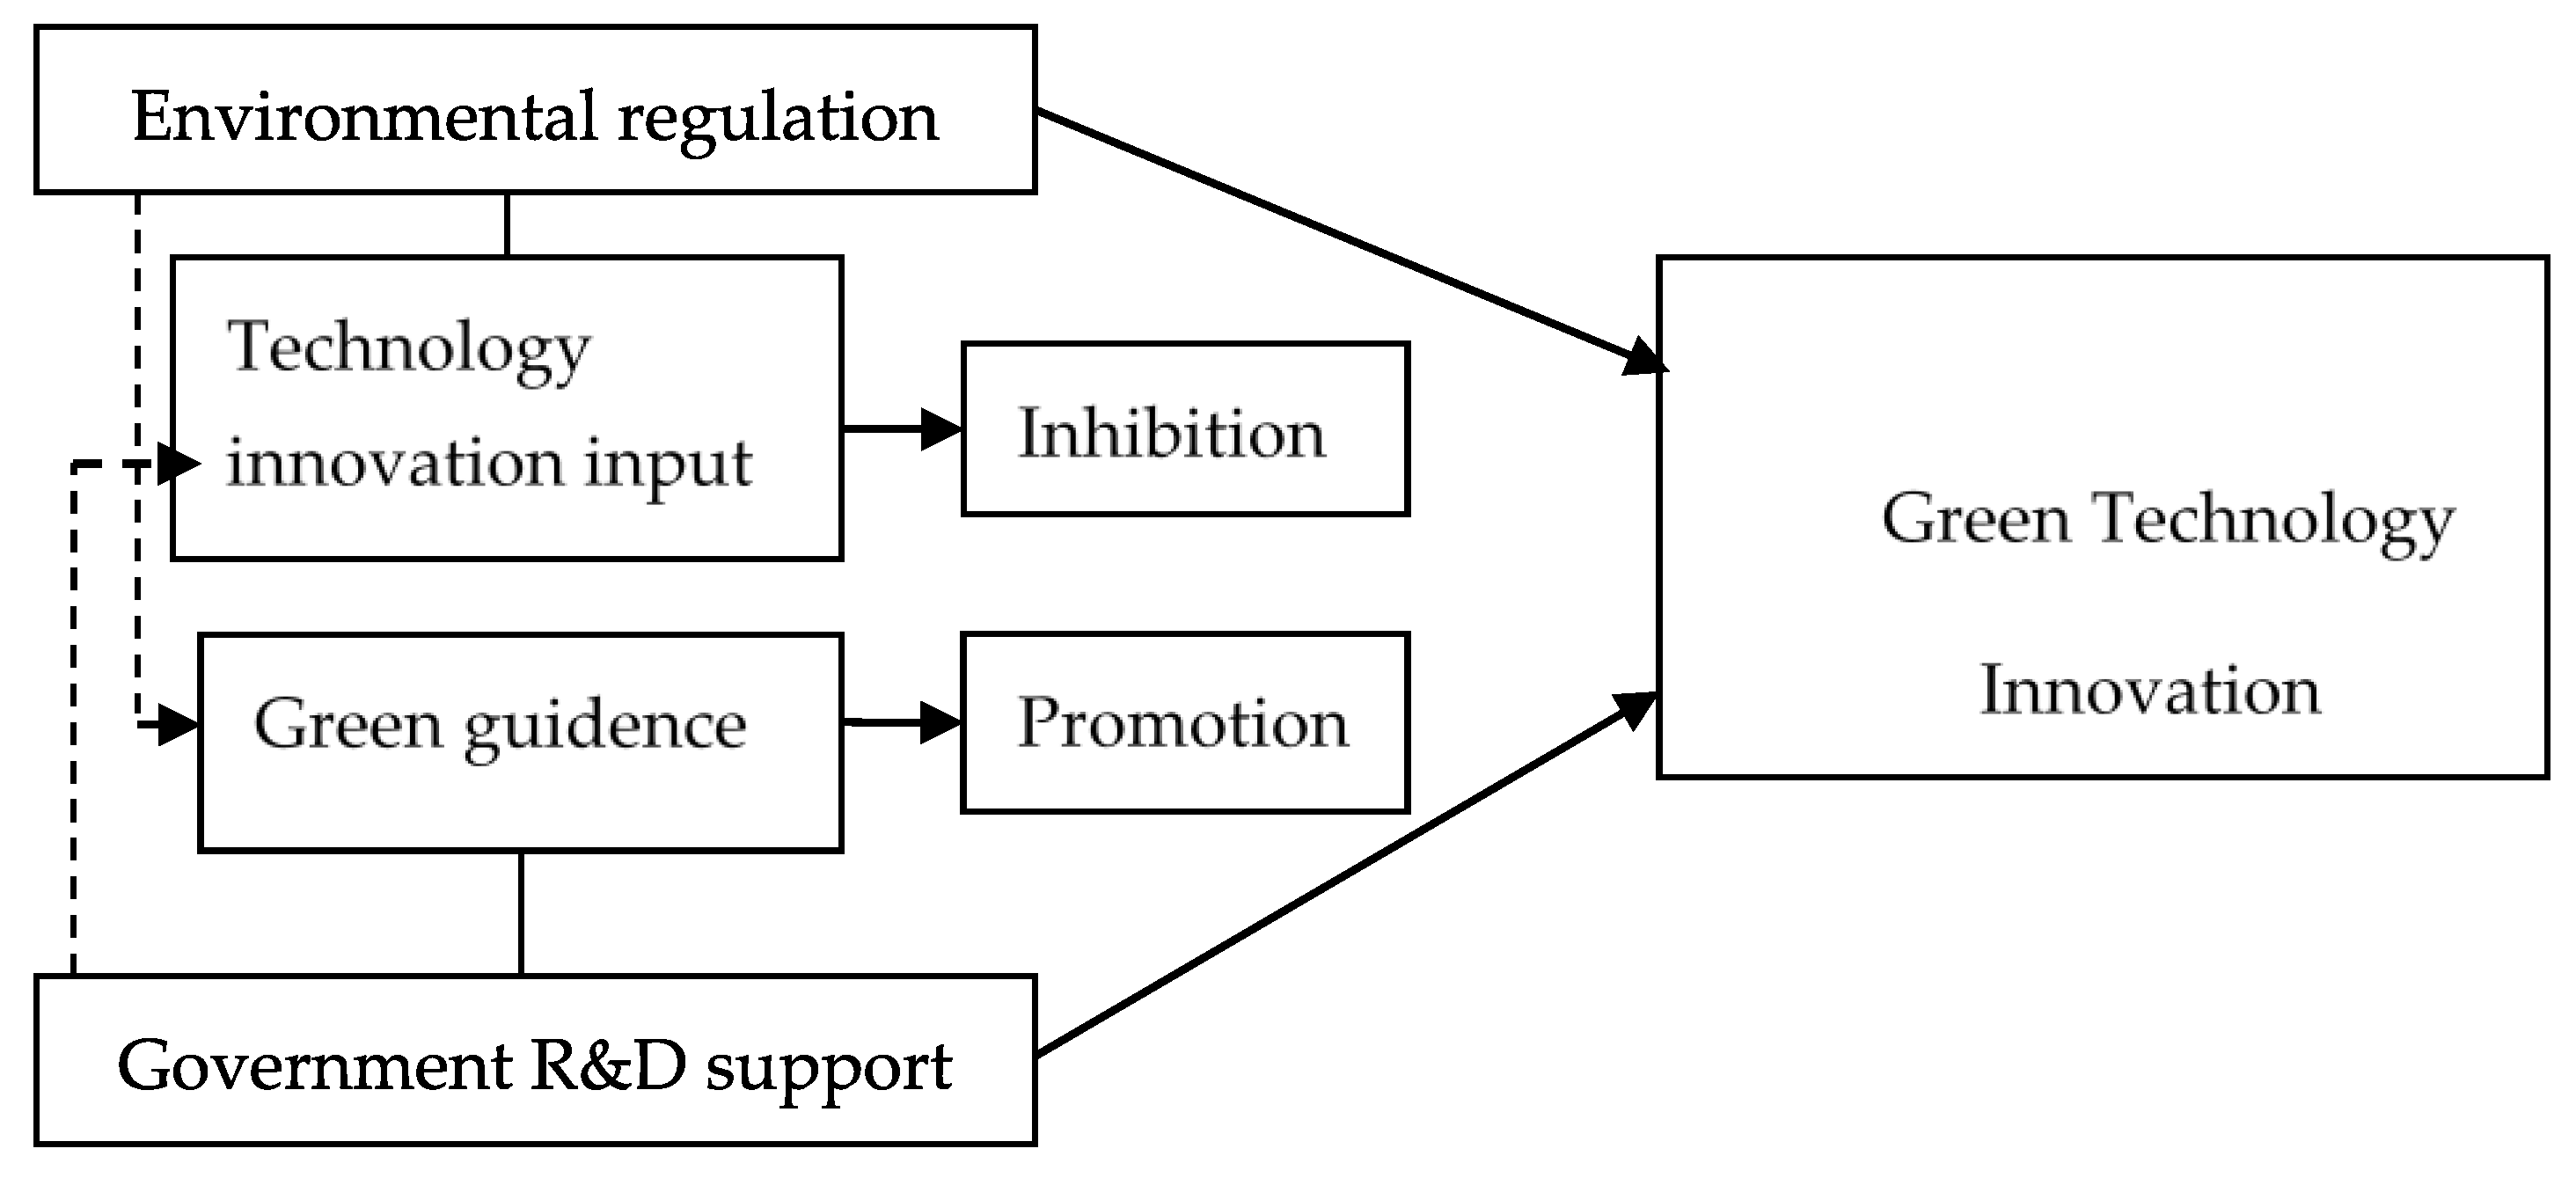
Based on the analysis of the conceptual relationship among environmental regulation, government R&D funding and green technology innovation, a theoretical model of the relationship between them is established, as shown in Figure 1. According to the theory of green technology innovation, this study divides green technology innovation into green product innovation and green process innovation. Furthermore, the green product innovation embodies the new product creation which reduces the energy consumption, the new energy development, and pays more attention to the goal of “energy saving”. Nevertheless, green process innovation is embodied in the development of cleaner production process and pollution control technology, with more emphasis on the “emission reduction” goal. Based on the model, firstly, environmental regulation can promote or restrain green product innovation and green process innovation. Secondly, government funding will also have an impact on green product innovation and green process innovation (according to the development of R&D aid means of Chinese government, two main policies of direct subsidy and tax preference are selected to study the effect of different government subsidy means on green product innovation and green process innovation respectively). Finally, the interaction between environmental regulation and government funding will have an impact on green product innovation and green process innovation (similarly, it will be divided into two situations: environmental regulation and government direct subsidy policy, environmental regulation and government R&D tax preferential policy).
3. Research Method
Firstly, the panel data of 30 provinces from 2009 to 2015 are used in this paper, and the fixed effect model of panel data is established by Hausman test. The theoretical models of environmental regulation, government subsidy and green product innovation, environmental regulation, government subsidy and green process innovation are fitted respectively. Secondly, according to the empirical analysis results, we then explain the role of environmental regulation, government R&D funding on green technology innovation mechanism. Finally, 30 provinces (excluding Tibet) were selected as the study samples in 2009–2015. The main sources of the data are the China Energy Statistics Yearbook, the China Science and Technology Statistics Yearbook, the China Environment Yearbook, the Industrial Enterprise Science and Technology Activity Statistics Yearbook, and the China Statistical Yearbook.
3.1. Dependent Variables Measurement
Green technology innovation is committed to pursuing the “win-win” development pattern of environment and economy [6]. Furthermore, to achieve sustainable development, it is increasingly important to develop and strengthen green technology innovation [7]. Therefore, compared with the traditional technology innovation, green technology innovation emphasizes the restriction of green environmental protection, non-pollution, low energy consumption, recyclability, and cleanness. Green technology innovation can be divided into green product innovation and green technological innovation according to the division of enterprise production activities [3]. In essence, green technology innovation is the R&D and application of energy-saving and emission reduction technology. More specifically, the green product innovation pays more attention to the realization of the goal of “energy saving”, which refers to the development of products that can save raw materials and energy. However, green process innovation pays more attention to the realization of “emission reduction” goal, which is devoted to reducing the amount of sewage effectively through process renewal, equipment modification or innovation.
The definition of green product innovation is based on the difference between green product innovation and traditional product innovation. Green product innovation pays more attention to reducing consumption and saving energy in the whole product life cycle. Therefore, the energy consumption per unit output or the output value per unit of energy consumption is often used in the research to measure the green product innovation as agents. From the industrial level, many scholars choose the new product unit energy consumption to measure the green product innovation (the ratio of new product income and energy consumption) based on the characteristics of green product innovation which pay more attention to energy saving [35,36].
In this study, the concept of green product innovation pays more attention to the perspective of “energy saving”, which is consistent with the previous research on the connotation and focus of green product innovation. The energy consumption of ¥ 10,000 new product output value (energy consumption/new product output value) is used for reference to measure the green product innovation, energy consumption/new product output value. The data of industrial energy consumption come from the China Energy Statistics Yearbook, and the new product output data come from the China Statistical Yearbook of Scientific and technological activities of Industrial Enterprises.
Most scholars define green process innovation as the innovation activity to reduce pollution and discharge in the production process, which can be realized by means of equipment renovation, process upgrading, waste treatment and so on. This paper holds that green process innovation is committed to reducing the amount of sewage discharged in production through process renewal, equipment renovation and innovation, and pays more attention to the goal of “energy saving”. For instance, some scholars choose the pollution intensity per unit output value to characterize the green process innovation from the characteristics of realizing the pollution reduction of production process [37,38,39]. Nevertheless, other scholars focus on innovation investment angle (introduction and improvement of new technology and new equipment), selecting the sum of R&D expenditure and technology innovation investment to measure green process innovation [35,36].
Therefore, this paper measures the green process innovation by the pollution intensity of unit output value by drawing lessons from the views of the above studies. In the concrete operation, the paper studies how to measure the green process innovation with the wastewater treatment capacity of ¥ 10,000 industrial output value, the ratio between the industrial wastewater treatment capacity and the main business income of the industrial enterprise. The data are derived from the China Environmental Yearbook, and the main business income data are derived from the Statistical Yearbook of Scientific and Technological Activities of Industrial Enterprises.
First, this paper selects green product innovation and green process innovation variables as reverse indicators (the larger the index value, the lower the degree of green product innovation and green process innovation). Secondly, in addition to the discharge of waste water, industrial pollution also includes the discharge of exhaust gases (mainly sulfur dioxide), solid wastes and hazardous wastes. This study only selects the green process innovation of wastewater treatment capacity agent under the main business income of ¥ 10,000 industry.
In order to strengthen the tightness of this study, the discharge of wastewater from the main business income of the ¥ 10,000 industrial enterprises, the sulfur dioxide emissions from the main business income of ¥ 10,000 industrial enterprises, and the fixed waste emissions from the main business income of ¥ 10,000 industrial enterprises are dependent variables to test the robustness of the results of the research.
3.2. Independent Variables Measurement
The Porter hypothesis holds that reasonable and appropriate environmental regulation can promote enterprises to carry out more innovation activities, which will increase the productivity of enterprises. Furthermore, it will offset the costs brought by environmental regulation and improve the market profitability of enterprises [40,41]. Moreover, the Porter hypothesis holds that the promotion of environmental regulation to technology innovation is mainly realized through innovation compensation. Hence, this kind of innovation compensation often occurs in two ways: (1) enterprises only consider how to deal with pollution in the light of environmental regulation, including the processing and emission of toxic materials, the reduction of toxic and harmful substances, and the promotion of secondary utilization; (2) based on the theory of externality, environmental regulation can bring forth implicit cost and explicit cost. Environmental regulation not only increases the environmental cost, but also inhibits the enthusiasm of enterprises. Therefore, environmental regulation has a negative impact on green product innovation and green process innovation.
There are many indicators of environmental regulation in the existing research. There is mainly the completed investment in industrial pollution control or its proportion in GDP, industrial output value, the proportion of operating expenses of pollution control facilities in industrial output value, the proportion of industrial pollution control investment in industrial production value sewage charges and other indicators selected from the angle of regulation cost [42,43,44]. In addition, the measurement of pollutant emission intensity, wastewater discharge rate, GDP/energy consumption [45,46] selected from the perspective of regulation effect. Specific environmental regulatory intensity measurement indicators include: (1) the promulgation of environmental regulation policy [47]; (2) the ratio of pollution control investment to the total cost of the enterprise or the production value of the enterprise [48]; (3) number of inspections and supervision of enterprises by government regulatory bodies [49]; (4) collection of sewage charges by environmental regulation institutions [50]; (5) operating costs of pollution control facilities [51]; (6) total investment in industrial pollution control and the proportion of main operating costs and industrial added value of industrial enterprises above scale [52,53]; (7) pollution control cost per industrial output value [54,55,56]; (8) per capita income level [57]; (9) changes of pollutant emissions under environmental regulation [58]; and (10) ratio of pollutant emissions to regional industrial gross domestic product [59]. This paper will measure the environmental regulation variables from the perspective of the cost of environmental regulation costs to calculate the operating costs of pollution control facilities/the main business income of industrial enterprises. Among them, the operating cost of the sewage treatment facility includes the operation cost of the wastewater treatment facility and the operating cost of the waste gas treatment facility. The data of the operating cost of wastewater treatment facilities and exhaust gas treatment facilities are derived from the China Environmental Yearbook.
Government R&D funding belongs to the means of the government to support technology innovation. It is the general term of the government and the public sectors to provide financial support to the technology innovation of enterprises. Romer (1990) [60], and Grossman and Helpman (1993) [61] both suggest that technology innovation is the source of economic growth. Because technology innovation brings knowledge spillover, technology innovation activities thus have positive externalities. The social income of green technological innovation is higher than that of private one, and the level of private optimal investment is lower than that of social optimal investment. Therefore, there may be market failure in green technology innovation. Nevertheless, the main purpose and function of the government subsidy is to reduce the cost of green technology innovation in enterprises, thus make up the difference between the private income and the social benefit brought by the green technology innovation. Therefore, direct government subsidy has positive impact on green product innovation and green process innovation. The preferential tax policy has positive impact on green product innovation and green process innovation.
Government R&D funding can correct technology spillover effects and support incentives to guide innovation. Li Yung (2014) pointed out that direct subsidy is the R&D funding arranged by the government from the budget, which is manifested by direct subsidy in the form of government R&D funding and other forms. Indirect subsidy is a preferential policy of the government in the form of tax reduction and exemption. The part of the government that should be turned over to finance itself is left to enterprises for R&D [62]. Hu et al. (2001) disputed that government direct funding and preferential tax policy are direct funding tools, while public research plays an indirect role and belongs to indirect funding tool [63]. Direct appropriations and tax deductions are important means for the government to regulate and guide enterprises to carry out technology innovation through funding [64]. Wei and Liu (2015) pointed out that direct policy support mainly includes financial subsidies and credit projects, while indirect policy guidance mainly includes tax preferential policies [65].
Hence, this paper divides the government R&D funding into two ways: direct government subsidy and tax preference. Considering that the green technology innovation in this paper is mainly the behavior of regional industrial enterprises. According to the statistics of the implementation of the relevant policies of the regional governments on enterprises in the yearbook, this paper selects the funds from government departments to measure the direct government R&D funding. In addition, we select the enterprise R&D expenses plus deductions, deductions, and tax deductions (that is, the income tax on R&D activities added before tax by the enterprise in accordance with the relevant policies and tax laws) to measure the tax preference of the government on the enterprise R&D. The data on government funds for science and technology activities and R&D expenses, plus deductions and tax deductions, are from the China Statistical Yearbook of Science and Technology Activities of Industrial Enterprises.
3.3. Control Variables Measurement
Regional differences among provinces are the controlling variables in this study. We mainly take the development of the region, the human resource base, and the degree of openness into account. Specifically, the level of regional development is measured by the per capita GDP (the proportion of the regional manufacturing industry in terms of the proportion of industrial enterprise output value in the regional GDP). Furthermore, the regional human resource base is measured in terms of the equivalent full-time equivalent of R&D staff (i.e., the sum of full-time R&D staff and part-time staff in terms of workload). Lastly, the development level of regional export-oriented economy is measured by the development of foreign-funded enterprises (the proportion of the main business income of foreign-funded enterprises to the regional GDP). The level of regional development, the proportion of the regional manufacturing industry, the development level of regional export-oriented economy, and the regional human resource base have positive impacts on green product innovation and green process innovation. The data related to the control variables mainly come from the Statistical Yearbook of China and the Statistical Yearbook of Science and Technology of China.
4. Empirical Analysis and Discussion of Results
4.1. Empirical Analysis
4.1.1. Empirical Model Construction
In this study, the fixed or random effect model of panel data will be used to fit the green technology innovation of regional enterprises. To reduce the heteroscedasticity of the equation and reduce the multiplex collinearity among the variables, the logarithmic entry of green technology innovation variables, government direct funding, tax preference variables and control variables into the model are carried out in the empirical model.
The Model of Environmental Regulation and Government R&D funding on green product innovation:
The model of environmental regulation and government R&D funding on green process innovation:
In the above equations, i in the variable subscript represent the province and t represents the year. , , , and respectively indicate green product innovation, green process innovation, environmental regulation intensity, government direct subsidy intensity and tax preference intensity of the i province in the t year. Moreover, represent control variables, including regional level of development rGDPit, regional manufacturing share rindusit, regional human capital rhumit, and level of regional extroverted economic development ropenit. In addition, is the constant term of the regression model, βj (j could be 1 to 5) is the coefficient of the independent variable to be estimated and is the residual term which can prevent the missing variable error.
4.1.2. Empirical Model Regression Results
Before the model fitting, the correlation of variables and multiple collinear tests were carried out. The variance expansion factor of the regional human resource base control variables was more than 10 in the test results. Thus, the model fitting was carried out by eliminating the regional human resource base variable correction multiplex collinearity, and then the fixed effect model fitting or random effect model fitting of panel data was selected by Hausman test. Empirical model regression fitting results are shown in Table 1 and Table 2 below.
Quadratic terms of environmental regulation are introduced in Model 1-3 and 2-3. The intensity of environmental regulation is standardized to avoid the problem of collinearity. Accordingly, the interaction terms of environmental regulation and government direct funding (enr*lngov1) or environmental regulation and tax preference are introduced in Model 1-4, 2-4, 1-5 and 2-5. Similarly, the interactive variables of environmental regulation, government direct funding, tax preference are standardized (centralization is another option) first, and then the interactive variables are generated to fit the model.
According to the model fitting results of environmental regulation and government R&D funding that affect green product innovation, when only control variables are added to Model 1-1, the results show that both the level of regional economic development and the degree of regional opening-up have a significant negative impact on the energy consumption of green product innovation, while the regional industrial structure has a positive impact on energy consumption. When independent variables are added to Model 1-2 (intensity of environmental regulation, direct government funding, and tax incentives for enterprise R&D), the results show that environmental regulation will play a significant positive role in the energy consumption of green product innovation. More specifically, as the intensity of environmental regulation increases, energy consumption increases gradually, which is not conducive to green technological innovation. In other words, both direct government subsidy and tax concessions will negatively affect the energy consumption of green product innovation, thus they are beneficial to green product innovation. The direct government subsidy has passed the significance test of 1% of the significant level, but the tax preferential policy of the government on the enterprises has no significant effect on the promotion of green product innovation. In Model 1-3, the quadratic term of environmental regulation is added based on Model 1-2, and the coefficient estimation result is significantly negative. Therefore, from the dynamic point of view, the change of environmental regulation intensity and green product innovation support the assumption of inverted “U” type relationship. Hence, there is a threshold for the intensity of environmental regulation. In Model 1-4, when the interaction between environmental regulation and direct government funding is added, the coefficient estimation results are significantly negative, which indicates that the interaction item has a significant negative effect on the energy consumption of green technology innovation. Therefore, the interaction between environmental regulation and government direct subsidy can promote the innovation of green products. In addition, in Model 1-5, the interaction between environmental regulation and government R&D tax preference is significantly negative, which indicates that the interaction item will significantly negatively affect the energy consumption in green product innovation. Therefore, we draw the conclusion that the interaction between environmental regulation and the preferential tax policy of the government can promote the green product innovation.
In the Model 3-1, which only introduces control variables, the level of regional economic development, the regional industrial structure, and the degree of regional opening-up will significantly affect the green process innovation (the green process innovation indicates the amount of wastewater treated by the main business income of the ten thousand yuan industrial enterprises). Hence, the level of regional economic development will significantly negatively affect the amount of green process innovation wastewater treatment, the industrial scale in the regional industrial structure, the degree of regional opening-up will significantly affect the amount of green process innovation wastewater treatment. Model 3-2 and Model 3-5 is a key analytical model with explanatory variables, which can be used to test research hypotheses. The result of coefficient estimation in Model 3-2 shows that the significant level of environmental regulation in 10% has a significant positive effect on the amount of wastewater treated with green process innovation. More specifically, with the increase of environmental regulation intensity, more wastewater is produced, which is not conducive to green process innovation. The government directly subsidizes the generation of highly significant negative effects on the production of green process innovation wastewater at the 1% level. In other words, direct government funding will significantly reduce the amount of waste water and be conducive to green process innovation, while the tax incentives of government R&D have no significant positive impact on the amount of waste water produced by green process innovation. In Model 3-3, the quadratic term of environmental regulation is introduced, and its coefficient is significantly negative. Therefore, the inverted “U” type relationship between environmental regulation and green process innovation can be verified. In Model 3-4, the interaction item between environmental regulation and government direct subsidy is introduced (enr*lngov1). The results show that the interaction coefficient has a positive relationship among environmental regulation and government direct subsidy policy and the amount of wastewater to be treated. Hence, interaction is not conducive to green process innovation. In addition, when the interaction between environmental regulation and government tax preference is introduced into Model 3-5, the interaction coefficient is also significantly positive. Hence, this paper holds that the interaction (enr*lngov2) between environmental regulation and government tax preferences will not be conducive to the development of green process innovation.
4.1.3. Robustness Test
In this section, the stability and validity of the empirical results (The regression model of environmental regulation, government R&D support and green product innovation) are tested by fitting the mixed regression model, the random (fixed) effect model and the panel mixed MLE estimation model, as shown in Table 3 below.
According to the regression model of environmental regulation, government R&D funding and green process innovation, this section uses the method of dependent variables to test the robustness. Discharge of Wastewater from the main business income of industrial enterprises per ¥ 10,000 (emission1), Sulfur dioxide emissions from the main business income of industrial enterprises per ¥ 10,000 (emission2), the amount of Industrial solid waste produced by the main Business income of Industrial Enterprises per ¥ 10,000 (emission3) are used as the explained variables to fit the regression model. For the stability and validity of the empirical results, see Table 4 below.
According to the regression results of different models, the coefficients and significance of environmental regulation, government direct subsidy, tax preference, interaction terms and control variables have little change compared with the original regression results. Therefore, the empirical regression results of environmental regulation, government R&D funding and green technology innovation are stable and effective.
4.2. Empirical Results Discussion
4.2.1. Environmental Regulation and Green Technology Innovation
Table 5 shows the research hypotheses and empirical results of environmental regulation on green technology innovation. Apparently, the hypothesis of environmental regulation on green technological innovation (green product innovation and green process innovation) is clearly verified and supported.
The empirical findings show that environmental regulation has a significant inhibitory effect on green product innovation and green process innovation. This restraint effect is mainly realized by the restriction effect brought by the setting of environmental standard and the extrusion effect brought by environmental regulation internalizing environmental cost. Furthermore, if we divide green technology innovation behavior into R&D input and innovation output, we can analyze the effect of environmental regulation on green technology innovation: The limiting effect is to reduce innovation output through standard-setting, and the extrusion effect is to squeeze out R&D investment through increased environmental costs. In view of this, the green product innovation and green process innovation are analyzed in detail: the green product innovation emphasizes the “energy saving” goal in the green technology innovation. However, the current environmental regulation has only the extrusion effect of increasing environmental cost, but not the limiting effect of energy conservation standards. So, it is concluded that the restraining effect of environmental regulation on green product innovation is mainly the constraint effect of squeezing out R&D investment; green process innovation pays more attention to the goal of “reducing emissions”. At present, there are many emission reduction standards for environmental protection, which limit green technology innovation and increase environmental costs and squeeze out R&D investment. Hence, the inhibition of environmental regulation on green process innovation includes the restriction of output and the extrusion of R&D input.
Table 6 shows the analysis results of restraining effect of environmental regulation on green technology innovation. From the perspective of dynamic analysis, environmental regulation quadratic terms and green product innovation and green process innovation show a significant “U-shaped relationship”, indicating that there is an “inflection point” in the relationship. More specifically, the amount of pollution and energy consumption will increase with the enhancement of environmental regulation before the “inflection point”; the amount of pollution and energy consumption will be reduced when environmental regulation is strengthened after the “inflection point”. Combined with the analysis results of environmental regulation and its quadratic terms, the current environmental regulation spot in China is before the “inflection point” under the dynamic development perspective. Hence, environmental regulation can significantly inhibit green technological innovation (green product innovation and green process innovation).
4.2.2. Government R&D Subsidy and Green Technology Innovation
Table 7 shows the comparison of research hypothesis and empirical results of government R&D funding on green technology innovation. The results show that the government direct R&D funding policy has proved its promoting effect on green product innovation and green process innovation and has passed the significance test. In addition, the role of the government in promoting R&D tax incentives has also been supported, but the role is not significant.
Theoretically, the role of government R&D support in promoting green technology innovation is the incentive effect of government R&D funding on green technology innovation. On the one hand, it can stimulate enterprises by reducing risk and cost. On the other hand, government guidance can encourage social investment and leverage R&D investment. Hence, in the aspect of green technology innovation input and output, government R&D support mainly plays an important role in R&D input, which can effectively stimulate R&D investment of green technology innovation.
In general, direct government funding is mostly carried out in the form of financial allocations. Direct funding for specific R&D projects is a pre-R&D policy. The preferential tax policy is mainly to deduct the costs of R&D for enterprises. It is an after-R&D policy. The empirical results show that the promotion of tax preferential policies is not significant which indicate that the implementation of tax preferential policies in China is not in place (perhaps because the taxation of science and technology innovation is difficult to measure). Hence, the tax preferential policy has not yet played an important role in promoting green technology innovation.
4.2.3. Environmental Regulation, Government R&D Subsidy and Green Technology Innovation
Table 8 shows the research hypotheses and empirical results of interaction terms (environmental regulation * government direct funding, environmental regulation * tax preference) on green technology innovation. The empirical findings indicate that the interaction between environmental regulation and government R&D funding has a significant role in promoting green product innovation, while the interaction between environmental regulation and government R&D funding has a significant inhibitory effect on green process innovation.
Figure 2 shows the theoretical mechanism of interaction between environmental regulation and government R&D funding. Government R&D funding will regulate the role of environmental regulation on green technology innovation by changing the investment in technology innovation of enterprises. In addition, environmental regulation can provide green guidance for technology innovation of government R&D supported enterprises through the standards and targets of energy saving and emission reduction. Specifically, environmental regulation will squeeze out R&D inputs and constrain innovation outputs, and government R&D funding will increase R&D investment through incentive effects. Moreover, the incentive effect of government R&D funding on R&D investment will weaken or offset the crowding out effect of environmental regulation on R&D investment. However, environmental regulation can amplify the incentive effect of government R&D funding on green technology innovation through green guidance.
To green product innovation, the inhibition of environmental regulation is mainly to squeeze out R&D investment. However, government R&D funding will increase the R&D investment of green technology innovation through incentive effect. Increased input in technology innovation from government R&D funding will counteract the squeezing constraint of environmental regulation. Therefore, under the joint action of environmental regulation and government R&D funding, green product innovation can be promoted significantly.
To green process innovation, environmental regulation will squeeze out R&D input and limit innovation output. Government R&D funding will increase R&D investment through incentive effect notwithstanding. Because the environmental regulation has a greater effect on the input extrusion and output restriction of green process innovation, the incentive effect of government R&D funding on R&D investment cannot effectively offset or reduce the inhibitory effect of environmental regulation. Therefore, the interaction between environmental regulation and government R&D funding has a significant inhibitory effect on green process innovation.
In general, the matching of environmental regulation and government R&D funding policy is very important for green technology innovation. Firstly, the current environmental regulation of China pays less attention to “energy saving” of green product innovation constraints. The green guidance regulation of environmental regulation and the increase of government R&D investment can alleviate the inhibition of environmental regulation to a certain extent, thus the interaction can significantly promote green product innovation. Secondly, there are relatively many restriction standards of green process innovation which focus on “emission reduction”. The green guidance regulation of environmental regulation and the increase of government R&D investment can hardly counteract the restraining effect of environmental regulation. So, the final performance of interaction is significantly averse to the development of green process innovation.
5. Conclusions and Inspirations
According to the above empirical findings, we could easily draw the following conclusions:
Firstly, China’s current environmental regulation will significantly inhibit green technology innovation. From the perspective of dynamic development, environmental regulation has an appropriate “inflection point” for the transformation of the role of environmental regulation on green technology innovation. However, China is on the left side of the “inflection point” of the appropriate intensity of environmental regulation. Hence, the current environmental regulation intensity in China needs to be strengthened to make it cross the “inflection point” and promote the innovation compensation and inductive effect of green technology innovation.
Secondly, the direct government subsidy policy and tax preferential policy will promote green technology innovation, but the government tax preferential policy is flawed and imperfect. Therefore, the government should draw attention to perfecting and implementing the R&D tax preferential policy when adhering to the direct subsidy policy of green technology innovation.
Thirdly, the interaction between environmental regulation and government R&D will promote green product innovation and inhibit green process innovation, which is closely related to the imbalance of environmental regulation intensity in energy saving and emission reduction. Hence, the “energy saving” environmental regulation for green product innovation will need to be strengthened; the corresponding government R&D funding should also be increased. Similarly, the current environmental regulation of “emission reduction” for green process innovation is relatively strong, only through the strengthening of government R&D support to regulate the inhibition of environmental regulation on green process innovation.
Lastly, according to the coefficient estimation of the control variable of regional difference in empirical research, the regional development level will significantly promote green technology innovation; the proportion of regional manufacturing industry will significantly inhibit green technology innovation; and regional export-oriented economic development level will significantly promote green product innovation but inhibit green process innovation. Hence, the regional government should formulate local environmental regulation policy and R&D subsidy policy according to the degree of local economic development, manufacturing development and opening to the outside world.
This study is not without limitation, as the focus is on the China current development scenario to discuss the solutions to get out of the “environment pollution–economic development” cycle. This makes the findings of the study not necessarily consistent with those in the context of the developed countries, and the implications of the research are not necessarily applicable to other developing countries either. Further studies could include other development countries (such as BRICS) or developed countries (EU or US). In addition, this study only focuses on the two public policies of environmental regulation and government R&D funding to discuss the green technology innovation. However, green technology innovation is a complex concept, which may also be influenced by the policy of cultivating scientific and technological talents and the policy of attracting foreign investment. Further studies could include wider policies to examine the effects to green technology innovation in more depth.
Acknowledgments
We thank the anonymous review experts for their advice, which is very important for the improvement of the article.
Author Contributions
Sheng Zhang and Yinyuan Guo conceived and designed the article framework and research design; Yingyuan Guo, Xingneng Xia and Danpin Zhang collected and analyzed the data; Yingyuan Guo, Danpin Zhang and Xingneng Xia wrote the paper.
Conflicts of Interest
The authors declare no conflict of interest.
References
- Columbia University. The Environmental Performance Index Ranks Countries’ Performance on High-Priority Environmental Issues. Available online: http://sedac.ciesin.columbia.edu/data/set/epi-environmental-performance-index-2016 (accessed on 10 December 2017).
- Yale University. The Environmental Performance Index Ranks Countries’ Performance on High-Priority Environmental Issues. Available online: http://epi.yale.edu/sites/default/files/Yale%20EPI%202016_Report_0.pdf (accessed on 10 December 2017).
- Braun, E.; Wield, D. Regulation as a means for the social control of technology. Technol. Anal. Strateg. Manag. 1994, 6, 259–272. [Google Scholar] [CrossRef]
- Norberg-Bohm, V. Stimulating ‘green’ technological innovation: An analysis of alternative policy mechanisms. Policy Sci. 1999, 32, 13–38. [Google Scholar] [CrossRef]
- Chen, Y.S.; Lai, S.B.; Wen, C.T. The Influence of Green Innovation Performance on Corporate Advantage in Taiwan. J. Bus. Ethics 2006, 67, 331–339. [Google Scholar] [CrossRef]
- Byron, C.J.; Jin, D.; Dalton, T.M. An Integrated ecological–economic modeling framework for the sustainable management of oyster farming. Aquaculture 2015, 447, 15–22. [Google Scholar] [CrossRef]
- Ooba, M.; Hayashi, K.; Fujii, M.; Fujita, T.; Machimura, T.; Matsui, T. A long-term assessment of ecological-economic sustainability of woody biomass production in Japan. J. Clean. Prod. 2015, 88, 318–325. [Google Scholar] [CrossRef]
- Esty, D.C.; Porter, M.E. National environmental performance: An empirical analysis of policy results and determinants. Environ. Dev. Econ. 2005, 10, 391–434. [Google Scholar] [CrossRef]
- Lankoski, L. Linkages between Environmental Policy and Competitiveness. Available online: http://www.olis.oecd.org/olis/2008doc.nsf/LinkTo/NT0000B20E/$FILE/JT03268619.PDF (accessed on 25 December 2017).
- Leeuwen, G.V.; Mohnen, P. Revisiting the Porter hypothesis: An empirical analysis of Green innovation for the Netherlands. Econ. Innov. New Technol. 2013, 67, 295–319. [Google Scholar] [CrossRef]
- Zhao, X.; Sun, B. The influence of Chinese environmental regulation on corporation innovation and competitiveness. J. Clean. Prod. 2016, 112, 1528–1536. [Google Scholar] [CrossRef]
- Zhao, X.K. Lead to Green Innovation: Research of Innovation-Oriented Environmental Policy; Economic Science Press: Beijing, China, 2006; ISBN 9787505855120. [Google Scholar]
- Feichtinger, G.; Hartl, R.F.; Kort, P.M.; Veliov, V.M. Environmental Policy, the Porter Hypothesis and the Composition of Capital: Effects of Learning and Technological Progress. J. Environ. Econ. Manag. 2003, 50, 434–446. [Google Scholar] [CrossRef]
- Zhao, X.; Zhao, Y.; Zeng, S.; Zhang, S. Corporate behavior and competitiveness: Impact of environmental regulation on Chinese firms. J. Clean. Prod. 2015, 86, 311–322. [Google Scholar] [CrossRef]
- Gray, W.B.; Shadbegian, R.J. Plant vintage, technology, and environmental regulation. J. Environ. Econ. Manag. 2001, 46, 384–402. [Google Scholar] [CrossRef]
- Bezdek, M. The Effects of Environmental Regulation on the Competitiveness of U.S. Manufacturing; No. w18392; National Bureau of Economic Research: Cambridge, MA, USA, 2012; pp. 67–69. [Google Scholar]
- Chintrakarn, P. Environmental regulation and US states’ technical inefficiency. Econ. Lett. 2008, 100, 363–365. [Google Scholar] [CrossRef]
- Sinn, H.W. Public policies against global warming: A supply side approach. Int. Tax Public Financ. 2008, 15, 360–394. [Google Scholar] [CrossRef]
- Qi, C.Q.; Zhang, H. Spatial differences of technological Innovation effects of Environmental Regulation: An empirical Analysis based on Chinese Panel data from 2000 to 2013. Macroeconomics 2015, 72–83. [Google Scholar] [CrossRef]
- Zhang, H.; Wei, X.P. Green Paradox or Forced Emission-reduction: Dual Effect of Environmental Regulation on Carbon Emissions. China Popul. Resour. Environ. 2014, 24, 21–29. [Google Scholar]
- Li, L.; Tao, F. Selection of Optimal Environmental Regulation Intensity for Chinese Manufacturing Industry—Based on the Green TFP Perspective. China Ind. Econ. 2012, 5, 70–82. [Google Scholar]
- Jiang, F.X.; Wang, Z.J.; Bai, J.H. The Dual Effect of Environmental Regulations’ Impact on Innovation—An Empirical Study Based on Dynamic Panel Data of Jiangsu Manufacturing. China Ind. Econ. 2013, 44–55. [Google Scholar] [CrossRef]
- Ai, Z.H. Incentive Regulation based on Green technological Innovation. J. Hubei Univ. Econ. 2010, 7, 64–65. [Google Scholar]
- He, X.G. Research on Optimal Regulation Strcture of Green Technology Innovation—Based On the Dual Interactive Effect of R&D Support and Environmental Regulation. Econ. Manag. 2014, 144–153. [Google Scholar] [CrossRef]
- Wallsten, S.J. The Effects of Government-Industry R&D Programs on Private R&D: The Case of the Small Business Innovation Research Program. Rand J. Econ. 2000, 31, 82–100. [Google Scholar] [CrossRef]
- Theofanis, P.; Mamuneas, M.; Ishaq, N. Public R&D policies and cost behavior of the US manufacturing industries. J. Public Econ. 1996, 63, 57–81. [Google Scholar] [CrossRef]
- Hall, B.; Van Reenen, J. How effective are fiscal incentives for R&D? A review of the evidence. Res. Policy 2000, 29, 449–469. [Google Scholar] [CrossRef]
- Guellec, D. Applications, grants and the value of patent. Econ. Lett. 2000, 69, 109–114. [Google Scholar] [CrossRef]
- Jiang, Y.J.; Yang, Q.L. Local Government Intervention, Environmental Regulation and Technological Innovation—Based on Panel Data of Provinces in China. J. Anhui Adm. Inst. 2015, 35–39. [Google Scholar] [CrossRef]
- Cao, Y.; Jiang, Z.Y.; Sun, H.l.; Xiong, S.Y. Environment Regulations and Technological Innovation Performance: The Moderating Effect of Government Support. Forum Sci. Technol. China 2015, 81–86. [Google Scholar] [CrossRef]
- Ma, F.P.; Cha, N. The Impact of Environmental Regulation on Technological Innovation Performance—The Moderating Role of Institutional Environment. R&D Manag. 2012, 24, 60–66. [Google Scholar] [CrossRef]
- Féres, J.; Reynaud, A. Assessing the Impact of Formal and Informal Regulations on Environmental and Economic Performance of Brazilian Manufacturing Firms. Environ. Resour. Econ. 2012, 131, 75–84. [Google Scholar] [CrossRef]
- Van Rooij, B.; Fryxell, G.E.; Lo, C.W.-H.; Wang, W. From support to pressure: The dynamics of social and governmental influences on environmental law enforcement in Guangzhou City, China. Regul. Gov. 2013, 7, 321–347. [Google Scholar] [CrossRef]
- Tang, C.A.; Huang, P. The Environmental Protection Innovation Behavior of the Enterprise Technical Alliance under the Constraint of Optimal Environmental Tax. Syst. Eng. 2013, 31, 115–119. [Google Scholar]
- Yuan, L.; Su, Z.; Yi, L. Can strategic flexibility help firms profit from product innovation? Technovation 2010, 30, 300–309. [Google Scholar] [CrossRef]
- Awasthi, A.; Chauhan, S.S.; Goyal, S.K. A fuzzy multicriteria approach for evaluating environmental performance of suppliers. Int. J. Prod. Econ. 2010, 126, 370–378. [Google Scholar] [CrossRef]
- Bi, K.X.; Ma, H.Z.; Li, W.H. Interpretive Structural Modeling of Critical Success Factors for Implementing Green Process Innovation in Manufacturing Enterprises. Adv. Mater. Res. 2011, 361–363, 1026–1029. [Google Scholar] [CrossRef]
- Xie, X.; Huo, J.; Qi, G.; Zhu, K.X. Green Process Innovation and Financial Performance in Emerging Economies: Moderating Effects of Absorptive Capacity and Green Subsidies. IEEE Trans. Eng. Manag. 2015, 63, 1–12. [Google Scholar] [CrossRef]
- Bi, K.X.; Yang, C.J.; Huang, P. Research on the Impact of FDI on the Green Process Innovation of Chinese Manufacturing Industries: An Empirical Analysis Based on the Panel Data. China Soft Sci. 2011, 9, 172–180. [Google Scholar]
- Porter, M.E. America’s Green Strategy. Sci. Am. 1991, 193–246. [Google Scholar] [CrossRef]
- Porter, M.E.; Linde, C.V.D. Toward a New Conception of the Environment-Competitiveness Relationship. J. Econ. Perspect. 1995, 9, 97–118. [Google Scholar] [CrossRef]
- Chiou, T.Y.; Chan, H.K.; Lettice, F.; Chung, S.H. The influence of greening the suppliers and green innovation on environmental performance and competitive advantage in Taiwan. Transp. Res. Part E Logist. Transp. Rev. 2011, 47, 822–836. [Google Scholar] [CrossRef]
- Zhang, H.; Zhu, Z.; Fan, Y. The impact of environmental regulation on the coordinated development of environment and economy in China. Nat. Hazards 2017, 1–17. [Google Scholar] [CrossRef]
- Yuan, B.; Ren, S.; Chen, X. Can environmental regulation promote the coordinated development of economy and environment in China’s manufacturing industry?—A panel data analysis of 28 sub-sectors. J. Clean. Prod. 2017, 149, 11–24. [Google Scholar] [CrossRef]
- Yuan, B.; Xiang, Q. Environmental regulation, industrial innovation and green development of Chinese manufacturing: Based on an extended CDM model. J. Clean. Prod. 2018, 176, 895–908. [Google Scholar] [CrossRef]
- Feng, Z.; Chen, W.; Rosen, M.A. Environmental Regulation, Green Innovation, and Industrial Green Development: An Empirical Analysis Based on the Spatial Durbin Model. Sustainability 2018, 10, 223. [Google Scholar] [CrossRef]
- Javorcik, B.S.; Wei, S.J. Pollution Havens and Foreign Direct Investment: Dirty Secret or Popular Myth? Contrib. Econ. Anal. Policy 2001, 3, 1244. [Google Scholar] [CrossRef]
- Isern, J.; Bravo, E.; Hirschmann, A. Environmental Regulation and Productivity: Evidence from Oil Refineries. Rev. Econ. Stat. 2001, 83, 498–510. [Google Scholar]
- Brunnermeier, S.B.; Cohen, M.A. Determinants of environmental innovation in US manufacturing industries. J. Environ. Econ. Manag. 2003, 45, 278–293. [Google Scholar] [CrossRef]
- Levinson, A. Environmental regulations and manufacturers’ location choices: Evidence from the Census of Manufactures. J. Public Econ. 1996, 62, 5–29. [Google Scholar] [CrossRef]
- Zhang, C.; Yu, T.S.; Guo, L. Does Environmental Regulation Influence Industrial Productivity in China—The Empirical Test Based on DEA and Co-integration Analysis. Econ. Theory Bus. Manag. 2010, 11–17. [Google Scholar]
- Lanoie, P.; Patry, M.; Lajeunesse, R. Environmental regulation and productivity: Testing the porter hypothesis. J. Product. Anal. 2008, 30, 121–128. [Google Scholar] [CrossRef]
- Zhang, C.; Yang, L.; Guo, L.; Yu, T.S. The Intensity of Environmental Regulation and Technological Progress of Production. Econ. Res. J. 2011, 46, 113–124. [Google Scholar]
- Zhang, H. Exploring the impact of environmental regulation on economic growth, energy use, and CO2, emissions nexus in China. Nat. Hazards 2016, 84, 213–231. [Google Scholar] [CrossRef]
- Liu, J.; Ran, M. Effect of the Intensity of Environmental Regulation on Production Technology Progress in 17 Industries: Evidence from China. Pol. J. Environ. Stud. 2014, 67, 678–679. [Google Scholar]
- Lei, P.; Tian, X.; Huang, Q.; He, D. Firm Size, Government Capacity, and Regional Environmental Regulation: Theoretical Analysis and Empirical Evidence from China. J. Clean. Prod. 2017. [Google Scholar] [CrossRef]
- Cole, M.A.; Elliott, R.; Shimamoto, K. Why the grass is not always greener: The competing effects of environmental regulations and factor intensities on US specialization. Ecol. Econ. 2004, 54, 95–109. [Google Scholar] [CrossRef]
- Domazlicky, B.R.; Weber, W.L. Does Environmental Protection Lead to Slower Productivity Growth in the Chemical Industry? Environ. Resour. Econ. 2004, 28, 301–324. [Google Scholar] [CrossRef]
- Cole, M.A.; Elliott, R.J.R. Do Environmental Regulations Influence Trade Patterns? Testing Old and New Trade Theories. World Econ. 2003, 26, 1163–1186. [Google Scholar] [CrossRef]
- Romer, P.M. Endogenous Technological Change. J. Political Econ. 1990, 71–102. [Google Scholar] [CrossRef]
- Grossman, G.M.; Helpman, E. Innovation and Growth in the Global Economy; MIT Press: Cambridge, MA, USA, 1993; Volume 1, pp. 323–324. [Google Scholar]
- Li, Y.; Meng, X.Y.; Wang, Y.P. Public R&D Subsidies and Enterprise Technology Innovation: An Empirical Analysis Based on Multi-Dimensional Industry Heterogeneity. Sci. Sci. Manag. S & T 2014, 35, 33–41. [Google Scholar]
- Hu, M.Y.; Zh, J.Z. Impact of Government Funding on the Technology Innovation: The Theory Analysis and Selection of Policy Tools. Sci. Res. Manag. 2001, 22, 31–36. [Google Scholar] [CrossRef]
- Lian, Y.H.; Zhen, Y.R.; Yu, H. Government fund ing and enterprise technology innovatio. Sci. Res. Manag. 2005, 26, 18–25. [Google Scholar] [CrossRef]
- Wei, J.; Liu, Y. Government support and firm innovation performance: Empirical analysis of 343 innovative enterprises in China. Chin. Manag. Stud. 2015, 9, 38–55. [Google Scholar] [CrossRef]
Figure 1.
Theoretical model of the role of environmental regulation and government R&D funding in green technology innovation.
Figure 1.
Theoretical model of the role of environmental regulation and government R&D funding in green technology innovation.

Figure 2.
Analysis of the role of environmental regulation and government R&D funding in green technology innovation.
Figure 2.
Analysis of the role of environmental regulation and government R&D funding in green technology innovation.


Table 1.
Regression model of environmental regulation and government R&D funding affecting green product innovation.
Table 1.
Regression model of environmental regulation and government R&D funding affecting green product innovation.
| Variable | Model 1-1 | Model 1-2 | Model 1-3 | Model 1-4 | Model 1-5 |
|---|---|---|---|---|---|
| enr | 34.0137 ** | 0.2967 *** | 0.3297 *** | 0.3008 *** | |
| (15.95239) | (0.074676) | (0.073699) | (0.078535) | ||
| enr2 | −0.0528 *** | −0.0631 *** | −0.0782 *** | ||
| (0.016115) | (0.016069) | (0.019669) | |||
| lngov1 | −0.5050 *** | −0.4425 *** | −0.4228 *** | −0.4798 *** | |
| (0.079906) | (0.078975) | (0.077731) | (0.933369) | ||
| lngov2 | −0.0627 | −0.0790 | −0.0734 | −0.0660 | |
| (0.050364) | (0.049476) | (0.048229) | (0.051915) | ||
| enr*lngov1 | −0.1120 *** | ||||
| (0.036638) | |||||
| enr*lngov2 | −0.1118 *** | ||||
| (0.038252) | |||||
| lnrGDP | −1.2671 *** | −0.3823 *** | −0.2111 | −0.1895 | −0.2543 |
| (0.166544) | (0.148513) | (0.150742) | (0.148263) | (0.194009) | |
| lnrindus | 0.1171 | 0.0875 | 0.0814 | 0.0909 | 0.0859 |
| (0.099095) | (0.085702) | (0.084226) | (0.082007) | (0.084592) | |
| lnropen | −0.4263 *** | −0.4658 *** | −0.4702 *** | −0.4756 *** | −0.5124 *** |
| (0.120066) | (0.070031) | (0.066226) | (0.065419) | (0.104694) | |
| constant | 16.52007 *** | 13.545 *** | 11.4154 *** | 10.87197 *** | 12.22418 *** |
| (2.003468) | (1.377752) | (1.448046) | (1.434603) | (1.923735) | |
| Numbers | 180 | 180 | 180 | 180 | 180 |
| p Value | 0.0000 | 0.0000 | 0.0000 | 0.0000 | 0.0000 |
| Hausman Test results | Fixed effect model | Random effect model | Random effect model | Random effect model | Fixed effect model |
The number in brackets in the table is the standard error in the coefficient estimation; significance test: * p < 0.10, ** p < 0.05, *** p < 0.01; the square term is introduced into Model 1-3. To solve the problem of collinearity, standardized processing of enr variables is made; the interactive terms are introduced into Model 1-4 and 1-5 to avoid the problem of collinearity, the variables are standardized first.
Table 2.
Regression model of environmental regulation and government R&D funding affecting green process innovation.
Table 2.
Regression model of environmental regulation and government R&D funding affecting green process innovation.
| Variable | Model 2-1 | Model 2-2 | Model 2-3 | Model 2-4 | Model 2-5 |
|---|---|---|---|---|---|
| enr | 29.2716 * | 0.3090 *** | 0.2585 *** | 0.2713 *** | |
| (16.50643) | (0.077753) | (0.076892) | (0.078464) | ||
| enr2 | −0.0577 *** | −0.0443 *** | −0.0322 | ||
| (0.016307) | (0.016319) | (0.019651) | |||
| lngov1 | −0.2870 *** | −0.2304 ** | −0.2526 *** | −0.2421 *** | |
| (0.096709) | (0.094430) | (0.091698) | (0.093252) | ||
| lngov2 | 0.0084 | −0.0111 | −0.0132 | −0.0060 | |
| (0.054311) | (0.052554) | (0.050895) | (0.051868) | ||
| enr*lngov1 | 0.1193 *** | ||||
| (0.036819) | |||||
| enr*lngov2 | 0.0862 ** | ||||
| (0.038217) | |||||
| lnrGDP | −1.9018 *** | −1.6827 *** | −1.4935 *** | −1.5575 *** | −1.5332 *** |
| (0.100477) | (0.195694) | (0.195769) | (0.190602) | (0.193833) | |
| lnrindus | 0.2727 *** | 0.2681 *** | 0.2637 *** | 0.2593 *** | 0.2751 *** |
| (0.087812) | (0.088907) | (0.085564) | (0.082868) | (0.084516) | |
| lnropen | 0.1822 *** | −0.0077 | −0.0333 | −0.0391 | −0.0411 |
| (0.065988) | (0.109923) | (0.106025) | (0.102687) | (0.104599) | |
| constant | 21.40082 *** | 22.63441 *** | 20.4584 *** | 21.4666 *** | 20.99449 *** |
| (1.145417) | (1.91429) | (1.934323) | (1.898798) | (1.921993) | |
| Numbers | 180 | 180 | 180 | 180 | 180 |
| p Value | 0.0000 | 0.0000 | 0.0000 | 0.0000 | 0.0000 |
| Hausman Test results | Random effect model | Fixed effect model | Fixed effect model | Fixed effect model | Fixed effect model |
The number in brackets in the table is the standard error in the coefficient estimation; significance test: * p < 0.10, ** p < 0.05, *** p < 0.01; the square terms are introduced into Model 2-3, 2-4 and 2-5. To solve the problem of collinearity, standardized processing of enr variables is made; the interactive terms are introduced into Model 2-4 and 2-5 to avoid the problem of collinearity, the variables are standardized first.
Table 3.
Results of robustness test (1).
| Variable | Model 3-1 | Model 3-2 | Model 3-3 | Model 3-4 | Model 3-5 | Model 3-6 |
|---|---|---|---|---|---|---|
| enr | 0.3297 *** | 0.2990 *** | 0.3272 *** | 0.3316 *** | 0.3316 *** | 0.3277 *** |
| (0.073699) | (0.112319) | (0.072068) | (0.074265) | (0.088167) | (0.072477) | |
| enr2 | −0.0631 *** | −0.0576 *** | −0.0627 *** | −0.0825 *** | −0.0825 *** | −0.0819 *** |
| (0.016069) | (0.020703) | (0.015654) | (0.019017) | (0.020716) | (0.018436) | |
| lngov1 | −0.4228 *** | −0.4744 *** | −0.4264 *** | −0.4247 *** | −0.4247 *** | −0.4305 *** |
| (0.077731) | (0.102773) | (0.076941) | (0.077915) | (0.095034) | (0.077314) | |
| lngov2 | −0.0734 | −0.0574 | −0.0718 | −0.0802 * | −0.0802 | −0.0778 * |
| (0.048229) | (0.065931) | (0.047126) | (0.048444) | (0.064106) | (0.047194) | |
| enr*lngov1 | −0.1120 *** | −0.1110 ** | −0.1120 *** | |||
| (0.036638) | (0.052103) | (0.035522) | ||||
| enr*lngov2 | −0.1056 *** | −0.1056 ** | −0.1064 *** | |||
| (0.037538) | (0.048361) | (0.036312) | ||||
| lnrGDP | −0.1895 | −0.2463 | −0.1928 | −0.1932 | −0.1932 | −0.1987 |
| (0.148263) | (0.171132) | (0.146033) | (0.148518) | (0.153026) | (0.146928) | |
| lnrindus | 0.0909 | 0.1047 | 0.0918 | 0.072260 | 0.0723 | 0.0735 |
| (0.082007) | (0,123106) | (0.079553) | (0.082457) | (0.086515) | (0.079727) | |
| lnropen | −0.4756 *** | −0.5172** | −0.4770 *** | −0.4641 *** | −0.4641 *** | −0.4665 *** |
| (0.065419) | (0.240299) | (0.064957) | (0.065459) | (0.100711) | (0.065622) | |
| constant | 10.87197 *** | 11.98102 *** | 10.9324 *** | 10.99708 *** | 10.99708 *** | 11.09908 *** |
| (1.434603) | (1.910714) | (1.421713) | (1.433563) | (1.217305) | (1.427479) | |
| Types of model | Mixed regression model | Fixed effect model | MLE estimation model | Mixed regression model | Random effect model | MLE estimation model |
The number in brackets in the table is the standard error in the coefficient estimation, and the t statistic can be obtained by dividing the coefficient by the standard error; Significance test: * p < 0.10, ** p < 0.05, *** p < 0.01.
Table 4.
Results of robustness test (2).
| Variable | Emission1 | Emission2 | Emission3 | Emission1 | Emission2 | Emission3 |
|---|---|---|---|---|---|---|
| Model 4-1 | Model 4-2 | Model 4-3 | Model 4-4 | Model 4-5 | Model 4-6 | |
| enr | 0.4206 *** | 0.3169 *** | 0.4143 *** | 0.4205 *** | 0.3261 *** | 0.3958 *** |
| (0.066405) | (0.045793) | (0.071094) | (0.066661) | (0.047568) | (0.077555) | |
| enr2 | −0.0821 *** | −0.0578 *** | −0.0649 *** | −0.0788 *** | −0.0448 *** | −0.0518 *** |
| (0.014729) | (0.009719) | (0.015621) | (0.017307) | (0.011913) | (0.019423) | |
| lngov1 | −0.0366 | −0.0838 | −0.0827 | −0.0361 | −0.0750 | −0.1096 |
| (0.066683) | (0.054610) | (0.07319) | (0.066641) | (0.056533) | (0.092172) | |
| lngov2 | −0.0019 | −0.0199 | −0.1530 *** | −0.00058 | −0.0129 | −0.1371 *** |
| (0.043886) | (0.030310) | (0.046708) | (0.043867) | (0.031444) | (0.051267) | |
| enr*lngov1 | 0.0227 | 0.1104 *** | 0.1041 *** | |||
| (0.033769) | (0.021927) | (0.035710) | ||||
| enr*lngov2 | 0.0190 | 0.0860 *** | 0.0564 | |||
| (0.034430) | (0.023169) | (0.037775) | ||||
| lnrGDP | −1.0487 *** | −1.3159 *** | −0.7084 *** | −1.0478 *** | −1.2963 *** | −0.6659 *** |
| (0.124489) | (0.113512) | (0.138067) | (0.124340) | (0.117509) | (0.191587) | |
| lnrindus | 0.1330 * | 0.0415 | 0.1480 * | 0.1367 * | 0.0569 | 0.1241 |
| (0.075652) | (0.049352) | (0.079953) | (0.075680) | (0.051237) | (0.083537) | |
| lnropen | −0.2685 *** | 0.1908 *** | −0.2832 *** | −0.2662 *** | 0.1883 *** | −0.2450 ** |
| (0.052328) | (0.061154) | (0.059382) | (0.052227) | (0.063412) | (0.065622) | |
| constant | 2.7681 ** | 8.8236 *** | 0.7959 | 2.740 *** | 8.4251 *** | 0.3542 |
| (1.215321) | (1.130814) | (1.340458) | (1.212238) | (1.165188) | (1.899726) | |
| Types of model | Random effect model | Fixed effect model | Random effect model | Random effect model | Fixed effect model | Fixed effect model |
The number in brackets in the table is the standard error in the coefficient estimation, and the t statistic can be obtained by dividing the coefficient by the standard error; Significance test: * p < 0.10, ** p < 0.05, *** p < 0.01.
Table 5.
Comparison of research hypotheses and empirical results of environmental regulation on green technology innovation.
Table 5.
Comparison of research hypotheses and empirical results of environmental regulation on green technology innovation.
| Green Product Innovation | Green Process Innovation | ||||
|---|---|---|---|---|---|
| Research Hypotheses | Empirical Results | Research Hypotheses | Empirical Results | ||
| Governmental regulation | enr | inhibition | inhibition, significant | inhibition | inhibition, significant |
| enr2 | Inverted “U” type relation | Inverted “U” type relation | Inverted “U” type relation | Inverted “U” type relation | |
Table 6.
Analysis of restraining effect of environmental regulation on green technology Innovation.
| Environmental Regulation Effect | R&D Input | Innovation Output | |
|---|---|---|---|
| Green Technology Innovation | |||
| Green product innovation | Extrusion effect | / | |
| Green process innovation | Extrusion effect | Limiting effect | |
Table 7.
Comparison of research hypothesis and empirical results of government R&D funding on green technology innovation.
Table 7.
Comparison of research hypothesis and empirical results of government R&D funding on green technology innovation.
| Green Product Innovation | Green Process Innovation | ||||
|---|---|---|---|---|---|
| Research Hypothesis | Empirical Result | Research Hypothesis | Empirical Result | ||
| Government R&D funding | Government direct funding | promotion | promotion, significant | promotion | Promotion significant |
| Tax preference | promotion | Promotion insignificant | promotion | Promotion insignificant | |
Table 8.
Comparison of research hypothesis and empirical results of interactive terms on green technology innovation.
Table 8.
Comparison of research hypothesis and empirical results of interactive terms on green technology innovation.
| Green Product Innovation | Green Process Innovation | ||||
|---|---|---|---|---|---|
| Research Hypothesis | Empirical Result | Research Hypothesis | Empirical Result | ||
| Interaction between Environmental Regulation and Government R&D funding | Environmental Regulation * Government Direct funding | promotion | promotion, significant | promotion | inhibition, significant |
| Environmental Regulation * tax preference | promotion | promotion, significant | promotion | inhibition, significant | |
© 2018 by the authors. Licensee MDPI, Basel, Switzerland. This article is an open access article distributed under the terms and conditions of the Creative Commons Attribution (CC BY) license (http://creativecommons.org/licenses/by/4.0/).
Share and Cite
MDPI and ACS Style
Guo, Y.; Xia, X.; Zhang, S.; Zhang, D. Environmental Regulation, Government R&D Funding and Green Technology Innovation: Evidence from China Provincial Data. Sustainability 2018, 10, 940. https://doi.org/10.3390/su10040940
AMA Style
Guo Y, Xia X, Zhang S, Zhang D. Environmental Regulation, Government R&D Funding and Green Technology Innovation: Evidence from China Provincial Data. Sustainability. 2018; 10(4):940. https://doi.org/10.3390/su10040940
Chicago/Turabian StyleGuo, Yingyuan, Xingneng Xia, Sheng Zhang, and Danping Zhang. 2018. "Environmental Regulation, Government R&D Funding and Green Technology Innovation: Evidence from China Provincial Data" Sustainability 10, no. 4: 940. https://doi.org/10.3390/su10040940
Note that from the first issue of 2016, this journal uses article numbers instead of page numbers. See further details here.