Article

Carbon Footprint and Driving Forces of Saline Agriculture in Coastally Reclaimed Areas of Eastern China: A Survey of Four Staple Crops

1
School of Geography, Geomatics, and Planning, Jiangsu Normal University, Xuzhou 221116, China
2
Department of Geography and School of Global Studies, University of Sussex, Falmer, Brighton BN1 9RH, UK
*
Authors to whom correspondence should be addressed.
Sustainability 2018, 10(4), 928; https://doi.org/10.3390/su10040928
Submission received: 8 February 2018 / Revised: 9 March 2018 / Accepted: 20 March 2018 / Published: 23 March 2018
(This article belongs to the Section Sustainable Agriculture)

Abstract

:
Carbon emissions have always been a key issue in agricultural production. Due to the specific natural factors in the soil of saline agriculture, there are distinctive characteristics in saline agricultural production as compared with traditional agricultural zones. Here, we have adopted the theory of life cycle assessment and employed the Intergovernmental Panel on Climate Change (IPCC) greenhouse gas (GHG) field calculation to estimate the GHG emissions, derived from the staple crop productions (i.e., barley, wheat, corn and rice). In addition, our study further analyzed the main driving forces of carbon emissions and proposed some effective measures to reduce them. Our results have showed that: (1) carbon footprint from the four crops in the study area varies from 0.63 to 0.77 kg CO2 eq·kg−1, which is higher than that from traditional agriculture; (2) GHG emissions from Fertilizer-Nitrogen (N) manufacture and inorganic N application have contributed to the greatest percentage of carbon footprint. Compared with traditional agricultural zones, fertilizer-N application and paddy irrigation involved with crop productions have overall greater contributions to carbon footprint; (3) carbon emissions from saline agriculture can be reduced significantly by planting-breeding combination to reduce the amount of N fertilizer application, improving the traditional rotation system, and developing water-saving agriculture and ecological agriculture.

Graphical Abstract

1. Introduction

At present, climate change has been the most serious and ever-growing global issue facing human beings. Excessive greenhouse gases (GHG) entering the atmosphere from human activities have been verified as the major explanation of climate change [1]. Meanwhile, GHGs released from agricultural manufacture have accounted for a large proportion of human-induced emissions [2,3]. The Intergovernmental Panel on Climate Change (IPCC) has reported agricultural GHG emissions were totally up to 12.0 Gt/year (CO2 equivalent), taking nearly 24% of human-induced emissions (IPCC, 2014). China, as a dominating agricultural country in the world, the large-scale plantation of rice, corn and wheat is a significant contribution of global carbon emissions [4]. In China, widespread saline agriculture is one of the important parts of agricultural manufacture. Characterised by higher soil salinity, specific tillage practice, and crop rotation systems, saline agriculture has an important contribution to China carbon emissions. As the most reserved land resource, coastal wetlands in eastern China have been reclaimed for agriculture, industry, and other activities in order to relieve the human–land conflict, increase the crop yield and promote regional economic development [5,6,7]. Accurately assessing the carbon footprint (CF) of saline agriculture in eastern China is an important and fundamental task to optimise regional agricultural resource allocation, improve tillage practices and reduce carbon emissions caused by agriculture. In Jiangsu Province (eastern China), the largest area of coastal wetlands, taking over 25% of the total area, has been reclaimed for agriculture as early as the 11th century when there was a larger scale of agricultural growth, advanced reclamation and tillage technology for saline agricultural development. Hence, coastally reclaimed areas of Jiangsu Province are selected to study the CF of saline agriculture.
Carbon emissions per-yield or per-area induced by manufactured inputs used for crop production are referred to as carbon emission intensity (namely, “carbon footprint”, or CF). The CF is a key element for the global carbon cycle research in order to resolve the issues in the human-environment system and optimise resource allocation [8]. The CF of agriculture is mainly analysed by the direct or indirect GHG emissions associated with a complete crop life cycle, including the yield-scaled or area-scaled carbon emissions of all inputs to the farming land (e.g., plowing, sowing, growth, harvest, by-product treatment etc.) [9,10]. Al-Mansour and Jejcic [11] have reported that the portion of GHG emissions from the fertilizers used represents 42% to 76% of the total emissions from crop production, which was the greatest contribution to wheat CF in Slovenia. The average carbon sustainability index [12] calculated by the CF is significantly higher in Ohio, USA with reduced conservation tillage than that in Punjab, India with conventional tillage, revealing that more efficient agriculture can reduce the CF. Many previous studies have paid close attention to the CF of integrative agriculture on the basis of statistical yearbook [12,13,14]. Reducing agricultural CF by improving the crop rotation and optimizing the amount of fertilizer used via annual soil testing is an effective choice. Gan et al. [15] have addressed that using lentil (a grain legume) to substitute the summer fallowing of the wheat-wheat fallow system in Canada could reduce the wheat CF effectively. On the other hand, some common knowledge on the CF of agricultural production has been obtained: (1) the larger the scale of crops is, the lower the CF will be [11,16]; (2) the dry environment or upland crop system generally produces a higher CF as compared with the wet environment and paddy [3,14,17]; and (3) the conversion from conventional farming to no-till could conspicuously lower the CF of crop inputs [11,17,18].
In China, Wang et al. [19] have analysed the agricultural CF of five provinces in northern China plain, and found the per-area CF tended to increase, while the per-yield CF decreased from 1993 to 2012. Furthermore, 30.25% of per-yield CF came from energy consumption in irrigation, and 23.07% of per-yield CF came from fertilizer-Nitrogen (N) application. In Guanzhong plain, the CF of several crop productions (i.e., wheat, corn and alfalfa) was estimated, showing that the corn CF was the highest. The main contribution of the corn CF is again irrigation and fertilizer application [20]. In addition, Liu et al. [21] have proposed that carbon sequestration induced by fertilizer application and multiple cropping should be integrated into the CF assessment.
Currently, carbon emissions from agricultural production in traditional agricultural areas have been more intensively studied [14,17,19,20,22,23,24]. On the other hand, limited information on the CF of saline agricultural production has been obtained, especially in coastally reclaimed areas. Production processes, farming practices, crop type and natural environment involved with coastal saline agriculture are significantly different from those of the traditional agriculture [6,7]. Hence, evaluation of the CF from the coastal saline agriculture is an important task, which will bring meaningful assessments of the sustainability of the saline agricultural production and improve the coastal ecosystem management [8,25]. In our present study, a coastally reclaimed area in Yancheng City, Jiangsu Province, eastern China is selected as an example site. Instead of using the scale-up methods, we have developed a survey questionnaire to evaluate the regional scale CF, based on previous studies [20,26]. Using our survey questionnaire, all material and energy inputs involved in saline agricultural production are clearly identified. It is a grand challenge to accurately estimate the anthropogenic carbon emission. This is because human activities are very complicated—they can change significantly from one site to another. It is almost impossible to scale up from plot (spot) measurement to such a large area of coastal saline agriculture. The carbon emissions of four staple crops (i.e., barley, wheat, corn and rice) in our study area are assessed by using the CF estimate and life cycle assessment framework. Furthermore, the main driving forces of the CF are analysed, and some possible measures of carbon emission reduction are proposed. Our assessment could support decision makers for optimizing agricultural resource allocation, promoting high-efficiency saline agriculture, and sustainable development in coastal areas inside China. The reminder of this paper is organised as follows. In Section 2, we will describe in some details about our material and methods. Our results are presented in Section 3. In Section 4, we will discuss and compare our results with previous studies. A summary of our finding is presented in Section 5.

2. Materials and Methods

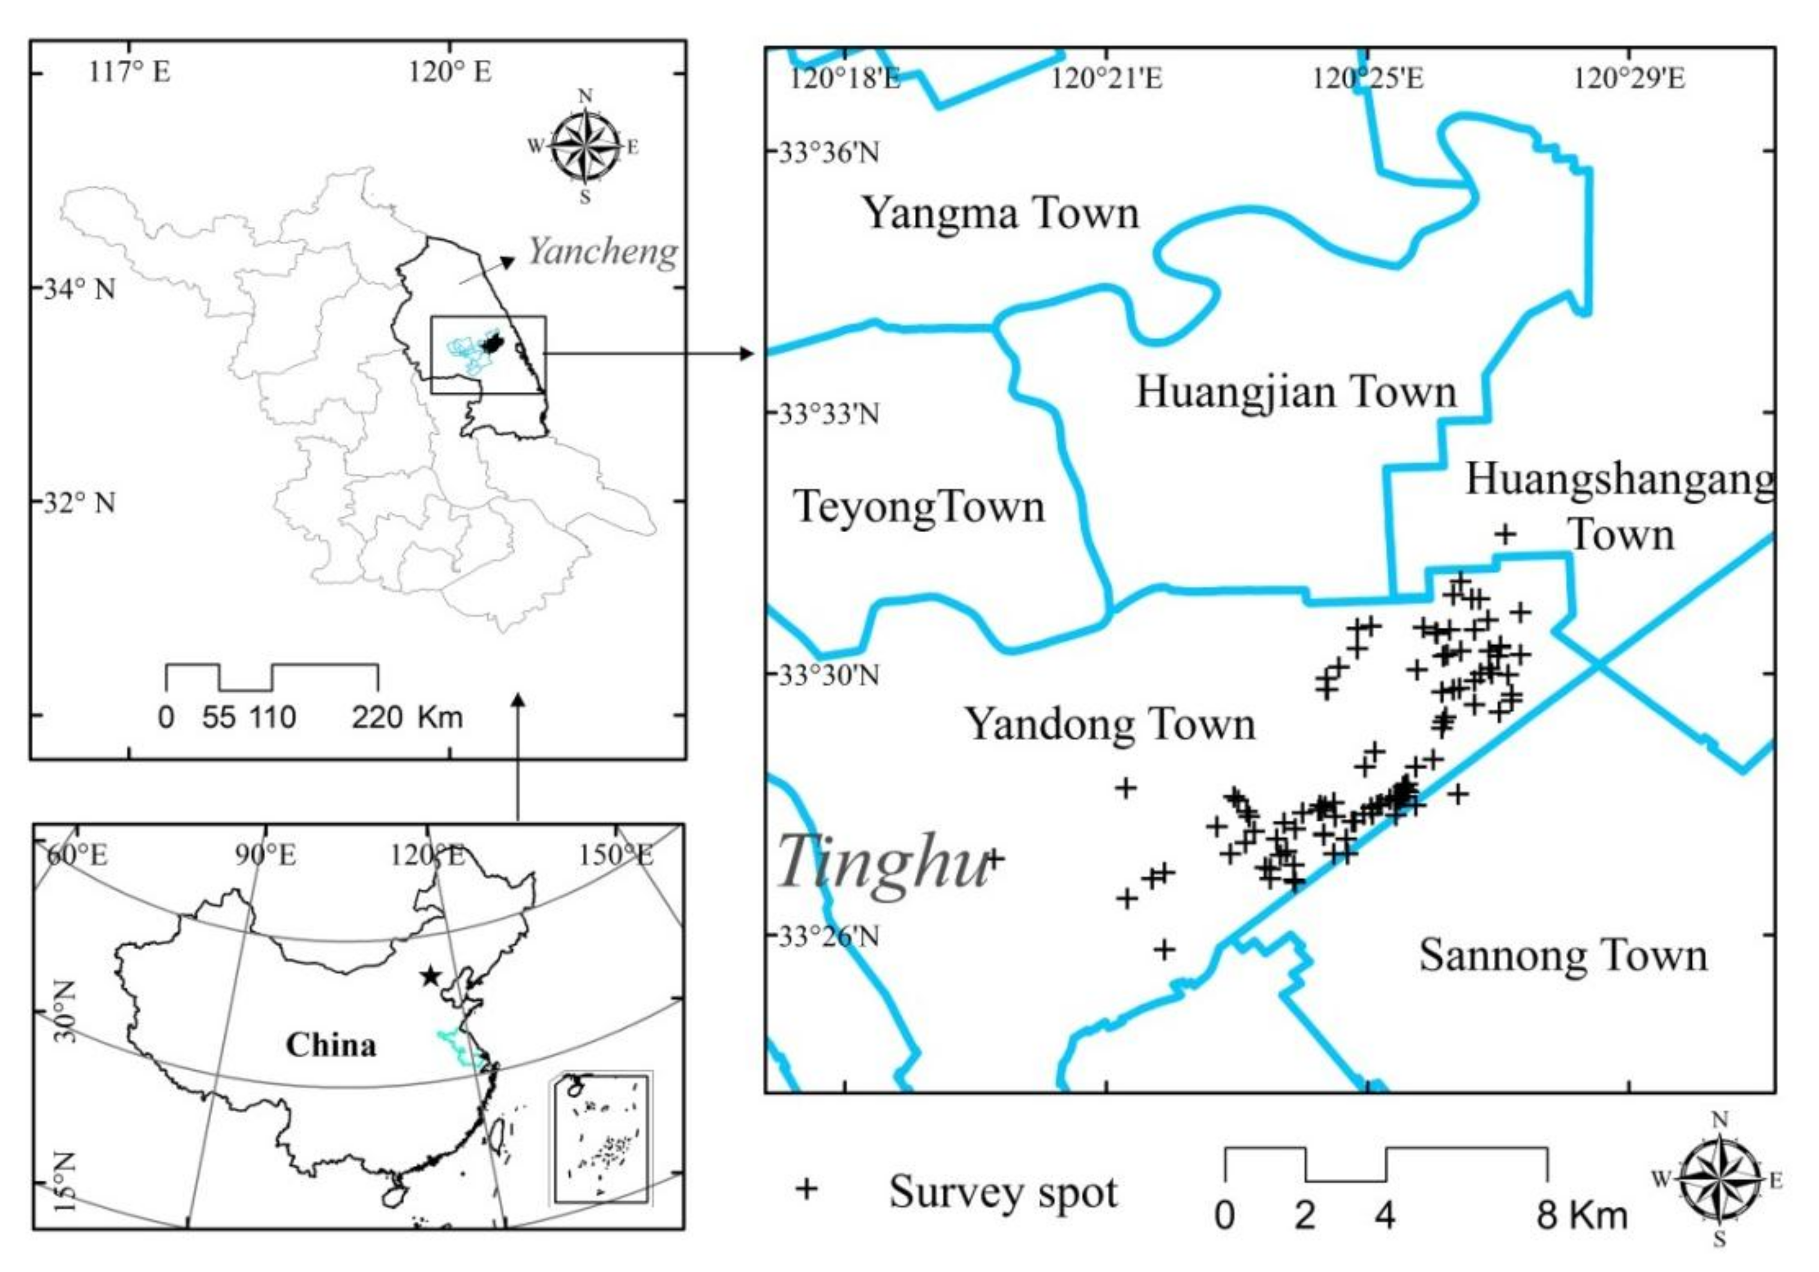
2.1. Study Area and Data Acquisition

Our study is carried out in Tinghu District, Yancheng City, Jiangsu Province, eastern China, which is located very close to the China Yellow Sea. The study area has a subtropical monsoon climate with an annual total rainfall of around 1250 mm. The annual mean temperature is about 14 °C. Saline and alluvial soils are the main soil types [27]. The study area is a coastally reclaimed zone with a 45-year history (Figure 1). Although the soil has been fattened and leached by desalination for decades, the soil quality is still lower as a typical saline agriculture, resulting in a distinctive farming practice as compared with traditional agricultural areas. In our study area, cotton was previously the main type of crop grown. However, as a result of the ever-declining price of cotton, local people have begun to plant barley, wheat, corn and rice that have increasing economic benefits and need less labour inputs.
The present study has been carried out in July of 2017. A total of three towns (covering eight villages) is surveyed to obtain the information on crop yields, materials and energy inputs (fossil energy used in the processes of manufacture, including inorganic fertilizer, pesticide, irrigation, harvesting, etc.). A total of 500 survey questionnaires were distributed, of which 488 were collected and validated. Among the 488 surveys, there are 84 for barley, 181 for wheat, 213 for corn, and 10 for rice, respectively. The basic household information of surveyed farmers is listed in Table 1 below. The smallest survey is for rice because the rice planting usually occurs among farmers with a large amount of land. In our study area, only ten farmers, who have a farmland larger than 67 ha, and have cultivated the lands to plant rice. One-way ANOVA test is used to analyse the different GHGs emissions among the four staples. All data are processed by SPSS 22.0 (IBM, Armonk, NY, USA) and Excel 2010 software (Microsoft, Redmond, WA, USA).

2.2. Methodology

The life cycle assessment approach (LCA) is employed to study the CF of agricultural production, covering totally five steps: (1) setting goals; (2) identifying the boundary of LCA; (3) input inventory analysis; (4) metrics of the CFs and (5) result analysis [28].

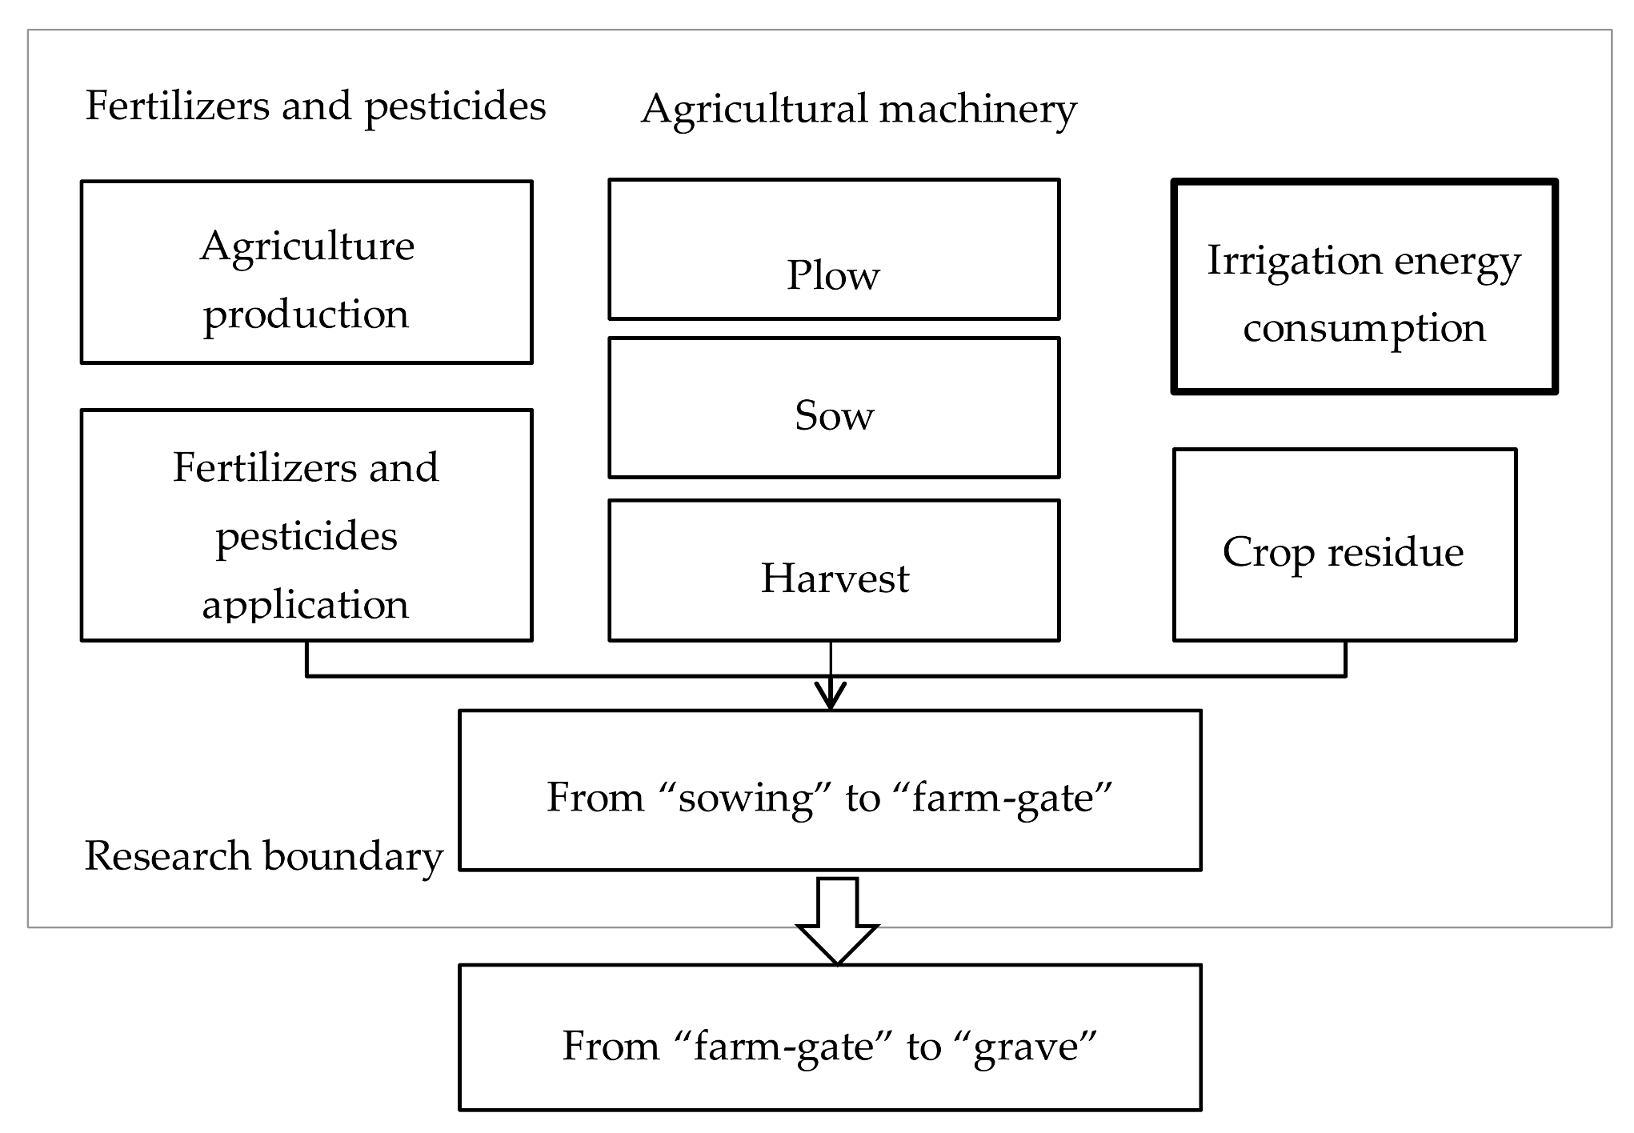
2.2.1. Setting Goals and Identifying the Boundary of LCA

The research goal of our study is to identify the CF of four staple crops in saline agriculture of coastally reclaimed areas, where the CF is measured as carbon emissions on the basis of per unit of farmland or per kg of grain yield. Identifying the LCA boundary is a vital step that can directly affect the result [24]. Generally, two different boundaries associated with agricultural CF are defined as “from sowing to farm-gate” or “from farm-gate to grave”. The former is the boundary of LCA used in our study, namely the agricultural CF from sowing, growth, management, and harvesting, except for the fossil energy used during further processing and delivery outside of farm-gate.

2.2.2. Input Inventory Analysis

The input inventory associated with crop productions should be listed completely within the boundary of “from sowing to farm-gate”. This inventory comprises: (1) the fossil energy inputs during ploughing and sowing; (2) direct and indirect carbon emissions during inorganic fertilizer manufacture and application; (3) carbon emissions during pesticide manufacture; (4) energy used during irrigation; (5) fossil fuel used by machinery during harvesting; and (6) lastly carbon emissions caused by crop residue decomposition (see Figure 2; Table 2). Based on the study of Bi [28], the ratio of grain to straw of the four staple crops is defined as 1:1.3, 1:1.36, 1:1.1, 1:1 for barley, wheat, corn and rice, respectively. Data of fertilizer inputs (N and P), pesticides inputs, power consumption and diesel oil inputs during crop productions are collected via the farmer survey questionnaires. The grain and residuals of the four crops are calculated by the ratio of grain to straw mentioned above (see Table 2). Most importantly, as shown in Table 2, the power consumption associated with irrigation during the rice production is relatively high in the study area. This is because the local farmers have to elevate the altitude of the rice fields via covering soil in order to desalinate. Compared with the tidal flat plains, the elevation of the rice fields tends to increase after a long-term reclamation. Therefore, the natural irrigation by gravity is impossible in rice production, instead an electric pump is used for watering rice fields. In addition, the amount of fertilizer-N inputs in the study area is higher (see Table 2). The main reason is that the original lower soil quality and fewer organic fertilizer inputs coupled with higher frequent rotation for seeking economic profit have resulted in a significant decrease of soil fertility. Hence, massive amounts of fertilizer-N are applied to farmlands to maintain soil fertility.

2.2.3. Metrics of Carbon Footprints

Our empirical models (Equations (1)–(4) below) are developed using the IPCC report [29,30] and previous studies [20] for estimating the anthropogenic GHGs emissions at some broad scales. In addition to the challenge mentioned in Section 1, the observed (mean) GHGs emissions in a plot/spot site cannot represent the actual (total) emissions at a regional scale. Three GHG emissions (carbon dioxide, CO2; nitrous oxide, N2O and methane, CH4) associated with the four crops' production are estimated. The amounts of N2O and CH4 emissions are all converted into CO2 emissions on the basis of global warming potential (hereafter GWP) parameters (namely, a unit of N2O and CH4 having the GWP of how many units of CO2 equivalents with a 100-year timeframe). The formula is shown below:
  C F S i = ( e C O 2 i × W C O 2   + e N 2 O i × W N 2 O   + e C H 4 i × W C H 4 ) / G i  
where CFSi is the CF of crop i; e C O 2   i is the amount of CO2 emissions during crop i growth (kg/ha); e N 2 O   i is the amount of N2O emissions during crop i growth (kg/ha); e C H 4   i is the amount of CH4 emissions during crop i growth (kg/ha); and W C O 2 , W N 2 O and W C H 4 are the GWP values of CO2, N2O and CH4 respectively. According to the IPCC report [29] and a study by Gan et al. [15], the GWP values are 1, 298 and 25 for three GHGs respectively; Gi is the dry matter grain yield (kg/ha).
e C O 2   i = j = 1 3 ( C F i j ×   W C F j ) + P E i × W P E + M A i × W M A + E L i × W E L + U R i × W U R × ( 44 12 )
where CFij is the fertilizer-j used during crop i production (kg/ha); WCFij is carbon emissions coming from fertilizer-j manufacture (kg/kg); PEi is the pesticide inputs during crop i production (kg/ha); WPE is the carbon emissions of per-kg pesticide manufacture (kg/kg); MAi is the diesel oil used by machinery during crop i production; WMA is the CO2 emission coefficient of diesel oil burning (kg/L); ELi is the power consumption during crop i production (kWh/ha); WEL is the CO2 emissions of per-kWh manufacture (kg/kWh); URi is the fertilizer-N inputs during crop i production (kg/ha); WUR is the carbon emissions of per-kg fertilizer-N manufacture (kg/kg); and 44/12 is the molecular conversion factor of CO2-C to CO2.
e N 2 O i = ( F N i + G R i × W G R ) × ( D N × ( 44 28 ) + G A S i × W N H + L × N L )
where FNi is the amount of fertilizer-N used during crop i production (kg/ha); GRi is the residuals of crop i; WGR is the N-content in crop residuals (kg/kg); DN is the direct N2O emissions of fertilizer-N application (kg/kg); GASi is the coefficient of ammonia volatilization of crop i production; WNH is the coefficient of N2O emissions caused by nitrogen deposition from the atmosphere; L is the coefficient of fertilizer-N leaching losses; NL is the coefficient of N2O emissions induced by runoff and permeation; and 44/28 is the molecular conversion factor of N2 to N2O.
W C H 4 = D a y × E ( C H 4 ) d i f f × A
where Day is the amount of days of water flooding a field every year (day/year); E ( C H 4 ) d i f f is the CH4 emissions of per-area cropland every day (kg/ha/day); and A is the area of water flooding (ha). All parameters mentioned above are shown in Table 3.

3. Results

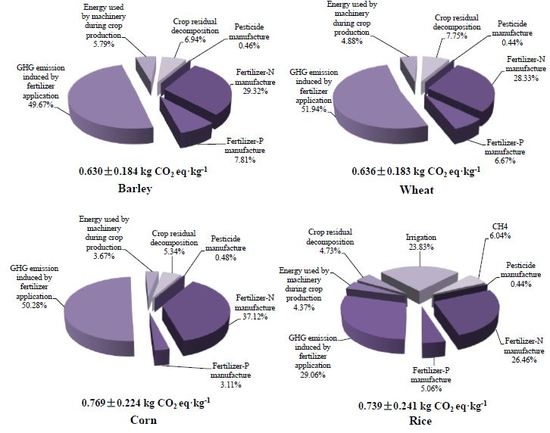
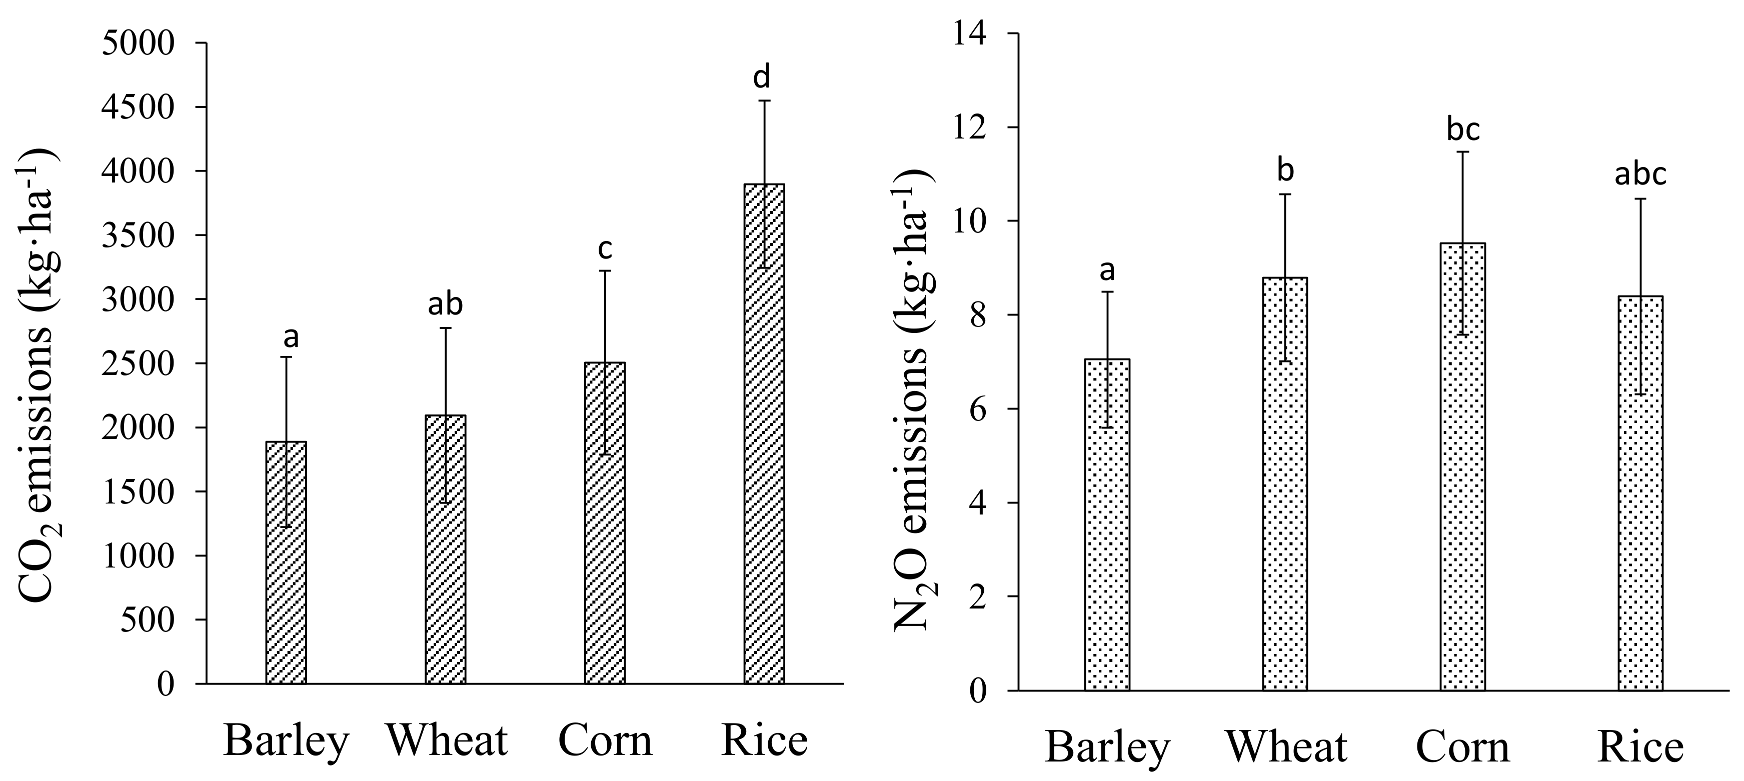
3.1. Area-Derived CF of Saline Agricultural Productions

For each GHG, Figure 3 shows that significant differences of carbon emissions exist among the four crops. Note that because upland crops’ growth mainly depends on rainwater instead of artificial irrigation, their CH4 emissions are assigned to zero. These crops include barley, wheat and corn. For per-area CF among the four crops, rice production has an average of 3896.01 kg CO2 eq·ha−1, followed, in decreasing order, by: corn (3896.01 kg CO2 eq·ha−1), wheat (2093.05 kg CO2 eq·ha−1), barley (1886.44 kg CO2 eq·ha−1). According to the result of LSD (Least Significant Difference) method of one-way ANOVA, CO2 emissions coming from rice and corn production were significantly higher than from wheat and barley (based on ANOVA test P < 0.05). However, no significant difference in CO2 emissions was found between the production of wheat and barley. For N2O, the highest value of per-area N2O emissions is at an average 9.53 kg N2O·ha−1 in the production of corn. The next highest value is found in the production of wheat (8.79 kg N2O·ha−1.) The rice and barley productions have N2O emissions values of 8.39 kg N2O·ha−1 and 7.05 kg N2O·ha−1, respectively. The per-area N2O emissions of corn and wheat are significantly higher than barley (based on ANOVA test P < 0.05). The main reason for this is that higher N (nitrogen) fertilizer inputs during the production of corn and wheat were found (see Table 2). Only rice production can result in CH4 emissions as a result of its elevated ground. In our study area, an average of 15.05 kg CH4·ha−1 was estimated in rice production. Meanwhile, from the results of standard deviation bars as shown in Figure 3, the relatively consistent variables of per-area CF among the four crops reflected that local farmers’ farming behaviour preference was homogeneous except for corn. Total per-area CF associated with the three GHGs above-mentioned is obtained via a conversion based on warming potential parameters (CO2 equivalent) (see Table 3). Table 4 shows that the per-area CF of rice production is the highest, at an average of 7698.07 kg CO2 eq·ha−1, followed in decreasing order by: corn (5344.18 kg CO2 eq·ha−1), wheat (4712.48 kg CO2 eq·ha−1), and barley (3986.87 kg CO2 eq·ha−1). The possible reason is that irrigation during the rice production results in a huge power consumption (see Table 2). In addition, the results in Table 3 show that the contributions of N2O emissions among the four crops to total CF are larger, at an average of 52.68%, 55.59%, 53.12% and 49.12% for barley, wheat, corn and rice, respectively. The greatest value exists in wheat production.

3.2. Yield-Derived CF of Saline Agricultural Productions

As shown in Table 5, the per-yield CF (CO2 equivalent) coming from the four crops are 0.77 ± 0.22 kg CO2 eq·kg−1 for corn, 0.74 ± 0.24 kg CO2 eq·kg−1 for rice, 0.64 ± 0.18 kg CO2 eq·kg−1 for wheat, and 0.63 ± 0.18 kg CO2 eq·kg−1 for barley. A larger amount of fertilizer-N is applied during the corn production, resulting in a higher CF, as compared with the three other crops. Our survey has revealed that the amount of fertilizer-N used in the corn production is 439.28 ± 144.85 kg·ha−1. This is 1.69 times higher than that of barley, at a value 259.91 ± 107.21 kg·ha−1, 1.47 times higher than that of wheat, at a value 299.49 ± 114.78 kg·ha−1, and 1.21 times higher than that of rice, at a value 362.69 ± 149.34 kg·ha−1. However, considerable differences in the amount of fertilizer-N inputs of corn production exist among different farmers. The highest value of 1148.4 kg·ha−1 fertilizer-N was applied by some farmers, and not for a corn field. The saying of “the higher fertilizer inputs, the higher corn grain product” is popularised among the local farmers. However, not everyone thinks so, depending on the perception of the cost-effectiveness of corn production.

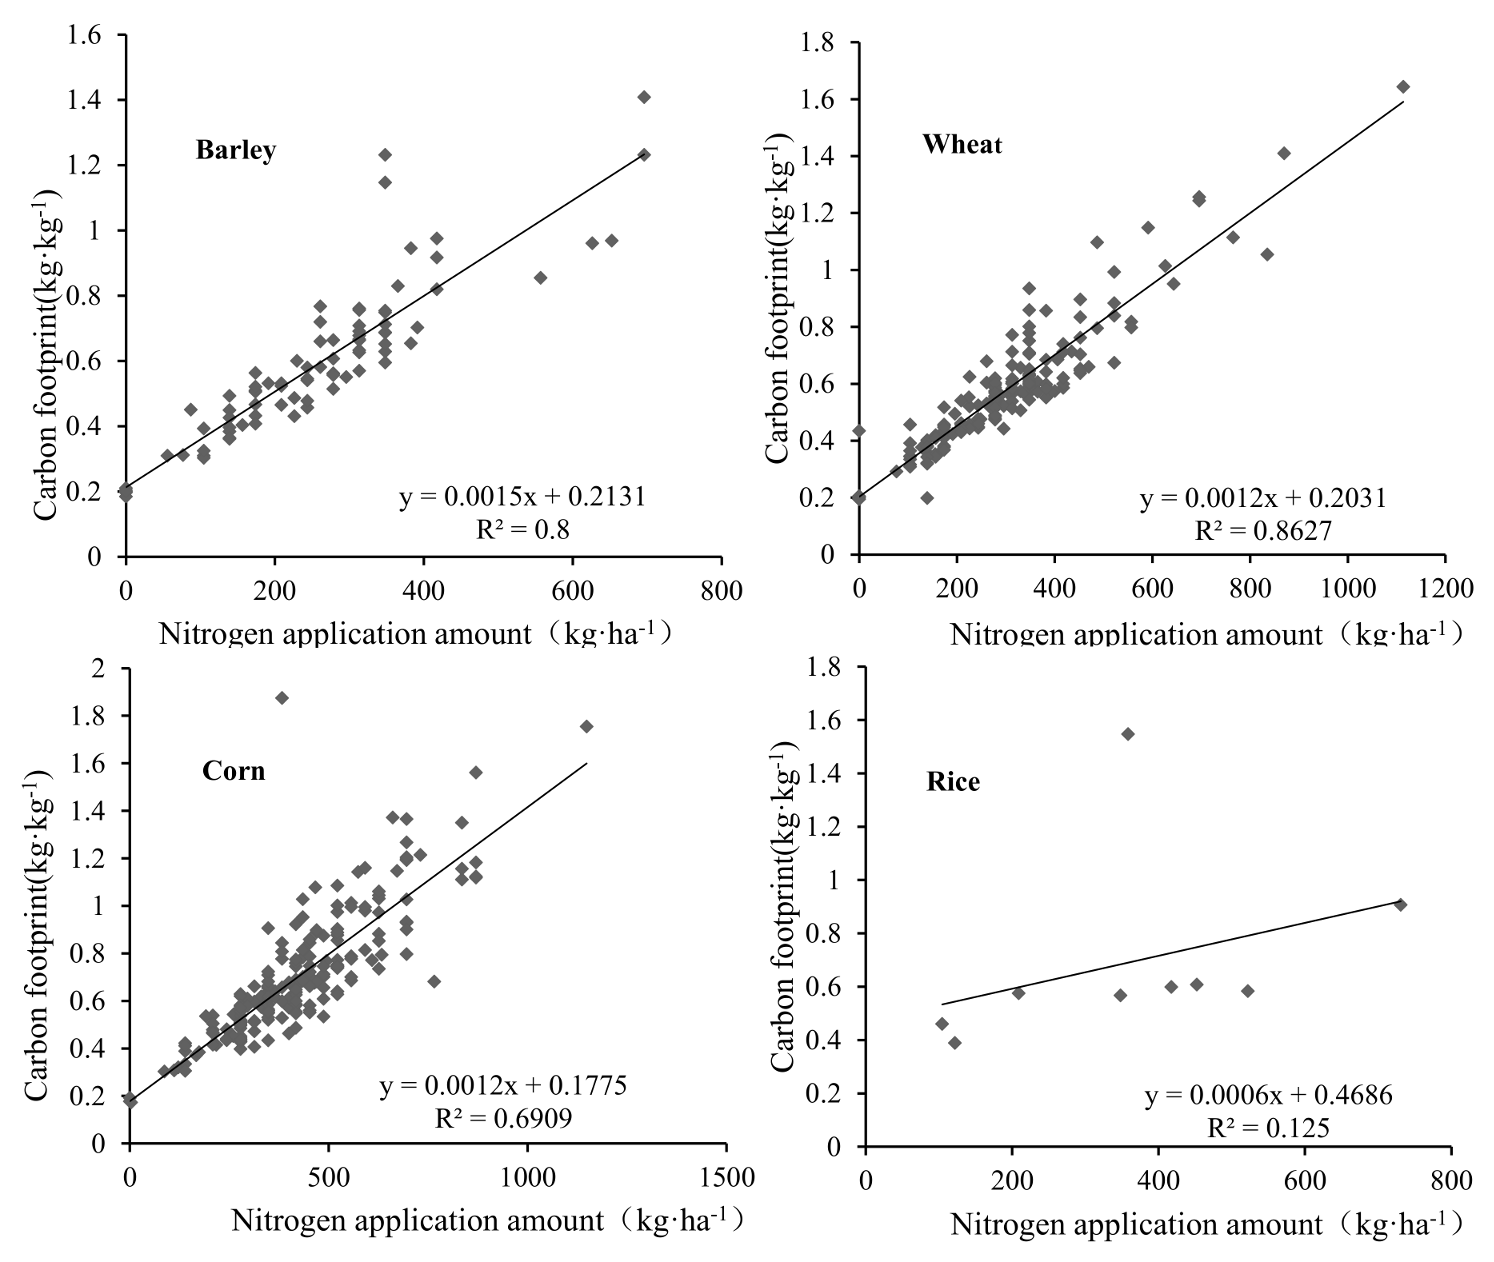
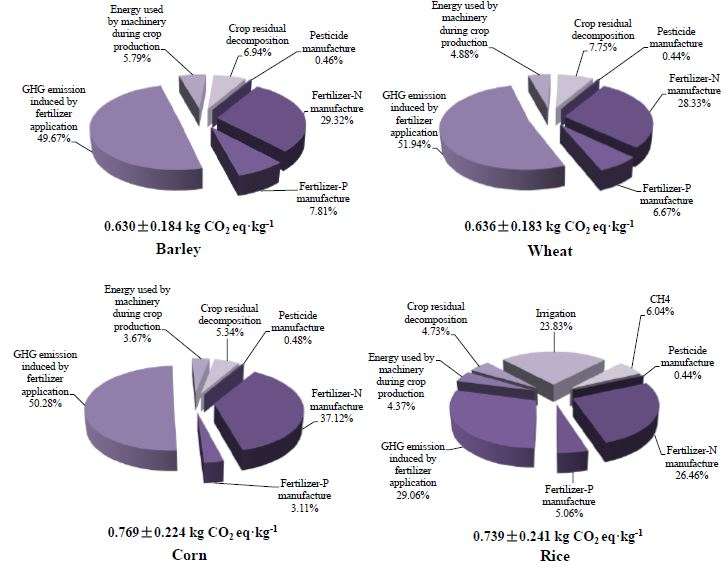
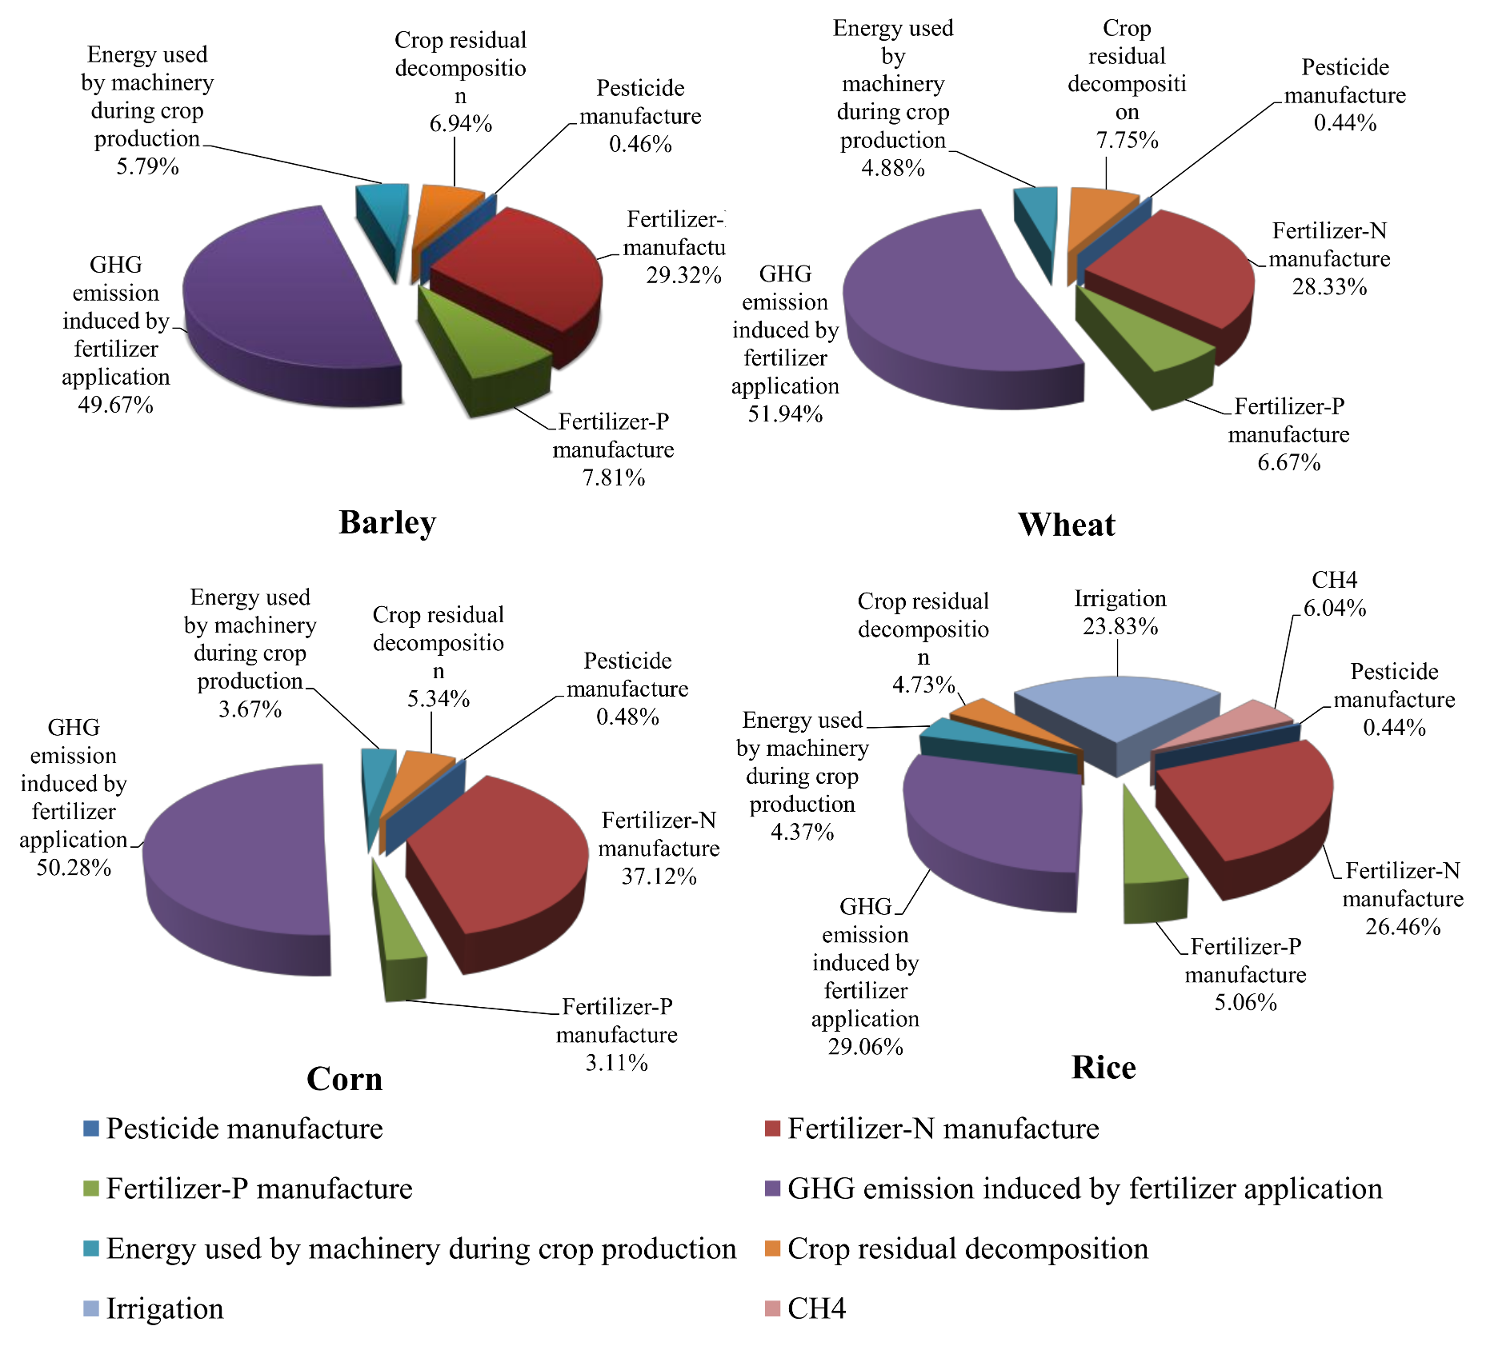
3.3. Driving Forces of Saline Agricultural CF

As shown in Figure 4, a total of six processes are involved for crop grain production to contribute to total CF of saline agricultural production. They include N/P fertilizer manufacture, pesticide manufacture, crop residual decomposition, machinery usage, GHGs emissions caused by N/P fertilizer application, and lastly irrigation. Among the six processes, pesticide manufacture contributes the lowest to CF (all under the value 0.5%, ranging from 0.44% to 0.48%). Machinery usage has a contribution within a range of 3.67% to 5.79%. This is noteworthy because of the heavy use of machinery during the production of wheat and barley due to the higher weight of wheat seed as well as higher planting density. Crop residual decomposition contributes to CF from 4.73% to 7.75%, of which the largest is in wheat production and the lowest in rice production. P fertilizer manufacture has a contribution ranging from 3.11% to 7.81%, of which the largest is in barley and the lowest in corn. N fertilizer manufacture contributes to CF from 26.46% to 37.12%, of which the largest is in corn and the lowest in rice production. GHG emissions induced by N fertilizer input contributes to CF from 29.06% to 51.94%, of which the largest is in wheat and the lowest in rice production. Irrigation in rice fields has a considerable contribution to CF at an average of 23.83%, while zero contribution to CF for three other crops as a result of no artificial irrigation.
Based on our study, it can be concluded that fertilizer-N manufacture and GHGs emissions caused by fertilizer-N application during staple crop production are the greatest contributions to total CF of saline agricultural production. The direct/indirect GHGs emissions induced by fertilizer-N inputs during crop production contribute to CF from 55.52% to 87.40%. In addition, the survey’s results have revealed that the amount fertilizer-N application has increased year by year. The main reason is that the original lower soil quality and fewer organic fertilizer inputs coupled with higher frequent rotation for seeking economic profit have resulted in a significant decrease of soil fertility. Hence, massive amounts of fertilizer-N are applied to farmlands to maintain soil fertility. However, massive fertilizer-N applications in a short period of time could significantly increase N2O emissions due to volatilization of NH3 and nitrate losses via leaching and denitrification [15,36]. The higher warming potential of N2O is consequently responsible for the largest CF of fertilizer-N application in the study area.

4. Discussion

4.1. Comparison with Similar Studies

Table 6 shows that the CF of saline agriculture is significantly different from that of other regions. Our corn grain CF is similar to that in Korea, but significantly higher than in USA. The main reason is because the inputs of different fertilizers, fossil energy and machinery per-yield in the large-scale and more intensive agriculture in USA are generally lower than in China. This indicates that intensive agriculture with features of large-scale and mechanization can conspicuously reduce the CF. Our finding agrees with the study of Al-Mansour and Jejcic [11] and Gan et al. [17]. Our wheat grain CF is two times higher than in Australia, which could also be explained by the intensification of farming. In Japan, rice grain CF is nearly 13 times higher than in our study. The difference of assessment framework between the two studies is the most important contribution. The assessment framework in Japanese study is relatively broad, covering the seed rice production, grain cooking and waste treatment [37]. Due to the natural environmental condition, agricultural practices and tillage regime are different, the assessment frameworks of the CF are different in different places [38] (see Table 7). In USA and Australia, the assessment framework includes the inputs and transportation of trace nutrients (sulfur, boron, and lime, etc.) [39,40]. In Korean, the organic fertilizer is applied to replace the inorganic one. In addition, the material inputs induced by farmland infrastructure construction are integrated into their assessment framework [41]. Therefore, the CF of the same crop could be different in different regions. Compared with other places inside China, the grain CF of wheat and corn in our study is generally higher than in Shandong, which has some lower fertilizer inputs (see Table 6). However, the corn grain CF in our study area is higher than in Guanzhong plain mainly due to higher Nitrogen fertilizer inputs (439.29 ± 144 kg·ha−1 in our study area versus 179.9 ± 91.7 kg·ha−1 in Guanzhong plain). In our study, the grain CFs are all higher than those in northern China plain and Northeast China [22,24]. The main reason is that the pesticide and fertilizer inputs per-area during crop production in the latter areas are generally lower than in our study. Greater energy inputs caused by heavy machinery usage and irrigation during crop productions due to the dry environment in northern China plain and Northeast China are the dominate contributions to grain CFs [22,24]. Consequently, higher grain CFs in saline agriculture as compared with traditional agricultural areas become obvious.

4.2. Structure and Driving Forces of Grain CF in Saline Agriculture

The contribution of irrigation during grain production between our study and other places is significantly different. In Guanzhong plain, the average grain CF induced by irrigation of corn and wheat are 242.42 kg CO2 eq·kg−1 and 58.8 kg CO2 eq·kg−1, respectively, which contribute the portions 39.1% and 24.5% of total CF [20]. Furthermore, the irrigation of wheat production in North China plain contributes a portion of 28.07% to wheat grain CF, at an average of 309.01 kg CO2 eq·kg−1 [22]. However, as concluded from our farm survey, the water supplied during upland crop growth (barley, wheat and corn) mainly depends on soil water and rainwater, saving massive energy consumption. Given saline silt soil is the main soil type in the study area, the soil water-holding capacity is poor coupled with the high demand from soil desalination, higher frequency of irrigation is carried out on daily bases in rice production, as compared with traditional agricultural areas. For rice production, on average less than eight times of irrigation are normally needed during in inland areas of Jiangsu, while our study area has up to 20 times of irrigation during the growing season of rice. Hence, the irrigation CF is very high in our study area, with an average of 1479.91 kg CO2 eq·ha−1, which contributes a portion of 18.76% to grain CF. The average of power inputs during rice production in the study area is 1569.364 kWh·ha−1, while it is only 222.75 kWh·ha−1 in Shanghai, which has a similar natural environment, very close to our study area [43].
Fertilizer application is generally the greatest contribution to grain CF in coastally reclaimed areas. Its contribution in the present study is 55.52% for rice, 78.99% for barley, 80.27% for wheat and 87.40% for corn, respectively. However, its contribution is only 38.96% for barley and wheat, 47.15% for corn, and 16.5% for rice in traditional agricultural areas [10,20,22,24]. In our study area, excessive fertilization has been a custom among local farmers to offset the lower soil fertility. As potassium ion is rich in coastal soil, massive amounts of N, P fertilizers or compound fertilizer, are applied to soil, especially N fertilizer. A recent study has indicated the massive N fertilizer is used even in small famers inside China [44], and therefore the higher contribution of fertilizer-N application to CF in our study area has been found, while, for traditional agriculture, the NPK balanced fertilization is the main pattern. We estimate that approximately 7.06 Tg CO2 equivalent would be eliminated each year in coastal China if half of inorganic fertilizers inputs would be replaced by organic fertilizer (e.g., manure of livestock, biogas residue, biogas slurry and straw processed by ammoniation returning to field) on the basis of planting-breeding balance. As shown in Figure 5, there is a significantly positive relationship between N fertilizer input and CF, with each kg of N input resulting in 0.0015 kg CO2 eq·kg−1, 0.0012 kg CO2 eq·kg−1, 0.0012 kg CO2 eq·kg−1, 0.006 kg CO2 eq·kg−1 of CF for barley grain, wheat grain, corn grain and rice grain, respectively.

4.3. Methods for Reducing CF of Saline Agriculture

This study finds that the carbon emission related fertilizer-N inputs during crop productions account for 55% of the total carbon emission, of which about 23% came from fertilizer-N manufacture and nearly 32% came from fertilizer-N application, which was verified by the studies in semi-arid areas [17,20]. Some effective measures can be taken to reduce the CF related fertilizer-N inputs, such as developing coal-based nitrogen fertilizer manufacture technology instead of conventional nitrogen fertilizer manufacture technology (high energy-consuming oil-based nitrogen fertilizer manufacture technology) to reduce carbon emissions during N fertilizer manufacture [45]. Using slow-release nitrogen fertilizer and urease inhibitors, increasing the frequency of fertilization, meanwhile reducing the amount of each fertilization can significantly improve nitrogen efficiency and reduce carbon emissions [46,47].
As concluded from our farm survey, the phenomenon of excessive fertilization is popular and increases every year in our study area. Massive amounts of fertilizer-N applied to soil in a short period will cause the least absorbed by crops and the most lost by the effects of nitrification, denitrification and decomposition. This can also give rise to no-point pollution [48]. Improving the fertilization management to meet the demands of crop growth, while, at the same time, reducing carbon emissions is an important future work in our study area. According to “The recommended fertilization advice of staple crops of China in 2017” , the recommended amounts of fertilization for barley and wheat are 233.16 kg N·ha−1, 208.8 kg N·ha−1 for corn and 180.0 kg N·ha−1 for rice, respectively. On the basis of this advice, the per-area CF can be reduced by 15.63%, 14.38%, 73.92% and 55.58% for barley, wheat, corn and rice, respectively. Meanwhile the per-yield CF can be lowered by 16.58%, 18.76%, 39.09% and 31.75% for barley, wheat, corn and rice, respectively.
Beside from the contribution of fertilizer-N input, machinery usage and crop residuals are also important contributions to carbon emissions during the crop production. Some ecological practices should be employed, which promote the soil sequestration carbon capacity, to sequester greater amounts of GHGs from the atmosphere to offset carbon emissions during crop production. For example, legume-rhizobial associations well known as N-fixing systems to replace the summer fallow phase can be carried out in rotation system [15]. Agronomic practices such as improved fertilization, plastic-film mulching, and drip irrigation could be combined with a systematic manner to reduce carbon emissions during the crop production [11,15]. For machinery usage, more suitable machinery should be used in the processes of sowing, ploughing and harvesting based on the characters of farmland and soil thickness to reduce the fossil fuel inputs [14]. Conservation tillage (no-tillage and reduced tillage) is a proven effective approach to reduce machinery inputs, and to lower carbon emissions during the crop production [23]. In addition, Jiangsu’s coastal areas are also a concentrated area for livestock breeding, which produces a lot manure [49]. As advocated by Al-Mansour and Jejcic [11], due to higher GHG emissions caused by microbial decomposition, the CF of crop products manufactured by organic farming may be higher than those manufactured by conventional and integrated farms. However, this is inconsistent with the study of [50]. We think while organic fertilizer inputs can increase the risk of soil carbon emission, putting the manure into the field directly can significantly reduce the consumption of fossil fuel and power induced by organic fertilizer manufacture. Hence, actively implementing the combination of planting and breeding, using manure instead of inorganic fertilizer to reduce the fertilizer inputs during crop production, are effective work to lower the grain CF of saline agriculture in Jiangsu’s coastal area.

5. Conclusions

The CFs involved with crop production inputs in saline agriculture are generally higher than those in traditional agricultural areas. On per-area CF of the four crops in study area, rice grain production has the greatest value of 7698.07 kg CO2 eq·ha−1, followed in decreasing order by: corn (5344.18 kg CO2 eq·ha−1), wheat (4712.48 kg CO2 eq·ha−1), and barley (3986.87 kg CO2 eq·ha−1). On per-kg CF, the greatest value of 0.77 ± 0.22 kg CO2 eq·kg−1 was identified for corn, 0.74 ± 0.24 kg CO2 eq·kg−1 for rice, 0.63 ± 0.18 kg CO2 eq·kg−1 for wheat, and 0.63 ± 0.18 kg CO2 eq·kg−1 for barley, respectively. The highest value of the grain CF is found in corn production in our study area due to extra fertilizer-N inputs. N2O emissions have the greatest contribution to grain CF at 55.59% for wheat, 53.12% for corn, 52.68% for barley and 49.12% for rice, respectively. Decomposed CF of the four crops' productions, namely N fertilizer manufacture and GHGs emission caused by N fertilizer application, has greater contribution, at 30.31% and 45.26% respectively, which are significantly higher than those in traditional agricultural areas. The contribution of irrigation during rice production in our study area is relatively higher, at an average of 23.83%. Promoting the combination of planting and breeding, using organic fertilizers instead of inorganic ones to reduce the fertilizer inputs during crop production and integrating some effective farming practices together as a systematic manner are important future works to lower the grain CF of saline agriculture in Jiangsu’s coastal area.

Acknowledgments

This work was supported by The Ministry of Education of Humanities and Social Science project (No. 17YJCZH085), National Science Foundation of China (No. 41701371, 41201213), University Science Research Project of Jiangsu Province (No. 17KJB170006), Jiangsu Normal University Foundation (15XLR017), Jiangsu students’ innovation and entrepreneurship training program (No. 201610320043Z, 201710320059Z).

Author Contributions

Jianguo Li devised the research questions and analytical strategy. Wenhui Yang, Yi Wang, Qiang Li, Lili Liu and Zhongqi Zhang collected the questionnaire data. All authors collaborated on the interpretation of the results and on writing and revising the paper.

Conflicts of Interest

The authors declare no conflict of interest.

References

  1. Edenhofer, O. Climate Change 2014—Mitigation of Climate Change: Key Insights from IPCC’s AR5 and beyond; Cambridge University Press: Cambridge, UK, 2015. [Google Scholar]
  2. Pryor, S.W.; Smithers, J.; Lyne, P.; Antwerpen, R.V. Impact of agricultural practices on energy use and greenhouse gas emissions for South African sugarcane production. J. Clean. Prod. 2017, 141, 137–145. [Google Scholar] [CrossRef]
  3. Zhang, D.; Shen, J.; Zhang, F.; Li, Y.E.; Zhang, W. Carbon footprint of grain production in China. Sci. Rep. 2017, 7, 4126. [Google Scholar] [CrossRef] [PubMed]
  4. Lin, E.; Liu, Y.; Li, Y. Agricultural C cycle and greenhouse gas emission in China. Nutr. Cycl. Agroecosyst. 1997, 49, 295–299. [Google Scholar]
  5. Sun, Z.; Sun, W.; Tong, C.; Zeng, C.; Yu, X.; Mou, X. China’s coastal wetlands: Conservation history, implementation efforts, existing issues and strategies for future improvement. Environ. Int. 2015, 79, 25–41. [Google Scholar] [CrossRef] [PubMed]
  6. Li, J.; Pu, L.; Han, M.; Zhu, M.; Zhang, R.; Xiang, Y. Soil salinization research in China: Advances and prospects. J. Geogr. Sci. 2014, 24, 943–960. [Google Scholar] [CrossRef]
  7. Li, J.; Pu, L.; Zhu, M.; Zhang, J.; Li, P.; Dai, X.; Xu, Y.; Liu, L. Evolution of soil properties following reclamation in coastal areas: A review. Geoderma 2014, 226–227, 130–139. [Google Scholar] [CrossRef]
  8. Chambers, J.Q.; Fisher, J.I.; Zeng, H.; Chapman, E.L.; Baker, D.B.; Hurtt, G.C. Hurricane Katrina’s carbon footprint on U.S. Gulf Coast forests. Science 2007, 318, 1107. [Google Scholar] [PubMed]
  9. Mogensen, L.; Kristensen, T.; Nguyen, T.L.T.; Knudsen, M.T.; Hermansen, J.E. Method for calculating carbon footprint of cattle feeds—Including contribution from soil carbon changes and use of cattle manure. J. Clean. Prod. 2014, 73, 40–51. [Google Scholar] [CrossRef]
  10. Duan, H.; Yue, Z.; Zhao, J.; Bian, X. Carbon Footprint Analysis of Farmland Ecosystem in China. J. Soil Water Conserv. 2011, 25, 203–208. (In Chinese) [Google Scholar]
  11. Al-Mansour, F.; Jejcic, V. A model calculation of the carbon footprint of agricultural products: The case of Slovenia. Energy 2017, 137, 7–15. [Google Scholar] [CrossRef]
  12. Han, Y.; Chen, K.; Chen, Y.; Su, M.; Chen, L. Study on Dynamic Change of Carbon Footprint of Qinghai in the Years from 1999 to 2008. Ecol. Econ. 2011, 235, 54–56. (In Chinese) [Google Scholar]
  13. Hillier, J.; Hawes, C.; Squire, G.; Hilton, A.; Wale, S.; Smith, P. The carbon footprints of food crop production. Int. J. Agric. Sustain. 2009, 7, 107–118. [Google Scholar] [CrossRef]
  14. Dong, G.; Mao, X.; Zhou, J.; Zeng, A. Carbon footprint accounting and dynamics and the driving forces of agricultural production in Zhejiang Province, China. Ecol. Econ. 2013, 91, 38–47. [Google Scholar] [CrossRef]
  15. Gan, Y.; Liang, C.; Chai, Q.; Lemke, R.L.; Campbell, C.A.; Zentner, R.P. Improving farming practices reduces the carbon footprint of spring wheat production. Nat. Commun. 2014, 5, 5012. [Google Scholar] [CrossRef] [PubMed]
  16. Bailey, A.P.; Basford, W.D.; Penlington, N.; Park, J.R.; Keatinge, J.D.H.; Rehman, T.; Tranter, R.B.; Yates, C.M. A comparison of energy use in conventional and integrated arable farming systems in the UK. Agric. Ecosyst. Environ. 2003, 97, 241–253. [Google Scholar] [CrossRef]
  17. Gan, Y.; Liang, C.; Hamel, C.; Cutforth, H.; Wang, H. Strategies for reducing the carbon footprint of field crops for semiarid areas. A review. Agron. Sustain. Dev. 2011, 31, 643–656. [Google Scholar] [CrossRef]
  18. Karimi, P.; Qureshi, A.S.; Bahramloo, R.; Molden, D. Reducing carbon emissions through improved irrigation and groundwater management: A case study from Iran. Agric. Water Manag. 2012, 108, 52–60. [Google Scholar] [CrossRef]
  19. Wang, Z.B.; Wang, M.; Chen, F. Carbon Footprint Analysis of Crop Production in North China Plain. Sci. Agric. Sin. 2015, 48, 83–92. (In Chinese) [Google Scholar]
  20. Liu, S.; Wang, X.; Cui, L.; Duan, X.; Zhao, J. Carbon footprint and its impact factors of feed crops in Guanzhong Plain. Acta Sci. Circumstantiae 2017, 37, 1201–1208. (In Chinese) [Google Scholar]
  21. Liu, X.; Xu, W.; Li, Z.; Chu, Q.; Yang, X.; Chen, F. The missteps, improvement and application of carbon footprint methodology in farmland ecosystems with the case study of analyzing the carbon efficiency of China's intensive farming. Chin. J. Agric. Resour. Reg. Plan. 2013, 34, 1–7. (In Chinese) [Google Scholar]
  22. Leigang, S.; Chen, F.; Kong, F.; Fan, S. The carbon footprint of winter wheat-summer maize cropping pattern on north china plain. China Popul. Resour. Environ. 2011, 21, 97–102. (In Chinese) [Google Scholar]
  23. Dubey, A.; Lal, R. Carbon footprint and sustainability of agricultural production systems in Punjab, India, and Ohio, USA. J. Crop Improv. 2009, 23, 332–350. [Google Scholar] [CrossRef]
  24. Huang, X.M.; Chen, C.Q.; Chen, M.Z.; Song, Z.W.; Deng, A.X.; Zhang, J.; Zheng, C.Y.; Zhang, W.J. Carbon footprints of major staple grain crops production in three provinces of Northeast China during 2004–2013. Chin. J. Appl. Ecol. 2016, 27, 3307–3315. (In Chinese) [Google Scholar]
  25. Li, J.; Wang, W.; Pu, L.; Liu, L.; Zhang, Z.; Li, Q. Coastal reclamation and saltmarsh carbon budget: Advances and prospects. Adv. Earth Sci. 2017, 32, 599–614. (In Chinese) [Google Scholar] [CrossRef]
  26. Yan, M.; Luo, T.; Bian, R.; Cheng, K.; Pan, G.; Rees, R. A comparative study on carbon footprint of rice production between household and aggregated farms from Jiangxi, China. Environ. Monit. Assess. 2015, 187, 1–13. [Google Scholar] [CrossRef] [PubMed]
  27. Li, J.; Pu, L.; Ming, Z.; Dai, X.; Yan, X.; Chen, X.; Zhang, L.; Zhang, R. Monitoring soil salt content using HJ-1A hyperspectral data: A case study of coastal areas in Rudong County, Eastern China. Chin. Geogr. Sci. 2015, 25, 213–223. [Google Scholar] [CrossRef]
  28. Knudsen, M.T.; Meyeraurich, A.; Olesen, J.E.; Chirinda, N.; Hermansen, J.E. Carbon footprints of crops from organic and conventional arable crop rotations—Using a life cycle assessment approach. J. Clean. Prod. 2014, 64, 609–618. [Google Scholar] [CrossRef]
  29. Stocker, T.F.; Qin, D.; Plattner, G.K.; Alexander, L.V.; Allen, S.K.; Bindoff, N.L.; Bréon, F.M.; Church, J.A.; Cubasch, U.; Emori, S. IPCC, 2013: Technical Summary. In Climate Change 2013: The Physical Science Basis. Contribution of Working Group I to the Fifth Assessment Report of the Intergovernmental Panel on Climate Change; Stocker, T.F.D., Qin, G.-K., Plattner, M., Tignor, S.K., Eds.; Cambridge University Press: Cambridge, UK, 2013; pp. 533–535. [Google Scholar]
  30. Weidema, B.; Bauer, C.; Hischier, R.; Mutel, C.L.; Nemecek, T.; Reinhard, J.; Vadenbo, C.O.; Wernet, G. Data Quality Guidelines for the Ecoinvent Database Version 3: Overview and Methdology (Final); The Ecoinvent Centre: St. Gallen, Switzerland, 2013. [Google Scholar]
  31. West, T.O.; Marland, G. A synthesis of carbon sequestration, carbon emissions, and net carbon flux in agriculture: Comparing tillage practices in the United States. Agric. Ecosyst. Environ. 2002, 91, 217–232. [Google Scholar] [CrossRef]
  32. Xie, H. Improvement and Application of Ecological Footprint Evaluation Model; Chemical Industry Press: Beijing, China, 2008. [Google Scholar]
  33. Di, X.; Nie, Z.; Yuan, B.; Zuo, T. Life cycle inventory for electricity generation in China. Int. J. Life Cycle Assess. 2007, 12, 217–224. [Google Scholar] [CrossRef]
  34. Miao, R.; Zhang, F.; Li, L. Analysis of biomass and nitrogen content in the ground and underground of maize/broad bean, wheat/broad bean and barley/broad bean intercropping system. Chin. Agric. Sci. Bull. 2008, 24, 148–152. (In Chinese) [Google Scholar]
  35. Xue, L.; Yang, L.; Fan, X. Estimation of nitrogen content and C/N in rice leaves and plant with canopy reflectance spectra. Acta Agron. Sin. 2006, 59, 289–302. (In Chinese) [Google Scholar]
  36. Law, Y.; Ye, L.; Pan, Y.; Yuan, Z. Nitrous oxide emissions from wastewater treatment processes. Philos. Trans. R. Soc. Lond. 2012, 367, 1265–1277. [Google Scholar] [CrossRef] [PubMed]
  37. Yoshikawa, N.; Ikeda, T.; Amano, K.; Shimada, K. Carbon Footprint Estimation and Data Sampling Method: A Case Study of Ecologically Cultivated Rice Produced in Japan. In Proceedings of the VII International Conference on Life Cycle Assessment in the Agri-Food Sector, Bari, Italy, 22–24 September 2010. [Google Scholar]
  38. Pandey, D.; Agrawal, M.; Pandey, J.S. Carbon footprint: Current methods of estimation. Environ. Monit. Assess. 2011, 178, 135–178. [Google Scholar] [CrossRef] [PubMed]
  39. Adom, F.; Maes, A.; Workman, C.; Clayton-Nierderman, Z.; Thoma, G.; Shonnard, D. Regional carbon footprint analysis of dairy feeds for milk production in the USA. Int. J. Life Cycle Assess. 2012, 17, 520–534. [Google Scholar] [CrossRef]
  40. Brock, P.; Madden, P.; Schwenke, G.; Herridge, D. Greenhouse Gas Emissions Profile for 1 Tonne of Wheat Produced in Central Zone (East) New South Wales: A Life Cycle Assessment Approach; The Society: London, UK, 2012; pp. 78–85. [Google Scholar]
  41. Baek, C.Y.; Lee, K.M.; Park, K.H. Quantification and control of the greenhouse gas emissions from a dairy cow system. J. Clean. Prod. 2014, 70, 50–60. [Google Scholar] [CrossRef]
  42. Wu, N.; Wang, E.; Wang, C.; Ning, T.; Li, Y.; Zhou, C. Effects of tillage on carbon footprint of wheat-corn two cropped farmland ecosystem. Shandong Agric. Sci. 2017, 49, 34–40. (In Chinese) [Google Scholar]
  43. Cao, L.; Li, M.; Wang, X.; Zhao, Z.; Pan, X. Life cycle assessment of carbon footprint for rice production in Shanghai. Acta Ecol. Sin. 2014, 34, 491–499. (In Chinese) [Google Scholar]
  44. Cui, Z.; Zhang, H.; Chen, X.; Zhang, C.; Ma, W.; Huang, C.; Zhang, W.; Mi, G.; Miao, Y.; Li, X.; et al. Pursuing sustainable productivity with millions of smallholder farmers. Nature 2018, 555, 363–366. [Google Scholar] [CrossRef] [PubMed]
  45. Li, S. Deepening the implementation of energy conservation and low-carbon development strategy to accelerate the formation of green oil and chemical industry development. Chem. Enterp. Manag. 2016, 25, 17–21. (In Chinese) [Google Scholar]
  46. Wang, Y.; Li, C.; Wang, J.; Tan, J. Application and Prospect of Slow/Controlled Release Fertilizers in Maize Production. Chin. Agric. Sci. Bull. 2009, 25, 254–257. (In Chinese) [Google Scholar]
  47. Zhao, Z.; Han, X.; Shi, Y.; Wu, W.; Meng, F. Effect of nitrification and urease inhibitor on carbon sequestration and greenhouse gas emissions in winter wheat and summer maize rotation system in North China. Trans. Chin. Soc. Agric. Eng. 2016, 32, 254–262. (In Chinese) [Google Scholar]
  48. Liu, L.; Xu, W.; Sang, D.; Liu, C.; Zhou, J.; Yang, J. Field nitrogen management to improve nitrogen use efficiency in rice. Acta Agron. Sin. 2006, 32, 987–994. (In Chinese) [Google Scholar]
  49. Zhang, X.; Dong, Y.; Wang, H.; Shen, D.; Liu, D. Temporal and spatial variation of manure load in farmland of Jiangsu Province. Sci. Geogr. Sin. 2007, 27, 597–601. (In Chinese) [Google Scholar]
  50. Qi, L.; Liu, B.J.; Ambus, P.; Zhang, Y.H.; Hansen, V.; Lin, Z.B.; Shen, D.C.; Gang, L.; Bei, Q.C.; Zhu, J.G. Carbon footprint of rice production under biochar amendment—A case study in a Chinese rice cropping system. Glob. Chang. Biol. Bioenergy 2016, 8, 148–159. [Google Scholar]
Figure 1. Map location of our study area.
Sustainability 10 00928 g001
Figure 2. Carbon footprint assessment framework.
Sustainability 10 00928 g002
Figure 3. CO2 and N2O emissions from the four crops’ productions. Indicators of the “abcd”: Different lower-case letters indicate significant differences (P < 0.05).
Sustainability 10 00928 g003
Figure 4. Our CF structures of the four crops in saline agriculture.
Sustainability 10 00928 g004
Figure 5. Relationship between N input rate and crop grain CF.
Sustainability 10 00928 g005
Table 1. The descriptive statistics of the surveyed farmers.
AgeReclaimed YearsFarmland AreaSMCPMCAHI (million RMB)
>0.10.05~0.1<0.05
Mean58.7945.338.278.24%68.24%2.30%4.94%82.76%
Min8.0015.002.00
Max85.0080.0045.00
SD9.9422.734.57
Note: SMC refers to senior middle school degree (%); PMC refers to primary school degree or below (%); SD is for standard deviation; AHI refers to annual household income.
Table 2. Annual resource input and output from crops on 1 ha land.
CropN Fertilizer
(kg)
P Fertilizer
(kg)
Pesticides
(kg)
Power Consumption
(kWh)
Diesel Oil
(L)
Grain
(kg)
Residuals
(kg)
Barley259.91 ± 107163.41 ± 1001.09 ± 0.25 82.35 ± 136451.80 ± 8558387.35 ± 1111
Wheat299.49 ± 114166.64 ± 1041.22 ± 0.2589.25 ± 117980.80 ± 130010,853.89 ± 1769
Corn439.28 ± 14480.35 ± 831.5 ± 0.2775.0 ± 107218.22 ± 10197940.05 ± 1121
Rice362.7 ± 149111.17 ± 1131.39 ± 0.371569.36 ± 57377.65 ± 310,499.17 ± 66610,499.17 ± 666
1 mean ± SD; 2 The amount of fertilizer-Nitrogen inputs is converted as Nitrogen; the amount of fertilizer-P inputs is converted as P2O5; the amount of pesticide inputs is converted as active ingredient; power consumption comes from irrigation; fossil fuel (mainly diesel oil) is used during ploughing, sowing and harvesting.
Table 3. Parameters for our CF calculation (Equations (1)–(4)).
CodeUnitValueReference
WCO21[29]
WN2O298[29]
WCH425[29]
WCFNkg·kg−14.77[30]
WCFpkg·kg−12.02[30]
WPEkg·kg−118.04[31]
WMAkg·L−12.76[32]
WELkg·kWh−10.943[33]
WURkg·kg−10.2[29]
WGRkg·kg−1Barley: 0.035
Wheat: 0.036
Corn: 0.038
Rice: 0.028
[34]
[35]
DNkg·kg−10.0105[29]
WNHkg·kg−10.01[29]
L0.25[29]
NLkg·kg−10.0075[29]
E(CH4)diffkg·ha−1·day−10.150[29]
Table 4. Contribution of different GHGs to total per-area CF.
Total Carbon Footprint
(kg CO2 eq·ha−1)
CO2 Contribution (%)N2O Contribution (%)CH4 Contribution (%)
Barley3986.8747.32%52.68%0.00%
Wheat4712.4844.41%55.59%0.00%
Corn5344.1846.88%53.12%0.00%
Rice7698.0745.81%49.12%5.07%
Table 5. Per-yield CF of the four crops in our study area.
CropNumber of SamplesPer-Yield Carbon Footprint (kg CO2 eq·kg−1)
MaxMinMeanSD
Barley841.480.20.630.18
Wheat1814.610.220.640.18
Corn2134.20.190.770.22
Rice101.580.410.740.24
Table 6. CF related researches in China and abroad. Unit: kg CO2 eq·kg−1.
Study AreaBarleyWheatCornRiceReference
Saline agriculture 0.6300.6360.7690.739This study
USA0.390[39]
Korea0.712[41]
Australia0.15–0.20[40]
Japan7.7[37]
Jiangxi, central China0.62–1.1[26]
Shandong, eastern China0.219–0.4260.563–0.89[42]
Guanzhong plain, Western China0.620[20]
North China plain0.120.08[22]
Northeast China0.2900.324[24]
Table 7. The assessment frameworks of CF in different countries.
FertilizerLand PreparationAgrochemicalsIrrigationInfrastructureTransportationSowing-HarvestingPackagesGrain PolishingGrain BoilingWaste Treatment
NPKTrace Nutrients Manure
Japan [37]
USA [39]
Korea [41]
Australia [40]
This study
Note: Trace nutrients cover sulfur, boron, and lime, etc.

