Performance of a RBSN under the RCP Scenarios: A Case Study in South Korea


Department of Civil Engineering, Yeungnam University, Gyeongsan 38541, Korea
*
Author to whom correspondence should be addressed.
Sustainability 2018, 10(4), 1242; https://doi.org/10.3390/su10041242
Submission received: 28 March 2018
/
Revised: 12 April 2018
/
Accepted: 16 April 2018
/
Published: 18 April 2018
(This article belongs to the Special Issue Impacts of Climate Change on Hydrology, Water Quality and Ecology)
Abstract
:According to the Intergovernmental Panel on Climate Change’s (IPCC) Fifth Assessment Report, the amount of precipitation in South Korea would increase regardless of the reduction of Greenhouse Gas (GHG) emissions. However, at the same time, it is expected that the temporal and spatial rainfall variation would also increase. Due to the impact from typhoons, 90% of the annual precipitation in Korea occurs in July, August, and September. Moreover, the Representative Concentration Pathways (RCP) scenario projected that the average precipitation in this period is expected to increase markedly, especially over the next 100 years. These predictions imply an increased variability of available water resources. In this study, we assessed a RBSN (rain barrel sharing network) as an efficient way to respond to the future climate change projections under the RCP scenarios when compared to the historical data. We proposed an evaluation procedure for the reliability, resilience, and vulnerability of RBSN based on a storage-reliability-yield (SRY) relationship. The result shows that the reliability and resiliency of a RBSN will improve but be more vulnerable compared to the results from the historical rainfall data. However, even in the climate change condition, the results showed that a RBSN still contributes to reduce vulnerability. The results of this study imply that a RBSN is an effective and alternative measure that can deal with the impacts of climate change in the future.
1. Introduction
A rainwater harvesting system (RWHS) is the accumulation and storage of rainwater for various uses directly on-site with containers, gathering tanks, and other forms of storage devices, rather than allowing water to run [1]. RWHS comes in all shapes and sizes, from simple catchment system under a downspout to large above and/or underground cisterns with complex filtration systems. Types of RWHS include the simplest form of rainwater harvesting such as rain barrels, domestic RWHSs such as gravity feed systems on building tops or pump feed systems at ground level. There are commercial or industrial RWHSs, which are different from the domestic RWHSs mainly by their greater sizes. The advantage of RWHS includes covering the peak flow in demand that is greater than the amount of the water source, flexible responses to irregular water supply, and sustainable water resources management, which can contribute to water security in the case of supply interruptions or disaster. Moreover, harvested rainwater can be used in each household. There are additional benefits, as a source of chemically untreated water that can reduce peak flow in urban catchments and also offer freeze protection by working as a form of thermal conservation. A rainwater harvesting system (RWHS) typically consists of natural landforms and artificial facilities that store rainwater in the hydrologic cycle [2]. Owing to these advantages, the RWHS has been adopted for diverse purposes around the world for centuries. For example, in household irrigation and other uses [2,3,4], and in agricultural irrigation in both urban and rural areas [5,6]. It has been broadly employed as a pragmatic methodology for sustainable water resource management, especially in municipal regions.
RWHS is fast becoming an essential part of sustainable water management [7]. Most of the previous studies have been focused on the optimal sizing of rainwater storage, using a mass balance relation [6,8,9]. The concept of rainwater harvesting is close to that of stormwater basins or reservoir systems except for on-site use. Therefore, similar approaches have been applied to determine the optimal-sizing of a rainwater storage system, such as an analytical equation for storm-water detention [10], a general storage-reliability-yield (SRY) relationship [11], and a method with different results depending on the scenario [12], or a dimensionless method [12]. On the other hand, the regional performance of RWHS has drawn great attention as it is necessary to comprehend how regional characteristics, such as social and natural components, affect the performance of a RWHS [13,14,15,16,17].
The importance of RWHS as an alternative water source is becoming prominent and now receives greater attention under climate change. Various studies have proposed an integrated method for the sizing of a RWHS [18] and assessed the performance of a RWHS under various climatic conditions. Asadieh et al. [19] showed that a suburban RWHS primarily for the purpose of non-potable water is more sensitive to climate change compared to other forms of RWHS. Jafarzadeh et al. [20] investigated the capacity of an RWHS, which is required for a specific deficit rate under climate change, and showed that a climate change scenario resulted in a capacity reduction. Label et al. [21] assessed the benefits of a RWHS on the maize yield increase based on a spatial climate projection in Africa. Haque et al. [22] reported the negative effects of climate change on the performance of a RWHS in Australia.
A single user involves both the production and use of rainwater, which enables mutual aid among multiple users. This is one of the interesting features of a RWHS: its potential to be commonly shared among neighbors because of its on-site use characteristic. Social campaigns and programs can promote and encourage people to form a feasible rain barrel sharing network (RBSN). Therefore, a RBSN can be defined as a sharing network in a community, of which members readily share their stored (rain barrel) rainwater with others. All members in the community can join the sharing program. However, sometimes, only a few members would join the sharing program depending on their needs. There can be possible combination of demands depending on the number of users who join the sharing program. Seo et al. [23] introduced a virtual community of four individual users and showed that the reliability of a RBSN increases as the degree of sharing increases. The benefits from a RBSN are expected to be larger under climate change [24].
The main focus of this study is to evaluate a RBSN under climate change and whether a RBSN degrades or upgrade the performance of RWHS in a qualitative basis using three performance criteria: reliability, resiliency, and vulnerability. In this regard, this study measures the performance of a RBSN depending on the degree of sharing and how it changes under climate change conditions. Specifically, this study assesses the performance of a RBSN under RCP scenarios, including how successfully a RBSN works (reliability), how quickly a RBSN recovers from a failure state (resiliency), and how severely a RBSN fails (vulnerability). We compared these performance criteria with different climate change scenarios and compared the results with historical rainfall data to examine the benefit of a RBSN under climate change. Four cities in South Korea were selected as a case study with regional projections based on the RCP Scenarios from IPCC [25]. We assumed water demand as a random variable to contain the uncertainty of demand, similar to previous studies [23,24,26,27].
2. Methods
2.1. Study Area and Corresponding RCP Scenarios
The RCPs used in this study are the climate change scenarios presented in the IPCC Fifth Assessment Report [25]. The RCPs describe four different pathways, including GHG emissions and atmospheric concentrations, air pollutant emissions, and land use. A storyline for each RCP is based on the degree of implementation of the GHG mitigation policy, as shown in Table 1. The RCP scenarios include a rigorous mitigation scenario (RCP 2.6), two scenarios of a moderate level of mitigation (RCP 4.5 and RCP 6.0), and one GHG emissions scenario of a high level of mitigation (RCP 8.5). RCP 2.6 is a scenario in which GHG mitigation is very strict and the surface temperature increase is maintained below 2 °C compared to before industrialization [25]. Global warming will continue for 100 years from now under all RCP scenarios except RCP 2.6. The surface temperature of the earth is expected to maintain approximately invariable at elevated levels for many centuries even after absolute cessation of factitious CO2 emissions [25]. Hence, this study used RCP 4.5, which severely limits GHG emissions among intermediate-level scenarios, and RCP 8.5, which emits GHG to current levels.
These cover a wider range of possible pathways than the scenarios used in previous SRES assessments, as they additionally consider scenarios with practices regarding climate policy. Compared to the SRES scenarios used in the IPCC fourth Assessment Report, RCP projections brought about the improvement of the resolution: grid spacing is about 9 times as large as before, and grid spacing in the target area is about 10 times as much as 10 km to 1 km. This made it possible to reflect the various elements affecting possible climate change projections [25].
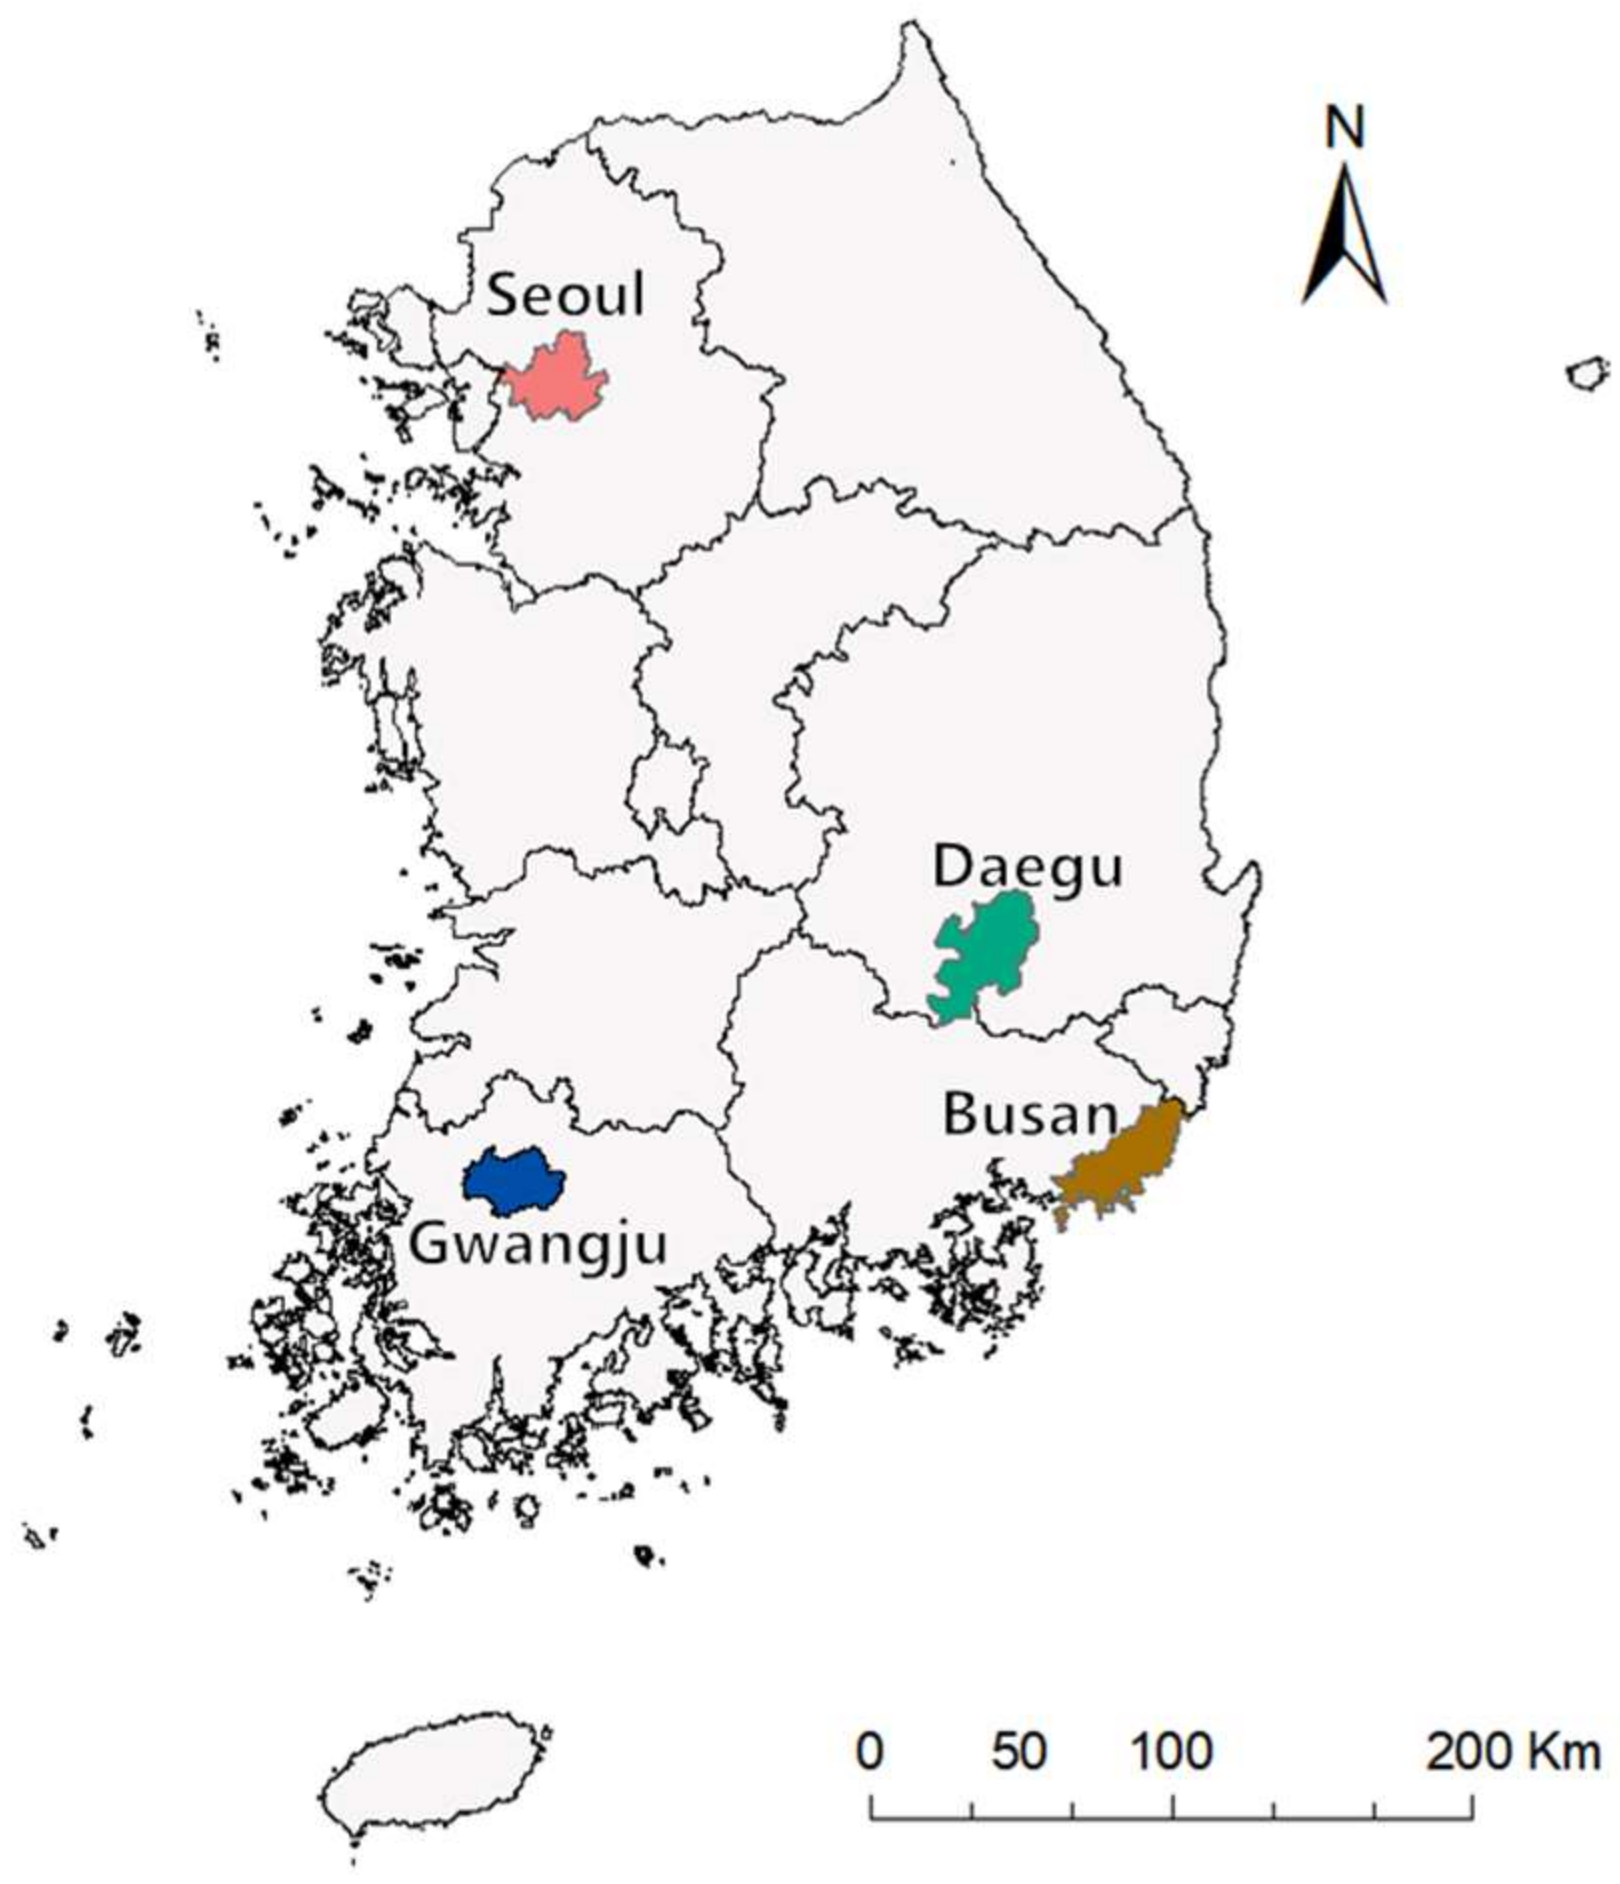
The study areas consist of four metropolitan cites in South Korea: Seoul, Busan, Daegu, and Gwangju. These cities have a population of greater than 1.5 million each and are among the largest metropolitan cities in South Korea. Figure 1 shows the locations of the study areas. The regional projection data in South Korea was obtained from the Korea Meteorological Administration (KMA). KMA produced the regional projection using a HadGEM3-RA (12.5 km resolution) with the global scenario from HadGEM2-AO (135 km resolution). Again, a statistical disaggregation model, PRISM (Parameter-elevation Regression on Independent Slopes Model) was used to produce detail projections (1 km resolution) in South Korea [28,29].
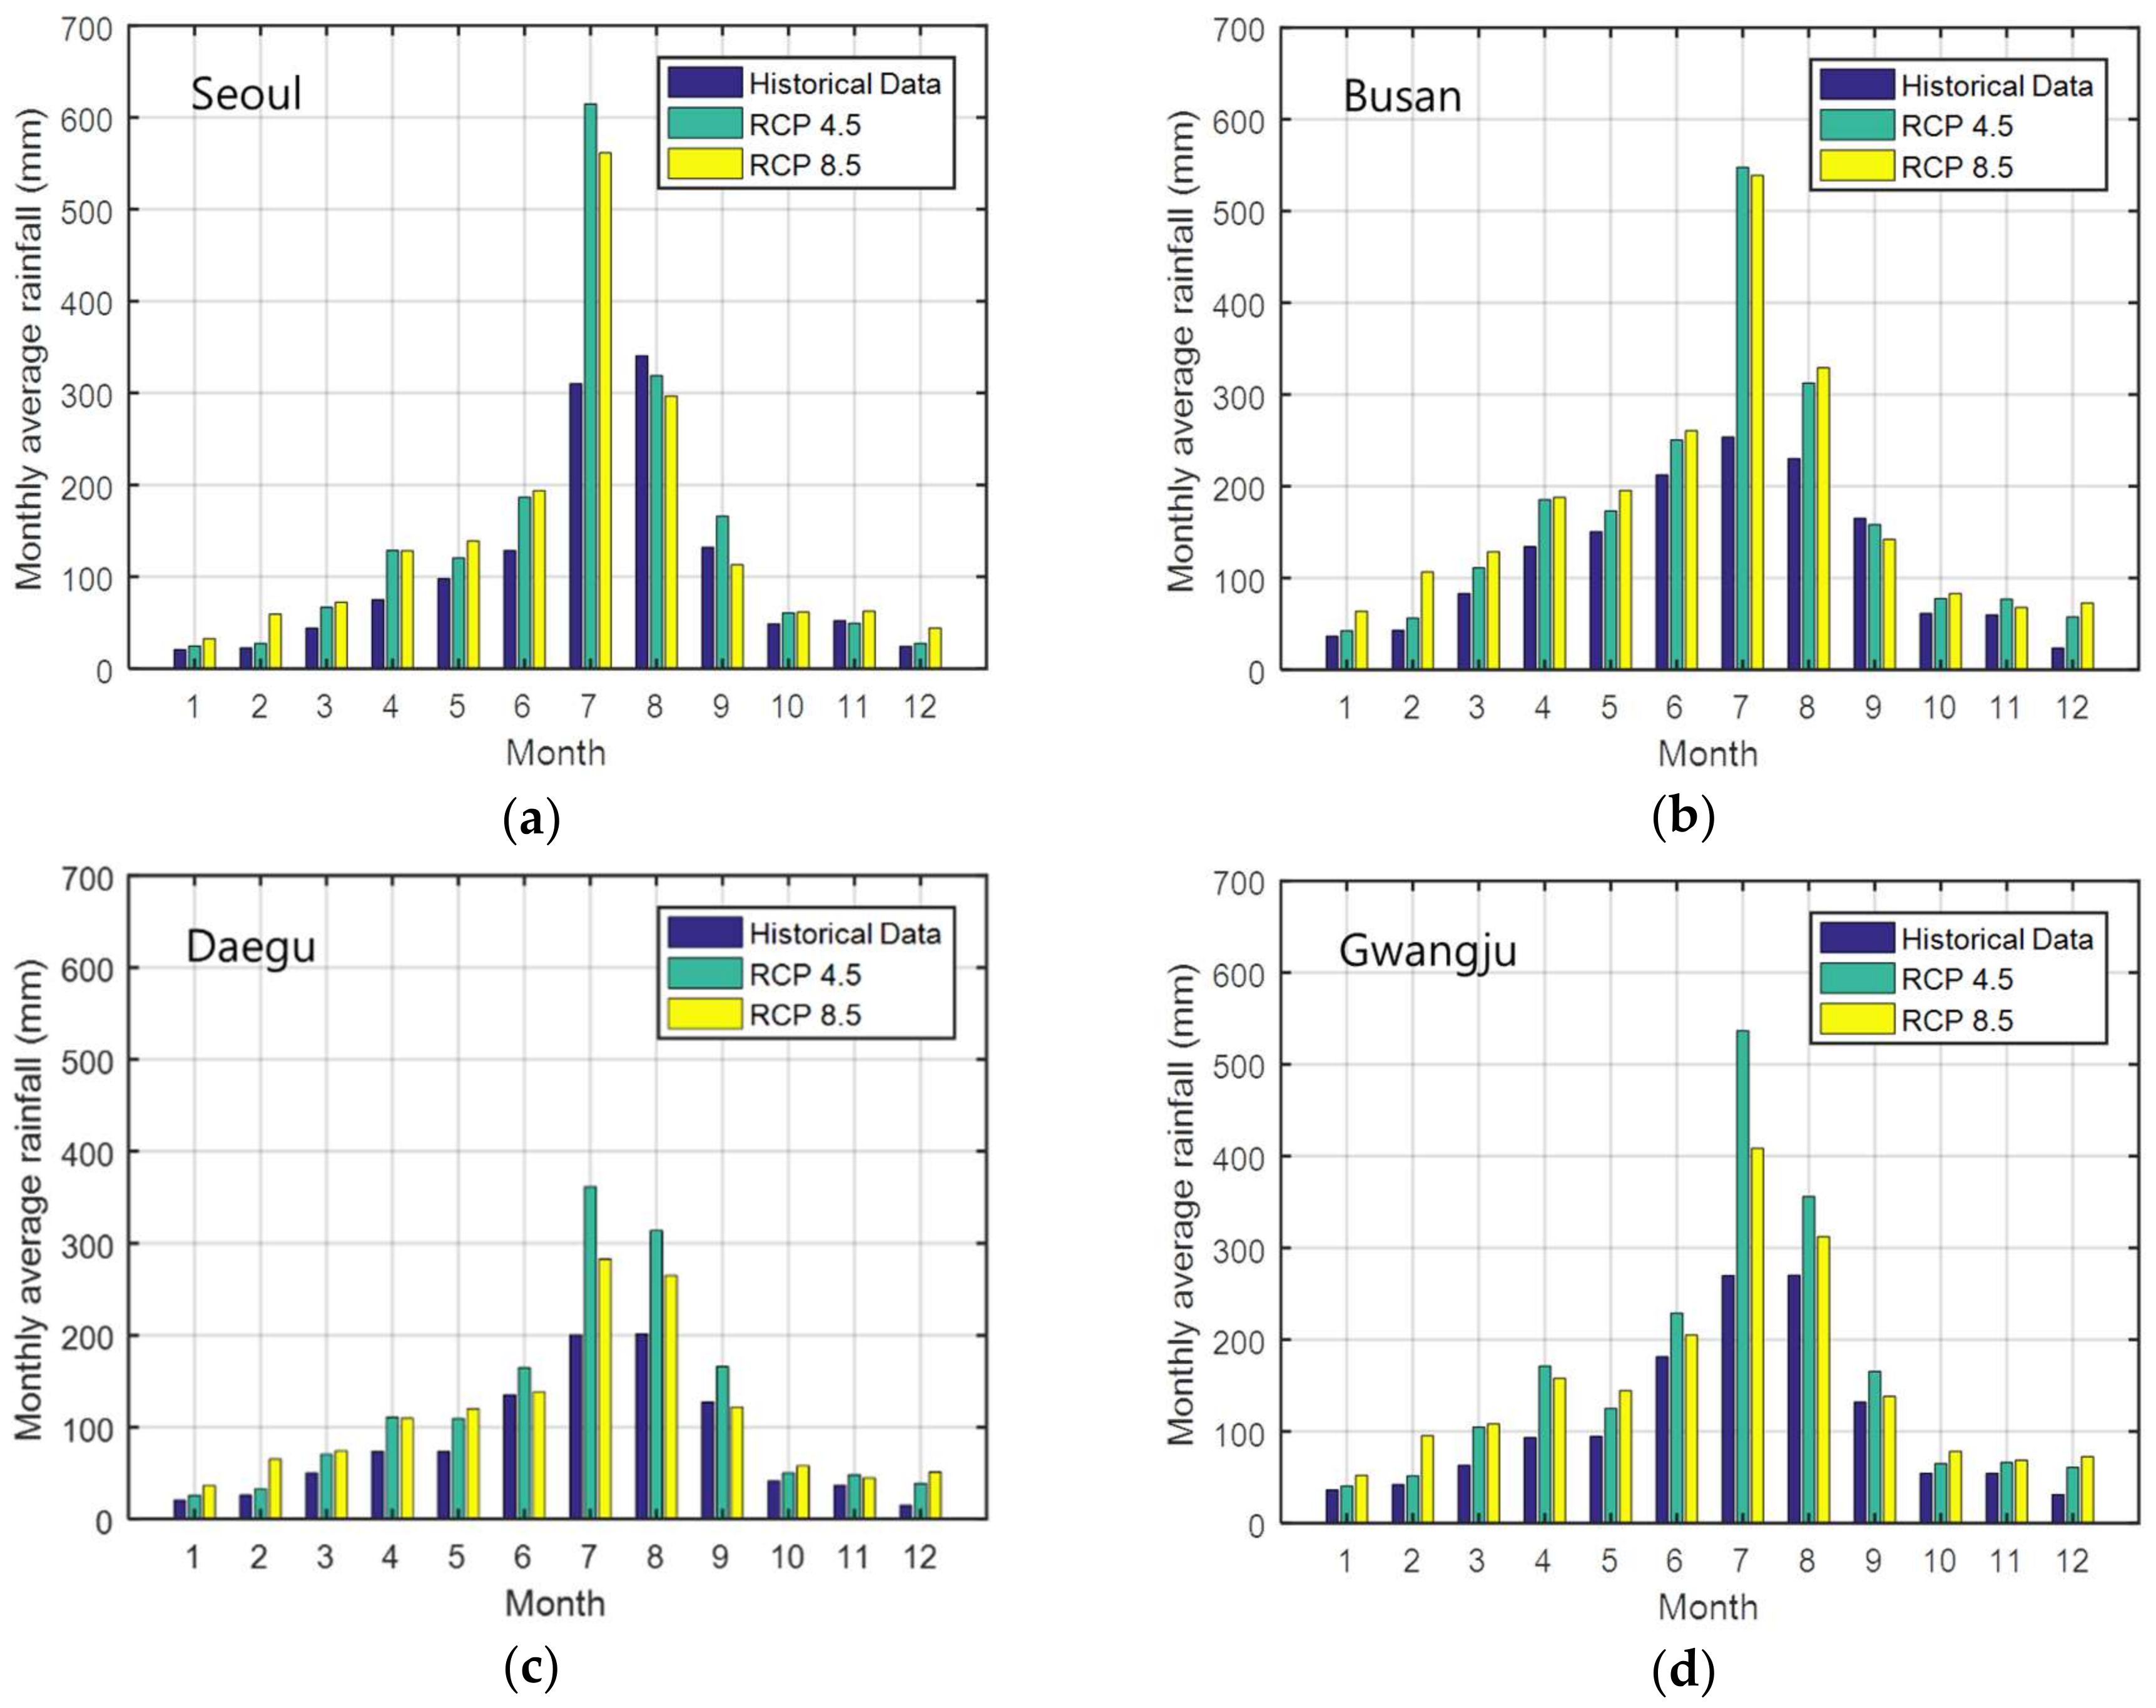
The projection shows a unanimous increase in monthly rainfall for both RCP 4.5 and 8.5 scenarios, which is different from the previous SRES scenarios. Seo et al. [23] reported that the monthly rainfall changes based on the SRES scenarios, such as in A1B, A2, and B1. The SRES scenarios forecasted that the monthly rainfall in July will increase by 113%, whereas the monthly rainfall in October will decrease by −26.7% in Seoul. However, RCP scenarios result in different projects as shown in Figure 2. Figure 2 shows the monthly rainfall projection from 2071 to 2100. The RCP 4.5 and 8.5 projection shows that the monthly rainfall in Seoul on July will increase by 199% and 186%, respectively. Monthly rainfall in July in Busan, Daegu, and Gwangju will increase by 220%, 180%, and 193%, respectively. This tendency in monthly rainfall increase is similar for all months. The RCP scenario shows increases also in the winter seasons when compared to the historical data. Particularly, it shows great increases in monthly rainfall in February and December. For example, the monthly rainfall in December and February will increase by 409% and 353%, respectively. The annual precipitation will increase by 149% and 150% for the RCP 4.5 and 8.5 scenarios, respectively.
2.2. SRY Relation and a RBSN
Combining demand, reliability and precipitation, a simple mass balance relation is used to calculate the storage. Storage is a cumulative summation of the difference between demand and precipitation but remains positive. If storage goes below zero, the state changes to a failure. The SRY curve method was used to calculate the required storage size for a given target reliability [11]:
where Sr is the total storage size of a RWHS per unit collecting area (1 m2), X is demand, R is reliability, and P is precipitation for a time period of interest. Here, the yield ratio is a non-dimensional one, which is divided by the mean daily rainfall. For example, α = 0.1 means that the demand is 1/10 of the mean daily rainfall:
This study assumes the water demand as a random variable with a lognormal distribution due to its inherent variability. The daily water demand is a combination of different and diverse water uses [4]. It is important to take account of inherent variability in water demand that is caused by variable purposes, different timing and amount of use. In case of sharing, a new combination of demand (Ci) is calculated based on the number of users who join the sharing group. The new combination of demand is normalized by the users’ contributing area before applying it to obtain the required storage as follows [24]:
where Srtotal is the total required storage for the target reliability, Sri is the required storage for user i, ai is contributing area, and Ci is a new combination of demands based on sharing networks among users. Figure 3 depicts an example of SRY curves in Seoul with historical rainfall data from 1971 to 2000. Figure 3 shows an increase in reliability with increasing storage size given a yield ratio (α).
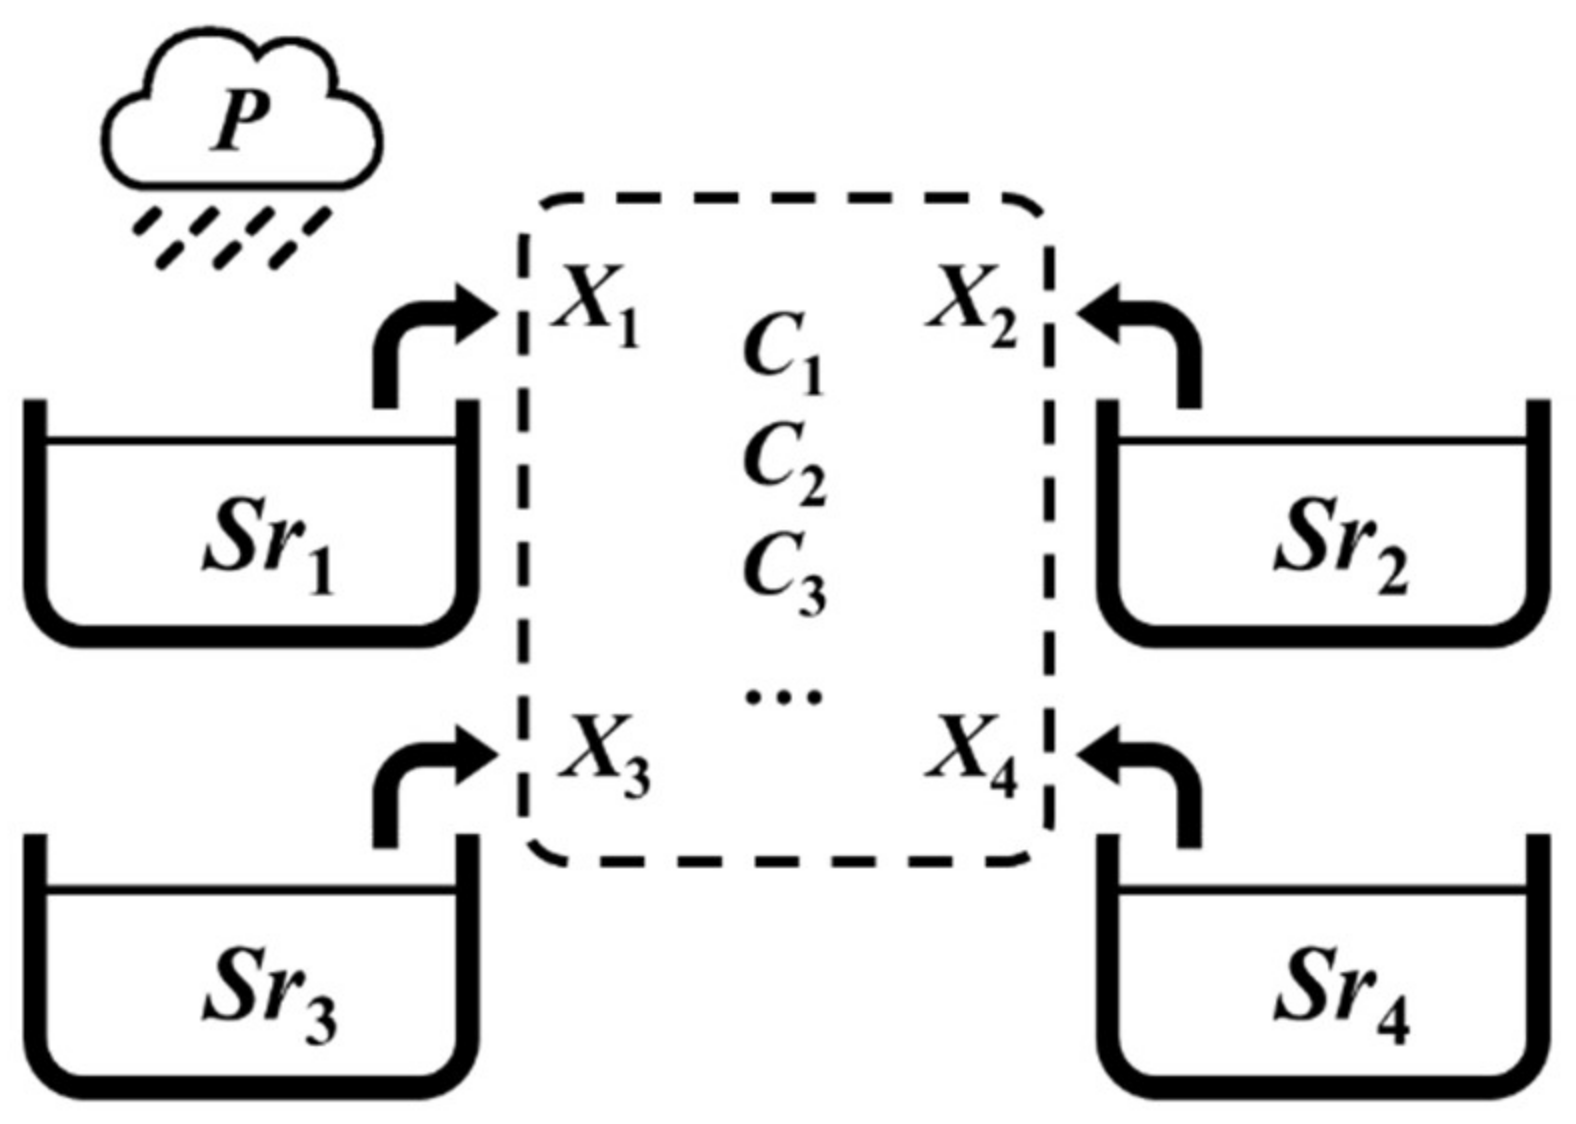
Figure 4 shows a RBSN that consists of the four individual users with rainwater storage (rain barrel) for each that are considered in this study. Individual users can share their storage with others. This sharing creates a new combination of demands. The sharing degree (Nc) is represented by the number of sharing connections [24,28]. For example, there are three connections (Nc = 3) if all four users are sharing their storage. For Nc = 1, possible sharing connections are dependent on whom will join the sharing group. Let us say User 1 (X1) and User 2 (X2) share their storage with each other, then two other users (X3 and X4) are out of the sharing network. Therefore, new possible combinations of demands are C1 (X1 + X2), C2 (X3) and C3 (X4). This corresponds to scenario 11 listed on Table 2. Actually, there are a number of possible combinations, depending on the number of users who join a sharing group. Table 2 lists all the possible combinations depending on the number of connections (Nc) considered in this study. With all of the possible number of combinations, a new SYR relation can be derived. Finally, comparing this SRY relation with that from the non-sharing case reveals the benefit of a RBSN. Basically, the benefit of a RBSN results in a higher reliability for the same storage size, which means the supply storage meets a user’s demand more often when compared to the non-sharing case. Given a target reliability, a RBSN can contribute to reducing the storage size by sharing. It means one can reduce the costs of rainwater harvesting with the same performance.
2.3. Performance Criteria
What would be the benefit from a community sharing strategy on the performance of an individual RWHS? The main focus of this study is to assess whether a RBSN degrades or upgrades the performance of RWHS in a qualitative way using three different performance criteria. We used reliability, resiliency, and vulnerability as the performance criteria of a RBSN in this study. These performance criteria are commonly adopted for a water resources system, such as a reservoir system [11]. Reliability can be defined as the ratio of success states as follows:
where R is reliability and n is the total number of days, nf, ns are the number of failure and success days, respectively. The resiliency can be defined as the inverse of the average days of consecutive failure states [30].
where γ is the resiliency, R is the reliability, and rf is the ratio of the total number of days when the state changes from failure to success divided by the total number of days. Vulnerability of a RBSN is defined as follows [30].
where ν is the vulnerability, F is a set of failure states, sj is an indicator showing how severe a failure state is. ej is the probability of sj. In this study, the deficit amount of demand was used as sj. In this regard, the vulnerability of a RBSN is defined as a mean deficit amount of demand.
3. Results and Discussion
3.1. Performance of a RBSN under the RCP Scenarios
Figure 4, Figure 5 and Figure 6 show the reliability, resiliency, and vulnerability of a RBSN in Seoul. This study used rainfall data from 1971 to 2000 as the historical rainfall data. As mentioned earlier, this study applied climate change scenarios (RCP 4.5 and RCP 8.5) from 2071 to 2100, downscaled by KMA [www.climate.go.kr].
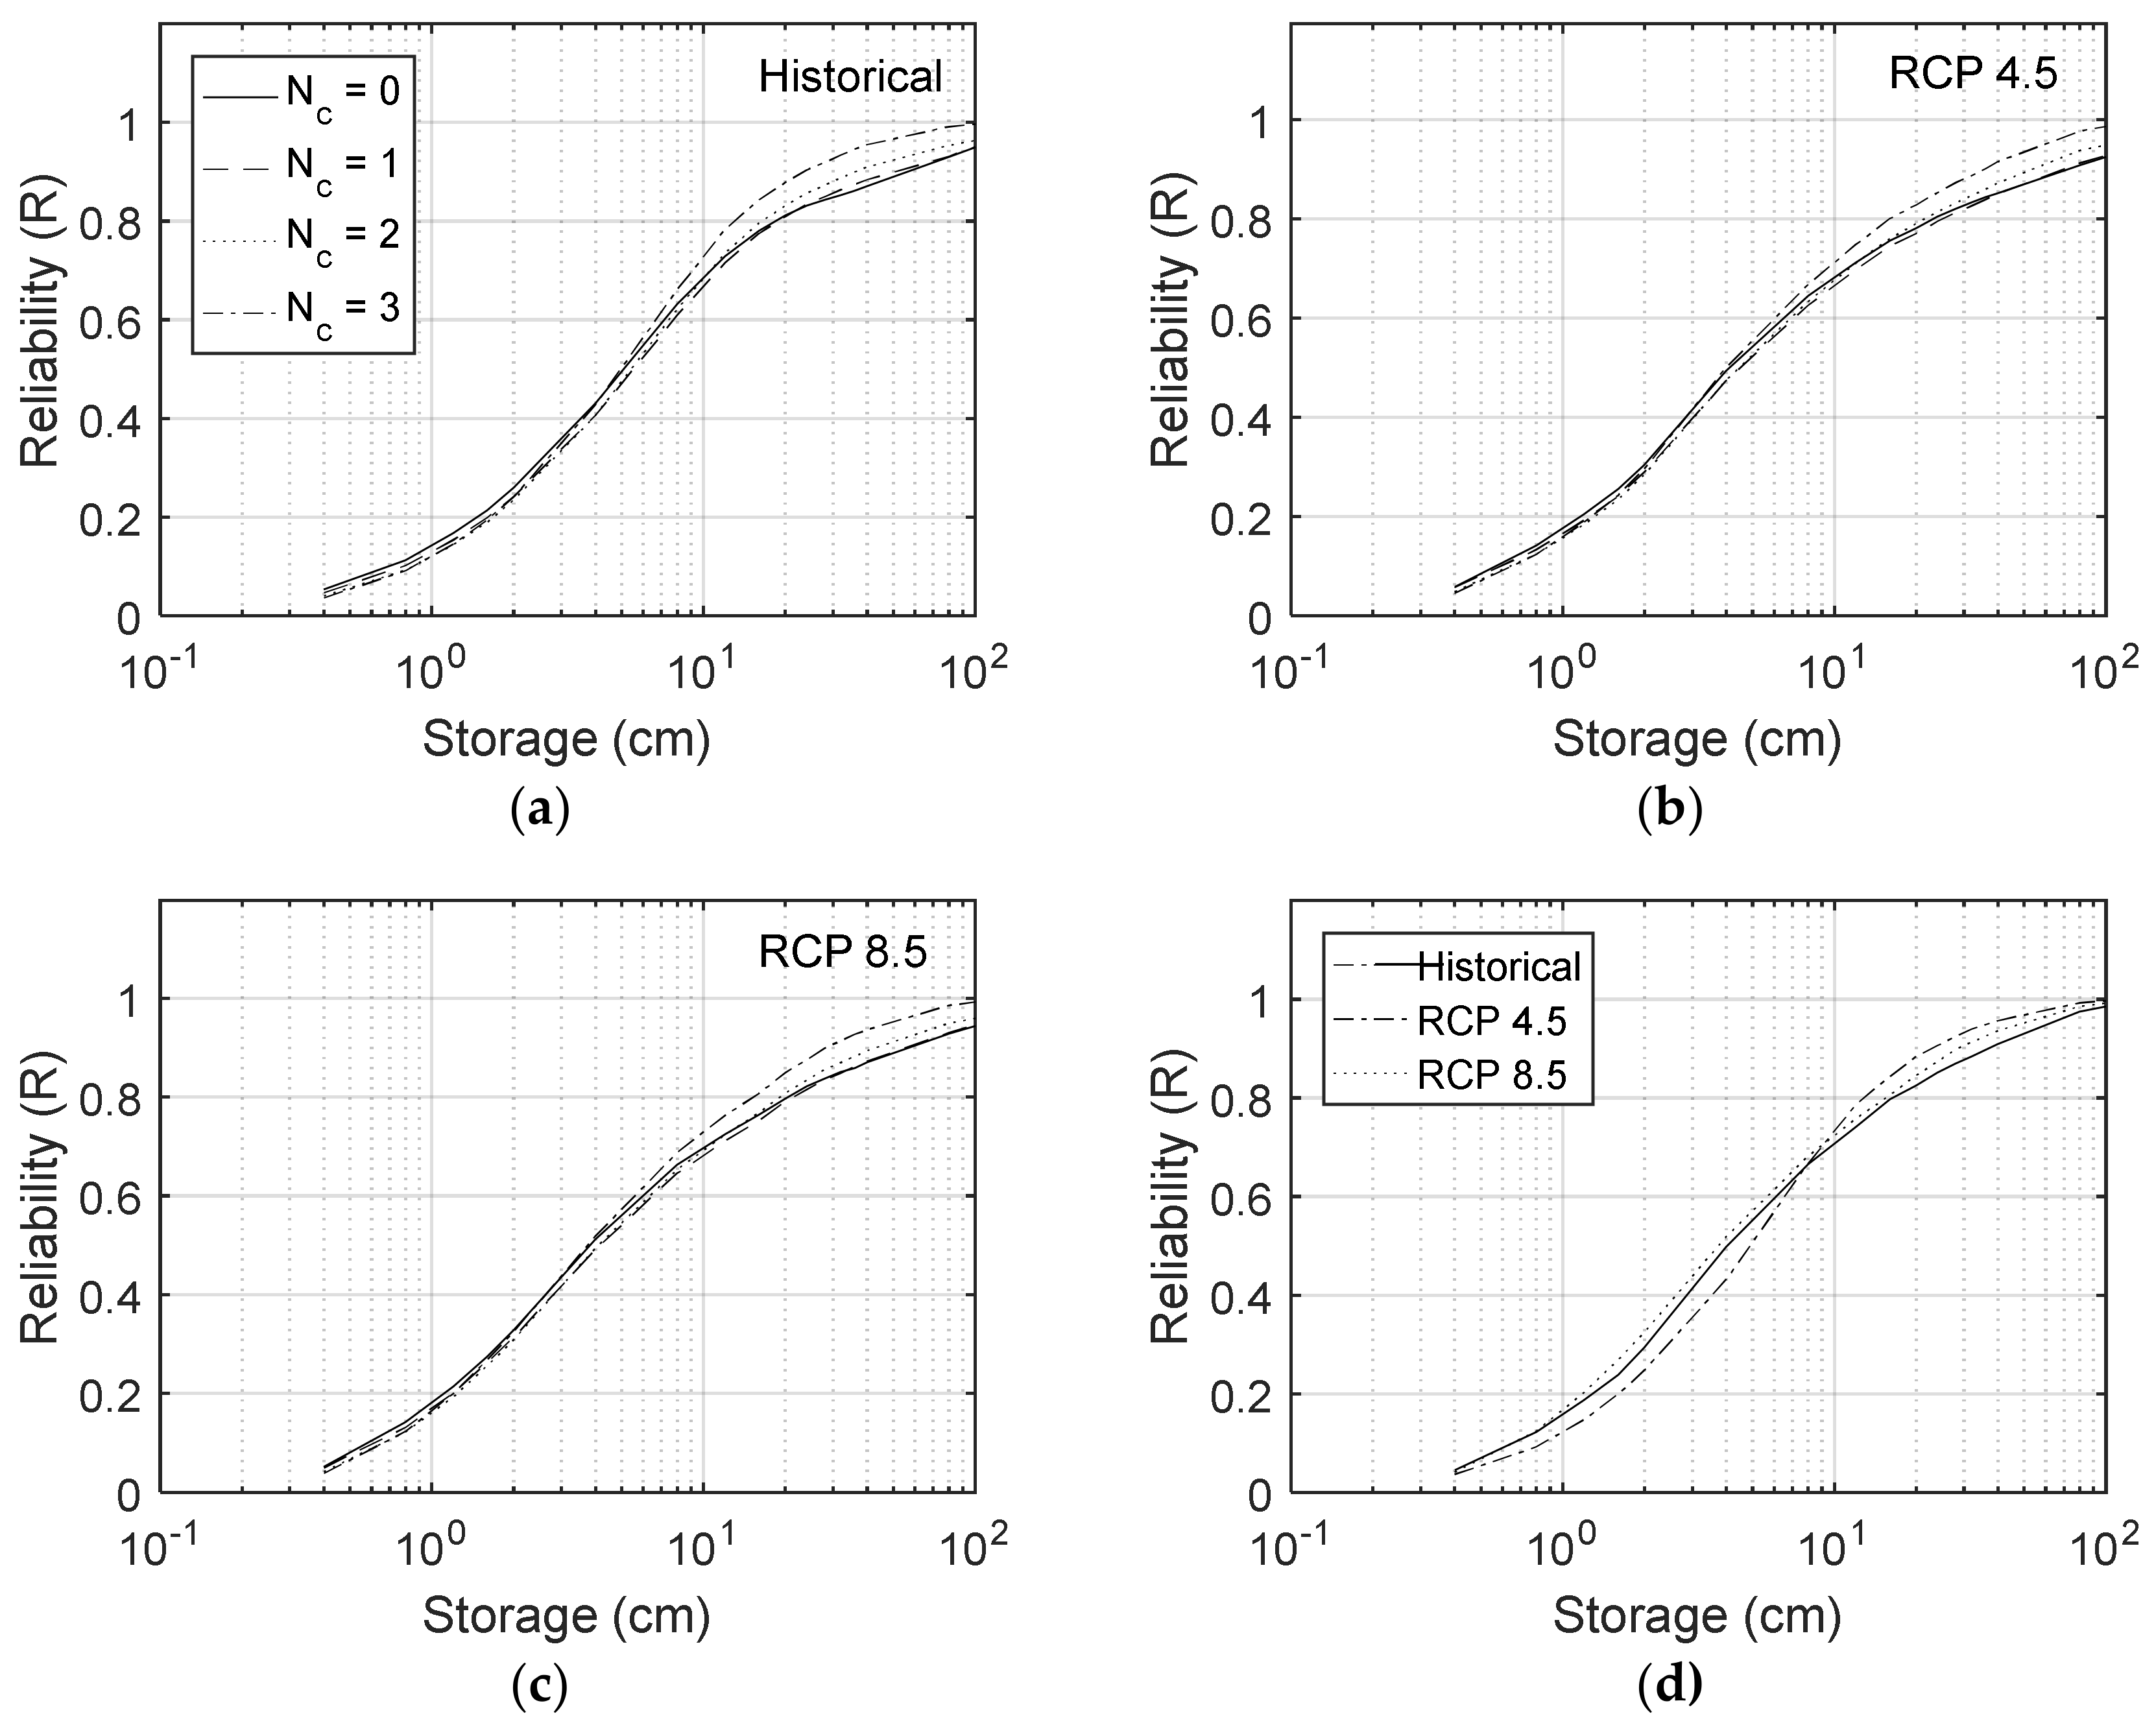
The results show the benefit of a RBSN as the degree of sharing (number of connection, Nc) increases. Figure 5 shows the reliability-storage relation in Seoul for historical rainfall data from 1971 to 2000. The benefit is maximized when all users in a community (Figure 4) are connected and share their storage (Nc = 3). Especially, the result shows that this benefit is obvious in a high reliability region, where the reliability is greater than 60, as shown in Figure 5a. This result is consistent even under climate change conditions, as shown in Figure 5b,c for the RCP 4.5 and 8.5 scenarios, respectively. Figure 5d compares the reliability of a RBSN with historical rainfall and climate change conditions when all users join the sharing group and are fully connected (Nc = 3). The results are interesting in that they show different behaviors when the reliability is greater than 65 and when it is less than 65. The results show that the reliability of a RBSN improves under climate change conditions when the reliability is greater than 65. Both RCP 4.5 and RCP 8.5 result in improved reliability for the region where the reliability is greater than 65. In contrast, when the reliability is less than 65, the reliability is degraded under the climate change conditions when compared with the results from the historical rainfall data.
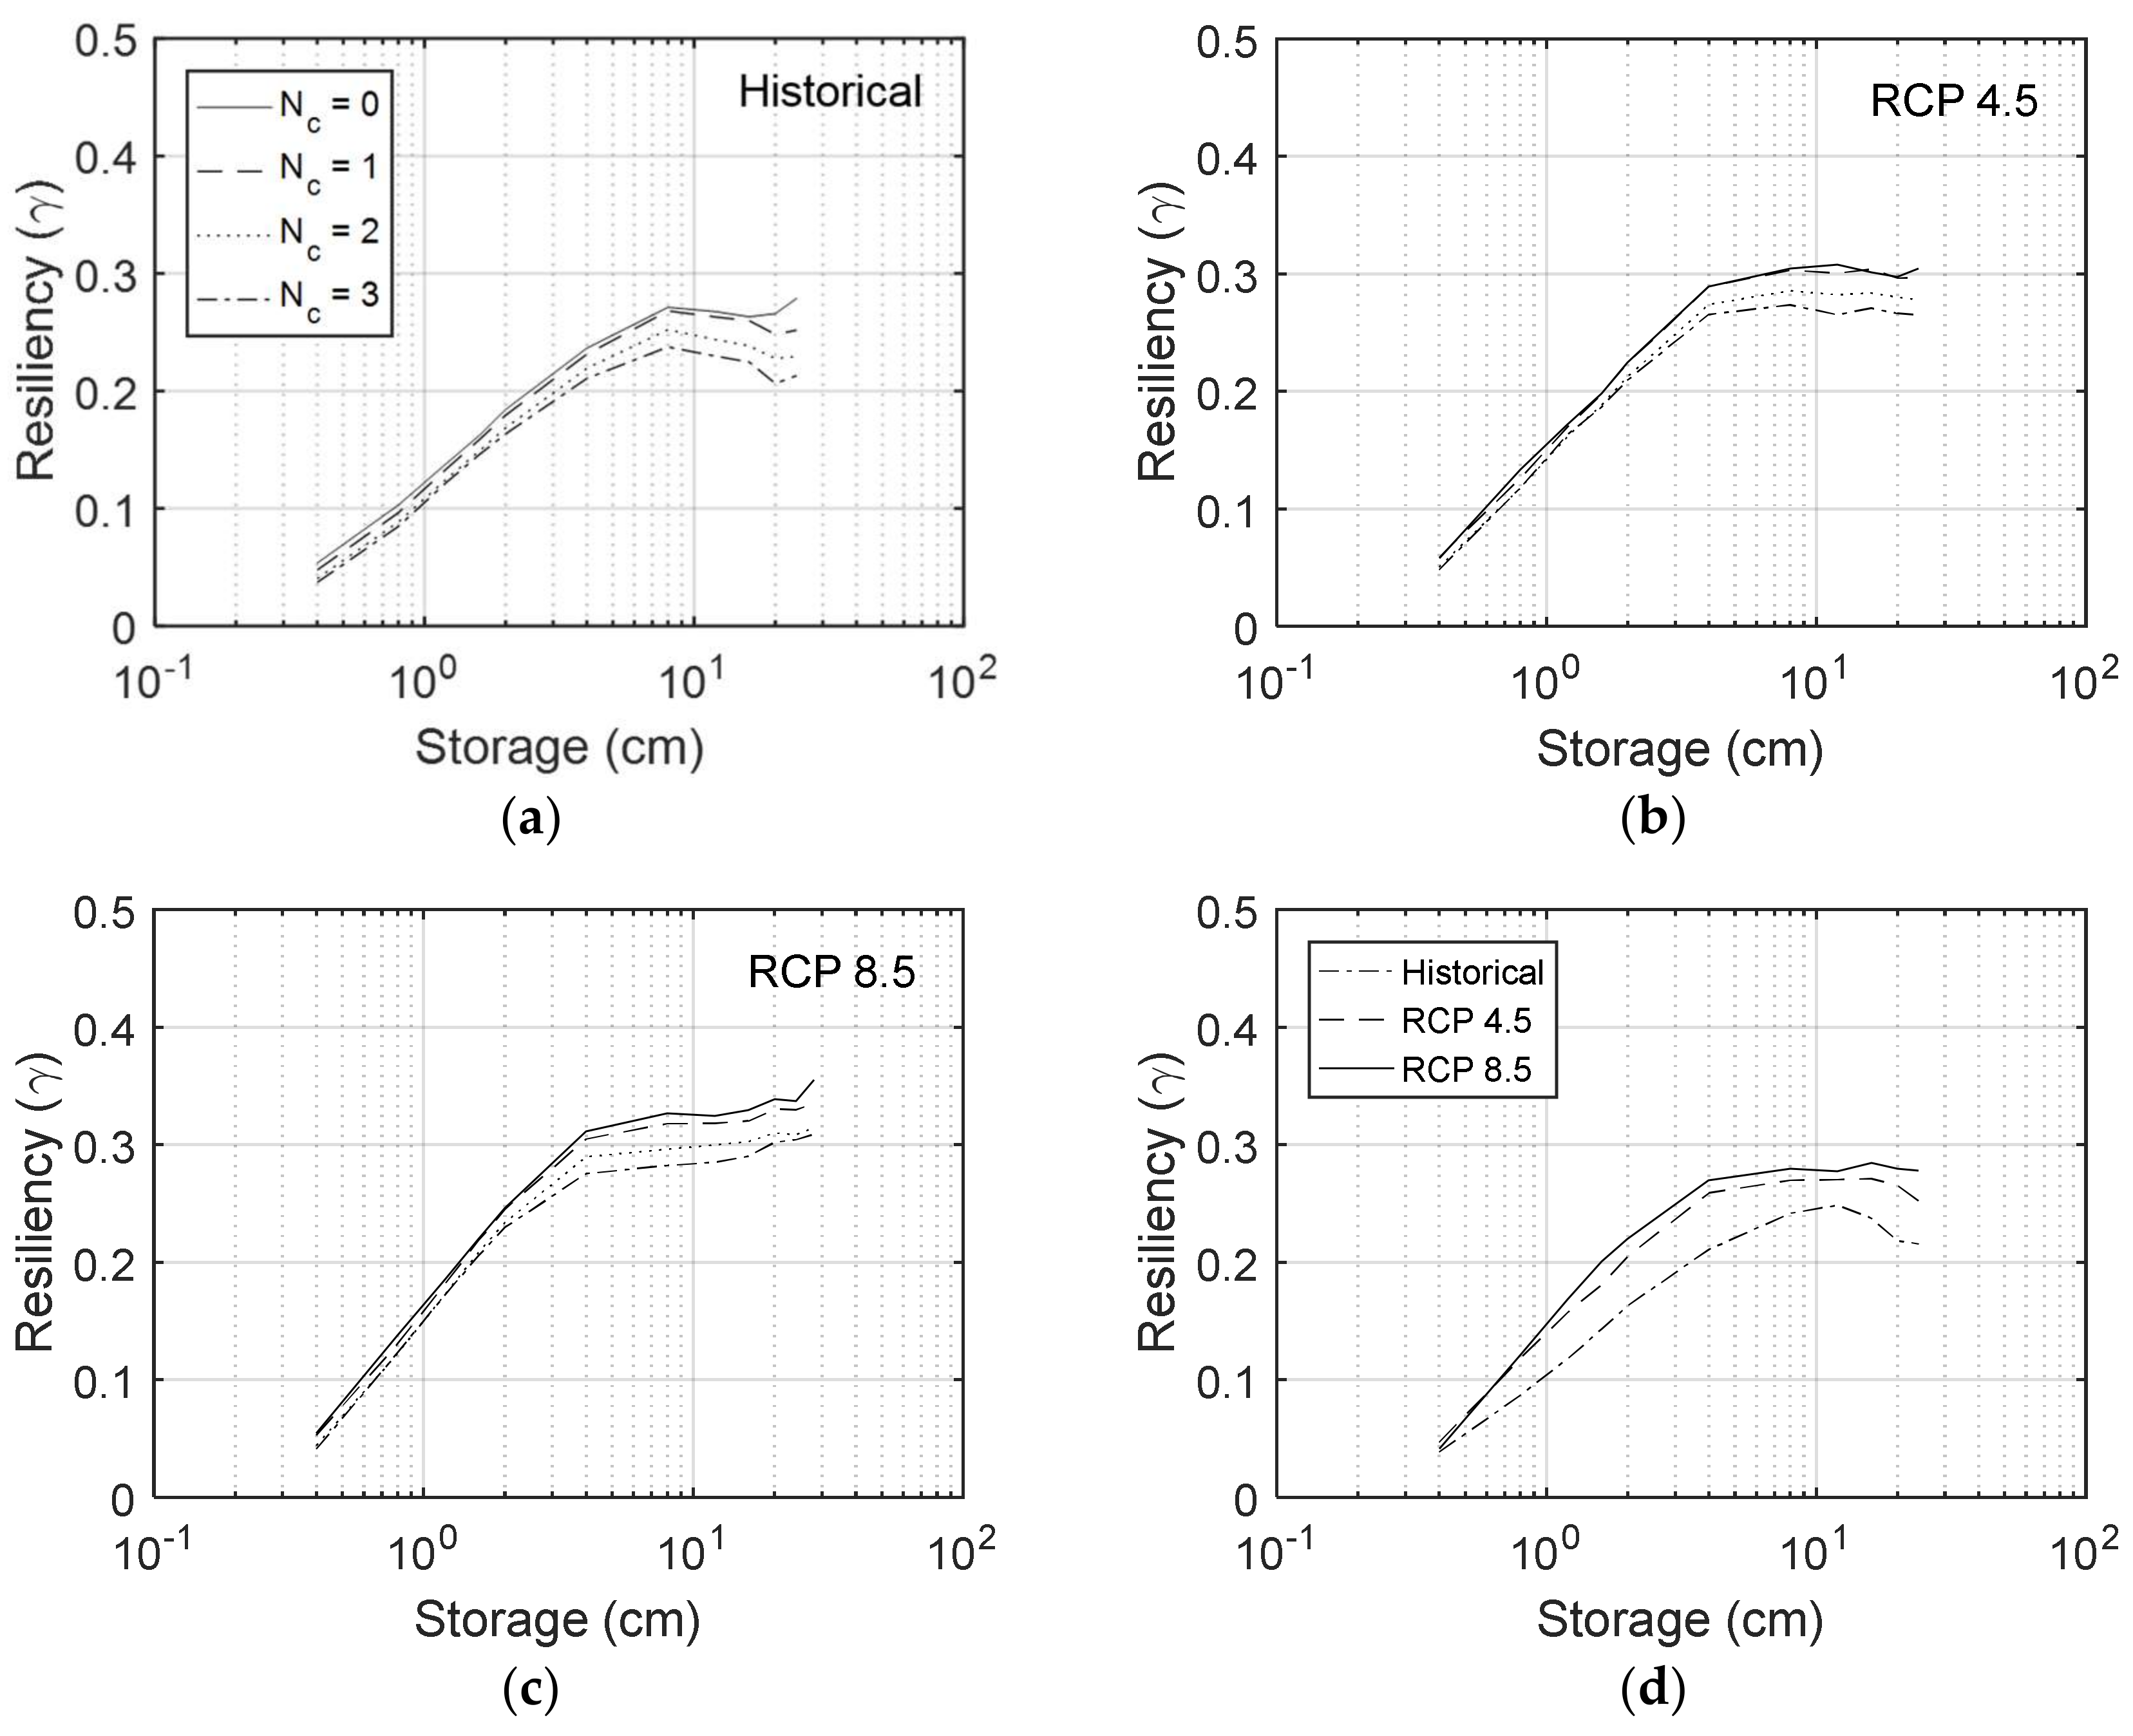
Resiliency shows different behaviors when compared to reliability in a RBSN. Figure 6 shows the resiliency-storage relation for the historical rainfall data in Seoul (Figure 6a) and the RCP 4.5 scenario (Figure 6b and RCP 8.5 scenario Figure 6c). The result with the historical rainfall data shows that the resiliency is degraded as the degree of sharing (or number of connections) increases and this is consistent for the results under future climate conditions (RCP 4.5 and 8.5). These results imply that as users become more involved in sharing, it becomes more difficult for the entire system to recover from failure states. The resiliency is obtained from the inverse of the mean continuous failure period, which is equal to the total failure days divided by the number of switches from failure to success states. It is obvious that the storage size would reduce the number of total failure days, as was shown Figure 5. However, the number of switches from failure to success states abruptly decreases and has its maximum values around the storage size of 10 cm depth. Therefore, the resiliency has its maximum around the storage size of 10 cm. This explains the peak resiliency for some cases, such as the historical rainfall case (Figure 6a) or the RCP 4.5 case as shown in Figure 6b. In contrast, the RCP 8.5 case shows maximum resiliency values with maximum storages.
Despite the negative effect of sharing on the resiliency of a RBSN, the simulation result shows that the resiliency improves under the climate change conditions. Figure 6d compares the resiliency of a RBSN with historical rainfall and climate change conditions when all users join in the sharing and are fully connected (Nc = 3). The result shows that the resiliency under the RCP 8.5 scenario is the greatest among the others and this result is consistent regardless of the storage (or rain barrel) size. The resiliency from the historical rainfall data shows a minimum when compared to the results from the climate change scenarios, such as the RCP 4.5 and RCP 8.5.
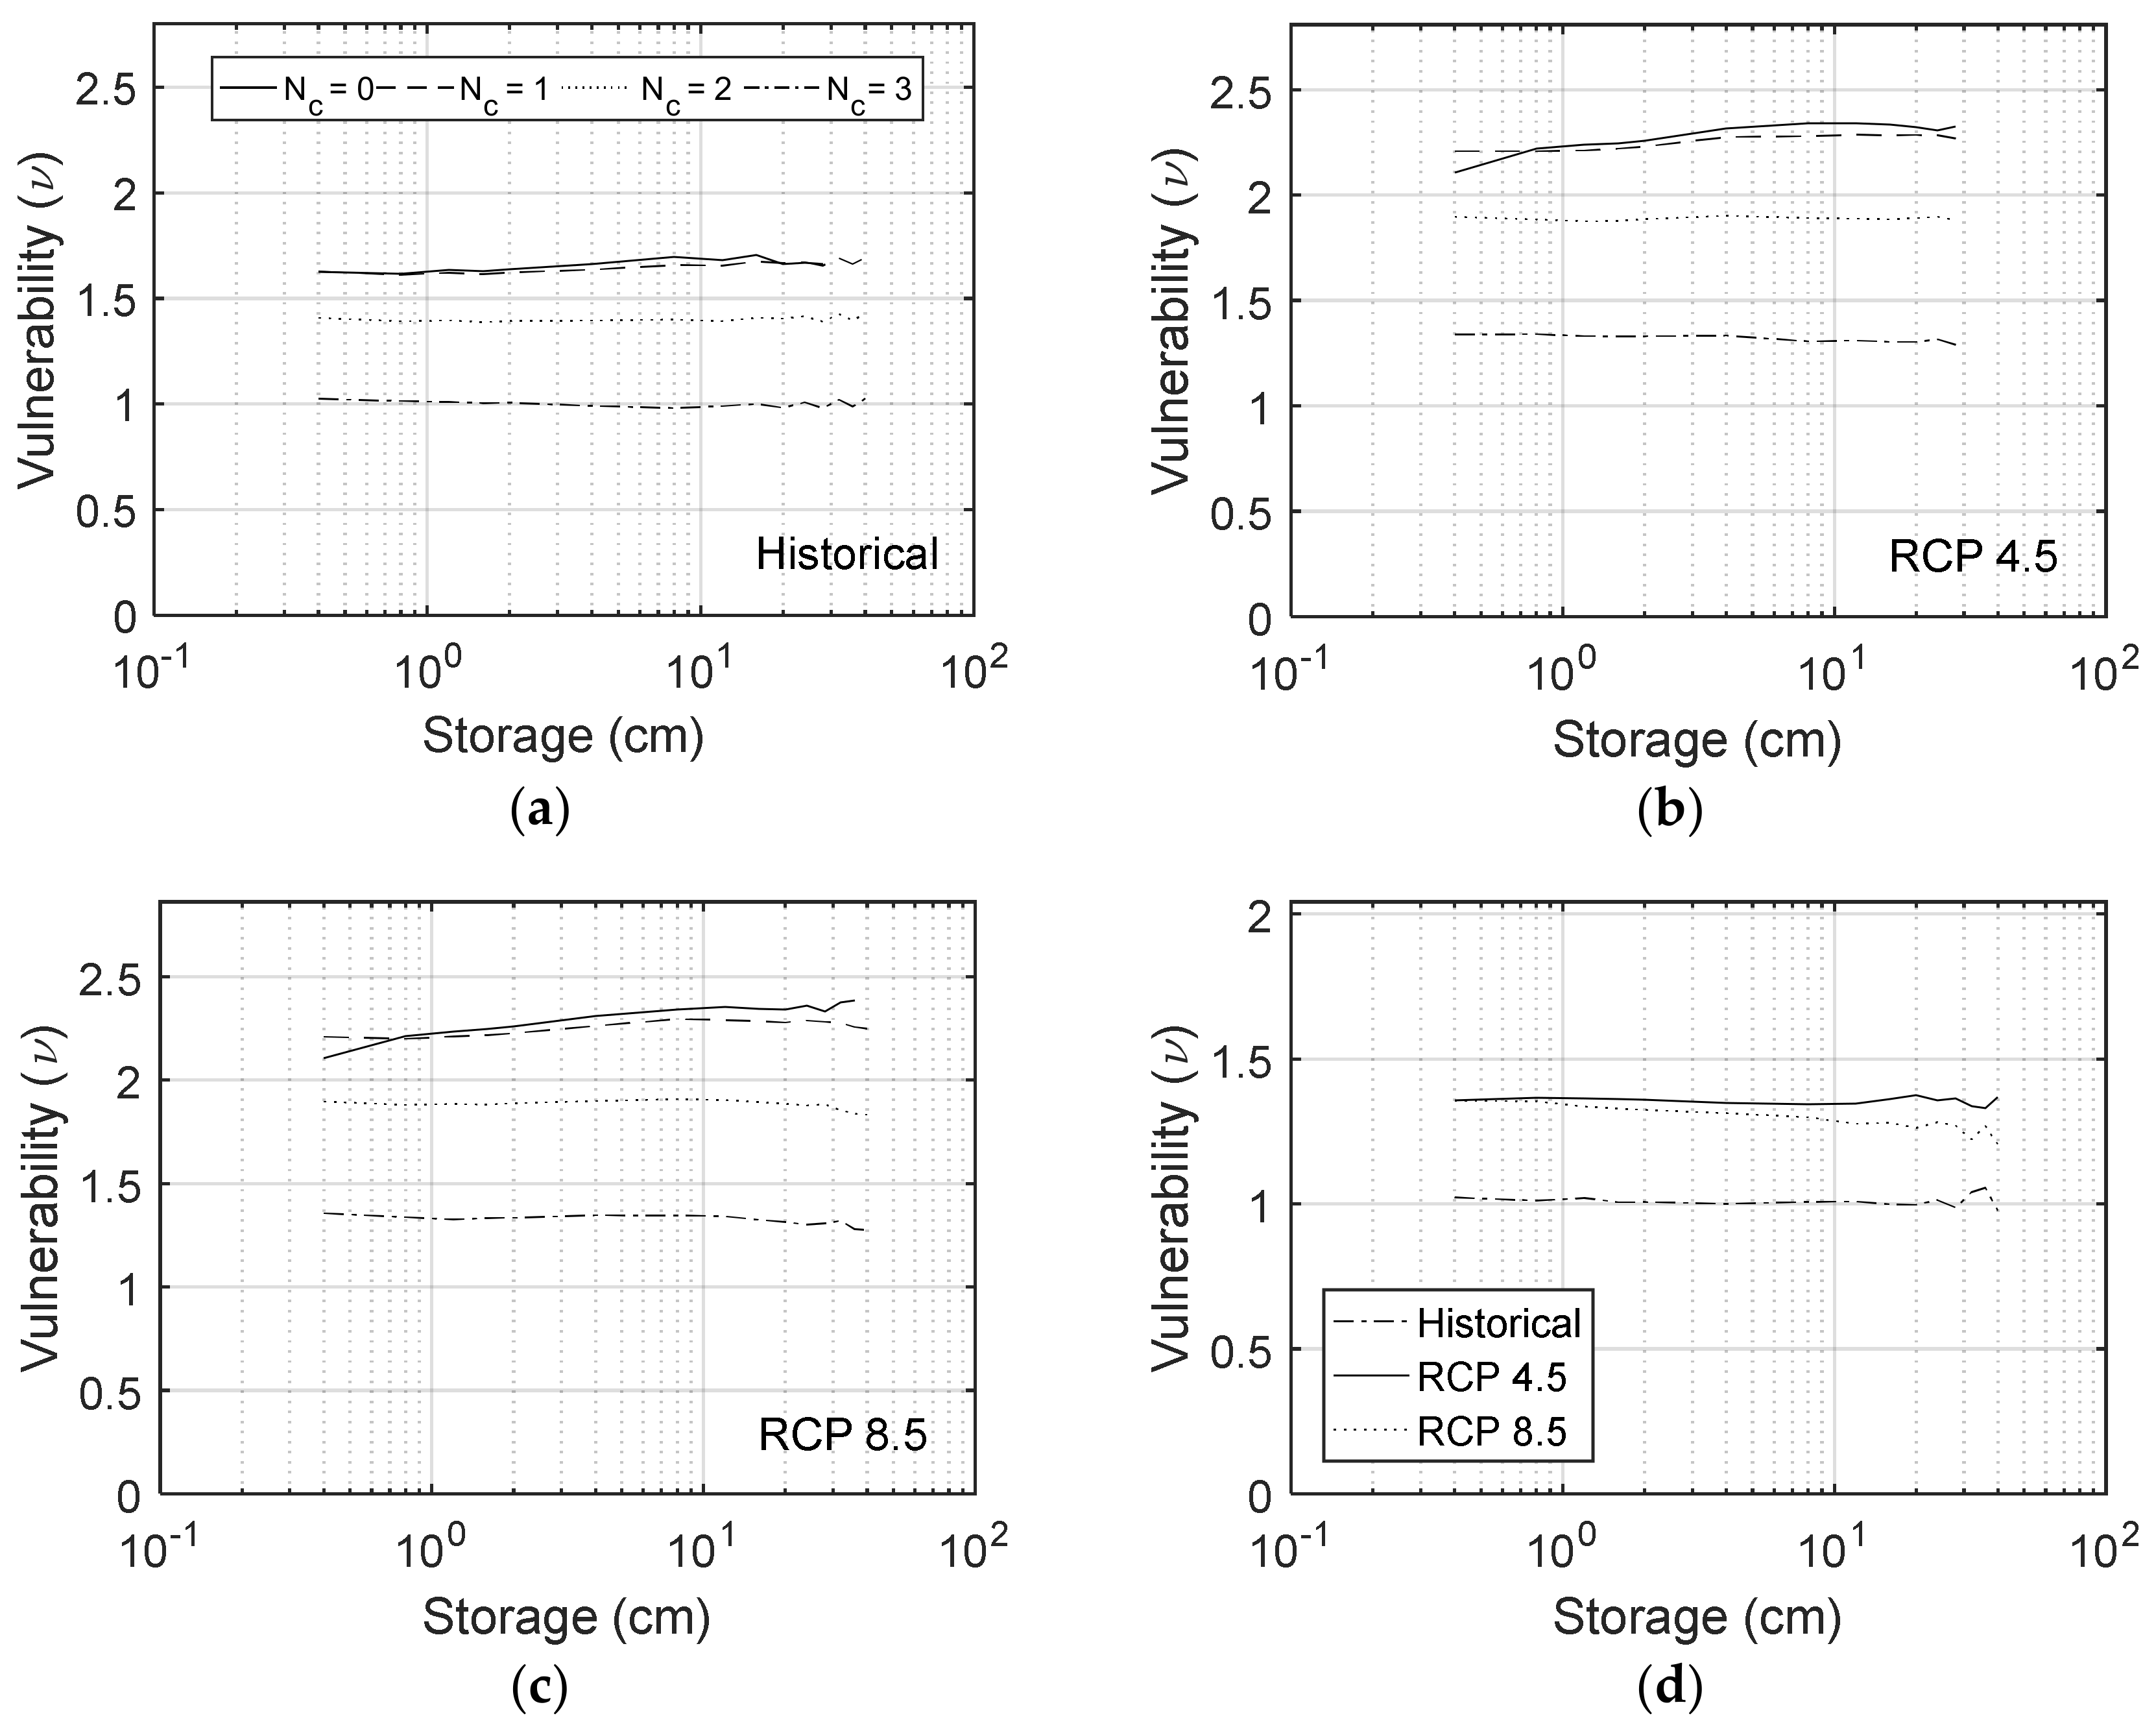
The vulnerability shows a different behavior when compared with reliability and resiliency. Most of all, the vulnerability remains stable for different storage sizes. As shown in Figure 7, the changes in vulnerability are less than 0.5. These results imply an independence of the demand deficit and the number of failure days compared to the storage size. However, vulnerability shows a great difference depending on the degree of sharing (or the number of connection, Nc). As the degree of sharing increases, the vulnerability decreases. This is quite obvious, especially when the users fully share their storage with others (Nc = 3). In this regard, a RBSN contributes to improving vulnerability and this is consistent for all of the conditions, as shown in Figure 7a for the historical rainfall case, Figure 7b for the RCP 4.5, and Figure 7c for the RCP 8.5 scenario. Figure 7d compares the vulnerability of a RBSN with historical rainfall and climate change conditions when all users join the sharing group and are fully connected (Nc = 3). The result shows that the vulnerability of a RSBN is very close for both the RCP 4.5 and RCP 8.5 scenarios, but both cases showed higher vulnerability compared to the results from the historical rainfall. The results imply that the magnitude of failure (supply deficit in this stud) will increase under climate change conditions. However, still, the results clearly indicate the benefit of a RBSN compared to the no-sharing cases.
3.2. Benefit of a RBSN Under RCP Scenarios
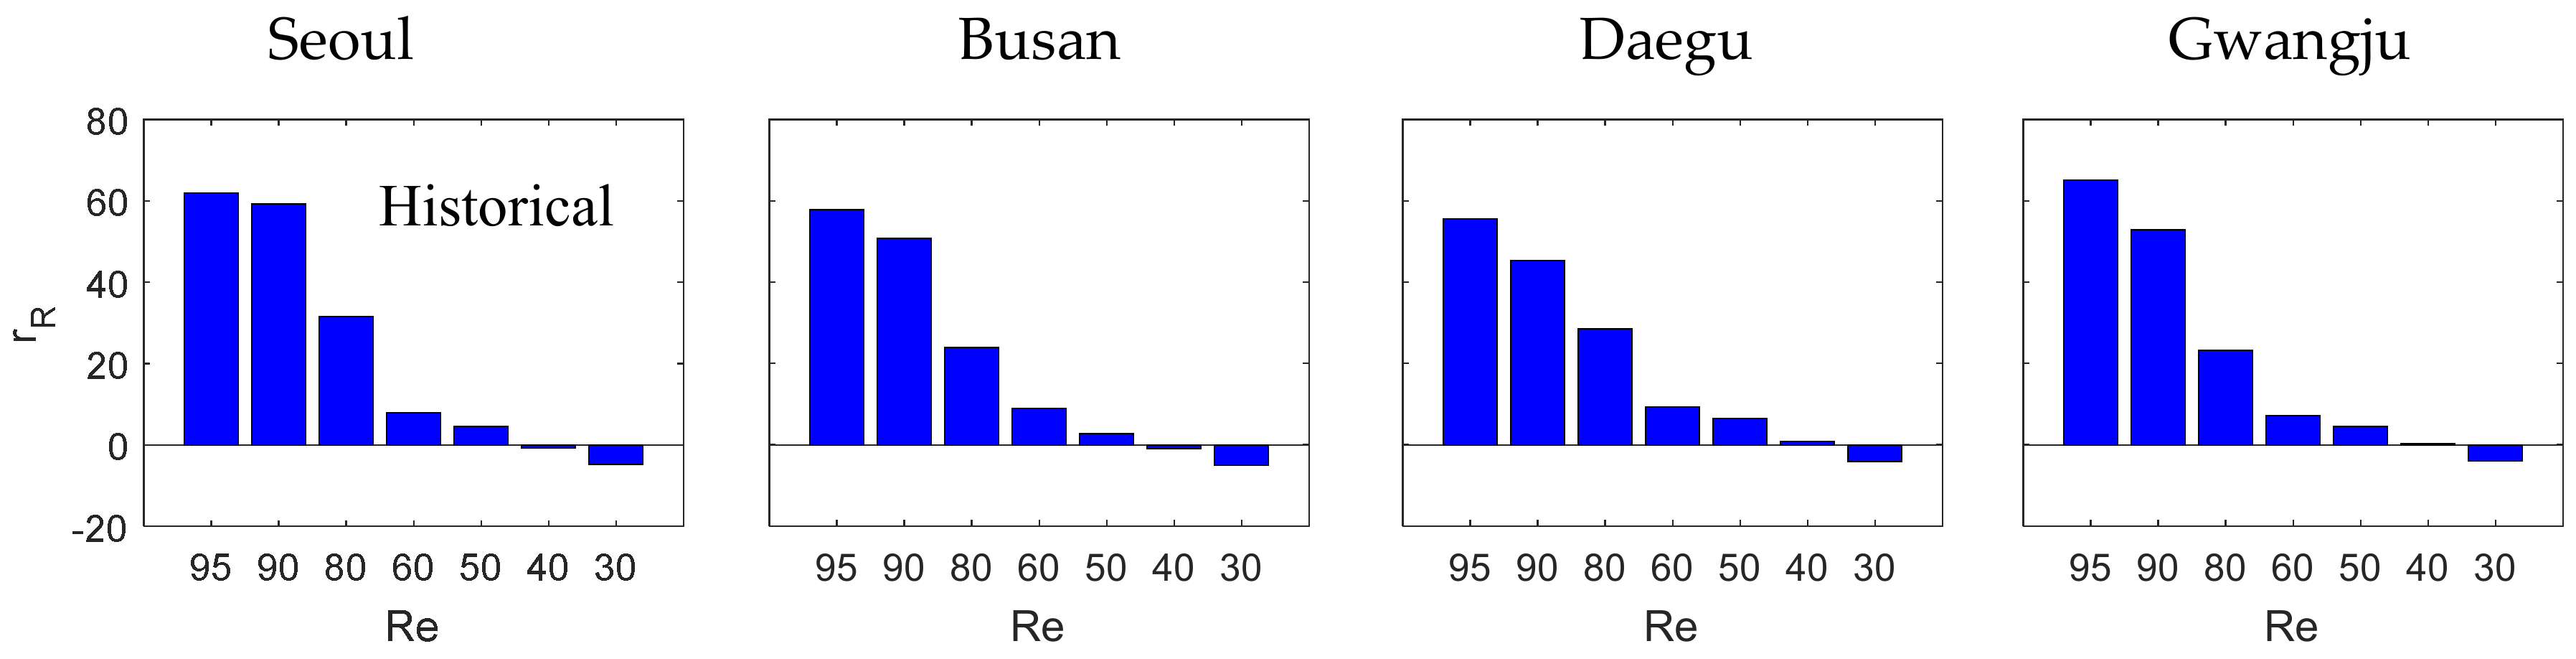
In this section, we focused more on the benefit of a RBSN in terms of the storage size reduction target reliability under climate change compared to the results from the historical rainfall data. As mentioned earlier, given a target reliability, a RBSN can contribute to reducing the storage size by sharing. It suggests that one can reduce the cost of rainwater harvesting with the same performance. In order to evaluate the benefit of a RBSN in terms of storage size reduction, first, the target reliability was set from 30 to 95. Then the storage size required to satisfy the target reliability was obtained using the SRY relation. Finally, the amount of storage size reduction was obtained by comparing the case with the no-sharing (Nc = 0) case and the other case with full sharing (Nc = 3).
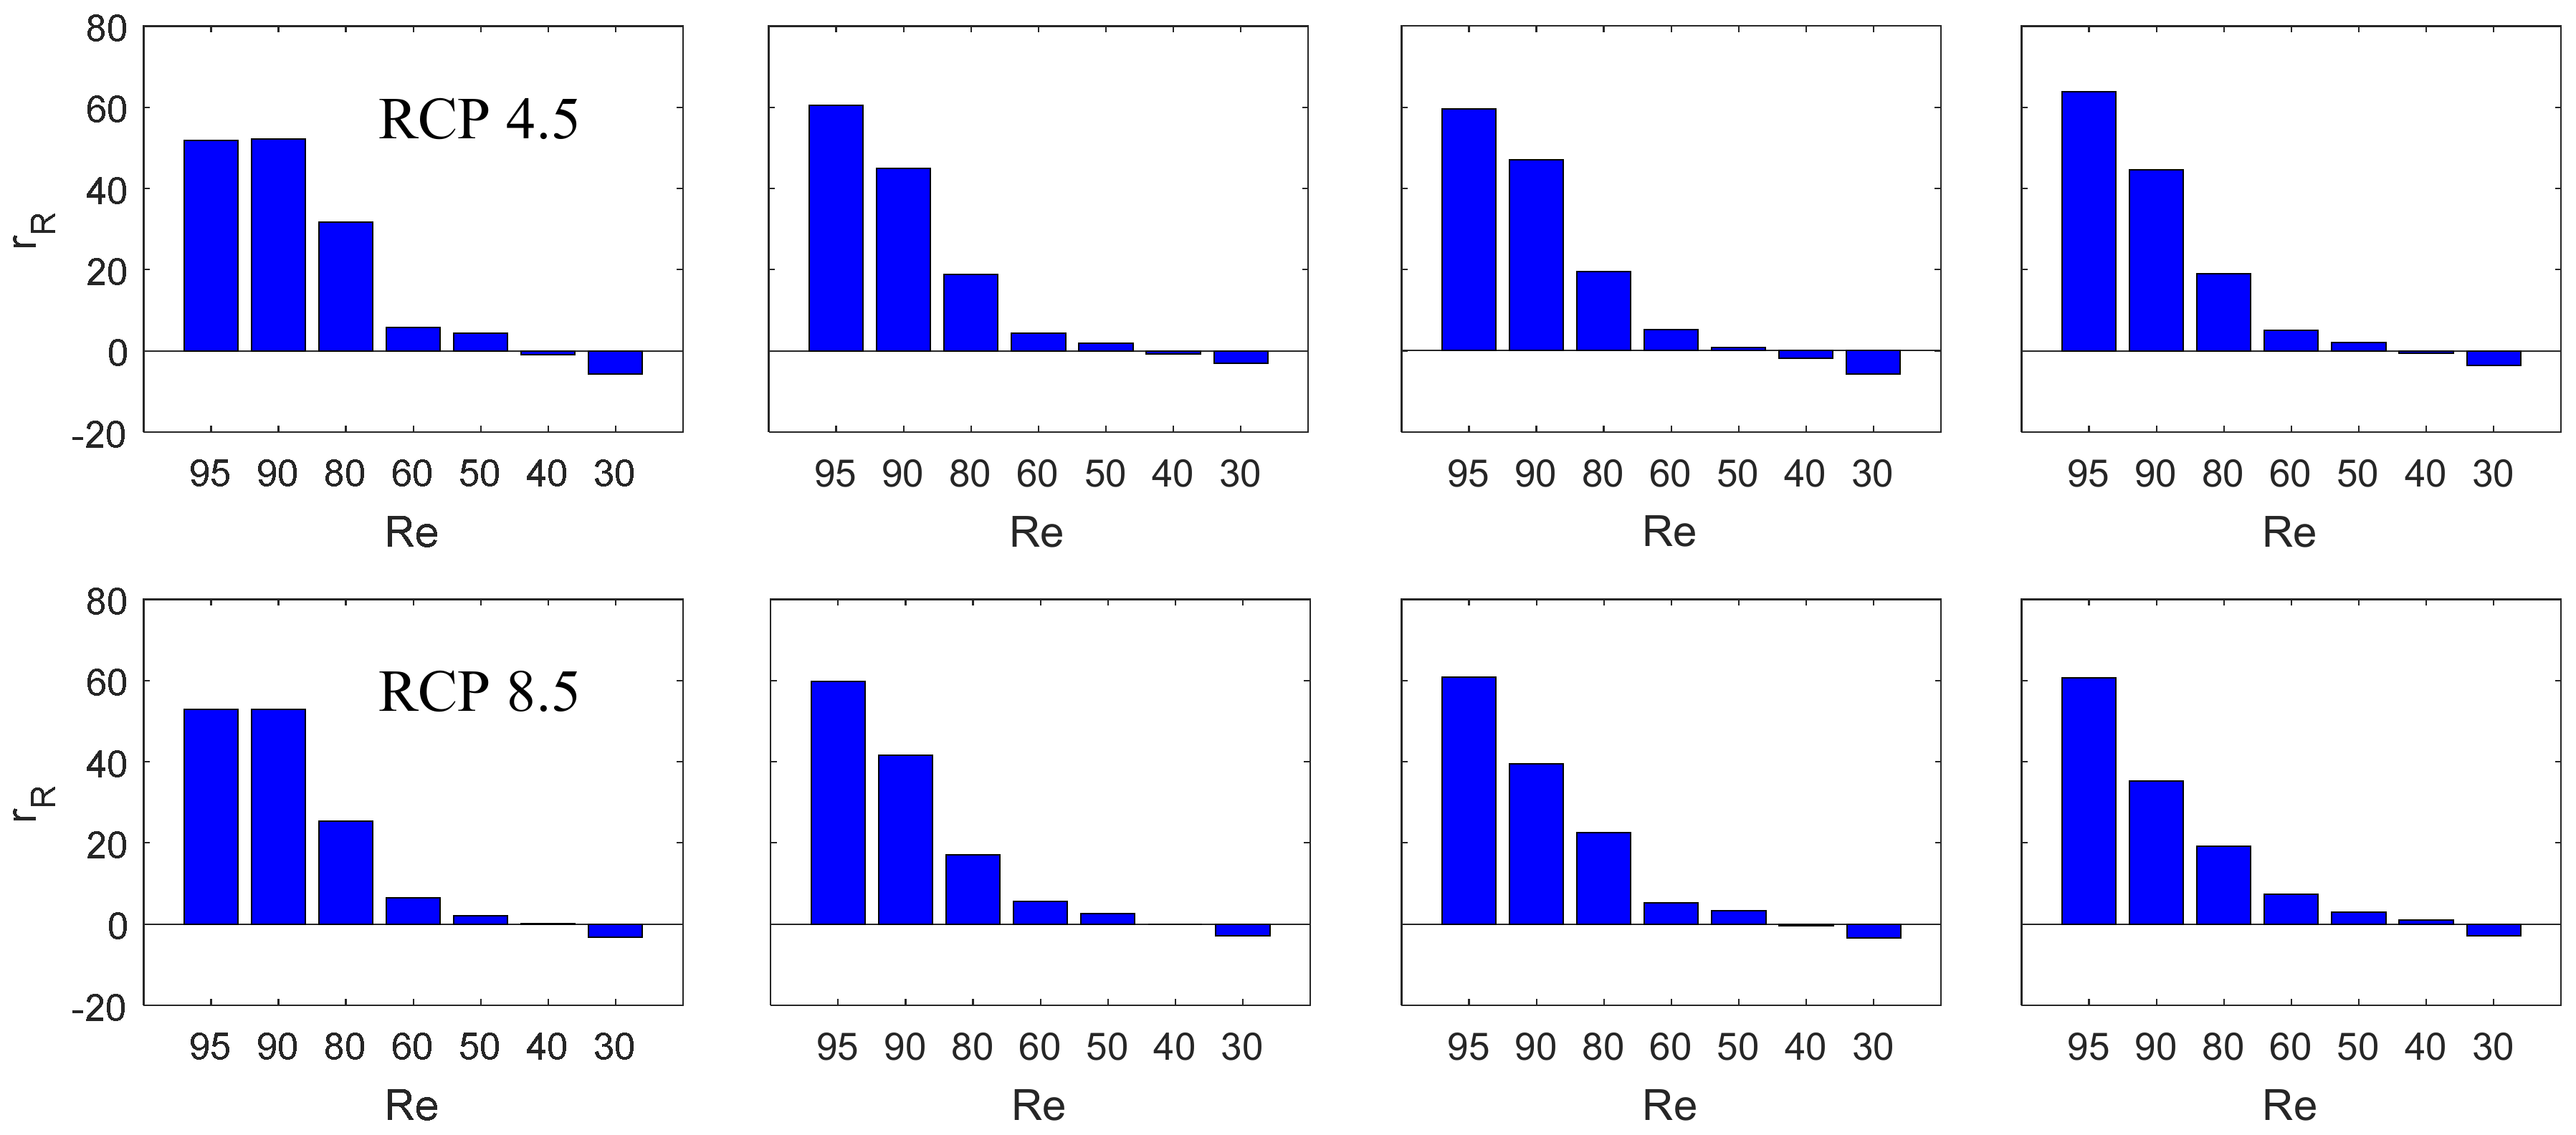
Table 3 lists the storage reduction ratio for the sharing network (Nc = 3) depending on the region, target reliability, and climate change scenario. For example, the result shows that the storage can be reduced by 62% for a target reliability of 95% with a RBSN compared to the no-sharing case under historical rainfall. As mentioned in Section 3.1, the results show that the sharing negatively affects the storage sizes for lower target reliability. However, the result shows that a RBNS contributes to reducing the required storage size for most cases of target reliability, except 30%. The results show that the storage size reduction ratio is dependent on the climate change scenarios and regions. The storage reduction ratio increases as the target reliability increases and this is consistent for all cases, as shown in Table 3 and Figure 8. In Seoul, the result showed that the benefit of a RBSN decreases under climate change. However, Busan and Daegu showed that the benefit increases under the climate change conditions. Gwangju showed little change in the benefit from a RBSN with the RCP 4.5 scenario, but slight a decrease with the RCP 8.5 scenario.
4. Conclusions
The importance of RWHS as an alternative water source is becoming more prominent and getting more attention under climate change. In this study, we proposed a RBSN as an effective and alternative measure that deals with the impact of climate change in the future. We assessed the performance of a RBSN under the climate change conditions based on SRY curves and compared the results from historical rainfall data using three performance criteria. The results showed that the reliability and resiliency of a RBSN will improve but be more vulnerable to climate change when compared to the results from the historical rainfall data. However, even in the climate change condition, the results showed that a RBSN still contributes to reducing vulnerability. The most important benefit from a RBSN is a storage size reduction. Given target reliability, a RBSN can contribute to reduce the storage size by sharing. It means one can reduce the costs of rainwater harvesting with the same performance. The results show that the storage size reduction ratio is dependent on the climate change scenarios and regions. This case study showed that the benefit of a RBSN decreases under climate change in Seoul. However, Busan and Daegu showed that the benefit increases under climate change conditions. Gwangju showed little change in the benefit from a RBSN with the RCP 4.5 scenario but a slight decrease with the RCP 8.5 scenario.
The impacts from climate change are assessed in various ways and dependent on both external components, such as climate change scenarios and internal components such as an adaption strategy. This study demonstrated that RBSNs can be a prominent and alternative adaptation strategy for rainwater harvesting. It contributes to improving the performance of a RWHS. The potential benefit of a RBSN suggests a new community strategy for countries where RWHSs play an important role to address water-related issues, such as the development of alternative on-site water resources today and even in the future.
Acknowledgments
This research was supported by a grant (18AWMP-B079625-05) from the Water Management Research Program sponsored by Ministry of Land, Infrastructure and Transport of Korean government.
Author Contributions
Yongwon Seo conceived and designed the experiment of the study; Youjeong Kwon performed the experiments; Yongwon Seo, Youjeong Kwon and Junshik Hwang analyzed the data and equally contributed to writing the manuscript.
Conflicts of Interest
The authors declare no conflict of interest.
References
- Pacey, A.; Cullis, A. Rainwater Harvesting: The Collection of Rainfall and Runoff in Rural Areas; ITDG Publishing: London, UK, 1986. [Google Scholar]
- Helmreich, B.; Horn, H. Opportunities in rainwater harvesting. Desalination 2009, 248, 118–124. [Google Scholar] [CrossRef]
- Stec, A.; Kordana, S. Analysis of profitability of rainwater harvesting, gray water recycling and drain water heat recovery systems. Resour. Conserv. Recycl. 2015, 105, 84–94. [Google Scholar] [CrossRef]
- Villarreal, E.L.; Dixon, A. Analysis of a rainwater collection system for domestic water supply in ringdansen, Norrkoping, Sweden. Build. Environ. 2005, 40, 1174–1184. [Google Scholar] [CrossRef]
- Campisano, A.; Butler, D.; Ward, S.; Burns, M.J.; Friedler, E.; DeBusk, K.; Fisher-Jeffes, L.N.; Ghisi, E.; Rahman, A.; Furumai, H.; et al. Urban rainwater harvesting systems: Research, implementation and future perspectives. Water Res. 2017, 115, 195–209. [Google Scholar] [CrossRef] [PubMed]
- Mahmood, A.; Hossain, F. Feasibility of managed domestic rainwater harvesting in South Asian rural areas using remote sensing. Resour. Conserv. Recycl. 2017, 125, 157–168. [Google Scholar] [CrossRef]
- Ward, S.; Memon, F.A.; Butler, D. Performance of a large building rainwater harvesting system. Water Res. 2012, 46, 5127–5134. [Google Scholar] [CrossRef] [PubMed]
- Jenkins, D.; Pearson, F.; Moore, E.; Sun, J.K.; Valentine, R. Feasibility of Rainwater Collection System in California; Contribution No. 173 California Water Resources Center, University of California: Oakland, CA, USA, 1978. [Google Scholar]
- Pelak, N.; Porporato, A. Sizing a rainwater harvesting cistern by minimizing costs. J. Hydrol. 2016, 541, 1340–1347. [Google Scholar] [CrossRef]
- Huang, C.-L.; Hsu, N.-S.; Wei, C.-C.; Luo, W.-J. Optimal spatial design of capacity and quantity of rainwater harvesting systems for urban flood mitigation. Water 2015, 7, 5173–5202. [Google Scholar] [CrossRef]
- Hanson, L.; Vogel, R.; Kirshen, P.; Shanahan, P.; Starrett, S. Generalized Storage-Reliability-Yield Equations Rainwater Harvesting Systems. In Proceedings of the World Environmental & Water Resources Congress, Kansas City, MO, USA, 17–21 May 2009; American Society of Civil Engineers: Kansas City, MO, USA, 2009; pp. 1–10. [Google Scholar]
- Sanches Fernandes, L.F.; Terêncio, D.P.S.; Pacheco, F.A.L. Rainwater harvesting systems for low demanding applications. Sci. Total Environ. 2015, 529, 91–100. [Google Scholar] [CrossRef] [PubMed]
- Terêncio, D.P.S.; Sanches Fernandes, L.F.; Cortes, R.M.V.; Moura, J.P.; Pacheco, F.A.L. Rainwater harvesting in catchments for agro-forestry uses: A study focused on the balance between sustainability values and storage capacity. Sci. Total Environ. 2018, 613–614, 1079–1092. [Google Scholar]
- Ndiritu, J.; Moodley, Y.; Guliwe, M. Generalized storage-yield-reliability relationships for analysing shopping centre rainwater harvesting systems. Water 2017, 9, 771. [Google Scholar] [CrossRef]
- Hajani, E.; Rahman, A. Reliability and cost analysis of a rainwater harvesting system in peri-urban regions of greater Sydney, Australia. Water 2014, 6, 945–960. [Google Scholar] [CrossRef]
- Lopes, V.A.R.; Marques, G.F.; Dornelles, F.; Medellin-Azuara, J. Performance of rainwater harvesting systems under scenarios of non-potable water demand and roof area typologies using a stochastic approach. J. Clean. Prod. 2017, 148, 304–313. [Google Scholar] [CrossRef]
- Vuong, N.M.; Ichikawa, Y.; Ishidaira, H. Performance assessment of rainwater harvesting considering rainfall variations in Asian tropical monsoon climates. Hydrol. Res. Lett. 2016, 10, 27–33. [Google Scholar] [CrossRef]
- Burns, M.J.; Fletcher, T.D.; Duncan, H.P.; Hatt, B.E.; Ladson, A.R.; Walsh, C.J. The performance of rainwater tanks for stormwater retention and water supply at the household scale: An empirical study. Hydrol. Process. 2015, 29, 152–160. [Google Scholar] [CrossRef]
- Asadieh, B.; Krakauer, N.Y. Impacts of Changes in Precipitation Amount and Distribution on Water Resources Studied Using a Model Rainwater Harvesting System. J. Am. Water Resour. Assoc. 2016, 52, 1450–1471. [Google Scholar] [CrossRef]
- Jafarzadeh, A.; Bilondi, M.P.; Afshar, A.A.; Yaghoobzadeh, M. Reliability estimation of rainwater catchment system using future GCM output data (case study: Birjand city). Eur. Water 2017, 59, 169–175. [Google Scholar]
- Lebel, S.; Fleskens, L.; Forster, P.M.; Jackson, L.S.; Lorenz, S. Evaluation of in situ rainwater harvesting as an adaptation strategy to climate change for maize production in rainfed Africa. Water Resour. Manag. 2015, 29, 4803–4816. [Google Scholar] [CrossRef]
- Haque, M.M.; Rahman, A.; Samali, B. Evaluation of climate change impacts on rainwater harvesting. J. Clean. Prod. 2016, 137, 60–69. [Google Scholar] [CrossRef]
- Seo, Y.; Choi, N.J.; Park, D. Effect of connecting rain barrels on the storage size reduction. Hydrol. Process. 2012, 26, 3538–3551. [Google Scholar] [CrossRef]
- Seo, Y.; Ahn, J.; Kim, Y.O. The impact of climate change on the benefit of a rain barrel sharing network. Resour. Conserv. Recyl. 2013, 74, 66–74. [Google Scholar] [CrossRef]
- IPCC. Climate Change 2014: Synthesis Report. Contribution of Working Groups i, ii and iii to the Fifth Assessment Report of the Intergovernmental Panel on Climate Change; IPCC: Geneva, Switzerland, 2014; p. 151. [Google Scholar]
- Seo, Y.; Park, S.Y.; Kim, Y.O. Potential benefits from sharing rainwater storages depending on characteristics in demand. Water 2015, 7, 1013–1029. [Google Scholar] [CrossRef]
- Noh, S.J.; Chung, E.S.; Seo, Y. Performance of a rain barrel sharing network under climate change. Water 2015, 7, 3466–3485. [Google Scholar] [CrossRef]
- Kim, M.-K.; Han, M.-S.; Jang, D.-H.; Baek, S.-G.; Lee, W.-S.; Kim, Y.-H.; Kim, S. Production technique of observation grid data of 1km resolution. J. Clim. Res. 2012, 7, 55–68. [Google Scholar]
- Kim, M.-K.; Lee, D.-H.; Kim, A.J. Production and validation of daily grid data with 1 km resolution in South Korea. J. Clim. Res. 2013, 8, 13–25. [Google Scholar]
- Hashimoto, T.; Stedinger, J.R.; Loucks, D.P. Reliability, resiliency, and vulnerability criteria for water resource system performance evaluation. Water Resour. Res. 1982, 18, 14–20. [Google Scholar] [CrossRef]
Figure 1.
Study areas in South Korea: Seoul, Daegu, Gwangju, and Busan.

Figure 2.
Monthly average historical rainfall (1971–2000), future projection with RCP 4.5 and 8.5 (2071–2100) for (a) Seoul; (b) Daegu; (c) Busan; and (d) Gwangju in Korea.
Figure 2.
Monthly average historical rainfall (1971–2000), future projection with RCP 4.5 and 8.5 (2071–2100) for (a) Seoul; (b) Daegu; (c) Busan; and (d) Gwangju in Korea.

Figure 3.
Storage-Reliability-Yield (SRY) relation of Seoul from historical rainfall data (1971–2000) and a constant yield ratio.
Figure 3.
Storage-Reliability-Yield (SRY) relation of Seoul from historical rainfall data (1971–2000) and a constant yield ratio.
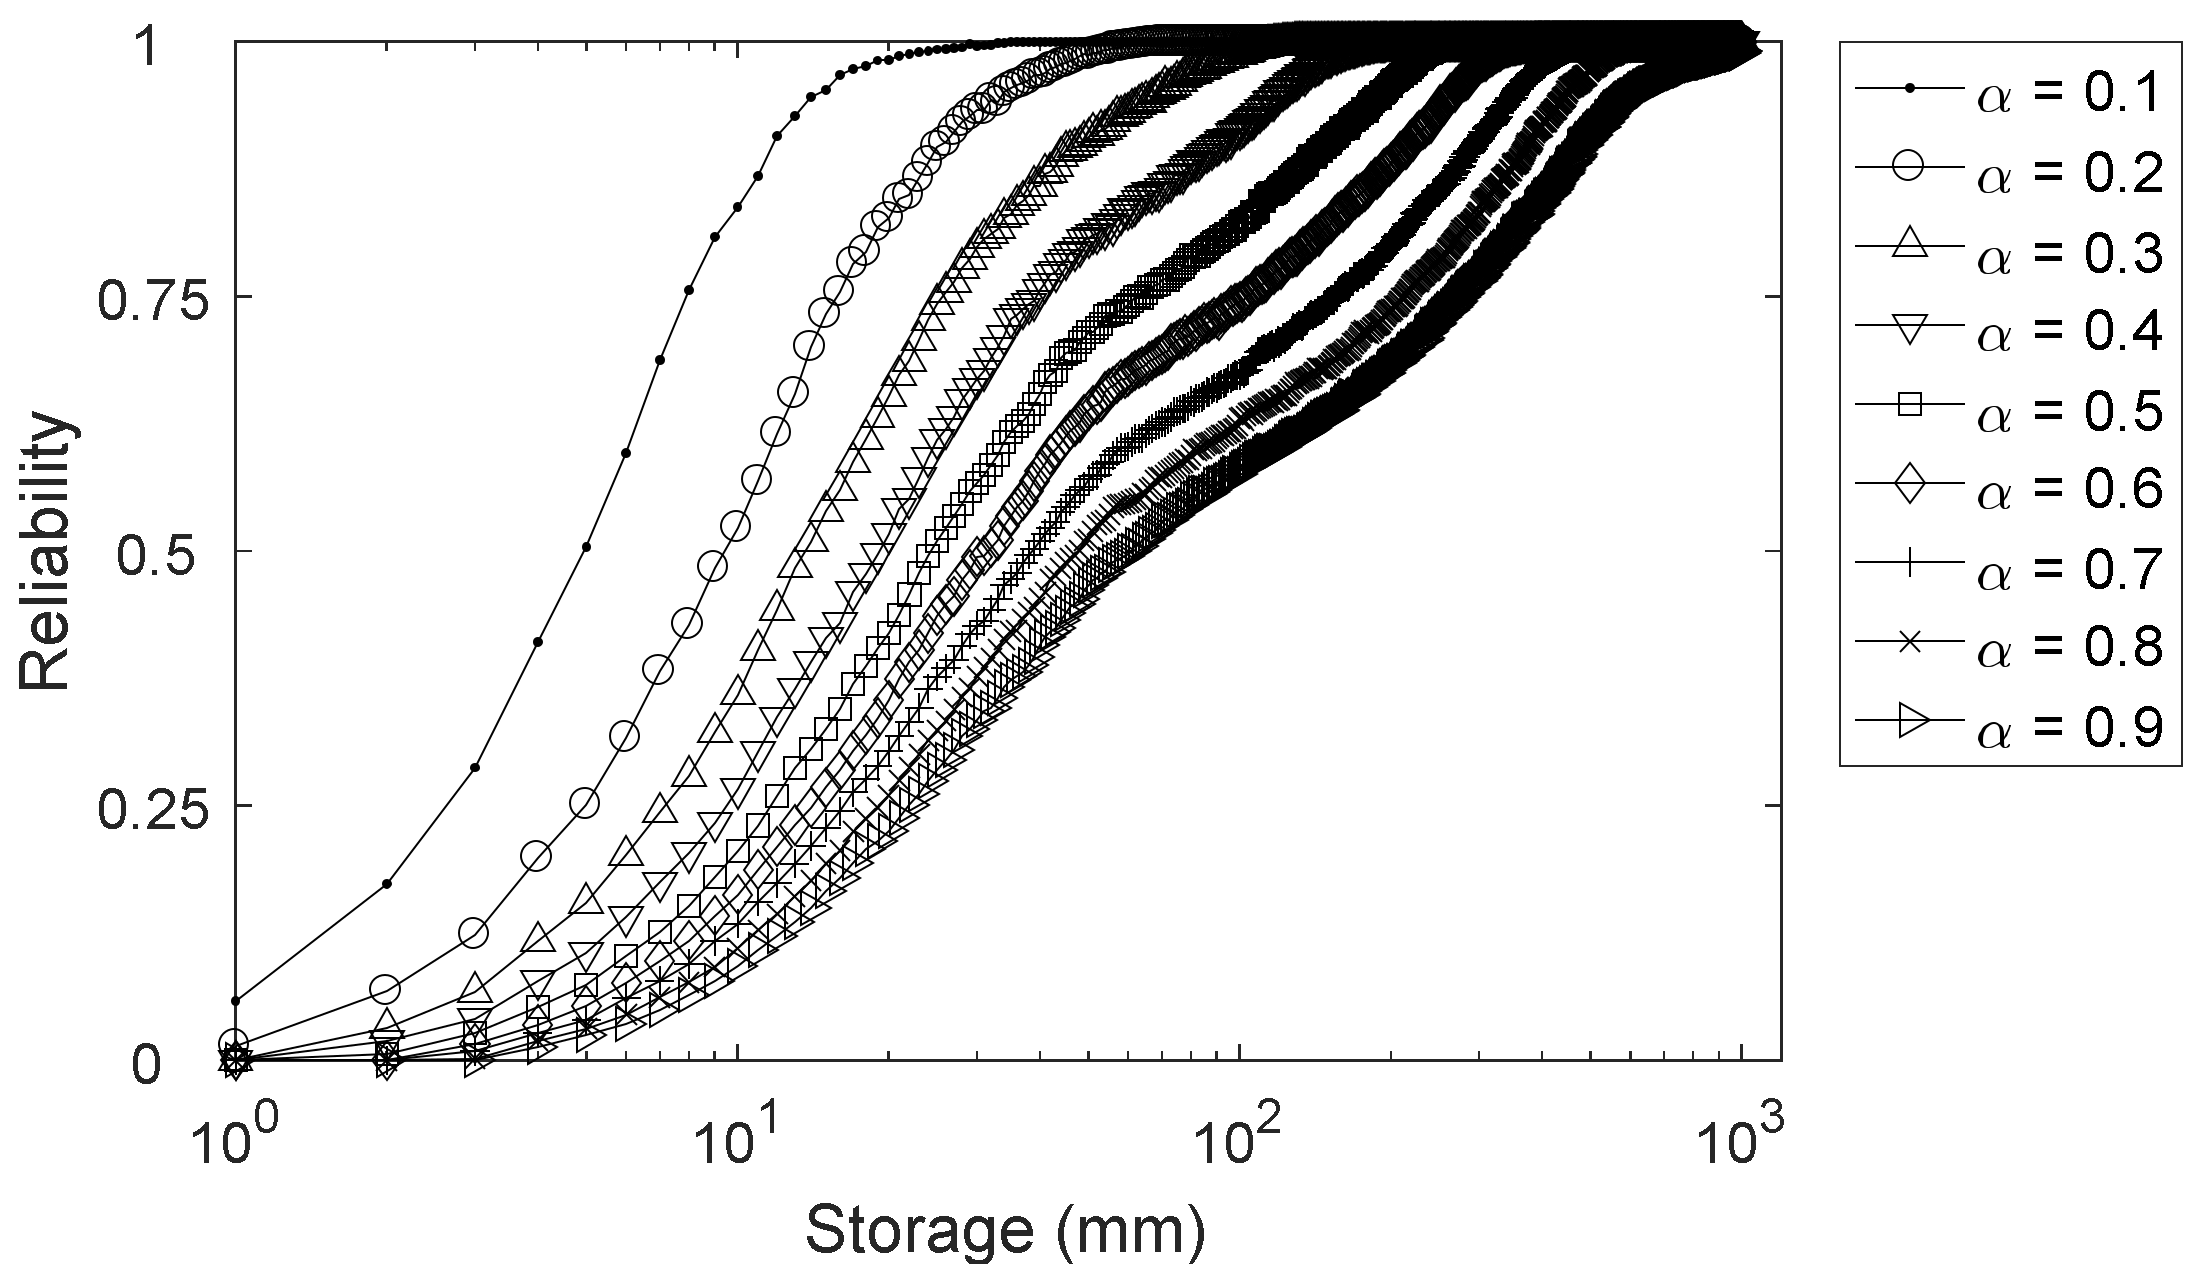
Figure 4.
Schematic of a conceptual community (RSBN) that consists of four users with different storage sizes (Sr) and demand (X); Ci represents a combination of demand depending on the users who join sharing their rainwater storage (rain barrel) with others.
Figure 4.
Schematic of a conceptual community (RSBN) that consists of four users with different storage sizes (Sr) and demand (X); Ci represents a combination of demand depending on the users who join sharing their rainwater storage (rain barrel) with others.

Figure 5.
Reliability-storage relation for historical rainfall data in Seoul; (a) for historical rainfall data (1971–2000); (b) for RCP 4.5 scenario; (c) RCP 8.5 scenario; and (d) comparison of reliability-storage relation for a fully connected RBSN from historical rainfall data, RCP 4.5 and 8.5 scenarios.

Figure 6.
Resiliency-storage relation for historical rainfall data in Seoul; (a) for historical rainfall data (1971–2000); (b) for RCP 4.5 scenario; (c) RCP 8.5 scenario; and (d) comparison of resiliency-storage relation for a fully connected RBSN from historical rainfall data, RCP 4.5 and 8.5 scenarios.

Figure 7.
Vulnerability-storage relation for historical rainfall data in Seoul; (a) for historical rainfall data (1971–2000); (b) for RCP 4.5 scenario; (c) RCP 8.5 scenario; and (d) comparison of vulnerability-storage relation for a fully connected RBSN from historical rainfall data, RCP 4.5 and 8.5 scenarios.

Figure 8.
Storage reduction ratio for a fully-linked (Nc = 3) RBSN depending on each region, target reliability, and climate change scenarios (RCP 4.5 and RCP 8.5).
Figure 8.
Storage reduction ratio for a fully-linked (Nc = 3) RBSN depending on each region, target reliability, and climate change scenarios (RCP 4.5 and RCP 8.5).


Table 1.
Description of the Representative Concentration Pathways (RCP) scenarios [25].
Table 1.
Description of the Representative Concentration Pathways (RCP) scenarios [25].
| Scenarios | Radiative Forcing (W/m2) | CO2-eq Concentration (ppm) | Description |
|---|---|---|---|
| RCP 2.6 | 3.0 | 480–530 | A strict reduction scenario that aims to keep global warming likely below 2 °C above pre-industrial temperatures. |
| RCP 4.5 | 4.5 | 580–720 | A reduction scenario in which a significant GHG mitigation policy is implemented. |
| RCP 6.0 | 6.0 | 720–1000 | A normal reduction scenario in which an ordinary GHG mitigation policy is implemented. |
| RCP 8.5 | 8.5 | >1000 | Very high GHG emissions. Scenarios without additional efforts to constrain emissions. |
Table 2.
Possible combination of demands (C1, C2 …) in a RBSN.
| Nc | Scenarios | Possible Combinations |
|---|---|---|
| 1 | 11 | C1 = X1 + X2; C2 = X3; C3 = X4 |
| 12 | C1 = X1 + X3; C2 = X2; C3 = X4 | |
| 13 | C1 = X1 + X4; C2 = X2; C3 = X3 | |
| 14 | C1 = X1 + X3; C2 = X1; C3 = X4 | |
| 15 | C1 = X1 + X4; C2 = X1; C3 = X3 | |
| 16 | C1 = X1 + X4; C2 = X1; C3 = X2 | |
| 2 | 21 | C1 = X1 + X2 + X3; C2 = X4 |
| 22 | C1 = X1 + X2 + X4; C2 = X3 | |
| 23 | C1 = X1 + X3 + X4; C2 = X2 | |
| 24 | C1 = X2 + X3 + X4; C2 = X1 | |
| 25 | C1 = X1 + X2; C2 = X3 + X4 | |
| 26 | C1 = X1 + X4; C2 = X2 + X3 | |
| 27 | C1 = X1 + X3; C2 = X2 + X4 | |
| 3 | 31 | C1 = X1 + X2 + X3 + X4 |
Table 3.
Storage reduction ratio for sharing network (Nc = 3) depending on the region, target reliability, and climate change scenario.
Table 3.
Storage reduction ratio for sharing network (Nc = 3) depending on the region, target reliability, and climate change scenario.
| Region | Rainfall | Target Reliability (%) | ||||||
|---|---|---|---|---|---|---|---|---|
| 95 | 90 | 80 | 60 | 50 | 40 | 30 | ||
| Seoul | Historical | 62.0 | 59.3 | 31.5 | 7.9 | 4.5 | −0.7 | −4.8 |
| RCP 4.5 | 51.8 | 52.1 | 31.8 | 5.8 | 4.4 | −0.9 | −5.8 | |
| RCP 8.5 | 52.9 | 52.9 | 25.3 | 6.5 | 2.1 | −0.1 | −3.2 | |
| Busan | Historical | 57.8 | 50.8 | 23.8 | 8.9 | 2.7 | −0.9 | −4.9 |
| RCP 4.5 | 60.5 | 45.0 | 18.8 | 4.4 | 1.8 | −0.8 | −3.0 | |
| RCP 8.5 | 59.7 | 41.5 | 17.0 | 5.6 | 2.6 | −0.1 | −2.9 | |
| Daegu | Historical | 55.6 | 45.3 | 28.5 | 9.4 | 6.5 | 0.85 | −4.1 |
| RCP 4.5 | 59.6 | 47.0 | 19.5 | 5.2 | 0.7 | −1.8 | −5.7 | |
| RCP 8.5 | 60.8 | 39.4 | 22.5 | 5.2 | 3.2 | −0.4 | −3.4 | |
| Gwangju | Historical | 65.0 | 52.9 | 23.2 | 7.2 | 4.5 | 0.4 | −4.0 |
| RCP 4.5 | 63.3 | 45.6 | 18.9 | 5.2 | 2.9 | −0.1 | −2.7 | |
| RCP 8.5 | 60.6 | 35.2 | 19.1 | 7.4 | 2.9 | 1.0 | −2.9 | |
© 2018 by the authors. Licensee MDPI, Basel, Switzerland. This article is an open access article distributed under the terms and conditions of the Creative Commons Attribution (CC BY) license (http://creativecommons.org/licenses/by/4.0/).
Share and Cite
MDPI and ACS Style
Kwon, Y.; Hwang, J.; Seo, Y. Performance of a RBSN under the RCP Scenarios: A Case Study in South Korea. Sustainability 2018, 10, 1242. https://doi.org/10.3390/su10041242
AMA Style
Kwon Y, Hwang J, Seo Y. Performance of a RBSN under the RCP Scenarios: A Case Study in South Korea. Sustainability. 2018; 10(4):1242. https://doi.org/10.3390/su10041242
Chicago/Turabian StyleKwon, Youjeong, Junshik Hwang, and Yongwon Seo. 2018. "Performance of a RBSN under the RCP Scenarios: A Case Study in South Korea" Sustainability 10, no. 4: 1242. https://doi.org/10.3390/su10041242
Note that from the first issue of 2016, this journal uses article numbers instead of page numbers. See further details here.