Article

Investigating Stakeholder Perceptions of Fish Decline: Making Sense of Multiple Mental Models

by
Jeremy Horowitz
1,*,
Robert L. Pressey
1,
Georgina G. Gurney
1,
Amelia S. Wenger
1,2 and
Kristina A. Pahang
3
1
Australian Research Council Centre of Excellence for Coral Reef Studies, James Cook University, Townsville, QLD 4811, Australia
2
School of Earth and Environmental Science, University of Queensland, St. Lucia, QLD 4072, Australia
3
College of Science and Engineering, James Cook University, Townsville, QLD 4811, Australia
*
Author to whom correspondence should be addressed.
Sustainability 2018, 10(4), 1222; https://doi.org/10.3390/su10041222
Submission received: 22 January 2018 / Revised: 10 April 2018 / Accepted: 13 April 2018 / Published: 17 April 2018
(This article belongs to the Section Social Ecology and Sustainability)

Abstract

:
Stakeholders have different educational backgrounds, personal experiences and priorities that contribute to different perceptions about what causes natural resource decline and how to sustain a resource. Yet stakeholders have a common interest, which is to keep the resource of interest from declining. Effective co-management requires sharing of perceptions pertaining to the sustainability of a resource and making decisions that benefit all stakeholders. Therefore, this study used modified causal networks, referred to here as mental models, to elicit and compare stakeholder perceptions about fish decline in the Danajon Bank, Philippines. Perceptions were elicited from three types of stakeholders, each composed of two or three elicitation groups: fishers, local government and environmental organizations. Data were also elicited through semi-structured discussions to investigate why perceptions differed and how stakeholders communicated with one another. Hierarchical clustering revealed two broad clusters of similar perceptions about drivers of fish decline: one being environmental groups and the second being local government and fisher groups. Stakeholder communication patterns revealed that communication was weakest between environmental groups and fishers. A likely contributing factor for the lack of shared perceptions was that knowledge-sharing was constrained by the small number of environmental personnel available to exchange information effectively with the much larger number of fishers and local government personnel. To better co-manage fish populations in Danajon Bank, we suggest modifications to the governance framework to improve knowledge-sharing and social and ecological outcomes.

1. Introduction

Time, money and personnel are often limited in the conservation of natural resources, hindering the ability of decision-makers to apply the best actions in all the places needed [1,2]. This means decision-makers must allocate resources towards interventions that will most effectively mitigate the main contributors to (hereafter “drivers” of) resource decline to make the greatest possible difference to conservation outcomes [3]. However, perceptions of what are “the most threatening drivers” and “the right interventions” can differ among types of stakeholders because each has a different version of reality based on different values and norms, which shape distinct perceptions about resource decline [4,5,6,7].
Stakeholders are individuals or groups who are affected by, or influence, management decisions about a natural resource [8]. It is important that diverse stakeholders share their perceptions and knowledge about a natural resource of interest to foster a mutual understanding of their roles and actions, build a common knowledge base and improve capacity to deal with the issues surrounding resource management [8,9,10,11,12,13], such as promoting collective action [14,15] and adaptive co-management [16]. However, if some stakeholders are not included in the decision-making process or are not considered when decisions are made, sustained differences in perceptions can lead to interventions with negative social outcomes for some stakeholders who might resist compliance with intervention protocols, reducing conservation outcomes [11,17,18].
Stakeholders’ interactions are influenced by the governance framework, which we define as the structure and processes that dictate how stakeholders behave, make decisions and share power [19,20]. Given that governance systems are often made up of heterogeneous stakeholders, it is important that there are opportunities for communication and interaction among these stakeholders to share different types of knowledge to better understand resource change [8]. Therefore, understanding if and why perceptions are not shared, and how stakeholders communicate with others, can assist in determining where modifications to the governance framework are needed to better motivate interactions and share knowledge to facilitate adaptive co-management of a declining resource [5,6,21,22,23].
When eliciting perceptions about resource decline, the aim is to obtain an accurate representation of how a person perceives the workings of a social-ecological system [24]. However, much of the literature on understanding stakeholder perceptions about resource decline has used methods, including interviews and surveys [17,21,22,25] and questionnaires [7,26,27], which alone do not allow stakeholders the freedom to depict their complete mental models of the functioning of social-ecological systems. For example, Brewer (2012) used traditional interview techniques among stakeholders to elicit perceptions regarding what they thought reduced, fish stocks in the Solomon Islands and how they could be increased. One of his findings was that drivers of decline did not correspond to proposed interventions that mitigated decline [17]. A method that allows stakeholders to think in terms of the dynamic causality of drivers in the presence of interventions is through direct elicitation, which involves stakeholders building causal diagrams representing their mental models about factors pertaining to resource decline [28]. This type of mental model reflects causal chain frameworks, causal networks or causal loop analyses [29].
To investigate how and why perceptions of the drivers of resource decline and appropriate interventions differ between stakeholder types, we elicited information from diverse stakeholders with an interest in fish populations in the Danajon Bank Double Barrier Reef, Philippines. Two types of information were elicited. First, a modified causal network framework was used to build representative mental models about perceptions regarding: (1) the main drivers of fish decline; (2) subsequent causal effects of those drivers; and (3) interventions that can mitigate drivers. Second, semi-structured discussions provided data to determine possible causes for differences in perceptions and how stakeholders share information regarding fisheries resources. This study demonstrates how conceptual models and semi-structured discussions can be used together to address two questions: (1) how and why do perceptions of resource decline differ among stakeholder types; and (2) how does information exchange between stakeholder types relate to differences and similarities in perceptions of resource decline? Addressing these questions can suggest improvements to the way stakeholders share information and, therefore, could contribute to improving stakeholders’ ability to manage fish populations in the Danajon Bank and perhaps more widely.

2. Materials and Methods

2.1. Study Site

The Danajon Bank Double Barrier Reef is located off northern Bohol Island, Philippines (Figure 1). This reef system covers 272 km2 and is contained within seventeen municipalities (each consisting of one local government) nested within four provinces [30]. Ten municipalities in the Danajon Bank are within the province of Bohol Island, which is one of the poorest provinces in the country with approximately 47% of families below the Philippine Government’s poverty threshold level as of 2006 [31]. The population density is approximately 815 people per hectare and is increasing [31]. People living in the Danajon Bank depend on declining natural resources for most of their livelihoods [32]. Approximately 50% of the population is engaged in fishing [33], and about 70% of the population generates income and livelihood from fishing-related services [34]. Common fishing gear include net and line, seining, dynamite, cyanide, crab fishing gear, fish aggregation using light and longlines and trawls [33].

2.2. Governance Framework

Decision-making powers in regard to natural resource use and management were decentralized from the national government to the local government upon enactment of the Local Government Code of 1991 [35]. This code states that power pertaining to the formulation and implementation of policies shall be allocated among the different local government units [36], which prompted local governments and other local-level stakeholders to co-manage marine resources [37,38]. Since then, local governments have adopted regulations from The Philippine Fisheries Code of 1998 [39] and ordinances customized to respond to local issues [37].
Local-level key stakeholders with a role in fisheries management in the Danajon Bank include local government personnel (Municipal Agriculture Officers, Sangguniang Bayan members, who are responsible for passing local ordinances in a municipality and the municipal mayor), fishers and environmental organizations (non-government and for-profit organizations).
Municipal Agriculture Officers have the largest role in fisheries management because they are the front line of basic service delivery [40]. They enforce laws, coordinate with environmental groups to conduct surveys of the marine environment and recommend and advise the mayor on matters pertaining to the protection of natural resources [40]. Proposed new legislation is presented to the municipal mayor, who is an elected official and the chief executive of the municipal government. The mayor’s role in fisheries management is to pass approved legislation to the Sangguniang Bayan [41]. The Sangguniang Bayan are composed of the municipal vice-mayor and elected representatives. The role of the Sangguniang Bayan, as the legislative body of the municipality, is to enact ordinances, approve resolutions and appropriate funds for the municipality [42] (Figure 2A).
Fishers’ roles in fisheries management are to comply with laws and harvest fish sustainably. They also have knowledge about local fish populations, which is useful to the local government regarding development of legislation to mitigate main drivers of fish decline [43]. It can be difficult for fishers living in remote areas to communicate with other stakeholder types; however, the head of a People’s Organization can be contacted to communicate with local government and environmental personnel. People’s Organizations are independent groups that cluster based on shared interests such as the sustainability of fish populations and facilitate communication between fishers and the local government. The head is voted by the organization to convey the organization’s needs and concerns to other stakeholder groups (Figure 2A).
Environmental groups in the Danajon Bank consist of non-governmental organizations and for-profit organizations that create networks between stakeholders, conduct surveys and provide information about the status of the marine environment and assist in the establishment of community-run marine reserves [33,44]. A member of environmental groups usually consists of one or more Community Organizers that visit fishing villages to discuss issues or solutions pertaining to sustainability of marine resources. To contact fishers within a specific barangay (a barangay is a subdivision within a municipality or town), Community Organizers have the option of meeting with the Barangay Captain, who is voted into power by members of a barangay, resolves local-level disputes, is responsible for enforcing local-level laws and facilitates general communication between fishers and the local government and environmental groups (Figure 2A).
Although the governance framework has promoted decentralised management of resources, many local governments are not well equipped in this regard because they lack the required financial and technical resources [33,45]. This has left many municipalities without mooring buoys to define marine reserve boundaries, patrol boats, fuel to conduct regular patrols, guardhouses, or properly trained enforcement personnel [46]. Furthermore, weak coordination between stakeholders has resulted in the inability of municipalities to enforce municipal laws, which has reduced the effectiveness of interventions [47,48]. Decentralization has also created challenges for management because municipal boundaries define jurisdictional boundaries, which do not correspond to resource boundaries that can exist between, beyond, or within multiple municipalities, thereby restricting effective ecosystem-based conservation [47,49]. Besides boundaries that define municipal jurisdictions, there is also a boundary that separates the power of local governments to manage local fishers (shoreline to 15 km offshore) and provincial governments to manage commercial fishers (>15 km from shoreline). This divide has caused challenges for enforcement because the line between jurisdictions is not always clear. Furthermore, the continued decline of fish populations has resulted in commercial fishers encroaching on municipal waters [32], which has reduced the overall catch of municipal fishers [32,50]. This situation has forced both groups of fishers to resort to more efficient and sometimes illegal fishing methods [33].

2.3. Participant Selection

Key stakeholders with an interest in managing fish populations in the Danajon Bank were identified for this study based on the criteria defined in the Cross-Cutting Tool Stakeholder Analysis prepared by the World Wildlife Fund [51]. Stakeholders were chosen based on the following criteria: (1) those who have an interest in the specific study site; (2) those who are most dependent on the resource of concern; (3) those who have legal jurisdiction and are tasked with managing the resource within the study site; and (4) those who have the most knowledge and are most capable of dealing with the resource. Therefore, perception data were elicited from the following stakeholder types: (1) fishers, who are affected by management decisions, have an interest in the study site, are dependent on the resource of concern and have the most local knowledge regarding fish populations in the study site; (2) local government personnel, including Municipal Agriculture Officers and enforcement personnel, who have an interest in the study site, are tasked legally with managing the resource in the study site and have the most knowledge about laws and regulations pertaining to conservation of fish populations in the study site; and (3) environmental groups, which have an interest in the study site, have the most scientific knowledge pertaining to fish conservation in the study site, assist with the implementation of conservation interventions and educate other stakeholders regarding environmental issues. Municipal mayors and Sangguniang Bayan members were not available for this study due to scheduling conflicts; however, Municipal Agriculture Office and enforcement personnel have a larger role in identifying drivers of fish decline and choosing interventions to mitigate drivers in the study site (see Section 2.2).
Participants from each stakeholder type were selected at separate locations along the northern coast of Bohol Island to obtain an even representation of perceptions. Data were elicited from three fisher and three local government groups, one from each of three municipalities (Talibon, Tubigon and Ubay). Data were gathered from only two environmental groups because these are the only ones that work specifically in the Danajon Bank. The environmental groups were the Zoological Society of London (ZSL) and the Ecosystems Improved for Sustainable Fisheries (ECOFISH), which is a Philippine-based project. Collectively, these eight groups consisted of 50 participants. A research assistant was present to facilitate in the local language.
The number of participants per data collection activity ranged from 1–10. Although the range in number was large, this variation did not skew the data because there were enough participants relative to the size of the stakeholder type to accurately represent stakeholder perceptions. For example, there was only one currently active member from ECOFISH when data were gathered. Our respondent from ECOFISH had been the project site coordinator since ECOFISH was launched in 2012, so her responses represented the perceptions of the group.
All subjects gave their informed consent before they participated in this study. The study was conducted in accordance with the National Health and Medical Research Council Act of 1992 [52], and the protocol was approved by the human ethics committee of James Cook University (H6600) on 27 June 2016.

2.4. Elicitation of Perception Data

2.4.1. Creating Mental Models

We directly elicited perceptions by having our participants create visual representations of their understanding of the causes and effects of fish decline. This approach deviates slightly from creating traditional causal networks. Instead of response nodes that identify the societal responses to mitigate drivers of decline, our participants identified the interventions that are in place to mitigate specific main drivers (see Niemeijer and Groot, 2006, Figure 3, for a simplified causal network example). Other studies that have used direct elicitation methods to visually represent stakeholders’ mental models are Ozesmi and Ozesmi [53] and Dray et al. [54].
To create mental models for fish populations in the Danajon Bank, participants were first asked whether they perceived fish populations to be increasing, decreasing, or remaining constant over time. Regardless of the extent of experience (short-term or lifetime), all groups perceived fish populations to be decreasing. Therefore, the aim was to elicit perceived main drivers of fish decline, causal effects of main drivers that link drivers to fish decline and interventions that could mitigate those drivers. Mental models were built in three steps (Figure 3, Figure 4 and Figure 5). First, distal main drivers of fish decline were written along the top of a large piece of paper. Distal drivers were defined as situations or events having an ultimate but indirect effect on fish populations, via more direct pressures. Next, distal drivers were connected to fish decline via subsequent nodes (being either proximate main drivers or causal effects of drivers). Proximate drivers were defined as human activities that place direct pressure on marine ecosystems. Causal effects were defined as specific consequences of drivers that have direct effects on fish populations. Lastly, interventions were identified and linked to the distal or proximate main drivers that each specifically mitigates.
Each distal and proximate main driver and conservation intervention was weighted based on its presence and impact from 1–10 (1 = lowest weight, 10 = highest weight). Presence referred to how rare or extensive a driver or intervention was (1 = very rare, 10 = very common). Impact referred to how important a driver was in causing fish decline, or how much an intervention mitigated a main driver of fish decline (1 = negligible impact, 10 = large impact). To elicit these data, each participant was provided with ten index cards with numbers ranging from 1–10. When it was time to weight the presence or impact of a main driver or intervention, each participant would raise a card to indicate his or her individual perception. When perceptions varied within a group, discussions among the participants led to a group decision on weights and the consensus weight represented the group perception. The index card method of eliciting perceptions, involving all participants presenting their weights at the same time, reduced the potential for dominant participants to force individual opinions on others. This method was also enjoyable for participants, compared to traditional interview techniques and so reduced the likelihood of respondent fatigue and inaccurate data [55].

2.4.2. Stakeholder Data

In addition to investigating how perceptions differ among stakeholders, understanding why perceptions differ is also important to formulate strategies to improve communication and prioritize decisions [6]. Therefore, based on results from the group-produced mental models and questions asked in previous studies that aimed to understand stakeholders’ perceptions and interactions [6,7,15,17,21], a total of 25 questions (see Appendix A) were asked, which were divided into 6 sections:
  • Sources of knowledge about drivers of fish decline and interventions that mitigate drivers,
  • How drivers and interventions affect stakeholders,
  • Involvement in the decision-making process,
  • Role in conserving fish,
  • Communication between stakeholder types,
  • Perceived priorities in management.
These data were used to detect differences between stakeholder types that could relate to differences in perceptions and to create a framework to understand patterns of stakeholder communication.

2.5. Data Analysis

The eight mental models (three from fisher groups, three from local government groups and two from environmental groups) were first digitized by recreating each in ClickCharts Diagram & Flowchart Software by NCH Software. The eight mental models were then consolidated into three, one each for fishers, local government and environmental groups. For each of the three, the information from individual groups was retained by identifying the frequency with which main drivers, causal effect nodes and links between nodes were identified. Perceived interventions were also compared within and between the three stakeholder types in the same ways.
To explore overall similarities between perceptions regarding their grading of the presence and impact of main drivers and interventions, hierarchical cluster analyses were generated using Bray–Curtis similarity and group average clustering. The input data for each analysis consisted of perception weights from each stakeholder group regarding: the presence of distal and proximate drivers, impact of distal and proximate drivers, presence of interventions and impact of interventions.
Results from analyses of perception data were compared to patterns of communication between stakeholder types to identify relationships between the two kinds of information.

3. Results

3.1. Comparison of Perceptions about Main Drivers within Stakeholder Types

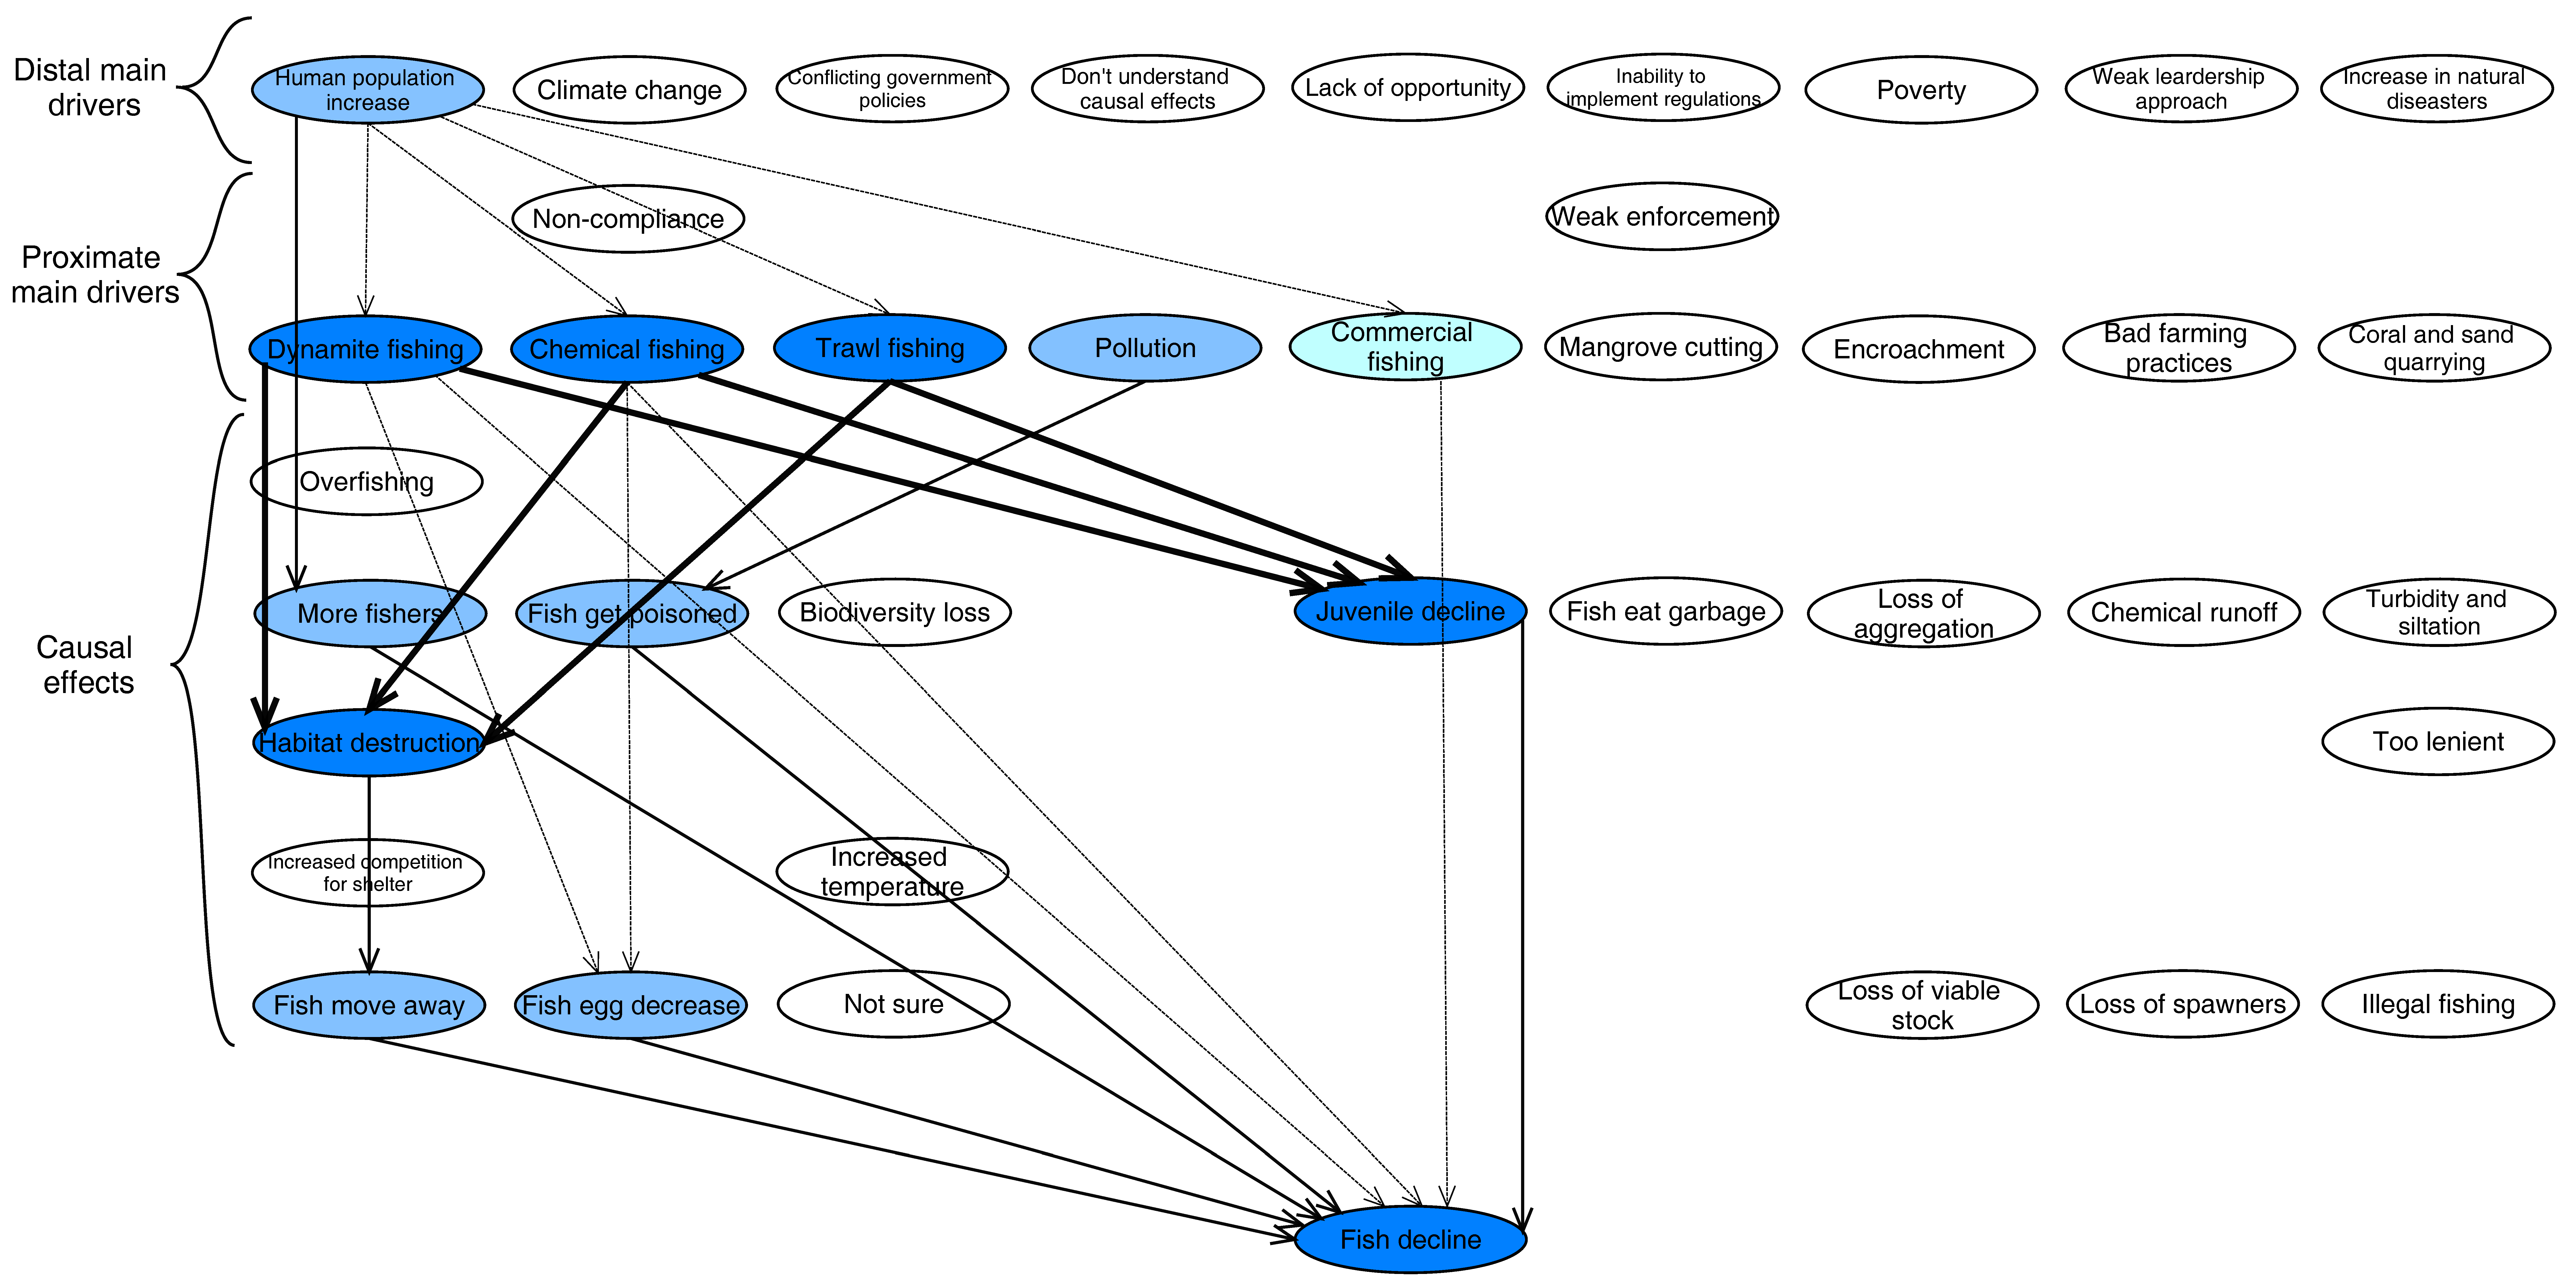
Two of the three fisher groups perceived human population increase to be a main distal driver of fish decline (Table 1, Figure 3). Dynamite, chemical, trawl and commercial fishing were each perceived to increase due to population pressure by one fisher group (connections in Figure 3), while both groups identifying population as a distal driver made the connection to increased number of fishers. There were differences in perception of the causal effects flowing from dynamite fishing and chemical fishing. One group perceived each type of fishing to cause either a decline in fish eggs or fish decline directly. All three groups agreed that dynamite, chemical and trawl fishing led to increased habitat destruction and juvenile decline, but identified different pathways to fish decline.
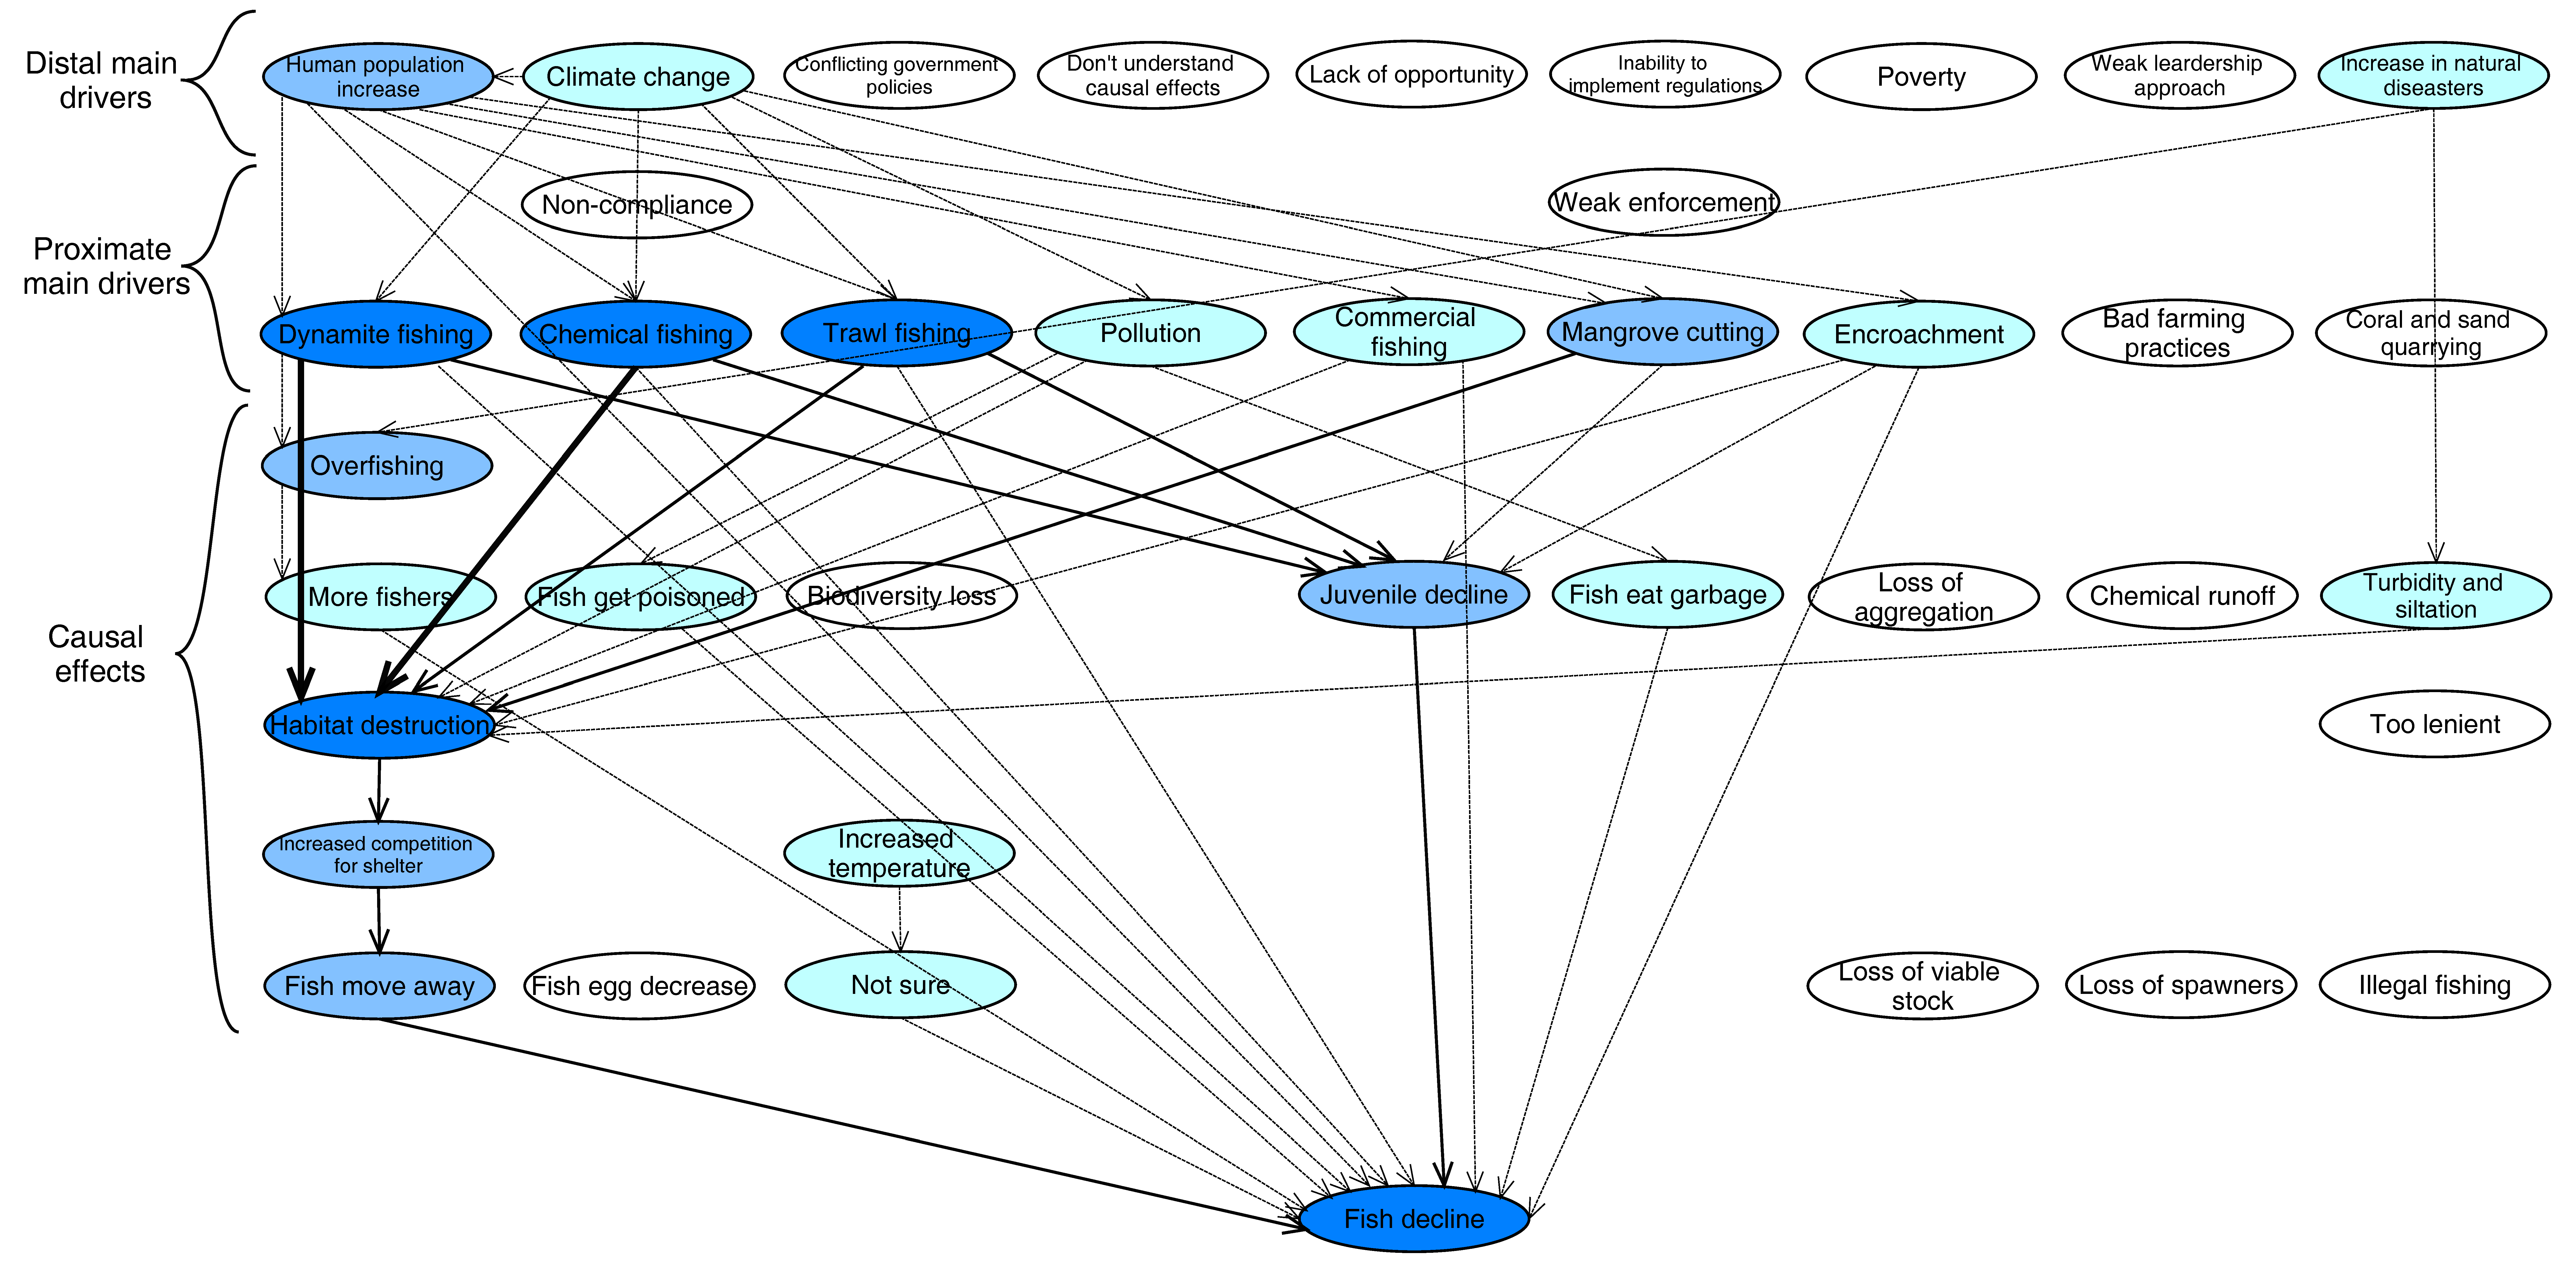
Two out of the three local government groups perceived human population increase to be a distal driver of fish decline, although the perceived proximate drivers and causal effects differed (Table 1, Figure 4). Dynamite fishing, overfishing, chemical fishing, trawl fishing, pollution, commercial fishing, mangrove cutting and encroachment were identified by single groups to result from human population increase. Climate change and increased natural disasters were perceived by single groups to be distal drivers of fish decline. Two local government groups were unconvinced that natural disasters were effects of climate change. One group included temperature increase in its mental model but members commented that they were unsure why temperature was increasing or how it was causing fish decline. All three groups perceived dynamite, chemical and trawl fishing to be important proximate drivers of fish decline. All groups perceived dynamite and chemical fishing to cause habitat destruction, but only two groups perceived trawl fishing to cause habitat destruction. Two out of the three groups perceived dynamite, chemical and trawl fishing to cause juvenile decline and one considered each fishing method to directly cause fish decline. While two groups perceived overfishing to be a consequence of human population increase, dynamite fishing and increased natural disasters, the subsequent pathways differed: either through more fishers or directly to fish decline.
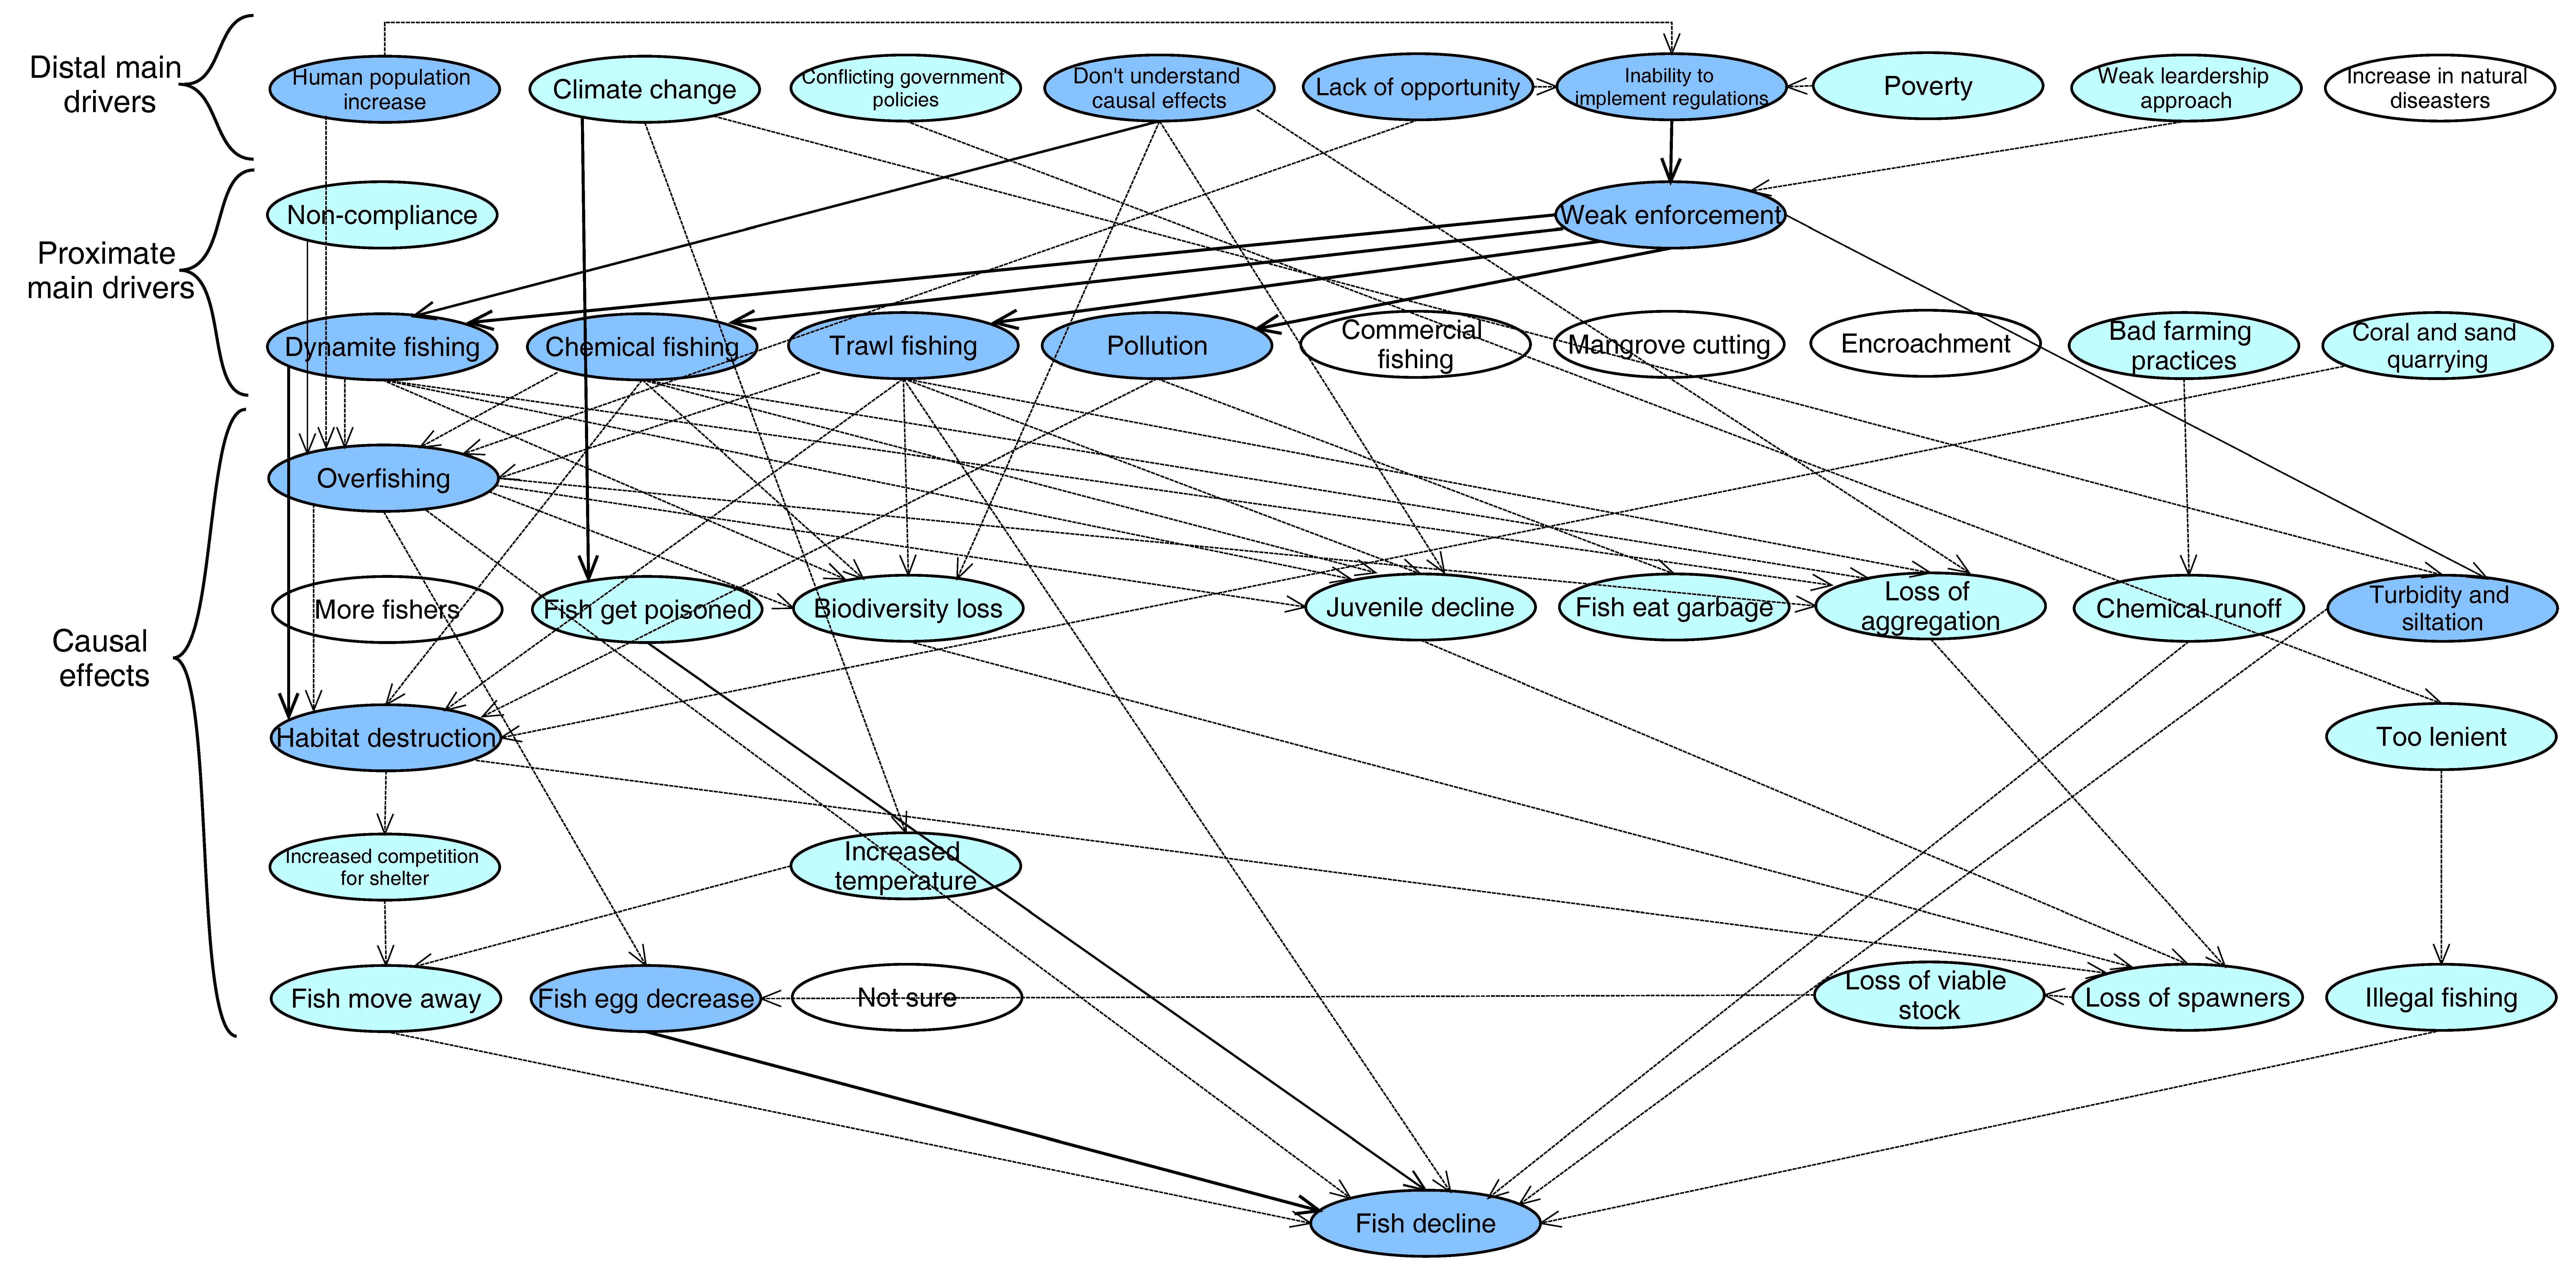
Single environmental groups perceived climate change, conflicting government policies, poverty and weak leadership to be distal drivers (Table 1, Figure 5). Single groups considered non-compliance, bad farming practices and coral and sand quarrying to be proximate drivers. Both groups identified four distal drivers: human population increase, lack of understanding of causal effects, lack of opportunity and inability to implement regulations. Both groups identified five proximate drivers: weak enforcement, dynamite fishing, chemical fishing, trawl fishing and pollution, although the perceived pathways to fish decline differed. One group perceived human population increase to cause overfishing while the other perceived it to prevent regulations being implemented due to limited conservation resources. Both groups linked not understanding causal effects to overfishing, but single groups also perceived lack of understanding to cause either biodiversity loss, juvenile decline, or loss of aggregations. One group perceived lack of opportunity to cause overfishing while the other perceived it to constrain implementation of regulations. Both groups perceived weak enforcement to cause an increase in dynamite fishing, chemical fishing, trawl fishing and pollution. The links between these fishing methods and their causal effects varied between groups. One group perceived pollution to increase in fish eating garbage; the other group perceived it to increase habitat destruction.

3.2. Comparison of Perceptions about Main Drivers

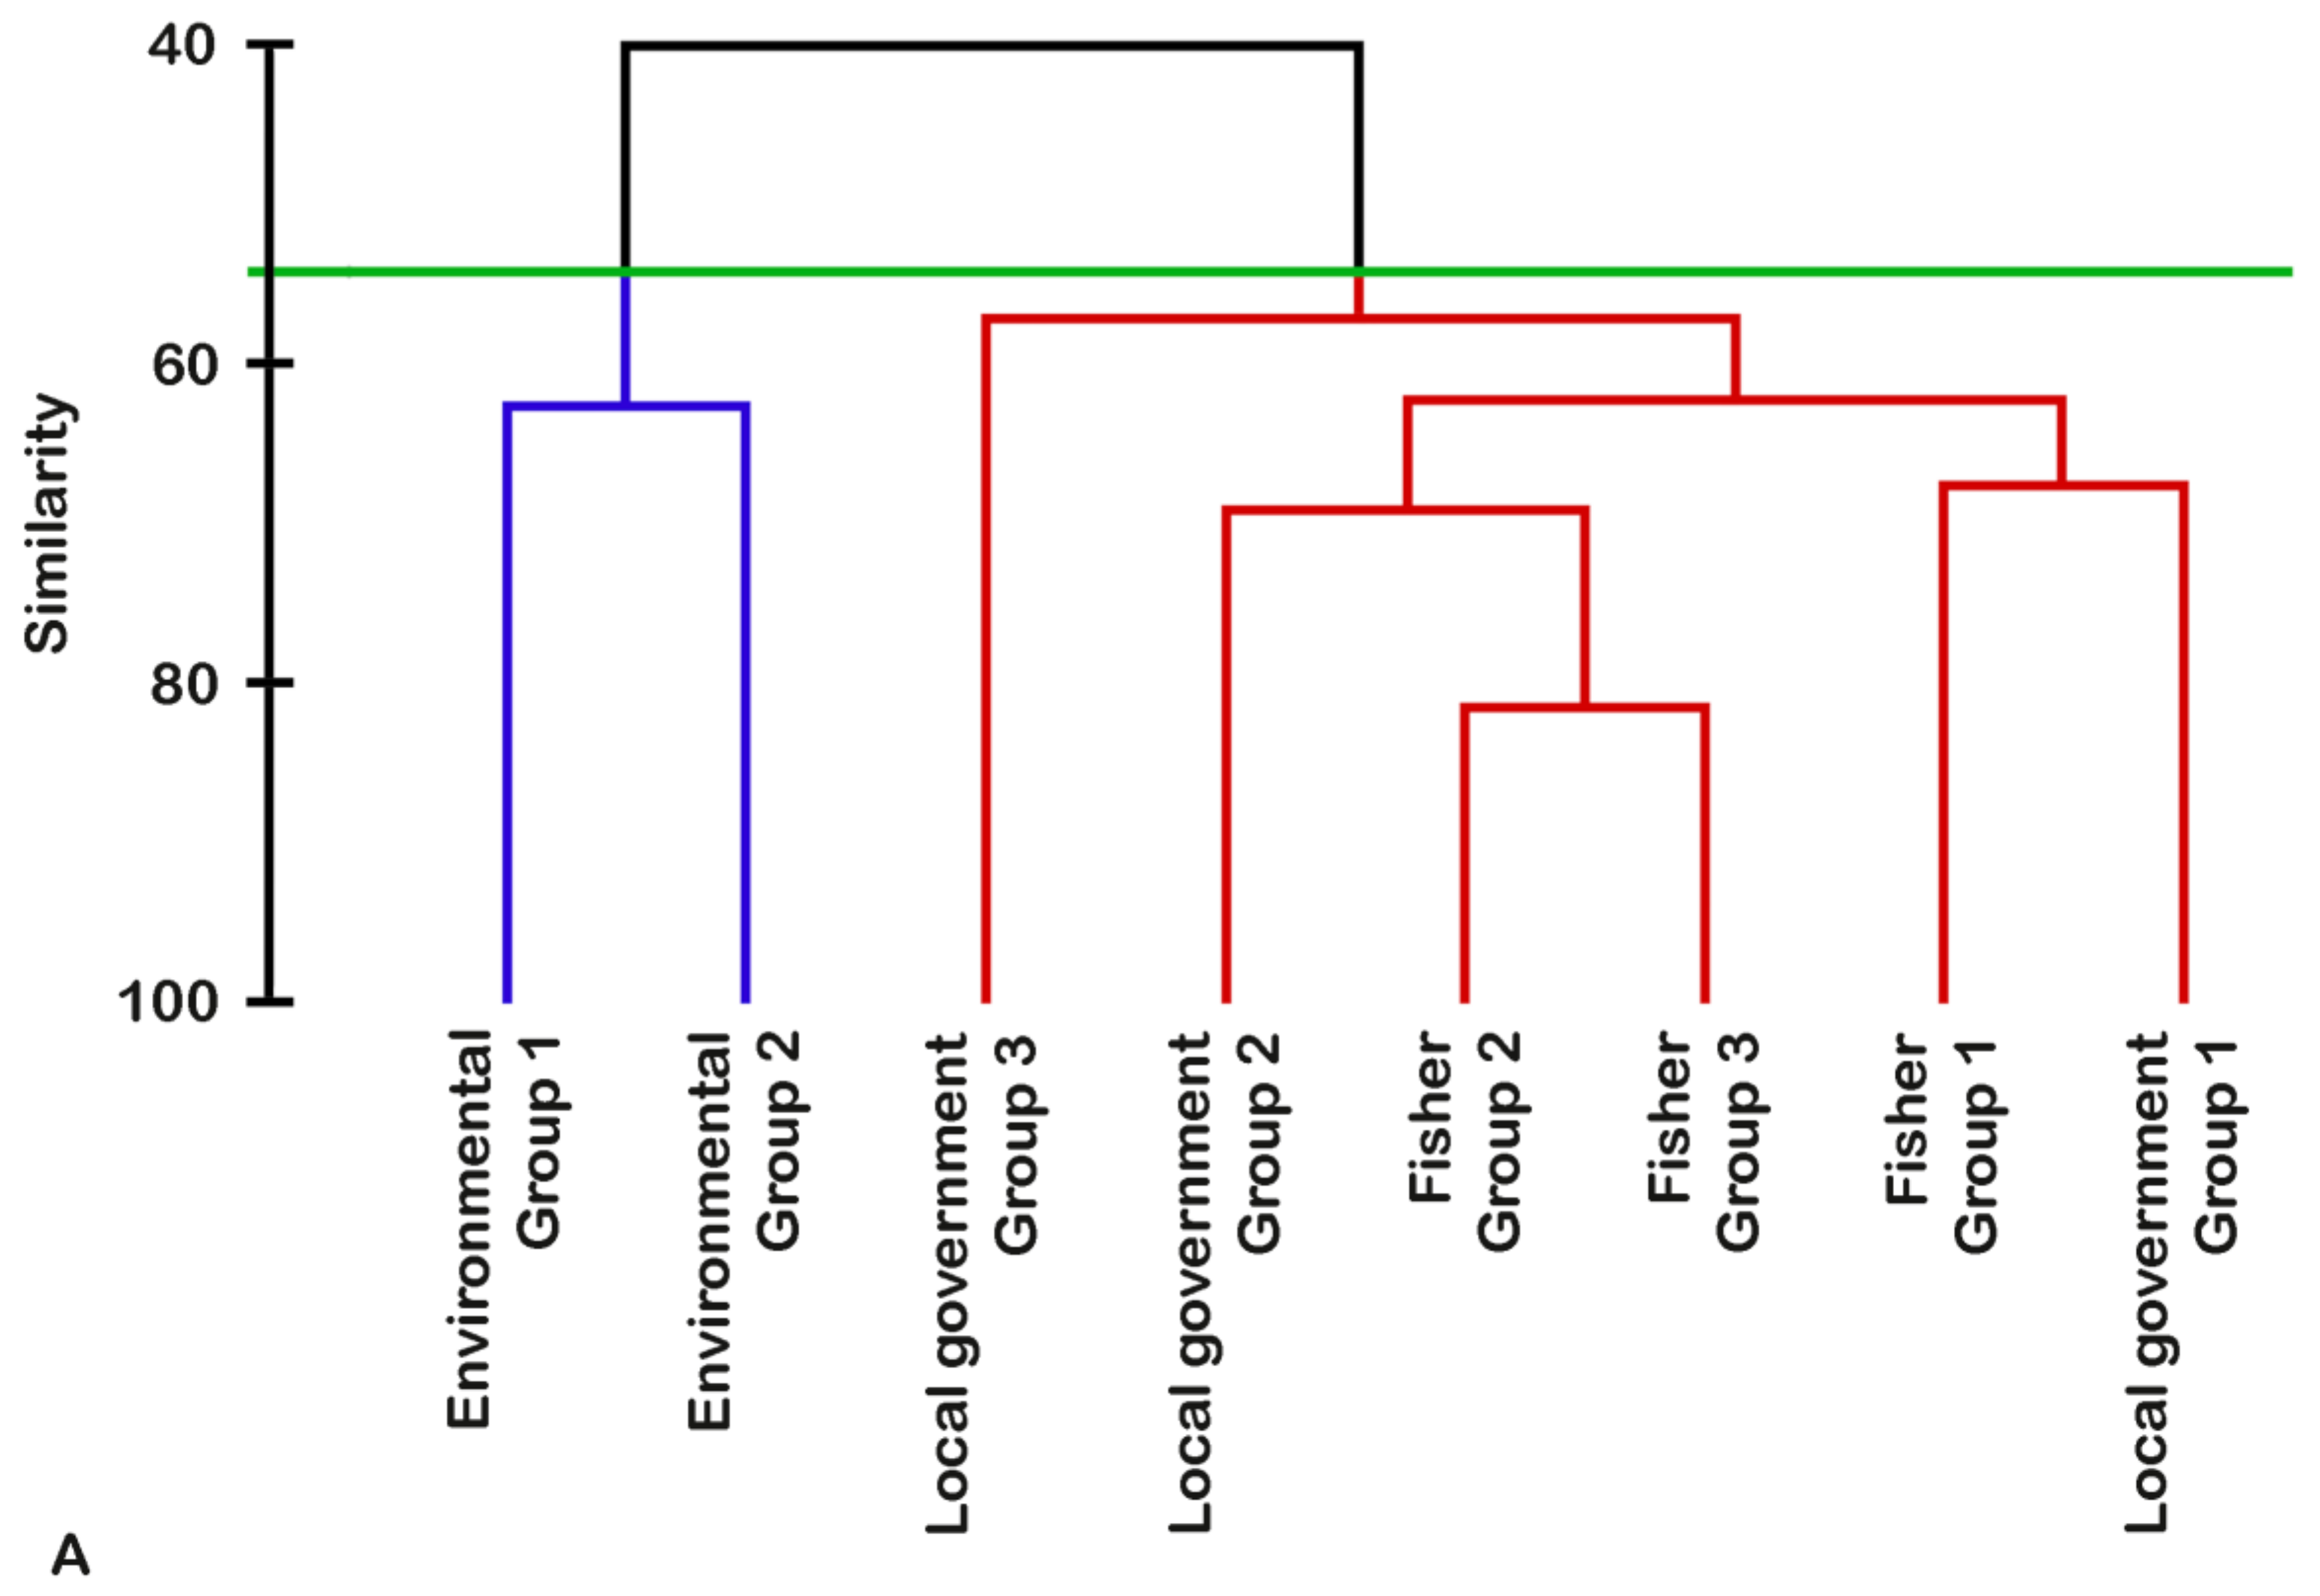
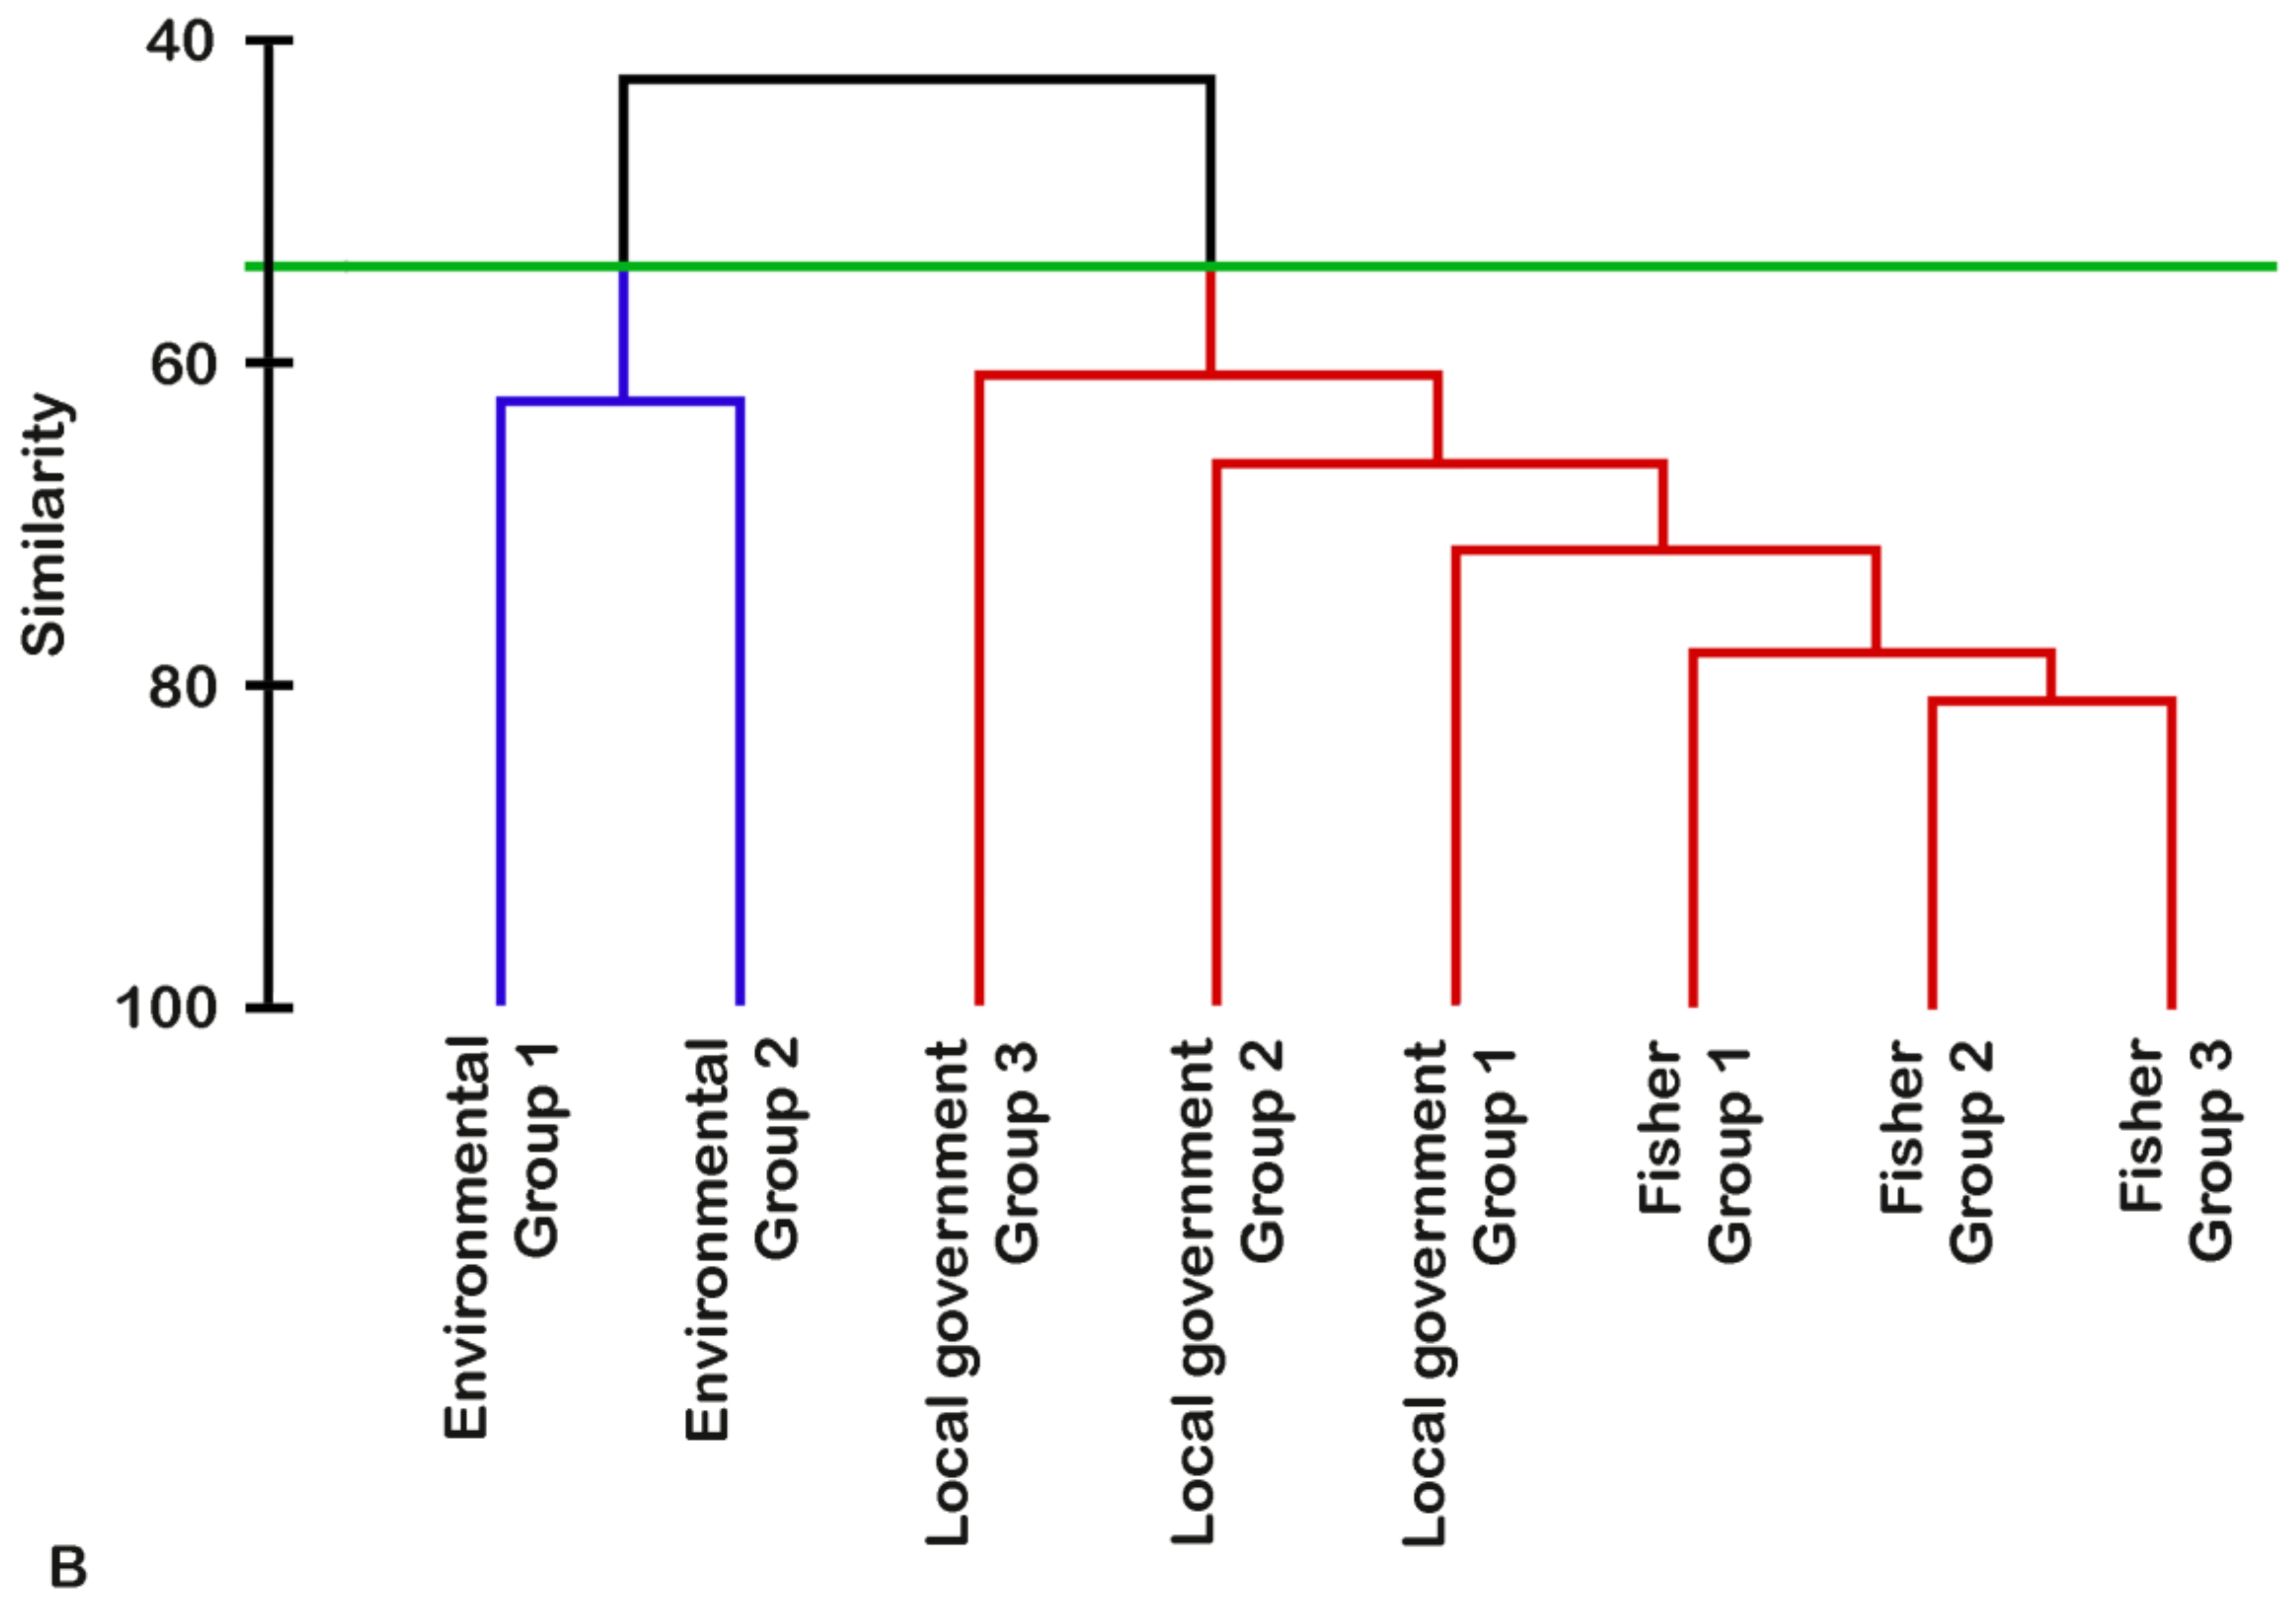
There were two distinct clusters of perceptions about the presence and impact of main drivers; one being environmental groups and the other consisting of fisher and local government groups (Figure 6A,B). Of the perceived distal drivers of fish decline, environmental groups identified eight, followed by local government groups who perceived three and fishers who identified one (Table 1). Of the perceived proximate drivers, environmental groups identified eight, followed by local government groups who perceived seven and fishers who identified five. Environmental groups identified ten distal and proximate drivers not perceived by the other stakeholder groups; local government groups identified three unique drivers; fisher groups identified no unique drivers.
The only distal main driver perceived by all stakeholder groups was human population increase (Table 1). Only one local government group identified an increase in natural disasters as a distal main driver and one local government and one environmental group perceived climate change as a distal main driver. Among proximate main drivers, all fisher, local government and environmental groups identified dynamite fishing, chemical fishing and trawl fishing. Pollution was another proximate main driver perceived by all three stakeholder types, but one fisher group and two local government groups did not include pollution in their mental models. Commercial fishing was perceived to be a main driver by only one fisher and one local government group, mangrove cutting was perceived by only two local government groups, encroachment was perceived by only one local government group and bad farming practices and coral and sand quarrying were perceived by only one environmental group.
Each stakeholder mental model had distinctly different pathways between main drivers and fish decline. However, one common pathway perceived by all groups within each stakeholder type was that dynamite, chemical and trawl fishing led to habitat destruction and, ultimately, fish decline.

3.3. Comparison of Perceptions about Conservation Interventions

Law enforcement was perceived by all three fisher groups, gear swapping and coastal clean-up were perceived by two fisher groups and three interventions were perceived by only one fisher group (Table 2). Four interventions were perceived by all three local government groups; tree planting was perceived by two local government groups; and five interventions were perceived by only one local government group. Six interventions were perceived by both environmental groups, while eleven were perceived by only one environmental group.
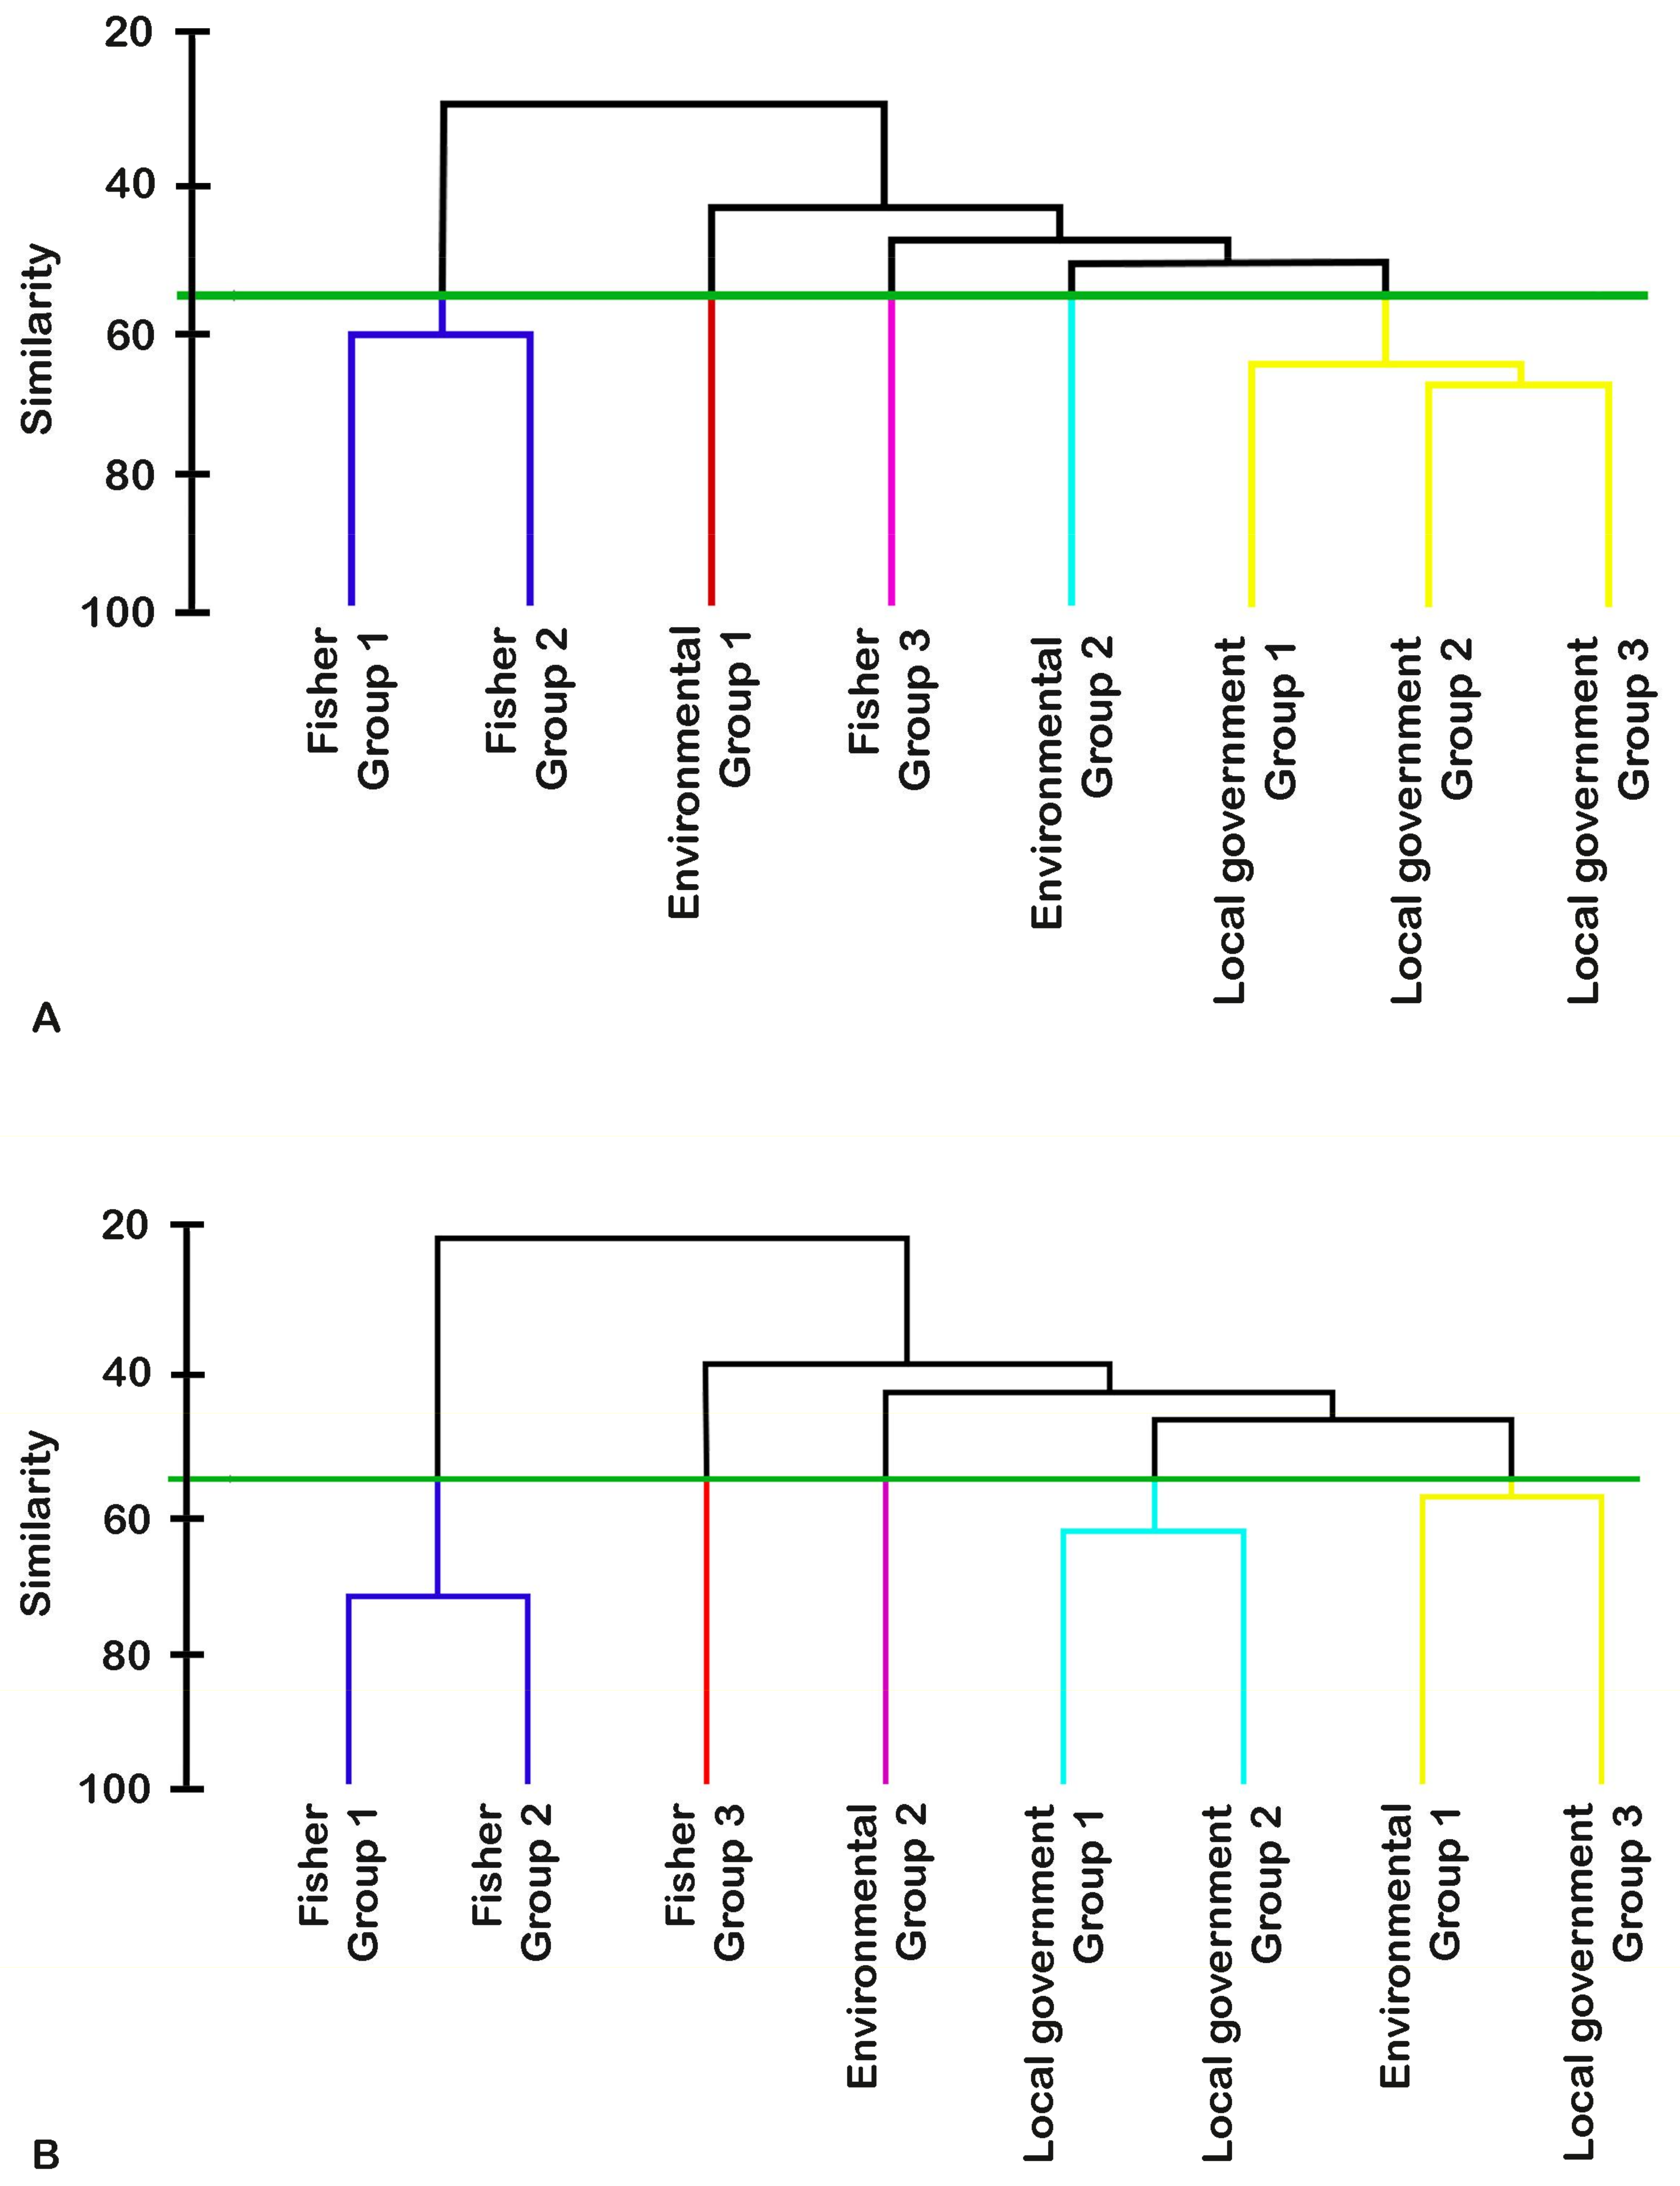
The dendrograms indicating similarity of perceptions in terms of interventions (Figure 7A,B), when cut at 55% similarity, gave five clusters for both presence and impact, in contrast to two clusters for both presence and impact of main drivers (Figure 6A,B). The larger number of clusters for interventions indicates less agreement both within and between stakeholder types, except for strong alignment of local government groups regarding presence of interventions.
A total of 22 interventions were identified as useful to mitigate one or more main drivers (Table 2). Only law enforcement was identified by all eight groups, and three interventions were identified by at least one group from each stakeholder type: laws and regulations (both environmental, all three-local government and one fisher group), marine reserves (both environmental, one local government and one fisher group) and information, education and communication activities (one environmental, all three local government and one fisher group). Three interventions were identified by only two stakeholder types: alternative livelihoods (both environmental and all three local government groups), reproductive health law (one environmental and one local government group) and gear swapping (one local government and two fisher groups). Fifteen interventions were perceived by only one stakeholder type, highlighting differences between their perceptions. Environmental groups identified eleven interventions that were not perceived by the other stakeholder types, followed by local government groups with three unique interventions and fisher groups with one.
Much of the variation in perceived interventions was due to variation in perceptions about main drivers. The main drivers that each intervention was seen to mitigate did not vary among stakeholder groups. For example, stakeholder groups that identified law enforcement, laws and regulations, marine reserves, alternative livelihoods, gear swapping, market denial, temporal closures, Integrated coastal management plans, poverty alleviation programs, fisher registration, fisher/People’s Organizations, allocation of resources to coastal resource management CRM, stakeholder networking and CRM plans were linking these interventions to illegal fishing methods such as dynamite, chemical and trawling. Reproductive health laws and birth control were identified as mitigating human population increase. Coastal clean-up and recycling programs were identified as mitigating pollution. Tree planting was identified as mitigating mangrove cutting, and some interventions were perceived to mitigate all main drivers, including information, education and communication campaigns, research and monitoring and evaluation.

3.4. Personal Experiences that Shaped Perceptions

Semi-structured discussions indicated that environmental groups’ perceptions about fish decline were formed by formal education, on-the-job training, reading scientific literature, conferences and trainings and experience working with fishers and community members. Both environmental groups in this study have participated in, and conducted trainings and workshops pertaining to, conservation of marine resources.
Local government groups stated that their perceptions were a product of both formal education and, to a lesser extent, experiencing the effects of main drivers and interventions first-hand. Local government respondents said that some local government personnel had bachelor degrees, experienced illegal fishing activities personally and were often involved in mitigating drivers of fish decline through enforcement of laws and regulations. They had also attended trainings from environmental groups, including ECOFISH and the Zoological Society of London that work specifically in the Danajon Bank and from groups, such as Rare and the Coastal Conservation and Education Foundation, that do not work specifically in the study area.
Fishers stated that their perceptions of fish decline were formed by their day-to-day activities and, to a lesser extent, workshops and trainings from both environmental groups and local government units. Most fishers had no formal education and therefore relied primarily on local knowledge pertaining to management of fish populations.

3.5. Values, Priorities and Involvement in the Decision Making-Process

Environmental groups valued fish as an important source of food and income for fishers and as playing a pivotal role in maintaining the marine ecosystem. Local government and fisher groups stated that fish were an important source of food and income for fishers.
All stakeholder types stressed that mitigating illegal fishing methods should be the main priority in management of fish populations.
Environmental groups were very involved and influential in the decision-making process because they provide results from research and baseline surveys that allow others to make evidence-based decisions. When asked about their level of involvement in decision-making, environmental groups discussed the benefits of community-based conservation and their intention to create networks among stakeholders and provide information to assist them in making good choices that conserve the marine environment. Consequently, they were satisfied with their roles in decision-making.
Local government groups stated that they had little involvement in decision-making because their job was to provide information to mayors who make the final decisions regarding which interventions are implemented. No local government groups stated that they would like greater involvement.
Fishers had mixed responses regarding their involvement in decision-making. One group stated it was reasonably satisfied because its members were invited to meetings regarding resource management, although this group also wanted more involvement in making decisions. The second fisher group stated that its members were not involved in making decisions and would not like to be more involved. The third fisher group stated that its members were not involved, but would like more involvement.

3.6. Perceptions about Communication Patterns between Stakeholder Types

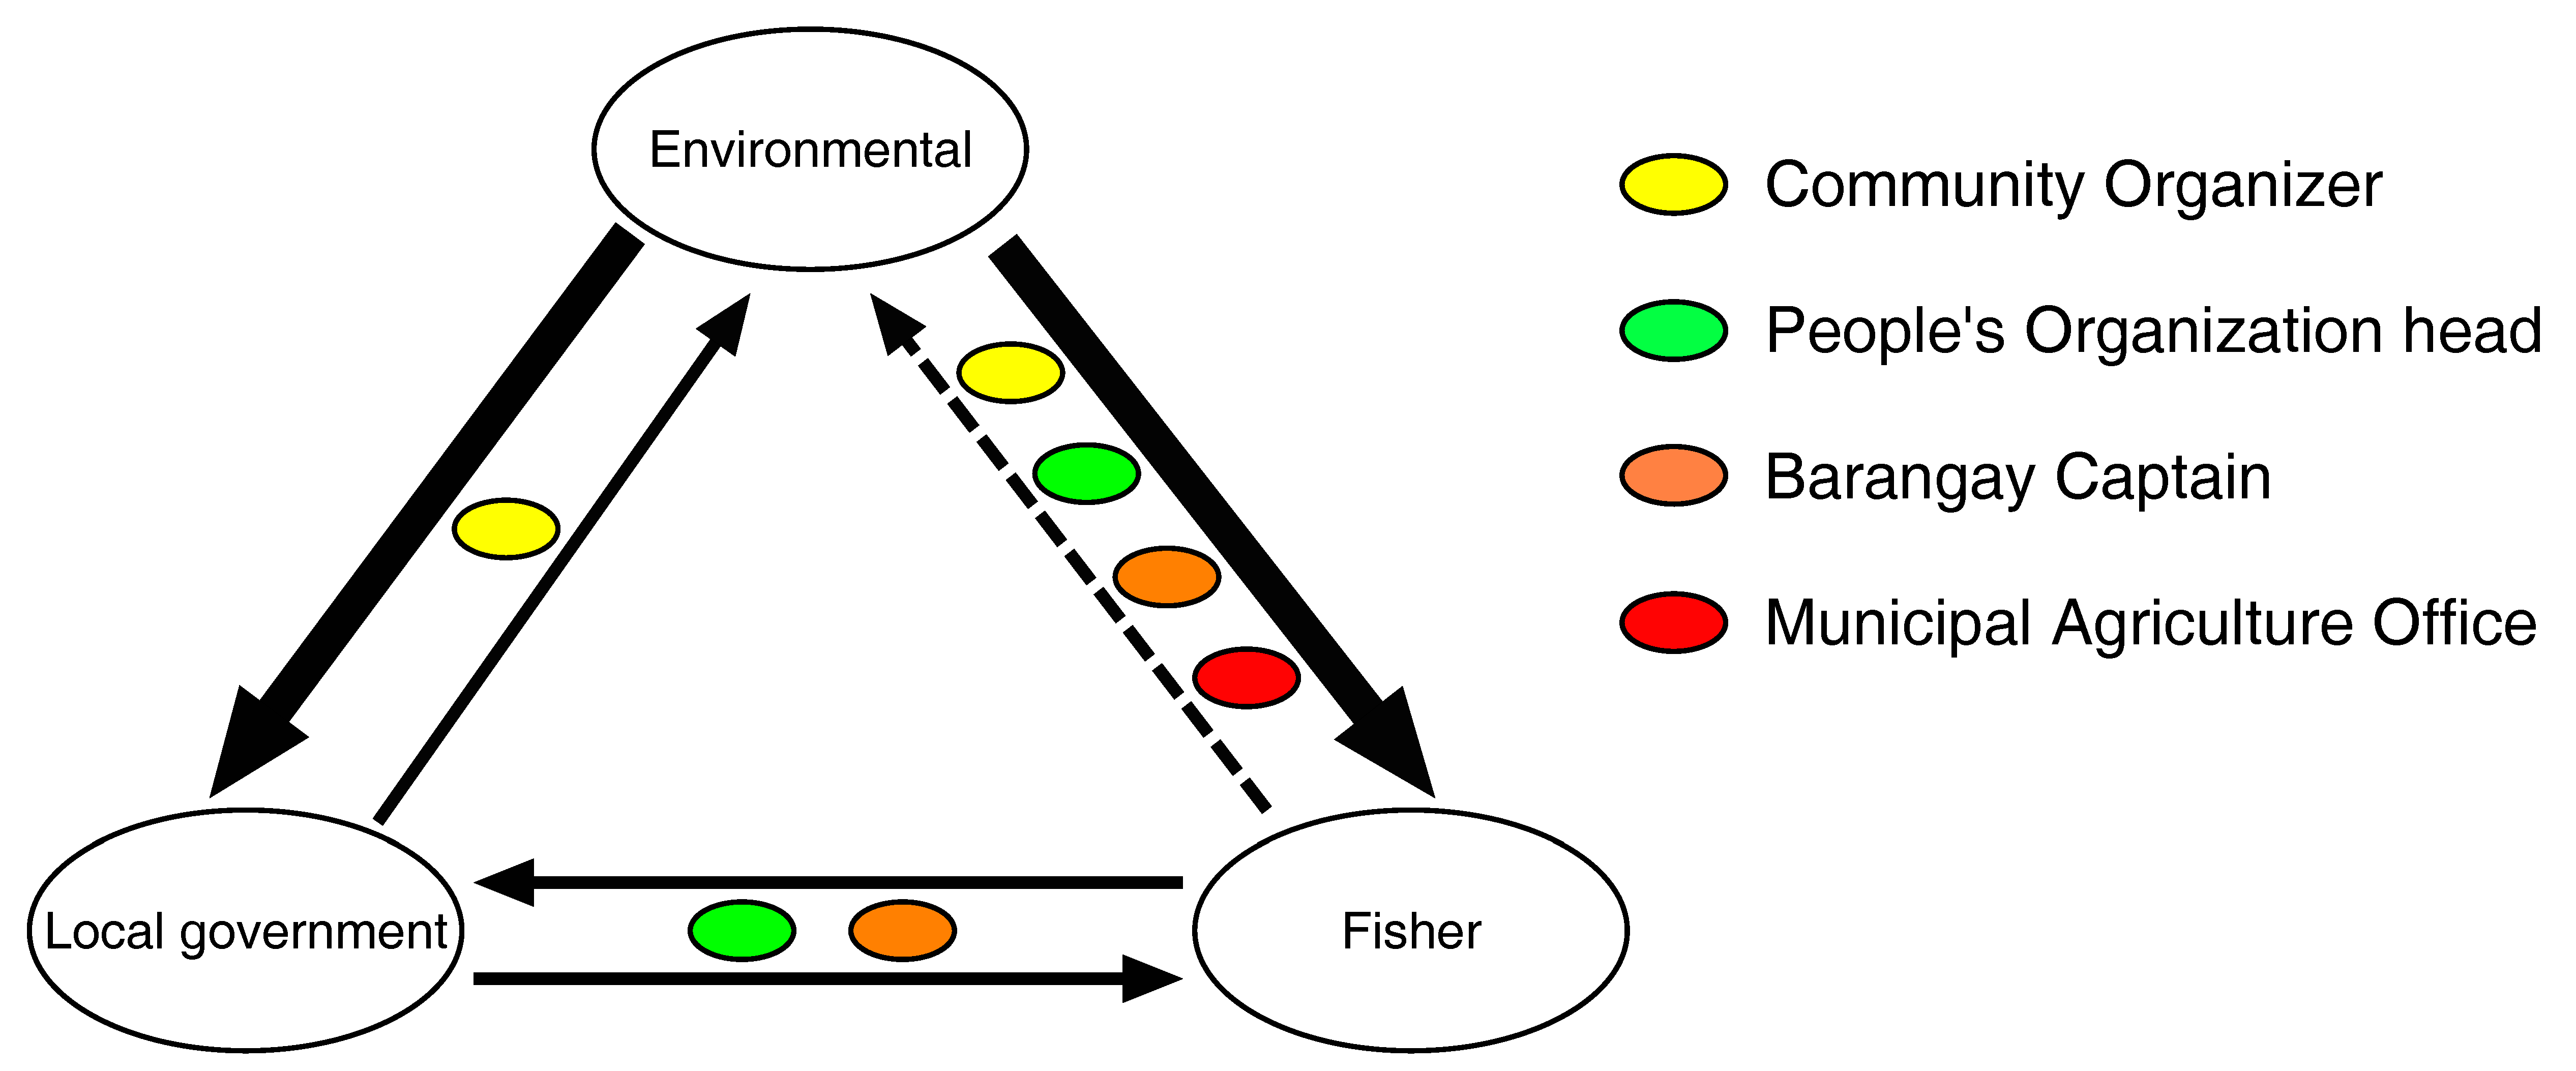
The weakest communication, as described in interviews, was by fishers with environmental groups (Figure 8). Both environmental groups described their communication with fishers to be very effective, which they defined as easy-to-achieve and constant communication. However, two fisher groups stated that they had minimal or ineffective communication with environmental groups, with the third fisher group stating that communication with environmental groups was only somewhat effective. Fishers defined ineffective communication as difficult-to-achieve and rare or non-existent communication and somewhat effective communication was defined by the one fisher group as somewhat-difficult-to achieve and occasional communication. Environmental groups also perceived very effective communication with local government groups. All three local government groups considered that their communication with environmental groups as somewhat effective and could be more effective and regular. All three local government and fisher groups perceived communication with the other stakeholder type as somewhat effective and could be more effective and regular.
Several key actors facilitated communication between stakeholder types, including Community Organizers, the heads of People’s Organizations, Barangay Captains and Municipal Agriculture Officers (Figure 8, descriptions for each actor are in Section 2.2). Environmental groups identified Community Organizers and the heads of People’s Organizations as pathways to communicate with fishers. However, two fisher groups did not know how to communicate with environmental groups and one fisher group stated that they would ask the Municipal Agriculture Officers to help communicate with environmental groups. Environmental groups stated that Community Organizers facilitated communication with local government personnel and that local governments had their municipal coastal resource management office to contact environmental personnel. Local government personnel stated that Barangay Captains facilitated communication with fishers and that fishers had the option to use either People’s Organizations or Barangay Captains to contact local government personnel.

3.7. Communication Patterns in Relation to Similarities in Perceptions about Drivers and Interventions

The weakest perceived link in communication was between fisher and environmental stakeholders. These two stakeholder types were also situated in different clusters of perceptions of both presence and impact of main drivers and interventions. Further, the two stakeholder types had different perceptions about the effectiveness of their communication. Environmental groups identified very effective communication with fishers, but fishers identified ineffective communication with environmental groups. In contrast, local government personnel and fishers both perceived relatively effective communication with each other, and they also fell into the same cluster of perceptions about the presence and impact of main drivers. While the same was not true for perceptions of interventions, no pair of stakeholder types fell wholly within a single cluster of perceptions regarding either the presence or impact of interventions.

4. Discussion

4.1. Perceptions of Resource Decline among Stakeholder Types

All stakeholders in this study agreed that fish populations were declining in the Danajon Bank; however, their understanding of which drivers were operating, how drivers caused decline and which interventions mitigated drivers differed among stakeholder types. Notably, environmental groups perceived a larger overall number of drivers and interventions than the other two stakeholder types. Additionally, the two environmental groups weighted the presence and impact of drivers more similarly to one another than to local government and fisher groups. Conversely, local government and fisher groups did not weight drivers more similarly to groups within their affiliated stakeholder type than to each other.

4.2. How Stakeholder Types Formed Their Perceptions and How They Interact

The sources of knowledge pertaining to fish conservation varied among the three stakeholder types. Environmental groups held scientific knowledge obtained from experts and the literature; fishers held local knowledge from direct experience; and local government fell into the middle of the spectrum between scientific and local knowledge, with comparatively less influence from the literature and less direct experience compared to the other stakeholder types.
Environmental groups were very involved in and were satisfied with their role in, the decision-making process. Local government personnel perceived that they had little involvement in, but were nonetheless satisfied with their role in, the decision-making process. Fishers had varied responses regarding their involvement in and satisfaction with the decision-making process.
The ability for effective communication varied between stakeholder types. In addition, there were differences in perceptions about how effective communication was within the following pairs of stakeholder types: local government and environmental and fisher and environmental. For example, fishers perceived very ineffective communication with environmental groups while environmental groups perceived very effective communication with fishers. Four kinds of bridging actors were identified as communication facilitators between pairs of stakeholder types, with unequal numbers of bridging actors acting between pairs.

4.3. Why Perceptions Were Different

The different stakeholder perceptions in this study likely reflect differences in how perceptions were formed through their personal and education experiences and values. These three attributes form distinct knowledge cultures, which have been shown to affect how stakeholders perceive a resource [56,57,58] see examples in [17,59,60]. Elsewhere, Hicks et al. [6] found that differences in personal experiences and the conceptual understanding about how drivers cause decline could lead to different management priorities among stakeholders. Our findings differ somewhat from those of Hicks et al. [6] in that different personal experiences and education led to different conceptual understandings of drivers, which in turn led to different perceptions about fish decline, with little effect on priorities in management. This is because our results showed that management priorities were similar among all three types (to mitigate dynamite fishing, chemical fishing and trawl fishing); however, how these drivers can be mitigated differed greatly between stakeholder types.

4.4. Why Perceptions Were Not Shared

Communication is required to share perceptions and knowledge about issues pertaining to the sustainability of a resource. In this study, stakeholders had varying levels of effective communication between each other, which means that diverse perceptions and knowledge about resource decline were not being shared equally. A contributing factor that made communication between stakeholder types difficult was the small number of environmental and local government personnel, limiting the potential to exchange information effectively with the ~125,000 municipal small-scale fishers. Currently, there is no formal system in place for the diverse stakeholders to share their knowledge, concerns and needs, and our results showed that it was difficult for certain stakeholders to communicate with others. Therefore, essential information is lacking when conservation decisions are being made [5,10,11,24].
Not only is general communication between stakeholders difficult for some, but not all stakeholders are involved in, or are interested in being involved in, the decision-making process. The decision-making process is a platform that allows stakeholders to share their unique knowledge cultures and contribute to the development of common knowledge that increases stakeholders’ overall awareness and understanding of drivers and interventions [8,10,11,12,53,57,61]. To improve the ability of stakeholders and managers to generate solutions that have a higher likelihood of making a positive impact that complements the needs of the different stakeholders [8,10,12], information sharing must occur in a trusting and respectful environment. It can be challenging for stakeholders with different knowledge cultures to accept new knowledge (e.g., scientists accepting and assimilating knowledge into their own mental models from fishers and vice versa) [62], However, strong social capital (e.g., trust, reciprocity and networks of relationships) and fair decision-making processes (i.e., procedural equity) can help overcome these challenges, facilitating cooperation and collaboration between stakeholders, even if stakeholders are not in complete agreement [63,64,65]. Changes to how stakeholders interact and how governance motivates interactions are thus needed to improve stakeholder communications to better co-manage fish populations.

4.5. Suggestions to Improve Knowledge and Perception Sharing

To improve communication among stakeholders, the literature suggests that key actors who are in the best position to bridge the gap between stakeholder types (i.e., bridging actors) be utilized to facilitate communication [8,14,66]. This study identified bridging actors in the Danajon Bank. One such actor is a Community Organizer, employed by environmental groups, who initiates and facilitates interactions between environmental groups and the other two stakeholder types. Two more key actors are the Barangay Captain and the head of a People’s Organization, who facilitate communication between fishers and the local government and environmental groups. The fourth identified key actor is the Municipal Agriculture Officer who assists with communication between fishers and higher-level local government members. Due to their occupational roles and ties within the community, these four kinds of actors are in the best position to increase the effectiveness of communication. Realizing the roles that bridging actors have in connecting stakeholders is important because strategies can then be formulated to improve communication.
With more realized and developed roles, bridging actors can relay information between stakeholders and pave the way for formal participation in knowledge-sharing activities that improve participation in, and outcomes from, the decision-making process across scales and levels [67]. This can be done by having bridging actors meet with their associated stakeholder types (Figure 2B, green) and assist them with identifying respected and informed members from each stakeholder type to act as formal representatives. In many cases, the most appropriate formal representatives would be their associated bridging actors such as the Community Organizers from environmental groups and Municipal Agriculture Officers from local governments. Identified formal representatives can first gather the concerns of the stakeholders they represent, along with knowledge and needs pertaining to fish populations, which can then be shared during knowledge-sharing activities (Figure 2B, orange). Knowledge-sharing activities with similar aims have been successful in the form of workshops, formal presentations with question and answer sessions and/or hands-on demonstrations, in New Zealand see four case studies in [68], Ethiopia [69] and Kenya [70]. These knowledge-sharing activities should coincide with discussions leading to conservation decisions. Beyond the benefit of increasing common knowledge and providing up-to-date information for decision-makers to make informed conservation decisions that reflect the needs of all stakeholders [71], this added level of connectivity also allows formal representatives to return to their affiliated stakeholder types to share what was discussed (Figure 2B, blue). This type of feedback is useful because stakeholders become aware of the reasoning behind decisions and that their voices were heard and their needs considered, increasing the likelihood of trust and compliance among resource users [72], which will improve co-management and sustainability of a given resource [16]. Similar suggestions have been offered in other studies because of the clear positive correlations between increased communication, sharing of knowledge and better management of resources [56,73].
The feasibility of conducting knowledge-sharing activities needs to be evaluated. This can be done through an environmental cost-benefit analysis where the cost and time needed to identify and transport bridging actors and formal representatives are compared to the potential short and long-term benefits of conducting these activities review of environmental cost-benefit analysis in [69].
Our suggestions aim to improve stakeholder interactions by adjusting the current governance framework. It is our hope that improved communication among diverse stakeholders will allow the current networks in the Danajon Bank to better reach their intended aims, which are to connect stakeholders, share information, promote collaboration and monitor social and ecological outcomes of marine reserves [47,50]. Our suggestions aim to fill gaps that limit the effectiveness of these aims by improving the ability of all stakeholders to collaborate within and across scales.

5. Conclusions

Co-management is not effective if diverse stakeholders are not sharing knowledge and perceptions about resource decline and ways of arresting or reversing that decline. In this paper, we show how using mixed methods can help to understand how and why perceptions are different. We also show, through a preliminary analysis of the governance framework, ways of improving communication, perception sharing and co-management. Further research needs to go into the feasibility of our suggestions, including the designation and logistics of formal representatives and establishment of knowledge-sharing activities. We believe that our suggestions can have a significant impact on stakeholder interactions, sharing of knowledge and improvement of both ecological and social outcomes.

Acknowledgments

We thank the editor and two anonymous reviewers for their valuable comments and suggestions, which greatly improved the paper. We acknowledge the support of the Australian Research Council (ARC) Centre of Excellence for Coral Reef Studies.

Author Contributions

J.H., G.G., A.W. and B.P. conceived of and designed the experiments. J.H. and K.P. conducted the field work. J.H., G.G., A.W. and B.P. analysed the data and wrote the paper.

Conflicts of Interest

The authors declare no conflict of interest.

Appendix A. Semi-Structured Questions Asked during Discussions

  • Sources of knowledge about drivers of fish decline and interventions that mitigate drivers.
    • Where did you learn about drivers of fish decline and interventions that mitigate drivers?
    • Have you participated in any workshops, trainings, or conferences?
    • Have you conducted any workshops, trainings, or conferences?
    • What else has shaped your perceptions on drivers of fish decline and interventions that mitigate drivers?
  • How drivers and interventions affect stakeholders.
    • How have any of the drivers positively affected you?
    • How have any of the drivers negatively affected you?
    • How have any of the interventions positively affected you?
    • How have any of the interventions negatively affected you?
  • Involvement in the decision-making process.
    • How involved is your group in the decision-making process regarding the implementation of conservation strategies?
    • Do you wish to be more or less involved?
  • Role in conserving fish.
    • What are the aims/roles of your group in protecting fish populations in the Danajon Bank?
    • How do you achieve your aims?
    • Are fish important to protect?
    • What, if any, are the benefits of fish?
    • Which is more important: receiving those benefits immediately, or receiving those benefits in the future?
  • Communication between stakeholder types.
    • How well do you communicate with the other two stakeholder types?
    • How well do you understand the actions of the other two stakeholder types?
    • In the past, what good interactions have you had with the other two stakeholder types?
    • How were those good interactions initiated and how will good interactions be sustained?
    • In the past, what bad interactions have you had with the other two stakeholder types?
    • How were those interactions initiated?
    • Were those interactions resolved and, if yes, how?
  • Perceived priorities in management.
    • What general improvements to fish management would you like to see?
    • How could this be achieved?
    • What interventions are not listed on your mental models but would be effective if present?

Appendix B. Description of Each Mental Model Node As Defined by Participants in the Study

  • Human population increase: An increase in the number of people.
  • Climate change: A change in normal weather patterns.
  • Conflicting government policies: Decision-makers having different agendas and methods to conserve marine resources.
  • Don’t understand causal effects: Being aware of a given driver but unsure how it relates to fish decline.
  • Lack of opportunity: Limited occupational options for people.
  • Inability to implement regulations: Regulations to conserve fish populations are not implemented due to conflicting priorities and limited resources among decision-makers.
  • Poverty: The state of being poor and being dependent on fish as a source of nutrients.
  • Weak leadership approach: Making poor decisions that negatively affect the marine environment.
  • Increase in natural disasters: Presence of more destructive and frequent natural disasters such as typhoons and earthquakes.
  • Non-compliance: Failing to act in accordance with laws and regulations pertaining to conservation of marine resources.
  • Weak enforcement: Failing to enforce laws and regulations pertaining to conservation of marine resources.
  • Dynamite fishing: The practice of using explosives to stun and/or kill fish, which also negatively affects underlying and nearby habitats.
  • Chemical fishing: Often associated with compressor fishing. The use of cyanide or chlorine to stun and/or kill fish. This also negatively affects underlying and nearby habitats.
  • Trawl fishing: Referring to either mid-water or bottom trawling. The use of large nets towed by boats to catch fish, which also negatively affects underlying habitats.
  • Pollution: The introduction of harmful substances into the marine environment such as plastic and nutrient runoff from farming.
  • Commercial fishing: The practice of catching large quantities of fish for profit, which often occurs illegally within municipal waters.
  • Mangrove cutting: The practice of harvesting mangroves for different purposes such as building supplies and kindling for cooking.
  • Encroachment: The act of fishing in an area that is designated as protected from fishing.
  • Bad farming practices: The act of adding excessive pesticides and fertilizers to plants.
  • Coral and sand quarrying: The act of harvesting coral or sand to create cement, to be sold as curios, or to replenish beaches.
  • Overfishing: The act of fishing past the point where the remaining fish populations can replenish themselves.
  • More fishers: A greater presence of fishers.
  • Fish get poisoned: Fish becoming sick from various destructive fishing methods.
  • Biodiversity loss: A decrease in the number of species.
  • Juvenile decline: A decrease in the number of juvenile fish.
  • Fish eat garbage: Fish eating garbage such as plastic.
  • Loss of aggregation: Thinning out of large schools of fish.
  • Chemical runoff: Chemicals such as pesticides entering the marine environment.
  • Turbidity/siltation: The process of substrate and/or corals being covered with matter such as sand or silt
  • Habitat destruction: The loss of habitat that is utilized by marine fauna.
  • Too lenient: Excessive laxity in implementation or enforcement of laws and regulations pertaining to the conservation of marine resources.
  • No patrol: Complete absence of personnel that enforce laws and regulations pertaining to the conservation of marine resources.
  • Increased competition for shelter: Fish having to compete to utilize decreasing available habitats.
  • Temperature increase: Ocean temperature being warmer than expected.
  • Fish move away: Fish leaving areas they used to inhabit.
  • Fish egg decrease: Less egg production than expected.
  • Not sure: Do not understand how the node above this one effects the node below, but sure of the connection.
  • Loss of viable stock: A decline in the total number of fish needed to maintain future populations.
  • Loss of spawners: A decline in the total number of fish that generate new offspring.
  • Illegal fishing in municipal waters: Types of fishing such as commercial fishing, which are not allowed within a given distance from shore; also, dynamite and chemical fishing, which are not allowed anywhere.

References

  1. Pressey, R.L.; Cabeza, M.; Watts, M.E.; Cowling, R.M.; Wilson, K.A. Conservation planning in a changing world. Trends Ecol. Evol. 2007, 22, 583–592. [Google Scholar] [CrossRef] [PubMed]
  2. Gill, D.A.; Mascia, M.B.; Ahmadia, G.N.; Glew, L.; Lester, S.E.; Barnes, M.; Craigie, I.; Darling, E.S.; Free, C.M.; Geldmann, J.; et al. Capacity shortfalls hinder the performance of marine protected areas globally. Nature 2017, 543, 665–669. [Google Scholar] [CrossRef] [PubMed]
  3. Pressey, R.L.; Visconti, P.; Ferraro, P.J.; Pressey, R.L. Making parks make a difference: Poor alignment of policy, planning and management with protected-area impact, and ways forward. Philos. Trans. R. Soc. 2015. [Google Scholar] [CrossRef] [PubMed]
  4. Brown, V.A. A collective social learning pattern. In Proceedings of the CEUR Workshop, Irsee, Germany, 9–13 July 2008. [Google Scholar]
  5. Bennett, N.J. Using perceptions as evidence to improve conservation and environmental management. Conserv. Biol. 2016, 30, 582–592. [Google Scholar] [CrossRef] [PubMed]
  6. Hicks, C.C.; Graham, N.A.J.; Cinner, J.E. Synergies and tradeoffs in how managers, scientists, and fishers value coral reef ecosystem services. Glob. Environ. Chang. 2013, 23, 1444–1453. [Google Scholar] [CrossRef]
  7. Hovardas, T.; Poirazidis, K. Environmental policy beliefs of stakeholders in protected area management. Environ. Manag. 2007, 39, 515–525. [Google Scholar] [CrossRef] [PubMed]
  8. Folke, C.; Hahn, T.; Olsson, P.; Norberg, J. Adaptive governance of social-ecological systems. Annu. Rev. Environ. Resour. 2005, 30, 441–473. [Google Scholar] [CrossRef]
  9. De Silva, M.J.; Breuer, E.; Lee, L.; Asher, L.; Chowdhary, N.; Lund, C.; Patel, V. Theory of Change: A theory-driven approach to enhance the Medical Research Councils’ framework for complex interventions. Trials 2014, 15, 267. [Google Scholar] [CrossRef] [PubMed] [Green Version]
  10. Raymond, C.M.; Fazey, I.; Reed, M.S.; Stringer, L.C.; Robinson, G.M.; Evely, A.C. Integrating local and scientific knowledge for environmental management. J. Environ Manag. 2010, 91, 1766–1777. [Google Scholar] [CrossRef] [PubMed]
  11. Pomeroy, R.; Douvere, F. The engagement of stakeholders in the marine spatial planning process. Mar. Policy 2008, 32, 816–822. [Google Scholar] [CrossRef]
  12. Keppel, G.; Alifereti, N.; Issac, R.; Pressey, R.L.; Thomas, N.T. Local and expert knowledge improve conservation assessment of rare and iconic Fijian tree species. Pac. Conserv. Biol. 2015. [Google Scholar] [CrossRef]
  13. Huntington, H.P. Using Traditional Ecological Knowledge in Science: Methods and Applications. Ecol. Appl. 2000, 10, 1270–1274. [Google Scholar] [CrossRef]
  14. Bodin, Ö.; Crona, B.I. The role of social networks in natural resource governance: What relational patterns make a difference? Glob. Environ Chang. 2009, 19, 366–374. [Google Scholar] [CrossRef]
  15. Mills, M.; Álvarez-Romero, J.G.; Vance-Borland, K.; Cohen, P.; Pressey, R.L.; Guerrero, A.M.; Ernstson, H. Linking regional planning and local action: Towards using social network analysis in systematic conservation planning. Biol. Conserv. 2014, 169, 6–13. [Google Scholar] [CrossRef]
  16. Armitage, D.R.; Plummer, R.; Berkes, F.; Arthur, R.I.; Charles, A.T.; Davidson-Hunt, I.J.; Diduck, A.P.; Doubleday, N.C.; Johnson, D.S.; Marschke, M.; et al. Adaptive co-management for social-ecological complexity. Front. Ecol. Environ. 2009, 7, 95–102. [Google Scholar] [CrossRef]
  17. Brewer, T.D. Dominant discourses, among fishers and middlemen, of the factors affecting coral reef fish distributions in Solomon Islands. Mar. Policy 2013, 37, 245–253. [Google Scholar] [CrossRef]
  18. Oldekop, J.A.; Holmes, G.; Harris, W.E.; Evans, K.L. A global assessment of the social and conservation outcomes of protected areas. Conserv. Biol. 2016, 30, 133–141. [Google Scholar] [CrossRef] [PubMed]
  19. Jones, P.J.S.; Qiu, W.; De Santo, E. Governing Marine Protected Areas: Getting the Balance Right. 2011. Available online: http://www.mpag.info/governing-mpas-final-technical-report-web-res.pdf (accessed on 1 April 2018).
  20. Lebel, L.; Anderies, J.M.; Campbell, B.; Folke, C.; Hatfield-Dodds, S.; Hughes, T.P.; Wilson, J. Governance and the capacity to manage resilience in regional social-ecological systems. Ecol. Soc. 2006, 11. [Google Scholar] [CrossRef]
  21. Bennett, N.J.; Dearden, P. Why local people do not support conservation: Community perceptions of marine protected area livelihood impacts, governance and management in Thailand. Mar. Policy 2014, 44, 107–116. [Google Scholar] [CrossRef]
  22. Ezebilo, E.E.; Mattsson, L. Socio-economic benefits of protected areas as perceived by local people around Cross River National Park, Nigeria. For. Policy Econ. 2010, 12, 189–193. [Google Scholar] [CrossRef]
  23. Plummer, R. The adaptive co-management process: An initial synthesis of representative models and influential variables. Ecol. Soc. 2009, 14. [Google Scholar] [CrossRef]
  24. Biggs, D.; Abel, N.; Knight, A.T.; Leitch, A.; Langston, A.; Ban, N.C. The implementation crisis in conservation planning: Could “mental models” help? Conserv. Lett. 2011, 4, 169–183. [Google Scholar] [CrossRef]
  25. Webler, T.; Danielson, S.; Tuler, S. Using Q Method to Reveal Social Perspectives in Environmental Research. Soc. Environ. Res. 2009, 1301, 1–54. [Google Scholar]
  26. Karnad, D.; Gangal, M.; Karanth, K.K. Perceptions matter: How fishermen’s perceptions affect trends of sustainability in Indian fisheries. Oryx 2014, 48, 218–227. [Google Scholar] [CrossRef]
  27. Gurney, G.G.; Cinner, J.; Ban, N.C.; Pressey, R.L.; Pollnac, R.; Campbell, S.J.; Tasidjawa, S.; Setiawan, F. Poverty and protected areas: An evaluation of marine integrated conservation and development project in Indonesia. Glob. Environ. Chang. 2014, 48, 218–227. [Google Scholar] [CrossRef]
  28. Jones, N.A.; Ross, H.; Lynam, T.; Perez, P.; Leitch, A. Mental Models: An interdisciplinary synthesis of theory and methods. Ecol. Soc. 2011, 16, 46. [Google Scholar] [CrossRef]
  29. Niemeijer, D.; De Groot, R.S. Framing environmental indicators: Moving from causal chains to causal networks. Environ. Dev. Sustain. 2008, 10, 89–106. [Google Scholar] [CrossRef]
  30. Armada, N.; White, A.T.; Christie, P. Managing Fisheries Resources in Danajon Bank, Bohol, Philippines: An Ecosystem-Based Approach. Coast Manag. 2009, 37, 308–330. [Google Scholar] [CrossRef]
  31. CCEF. A Profile of Danajon Bank Philippines. A Portfolio of the Coastal Resource/Socio-Economic Status and Coastal Resource Management Programs in Danajon Bank; Coastal Conservation and Education Foundation: Cebu City, Philippines, 2013. [Google Scholar]
  32. Sanders, J.S.; Greboval, D.; Hjort, A. Marine Protected Areas: Country Case Studies on Policy Governance and Institutional Issues: Japan, Mauritania, Philippines, Samoa; FAO Fisheries and Aquaculture Technical Paper No. 556/2; FAO: Rome, Italy, 2013; Available online: http://www.fao.org/3/a-i3212e.pdf (accessed on 1 April 2018).
  33. Christie, P.; Armada, N.; White, A.T.; Gulayan, A.; De Dios, H. Coastal Environmental and Fisheries Profile, Danajon Bank, Bohol, Philippines; Fisheries improved for Sustainable Harvest (FISH) Project: Cebu City, Philippines, 2006; pp. 1–63. Available online: http://oneocean.org/download/db_files/danajon_bank_profile.pdf (accessed on 1 April 2018).
  34. Mercado, E.S. A Case Study of Ubay, Bohol on Sustainable Coastal and Fishery Resource Management: A Contribution to the Philippines Country Environmental Analysis. 2008, pp. 1–18. Available online: http://siteresources.worldbank.org/INTPHILIPPINES/Resources/WBCEAUbayCaseStudyFINAL.pdf (accessed on 1 April 2018).
  35. Republic Act No. 7160. Local Government Code of 1991. Republic of the Philippines, 1991. Available online: http://www.lawphil.net/statutes/repacts/ra1991/ra_7160_1991.html (accessed on 1 April 2018).
  36. Operative Principles of Decentralization. Republic Act No. 7160. Local Government Code of 1991; Republic of the Philippines, 1991. Available online: http://www.lawphil.net/statutes/repacts/ra1991/ra_7160_1991.html (accessed on 1 April 2018).
  37. Magallona, M.M.; Malayang, B.S. Environmental Governance in the Philippines; Environmental Governance in Southeast Asia, Institute of Global Environmental Strategies: Tokyo, Japan, 2001; Available online: http://site.iugaza.edu.ps/tissa/files/2010/02/Environmental_Governance_in_the_Philippines.pdf (accessed on 1 April 2018).
  38. Pomeroy, R.S.; Pido, M.D. Initiatives towards fisheries co-management in the Philippines: The case of San Miguel Bay. Mar. Policy 1995, 19, 213–226. [Google Scholar] [CrossRef]
  39. Republic Act No. 8550. The Philippine Fisheries Code of 1998. Republic of the Philippines, 1998. Available online: http://www.lawphil.net/statutes/repacts/ra1998/ra_8550_1998.html (accessed on 1 April 2018).
  40. Qualifications, Powers and Duties. Republic Act No. 7160. Local Government Code of 1991; Republic of the Philippines, 1991. Available online: http://www.lawphil.net/statutes/repacts/ra1991/ra_7160_1991.html (accessed on 1 April 2018).
  41. The Chief Executive: Powers, Duties, Functions and Compensation. Republic Act No. 7160. Local Government Code of 1991; Republic of the Philippines, 1991. Available online: https://www.lawphil.net/statutes/repacts/ra1991/ra_7160_1991.html (accessed on 1 April 2018).
  42. Republic Act No. 7160. Local Government Code of 1991. Book 3, Title 5, Chapter 3, Article 3: The Sangguniang Bayan. Republic of the Philippines, 1991. Available online: http://www.lawphil.net/statutes/repacts/ra1991/ra_7160_1991.html (accessed on 1 April 2018).
  43. Zukowski, S.; Curtis, A.; Watts, R.J. Using fisher local ecological knowledge to improve management: The Murray crayfish in Australia. Fish. Res. 2011, 110, 120–127. [Google Scholar] [CrossRef]
  44. ECOFISH Public-Private Partnership Strategy. Ecosystems Improved for Sustainable Fisheries (ECOFISH) Project; United States Agency International Development, 2013. Available online: http://pdf.usaid.gov/pdf_docs/PA00K5C9.pdf (accessed on 1 April 2018).
  45. Balgos, M.C.; Pagdilao, C.R. Provincial and Regional Institutions in the Philippines: An Essential Element in Coastal Resource Management and Marine Conservation. Institutional Frameworks for Community Based Coastal Resources Management and Marine Conservation in the Visayas Region. pp. 1–34. Available online: http://www.crc.uri.edu/download/Philippines_Background_Paper.pdf (accessed on 1 April 2018).
  46. Langjahr, K.K. Improved enforcement and financial support of marine sanctuaries: Perceived factors in eliminating illegal fishing in the Danajon Bank, Philippines. In Proceedings of the 20th International Conference of the Coastal Society, St. Pete Beach, FL, USA, 17 May 2006; pp. 230–234. [Google Scholar]
  47. Lowry, G.K.; White, A.T.; Christie, P. Scaling Up to Networks of Marine Protected Areas in the Philippines: Biophysical, Legal, Institutional, and Social Considerations. Coast. Manag. 2009, 37, 274–290. [Google Scholar] [CrossRef]
  48. Yasue, M.; Kaufman, L.; Vincent, A.C.J. Assessing ecological changes in and around marine reserves using community perceptions and biological surveys. Aquat. Conserv. Mar. Freshw. Ecosyst. 2010, 20, 407–418. [Google Scholar] [CrossRef]
  49. Folke, C.; Pritchard, L.; Berkes, F.; Colding, J.; Svedin, U. The problem of fit between ecosystems and institions: Ten years later. Ecol. Soc. 2007, 12, 30. [Google Scholar] [CrossRef]
  50. Horigue, V.; Aliño, P.M.; White, A.T.; Pressey, R.L. Marine protected area networks in the Philippines: Trends and challenges for establishment and governance. Ocean Coast. Manag. 2012, 64, 15–26. [Google Scholar] [CrossRef]
  51. Golder, B.; Gawler, M. Cross-Cutting Tool Stakeholder Analysis. WWF Standards of Conservation Project and Programme Management. 2005. Available online: www.panda.org/standards/1_4_stakeholder_analysis (accessed on 1 April 2018).
  52. NHMRC. National Statement on Ethical Conduct in Research Involving Humans. NHMRC Act, 1992 (Cth); 1999. Available online: https://www.nhmrc.gov.au/_files_nhmrc/publications/attachments/e35.pdf (accessed on 1 April 2018).
  53. Özesmi, U.; Özesmi, S.L. Ecological models based on people’s knowledge: A multi-step fuzzy cognitive mapping approach. Ecol. Model. 2004, 176, 43–64. [Google Scholar] [CrossRef]
  54. Dray, A.; Perez, P.; Iones, N.; Le Page, C.; D’Aquino, P.; Auatabu, T. The atollgame experience: From knowledge engineering to a computer-assisted role playing game. J. Artif. Soc. Soc. Simula. 2006, 9, 149–158. [Google Scholar]
  55. Porter, S.; Whitcomb, M.; Weitzer, W. Multiple surveys of students and survey fatigue. New Dir. Inst. Res. 2004, 2004, 63–73. [Google Scholar] [CrossRef]
  56. Hill, R.; Davies, J.; Bohnet, I.C.; Robinson, C.J.; Maclean, K.; Pert, P.L. Collaboration mobilises institutions with scale-dependent comparative advantage in landscape-scale biodiversity conservation. Environ. Sci. Policy 2015, 51, 267–277. [Google Scholar] [CrossRef]
  57. Bohensky, E.L.; Kirono, D.G.C.; Butler, J.R.A.; Rochester, W.; Habibi, P.; Handayani, T.; Yanuartati, Y. Climate knowledge cultures: Stakeholder perspectives on change and adaptation in Nusa Tenggara Barat, Indonesia. Clim. Risk Manag. 2016, 12, 17–31. [Google Scholar] [CrossRef]
  58. Adams, W.M.; Brockington, D.; Dyson, J.; Vira, B. Managing Tragedies: Understanding Conflict over Common Pool Resources. Science 2003, 302, 1915–1916. [Google Scholar] [CrossRef] [PubMed]
  59. Kroon, F.J.; Robinson, C.J.; Dale, A.P. Integrating knowledge to inform water quality planning in the Tully–Murray basin, Australia. Mar. Freshw. Res. 2009, 60, 1183–1188. [Google Scholar] [CrossRef]
  60. Lamarque, P.; Tappeiner, U.; Turner, C.; Steinbacher, M.; Bardgett, R.D.; Szukics, U.; Schermer, M.; Lavore, S. Stakeholder perceptions of grassland ecosystem services in relation to knowledge on soil fertility and biodiversity. Reg. Environ. Chang. 2011, 11, 791–804. [Google Scholar] [CrossRef]
  61. Sutton, S.G.; Tobin, R.C. Recreational fishers’ attitudes towards the 2004 rezoning of the Great Barrier Reef Marine Park. Environ. Conserv. 2009, 36, 245–252. [Google Scholar] [CrossRef]
  62. Gratani, M.; Butler, J.R.A.; Royee, F.; Valentine, P.; Burrows, D.; Canendo, W.I.; Anderson, A.S. Is validation of indigenous ecological knowledge a disrespectful process? A case study of traditional fishing poisons and invasive fish management from the wet tropics, Australia. Ecol. Soc. 2011, 16, 25. [Google Scholar] [CrossRef]
  63. Gurney, G.G.; Cinner, J.E.; Sartin, J.; Pressey, R.L.; Ban, N.C.; Marshall, N.A.; Prabuning, D. Participation in devolved commons management: Multiscale socioeconomic factors related to individuals’ participation in community-based management of marine protected areas in Indonesia. Environ. Sci. Policy 2016, 61, 212–220. [Google Scholar] [CrossRef]
  64. Diedrich, A.; Stoeckl, N.; Gurney, G.G.; Esparon, M.; Pollnac, R. Social capital as a key determinant of perceived benefits of community-based marine protected areas. Conserv. Biol. 2017, 31, 311–321. [Google Scholar] [CrossRef] [PubMed]
  65. Tyler, T.R. Social justice. In APA Handbook of Personality and Social Psychology: Group Processes; APA Handbooks in Psychology; Mikulincer, M., Shaver, P.R., Dovidio, J.F., Simpson, J.A., Eds.; American Psychological Association: Washington, DC, USA, 2015; Volume 2. [Google Scholar]
  66. Barnes-Mauthe, M.; Shawn, A.; Stewart, A.; PingSun, L. A Network Analysis of Fisher’s Social Capital and the Effects of Ethnic Diversity in Hawaii’s Longline Fishery; SOEST Publication 12-03, JIMAR Contribution 12-381; Pelagic Fisheries Research Program: Honolulu, Hawaii, 2012; Available online: http://www.soest.hawaii.edu/PFRP/soest_jimar_rpts/barnes_arita_leung_ethnic_longline.pdf (accessed on 1 April 2018).
  67. Berdej, S.M.; Armitage, D.R. Bridging organizations drive effective governance outcomes for conservation of Indonesia’s marine systems. PLoS ONE 2016, 11. [Google Scholar] [CrossRef] [PubMed]
  68. Johnson, A.; Wouters, M. Strengthening community capacity to undertake conservation work: Sharing conservation skills and knowledge. Sci. Conserv. 2008, 287, 1–74. [Google Scholar]
  69. Gebresenbet, F.; Bauer, H.; Hunter, L.; Gebretensae, K. Lion conservation workshop in Ethiopia. Cat News 2010, 52, 30. Available online: http://www.rocal-lion.org/documents/Lion_Ethiopia_Proceedings_web.pdf (accessed on 1 April 2018).
  70. Githiru, M.; Lens, L. Application of fragmentation research to conservation planning for multiple stakeholders: An example from the Taita Hills, southeast Kenya. Biol. Conserv. 2007, 134, 271–278. [Google Scholar] [CrossRef]
  71. Alem, L.; Kravis, S.; McLean, A. Knowledge Sharing Technologies to Support Community Participation in Natural Resource Management: A Research Agenda. In Proceedings of the Australian Conference on Knowledge Management and Intelligent decision Support, Melbourne, Australia, 11–12 December 2003; pp. 30–41. [Google Scholar]
  72. Ostrom, E. A behavioral approach to the rational choice theory of collective action. Am. Polit. Sci. Rev. 1998, 92, 1–22. [Google Scholar] [CrossRef]
  73. Nooy, W. Communication in natural resource management: Agreement between and disagreement within stakeholder groups. Ecol. Soc. 2013, 18. [Google Scholar] [CrossRef]
Figure 1. The Danajon Bank, Philippines and locations where data were elicited.
Sustainability 10 01222 g001
Figure 2. Present and potential governance frameworks for the Danajon Bank. SB refers to the Sangguniang Bayan, MAO refers to Municipal Agriculture Officers and PO refers to People’s Organizations. (A) The governance framework relating to decision-making and communication. This framework was derived from the Local Government Code of 1991, Republic Act 7160, and modified with data from field work to include bridging actors that facilitate communication between the local government, environmental personnel and fishers. (B) A modified governance framework that might improve decision-making and communication based on results from our study and the literature. Black arrows refer to interactions that are unchanged from Diagram (A). Green arrows refer to bridging actors communicating with stakeholder types to assist in identifying formal representatives. Orange arrows refer to formal representatives attending knowledge-sharing activities to share information, grievances and needs. Blue arrows refer to formal representatives returning to their affiliated stakeholder types to relay what was discussed during knowledge-sharing activities. The modified diagram depicts how more informed decisions could be made to benefit all stakeholders.
Sustainability 10 01222 g002aSustainability 10 01222 g002b
Figure 3. Mental model depicting perceptions of three fisher groups about fish decline in the Danajon Bank. Light blue indicates driver and causal effect nodes perceived by only one group; medium blue indicates perceptions by two groups; dark blue indicates perceptions by all three groups. Dashed lines connecting driver and causal effect nodes indicate perception by only one group; thin, solid lines indicate perceptions of connections by two groups; thick, solid lines indicate perceptions of connections by all three groups. Unidentified nodes and connections are illustrated for comparison with perceptions of local government and environmental stakeholders. A description of each node can be found in Appendix B.
Sustainability 10 01222 g003
Figure 4. Mental model depicting perceptions of three local government groups about fish decline in the Danajon Bank. Light blue indicates driver and causal effect nodes perceived by only one group; medium blue indicates perceptions by two groups; dark blue indicates perceptions by all three groups. Dashed lines connecting driver and causal effect nodes indicate perception by only one group; thin, solid lines indicate perceptions of connections by two groups; thick, solid lines indicate perceptions of connections by all three groups. Unidentified nodes and connections are illustrated for comparison with perceptions of fisher and environmental stakeholders. A description of each node can be found in Appendix B.
Sustainability 10 01222 g004
Figure 5. Mental model depicting perceptions of two environmental groups about fish decline in the Danajon Bank area. Light blue indicates driver and causal effect nodes perceived by only one group; medium blue indicates perceptions by two groups. Dashed lines connecting driver and causal effect nodes indicate perception by only one group; thin, solid lines indicate perceptions of connections by two groups. Unidentified nodes and connections are illustrated for comparison with perceptions of fisher and local government stakeholders. A description of each node can be found in Appendix B.
Sustainability 10 01222 g005
Figure 6. Cluster analysis of perceptions of main drivers of fish decline. (A) Presence of main drivers; (B) Impact of main drivers. Groupings are based on the Bray–Curtis measure of similarity and group average clustering. Similarity on Y-axes ranges from 0–100%. Coloured links indicate clusters of similar perceptions when each dendrogram is cut horizontally at 55% similarity (green lines).
Sustainability 10 01222 g006aSustainability 10 01222 g006b
Figure 7. Cluster analysis of perceptions of interventions useful in mitigating one or more main drivers of fish decline. (A) Presence of interventions; (B) Impact of interventions. Groupings are based on the Bray–Curtis measure of similarity and group average clustering. Y-axes represent similarity of perceptions among groups, ranging from 0 to 100%. Coloured links indicate clusters of similar perceptions when each dendrogram is cut horizontally at 55% similarity (green lines).
Sustainability 10 01222 g007
Figure 8. Perceived communication patterns between stakeholder groups (uncoloured ovals). Arrows from groups indicate the perceptions of those groups. Thick arrows indicate perception of very effective communication. Thin arrows indicate perception of somewhat effective communication. Dashed arrow indicates perception of ineffective communication. Key actors who facilitated communication are indicated with coloured ovals.
Sustainability 10 01222 g008
Table 1. Perceptions of three types of stakeholders about main drivers of fish decline in the Danajon Bank. Light blue indicates identification by one group; medium blue indicates identification by two groups; dark blue indicates perception by three groups. Note that there were only two environmental groups, so medium blue indicates identification by both.
Perceived Drivers Stakeholder Types
FisherLocal GovernmentEnvironmental
Distal drivers
Human population increase
Climate change
Increase of natural disasters
Conflicting government policies
Don’t understand causal effects
Lack of opportunity
Inability to implement regulations
Poverty
Weak leadership approach
Proximate drivers
Dynamite fishing
Chemical fishing
Trawl fishing
Pollution
Commercial fishing
Mangrove cutting
Encroachment
Non-compliance
Weak enforcement
Bad farming practices
Coral and sand quarrying
Table 2. Perceptions of three types of stakeholders about interventions useful to mitigate one or more main drivers of fish decline in the Danajon Bank. Light blue indicates identification by one group; medium blue indicates identification by two groups; dark blue indicates perception by three groups. Note that there were only two environmental groups, so medium blue indicates identification by both.
Perceived Interventions Stakeholder Types
FisherLocal GovernmentEnvironmental
Law enforcement
Laws and regulations
Marine reserves
Information education and communication activities
Gear swapping
Coastal clean-up
Alternative Livelihoods
Reproductive health laws
Market denial
Birth control
Tree planting
Recycling programs
Temporal closures
Integrated coastal management plans
Poverty alleviation programs
Fisher registration
Fisher/ People Organizations
Allocation of resources to coastal resource management
Research
Stakeholder networking
Monitor and evaluation
Coastal resource management plans