Effects of ERV Filter Degradation on Indoor CO2 Levels of a Classroom


1
Department of Architectural Engineering, Inha University, Incheon 22212, Korea
2
Air Solution B2B Sales Engineering Team, LG Electronics, Seoul 07336, Korea
*
Author to whom correspondence should be addressed.
Sustainability 2018, 10(4), 1215; https://doi.org/10.3390/su10041215
Submission received: 27 March 2018
/
Revised: 12 April 2018
/
Accepted: 13 April 2018
/
Published: 17 April 2018
(This article belongs to the Section Sustainable Engineering and Science)
Abstract
:Energy recovery ventilators (ERVs) are widely used to reduce energy losses caused by ventilation and improve indoor air quality for recently-constructed buildings. It is important for spaces with high occupancy density and longer residence times, such as classrooms. In classrooms, the ERV size is typically estimated by the target number of students in the design phase, but the design air volume flow rates (m3/h) of the ERV can decrease over time owing to filter degradation such as increased dust loading. In this study, field tests are conducted in a classroom to investigate filter degradation through a visual inspection and by measuring the air volume flow rates at the diffusers connected to the ERV. In addition, variations in carbon dioxide (CO2) concentrations are also measured to verify the effects of filter degradation on the indoor CO2 levels over the entire test period, which includes filter replacement, as well. As the tests are conducted during classes, several adjusting methodologies are proposed to match the different test conditions. The results show that the total air volume flow rate of the ERV increases after the filter replacement (546 to 766 m3/h), but it again decreases as time elapses (659 m3/h). Accordingly, the indoor CO2 concentration decreases after the filter replacement by more than 300 ppm (1404 to 1085 ppm), clearly showing the effect of filter degradation. However, this CO2 concentration remains similar for four months after the replacement, and the total air volume rate decreases again. An interpretation is made using computational fluid dynamics analysis that the measured CO2 concentrations are affected by airflow patterns. The airflow in the cooling system may dilute CO2 concentrations at the measuring location. Thus, periodic filter replacement and management are important to ensure the desired ERV air volume rates and consequently the desired indoor CO2 concentrations.
1. Introduction
With an increased requirement for reducing building energy consumption, buildings have become more airtight, and the infiltration rates have decreased [1]. A decrease in air exchange rates of a building is good for energy conservation, but the contaminated air may remain indoors for a long time, such as PM2.5, radon, formaldehyde, nitrous oxides, volatile organic compounds and carbon dioxide (CO2), which are harmful to the health of the occupants [2,3,4,5]. Especially, CO2, which is mainly produced by the respiration of occupants, may get accumulated in that space. High levels of CO2 concentration are observed in a space with high occupancy density. This may cause problems such as headaches, fatigue, eye symptoms, throat symptoms and breathing difficulties. Consequences of such problems may be more serious when the room is used for mental work. For instance, Satish et al. [6] attempted to assess the effects of increased CO2 on decision-making performance by means of chamber tests with six groups of four participants. The results showed statistically meaningful reductions in the performance. A common place for such cases is a classroom. Several studies reported negative effects of high CO2 level on educational attainment [7,8,9,10,11,12].
Many studies have been previously conducted on the CO2 concentrations in school facilities. Turanjanin et al. [13] measured the CO2 concentrations in classrooms of five schools in Serbia, which are naturally ventilated. Similarly, Shendell et al. [14] measured CO2 concentrations in schools in Washington (WA) and Idaho (ID). The test classrooms were equipped with ventilation systems, and 45% of the classrooms showed CO2 concentrations above 1000 ppm (35% in WA and 59% in ID). Corsi et al. [15] measured CO2 concentrations in 115 elementary schools that are equipped with ventilation systems at a breathing zone located between 0.8 and 1.2 m from the floor of the classroom, and the mean value of CO2 concentrations was 1440 ppm in that study. Santamouris et al. [16] analyzed 65 research papers that measured CO2 levels in classrooms, of which 29 papers were naturally ventilated cases through window openings and 36 papers were related to mechanical ventilation systems. For the naturally ventilated cases that were collected from 287 classrooms among 182 schools in 17 countries, 25% of the classrooms showed lower than 1000 ppm, 47% showed higher than 1500 ppm and 18% showed more than 2000 ppm in CO2 concentrations. For cases with mechanical ventilation systems, 52% of the total 900 classrooms showed less than 1000 ppm, 15% more than 1500 ppm and 18% showed more than 1800 ppm in CO2 concentrations. Grimsrud et al. [17] measured CO2 concentrations for eight mechanically ventilated schools in Minnesota, and it measured between 2500 and 3000 ppm when the ventilation systems were not operated and between 1500 and 1700 ppm when operated. Briefly, most of the classrooms that are ventilated naturally through window openings or with mechanical ventilation systems are effective at keeping CO2 concentrations within a certain range, for instance 1000 to 2000 ppm. The unventilated classrooms or those with switched-off mechanical systems showed high CO2 concentrations out of this range. Therefore, either proper natural ventilation or the operation of mechanical ventilation is required to keep the indoor CO2 levels within a desired range for classrooms.
The American Society of Heating, Refrigerating and Air-Conditioning Engineers (ASHRAE) [18] recommended a minimum ventilation rate of 5 L/s per person or 0.6 L/s/m2 for educational facilities. This ventilation rate would correspond to approximately 1000 to 1200 ppm of CO2 levels in a typical classroom. According to the Building Bulletin 101 (BB101) guidelines on ventilation, thermal comfort and indoor air quality in schools (2017) [19], a mechanical ventilation system must keep below a daily average value of 1000 ppm as the CO2 level. For naturally ventilated classrooms without mechanical systems, this level must not exceed a daily average value of 1500 ppm as the CO2 level.
In Korea, according to the School Health Act of the Ministry of Education, it is recommended to maintain CO2 concentrations for classrooms below 1000 ppm, but it is allowed up to 1500 ppm for classrooms equipped with mechanical ventilation systems [20]. This regulation aims to promote installation of mechanical ventilation systems. The government uses a favored regulation for mechanical ventilation systems because natural ventilation can considerably increase a building’s energy consumption in the considered climate [21]. Another reason is that natural ventilation mainly occurs through window openings. Outdoor air is no longer fresh in Korea, particularly from winter to spring, because the outdoor concentration of particulate matter is high [22]. Therefore, ventilation through controlled air paths is favored so that energy recovery and air filtration can be applied.
In many countries, mechanical ventilation systems include energy recovery systems, and the whole system is commonly called an energy recovery ventilator (ERV). Here, energy indicates both sensible and latent heat [23,24,25,26,27]. Zhang and Niu [28] analyzed energy saving rates for an ERV system. The annual performance of a membrane-based energy recovery ventilation (MERV) system was analyzed, which covers a 100 square meter office with an occupancy density of 10 square meters per person for approximately six regions in Hong Kong. The MERV system saved about 58% of the energy required for conditioning fresh air, while only about 10% of energy is saved with a traditional sensible-only heat recovery ventilation system. In Korea, the ERV system has largely been installed for its high energy saving effects.
To protect the energy recovery exchanger inside the ERV system from indoor and outdoor dust and to induce only fresh air indoors, filters are installed at both the intake (supply) and outtake (exhaust) air sides of the ERV system. The recommended CO2 concentration in a classroom can be achieved by properly sizing air volume flow rates of the ERV system for a given number of occupants. Sizing the total airflow rate of the ERV system can be achieved by multiplying the CO2 emission rate per person and the expected number of occupants of the classroom. However, ventilation filters can degrade over time, particularly in classrooms, as indoor dust is abundant owing to high occupancy density and activities. Therefore, the following assumptions can be made. A proper maintenance of the filters is crucial to guarantee the ventilation performance set during the design because the filter state may affect the total air volume flow rate of the ERV system and consequently the indoor CO2 concentrations.
In this study, field tests are conducted to investigate such assumptions. The test is to observe the degradation rate of the ERV filters over time and resulting variations of the indoor CO2 levels. A few analysis methodologies are proposed to calibrate the test conditions that do not remain the same over long periods of tests. First, the field test case is introduced, and the filter degradation is observed by measuring the airflow rates at air inlet and outlet diffusers of a classroom. Further, the indoor CO2 concentration is measured and its variation over time is analyzed. The analysis of the results using the proposed analysis methodologies is given in the Results Section.
2. Filter Degradation over Time
2.1. Description of Test Classroom
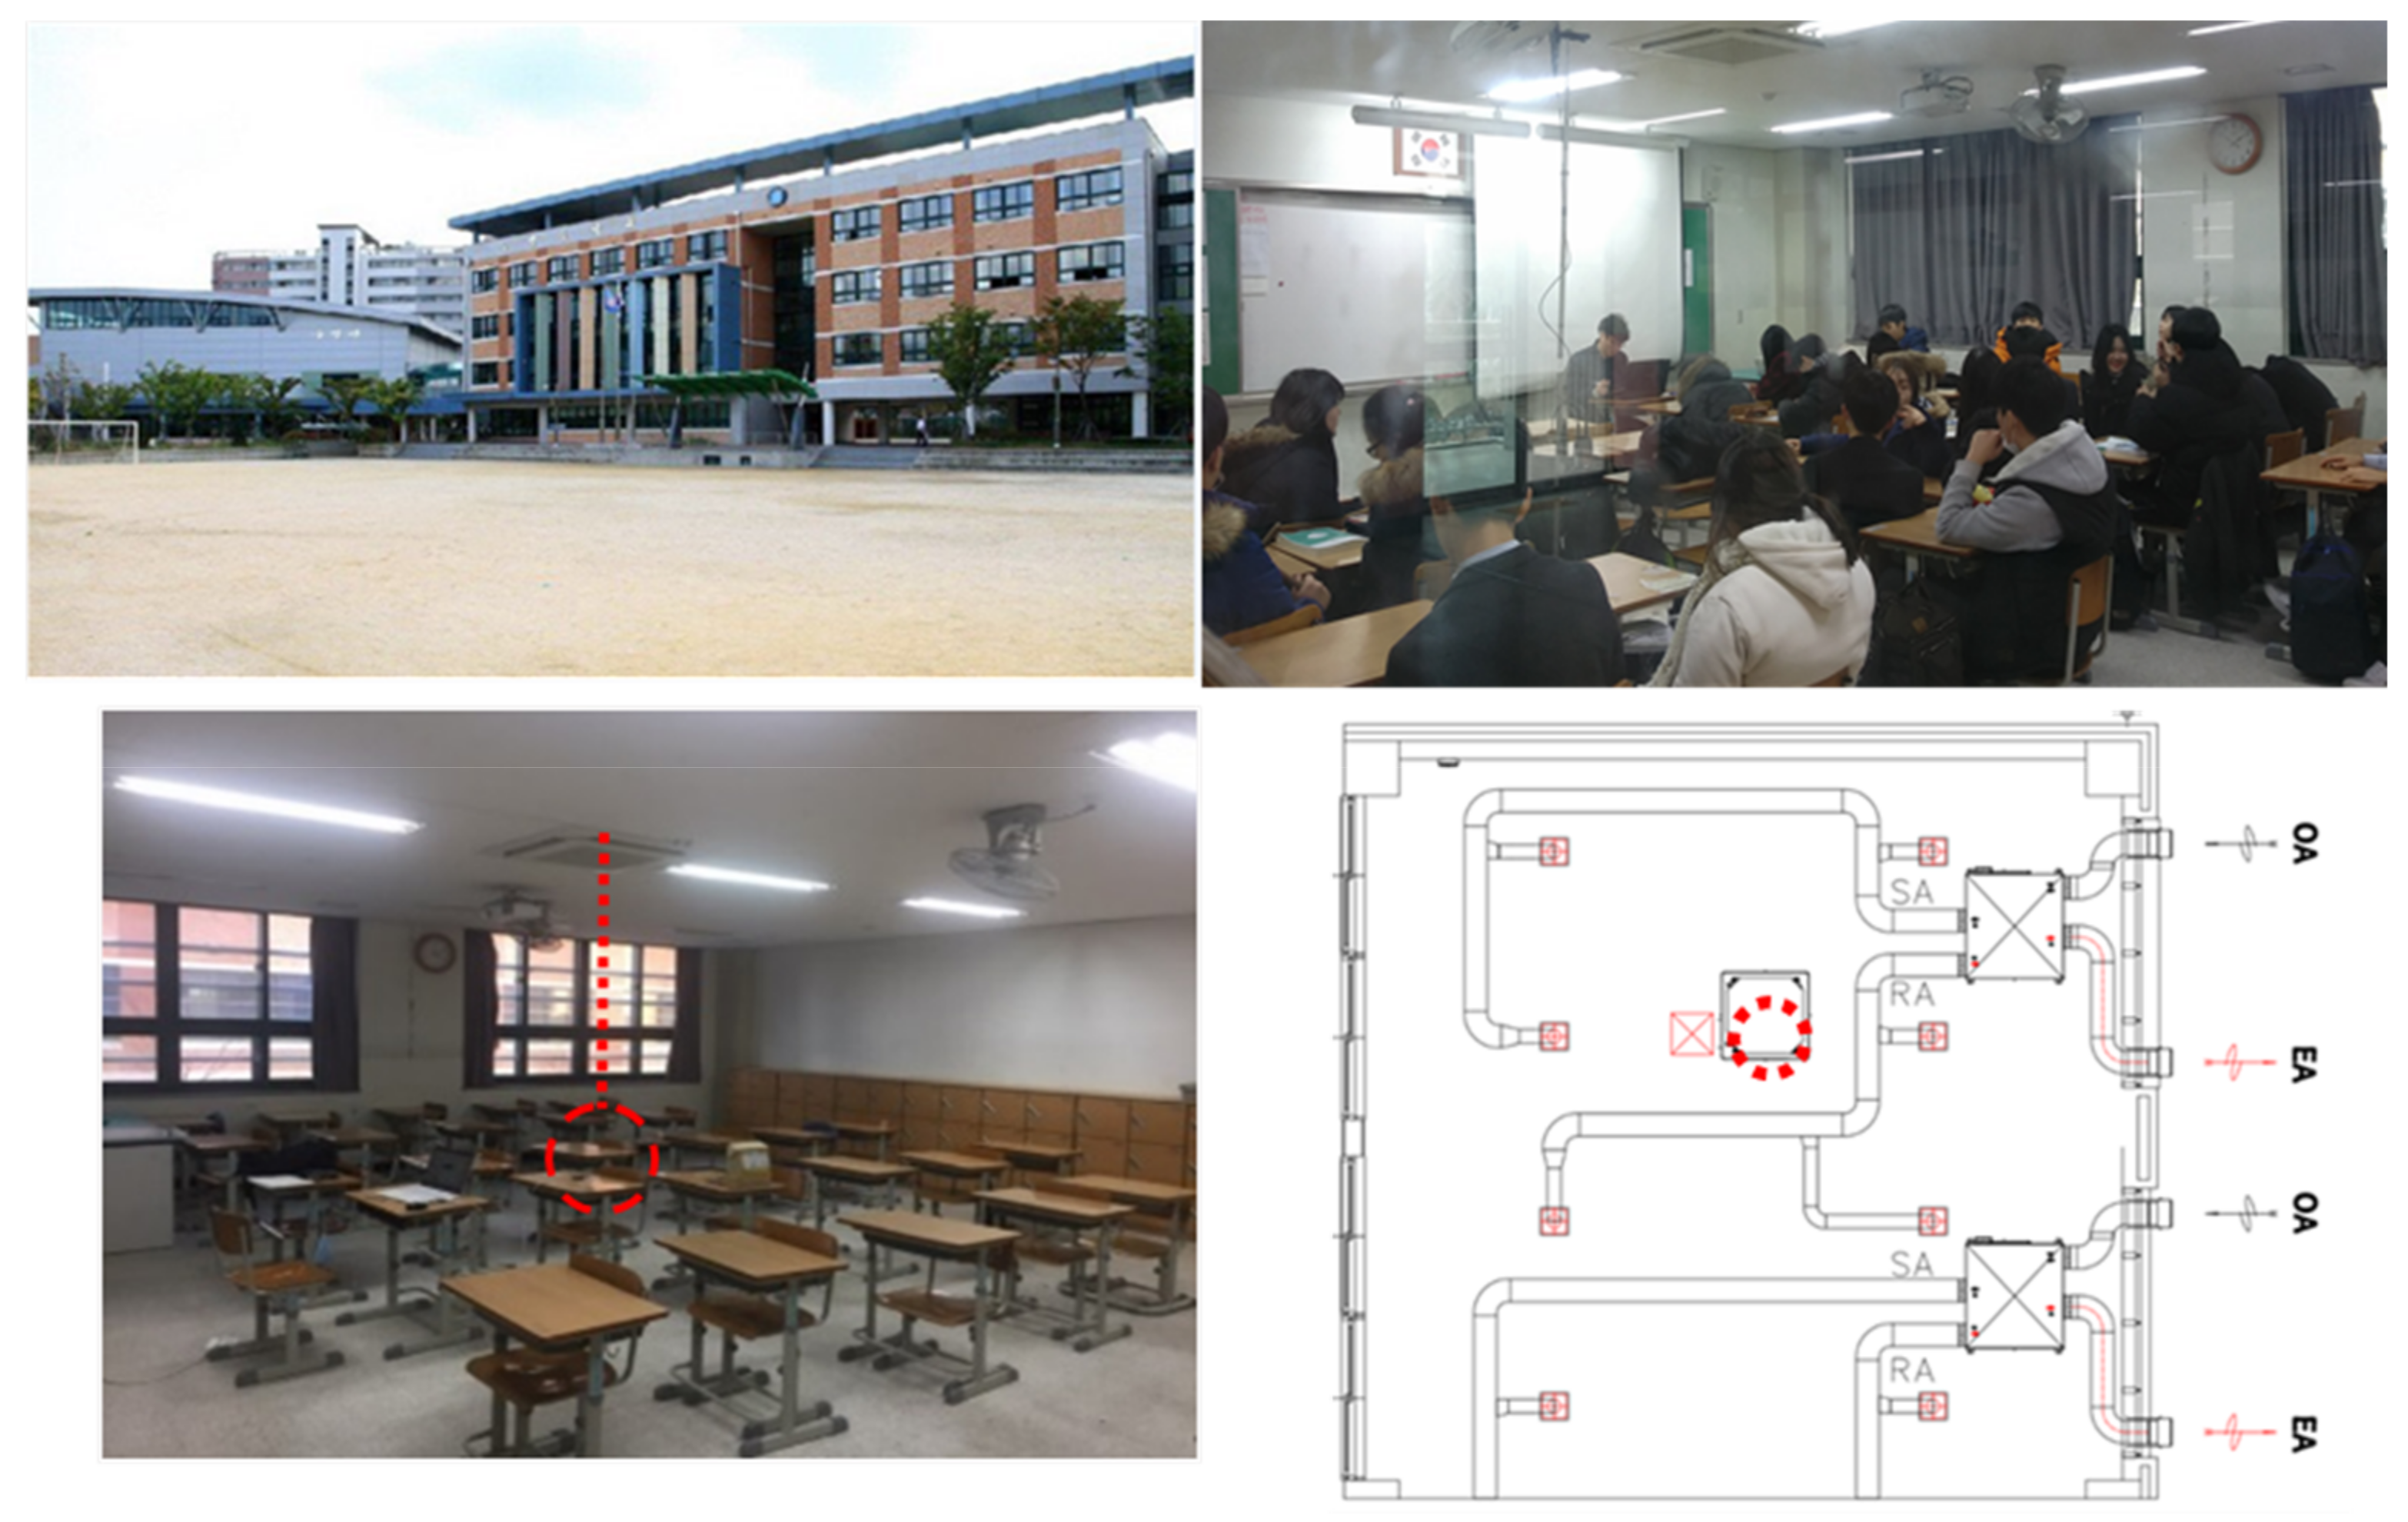
For the field test, a middle school located in Seoul, Korea, was selected. The school was built more than 20 years ago, but the test classroom is located on the second floor in a newly-attached building that was constructed three years ago. The classroom and connection area are well insulated, and ERV systems are installed in the classroom. Some images and detailed ERV duct configurations are shown in Figure 1. A total of two ERVs is installed in the ceiling space of the classroom, one of which also serves the adjacent classroom. However, both ERVs are operated according to the control of the test classroom. The first ERV is connected with three pairs of supply and exhaust ducts, while the other ERV is linked to a single set of ducts of the test classroom, as shown in Figure 1.
Both heating and cooling energies are provided by a multi-type electric heat pump (EHP) that is located at the center of the classroom. The CO2 concentrations are measured below this EHP, where the indoor air is drawn from almost every direction to the inlet air grill of the EHP, when heating and cooling are operated. The installation of CO2 sensors is limited to this restricted zone unless the classes are disturbed as this field test was conducted for several months. In this study, various additional simulation tests are presented to analyze the test results because some results cannot be fully understood under such limited measuring conditions.
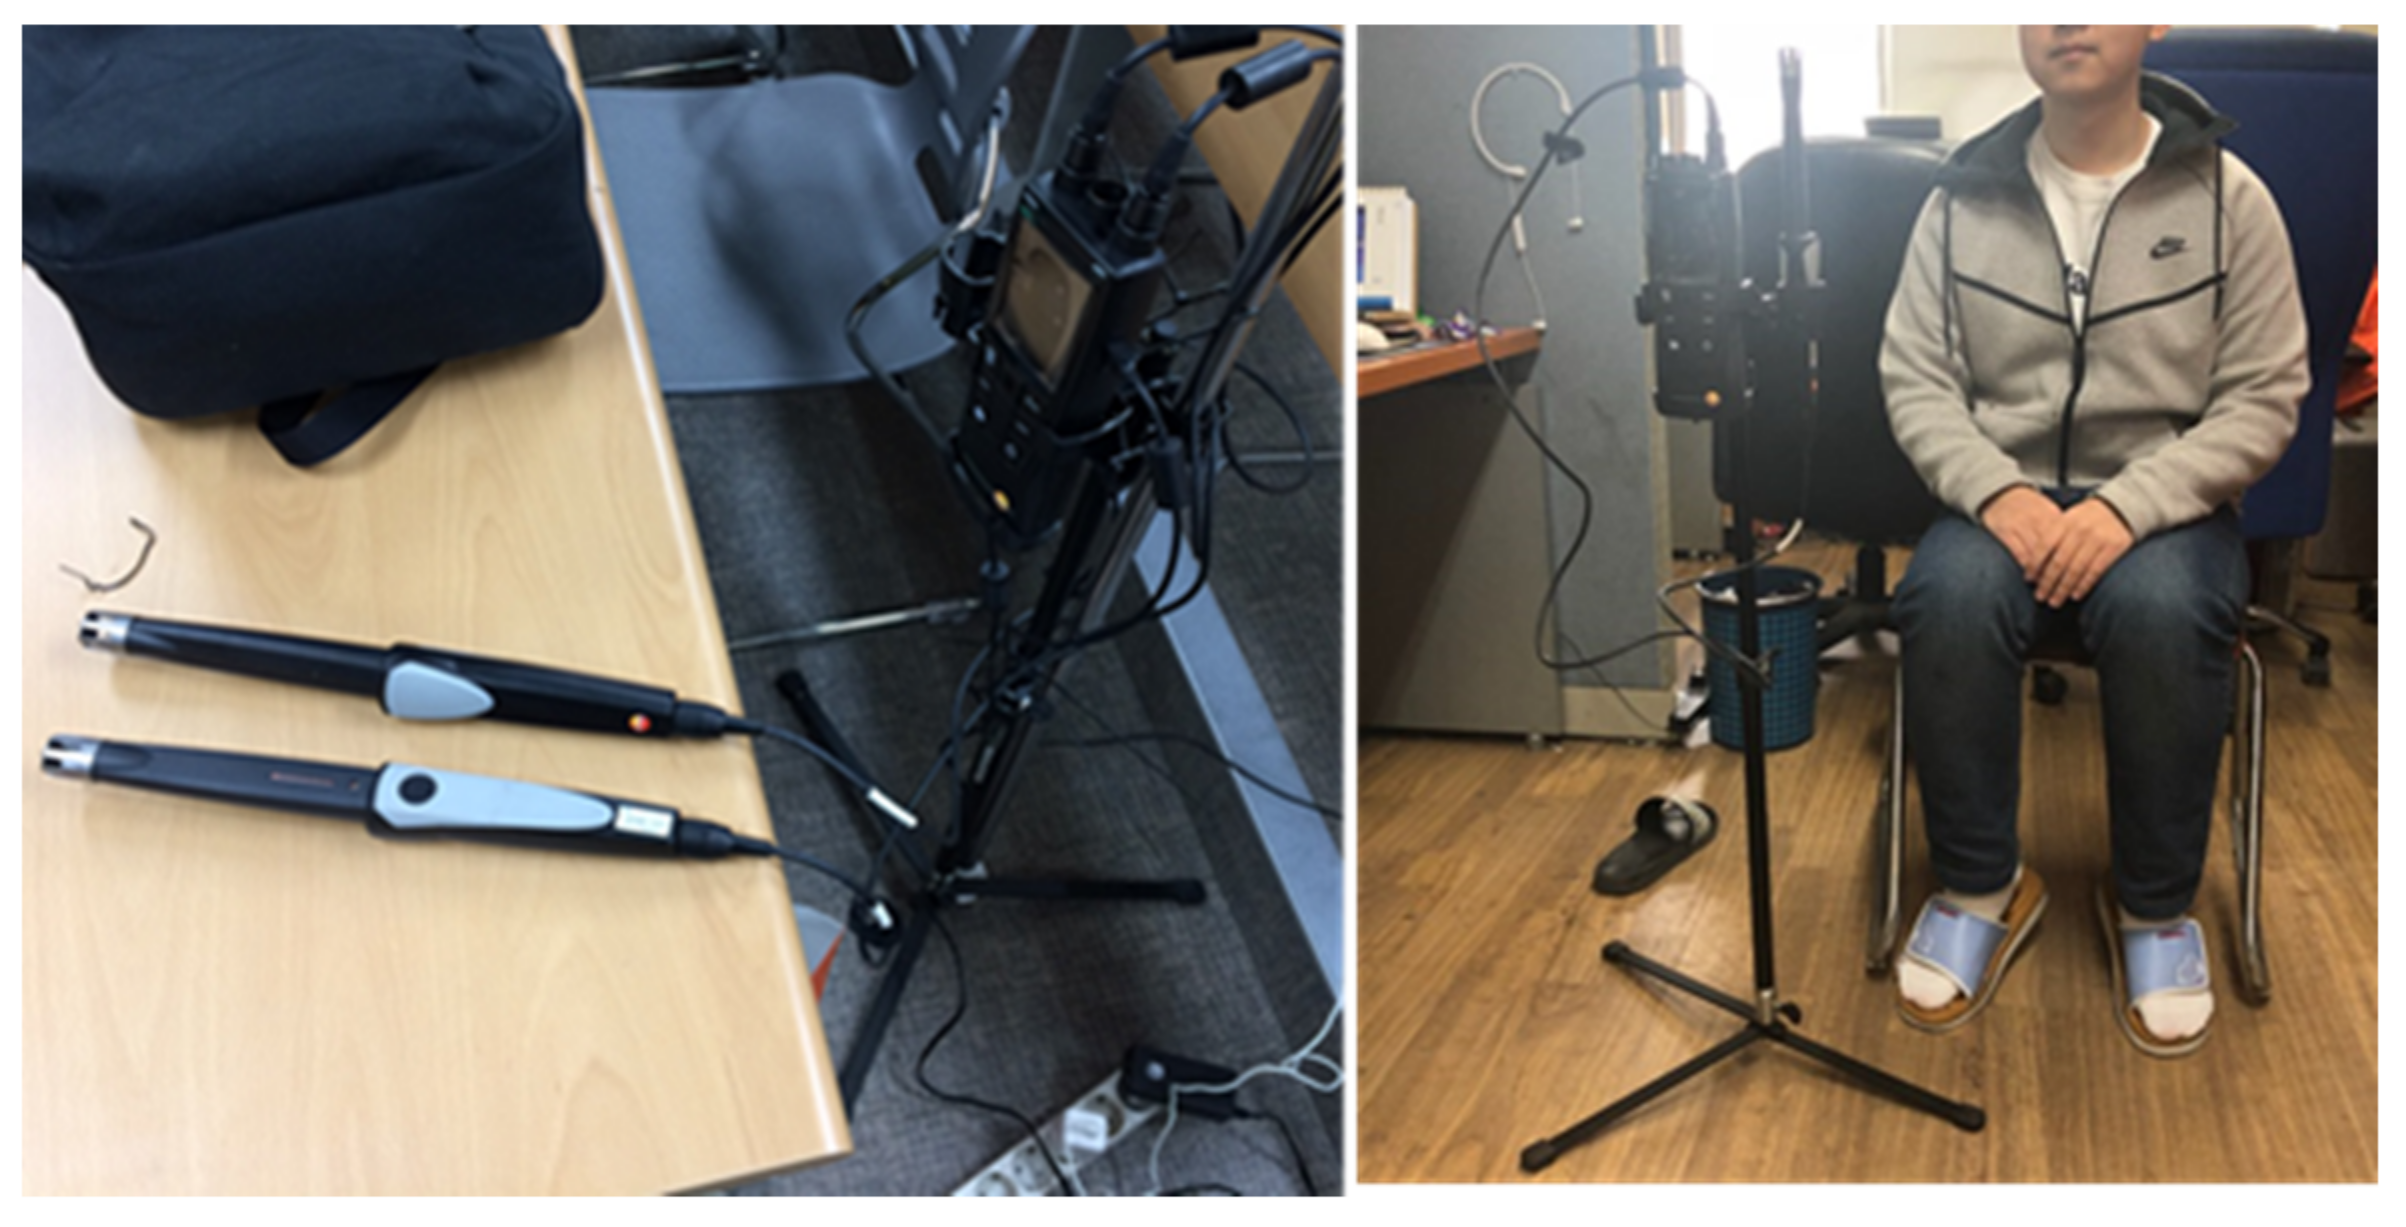
As shown in Figure 2, the measuring height is 1.1 m near the occupancy zone when the occupants are sitting, but the sensor is located away from students’ exhaled breath. The measuring instrument used is a ‘Testo 480’ IAQ probe, for which the measurement range is between 0 and 10,000 ppm with an accuracy of ±3%. The systems of this test classroom are described in Table 1. The ERV capacity is given in CMH, which represents m3/h (cubic meter per hour), customarily used among manufacturers.
2.2. Measurement of Air Volume Flow Rates According to Filter Degradation
In a space with high occupancy density, the filters of the ERV system may be rapidly contaminated and degraded by the dust and pollution sources generated in the inner space, as well as by outdoor pollution. Filter contamination and performance degradation may result in reduced air volume flow rates in the ERV system. Therefore, we measure air volume flow rates for observing the degradation level instead of the typical method of measuring static pressure drop across the filters.
The existing filters of the ERV system and newly-replaced filters are compared, and the new filters are also tested four months after the filter replacement. Above all, a visual inspection is conducted for the comparisons, as shown in Figure 3. Figure 3a shows the current state of the mounted filters that have been used for over three years. Generally, a manufacturer recommends replacing the filter every six months, especially for classrooms; however, it is hardly fulfilled in practice. The top filter in Figure 3a was placed on the exhaust air side, and it is more deteriorated indicating more pollution indoors. After replacement (see Figure 3b), the new filters are quickly deteriorated in four months (Figure 3c). Here, the filter on the exhaust air side also becomes more degraded.
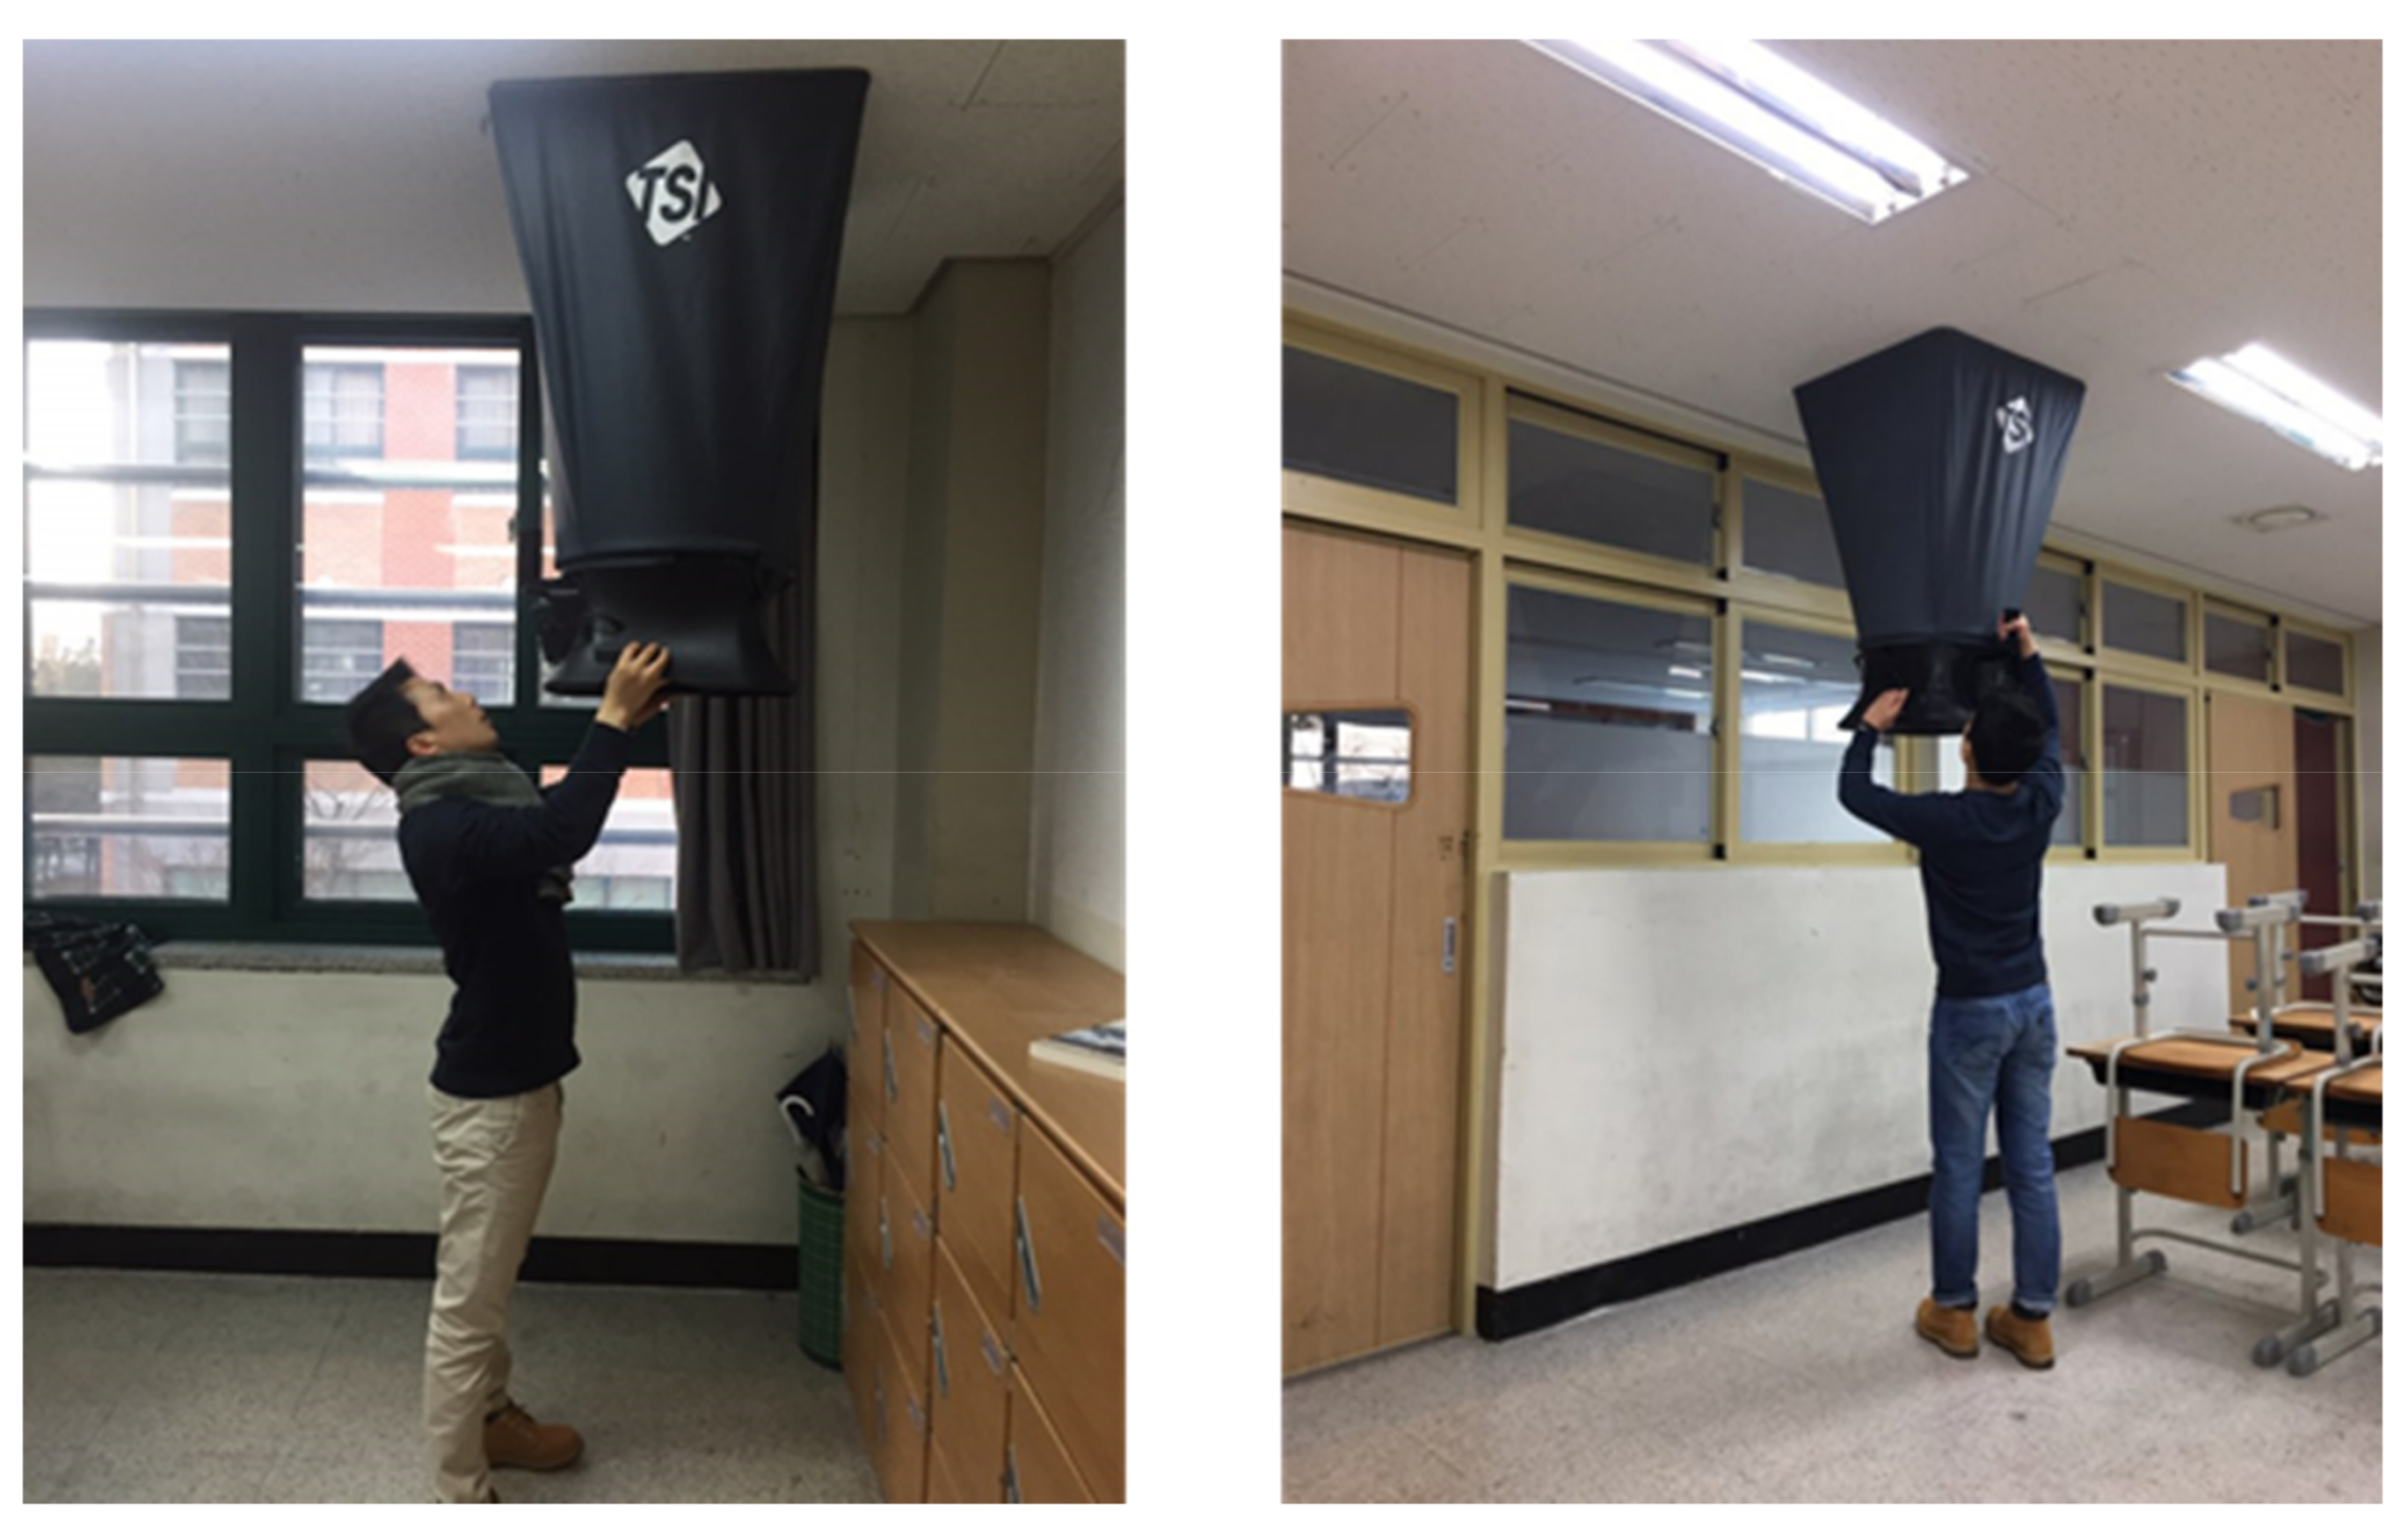
To quantitatively test the levels of degradation, we measured the air volume flow rates at every diffuser of supply, as well as exhaust air at the three different points of time considered in this study (before and after the replacement and four months after the filter replacement). These tests were achieved with the ERV operation at maximum capacity and at a similar time of the day. The air volume flow rates were measured using an airflow measurement instrument (TSI barometer capture hoop), which has an accuracy of ±3%. This test instrument is shown in Figure 4. The hood is used to draw or blow the supply or exhaust air, and the measuring sensor is placed at the inlet part of the instrument. The air volume flow rates were measured twice for each diffuser, as shown in Figure 4. These measurement results may indirectly show the levels of degradation of the filters. Lower air volume rates at the same diffuser indicate decreased performance of the filter.
3. Analysis Methodologies for Adjusting Measured CO2 Results
3.1. Mass Balance According to Ventilation Rates
In this study, a mass balance equation is used for result analysis, as represented by Equation (1). This is a global approach model that can predict the variation in the average CO2 concentration according to the changes in boundaries (inputs), such as imposed air volume flow rates.
Here, C is the CO2 concentration expressed in ppm, V represents the room air volume (m3), (m3/h) is the ventilation rate provided by the ERV and (m3/h) is the infiltration rate. The test is conducted when the ERV is fully operational, and thus, is neglected in this study. This is because exfiltration and infiltration are negligible values when the ventilation system is activated, as assumed in another study [29]. The last term of the equation indicates the CO2 emission caused by occupants exhaling. It is expressed by the number of occupants (N) and the CO2 emission rate (L/s) per person (E) with a correction coefficient CC (1/2.27778 × 106) converting L/s to ppm.
This model considers complete air mixing. Thus, the time evolution of the CO2 concentration within an enclosure, Cin, is well described by the mass balance of the intake, outtake and generated CO2. When the filter is degraded and the total ventilation rates are reduced, the average indoor CO2 concentration is increased, and it can be predicted with this model. This is helpful in crosschecking the measured data and analyzing the effects of test condition changes on the indoor CO2 levels. For example, the effects of the variation of the number of students is considered with this model by modifying the number N with an estimate of the emission rate per person E from the measured data.
3.2. Evaluation Method of the CO2 Emission Rate per Student
To compare the indoor CO2 concentrations by filter replacement, the same number of students must be guaranteed. However, the number of students in the classroom is changed during the test period because of the rearrangement of classrooms for a new semester. The number of students before the filter replacement was 26, and it is increased to 31. Therefore, this number of students after the replacement must be corrected back to the same number of students before the filter replacement. The supply and exhaust air volume flow rates, indoor and outdoor CO2 concentration and number of students can be directly obtained through measurement, and only the amount of CO2 emitted per student remains to be evaluated. This parameter allows matching the measurement condition. The emission rate per student is variable per the activities and degree of physical development of the students. As both conditions are similar during classes in this study, the E value is assumed as a constant. An optimization method is proposed to deduce the E value from the measured data. The particle swarm optimization (PSO) method is used [30,31]. This method arbitrarily distributes a group of values (swarm size) within a parameter bound, and the minimum error area is iteratively searched for a given time (max time). The swarm size is set to 2000; max time is 1000 s; and the lower and upper bounds are given as 0 L/s and 0.008 L/s, respectively. These bounds are set from the fact that the emission of a classroom sitting quietly is less than 0.25 L/min (=0.0041 L/s) [32].
3.3. Computational Fluid Dynamics Analysis
The field tests are conducted for over five months. During the period, the EHP operation modes are changed from heating to cooling. The indoor airflow patterns can be different according to these modes, so a single measuring point located at the same place during this period may reflect distinct cases. Therefore, computational fluid dynamics (CFD) analysis is performed to estimate the airflow pattern, particularly at the height of the measuring point.
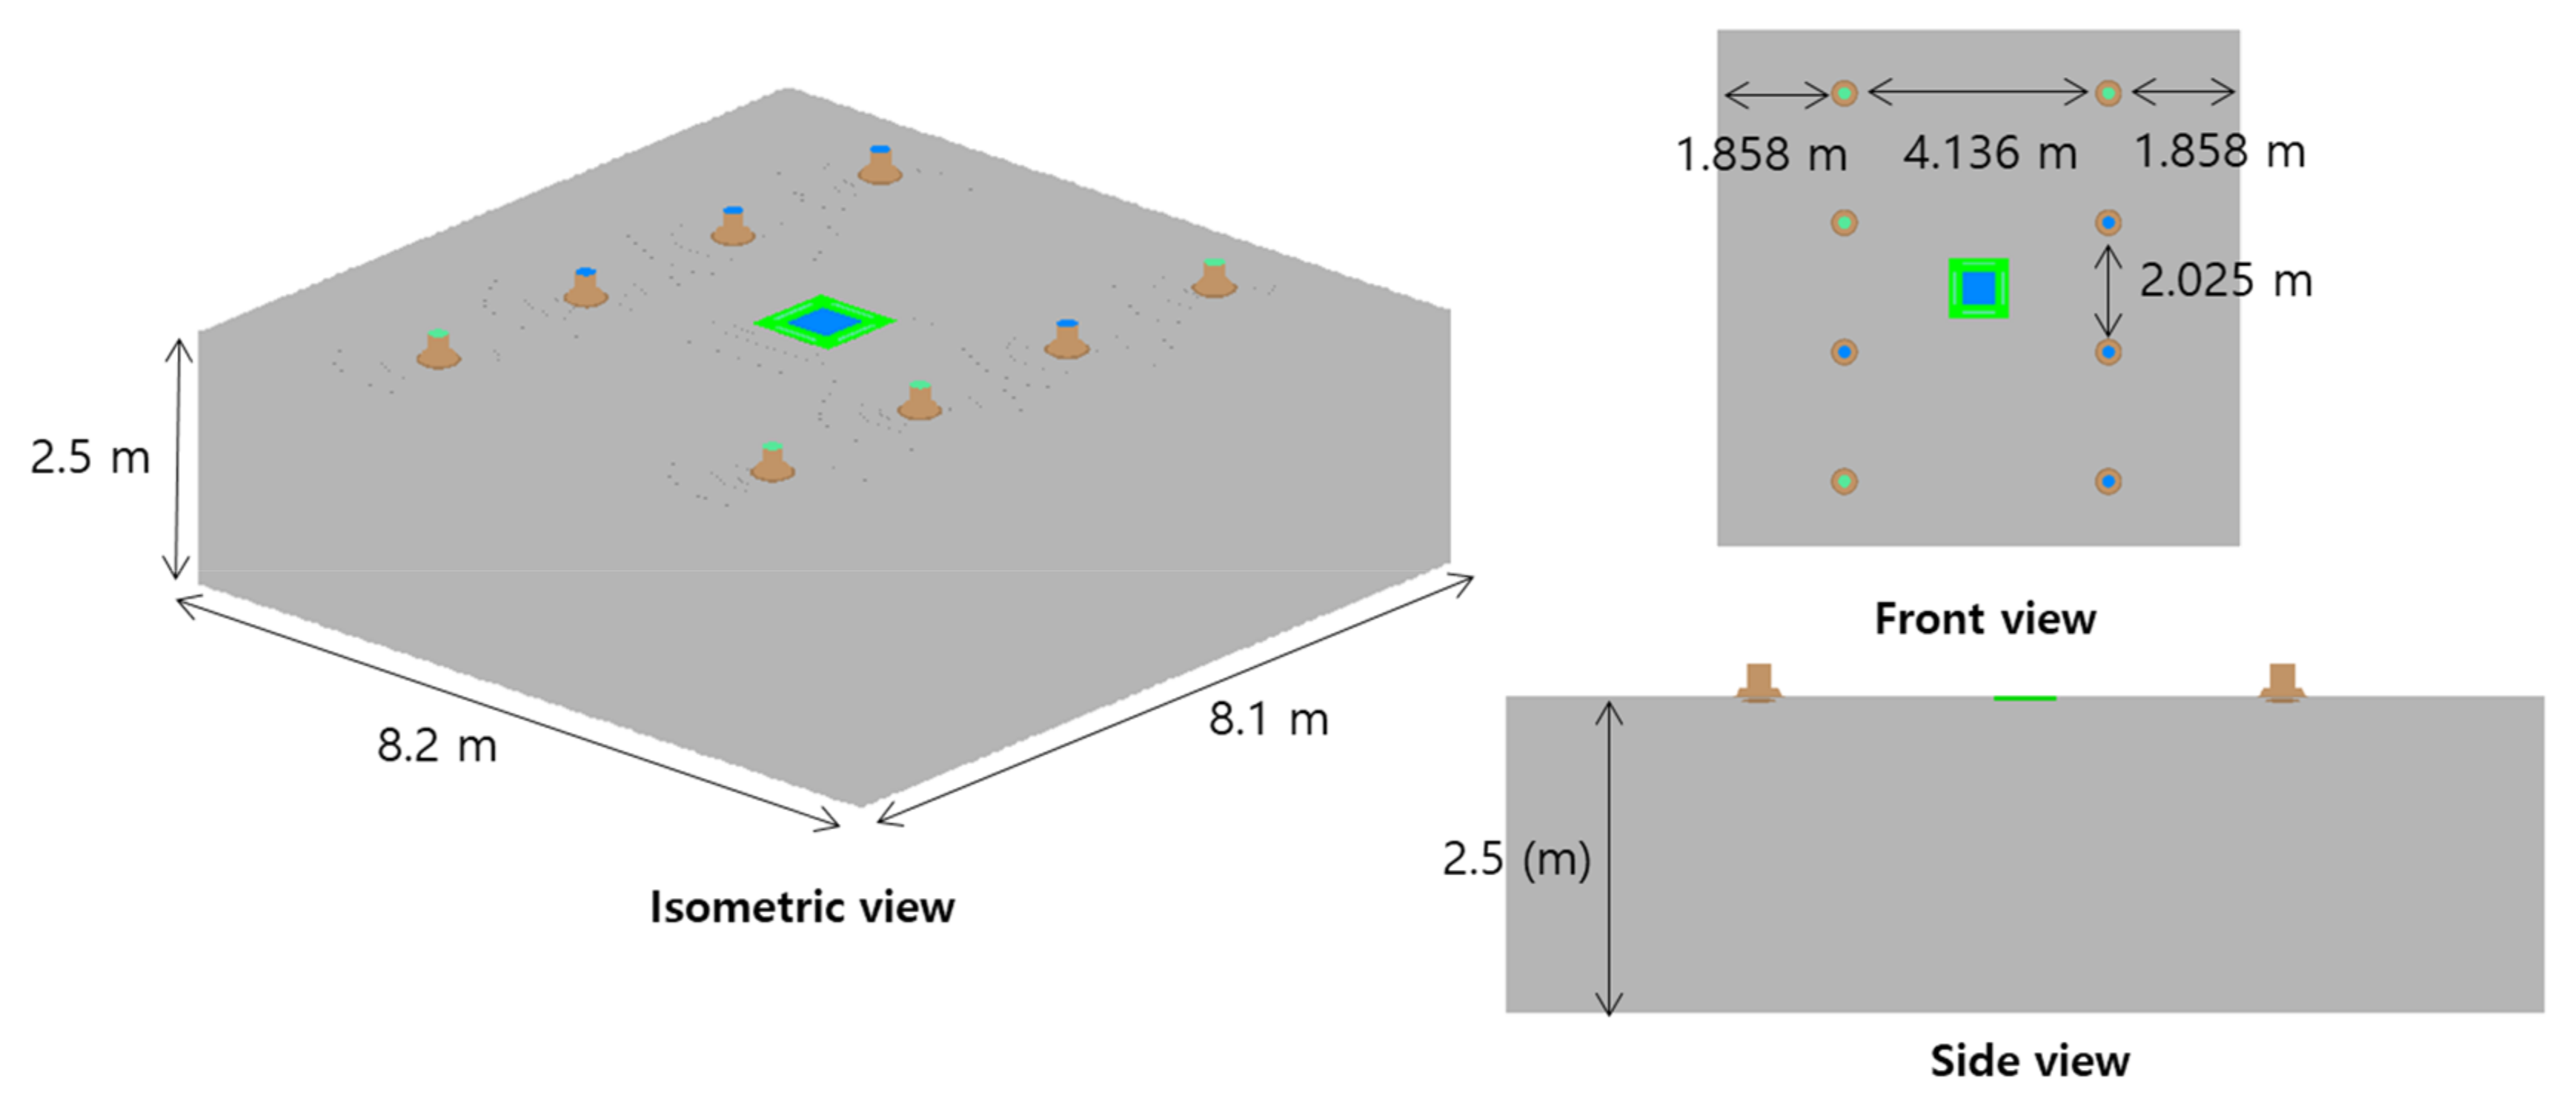
Such CFD analysis is conducted using the ANSYS Fluent software. The k-ε realizable turbulence model was selected with a first order upwind method, and wall sides are set as a non-slip condition. Three-dimensional modeling considers the installation location and shapes of EHP and diffusers of the ERV system (Figure 5).
4. Results
As given in Table 4, the measurements are estimated for three different points of time: before and after filter replacement and four months after filter replacement. The test conditions are not the same for each point of time. First, the number of students is changed over the filter replacement period, and the EHP mode is changed between the second and third time points. For the three cases, the outside CO2 concentrations are similar showing approximately 440 to 460 ppm, as mentioned earlier.
4.1. Air Volume Flow Rate Measurement
According to the degradation of filters, the air volume flow rates can decrease with an increase in the pressure drop across filters. The air volume flow rates are measured at the three points of time. Table 5 gives the mean values of the supply and exhaust air volume flow rates expressed in CMH, which are obtained by averaging the results two times measured at each diffuser. The flow rates are measured for four pairs of supply and exhaust diffusers, as shown in Figure 1. As per the results, the air volume flow rates are improved at all supply and exhaust diffusers after the filter replacement. Specifically, the air volume flow rates at the exhaust diffusers are very much increased, and apparently, this is related to the fact that the filter on the exhaust air side was more degraded by dust, as shown in Figure 3a. However, the air volume flow rates are decreased again four months after the filter replacement, and this is an expected result as filter degradation occurs during that period. In this case, the exhaust side shows high drops in the air volume flow rates; for example, the total flow rate on the supply side drops by 64 CMH (from 881 to 817) and on the exhaust side by 107 CMH (from 766 to 659). Figure 6 shows the changes in the air volume flow rates during the test period. This shows a relevant relationship between levels of the filter degradation and the consequent airflow rates. Thus, periodic filter replacement is important to ensure the initially-designed flow rates.
4.2. CO2 Level in the Classroom after Filter Replacement
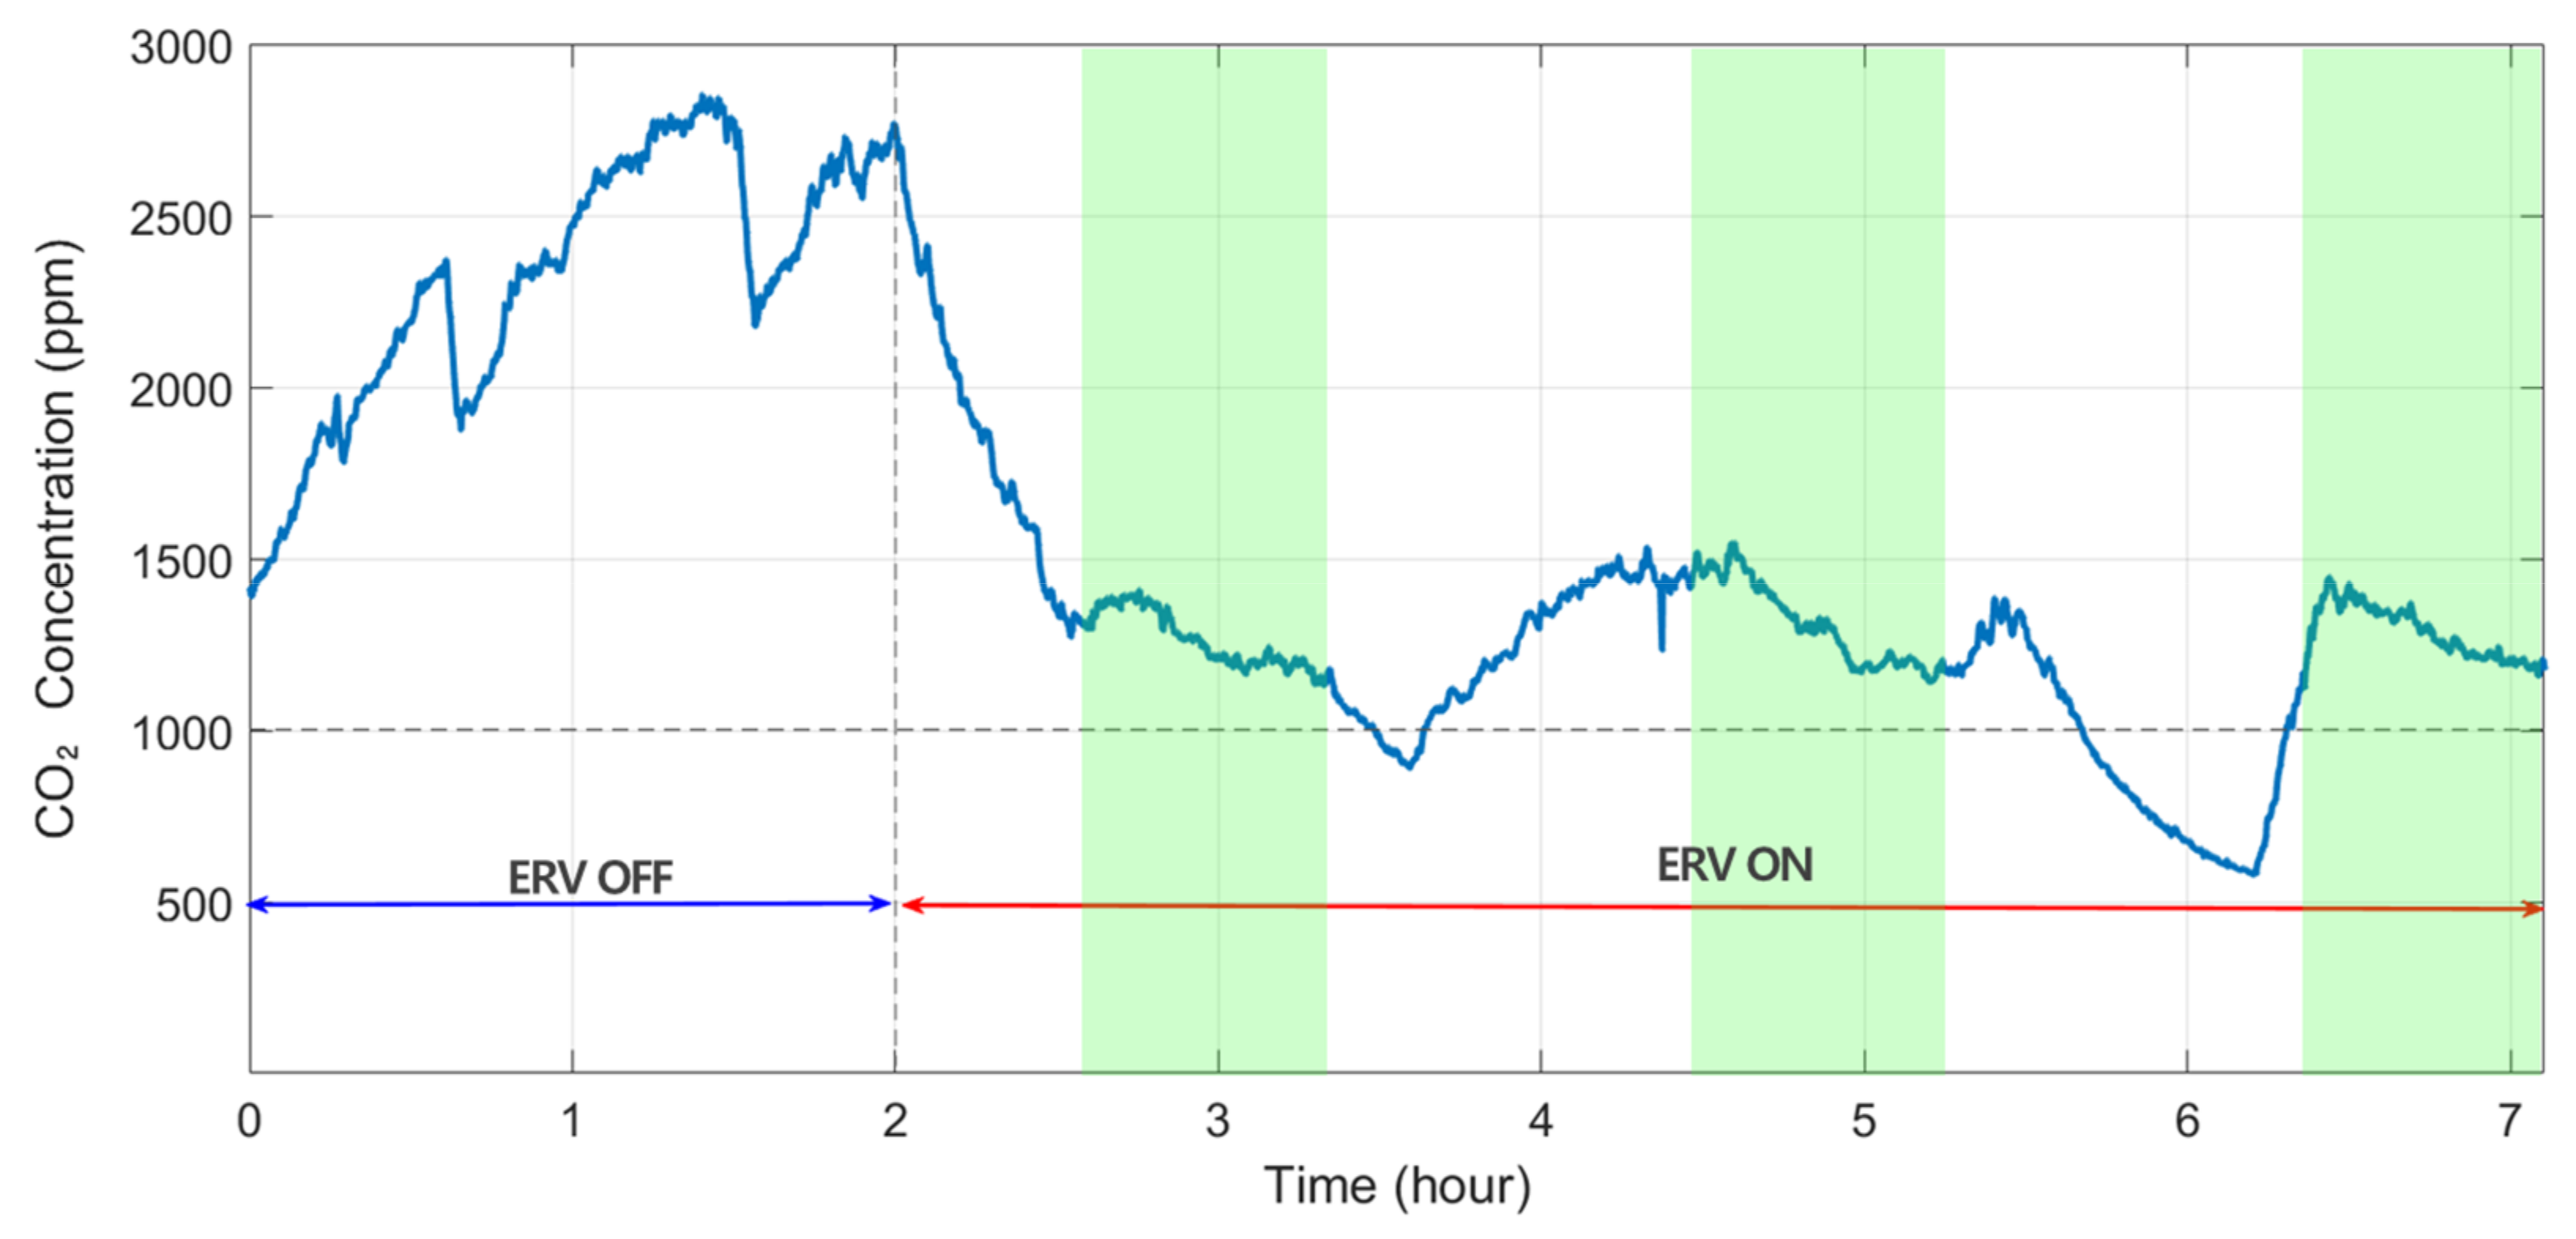
In this study, a method to set a reference CO2 concentration level is proposed for comparisons of the three cases (before, after and four months after the filter replacement) as the indoor CO2 concentrations are largely time-variable, as shown in Figure 7. The results are obtained for a normal class day, just after the filter replacement. A fluctuation is caused by changes in occupants’ activities and conditions related to the system and occupants. For example, when the ERV system is switched off, the CO2 level increased, as observed for the first few hours. The short periods, where the CO2 concentrations are decreased during the ERV-off interval, match the break time between classes, because some students leave the classroom and the doors are open. Such a break of approximately 10 min cannot reduce the accumulated indoor CO2 concentration sufficiently, because the corridor is also air-tight in recently built buildings. The high level of CO2 concentration reaches about 3000 ppm within two hours. This proves the necessity of installing ventilation systems for classrooms, particularly in modern air-tight buildings.
When the ERV is switched on, the CO2 concentration is rapidly decreased and maintained at a certain level, and the upper bound is close to 1500 ppm. This level follows the national regulation [18], but with only new filters. As shown in Figure 7, the green area represents the class time of 45 min. Interestingly, the concentration level at the end of every class is similar even with different initial CO2 concentrations. This means that the capacity of the installed ERV system is sufficient to get a quasi-steady-state condition within 45 min. This allows the use of CO2 concentrations, measured at the end of a class, for comparisons when other conditions are the same.
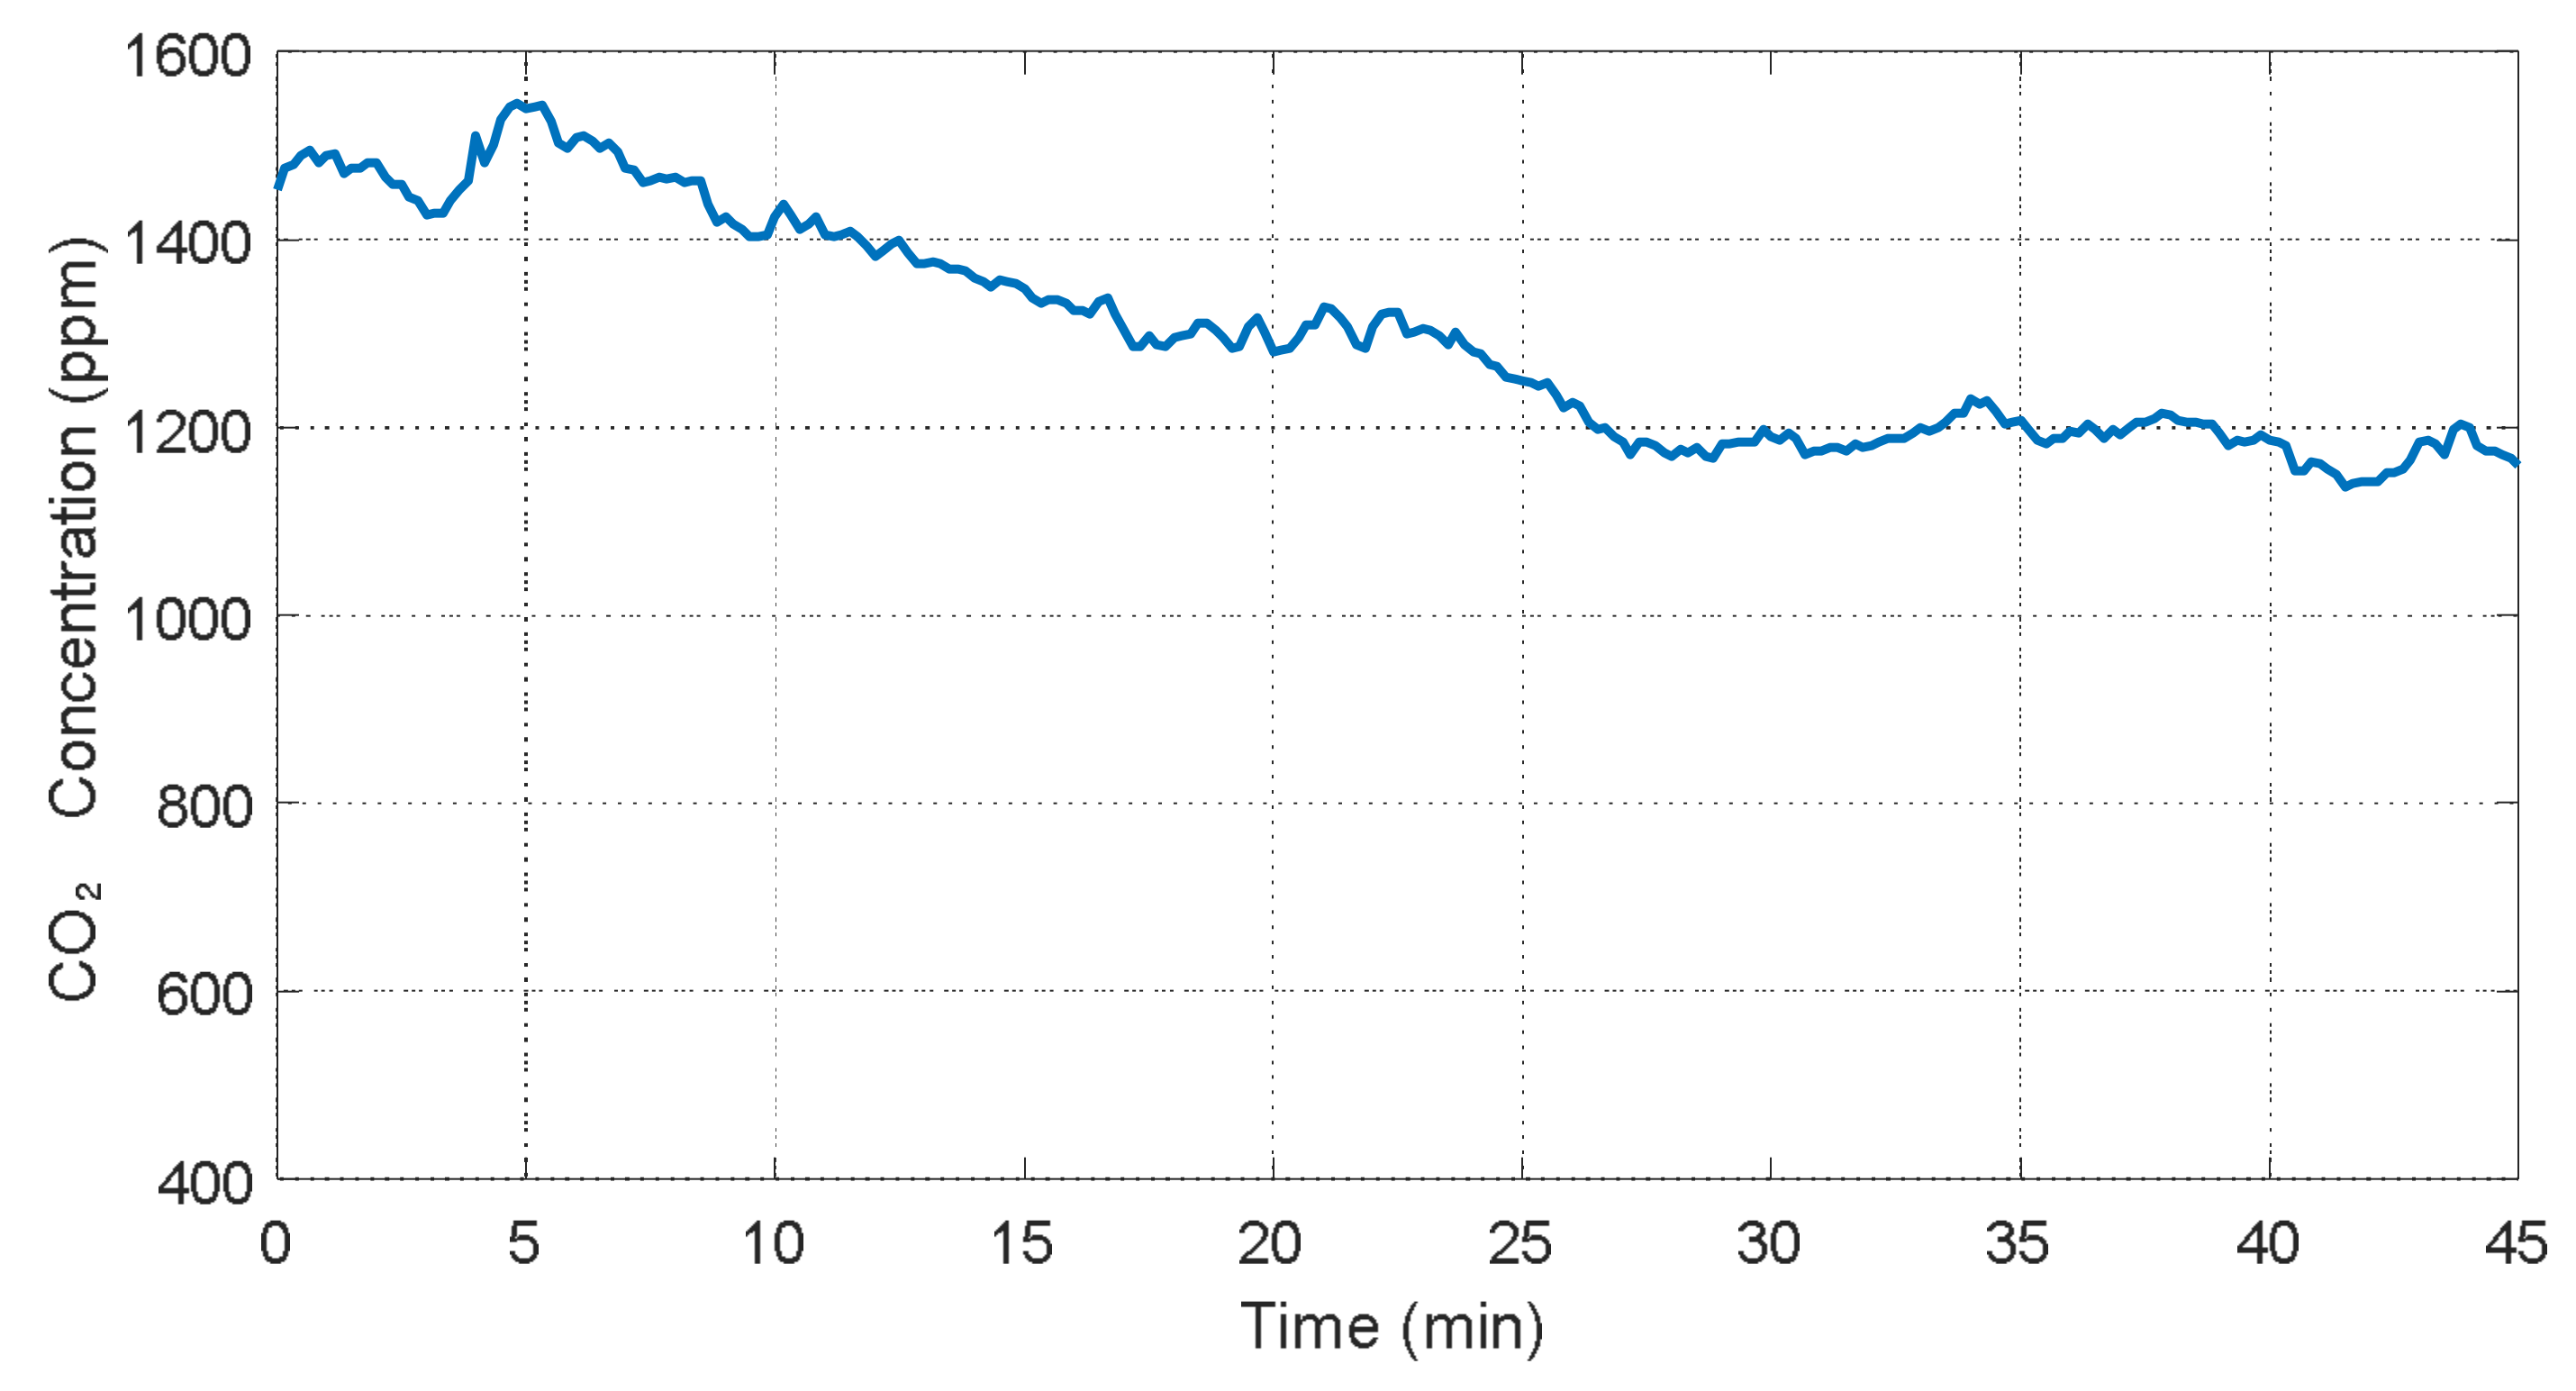
Figure 8 is a magnified graph of the second class marked with a green box in Figure 7. When the class begins, and the students sit, the CO2 concentrations are decreased by a low CO2 emission rate of quiet activities during the class. The CO2 concentrations is maintained at around 1200 ppm after 25 min from the beginning of the class. In this study, an average value of the CO2 concentration during the last 10 min of a class is set to be the reference measured data at the targeted point of time.
4.3. CO2 Level Comparison between Cases of before and after Filter Replacement
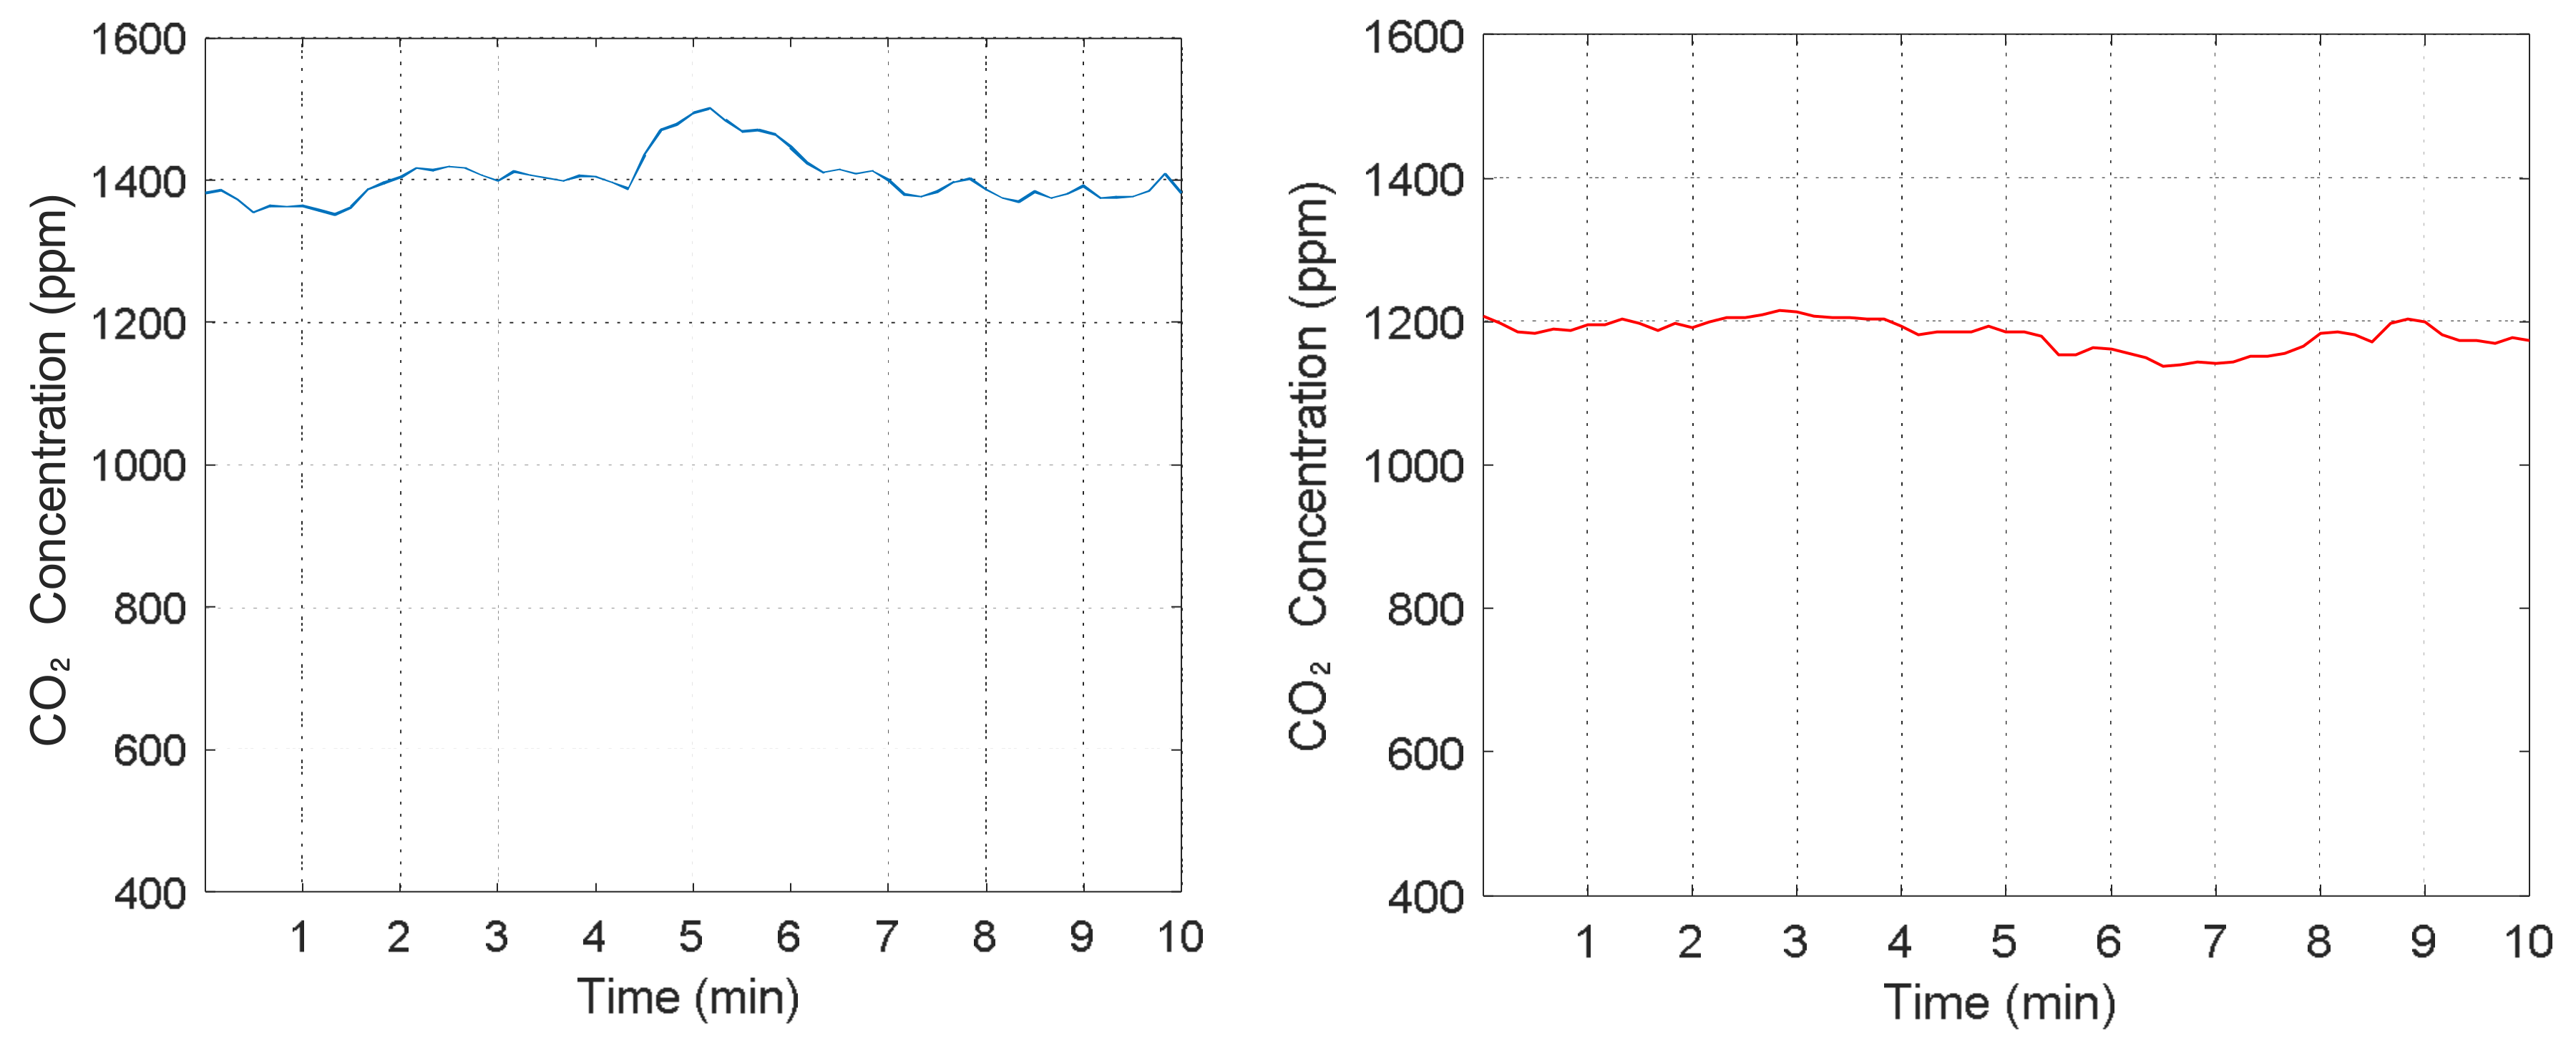
The level of CO2 concentrations shown in Figure 8 is compared to that measured a few days before the filter replacement. As mentioned above, the same measuring method is adopted for the results. Figure 9 shows the CO2 levels during the last 10 min of the classes on different days, before and after filter replacement. The left figure pertains to the data measured before the replacement, showing an average concentration of 1404 ppm, while the CO2 value after the replacement is 1182 ppm. From these results, the effect of filter replacement on the indoor CO2 level is evident, which shows a difference of more than 200 ppm. Furthermore, the number of students is increased across the filter replacement period (see Table 4). Thus, more important effects can be expected if the number of students is considered to be the same.
4.4. Analysis Methodologies I: Number of Students
To correctly compare the CO2 levels between cases before and after the filter replacements, the number of students must be adjusted. An evaluation method for a CO2 emission rate per student was proposed in Section 3.2, and the CO2 emission rate per student for the test class was evaluated in a way that it covers the whole data of Figure 9. The PSO loop includes two sub-simulation loops, where the emission rate E (Equation (1)) is equal, but the number of students is different. The PSO algorithm iteratively provides a value E to both the sub-simulation loops until the error between the simulation and measurement results is minimized. In this way, the target E can be obtained. Therefore, the measured data can be adjusted by simulation with Equation (1) and the obtained E for a case of a different number of students.
The PSO simulation deduces a value of 0.00411 L/s for the CO2 emission rate per person, as given in Table 6, which is close to the level for seated and quite activities proposed by ASHRAE [32]. As the number of students was increased after the filter replacement by a new school year, it was expected that the total CO2 emission rate would also be higher and thus overestimated. Thus, the corrected CO2 level can be lower than the measured values. The adjusted CO2 concentration after the filter replacement becomes 1085 ppm, when the number of students is modified to 26 students. By this adjustment, the measured CO2 concentration is decreased by approximately 100 ppm. Finally, this shows a more than 20% reduction in the indoor CO2 concentrations by filter replacement.
4.5. Comparison of Cases after the Filter Replacement and Four Months after the Replacement
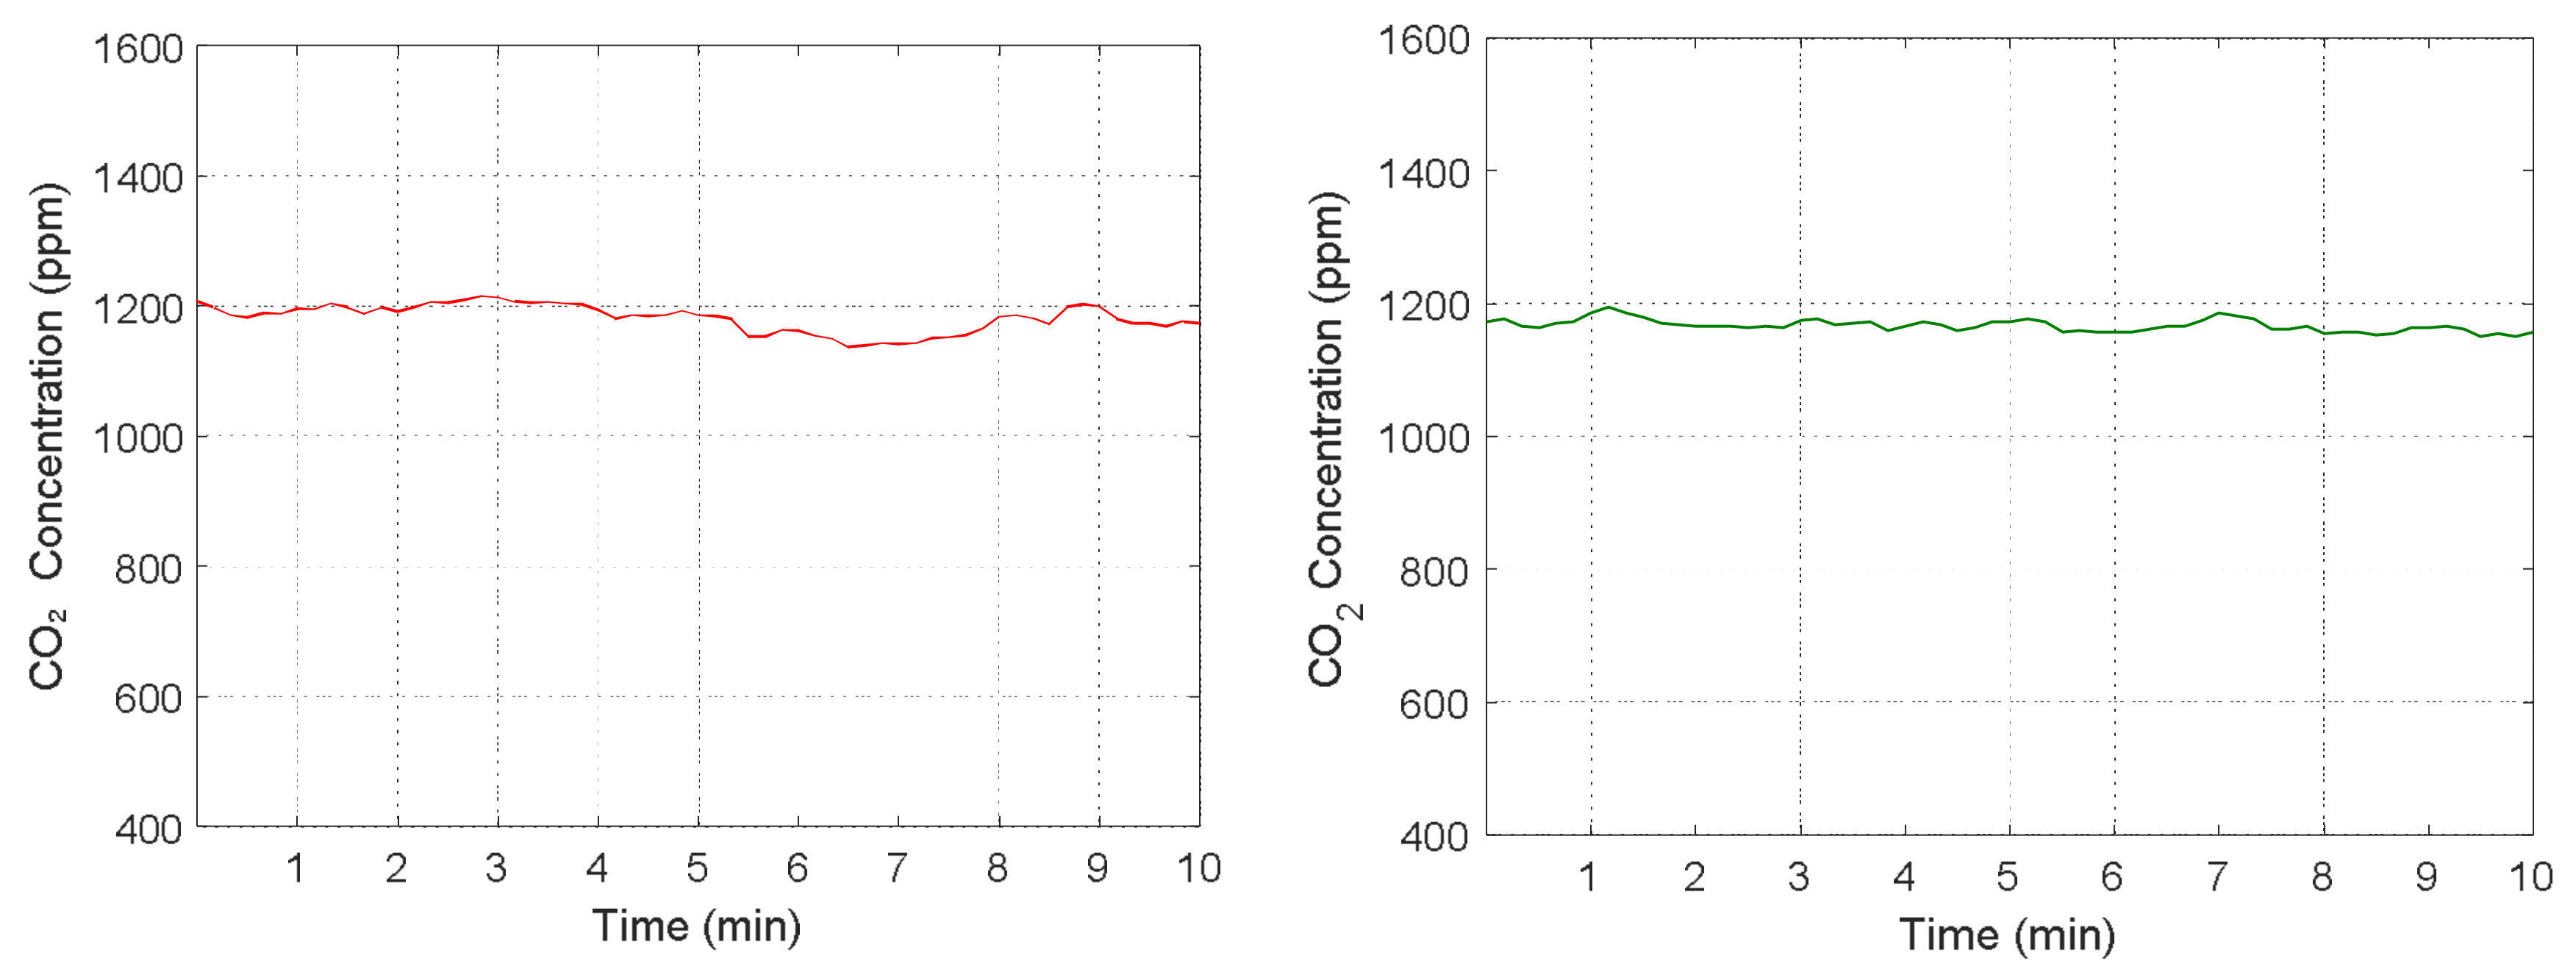
To confirm the increasing effect of indoor CO2 levels according to filter degradation, the CO2 concentrations, four months after the filter replacement, are measured. A value higher than the case just after the replacement is expected, as the filter degradation occurs during this period. The supply and exhaust air volume flow rates are decreased as time proceeds after filter replacement (see Table 5). However, there was almost no difference between the cases, as shown in Figure 10. The CO2 concentration of around 1182 ppm (for 31 students) after filter replacement is kept unchanged, showing 1167 ppm as the average value, as shown in Figure 10. The number of students between the two measurements was the same (Table 5), but the EHP operation in the classroom was shifted from heating to cooling as the seasons changed. The CO2 level is sensitive to indoor airflow patterns; thus, the concentration distribution can vary depending on the air temperature distribution [33,34]. Therefore, the room temperature distributions according to the different indoor airflow patterns caused by distinct operations of the EHP and ERV are investigated, and the results are presented in the following section.
4.6. Analysis Methodologies II: EHP Operation Mode
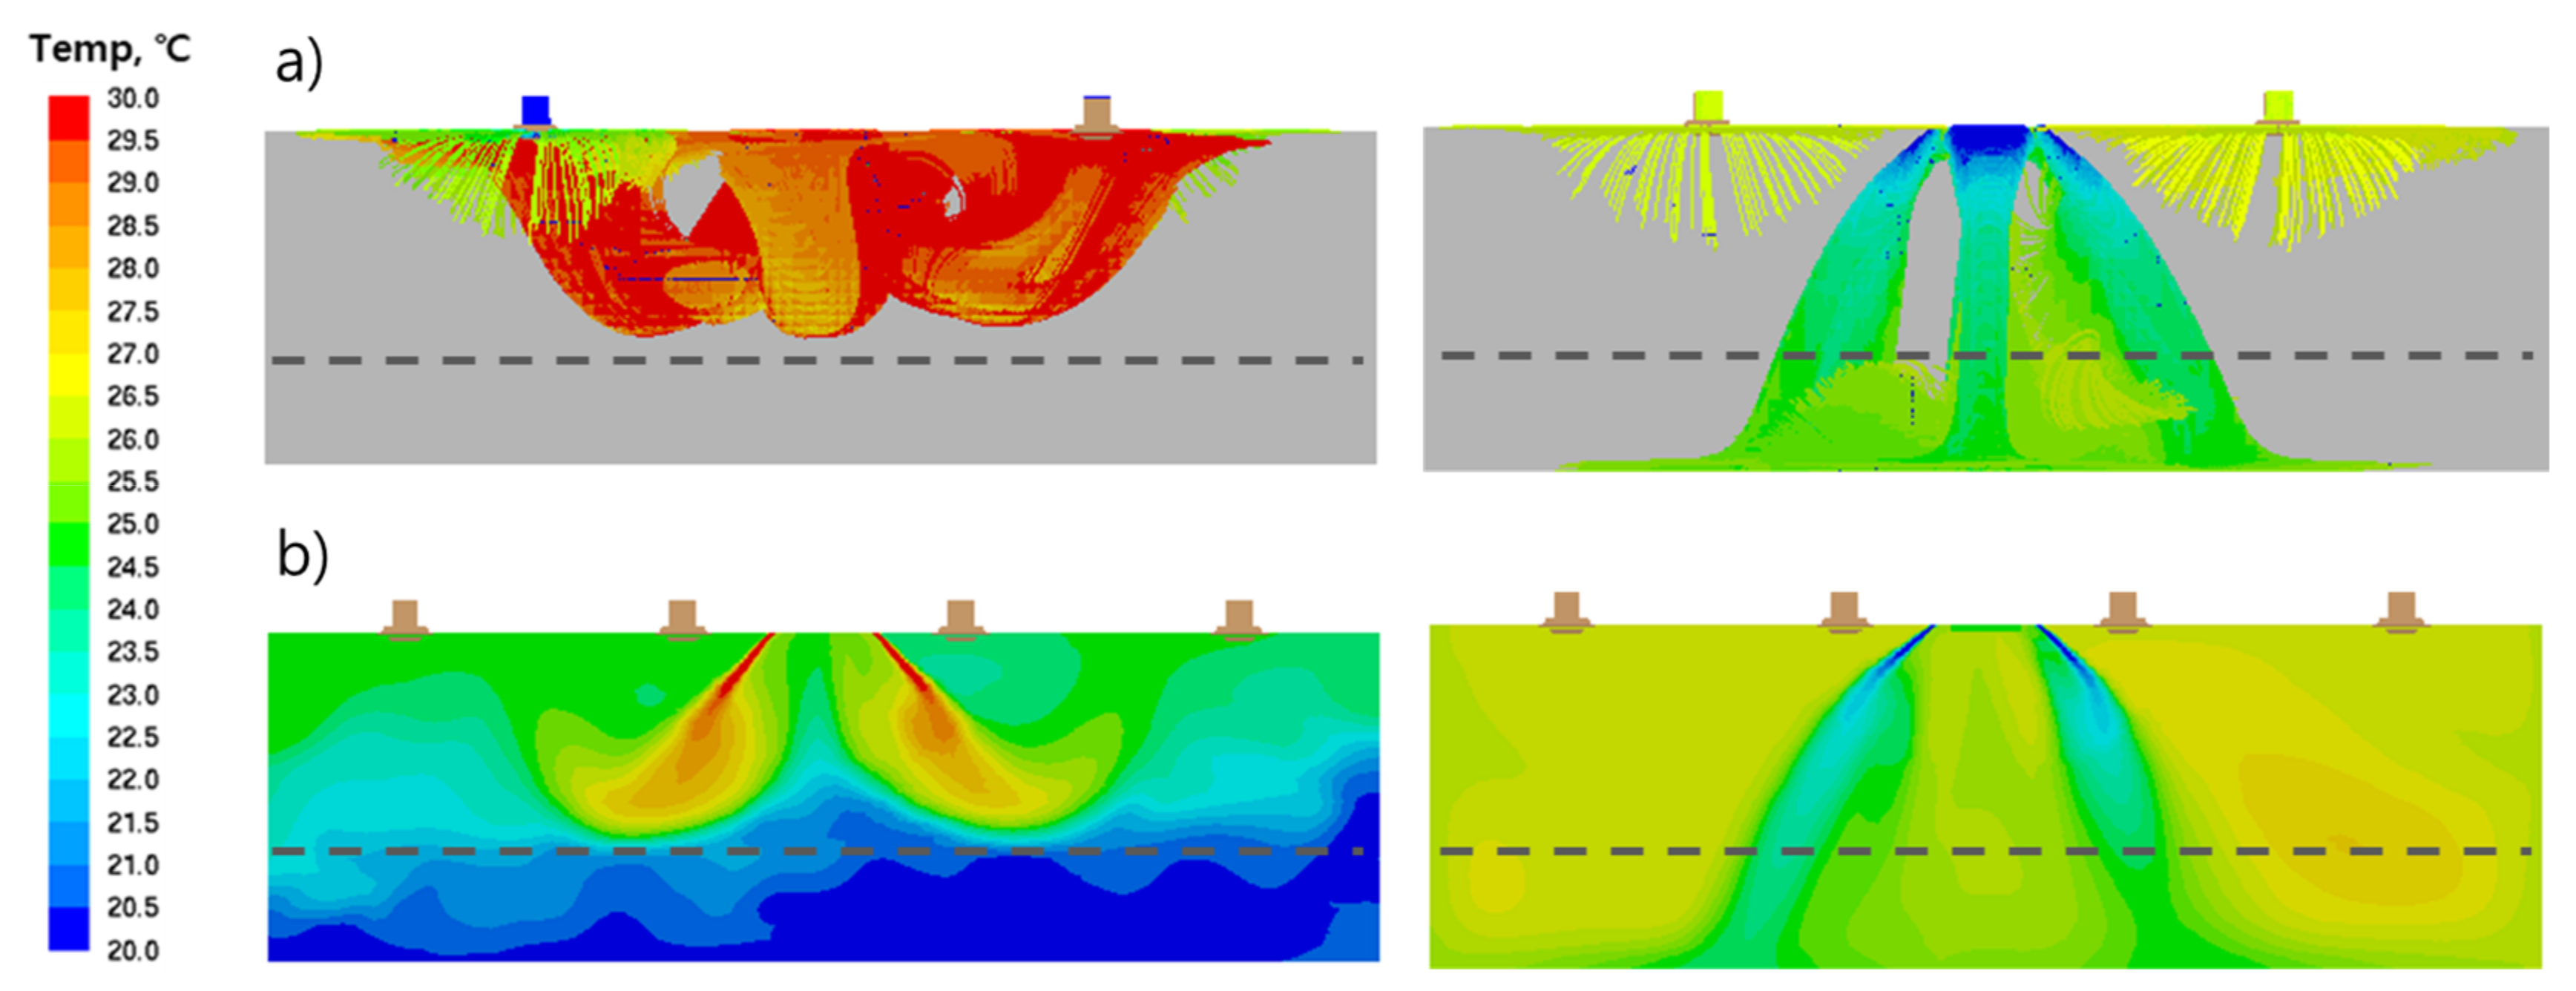
CFD simulations are run with the conditions demonstrated in Section 3.3. Figure 11 shows the airflow patterns and room temperature distribution results for the heating (left) and cooling (right) modes for EHP and ERV. The marks in the figure represent the measuring point for CO2 concentrations in the classroom. The airflow patterns in the classroom by the EHP and ERV are shown in Figure 11a. The air stream does not reach to the bottom in the heating period, while the stream vertically falls for the cooling mode. The cross-sectional temperature distribution and the CO2 concentration measuring location are given in Figure 11b. In the heating period, the temperature difference was approximately 7 °C between the heights of 0.5 m and 2 m, and the temperature at the measuring point at 1.1 m is close to the upper mixed temperatures. In the cooling period, the temperature difference according to the height is smaller than 1 °C.
From the results, a temperature stratification in the classroom is observed for the heating period, expecting that the emitted CO2 is likely to remain in the upper zone, including the measuring point. Thus, the measured CO2 concentration in the heating period can be higher than the average value. Moreover, the CO2 measured at the cooling period seems to be very close to the average value as the air is well mixed. This can be interpreted as the CO2 concentration measured four months after the filter replacement would be adjusted by a higher value when the same heating conditions are assumed. The incoherent results of the measured CO2 concentrations between the last two points of time are likely due to the air stratification effects shown in the CFD results. As a result, the same effect of filter degradation on the indoor CO2 level would be observed over the entire test period.
5. Conclusions
The purpose of the study was to investigate the filter degradation of ERVs and its effects on the indoor CO2 levels through field tests in a classroom. For such tests, the existing filters mounted in the ERV system for the past three years were replaced by new ones, and the resulting air volume flow rates and CO2 concentrations were measured. The tests were conducted during classes, in which the test conditions were different, and thus, several methodologies are proposed to match the conditions and compare the results. First, an optimization method is proposed to deduce the CO2 emission rate per student, which can be used to adjust the number of students, which was distinct over the tests. Second, CFD analysis is proposed to simulate the indoor airflow patterns in different EHP operations. This can give an interpretation of the measured CO2 concentrations, but at a single measuring point. Finally, the last ten minutes of each class are selected as a reference interval for obtaining average CO2 concentrations, as a quasi-steady-state value can be obtained during the interval regardless of the initial values.
The test results are summarized as follows:
- The air volume flow rates increased after the filter replacement by more than 200 CMH at the exhaust air side of the ERV.
- The air volume flow rates decreased as time elapsed since the filter replacement.
- The resulting indoor CO2 levels were affected by the measured air volume flow rates when the test conditions were similar.
- After the filter placement, the value of indoor CO2 concentrations was decreased by more than 300 ppm, showing 1085 ppm, sufficiently meeting the national recommended value.
- The PSO gave a value of 0.0148 CMH for the CO2 emission rate per student, which is within the standard ranges proposed by ASHRAE.
- The CFD simulation can give different airflow patterns in heating and cooling conditions, and this result can be used for interpreting the CO2 concentration measured at a single measuring point.
This work focuses on the apparently different test conditions to match them for comparison purposes, and thus other, factors that may affect indoor CO2 concentrations such as levels of ambient dust are not fully investigated. In addition, more detailed tests on the indoor airflow in various temperature and pressure conditions do not accompany those performed. These are to be carried out in future work. However, the proposed analysis methodologies can help with interpreting and adjusting other measured results that are obtained in different test conditions often encountered in field tests.
This study clearly shows the importance of filter replacement and management for ensuring the initially-designed air volume flow rates and resulting indoor CO2 concentration level related to student comfort and educational attainment. A new regulation such as installing a pressure drop gauge across the filter can be required in the future, and it is helpful in letting maintenance personnel know the need for filter replacement.
Acknowledgments
This research work was conducted under the framework of the Research and Development program of the Korea Institute of Energy Research (B8-2424-01). In addition, the authors want to thank LG Electronics for its technical support.
Author Contributions
Jae-Sol Choi and Jae-Hyuk Lee conducted the field tests and data analysis, and Eui-Jong Kim developed the analysis methodologies. Jae-Sol Choi drafted this manuscript, and Eui-Jong Kim corrected and improved it to complete the final version.
Conflicts of Interest
The authors declare no conflict of interest.
Nomenclature
| V | Volume of the classroom (m) |
| C | CO2 concentration in the room (ppm) |
| Co | Outdoor CO2 concentration (ppm) |
| Ci | Indoor CO2 concentration (ppm) |
| Cin | Initial CO2 concentration in the room (ppm) |
| CC | Correction coefficient |
| CMH | cubic meter per hour (m3/h) |
| Ventilation air volume flow rate (m3/h) | |
| Infiltration air volume flow rate (m3/h) | |
| N | Number of occupants (-) |
| E | CO2 emission rate per student (L/s) |
References
- McQuade, J. A System Approach to High Performance Buildings; Technical Report; United Technologies Corporation: Washington, DC, USA, 2009. [Google Scholar]
- Apte, M.G.; Fisk, W.J.; Daisey, J.M. Associations between Indoor CO2 Concentrations and Sick Building Syndrome Symptoms in US Office Buildings: An Analysis of the 1994–1996 BASE Study Data. Indoor Air 2000, 10, 246–257. [Google Scholar] [CrossRef] [PubMed]
- Seppänen, O.; Fisk, W.; Mendell, M. Association of Ventilation Rates and CO2 Concentrations with Health and other Responses in Commercial and Institutional Buildings. Indoor Air 1999, 9, 226–252. [Google Scholar] [CrossRef] [PubMed]
- Clausen, G. Ventilation Filters and Indoor Air Quality: A Review of Research from the International Centre for Indoor Environment and Energy. Indoor Air 2004, 14, 202–207. [Google Scholar] [CrossRef] [PubMed]
- Csobod, E.; Annesi-Maesano, I.; Carrer, P.; Kephalopoulos, S.; Madureira, J.; Rudnai, P.; de Oliveira Fernandes, E.; Barrero-Moreno, J.; Beregszászi, T.; Hyvärinen, A. SINPHONIE: Schools Indoor Pollution & Health Observatory Network in Europe; Final Report; Publications Office of the European Union: Luxemburg, 2014. [Google Scholar]
- Satish, U.; Mendell, M.J.; Shekhar, K.; Hotchi, T.; Sullivan, D.; Streufert, S.; Fisk, W.J. Is CO2 an Indoor Pollutant? Direct Effects of Low-to-Moderate CO2 Concentrations on Human Decision-Making Performance. Environ. Health Perspect. 2012, 120, 1671–1677. [Google Scholar] [CrossRef] [PubMed]
- Branco, P.; Alvim-Ferraz, M.; Martins, F.; Sousa, S. Children’s Exposure to Indoor Air in Urban Nurseries-Part I: CO2 and Comfort Assessment. Environ. Res. 2015, 140, 1–9. [Google Scholar] [CrossRef] [PubMed]
- Jaber, A.R.; Dejan, M.; Marcella, U. The Effect of Indoor Temperature and CO2 Levels on Cognitive Performance of Adult Females in a University Building in Saudi Arabia. Energy Procedia 2017, 122, 451–456. [Google Scholar] [CrossRef]
- Cetin, M. A Change in the Amount of CO2 at the Center of the Examination Halls: Case Study of Turkey. Stud. Ethno-Med. 2016, 10, 146–155. [Google Scholar] [CrossRef]
- Bornehag, C.; Sundell, J.; Hägerhed-Engman, L.; Sigsgaard, T. Association between Ventilation Rates in 390 Swedish Homes and Allergic Symptoms in Children. Indoor Air 2005, 15, 275–280. [Google Scholar] [CrossRef] [PubMed]
- Lee, S.; Chang, M. Indoor Air Quality Investigations at Five Classrooms. Indoor Air 1999, 9, 134–138. [Google Scholar] [CrossRef] [PubMed]
- Daisey, J.M.; Angell, W.J.; Apte, M.G. Indoor Air Quality, Ventilation and Health Symptoms in Schools: An Analysis of Existing Information. Indoor Air 2003, 13, 53–64. [Google Scholar] [CrossRef] [PubMed]
- Turanjanin, V.; Vučićević, B.; Jovanović, M.; Mirkov, N.; Lazović, I. Indoor CO2 Measurements in Serbian Schools and Ventilation Rate Calculation. Energy 2014, 77, 290–296. [Google Scholar] [CrossRef]
- Shendell, D.G.; Prill, R.; Fisk, W.J.; Apte, M.G.; Blake, D.; Faulkner, D. Associations between Classroom CO2 Concentrations and Student Attendance in Washington and Idaho. Indoor Air 2004, 14, 333–341. [Google Scholar] [CrossRef] [PubMed]
- Corsi, R.; Torres, V.; Sanders, M.; Kinney, K. Carbon Dioxide Levels and Dynamics in Elementary Schools: Results of the TESIAS Study. Indoor Air 2002, 2, 74–79. [Google Scholar]
- Santamouris, M.; Synnefa, A.; Asssimakopoulos, M.; Livada, I.; Pavlou, K.; Papaglastra, M.; Gaitani, N.; Kolokotsa, D.; Assimakopoulos, V. Experimental Investigation of the Air Flow and Indoor Carbon Dioxide Concentration in Classrooms with Intermittent Natural Ventilation. Energy Build. 2008, 40, 1833–1843. [Google Scholar] [CrossRef]
- Grimsrud, D.; Bridges, B.; Schulte, R. Continuous Measurements of Air Quality Parameters in Schools. Build. Res. Inf. 2006, 34, 447–458. [Google Scholar] [CrossRef]
- ANSI. Ventilation for Acceptable Indoor Air Quality. American Society of Hearing, Refrigerating and Air-Conditioning Engineers; ANSI/ASHRAE Standard 62.1-2016; ASHARE: Atlanta, GA, USA, 2013. [Google Scholar]
- Department for Education. Building Bulletin 101 (BB101)-Guidelines on Ventilation, Thermal Comfort and Indoor Air Quality in Schools; Department for Education: London, UK, 2017.
- Korea Ministry of Education. The standards for maintenance and management of the air quality in school buildings Table IV-2. In Enforcement Rule of the School Health Act, 2017.03; Article 3-2; Korea Ministry of Education: Sejong, Korea, 2017. [Google Scholar]
- El Fouih, Y.; Stabat, P.; Rivière, P.; Hoang, P.; Archambault, V. Adequacy of Air-to-Air Heat Recovery Ventilation System Applied in Low Energy Buildings. Energy Build. 2012, 54, 29–39. [Google Scholar] [CrossRef]
- Kang, C.; Sunwoo, Y.; Lee, H.S.; Kang, B.; Lee, S. Atmospheric Concentrations of PM2.5 Trace Elements in the Seoul Urban Area of South Korea. J. Air Waste Manag. Assoc. 2004, 54, 432–439. [Google Scholar] [CrossRef]
- Roulet, C.; Heidt, F.; Foradini, F.; Pibiri, M. Real Heat Recovery with Air Handling Units. Energy Build. 2001, 33, 495–502. [Google Scholar] [CrossRef]
- Fehrm, M.; Reiners, W.; Ungemach, M. Exhaust Air Heat Recovery in Buildings. Int. J. Refrig. 2002, 25, 439–449. [Google Scholar] [CrossRef]
- Lazzarin, R.M.; Gasparella, A. Technical and Economical Analysis of Heat Recovery in Building Ventilation Systems. Appl. Therm. Eng. 1998, 18, 47–67. [Google Scholar] [CrossRef]
- Dodoo, A.; Gustavsson, L.; Sathre, R. Primary Energy Implications of Ventilation Heat Recovery in Residential Buildings. Energy Build. 2011, 43, 1566–1572. [Google Scholar] [CrossRef]
- Bakó-Biró, Z.; Clements-Croome, D.; Kochhar, N.; Awbi, H.; Williams, M. Ventilation Rates in Schools and Pupils’ Performance. Build. Environ. 2012, 48, 215–223. [Google Scholar] [CrossRef]
- Zhang, L.; Niu, J. Energy Requirements for Conditioning Fresh Air and the Long-Term Savings with a Membrane-Based Energy Recovery Ventilator in Hong Kong. Energy 2001, 26, 119–135. [Google Scholar] [CrossRef]
- Lu, X.; Lu, T.; Viljanen, M. Estimation of space air change rates and CO2 generation rates for mechanically-ventilated buildings. In Advances in Computer Science and Engineering; InTech: London, UK, 2011. [Google Scholar]
- Shi, Y. Particle swarm optimization: Developments, applications and resources. In Proceedings of the 2001 Congress on Evolutionary Computation, Seul, Korea, 27–30 May 2001; pp. 81–86. [Google Scholar]
- Wang, Z.; Yang, R.; Wang, L. Multi-agent control system with intelligent optimization for smart and energy-efficient buildings. In Proceedings of the IECON 2010—36th Annual Conference on IEEE Industrial Electronics Society, Glenzdale, AZ, USA, 7–10 November 2010; pp. 1144–1149. [Google Scholar]
- Dougan, D.S.; Damiano, L. CO2-Based Demand Control Ventilation: Do Risks Outweigh Potential Rewards? ASHRAE J. 2004, 46, 47–53. [Google Scholar]
- Ning, M.; Mengjie, S.; Mingyin, C.; Dongmei, P.; Shiming, D. Computational Fluid Dynamics (CFD) Modelling of Air Flow Field, Mean Age of Air and CO2 Distributions Inside a Bedroom with Different Heights of Conditioned Air Supply Outlet. Appl. Energy 2016, 164, 906–915. [Google Scholar] [CrossRef]
- Chung, K.; Hsu, S. Effect of Ventilation Pattern on Room Air and Contaminant Distribution. Build. Environ. 2001, 36, 989–998. [Google Scholar] [CrossRef]
Figure 1.
Layout of the test classroom and energy recovery ventilator (ERV)/electric heat pump (EHP) systems (red mark: location of the CO2 sensor).
Figure 1.
Layout of the test classroom and energy recovery ventilator (ERV)/electric heat pump (EHP) systems (red mark: location of the CO2 sensor).

Figure 2.
CO2 sensors and measuring height.

Figure 3.
(a) Currently-mounted filters that will be replaced (used for over three years), (b) new filter to be mounted for the test and (c) filters four months after the filter replacement (the left filter is the filter on the exhaust air side).
Figure 3.
(a) Currently-mounted filters that will be replaced (used for over three years), (b) new filter to be mounted for the test and (c) filters four months after the filter replacement (the left filter is the filter on the exhaust air side).
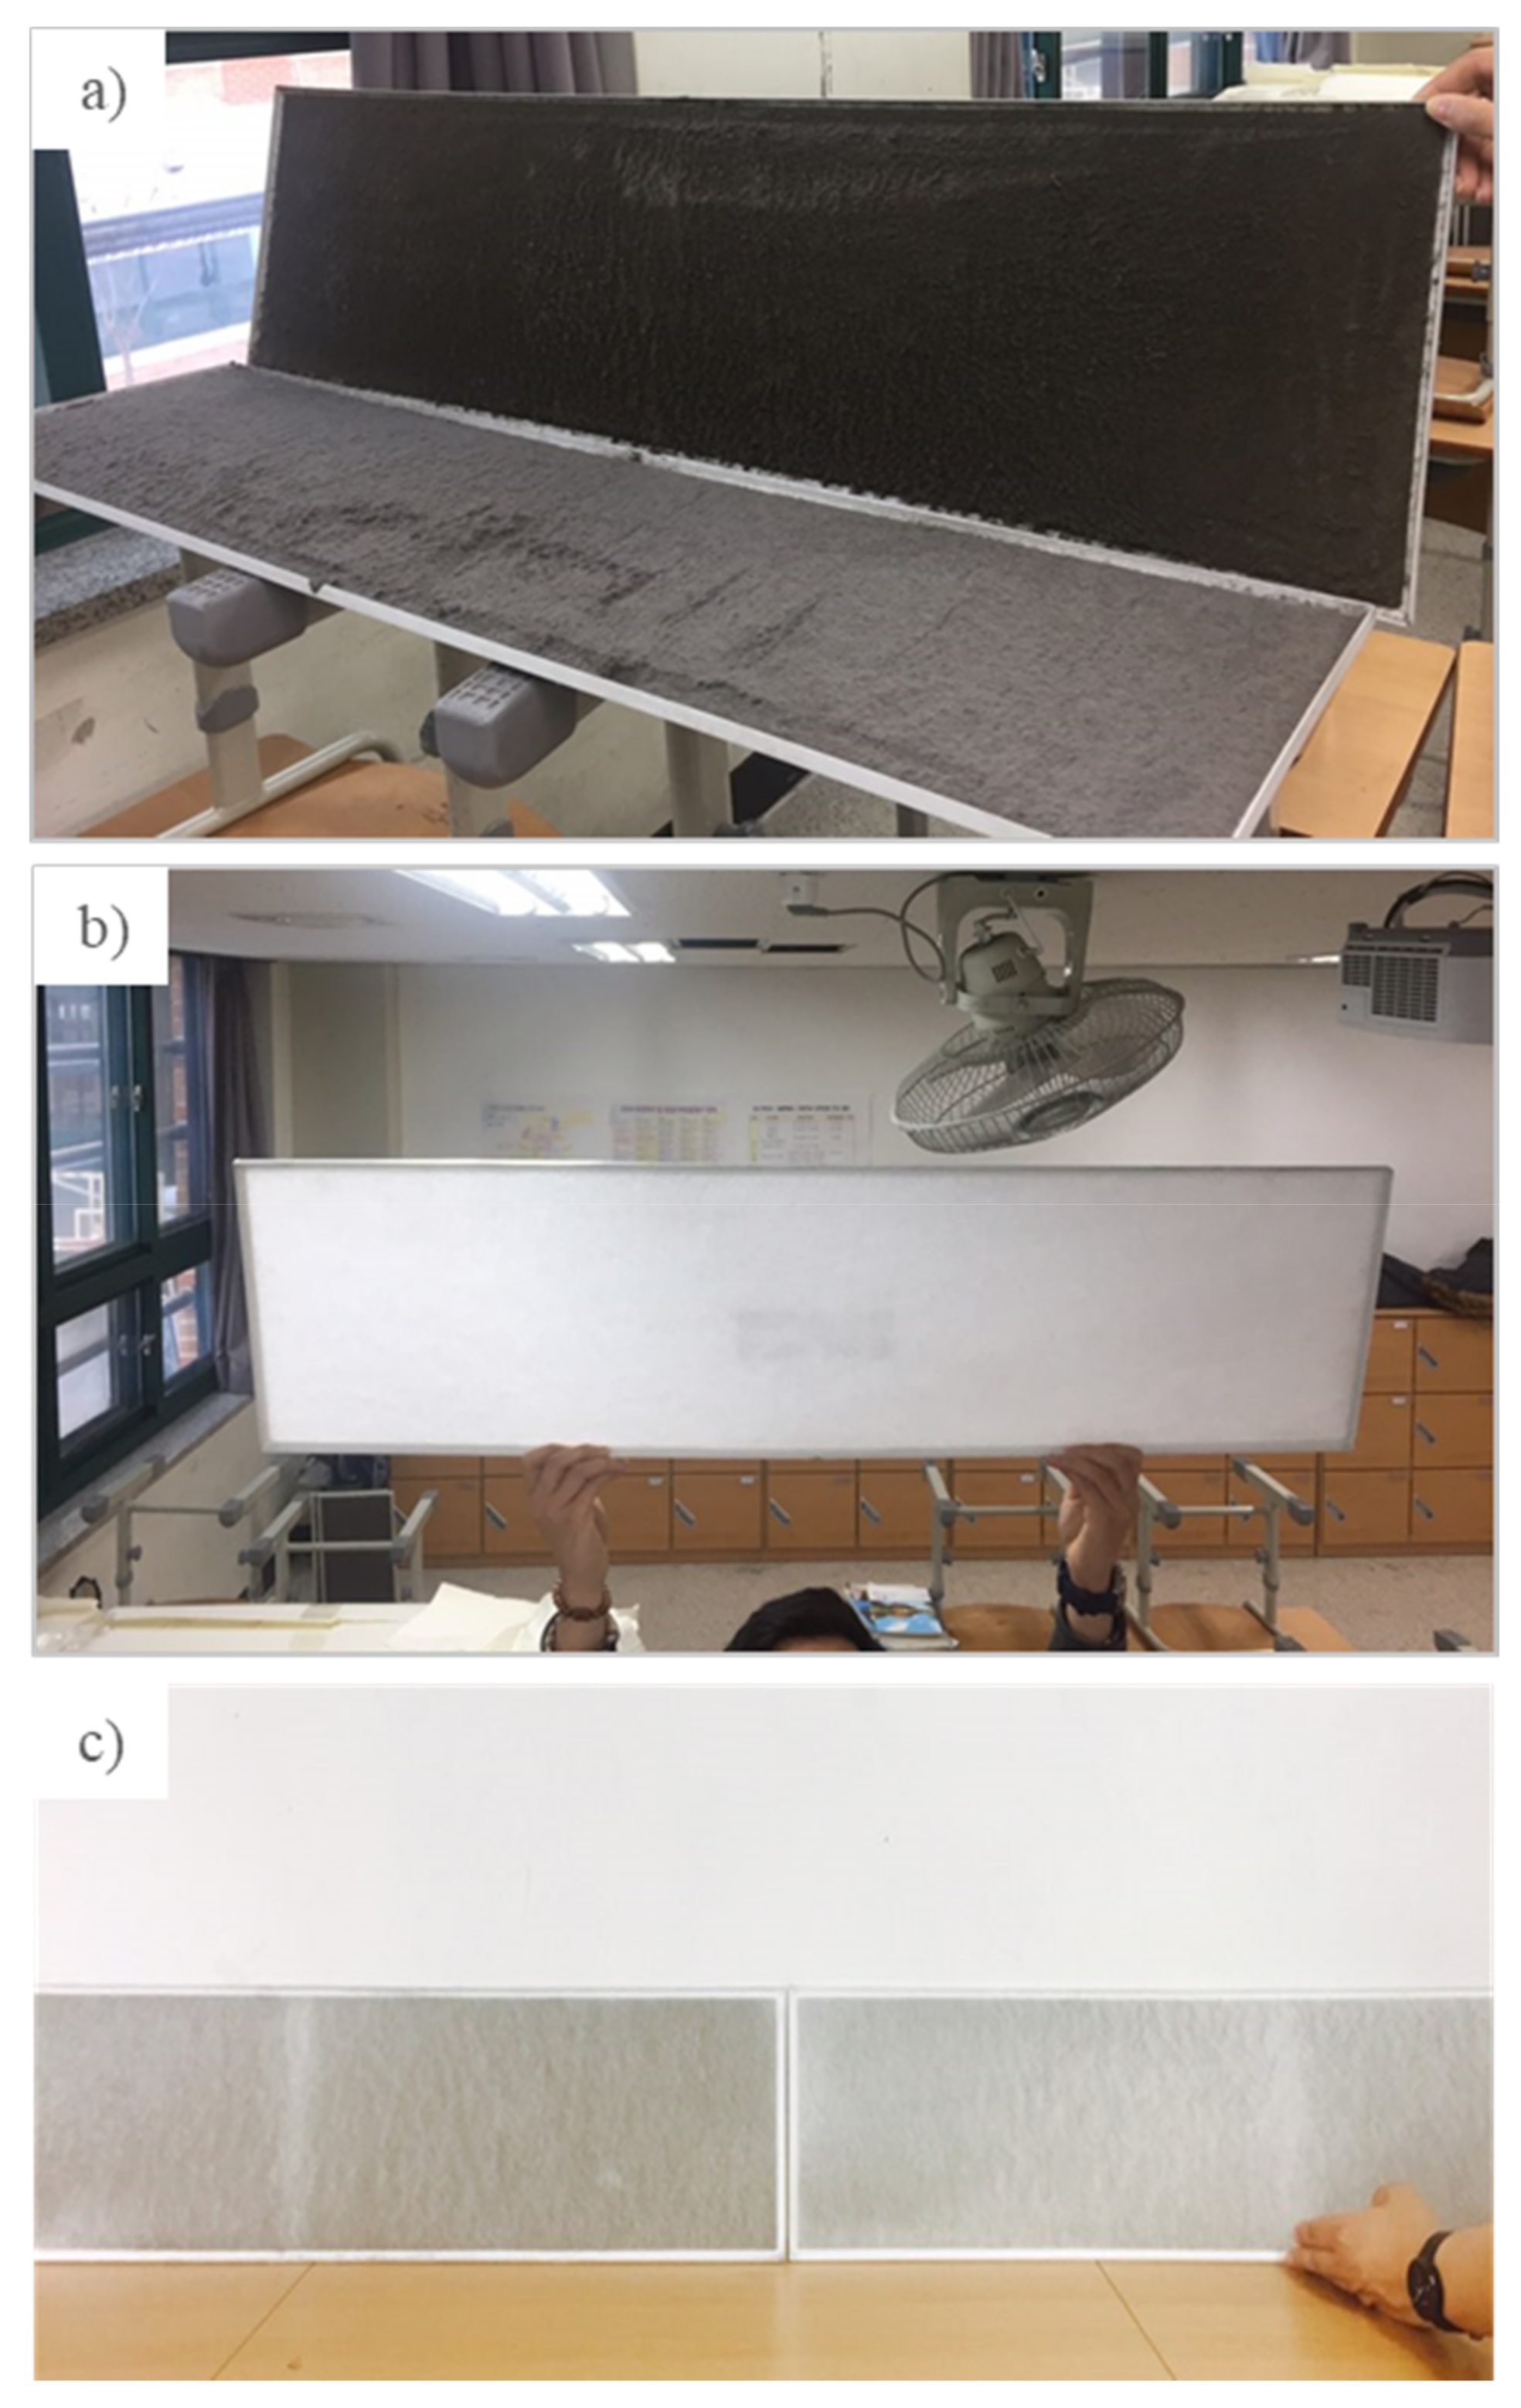
Figure 4.
Measurement of air volume flow rates for each air supply and exhaust diffuser.

Figure 5.
3D modeling of the test classroom for CFD analysis.

Figure 6.
Changes of total airflow rates around the filter replacement period.
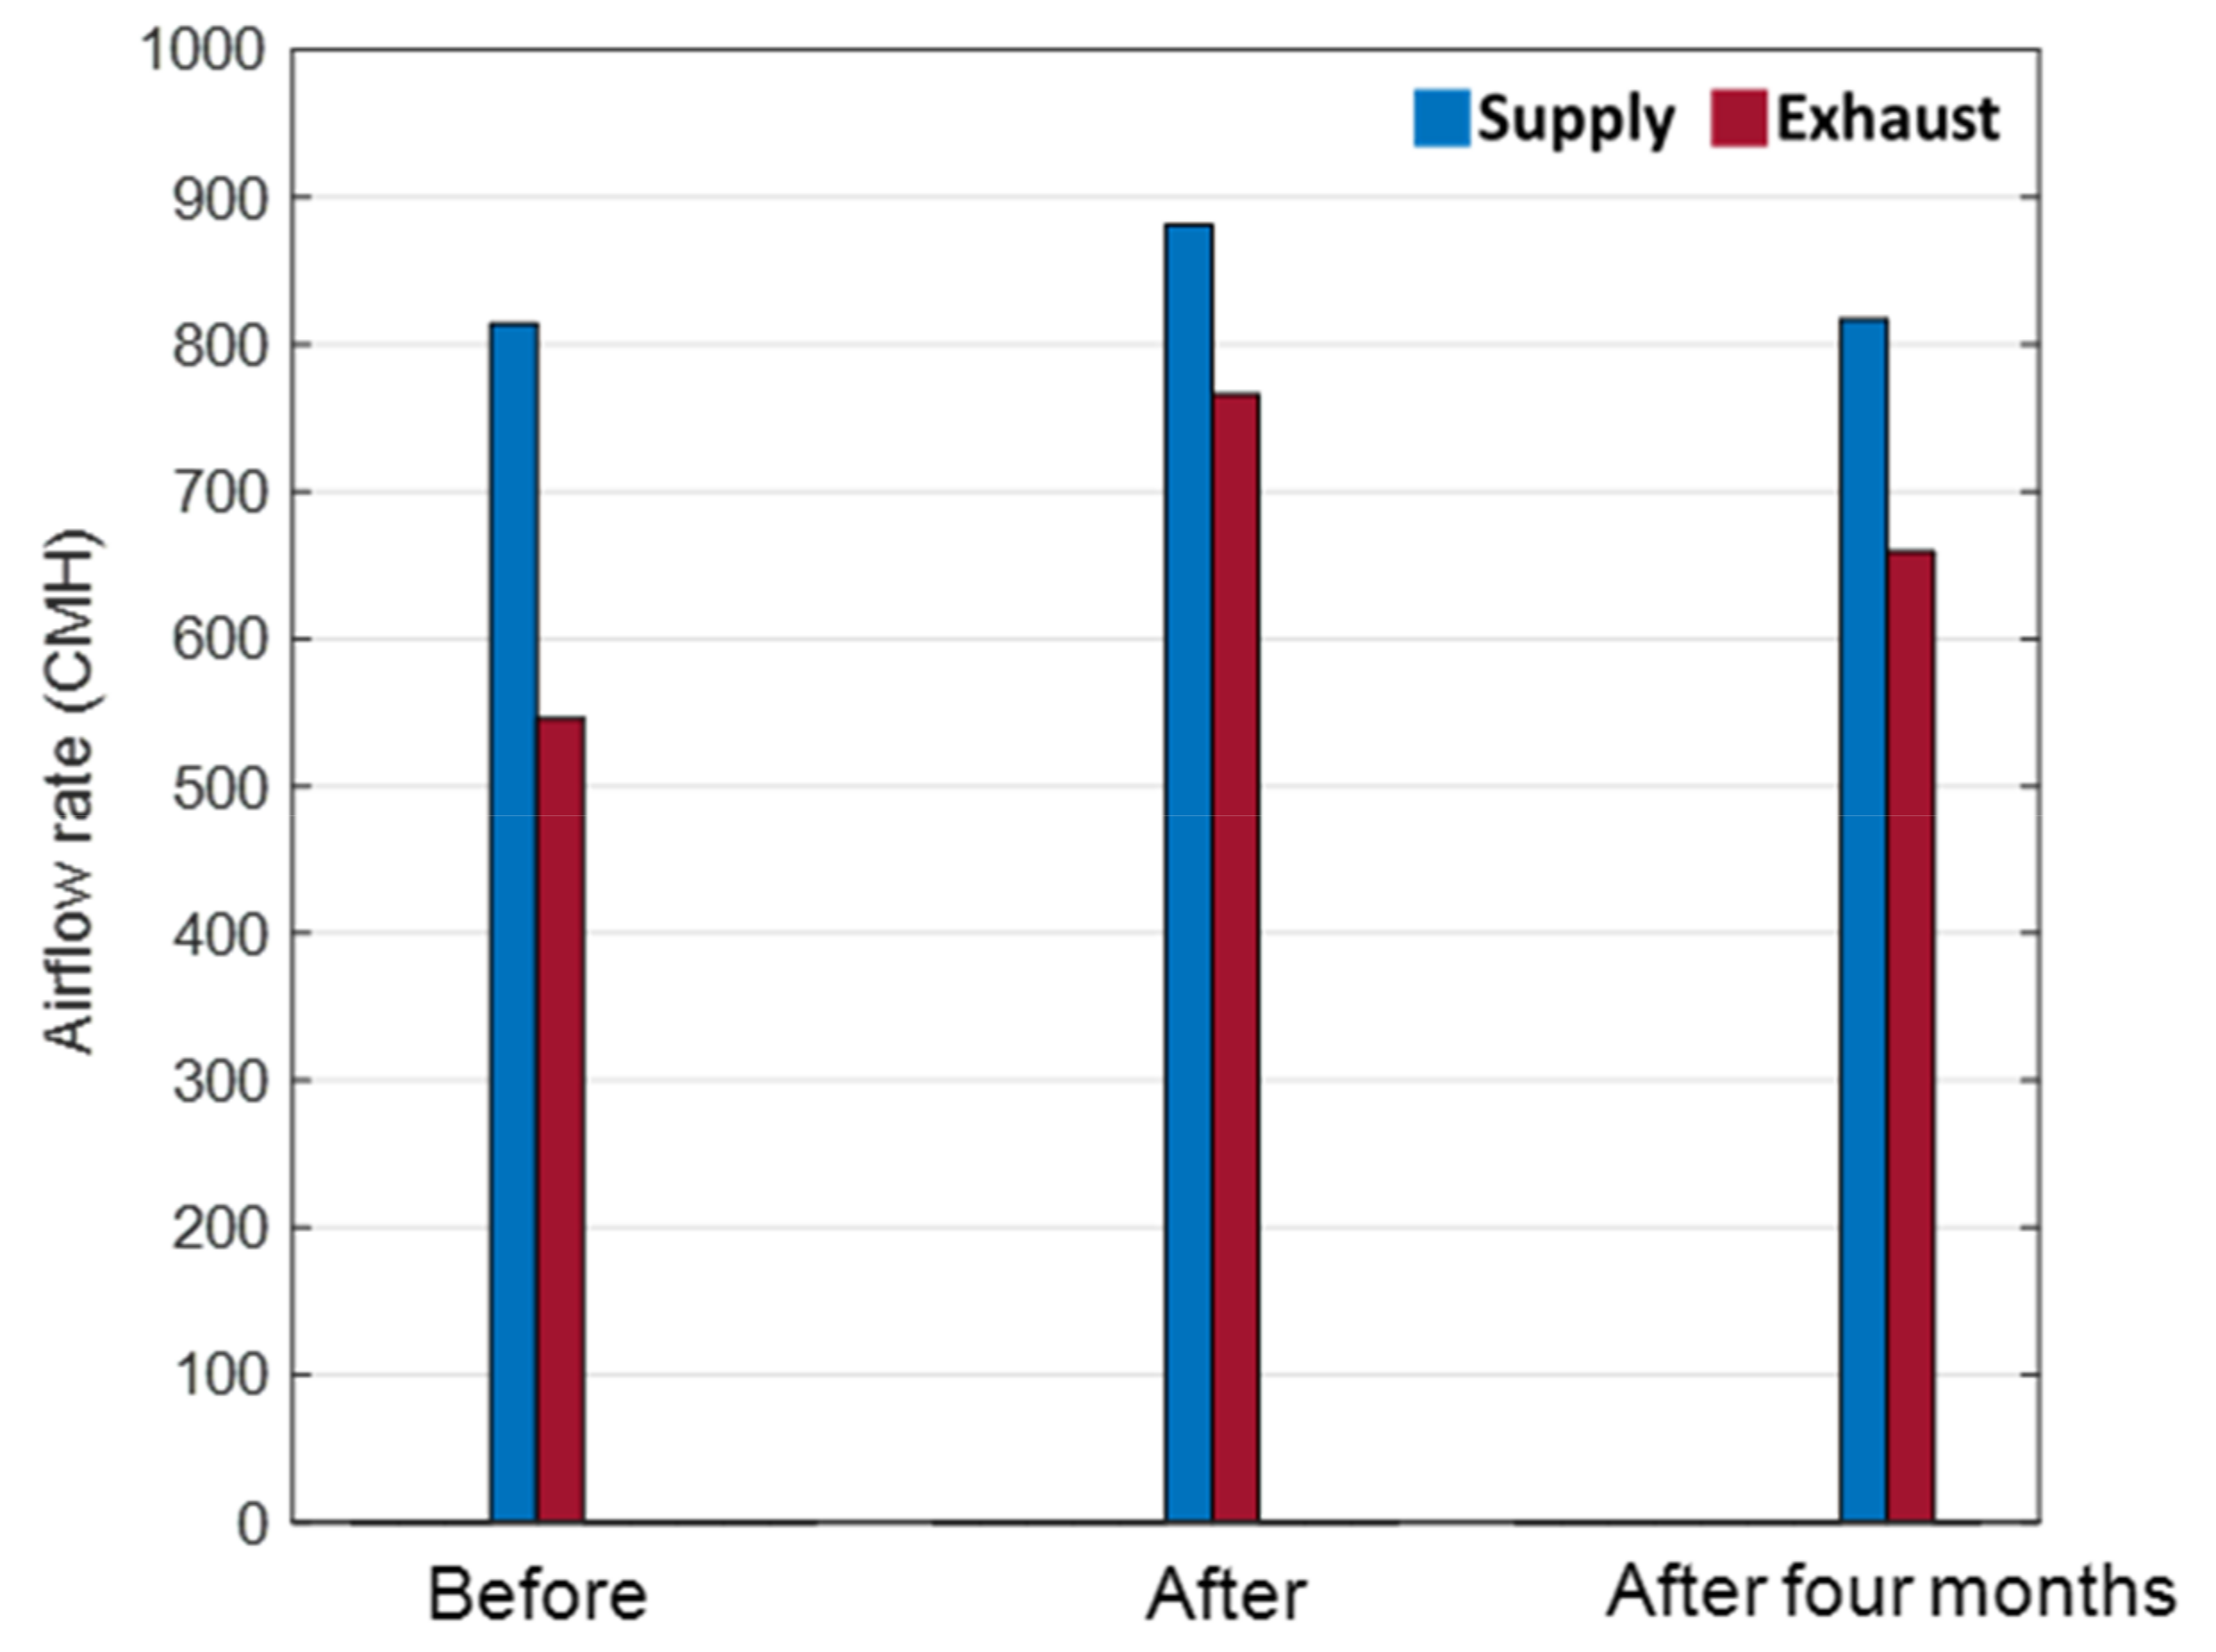
Figure 7.
Daily variation of CO2 concentration in the test classroom.

Figure 8.
Variation of CO2 concentration during a class of 45 min (the second green box in Figure 7).
Figure 8.
Variation of CO2 concentration during a class of 45 min (the second green box in Figure 7).

Figure 9.
Comparison of CO2 concentrations measured during the last 10 min of classes on different days (left: before the filter replacement and right: after the replacement).
Figure 9.
Comparison of CO2 concentrations measured during the last 10 min of classes on different days (left: before the filter replacement and right: after the replacement).

Figure 10.
Comparison of CO2 concentrations after the filter replacement and four months after replacement (left: after the replacement and right: four months after the replacement).
Figure 10.
Comparison of CO2 concentrations after the filter replacement and four months after replacement (left: after the replacement and right: four months after the replacement).

Figure 11.
(a) Side view of airflow patterns and (b) cross-sectional temperature distributions marked with the measuring height (left: heating and right: cooling).
Figure 11.
(a) Side view of airflow patterns and (b) cross-sectional temperature distributions marked with the measuring height (left: heating and right: cooling).


Table 1.
System description of the test classroom.
| Description | Value |
|---|---|
| Volume | 161.28 m³ |
| Number of EHP | 1 |
| Nominal EHP capacity | 6 kW |
| Number of ERVs | 2 |
| Nominal ERV capacity | 500 CMH |
| Number of supply diffusers | 4 |
| Number of exhaust diffusers | 4 |
Table 2.
Indoor initial temperature and internal heat gain condition.
| Conditions | Cooling | Heating |
|---|---|---|
| Room initial temperature (°C) | 30 | 10 |
| Internal heat gain (W/m³) | 36.17 | −25.29 |
Table 3.
EHP and ERV simulation setting.
| Conditions | Cooling | Heating |
|---|---|---|
| Discharge air temperature of ERV (°C) | 26 | 14 |
| ERV diffuser shape | Round shape | Round shape |
| Discharge air temperature of EHP (°C) | 16 | 40 |
| Discharge air volume flow rate of EHP (CMH) | 14 | 14 |
| EHP discharge air velocity (m/s) | 2.33 | 2.33 |
| EHP discharge air angle | Downward 40° | Downward 50° |
Table 4.
Changes in conditions during measurements.
| Conditions | Before | After | After Four Months |
|---|---|---|---|
| Number of occupants | 26 | 31 | 31 |
| EHP mode | Heating | Heating | Cooling |
| Indoor temperature (°C) | 21.4 | 20.6 | 23.4 |
| Outdoor temperature (°C) | −2.1 | 5 | 30.5 |
Table 5.
Results of the supply and exhaust air volume flow rate measurement.
| Before | After | After Four Months | ||
|---|---|---|---|---|
| Supply (CMH) | 1 | 202 | 216 | 196 |
| 2 | 189 | 209 | 203 | |
| 3 | 213 | 225 | 207 | |
| 4 | 210 | 231 | 211 | |
| Total | 814 | 881 | 817 | |
| Exhaust (CMH) | 1 | 144 | 225 | 173 |
| 2 | 143 | 207 | 178 | |
| 3 | 135 | 199 | 176 | |
| 4 | 124 | 135 | 132 | |
| Total | 546 | 766 | 659 | |
Table 6.
CO2 concentration rates in the classroom by adjusting the number of students.
| Conditions | Before Filter Replacement | After Filter Replacement |
|---|---|---|
| Number of students | 26 | 31 |
| Number of students (after adjustment) | 26 | 26 |
| Average CO2 concentration rate (ppm) | 1404 | 1182 |
| Average CO2 concentration rate after adjustment (ppm) | 1404 | 1085 (E = 0.00411 L/s) |
© 2018 by the authors. Licensee MDPI, Basel, Switzerland. This article is an open access article distributed under the terms and conditions of the Creative Commons Attribution (CC BY) license (http://creativecommons.org/licenses/by/4.0/).
Share and Cite
MDPI and ACS Style
Choi, J.-S.; Lee, J.-H.; Kim, E.-J. Effects of ERV Filter Degradation on Indoor CO2 Levels of a Classroom. Sustainability 2018, 10, 1215. https://doi.org/10.3390/su10041215
AMA Style
Choi J-S, Lee J-H, Kim E-J. Effects of ERV Filter Degradation on Indoor CO2 Levels of a Classroom. Sustainability. 2018; 10(4):1215. https://doi.org/10.3390/su10041215
Chicago/Turabian StyleChoi, Jae-Sol, Jae-Hyuk Lee, and Eui-Jong Kim. 2018. "Effects of ERV Filter Degradation on Indoor CO2 Levels of a Classroom" Sustainability 10, no. 4: 1215. https://doi.org/10.3390/su10041215
Note that from the first issue of 2016, this journal uses article numbers instead of page numbers. See further details here.