An Assessment of Direct Dissolved Inorganic Carbon Injection to the Coastal Region: A Model Result

1
Department of Oceanography, National Sun Yat-sen University, Kaohsiung 80424, Taiwan
2
Green Energy and Environment Research Laboratories, Industrial Technology Research Institute, Hsinchu 31040, Taiwan
*
Author to whom correspondence should be addressed.
Sustainability 2018, 10(4), 1174; https://doi.org/10.3390/su10041174
Submission received: 1 January 2018
/
Revised: 2 April 2018
/
Accepted: 9 April 2018
/
Published: 13 April 2018
(This article belongs to the Special Issue Marine Carbon Cycles)
Abstract
:The amount of carbon dioxide (CO2) in the atmosphere has increased in the past 60 years and the technology of carbon capture and storage (CCS) has recently been extensively studied. One of the strategies of CCS is to directly inject a high dissolved inorganic carbon (DIC) concentration (or high partial pressure of carbon dioxide, pCO2) solution into the ocean. However, the carbonate dynamics and air-sea gas exchange are usually neglected in a CCS strategy. This study assesses the effect of a DIC-solution injection by using a simple two end-member model to simulate the variation of pH, DIC, total alkalinity (TA) and pCO2 between the river and sea mixing process for the Danshuei River estuary and Hoping River in Taiwan. We observed that the DIC-solution injection can contribute to ocean acidification and can also lead the pCO2 value to change from being undersaturated to oversaturated (with respect to the atmospheric CO2 level). Our model result also showed that the maximum Revelle factors (Δ[CO2]/[CO2])/(Δ[DIC]/[DIC]) among varied pH values (6–9) and DIC concentrations (0.5–3.5 mmol kg−1) were between pH 8.3 and 8.5 in fresh water and were between 7.3 and 7.5 in waters with a salinity of 35, reflecting the changing efficiency of dissolving CO2 gas into the DIC solution and the varying stability of this desired DIC solution. Finally, we suggest this uncoupled Revelle factor between fresh and salty water should be considered in the (anthropogenic) carbonate chemical weathering on a decade to century scale.
1. Introduction
Increasing atmospheric carbon dioxide (CO2) amounts in the past 60 years are reducing oceanic pH and calcium carbonate saturation, both of which are key factors influencing marine organisms [1,2]. Patents related to carbon capture and storage have reached more than 1000 in 2013 [3]. One of the CO2 sequestration methods is a direct dissolved inorganic carbon (DIC) solution (or CO2 gas) injection into the ocean [4]. The cost and effect of CO2 capture and storage have been evaluated in previous studies. However, the variation of the carbonate system due to its natural characteristics is usually neglected. The effect of direct DIC injection into the ocean has been suggested [5], as well as the effect of increasing atmospheric CO2 level on the ocean [6]; that is, ocean acidification. Moreover, the nature of the carbonate system includes total alkalinity (TA) and partial pressure of CO2 (pCO2), in addition to pH and DIC. The effect of a direct DIC injection on the internal carbonate variation, among the above four parameters, is still unclear.
The oceanic carbonate system includes several important aspects and one of them is the air-sea CO2 gas exchange flux [7,8]. At ocean station ALOHA (A Long-term Oligotrophic Habitat Assessment) in the subtropical North Pacific Ocean, the pCO2 in the surface seawater followed the increasing atmospheric CO2 values in the past two decades [6], showing that the ocean is a sink of atmospheric CO2. The continental shelf is also a sink of atmospheric CO2 and the river-dominated marginal sea can be affected by the river nutrients, such as high nitrate concentrations [9,10,11]. The pCO2 to salinity relationship between the river and the ocean mixing process is a bimodal and non-linear relationship [10]. In the coastal ocean and estuary, the pH and salinity relationship is also non-linear, with a pH minimum zone at low salinities (0 < S < ~10) [12]. Eutrophication and hypoxia (dissolved oxygen less than 2 mg L−1) can further lead to synergetic acidification in the bottom water [13]. The water between oxic/anoxic conditions can also lead to a reduced pH in the water column [14].
In this study, we focus on the effect of a DIC-solution injection to the estuary and the ocean. We use two coastal regions in Taiwan to simulate the carbonate dynamics during river-to-sea mixing processes for two coastal regions. We first apply the pCO2-salinity simulation and pH-salinity simulation and we further examine the buffering capacity between CO2 and DIC. Finally, we systematically compare the variations among pH, DIC and pCO2 and also suggest the role of buffering capacity of air-sea gas exchange during this CO2 dissolving and the DIC injection processes.
2. Study Sites and Methods
We follow Huang et al. [15] and assume that the mixing process between riverine and sea end-members can be described as fractions of two end-members; that is, the water is a mixture of the two end-members at any salinity point of the diluted water.
where fR and fS are fractions of the riverine and oceanic end-members, respectively. Similarly, SR and SS are the salinity of the riverine and oceanic ones, respectively. Sal is the salinity of mixed water based on the sum of the salinity end-member multiplied by its fraction. The desired salinity can be calculated by giving the fraction and the end-members. Desired TA and DIC (C) for a conservative mixing scenario can also be calculated by using a similar equation (end-members in Table 1):
For any set of (Si, TAi), we can derive fRi and fSi. Therefore, we can calculate the conservative mixing concentrations (Cm) of DICi and NO3i.
where CR and CS are the end-member concentrations of the fresh water and the seawater, respectively (Table 1).
Furthermore, we also simulate the biological effect on the carbonate system by calculating the effect of biological nitrate uptake. One unit of nitrate uptake can increase one unit of TA [16,17], suggesting an effect on the conservative mixing equation as the follows:
where NO3Bio represents the biological uptake. We use C:N = 106/16 in the Redfield ratio [18] to convert the biological nitrate uptake and DIC uptake. The above mixing and biological uptake simulations are modeled by TA and DIC and the corresponding pH and pCO2 are calculated by applying TA and DIC in the CO2SYS (Matlab version) with K1 and K2 from Millero et al. [19].
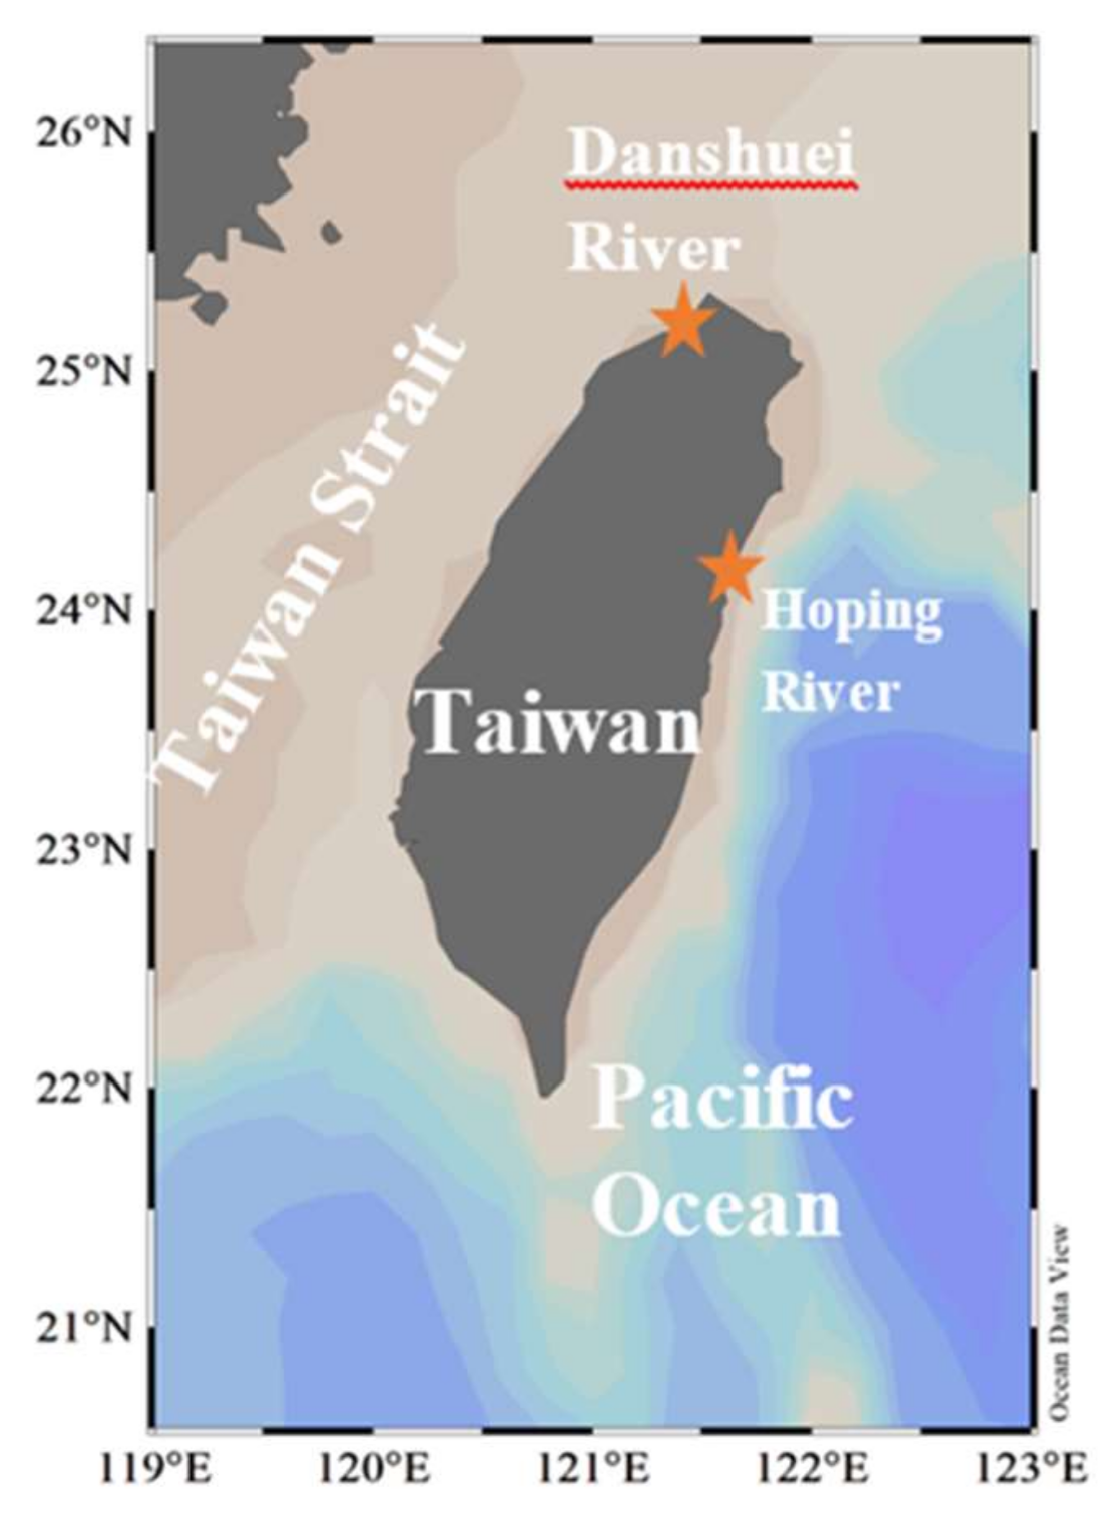
We first use the above model to simulate the current case at the Danshuei River and Hoping River in Taiwan (Figure 1), along with their corresponding riverine and sea end-members (as seen in Table 1). Temperature, salinity, TA and DIC for both Danshuei and Hoping rivers were measured and collected during the fall of 2017. TA and DIC samples were stored at room temperature and were analyzed in the laboratory at National Sun Yat-sen University, with a resolution of 0.1% [20]. A nitrate-to-salinity relationship was assumed based on data reported by Wen et al. [21] for the Danshuei River (details in Supplementary Materials). We use this biological removal as the high estimation. We also notice that the hypoxic condition has been observed at the Danshuei River estuary. The DIC concentration should be high in such a hypoxic condition and a further DIC injection should be rejected at such conditions.
We further simulated the DIC injection cases with four varied pCO2 and pH values. The pCO2 range for an exhausted gas is about 2000 to 4000 ppm and the pH value for the desired solution should be in a range of 6–8 to maintain HCO3− as the major component in the DIC solution. A low pH value (<6) may lead to a dominating component of pCO2 and the following degassing. Thus, DIC injection scenarios can be separated into two cases: (1) the desired solution is controlled at a pH of 6 and is equilibrated with a pCO2 of 2000 µatm or (2) the desired solution is controlled at a pH of 8 and is equilibrated with a pCO2 of 2000 µatm. The CO2SYS (Matlab version) is used with K1 and K2 from Millero et al. [19] to calculate the initial desired TA and DIC according to the above pH and pCO2 values. These two DIC injection scenarios can be compared with the above two cases in the Danshuei and Hoping rivers. We only choose the Danshuei River to present in this study as it is the largest river in Northern Taiwan.
We notice that there is a large gap in the pH and pCO2 of these two injection scenarios. To fulfill the gaps between two extreme injection scenarios, we systematically considered the pH range between 6 and 9 (with 0.1 intervals) and the DIC concentration between 0.5 to 3.5 mmol kg−1 (with 0.05 mmol kg−1 intervals) to cover their general range in river and salty waters. We use the CO2SYS (Matlab version) again with the same K1 and K2 to calculate the corresponding pCO2 and the buffering capacity between CO2 and DIC.
3. Results and Discussion
3.1. River-to-Sea Simulation Conditions
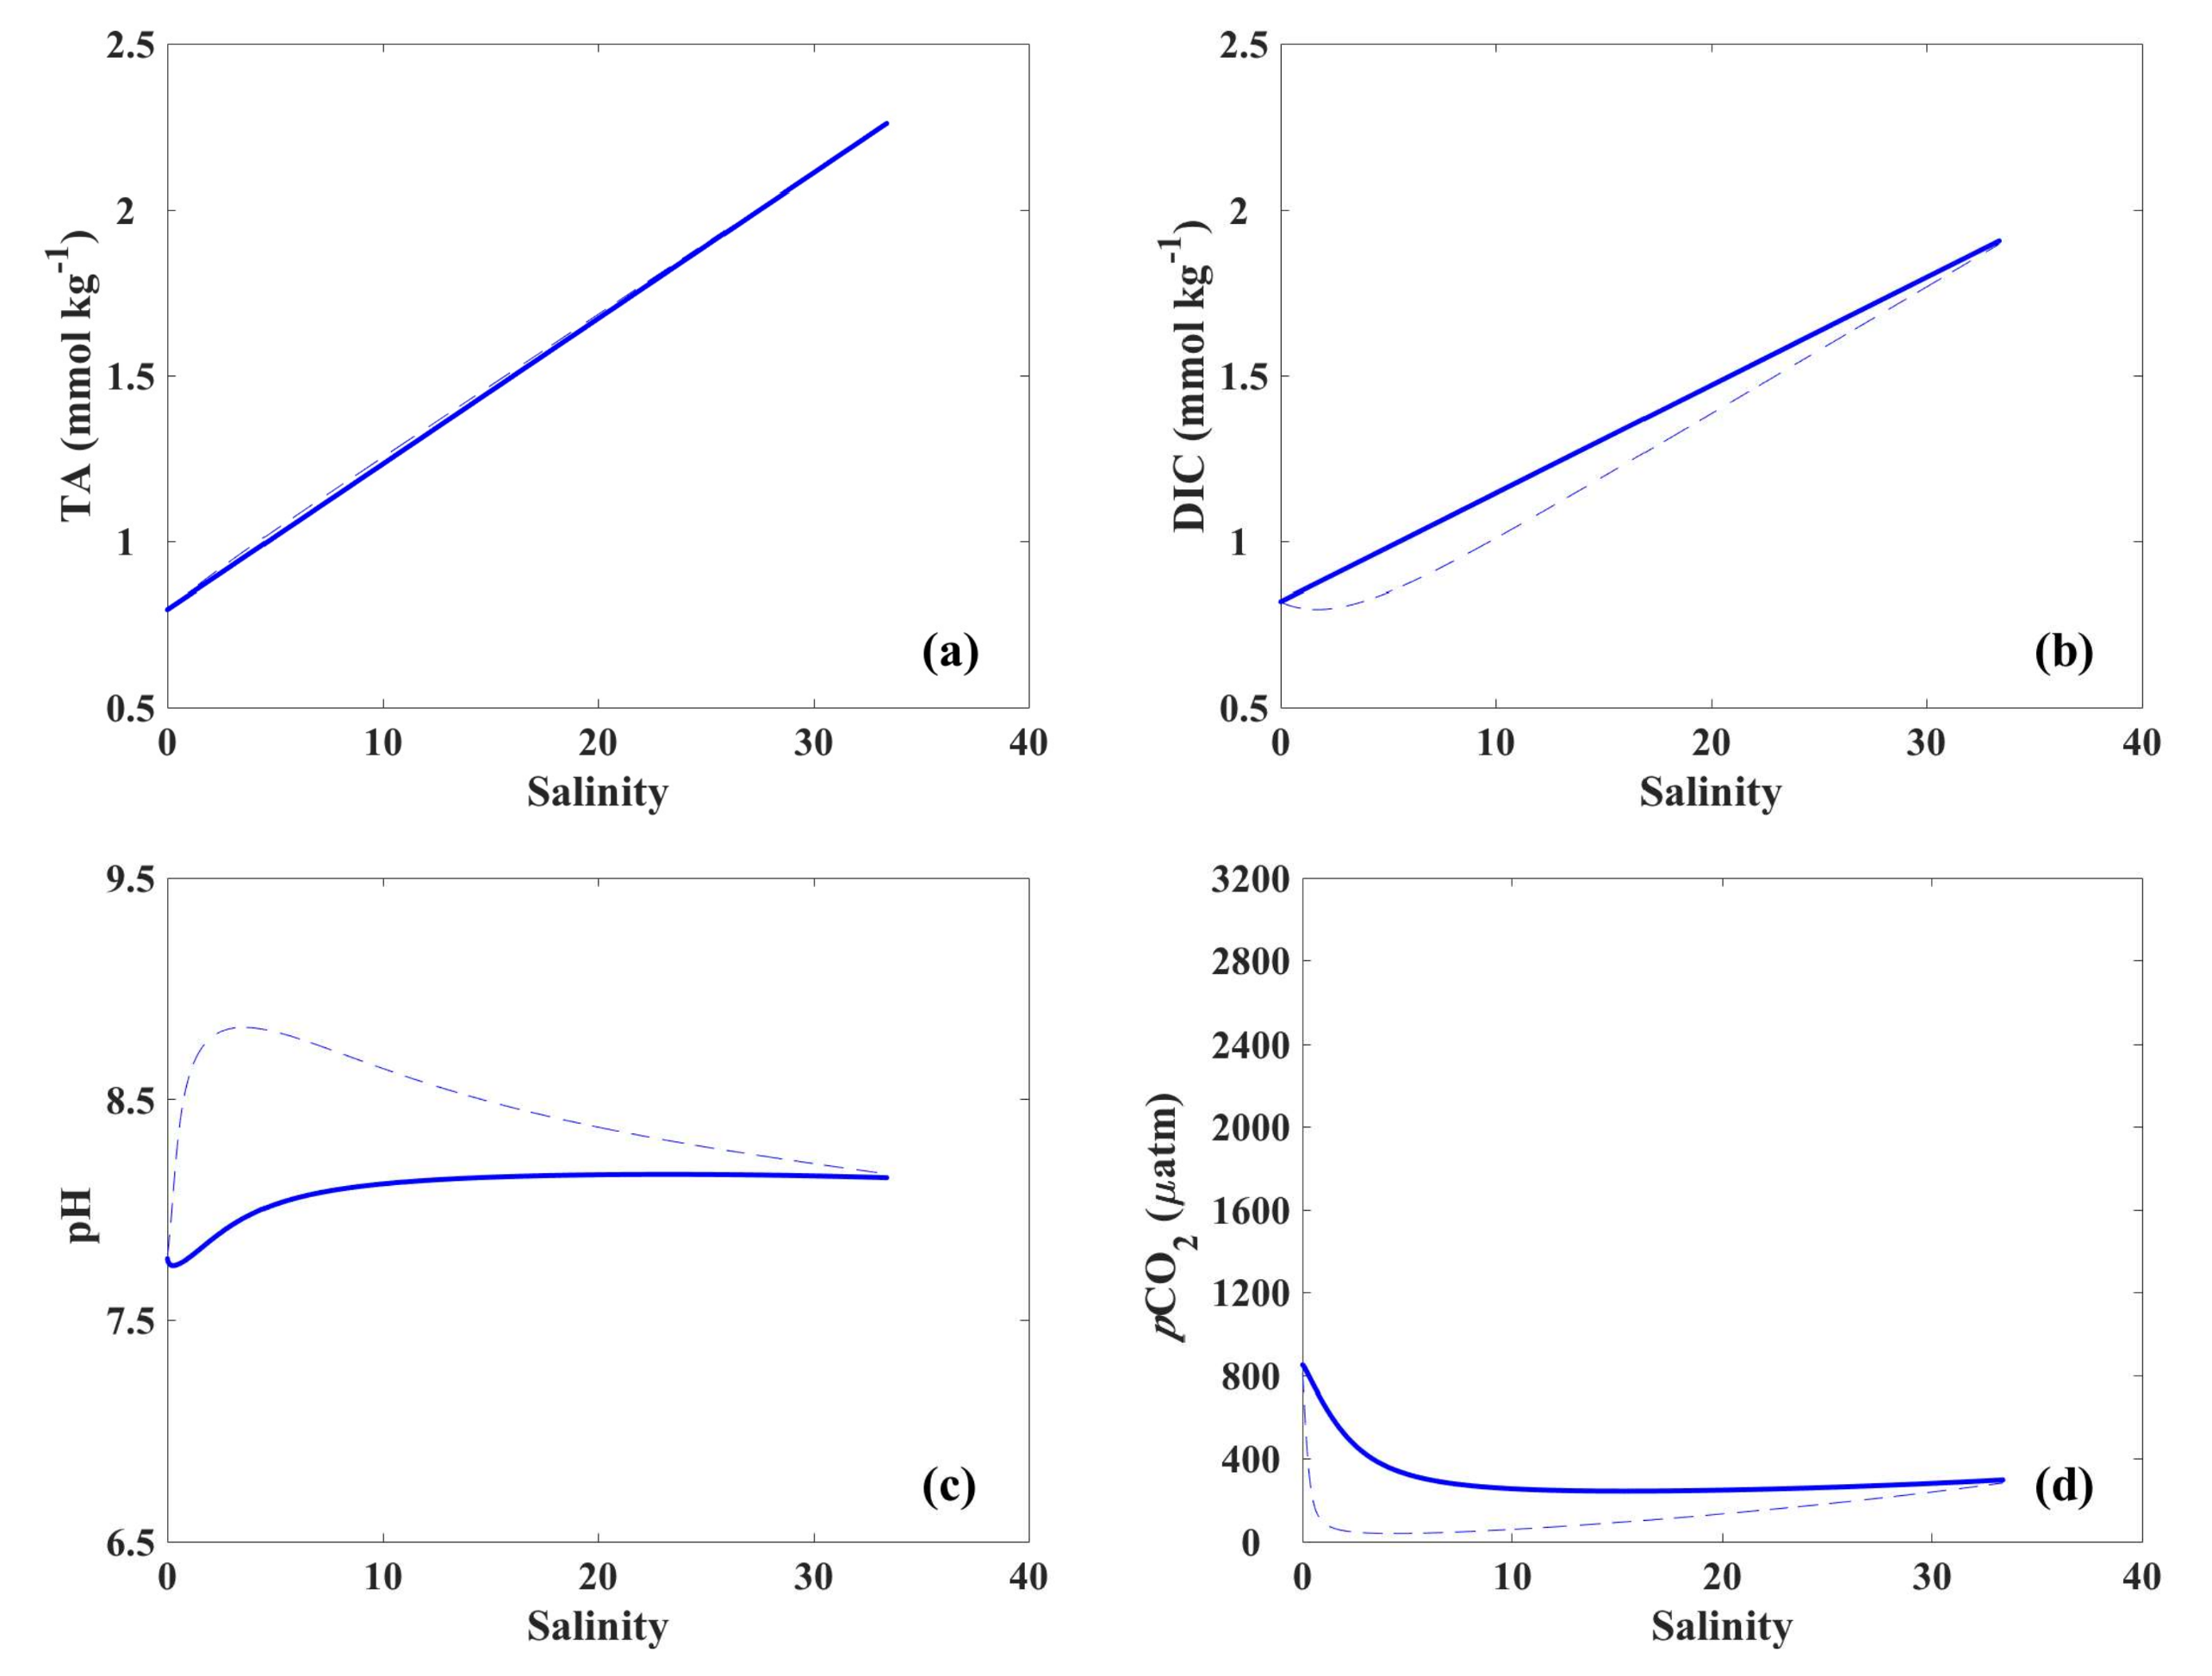
In the conservative mixing scenario, the model result displayed conservative mixing for both TA and DIC along the salinity gradient in the Danshuei estuary, as we have set (Figure 2a,b). The variations of pH and pCO2 values along the salinity gradient were nonlinear. The pH value showed a minimum value at salinities 1 to 2 and varied over a larger range in low salinities. The opposite was true in high salinities. The variation of pCO2 was bimodal, displaying high values to both riverine and sea end-members. For the biological uptake scenario, TA slightly changed and maximum DIC changed at middle salinities, corresponding to the maximum NO3 uptake. The pH and pCO2 values showed clear differences between conservative mixing and biological uptake scenarios (Figure 2c,d); that is, pH values increased and pCO2 decreased after biological uptake.
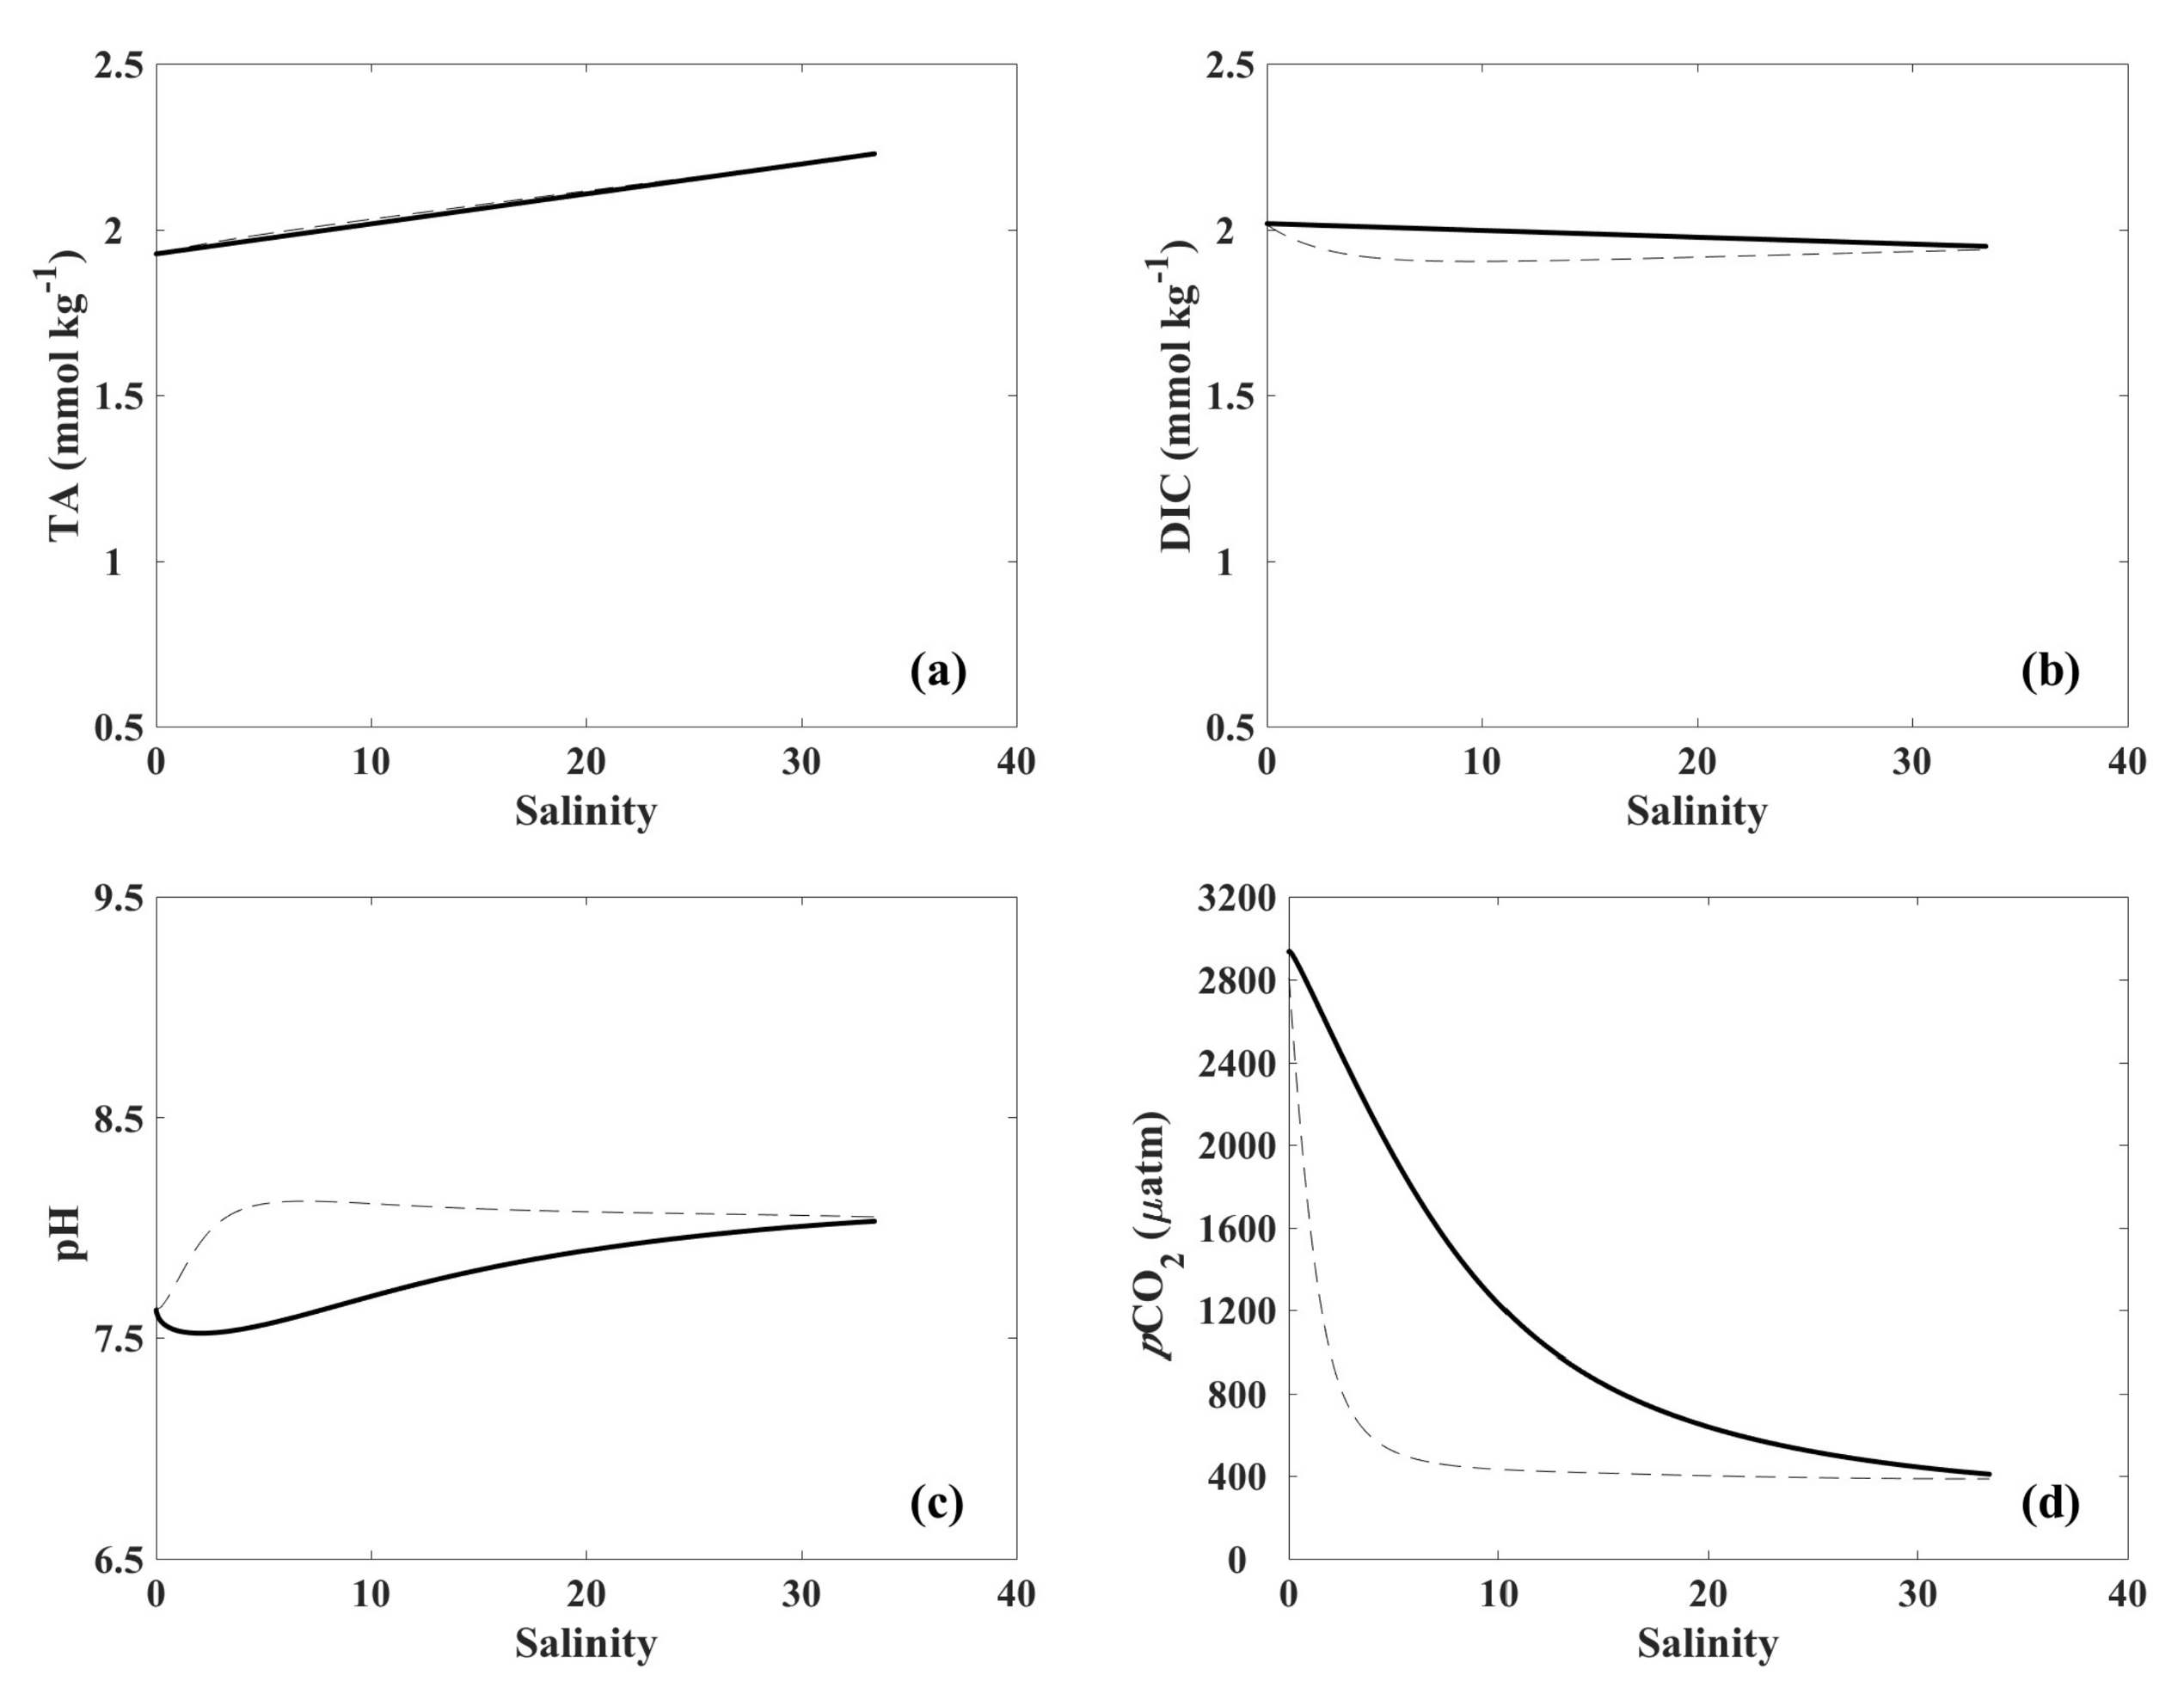
Hoping River showed river-to-sea mixing and was also affected by biological uptake (Figure 3). TA was mixed conservatively and was less affected by biological uptake (Figure 3a). The DIC concentration was affected by biological uptake in a narrow range from the mixing line. Signals of increased pH and decreased pCO2 were also observed by comparing the biological uptake scenario and the conservative mixing one (Figure 3c,d).
3.2. Injection Scenarios under Controlled pH and pCO2
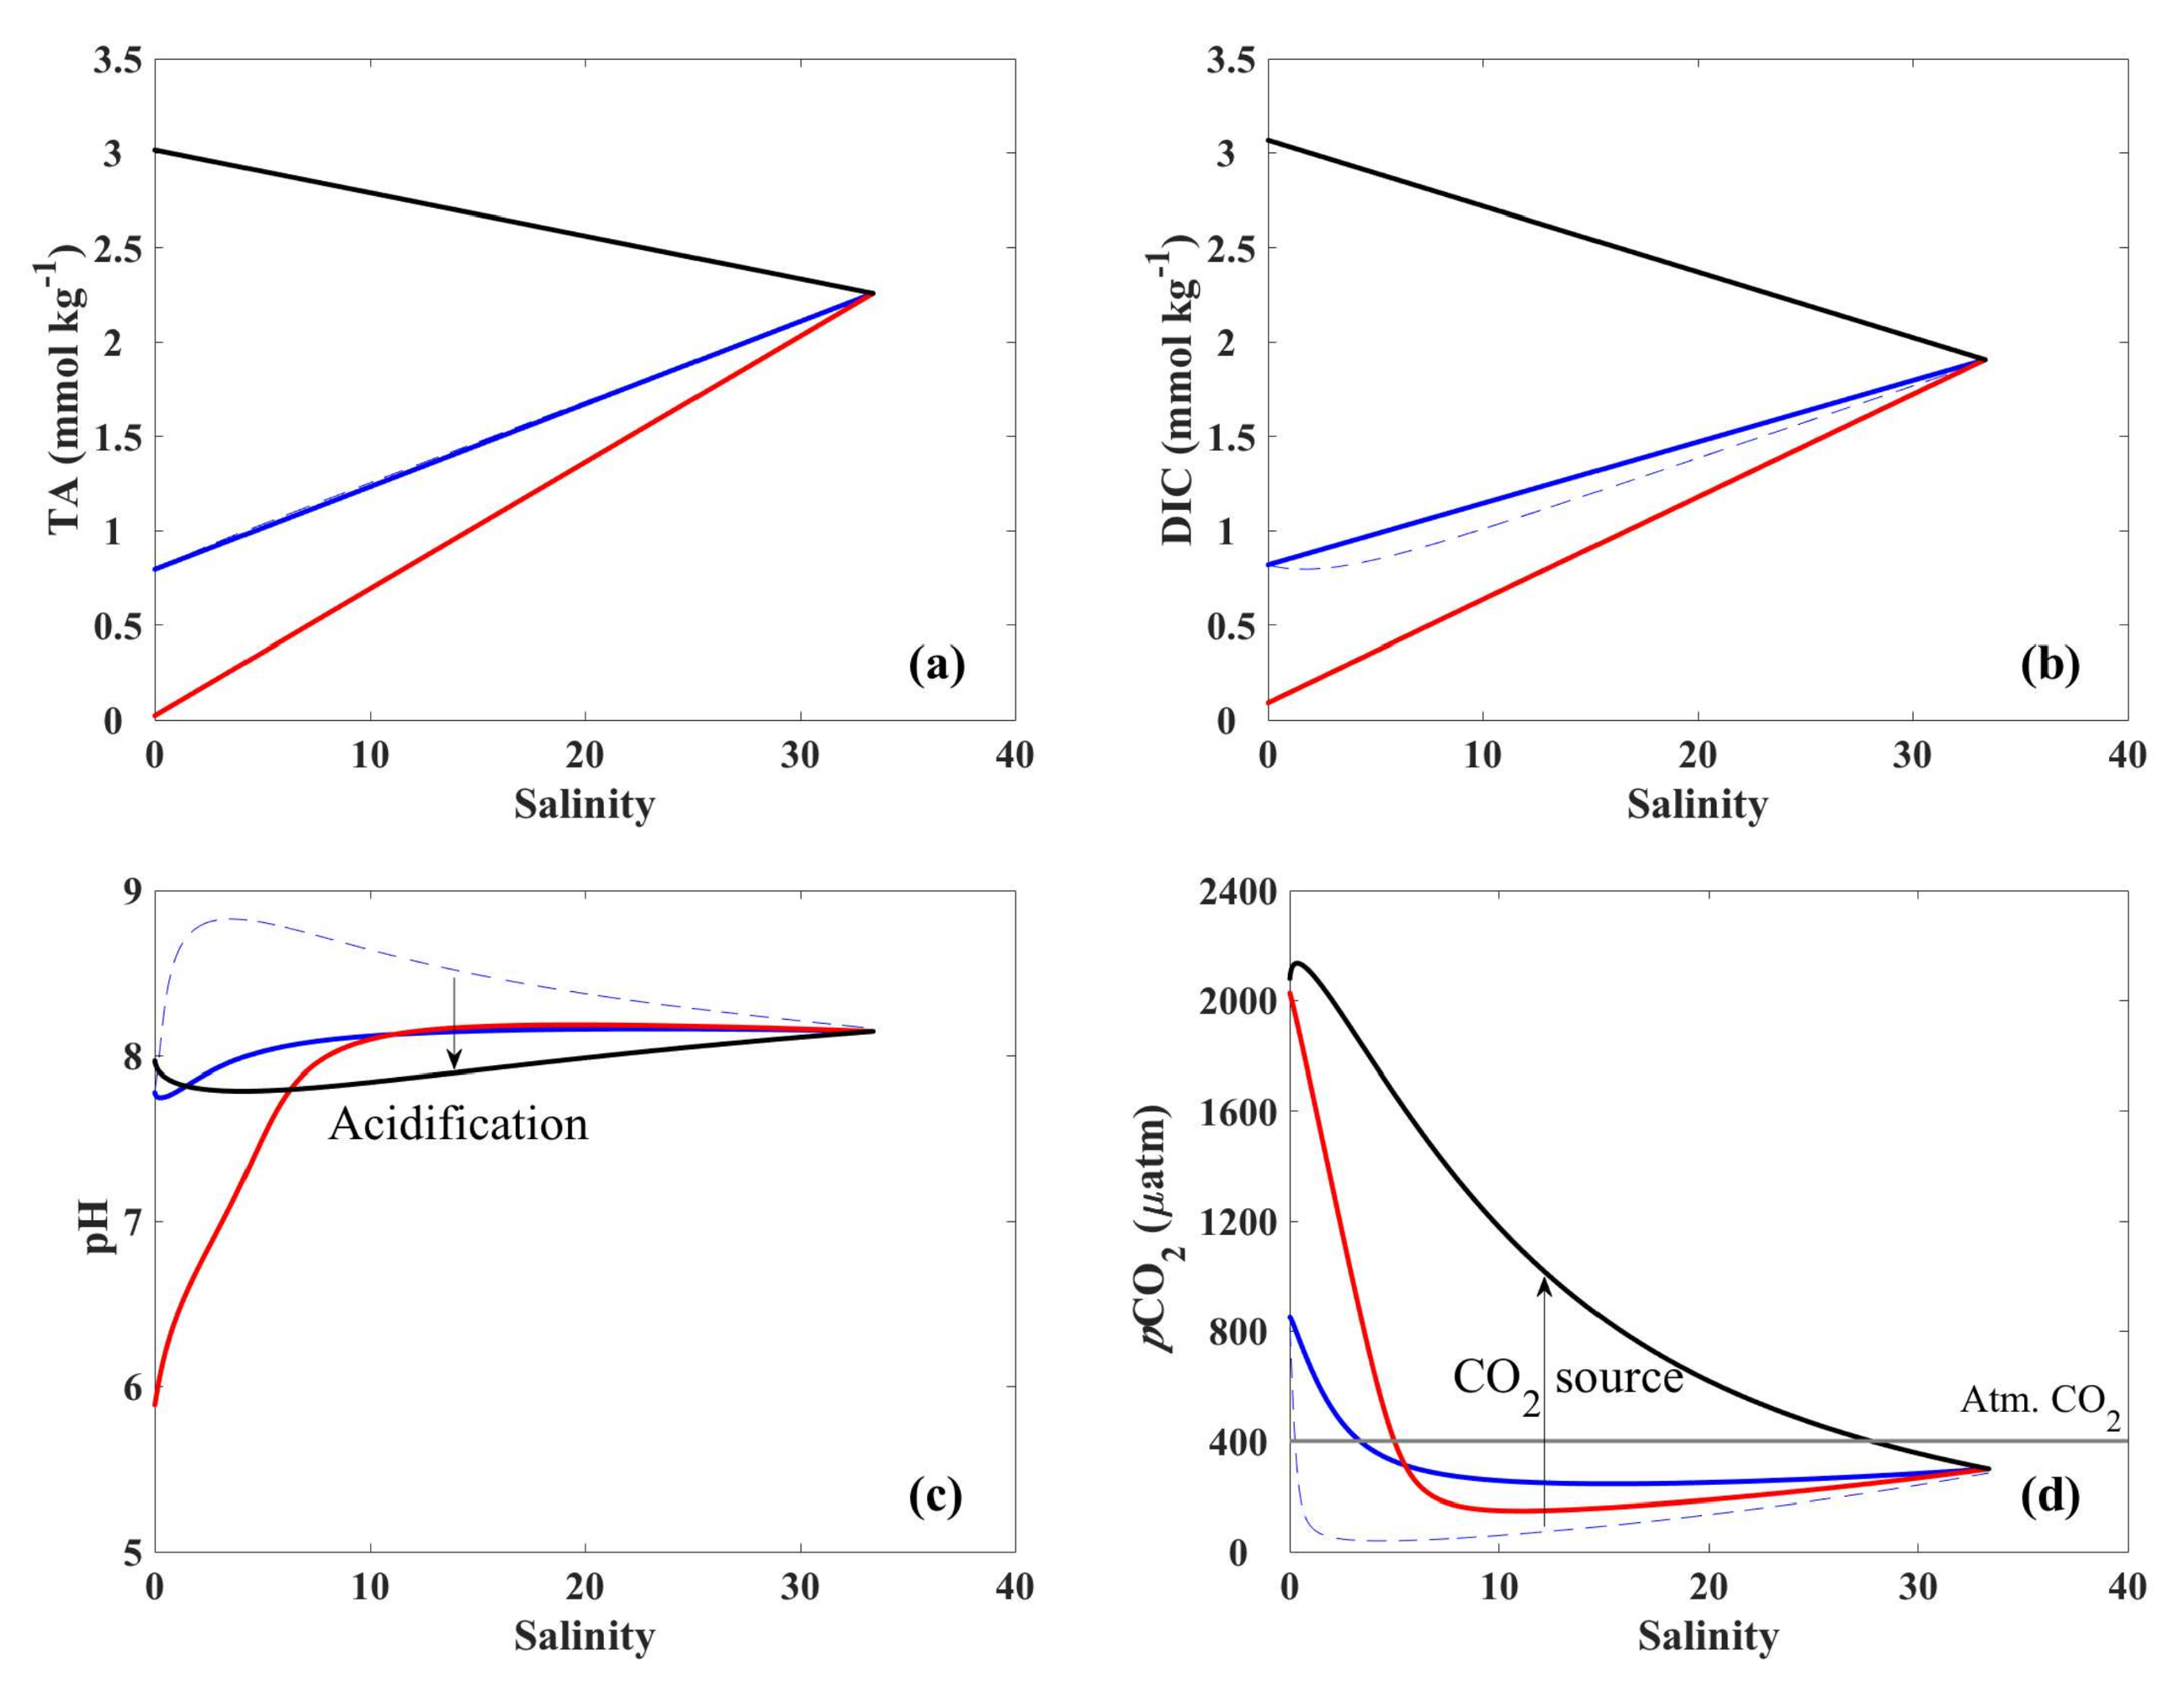
The simulation of DIC-injection results (with controlled pH and pCO2 in Section 2) demonstrates the impact of this DIC solution on brackish and salty waters. These two injection scenarios can be compared with both cases in the Danshuei River and Hoping River and we only chose the former one to present in this study as it is the largest River in Northern Taiwan. When the pH value is maintained at 6, the equilibrated DIC and TA values in a solution with a salinity of 0 are very low (~100 µmol L−1) (Figure 4a–c). During this river-to-sea mixing processes, this pCO2 value decreases quickly and its corresponding pH value increases in water with salinities of less than 10 (Figure 4c,d). When salinities are above 10, the pCO2 values are below that of the current scenario and its corresponding pH values are very close to that of the current scenario (Figure 4c). Though this scenario may reduce surface pCO2 in middle to high salinity regions (Figure 4d), this scenario has a profound effect of acidification on the low salty water (Figure 4c). Moreover, while pCO2 value is high in this case, the DIC concentration is low and reduces the efficiency of DIC delivery (Figure 4b). We will use the buffering capacity to discuss this later.
When pH is controlled at 8 (close to the current pH value), the expected DIC concentration can be much higher than the one at a pH of 6 (Figure 4b). However, the pH decreases during the mixing process, especially at low salinities (that is, salinities between 0 to 10) (Figure 4c). Such an occurrence of the lowest pH along the salinity gradient has been reported as a “pH minimum zone” [12]. The reduced pH in this salinity leads to acidification in this low salinity region (Figure 4c). Moreover, the pCO2 (in a pH of 8 scenario) becomes supersaturated (over atmospheric 400 μatm) over the entire salinity region (Figure 4d). When the water pCO2 value is lower than the atmospheric CO2 level, the water pCO2 is undersaturated with respect to the atmospheric CO2, resulting in this water acting as a sink of atmospheric CO2. When the water pCO2 value is oversaturated, this water acts as a CO2 source. This tremendous change in pCO2 value changes this region from acting as a sink of CO2 to a source when we compare this scenario to the situation in the Danshuei River (Figure 4d). In other words, the impact of this high DIC and high pCO2 injection scenario is not only acidification but also a change in the direction of air-sea CO2 gas exchange.
3.3. DIC Buffering Capacity along the Salinity Gradient
We have shown the relationship between each carbonate parameter and salinity in Figure 2 and Figure 3. Theses correlations and their buffering capacity can vary during the mixing process. The carbonate system has the characteristic of buffering capacity [23,24] which should be considered when dissolving CO2 gas into water and during the following DIC injection. Here, we use the Revelle factor (RF) [23] to represent the sensitivity.
A high RF value means that the CO2 variation is sensitive to the DIC variation and the buffering capacity is reduced.
To better show the change of pCO2 alongside the relationship between pH and DIC, we systematically demonstrate the three aforementioned parameters together and further display it against varied salinity and depth (Figure 5). This is because the dissolution constants (K1 and K2) in the carbonate system are related to salinity and pressure (reflecting on the depth). We can systematically compare the diagrams between in fresh water and salty water to distinguish the pCO2 variation and its corresponding buffering capacity (Figure 5). The RF is not linearly correlated with pH and its maximum values are around pH 7.8–8.8 for corresponding DIC concentrations. For example, the pCO2 value in varied pH levels and DIC concentrations between the mixing process in the Danshuei River estuary can be generally displayed by the two panels (salinity 0 and 35) (Figure 5a,c). Their corresponding variations of RF are seen on the other two panels (Figure 5b,d). When the pCO2 changes from the riverine end-member to the oceanic one (Figure 5a,c), the buffering factor increases and then later decreases (Figure 5b,d). Moreover, though the pCO2 value of the end-member in the Hoping River was high, its corresponding RF was low. During the river-to-sea mixing processes for the Hoping River and its adjacent area, the RF values were within a larger range than the range of RF values for the Danshuei River mixing process (Figure 5d), suggesting that the CO2 value during the mixing process of the Hoping River was more sensitive to the DIC change than in the mixing process at the Danshuei River estuary. Furthermore, the pCO2 and RF will change slightly from the surface to the depth of approximately 800 m (Figure 5c and Figure S2).
The contour lines of pCO2 at 400 µatm are demonstrated on this pH–DIC diagram based on the approximate value of atmospheric CO2 in 2010 (Figure 5a–c) to distinguish if the pCO2 value in the water is undersaturated or oversaturated with respect to the atmospheric level (that is, if it is a CO2 sink or source, respectively). Additionally, the pH minimum zone and minimum buffering capacity has been observed to be at water of low salinity, usually lower than 10 [12]. Thus, the concept of a maximum estuarine acidification zone [14] should also be noticed as this low salinity zone is affected by the tidal effect and usually act as important habitats. This changing pH buffering capacity may affect local biological activity in the brackish water.
The above information suggests that, during the DIC injection process, CO2 can degas when the water pCO2 is higher than the atmospheric level. This degassing issue may have been known before. We further show the possible salinity region and its pCO2 degree in this study. This degassing of high-DIC water thus reduced the efficiency of carbon capturing and storage in the surface ocean. This also repeated the importance to store CO2 in the deep water instead of the surface water as the CO2 sequestration strategy. However, when pH is reduced, the corresponding pCO2 is still increased through the nature of the carbonate system in the deep water (Figure 5 and Figure S2). Anthropogenic CO2 has been observed in the deep ocean [25,26] and can increase the DIC concertation there.
3.4. A Comparison between Injections on the Shelf and the Open Ocean
The selection of the injection site (such as on the shelf and on the open ocean) can play an important role in this regional carbon cycle. To reduce the cost of transportation and construction, a site on the continental shelf may be selected (such as the Danshuei River estuary). The vertical water column on the continental shelf may be stratified to separate the surface and bottom waters during the summer but these two waters can mix well in the winter [27]. We suggest that if high-DIC and high-pCO2 water is injected in the bottom water of the continental shelf (shallower than 200 m), it may mix with surface water in the winter. A proportion of the pCO2 may return to the atmosphere through air-sea gas exchange which can reduce the efficiency of injection. In contrast, when the direct injection of DIC is stored in the deep ocean (deeper than 1000 m)—such as offshore of the Hoping River—this deep water may need about 300 to 1000 years to return to surface water, based on the age of the global halothermal circulation [5]. However, the deep water usually already had a low carbonate saturation state (for example, lower than 1.5) [28] and the RF may also be high (Figure 5d and Figure S2). The surface pCO2 and pH variations on the open ocean are highly related to the variation of the temperature [7,29], implying that the temperature and density of the injection solution should be controlled. However, the fate of carbon on the continental shelf is still under debate [30] and there are few studies about the fate of DIC in the deep Northwestern Pacific Ocean water [22,31]. We are conservative in this DIC-solution injection issue. In addition to using this anthropogenic DIC-solution injection as accelerated chemical weathering to compensate for the increasing export of CO2 gas to the atmosphere, we encourage improving energy efficiency and also using green energy which can substantially reduce the export of CO2. A high-resolution physical-biogeochemical model simulation which considers carbonate dynamics is needed to evaluate the fate of deep water circulation in the future.
4. Summary and Implications
Our discussion about RF can have practical effects on subjects related to ocean acidification and carbon dynamics in varied scales. In a laboratory scale, this change of the RF along the pH and DIC gradient also suggests the efficiency of actively dissolving CO2 into the solution at varied salinities. The buffering capacity is high, suggesting that CO2 gas is not easy to degas and also suggests that CO2 gas is hard to be dissolved into the target solution (compared to a solution with a low buffering capacity). Therefore, this complex carbonate dynamic may be useful to (1) researchers who try to inject CO2 gas into a desired seawater tank to control the DIC and pH level, such as in an ocean acidification research or a coral reef culturing study and (2) carbon capture and storage researchers to evaluate desired pH, DIC and salinity to convert CO2 gas into a DIC solution.
In the scale of a continental shelf and continental slope, the RF we discussed in this study may have implications on chemical weathering. These pCO2 levels, from the pre-industry level (380 μatm) to the estimated level by the end of this century (800 μatm), on the diagram of the pH-DIC-RF (Figure 5b,d) suggest that the RF should decrease in both fresh and salty waters over time. The riverine pCO2 end-member can be controlled by the geological and hydrological characteristics in its watershed [32,33] and should be usually higher than the atmospheric level (Figure 5b). The open ocean surface pCO2 generally follows the atmospheric CO2 level with a decadal delay [6], suggesting that the RF in the salty water also decreases thereafter. Therefore, we suggest that this uncoupled RF between land and sea over time should be considered in chemical weathering from the river to the ocean over a decadal to century period.
In summary, the direct DIC injection may accelerate ocean acidification and increase water pCO2. The results from the two end-member model showed that a direct DIC injection may change a coastal region from a CO2 sink to a source to the atmosphere. We suggest that this strategy of a direct DIC injection may reduce the CO2 uptake ability of the ocean in a decade to century long scale.
Supplementary Materials
The following are available online at https://www.mdpi.com/2071-1050/10/4/1174/s1, Figure S1: The nitrate to salinity relationship at the Danshuei River estuary. Figure S2: The variation of pCO2 and Revelle factor against the pH and DIC for waters of salinity 35 and a pressure of 800 atm.
Acknowledgments
We thank the Industrial Technology Research Institute in Taiwan for funding. We thank K.-C. Huang for water sampling at Hoping River.
Author Contributions
Wei-Jen Huang, Kai-Jung Kao, Li-Lian Liu, Chi-Wen Liao and Yin-Lung Han conceived and designed the experiments and also discussed the model results. Wei-Jen Huang and Kai-Jung Kao performed the simulation. Wei-Jen Huang analyzed the data and dominated the writing and submitting processes.
Conflicts of Interest
The authors declare no conflict of interest. The founding sponsors had no role in the design of the study; in the collection, analyses, or interpretation of data; in the writing of the manuscript; and in the decision to publish the results.
References
- Orr, J.C.; Fabry, V.J.; Aumont, O.; Bopp, L.; Doney, S.C.; Feely, R.A.; Gnanadesikan, A.; Gruber, N.; Ishida, A.; Joos, F.; et al. Anthropogenic ocean acidification over the twenty-first century and its impact on calcifying organisms. Nature 2005, 437, 681–686. [Google Scholar] [CrossRef] [PubMed] [Green Version]
- Sabine, C.L.; Feely, R.A.; Gruber, N.; Key, R.M.; Lee, K.; Bullister, J.L.; Wanninkhof, R.; Wong, C.S.; Wallace, D.W.R.; Tilbrook, B.; et al. The Oceanic sink for anthropogenic CO2. Science 2004, 305, 367–371. [Google Scholar] [CrossRef] [PubMed] [Green Version]
- Li, B.; Duan, Y.; Luebke, D.; Morreale, B. Advances in CO2 capture technology: A patent review. Appl. Energy 2013, 102, 1439–1447. [Google Scholar] [CrossRef]
- Metz, B.; Davidson, O.; De Coninck, H.; Loos, M.; Meye, L. IPCC Special Report on Carbon Dioxide Capture and Storage; Cambridge University Press: Cambridge, UK; New York, NY, USA, 2009; ISBN 9780521863360. [Google Scholar]
- Chow, A. Ocean Carbon Sequestration by Direct Injection, CO2 Sequestration and Valorization; Esteves, V., Ed.; InTech: London, UK, 2014. [Google Scholar]
- Doney, S.C.; Fabry, V.J.; Feely, R.A.; Kleypas, J.A. Ocean Acidification: The other CO2 problem. Ann. Rev. Mar. Sci. 2009, 1, 169–192. [Google Scholar] [CrossRef] [PubMed]
- Takahashi, T.; Sutherland, S.C.; Sweeney, C.; Poisson, A.; Metzl, N.; Tilbrook, B.; Bates, N.; Wanninkhof, R.; Feely, R.A.; Sabine, C.; et al. Global sea-air CO2 flux based on climatological surface ocean pCO2, and seasonal biological and temperature effects. Deep Sea Res. Part II Top. Stud. Oceanogr. 2002, 49, 1601–1622. [Google Scholar] [CrossRef]
- Landschützer, P.; Gruber, N.; Bakker, D.C.E.; Schuster, U. Recent variability of the global ocean carbon sink. Glob. Planet. Chang. 2014, 28, 927–949. [Google Scholar] [CrossRef] [Green Version]
- Chen, C.-T.A.; Borges, A.V. Reconciling opposing views on carbon cycling in the coastal ocean: Continental shelves as sinks and near-shore ecosystems as sources of atmospheric CO2. Deep Sea Res. II 2009, 56, 578–590. [Google Scholar] [CrossRef]
- Huang, W.-J.; Cai, W.-J.; Wang, Y.; Lohrenz, S.E.; Murrell, M.C. The carbon dioxide system on the Mississippi River-dominated continental shelf in the northern Gulf of Mexico: 1. Distribution and air-sea CO2 flux. J. Geophys. Res. Oceans 2015, 120, 1429–1445. [Google Scholar] [CrossRef] [PubMed]
- Chou, W.C.; Gong, G.C.; Cai, W.J.; Tseng, C.M. Seasonality of CO2 in coastal oceans altered by increasing anthropogenic nutrient delivery from large rivers: Evidence from the Changjiang-East China Sea system. Biogeosciences 2013, 10, 3889–3899. [Google Scholar] [CrossRef]
- Hu, X.; Cai, W.J. Estuarine acidification and minimum buffer zone—A conceptual study. Geophys. Res. Lett. 2013, 40, 5176–5181. [Google Scholar] [CrossRef]
- Cai, W.-J.; Hu, X.; Huang, W.-J.; Murrell, M.C.; Lehrter, J.C.; Lohrenz, S.E.; Chou, W.-C.; Zhai, W.; Hollibaugh, J.T.; Wang, Y.; et al. Acidification of subsurface coastal waters enhanced by eutrophication. Nat. Geosci. 2011, 4, 766–770. [Google Scholar] [CrossRef]
- Cai, W.-J.; Huang, W.-J.; Luther, G.W.; Pierrot, D.; Li, M.; Testa, J.; Xue, M.; Joesoef, A.; Mann, R.; Brodeur, J.; et al. Redox reactions and weak buffering capacity lead to acidification in the Chesapeake Bay. Nat. Commun. 2017, 8, 369. [Google Scholar] [CrossRef] [PubMed]
- Huang, W.-J.; Cai, W.-J.; Powell, R.T.; Lohrenz, S.E.; Wang, Y.; Jiang, L.-Q.; Hopkinson, C.S. The stoichiometry of inorganic carbon and nutrient removal in the Mississippi River plume and adjacent continental shelf. Biogeosciences 2012, 9, 2781–2792. [Google Scholar] [CrossRef]
- Brewer, P.G.; Goldman, J.C. Alkalinity changes generated by phytoplankton growth. Limnol. Oceanogr. 1976, 21, 108–117. [Google Scholar] [CrossRef]
- Wolf-Gladrow, D.A.; Zeebe, R.E.; Klaas, C.; Körtzinger, A.; Dickson, A.G. Total alkalinity: The explicit conservative expression and its application to biogeochemical processes. Mar. Chem. 2007, 106, 287–300. [Google Scholar] [CrossRef] [Green Version]
- Redfield, A.C.; Ketchum, B.H.; Richards, F.A. The influence of organisms on the composition of seawater. In The Composition of Seawater. Comparative and Descriptive Oceanography. The Sea: Ideas and Observations on Progress in the Study of the Seas; Hill, M.N., Ed.; Wiley: New York, NY, USA, 1963; Volume 2, pp. 26–77. [Google Scholar]
- Millero, F.J.; Graham, T.B.; Huang, F.; Bustos-Serrano, H.; Pierrot, D. Dissociation constants of carbonic acid in seawater as a function of salinity and temperature. Mar. Chem. 2006, 100, 80–94. [Google Scholar] [CrossRef]
- Huang, W.-J.; Wang, Y.; Cai, W.-J. Assessment of sample storage techniques for total alkalinity and dissolved inorganic carbon in seawater. Limnol. Oceanogr. Methods 2012, 10, 711–717. [Google Scholar] [CrossRef]
- Wen, L.S.; Jiann, K.T.; Liu, K.K. Seasonal variation and flux of dissolved nutrients in the Danshuei Estuary, Taiwan: A hypoxic subtropical mountain river. Estuar. Coast. Shelf Sci. 2008, 78, 694–704. [Google Scholar] [CrossRef]
- Sheu, D.D.; Lee, W.Y.; Wang, C.H.; Wei, C.L.; Chen, C.T.A.; Cherng, C.; Huang, M.H. Depth distribution of δ13C of dissolved ΣCO2 in seawater off eastern Taiwan: Effects of the Kuroshio current and its associated upwelling phenomenon. Cont. Shelf Res. 1996, 16, 1609–1619. [Google Scholar] [CrossRef]
- Egleston, E.S.; Sabine, C.L.; Morel, F.M.M. Revelle revisited: Buffer factors that quantify the response of ocean chemistry to changes in DIC and alkalinity. Glob. Biogeochem. Cycles 2010, 24, GB1002. [Google Scholar] [CrossRef]
- Hagens, M.; Slomp, C.P.; Meysman, F.J.R.; Seitaj, D.; Harlay, J.; Borges, A.V.; Middelburg, J.J. Biogeochemical processes and buffering capacity concurrently affect acidification in a seasonally hypoxic coastal marine basin. Biogeosciences 2015, 12, 1561–1583. [Google Scholar] [CrossRef]
- Thomas, H.; Ittekkot, V. Determination of anthropogenic CO2 in the North Atlantic Ocean using water mass ages and CO2 equilibrium chemistry. J. Mar. Syst. 2001, 27, 325–336. [Google Scholar] [CrossRef]
- Sarmiento, J.L.; Gruber, N. Sinks for anthropogenic carbon. Phys. Today 2002, 55, 30–36. [Google Scholar] [CrossRef]
- Chou, W.-C.; Gong, G.-C.; Tseng, C.-M.; Sheu, D.D.; Hung, C.-C.; Chang, L.-P.; Wang, L.-W. The carbonate system in the East China Sea in winter. Mar. Chem. 2011, 123, 44–55. [Google Scholar] [CrossRef]
- Wanninkhof, R.; Barbero, L.; Byrne, R.; Cai, W.-J.; Huang, W.-J.; Zhang, J.-Z.; Baringer, M.; Langdon, C. Ocean acidification along the Gulf Coast and East Coast of the USA. Cont. Shelf Res. 2015, 98, 54–71. [Google Scholar] [CrossRef]
- Lui, H.-K.; Arthur Chen, C.-T. Deducing acidification rates based on short-term time series. Sci. Rep. 2015, 5, 11517. [Google Scholar] [CrossRef] [PubMed]
- Tsunogai, S.; Watanabe, S.; Sato, T. Is there a “continental shelf pump” for the absorption of atmospheric CO2? Tellus Ser. B-Chem. Phys. Meteorol. 1999, 51, 701–712. [Google Scholar] [CrossRef]
- Chou, W.C.; Sheu, D.D.; Chen, C.T.A.; Wen, L.S.; Yang, Y.; Wei, C.L. Transport of the South China Sea subsurface water outflow and its influence on carbon chemistry of Kuroshio waters off southeastern Taiwan. J. Geophys. Res. Oceans 2007, 112, 1–11. [Google Scholar] [CrossRef]
- Bauer, J.E.; Cai, W.-J.; Raymond, P.A.; Bianchi, T.S.; Hopkinson, C.S.; Regnier, P.A.G. The changing carbon cycle of the coastal ocean. Nature 2013, 504, 61–70. [Google Scholar] [CrossRef] [PubMed]
- Hu, X.; Pollack, J.B.; McCutcheon, M.R.; Montagna, P.A.; Ouyang, Z. Long-term alkalinity decrease and acidification of estuaries in northwestern Gulf of Mexico. Environ. Sci. Technol. 2015, 49, 3401–3409. [Google Scholar] [CrossRef] [PubMed]
Figure 1.
The study area. Orange stars represent the location of the Danshuei River mouth and the Hoping River mouth in Taiwan.
Figure 1.
The study area. Orange stars represent the location of the Danshuei River mouth and the Hoping River mouth in Taiwan.

Figure 2.
TA, DIC, pH and pCO2 variations along the river-to-sea mixing process for the Danshuei River estuary. TA and DIC values were linearly correlated to salinities (a,b) and the pH and pCO2 values were bimodal in the conservative scenario (c,d). The effect of biological uptake (dash lines) can increase the pH (c) and reduce the pCO2 value (d) in comparison to the conservative mixing scenario (blue lines).

Figure 3.
TA, DIC, pH and pCO2 variations along the river-to-sea mixing process for the Hoping River mouth and adjacent area. TA and DIC values were linearly correlated to salinities (a,b) and the pH and pCO2 values were bimodal in the conservative scenario (c,d). The effect of biological uptake (dash lines) can increase the pH (c) and reduce the pCO2 value (d) in comparison to the conservative mixing scenario (blue lines).

Figure 4.
The impact of controlled pH and pCO2 waters on the TA, DIC, pH and pCO2 in the study region. The conditions of conservative mixing (blue lines) and biological uptake scenarios (dash lines) in the Danshuei River (Figure 2) are repeated here for comparison. We simulated the injected DIC solution in two conditions: (1) water with a pH of 6 and a pCO2 of 2000 µatm (red lines) (c,d), leading to low TA, DIC values at salinity 0 (a,b); and (2) water with a pH of 8 and a pCO2 of 2000 µatm (black lines) (c,d), leading to high TA and DIC values at salinity 0 (a,b). The Danshuei River estuary may experience ocean acidification and may act as a CO2 source instead of a CO2 sink under the later scenario (c,d).

Figure 5.
The variation of pCO2 and Revelle factor (RF) under different measurements of pH and DIC. The variation of pCO2 (a) and RF (b) under varied pH and DIC values at waters of salinity 0 and a pressure of 1 atm; pCO2 (c) and RF (d) variations were for waters of salinity 35 and a pressure of 1. The three lines from the right-hand side to the left-hand side represent pCO2 values of 290 (pre-industry CO2 level), 400 (modern CO2 level) and 800 (2100 year CO2 level) µatm, respectively. The change of pCO2 and RF from the river (red circle) to sea (red triangle) mixing process for the Danshuei River estuary can be compared in panel (a) and (c). For the Hoping river-to-sea mixing process, black markers are used. Each arrow represents a general range of mixing process among riverine and oceanic end-members.


Table 1.
End-members for the river and sea mixing process.
| Region | Temp. (°C) | Salinity | TA (mmol kg−1) | DIC (mmol kg−1) | Nitrate (µM) |
|---|---|---|---|---|---|
| Danshuei (River) 1 | 26.0 | 0.2 | 0.799 | 0.822 | 40.0 |
| Hoping (River) 2 | 33.7 | 0.9 | 1.922 | 2.017 | 20.0 |
| Danshuei (Sea) 3 | 28.5 | 33.4 | 2.259 | 1.907 | 1.5 |
| Hoping (Sea) 4 | 29.0 | 33.8 | 2.230 | 1.950 | 1.5 |
1 These Danshuei River end-members (except nitrate) were taken on 14 October 2017 at the station near Danshuei (25.1675° N, 121.4432° E). The nitrate concentration was adopted from Wen et al. [21]. 2 These Hoping River end-members (except nitrate) were taken on 7 November 2017 at 25.1675° N, 121.4432° E. This TA value is calculated by DIC and pH (7.50 pH unit) by the same constants in Section 2. We assume the nitrate concentration is half that of the Danshuei River. The river flow was close to dry conditions. Thus, please note that these riverine end-members may represent a high estimation. 3 These sea end-members (except nitrate) were taken on 29 June 2017 at the station off the Danshuei River estuary at the southern East China Sea. The nitrate concentration is assumed based on the database in the Ocean Data Bank, Taiwan. 4 The oceanic end-member for Hoping River was adopted from data reported by Sheu et al. [22].
© 2018 by the authors. Licensee MDPI, Basel, Switzerland. This article is an open access article distributed under the terms and conditions of the Creative Commons Attribution (CC BY) license (http://creativecommons.org/licenses/by/4.0/).
Share and Cite
MDPI and ACS Style
Huang, W.-J.; Kao, K.-J.; Liu, L.-L.; Liao, C.-W.; Han, Y.-L. An Assessment of Direct Dissolved Inorganic Carbon Injection to the Coastal Region: A Model Result. Sustainability 2018, 10, 1174. https://doi.org/10.3390/su10041174
AMA Style
Huang W-J, Kao K-J, Liu L-L, Liao C-W, Han Y-L. An Assessment of Direct Dissolved Inorganic Carbon Injection to the Coastal Region: A Model Result. Sustainability. 2018; 10(4):1174. https://doi.org/10.3390/su10041174
Chicago/Turabian StyleHuang, Wei-Jen, Kai-Jung Kao, Li-Lian Liu, Chi-Wen Liao, and Yin-Lung Han. 2018. "An Assessment of Direct Dissolved Inorganic Carbon Injection to the Coastal Region: A Model Result" Sustainability 10, no. 4: 1174. https://doi.org/10.3390/su10041174
Note that from the first issue of 2016, this journal uses article numbers instead of page numbers. See further details here.