Influence of the Farmer’s Livelihood Assets on Livelihood Strategies in the Western Mountainous Area, China


1
College of Economics and Management, Jiangxi Agricultural University, Nanchang 330045, China
2
Institute of Ecological Civilization, Jiangxi University of Finance and Economics, Nanchang 330045, China
*
Author to whom correspondence should be addressed.
Sustainability 2018, 10(3), 875; https://doi.org/10.3390/su10030875
Submission received: 5 February 2018
/
Revised: 5 March 2018
/
Accepted: 15 March 2018
/
Published: 19 March 2018
Abstract
:The livelihood strategies of farm households depend on the conditions of their assets, and farm households cope with risks and shocks through portfolios consisting of different types of assets. Thus, discussing the relationship between the livelihood assets and the livelihood strategies of farm households helps in understanding their livelihood conditions and in formulating reasonable poverty reduction policies. Taking Zunyi City, which is located in a western, mountainous area of China, as the study region and using the framework of sustainability analysis, this study first tries to establish the mechanism of the influence of farm household livelihood assets on livelihood strategies, then evaluates different farm household livelihood assets by establishing an evaluation index system for them, and finally conducts an empirical analysis on the influence of farm household livelihood assets on livelihood strategies using a multinomial logit model. The research results indicate the following: (1) natural assets and material assets have a significant negative influence on farm households’ choice of livelihood strategies, that is, the more natural assets and material assets that farm households own, the more likely they are to choose livelihood strategies involving engaging in agricultural production; (2) Manpower assets and financial assets have a significant positive influence on farm households’ choice of livelihood strategy, namely, the more manpower assets and financial assets that farm households own, the more likely they are to choose livelihood strategies involving engaging in non-agricultural production; (3) Social assets have no significant influence on farm households’ choice of livelihood strategy.
1. Introduction
Livelihood strategies refer to actions taken and choices made to achieve livelihood goals, including production activities, investment strategies and maternity arrangements. As the activities that farm households engage in to achieve their livelihood goals, the livelihood strategies of farm households determine how they make use of natural resources and livelihood results within a certain context. A change in farm household livelihood strategies is highly important in regard to aspects such as changes in land use, ecological security, livelihood sustainability and the sustainable development of rural areas. Thus, in recent years, research on changes in the livelihood strategies of farm households has become a hot topic globally in the study of related disciplines such as geography and ecology.
Livelihood strategy is a collection of various livelihood options. Farm household livelihood strategies mainly include livelihood diversification, agricultural intensification, agricultural expansion and population migration etc. However, along with the drastic environmental change in developing countries (e.g., climate change, rapid urbanization and economic development), drastic changes take place in farm household livelihood assets, external environment and fragile environment (e.g., natural disasters, price change), and these changes often lead to change in farm household livelihood strategies. Currently, international studies on the change of farm household livelihood strategies mainly focus on the livelihood diversification and livelihood alternative. The former refers to the process of livelihood activities turning from single to diversified, and the latter refers to the process of the old livelihood strategy being completely replaced by a new livelihood strategy, concentrating in poorer areas such as Latin America and Africa. Change in farm household livelihood strategies has a significant influence on land use, ecological safety and and livelihood sustainability etc., as the traditional agricultural lifestyle are endangered by declining and aging population. It is not only a problem of spaces located in underdeveloped countries, developing countries or territories of China, but also in more developed areas such as Europe. The European Union prioritizes, through public aids, the change in the ways of life of farmers in order to stop demographic and socio-economic problems. Several towns in the south of Europe are disappearing due to their aging population and scarce economic resources, so there is aid aimed at solving these problems, such as those from the European Agricultural Fund for Rural Development (EAFRD) and Leader Approach. The EAFRD aims at modernizing the agricultural and forestry sectors, protecting the environment and improving quality of life. Cárdenas et al. (2017) analyzed the sustainable development in Extremadura, Spain, and provided us with a model that shows how various behaviors coexisted in the region in view of the distribution of current funding from the EAFRD [1]. Leader programme aims at having more effective policy implementation that considers the diversified needs of rural regions, and its central concept is based on the notion of social innovation. Dax et al. (2013) analyzed the application and delivery of Leader under the present Rural Development Programme in Austria and Ireland, and assessed the effects of this programme change [2].
Currently, the sustainable livelihood analysis framework has been widely used in the research and practice of international development, and the existing frameworks are mainly proposed by Department for International Development (DFID), United Nations Development Program (UNDP), and CARE International (CARE). Among the above, the most widely used framework is the Sustainable Livelihood Approach (SLA) analysis framework proposed by DFID, which has been adopted by many organizations and scholars both home and abroad.
The theoretical basis of the DFID model is Conway and Chambers’ understanding of poverty. Normalizing their work, the DFID becomes a separate and sharable development planning method. Providing a research approach for farm household livelihood, the framework helps to clarify the complex relationships among various factors affecting farm household livelihood. In the model, farm households make a living in a particular context of vulnerability. In this context, livelihood assets are the core content of the sustainable livelihood framework. Its nature and status determine the livelihood strategy adopted by farm households, thereby resulting in some kind of livelihood outcome, which influences the nature and status of livelihood assets, for example, social-economic factors can affect ecological land change [3]. The framework provides important implications for us to explain the differentiation of livelihood strategies. Although some studies focus on the relationship between livelihood assets and livelihood strategies, the in-depth quantitative research on its mechanism is still deficient.
In general, the conditions and the nature of the livelihood assets owned by a family or individual are the basis for understanding the choice opportunities, livelihood strategies, and risk environment of that family or individual. External factors influence farmers’ strategies under different conditions [4]. The livelihood strategies adopted by farm households depend on the assets that they own, and farm households cope with risks and shocks through portfolios consisting of their different types of assets. Thus, research on the livelihood assets and the livelihood strategies of farm households helps in understanding their livelihood conditions and in formulating reasonable poverty reduction policies. Scholars have conducted related studies on farm household livelihood assets and livelihood strategies. Xie et al. (2017, 2018) studied the factors influencing farmer willingness to fallow winter wheat, ecological compensation standards and farmers' response to the winter wheat fallow policy in a groundwater funnel area [5,6]. Lu and Xie (2018) find that changes in agricultural labor resources lead to reductions in agricultural labor supply [7]. Su et al. (2009) performed a quantitative study on the relationship between the livelihood assets and the livelihood strategies of farm households [8]. Zhang et al. (2013) performed a study on the relationship between the livelihood assets of herdsmen and the livelihood strategy of participating in tourism in the Kanas scenic ecological tourism spot in Xinjiang [9]. Zhao et al. (2011) studied the influence of livelihood assets on the choice of livelihood strategies [10]. Shi et al. (2014) investigated the relationship between farm household livelihood assets and livelihood strategies using multivariate logistic regression analysis, etc. [11].
The above scholars have achieved positive results in the research of farm household livelihood assets and livelihood strategies, however, research on farmer’s livelihood assets and livelihood strategies in the western mountainous area, which is less developed and ecologically vulnerable, is still deficient. Thus, taking Zunyi City, which is located in the western mountainous area, as the study region and based on the framework of sustainability analysis, this study first tries to establish the mechanism for the influence of farm household livelihood assets on livelihood strategies, then evaluates different farm household livelihood assets by establishing an evaluation index system for them, and finally conducts an empirical analysis of the influence of farm household livelihood assets on livelihood strategies using a multinomial logit model, generating corresponding conclusions and policy implications.
2. The Mechanism of the Influence of Farm Household Livelihood Assets on Livelihood Strategies
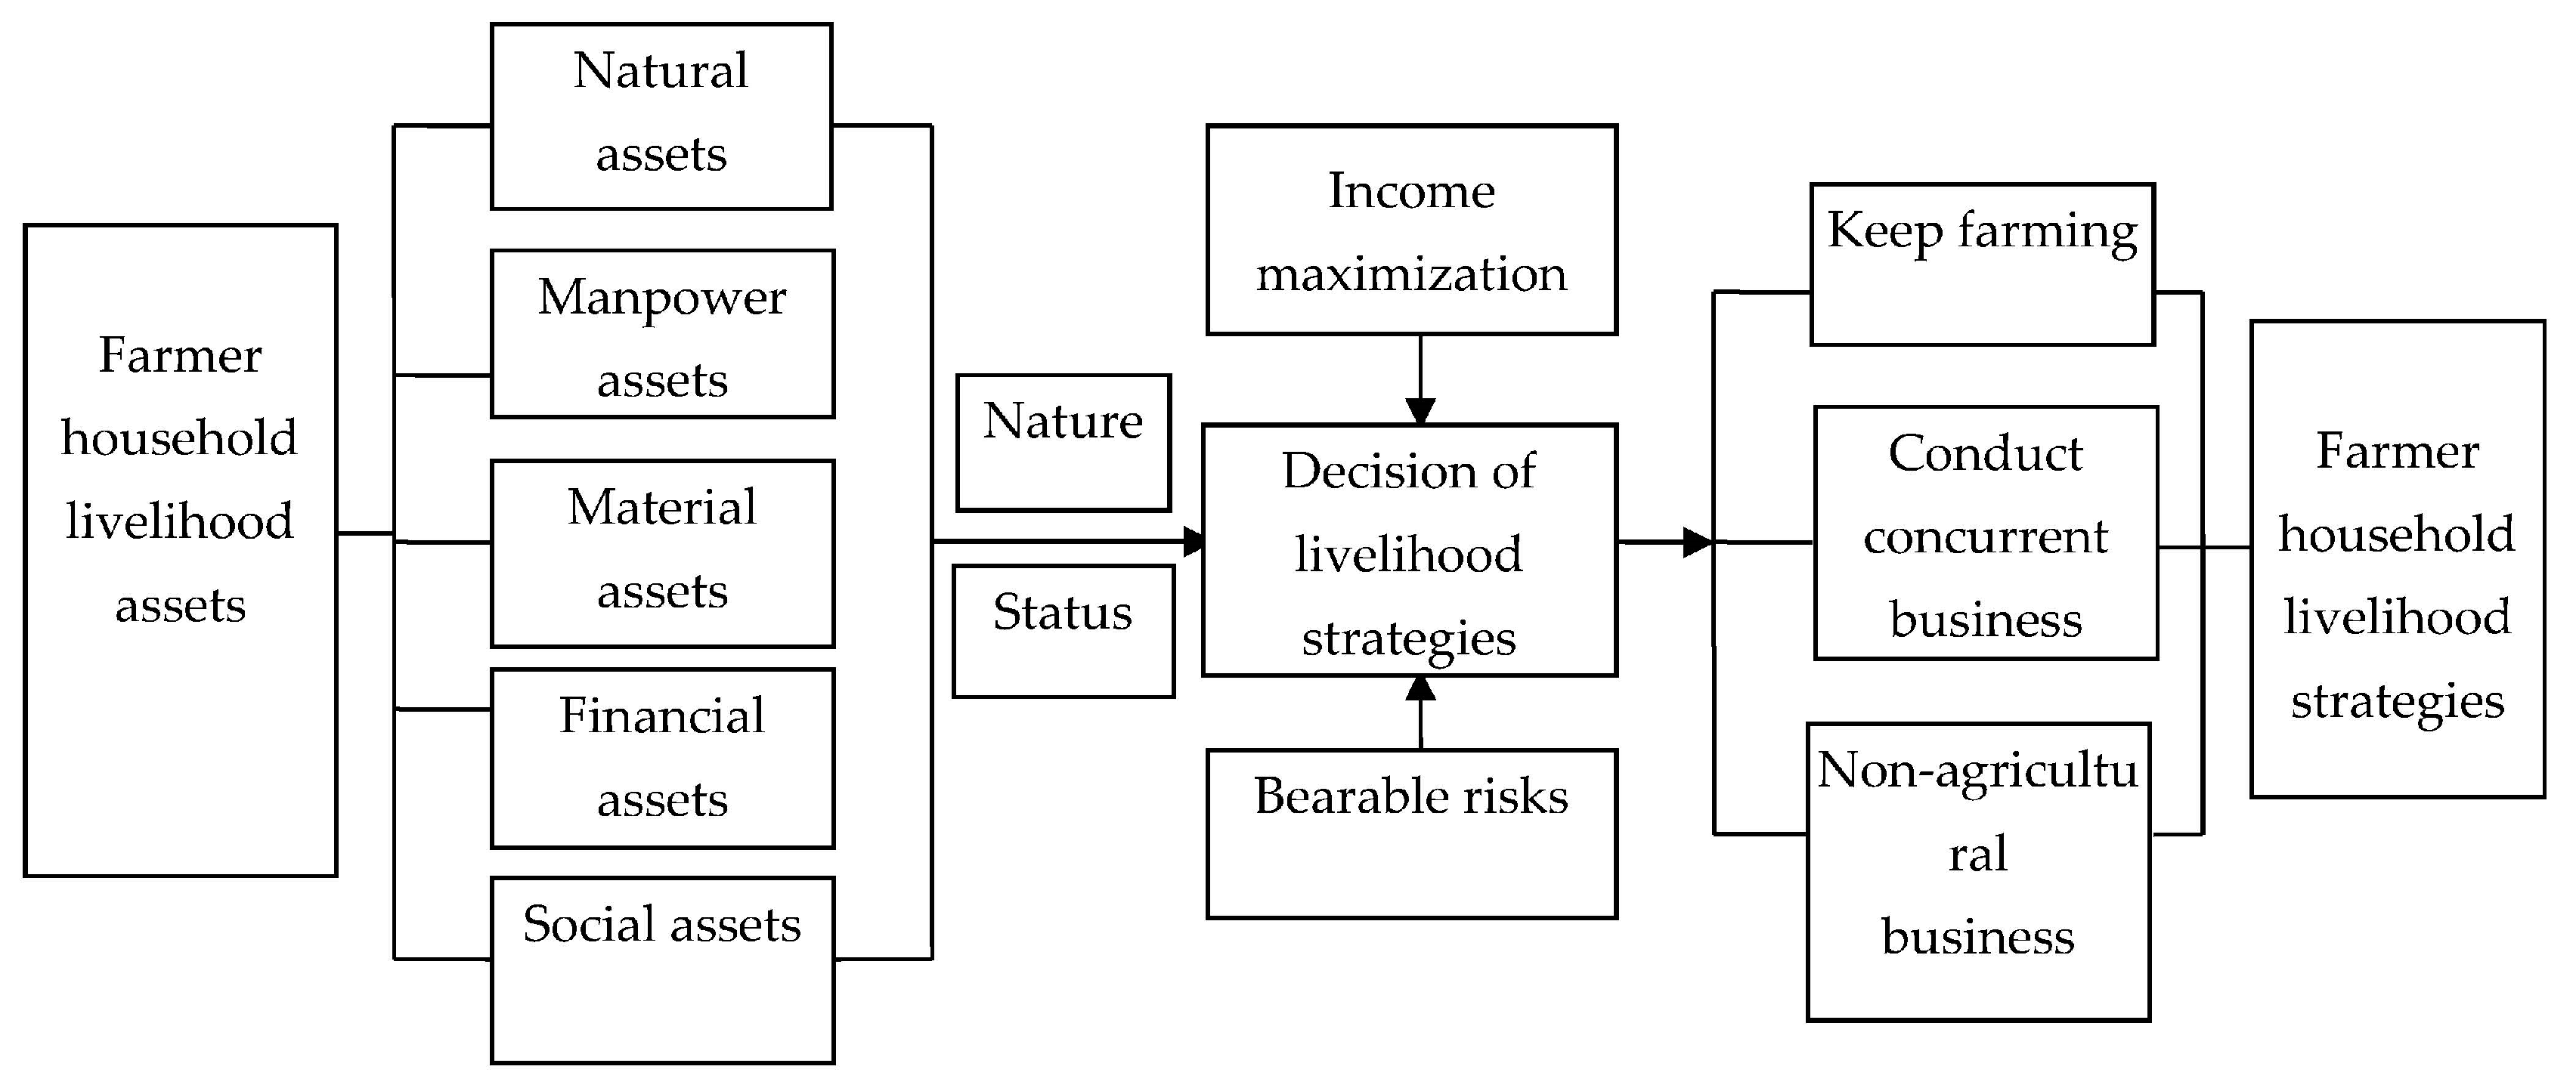
Livelihood refers to the way people make a living, which is based on capacity, assets and activities. Livelihood assets refer to the natural and manpower resources essential for people to survive, and they can be stored, exchanged or allocated to generate revenue streams or other benefits. Livelihood strategies refer to actions taken and choices made to achieve livelihood goals, including production activities, investment strategies, and maternity arrangements. In general, the conditions and the nature of the livelihood assets owned by a family or individual are the basis for understanding choice opportunities, livelihood strategies, and the risk environment of the family or individual. People must own different types of livelihood assets to achieve positive livelihood results, and relying on one single type of livelihood asset will not result in the diversified livelihood results that people seek. Livelihood strategies are composed of and realized by a series of livelihood activities. Under different asset conditions, the characteristics of dependence and asset diversity appear in livelihood assets and mutually combine to realize livelihood strategies. Thus, within a certain context, the conditions of farm household livelihood assets determine the adoption and adjustment of these households’ livelihood strategies. The more livelihood assets that farm households own, the more options they have, and they possess the ability to flexibly change their different types of livelihood strategies to ensure their livelihood. Farm household livelihood strategies are various behavioral strategies that are adopted by farm households according to their asset portfolio. Assuming that farm households are rational, farm households adopt livelihood strategy to gain the optimal balance between income and bearable risks. Change in quantity and structure of livelihood assets influences a farm households’ decision regarding livelihood strategy which is based on the optimal balance. In other words, changes in livelihood assets determine changes in livelihood strategies. The function mechanism from livelihood assets to livelihood strategies is shown in Figure 1.
3. Evaluation of Farm Household Livelihood Assets
3.1. Data Sources
In this study, stratified random sampling is adopted to select samples, and household surveys are conducted to investigate the situation of different farm households in terms of, for example, their livelihood assets, livelihood diversification and livelihood strategies via questionnaires and semi-structured interviews in the study region. The main contents of the survey are as follows: (1) natural assets, including contracted farmland area and woodland area; (2) material assets, including housing status, agricultural infrastructure, species and quantity of livestock, business assets, etc.; (3) manpower assets, including family population, education, age structure, gender composition, quantity of labor force, the number of workers in the second and third industries, state of health, etc.; (4) financial assets and social assets, including household wage income, access to loans (low-interest, interest-free or usury), employment, subsistence allowance, etc.; (5) current livelihood activities; (6) constraints on livelihood diversification; (7) land plot area owned by family, irrigation conditions, crop types, crop yield per unit; (8) agricultural land use status, including crop types, cropping system; consumption and capital expenditure of seeds, chemical fertilizer, pesticides, agricultural machinery, irrigation, fuel power, tool material, depreciation, fixing during agricultural production; expenses such as insurance, management fee, financial costs; labor force input, land rent, output, product price, etc.; (9) the relationship between land forage yield and livestock production; and (10) household consumption, including consumption of self-produced products, agricultural and sideline product purchases, various expenses, none-agricultural workers in towns and cities, etc. With the cooperation of staff from the local government and grassroots administrations, this study covers 13 counties (cities), 18 townships (towns) and 22 villages. In each village, the survey group carries out its work in three stages, namely, having an informal discussion with local cadres and villagers’ representatives, completing sample household survey questionnaires, and conducting field surveys. Out of a total of 731 data forms, there are 66 forms related to village-level socio-economic information and development resources, 620 forms aimed at investigating the sample farm household livelihood assets and livelihood strategies, 23 cadre interview forms at all levels (bureaus, townships and workstations in the counties), 22 forms for new business entities (large specialized households of crop and animal production and chairmen of cooperatives), and 13 compilations related to policy documents collected at the county level, all of which provide a detailed data base for the study of this project.
3.2. Comprehensive Evaluation of Farm Household Livelihood Assets
3.2.1. The Establishment of the Index System
On the basis of a specific and in-depth investigation of farm households in the study region and consultation with numerous experts and scholars in related areas, as well as a quantitative study on livelihood assets conducted by experts and scholars from both home and abroad, the author designed an evaluation index system (see Table 1) for farm household livelihood assets according to the specific natural resources, cultural life customs, ecological environment, religious beliefs etc. in the study region. This table is divided into three hierarchies. The first is the target layer, namely, the evaluation of the farm household livelihood assets in the study region. The second is the criterion layer, which includes natural assets, manpower assets, social assets, material assets and financial assets. The third, which concludes the 15 indexes of the system, consists of the details of the second hierarchy. These 15 indexes are the core and key indexes for evaluating livelihood assets—they are scientific and have a certain reference value. For more details please refer to the Reference [12].
3.2.2. Confirmation of Index Weighed Value
In this paper, the analytic hierarchy process (AHP) is adopted to measure the index weight of farm household livelihood assets in the evaluation index system. Combining quantitative and qualitative analysis, the AHP is a multi-objective decision analysis method proposed by American operations researcher T. L. Saaty in the 1970s. By decomposing complex problems into several layers and factors (or indexes), the AHP models and quantifies the decision-making process of decision-makers with regards to a complex system. Experts and decision-makers judge and grade the listed indexes layer by layer via a comparison of levels of importance and confirm the indexes’ weighted value according to the eigenvector of the matrix to provide evidence for decision analysis. The measurement index weight of farm household livelihood assets at each layer, as confirmed by the AHP, is presented in Table 2. For more details please refer to the Reference [12].
3.2.3. Standardized Processing of Data
To eliminate dimensional relations between variables, data should be standardized before data analysis in order to be comparable. In this paper, the data are standardized by means of dispersion normalization (i.e., 0–1 standardization) so that the result falls in the range of [0, 1]. Its linear transformation function is as follows:
where Xmax refers to the maximum value of the sample variables, and Xmin refers to the minimum value of the sample variables.
3.2.4. Comprehensive Evaluation Method
The measurement value of farm household livelihood assets at various levels is not the simple addition of the index values at each layer but the weighted sum, which results from the weighted calculation of the index values of the subordinate index layer. In this paper, the comprehensive index method is used to calculate the total amount of farm households’ monomial livelihood assets. Its calculation formula is as follows:
In the above formula, Y refers to the total amount of farm household monomial livelihood assets, while Wj refers to the weight of item j. In this way, m standardized indexes can be processed comprehensively, and a comprehensive index between 0 and 1 is obtained.
3.2.5. Evaluation Results
There are two main classification methods for farm household livelihood strategies. The first was proposed by the Institute of Rural Development, Chinese Academy of Social Sciences in 2002. In this method, farm households that earn more than 95% of their income from farming are classified as rural households, and those who earn more than 95% of their income from non-farming are classified as non-farming households. Farm households whose non-agricultural income accounts for 5 to 95% of total family income are classified as part-time households, and they are divided into two types according to the main source of their income, namely, agricultural income or wage. In the second method, based on the rural farm household survey scheme formulated by the State Statistics Bureau in October 2004, the proportion of 95% is adjusted to 90% [13]. Considering the actual conditions in the study region and the convenience of analysis, according to the degree of non-agriculturalization and the diversity of the livelihood of farm households, referring to the current research results of the farm household classification, and based on their non-agricultural income percentage in total family income, farm households with different livelihood strategies are classified into the following types: farm households whose non-agricultural income accounts for less than 10% of total family income are identified as rural households. Farm households whose non-agricultural income accounts for 10% to 90% of total family income are identified as part-time households. Farm households whose non-agricultural income accounts for more than 90% of total family income are identified as non-farming households.
The data are processed by means of the comprehensive index, and the value of the livelihood assets of farm households with different livelihood strategies is calculated. The index values of the livelihood assets of farm households with different livelihood strategies are listed from Table 3 to Table 4 (For more details please refer to the Reference [12]); the index values indicate the differences in the livelihood assets of farm households with different livelihood strategies.
The above tables show that farm households with different livelihood strategies differ slightly in the total amount of their livelihood assets and differ significantly in the structure of their different types of livelihood assets. The total value of livelihood assets in order are as follows: rural households (0.2162) > part-time households (0.2068) > non-farming households (0.2045) (Table 3). Farm household total livelihood asset values within the survey area were generally low, indicating backward economic conditions, low-level living standards and limited livelihood asset resources in China’s western mountainous region. Rural households are abundant in natural (0.195) and material (0.413) assets, which are beneficial to engaging in traditional agriculture, but they are deficient in manpower (0.208), financial (0.133) and social (0.084) assets, which go against modern agricultural production. Non-agricultural and part-time households possess relatively abundant manpower (0.264, 0.265), financial (0.170, 0.160) and social (0.099, 0.090) assets, which are beneficial to the diversification of livelihood strategies. However, their lack of natural and material assets hinders them from returning home to start a business and become modern agricultural operators. It indicates that farm households with different livelihood strategies possess different amounts and types of livelihood assets, namely, different livelihood asset structure. Thereby, farm households’ livelihood structure has a significant influence on the adoption of livelihood strategies.
4. The Influence of Farm Household Livelihood Assets on Livelihood Strategies
4.1. Model Construction
Based on the specific situation in the study region, the livelihood strategies of farm households are classified into three types, namely, continuing to farm (rural households), conducting concurrent business (part-time households) and engaging in non-agricultural occupations (non-farming households). Assuming that farm households have the three options of continuing to farm, conducting concurrent business and engaging in non-agricultural occupations as their livelihood strategies, the latent variable function expression that the ith farm household chooses the livelihood strategy of j (j = 1, 2, 3) is as follows:
where refers to the latent variable (supposing that farm households choose the livelihood strategies that maximize their own benefits within bearable risks, the latent variable can be defined as the benefits of the selected livelihood strategy); refers to the ith famer household’s 1 × q characteristic variable, namely, the factor influencing the ith farm household’s choice of livelihood strategy (farm households’ livelihood assets in this paper); and represents the number of q × 1 coefficient vectors is j. In this paper, farmers will choose k if their k choice makes them think that they can obtain the maximum benefit. That is,
where:
In this paper, a multinomial logit model is selected to estimate the model, and it is assumed that the random error term is mutually independent and obeys the logical distribution. To ensure that the model is identifiable, set , where m stands for the base category (here, continuing to farm is the reference category); thus, the probability of the kth livelihood strategy chosen by the ith farm household is as follows:
4.2. Results of the Model Evaluation
The model was evaluated using Stata 11 (Stata Corp. LLC, College Station, TX, USA). Taking continuing to farm (rural households) as the reference, the evaluated results of the models are presented in Table 5.
Table 5 shows that the different livelihood assets of farm households have different levels of influence on their choice of livelihood strategies.
(1) The Influence of Natural Assets
Table 5 shows that natural assets have a significant negative correlation with farm households’ choice of livelihood strategy in both the part-time household model and the non-farming household model (both are significant at the 1% level, and the sign is negative). This finding indicates that in the evaluation that takes continuing to farm (rural households) as the reference, the more natural assets that farm households own, the more likely they are to prefer to continue to farm (rural households) over conducting concurrent business as well as over engaging in non-agricultural occupations (non-farming households). At present, the most important natural asset for Chinese farm households is land. According to the development goals of land use management, land use types can be divided into cultivated land, construction land and ecological land and so on [14]. Land fragmentation significantly affects decisions regarding the amount of agricultural land circulation [15], and the type, quantity, distribution and productivity potential of the land resources that farm households own have a significant influence on their choice of whether to engage in agricultural production or not.
(2) The Influence of Manpower Assets
Table 5 shows that manpower assets have a significant positive influence on farm households’ choice of livelihood strategy in both the part-time household model and the non-farming household model (both are significant at the 1% level, and the sign is positive). This finding indicates that in the evaluation that takes continuing to farm (rural households) as the reference, the more manpower assets that farm households own, the more likely they are to prefer to conduct concurrent business over continuing to farm (rural households) and the more likely they are to prefer to engage in non-agricultural occupations (non-farming households) over continuing to farm. This finding shows that the quality of the labor force of farm households is an important factor influencing such households’ choice to conduct concurrent business and adopt non-agricultural livelihood strategies. This result is largely because farm households’ selection of livelihood strategies, which is based on the objectives of income maximization and bearable risks, enables a high-quality labor force with a better physical quality, education and skills in farm households to choose to go out and engage in non-agricultural occupations because a relatively low-quality labor force tends to engage in agricultural production.
(3) The Influence of Material Assets
Table 5 shows that material assets have a significant negative influence on farm households’ choice of livelihood strategy in both the part-time household model and the non-farming household model (both are significant at the 1% level, and the sign is negative). This finding indicates that in the evaluation that takes continuing to farm (rural households) as the reference, the more material assets that farm households own, the more likely they are to prefer to continue to farm (rural households) over conducting concurrent business and over engaging in non-agricultural occupations (non-farming households). This result is mainly because farm household material assets refer to the basic means of production and infrastructure to make a living. They are the indispensable prerequisites for agricultural production, and their conditions will inevitably have a significant influence on farm households’ choice of livelihood strategies. In general, the more advanced agricultural production tools that farm households own and the more convenient the infrastructure for agricultural production is, the more motivated farm households are to choose agricultural production.
(4) The Influence of Financial Assets
Table 5 shows that financial assets have a significant positive influence on farm households’ choice of livelihood strategy in both the part-time household model and the non-farming household model (both are significant at the 1% level, and the sign is positive). This finding indicates that in the evaluation that takes continuing to farm (rural households) as the reference, the more financial assets that farm households own, the more likely they are to prefer to conduct concurrent business over continuing to farm (rural households) and to prefer to engage in non-agricultural occupations (non-farming households) over continuing to farm. This result shows that financial assets are an important factor influencing farm households’ choice to conduct concurrent business and adopt non-agricultural livelihood strategies. Financial assets mainly refer to a disposable capital reserve and the various types of financing borrowing of farm households. For farm households in the western mountainous area, if they own more financial assets, then they will invest more capital and labor into non-agricultural industries to maximize non-agricultural income.
(5) The influence of social assets
Social assets refer to social resources needed by famer households to realize different livelihood strategies, including family and village networks of cooperation, trust, social embedding of many different kinds etc. Theoretically, owning different social assets has a positive influence on the allocation of the livelihood assets of farm households. However, in the empirical analysis of this paper, social assets have no significant influence on farm households’ choice of livelihood strategies. It shows that in the analysis of farm households’ livelihood, not only quantitative analysis but also qualitative analysis combing social background should be taken into consideration.
5. Conclusions and Discussion
In this paper, the mechanism of the influence of farm household livelihood assets on livelihood strategies is first theoretically analyzed, then, a quantitative study on farm household livelihood assets is conducted by establishing an index system. Finally, an empirical analysis of the influence of farm household livelihood assets on livelihood strategies in the study region is conducted using a multinomial logit model, with the results showing that different livelihood assets have different levels of influence on farm households’ choice of livelihood strategy. The specific conclusions are as follows:
- (1)
- Natural assets and material assets have a significant negative influence on farm households’ choice of livelihood strategies. That is, the more natural assets and material assets that farm households own, the more likely they are to choose livelihood strategies that involve engaging in agricultural production;
- (2)
- Manpower assets and financial assets have a significant positive influence on farm households’ choice of livelihood strategies. That is, the more manpower assets and financial assets that farm households possess, the more likely they are to choose livelihood strategies that involve engaging in non-agricultural production;
- (3)
- Social assets have no significant influence on farm households’ choice of livelihood strategies.
Natural assets and material assets are indispensable prerequisites for agricultural production, and their conditions will inevitably have an important influence on a farm household’s livelihood strategy decision to engage in agricultural production. It is necessary to develop agricultural intensification, specialization, organization and socialization in the background of mass migration of rural labor force and part-time farming. Should we promote, or inhibit the further differentiation of farm households? How do we judge that which type of farm households are more likely to develop into family farm or more efficient agricultural organization? These questions need to be answered. In the research area, part-time households are likely to develop into a family farm of a certain scale. Deficient land resources and fixed assets are the main factors limiting the development of part-time households. Thereby, land circulation should be encouraged to expand the cultivated land scale needed by part-time households and form big-specialized households of crop and animal productions gradually. Subsidies to labor-saving input such as small agricultural machinery should be increased.
However, manpower assets and material assets are the main factors determining farm households’ opportunity cost from engaging in agricultural production as well—the amount of these assets will inevitably have an important influence on farm households’ livelihood strategy decision, as this is based on income maximization and bearable risks. Zhang et al. (2013) believed that the core of constructing regional sustainable livelihood is diversified livelihood, which is mainly composed of non-agricultural activities. However, the deficiency of manpower assets is one of the main factors limiting rural households from engaging in non-agricultural activities, for example, Hao et al. (2010) found that the highest education level of family members had a significantly positive effect on farmers’ non-agricultural activities [16]. Thereby, it is necessary to upgrade manpower asset level through promoting education, improving medical and sanitation conditions, and popularize related agricultural techniques. In regards to financial assets, rural households are deficient. This is reflected in their search for financial support from relatives and neighbors and loans, and it implies their weak ability to cope with risks. Thereby, microcredit is of significant importance in this area. This is similar to a policy discussion in Gannan Plateau and Eastern Transect in Tibetan Plateau proposed by Zhao et al. (2011) [10] and Yan et al. (2009) [17].
Social assets provide external support and help for farm households that struggle to produce and survive. Theoretically, owning different social assets has a positive influence on the allocation of the livelihood assets of farm households. However, in the empirical analysis of this paper, social assets have no significant influence on farm households’ choice of livelihood strategies, which might be ascribed to the deficient development in social assets in the western mountainous area. This quantitative study on the five types of livelihood assets of farm households shows that the score for farm household social assets is the lowest, only 0.093, less than one-tenth of the average scores for livelihood assets. Social assets refer to social resources needed by famer households to realize different livelihood strategies, including family and village networks of cooperation, trust, social embedding of many different kinds, etc. It is difficult to quantify these specific elements. It shows that in the analysis of farm household livelihood, not only quantitative analysis but also qualitative analysis combing social background should be taken into consideration.
Acknowledgments
This study was supported by the National Natural Science Foundation of China (No. 41561040), the Key projects of the National Social Science Fund of China (No. 15AZD075), Funding Project for Academic and Technical Leaders in Major Disciplines of Jiangxi Province (20172BCB22011), the Technology Foundation of Jiangxi Education Department of China (No. KJLD14033 & No. GJJ160431) and the Fok Ying-Tung Fund (No. 141084).
Author Contributions
Hualin Xie developed the original idea for the study. Zhifei Liu and Qianru Chen were responsible for data collection. Zhifei Liu and Qianru Chen conducted the data analyses. All the authors contributed to drafting the manuscript and approved the final version of the manuscript.
Conflicts of Interest
The authors declare no conflict of interest.
References
- Cárdenas, A.G.; Nieto, M.A. Towards rural sustainable development? Contributions of the EAFRD 2007–2013 in low demographic density territories: The case of Extremadura (SW Spain). Sustainability 2017, 9, 1173. [Google Scholar] [CrossRef]
- Dax, T.; Strahl, W.; Kirwan, J.; Maye, D. The Leader programme 2007–2013: Enabling or disabling social innovation and neo-endogenous development? Insights from Austria and Ireland. Eur. Urban Reg. Stud. 2013, 23, 56–68. [Google Scholar] [CrossRef] [Green Version]
- Xie, H.L.; He, Y.F.; Xie, X. Exploring the factors influencing ecological land change for China’s Beijing-Tianjin-Hebei Region using big data. J. Clean. Prod. 2017, 142, 677–687. [Google Scholar] [CrossRef]
- Xie, H.L.; Wang, W.; Zhang, X.M. Evolutionary game and simulation of management strategies of fallow cultivated land: A case study in Hunan Province, China. Land Use Policy 2018, 71, 86–97. [Google Scholar] [CrossRef]
- Xie, H.L.; Cheng, L.J.; Lv, T.G. Factors influencing farmer willingness to fallow winter wheat and ecological compensation standards in a groundwater funnel area in Hengshui, Hebei Province, China. Sustainability 2017, 9, 839. [Google Scholar] [CrossRef]
- Xie, H.L.; Cheng, L.J.; Lu, H. Farmers’ responses to the winter wheat fallow policy in the groundwater funnel area of China. Land Use Policy 2018, 73, 195–204. [Google Scholar] [CrossRef]
- Lu, H.; Xie, H.L. Impact of changes in labor resources and transfers of land use rights on agricultural non-point source pollution in Jiangsu Province, China. J. Environ. Manag. 2018, 207, 134–140. [Google Scholar] [CrossRef] [PubMed]
- Su, F.; Pu, X.D.; Xu, Z.M.; Wang, L.A. Analysis about the relationship between livelihood capital and livelihood strategies: Take Ganzhou in Zhangye as an example. China Popul. Resour. Environ. 2009, 19, 119–125. (In Chinese) [Google Scholar]
- Zhang, H.Y.; Yao, J.; Ma, J. Study on the relationship between livelihood asserts and livelihood strategies of herdsmen participated in tourism: A case study in Kanas ecological tourism scenic spot in Xinjiang. Tour. Forum 2013, 6, 40–44. (In Chinese) [Google Scholar]
- Zhao, X.Y.; Li, W.; Yang, P.T.; Liu, S. Impact of livelihood capital on the livelihood activities of farmers and herdsmen on Gannan Plateau. China Popul. Resour. Environ. 2011, 21, 111–118. (In Chinese) [Google Scholar]
- Shi, Y.L.; Tang, B.; Yu, Y. Research on livelihood strategies in poverty-stricken areas based on livelihood capital path. Investigation in four villages with sustainable livelihood projects in Fengshan County, Guangxi. Reform. Strat. 2014, 30, 83–87. (In Chinese) [Google Scholar]
- Liu, Z.F.; Chen, Q.R.; Xie, H.L. Comprehensive evaluation of farm household livelihood assets in a western mountainous area of China—A case study in Zunyi City. J. Resour. Ecol. 2018, 9, 154–162. [Google Scholar]
- Hua, X.B. The Coupling between Livelihood of Farmers and Herders and Land Use—Case Studies of Three Agro-Ecological Zones in Tibetan Plateau; Southwest University: Chongqing, China, 2014. [Google Scholar]
- Xie, H.L.; Yao, G.R.; Liu, G.Y. Spatial evaluation of ecological importance based on GIS for environmental management: a case study in Xingguo County of China. Ecol. Indic. 2015, 51, 3–12. [Google Scholar] [CrossRef]
- Xie, H.L.; Lu, H. Impact of Land Fragmentation and Non-Agricultural Labor Supply on Circulation of Agricultural Land Management Rights. Land Use Policy 2017, 68, 355–364. [Google Scholar] [CrossRef]
- Hao, H.G.; Li, X.B.; Xin, L.J.; Tian, Y.J. Analysis on farm household concurrent business behavior and reasons. J. Agrotech. Econ. 2010, 3, 14–21. (In Chinese) [Google Scholar]
- Yan, J.Z.; Wu, Y.Y.; Zhang, Y.L. Livelihood diversification of peasants and nomads of Eastern Transect in Tibetan Plateau. Acta Geogr. Sin. 2009, 64, 221–233. (In Chinese) [Google Scholar]
Figure 1.
The mechanism of the influence of farm household livelihood assets on livelihood strategies.
Figure 1.
The mechanism of the influence of farm household livelihood assets on livelihood strategies.


Table 1.
Evaluation index system of farm household livelihood assets.
| Type of Asset | Evaluation Indexes | Definition (Unit) |
|---|---|---|
| Nature | Farmland area per capita (n1) | The actual contracted farmland area per capita in the survey year (mu) |
| Woodland area per capita (n2) | The actual contracted woodland area per capita in the survey year (mu) | |
| Manpower | Total family labor force (m1) | The actual total family labor force in the survey year (per capita) |
| Average years of education of the family labor force (m2) | The actual average years of education of the family labor force in the survey year (year) | |
| Number of skill trainings in which family members participate (m3) | The actual number of skill trainings in which family members participate in the survey year (time) | |
| Goods | Living space per capita (g1) | The actual living space per capita in survey year (m3) |
| Family housing quality (g2) | 4 for frame structure; 3 for brick and concrete structure; 2 for brick and wood structure; 1 for simple | |
| Household fixed assets (g3) | The proportion of fixed assets owned by family households in total assets. There are ten options for fixed assets (yuan) | |
| Production infrastructure (g4) | 4 for convenient; 3 for general; 2 for inconvenient; 1 for extremely inconvenient | |
| Financial | Cash income per capita (f1) | Total household income divided by total family population in the survey year (yuan) |
| Access to borrowing (f2) | 1 for borrowing; otherwise, 0 | |
| Family property income (f3) | Includes interest in the survey year, rent, land acquisition compensation, etc. (yuan) | |
| Society | Family transfer income (s1) | Includes policy subsidy and gift income from relatives and friends (yuan) |
| Access to non-agricultural occupations (s2) | 3 for access from relatives and friends; 2 for access from the government; 1 for applying and self-employment | |
| Communication expenditure (s3) | Service and maintenance costs for communication (yuan) |
Table 2.
Measurement index weight of farm household livelihood assets.
| Target Layer | Asset Type | Weight | Measurement Indexes | Weight of Asset Type | Weight of Target Layer |
|---|---|---|---|---|---|
| Farm household livelihood assets in the study area | Natural assets | 0.1728 | Farmland area per capita | 0.6667 | 0.1152 |
| Woodland area per capita | 0.3333 | 0.0576 | |||
| Manpower assets | 0.2280 | Total family labor force | 0.5000 | 0.1140 | |
| Years of education of the family labor force | 0.2500 | 0.0570 | |||
| Number of skill trainings in which family members participate | 0.2500 | 0.0570 | |||
| Material assets | 0.2280 | Living space per capita | 0.2929 | 0.0668 | |
| Family housing quality | 0.2929 | 0.0668 | |||
| Household fixed assets | 0.2071 | 0.0472 | |||
| Production infrastructure | 0.2071 | 0.0472 | |||
| Financial assets | 0.1985 | Cash income per capita | 0.5500 | 0.1092 | |
| Access to borrowing | 0.2098 | 0.0416 | |||
| Family property income | 0.2402 | 0.0477 | |||
| Social assets | 0.1728 | Family transfer income | 0.3275 | 0.0566 | |
| Access to non-agricultural occupations | 0.2599 | 0.0449 | |||
| Communication Expenditure | 0.4126 | 0.0713 |
Table 3.
Comparison of the total livelihood assets of farm households with different livelihood strategies.
Table 3.
Comparison of the total livelihood assets of farm households with different livelihood strategies.
| Comparison Items | Total Sample | Rural Households | Part-Time Households | Non-Farming Households |
|---|---|---|---|---|
| Total livelihood assets | 0.2064 | 0.2162 | 0.2068 | 0.2045 |
| Number of observations | 620 | 55 | 318 | 247 |
Table 4.
Comparison of the evaluation indexes of five livelihood assets of farm households with different livelihood strategies.
Table 4.
Comparison of the evaluation indexes of five livelihood assets of farm households with different livelihood strategies.
| Type of Assets | Total Samples | Rural Households | Part-time Households | Non-farming Households | ||||
|---|---|---|---|---|---|---|---|---|
| Mean | SD | Mean | SD | Mean | SD | Mean | SD | |
| Nature | 0.113 | 0.004 | 0.195 | 0.015 | 0.117 | 0.006 | 0.090 | 0.004 |
| Manpower | 0.259 | 0.005 | 0.208 | 0.013 | 0.265 | 0.007 | 0.264 | 0.009 |
| Goods | 0.350 | 0.005 | 0.413 | 0.018 | 0.346 | 0.007 | 0.342 | 0.008 |
| Financial | 0.161 | 0.005 | 0.133 | 0.010 | 0.160 | 0.006 | 0.170 | 0.008 |
| Society | 0.093 | 0.004 | 0.084 | 0.011 | 0.090 | 0.006 | 0.099 | 0.007 |
| Number of observations | 620 | 55 | 318 | 247 | ||||
Table 5.
Results of the model evaluation on the influence of farm household livelihood assets on livelihood strategies.
Table 5.
Results of the model evaluation on the influence of farm household livelihood assets on livelihood strategies.
| Livelihood Assets | Part-Time Household Model | Non-Farming Household Model | ||
|---|---|---|---|---|
| Coef. | P > z | Coef. | P > z | |
| Nature | −6.261 *** | 0.000 | −10.424 *** | 0.000 |
| Manpower | 4.205 *** | 0.002 | 3.734 *** | 0.009 |
| Goods | −6.046 *** | 0.000 | −6.154 *** | 0.000 |
| Financial | 5.2728 *** | 0.004 | 6.021 *** | 0.001 |
| Society | −0.888 | 0.589 | −0.364 | 0.827 |
| _cons | 3.352 *** | 0.000 | 3.513 *** | 0.000 |
| Number of observations = 620 | LR X2 (10) = 85.75 | |||
| Prob > X2 = 0.000 | Pseudo R2 = 0.0748 | |||
Note: The above table takes continuing to farm as the reference result, and *** indicates that the T values are significant at the 1% level.
© 2018 by the authors. Licensee MDPI, Basel, Switzerland. This article is an open access article distributed under the terms and conditions of the Creative Commons Attribution (CC BY) license (http://creativecommons.org/licenses/by/4.0/).
Share and Cite
MDPI and ACS Style
Liu, Z.; Chen, Q.; Xie, H. Influence of the Farmer’s Livelihood Assets on Livelihood Strategies in the Western Mountainous Area, China. Sustainability 2018, 10, 875. https://doi.org/10.3390/su10030875
AMA Style
Liu Z, Chen Q, Xie H. Influence of the Farmer’s Livelihood Assets on Livelihood Strategies in the Western Mountainous Area, China. Sustainability. 2018; 10(3):875. https://doi.org/10.3390/su10030875
Chicago/Turabian StyleLiu, Zhifei, Qianru Chen, and Hualin Xie. 2018. "Influence of the Farmer’s Livelihood Assets on Livelihood Strategies in the Western Mountainous Area, China" Sustainability 10, no. 3: 875. https://doi.org/10.3390/su10030875
Note that from the first issue of 2016, this journal uses article numbers instead of page numbers. See further details here.