Article

Anthropogenic Impact on Erosion Intensity: Case Study of Rural Areas of Pirot and Dimitrovgrad Municipalities, Serbia

Faculty of Geography, University of Belgrade, Studentski trg 3/3, 11000 Belgrade, Serbia
*
Author to whom correspondence should be addressed.
Sustainability 2018, 10(3), 826; https://doi.org/10.3390/su10030826
Submission received: 31 December 2017 / Revised: 9 March 2018 / Accepted: 13 March 2018 / Published: 15 March 2018
(This article belongs to the Special Issue Sustainable Ecology and Forest Management)

Abstract

:
In many Eastern European countries, the standard of living increased as a result of the process of industrialization in the second half of the 20th Century. Consequently, the population in rural areas with small-scale farming decreased due to the availability of employment elsewhere. This directly impacted soil erosion (and thereby sustainability of the land), but the degree and direction are not well known. This study investigates two municipalities within Serbia, their change in population and its impact on land use changes and soil erosion. The standard of living increased after the industrialization process in the 1960s within these municipalities. The erosion potential model is used to calculate gross annual erosion. The changes related to population and arable land in rural settlements are analyzed according to proportional spatial changes. The results show an overall decrease of erosion intensity in the study area. In addition, two basic findings are derived: first, the highest level of human impact on soil is in rural settlements at the lowest elevation zones, where erosion intensity shows the least amount of decrease; and, second, the most intensive depopulation process, recorded in higher elevation zones, indicates a rapid decrease of erosion intensity.

1. Introduction

Sustainability of soil resources is one of the important questions of modern times. Soil erosion is recognized as one of the most significant threats to soils around the world. In relation to that, several national research councils and advisory boards, such as the National Research Council, the Royal Society of Chemistry, London, and the German Advisory Council on Global Change, have published strategic papers [1]. Soil erosion is geographically determinate [2] as direct results of complex interactions among natural processes, as well as changes in population and economics. Those changes, along with various agrarian policies, have led to differentiated pressure on the soil and intensification of erosion processes in regions around the world during recent decades [3,4,5]. That is why it is essential to recognize that improving soil quality by adopting sustainable agricultural and land management practices can be a way to mitigate soil degradation trends [1].
The main resources come from mountainous areas which make millions of tons of sediment available for erosion and transport annually [6]. Various human activities related to agriculture and demographic changes have had an important impact on gross erosion and sediment yield. Results of previous research on a global [7,8,9] and regional [10,11,12,13,14] scale show that land use and land cover are highly significant factors in determining changes in erosion intensity and rates of soil loss. The most important demographic transformation, along with land use changes and erosion intensity, took place in the mountainous rural regions of Serbia [12,15]. The process of deforestation under conditions of overpopulation in rural areas that existed after the Second World War intensified erosion. However, in the last decades, in those areas, the opposite trend took place due to deagrarization and depopulation, and, in the previously deforested areas, natural vegetation has recovered, which led to a significant reduction of erosion intensity.
The aim of this research is to determine the changes of soil erosion intensity and the amount of gross soil erosion, considering demographic and agricultural processes, which are the most important factors in land use changes. For that purpose, erosion intensity is observed through population dynamic and arable land quantity. Changes in erosion intensity were analyzed in the period 1971–2011 in rural areas of two municipalities, Pirot and Dimitrovgrad, located in the eastern part of Serbia. The selection of this area was justified by the fact that natural conditions indicate a predisposition of the terrain toward soil erosion. On the other hand, these rural areas are characterized by different demographic and economic patterns on spatial and time scales. In the mid-twentieth century, the process of demographic and economic stabilization occurred. Meanwhile, towards the end of the twentieth and beginning of the twenty-first century, depopulation, aging, abandonment and extensification of farmland activities, and economic decline, spurred and intensified rural poverty [16,17,18].
The research results are important in understanding the deep connections between anthropogenic factors (demographic and agricultural determinants) and erosion intensity. Those relations are crucial in understanding problems caused by erosion, which has an important impact on the agriculture, forestry, and water management sectors. Finally, these findings should be considered when planning renewable natural resource projects, in particular protection of soil and forest ecosystems, water management projects, environmental protection, and spatial planning documentation.

2. Study Area

The municipalities of Pirot and Dimitrovgrad are located in the eastern part of Serbia, on the border with Bulgaria, between 43°01′06″ N, 22°35′06″ E and 43°15′83″ N, 22°58’05″ E (Figure 1), with a total area of 1715 km2. The municipalities are surrounded by Stara Planina Mountain to the north and northeast and Vlaška Mountain to the south, while the west and northwest borders extend to Svrljiške Planine Mountain. The area is characterized by hilly-mountainous relief in most of the municipalities, and alluvial plain around the River Nišava and its tributaries. Elevation ranges from 350 m to 2169 m on Stara Planina Mountain. The average elevation is 822 m, with an average slope of 12°. Average annual air temperature is 7.8 °C and average annual precipitation is 757 mm, approximately the national average [19]. The territory is characterized by a high degree of spatial variation in rainfall, which ranges from 580 mm in the valley of Nišava to 1200 mm on Stara Planina Mountain [20,21].
The observed area is situated in the eastern Serbian Carpatho–Balkanides within the Getic and Upper Danubian tectono-stratigraphic units [22]. Nowadays, this area is adjoined to the Kučaj terrane and Stara Planina-Poreč terrane, which are among several large alpine geotectonic units of the eastern Serbian Carpatho‒Balkanides [23]. Within the geological framework of the study area, it is possible to recognize six petrological complexes (Figure 1): (1) Quaternary and Cenozoic sedimentary cover, composed mainly of alluvium, diluvium, talus, river terraces, sands, gravels, conglomerates, and shales (15.7%); (2) Mesozoic clastic sediments, representing a mixed sequence of Triassic colored sandstones and Jurassic sandstones, shales, and conglomerates (25.6%); (3) Paleozoic clastic sediments, mainly composed of Permian red sandstones and Devonian conglomerates, alevrolytes, and shales (10.7%); (4) Carbonate rocks, dominated by limestones and dolomites (42.1%); (5) Igneous rocks, comprising acidic to intermediate varieties represented by granites, monzonites, diorites, latites, andesites, and minor basic basalts (2.9%); and (6) Metamorphic rocks exposed in the eastern parts of the municipalities, which have experienced green schist facies metamorphism (2.9%). A multihazard map [24] and high values of soil erodibility factor [13] show vulnerability topotential strong erosion in parts of the study area.
The study area consists of rural areas in two municipalities, Pirot and Dimitrovgrad, where 111 rural settlements are located. According to administrative criteria in Serbia, settlements are classified as urban, while those that are not declared as urban have been considered rural (labeled “others”). The total population of those municipalities in 2011 was 80,751, while the rural population amounted to 22,823 inhabitants (28% of the total population).

3. Materials and Methods

One of the most widely accepted and applied empirical models in Serbia iathe erosion potential model (EPM), also known as the Gavrilovic method [25]. Studies in Serbia [12,26,27,28] and worldwide [6,29,30,31,32,33,34] confirmed the validity of this model. In this study, EPM was used for estimation of soil erosion potential, i.e., for the analytical determination of erosion coefficient (Z), quantification of gross erosion (W), and specific annual gross erosion (W0). Gross erosion includes rill erosion, inter rill erosion, gully erosion and streambed erosion. The time frame of the erosion study covers the period from 1971 to 2011.
The annual soil loss, W (m3/year) within the EPM is calculated as Equation (1):
W = T × H × π × Z 3 × F
where W (m3/year) is total annual gross erosion (amount of soil lost per year), T is the temperature coefficient(calculated by T = t 10 + 0.1 , where t is annual air temperature °C), H(mm) is mean annual precipitation, Z is the erosion coefficient, and F (km2) is the study area.
EPM uses a scoring approach for three descriptive variables to calculate coefficients of erosion Y, X, and φ (Table 1). The soil erosion coefficient (Z) can be calculated from Equation (2):
Z = Y × X × ( φ + I )
where Y is the coefficient of soil resistance, X is the coefficient of soil protection, φ is erosion and stream network developed coefficient and I (%) is the average slope.
The erosion coefficient (Z) ranges from 0.01 (areas not affected) to 1.5 (areas with excessive erosion) (Table 2). Y is the soil erodibility coefficient, which depends on the geology and soil. X is the soil protection coefficient, which reflects the type of land use (crop or natural vegetation). φ is erosion and stream network developed coefficient that includes type and extent of erosion (Table 1).
Determination of climate parameters in the study area was done using historical weather datasets (Republic Hydrometeorological Service of Serbia) from 13 meteorological stations that are located in the study area, and from five meteorological stations in the Nišava River basin. A geological map on the scale 1:100,000 was used to determine the value of coefficient Y. In this study, coefficient X and coefficient ϕ were determined on the basis of a topographic map (1:25,000) and a map of soil erosion (1:500,000) [35], Google satellite images, and recognition of soil erosion by a geomorphologic mapping method based on field research. The basic input for generating morphometric attributes in the geographic information system (GIS) was a 90 m digital elevation model dataset. Integration of EPM and GIS has led to easier and more efficient soil erosion predictions and spatial distribution of soil erosion. Data and model implementation, digitalization, and mapping are based on Geomedia 6.0 (Intergraph corporation, Huntsville, AL, USA) and ARC GIS 10.2.2.
Analysis of the spatial distribution of population and arable land (land under temporary crops and under market and kitchengardens) in the period 1961–2011/2012 provides more detailed insight into the correlation of the depopulation process, population concentration, deagrarization, and land use changes and represents a significant starting point in explaining the intensity of erosion in this study area [36].Changes in population and land use in rural settlements can be observed based on the analysis of proportional spatial changes. The shift-share analysis method, which has been primarily used in economic research [37,38,39,40], has also been widely used in agrarian-geographical studies [41,42,43,44,45] and demographic research [46,47]. In Serbia, this method was applied in economic research [48] and agrarian research [49,50], as well as in determining the types of population change and their correlation with population aging, changes in use of agricultural land, the environment, and intensity of soil erosion [14,51,52,53]. For this research, the heterogene database is used (population census 1961 and 2011 and agricultural census 1961 and 2012), which is appropriate for quantitative analysis.
Change in population (PCj) and change in arable land (ACj) in rural settlements (j), are calculated using Equations (3) and (4):
PC j = P j 2 P j 1
AC j = A j 2 A j 1
where P j 1 is the population in rural settlements in 1961; P j 2 is the population in rural settlements in 2011; A j 1 is arable land in rural settlements in 1961; and A j 2 is arable land in rural settlements in 2012.
The regional development component of population ( PN j ) represents the relation between population in each rural setlement in 1961 ( P j 1 ) and proportional change of population of the study area.The same relations were applied for arable land ( AN j ). Both patterns are calculated using Equations (5) and (6):
PN j = P j 1 ( P j 2 P j 1 1 )
AN j = A j 1 ( A j 1 A j 1 1 )
Net relative change of population ( PR j ) represents the difference between rural population in each settlement in 2011 and a hypothetical number of inhabitants that each rural settlement would have if the population in 1961 had changed proportionally with the change of population of the study area from 1961 to 2011. The same relations were applied for arable land ( AR j ). Both patterns are calculated using Equations (7) and (8):
PR j = P j 2   P j 1 ( P j 2 P j 1 )
AR j = A j 2 A j 1 ( A j 2 A j 1 )
Based on the ratio of the total value of the regional development component of the population (∑ PN j ) and changes in the total number of inhabitants (∑ PC j ), the limit values of the types of changes are described. The following types of changes are defined as the percentage of the relative changes in each settlement individually ( PR j ). According to the total population change, three types of population change are presented: progressive type ( PR j > 64.13%), stagnant type ( PR j = 0–64.13%) and regressive type ( PR j < 0%). The spatial distribution of the types of change with the same methodological approach is also defined for the arable land: progressive type ( AR j > 69.32%), stagnant type ( AR j = 0–69.32%, and regressive type ( AR j < 0%). A comparative analysis of the types of population change (Figure 7, left) and the arable land (Figure 7, right) provided a clear insight into the interdependence of the expressed depopulation and deagrarization processes in the study area.
It is important to emphasize that the typologies of population change and changes in arable land were analyzed for the period 1961–2011/2012, and the analysis of the changes in erosion intensity spans the 1971–2011 period. The reason for using a different time span is the discrepancy at the beginning of the major demographic (population decline, emigration, aging, etc.) and agrarian (decline in the number of agricultural households, abandonment of previously cultivated agricultural land, etc.) reorganization that started in the 1960s, and significant changes in the intensity of erosion caused by the above-mentioned processes, which have been reflected since the beginning of the 1970s [12,15,16,18,50].

4. Results and Discussion

4.1. Spatial-Temporal Distribution of Erosion Coefficient (Z) and Specific Annual Gross Erosion (W0)

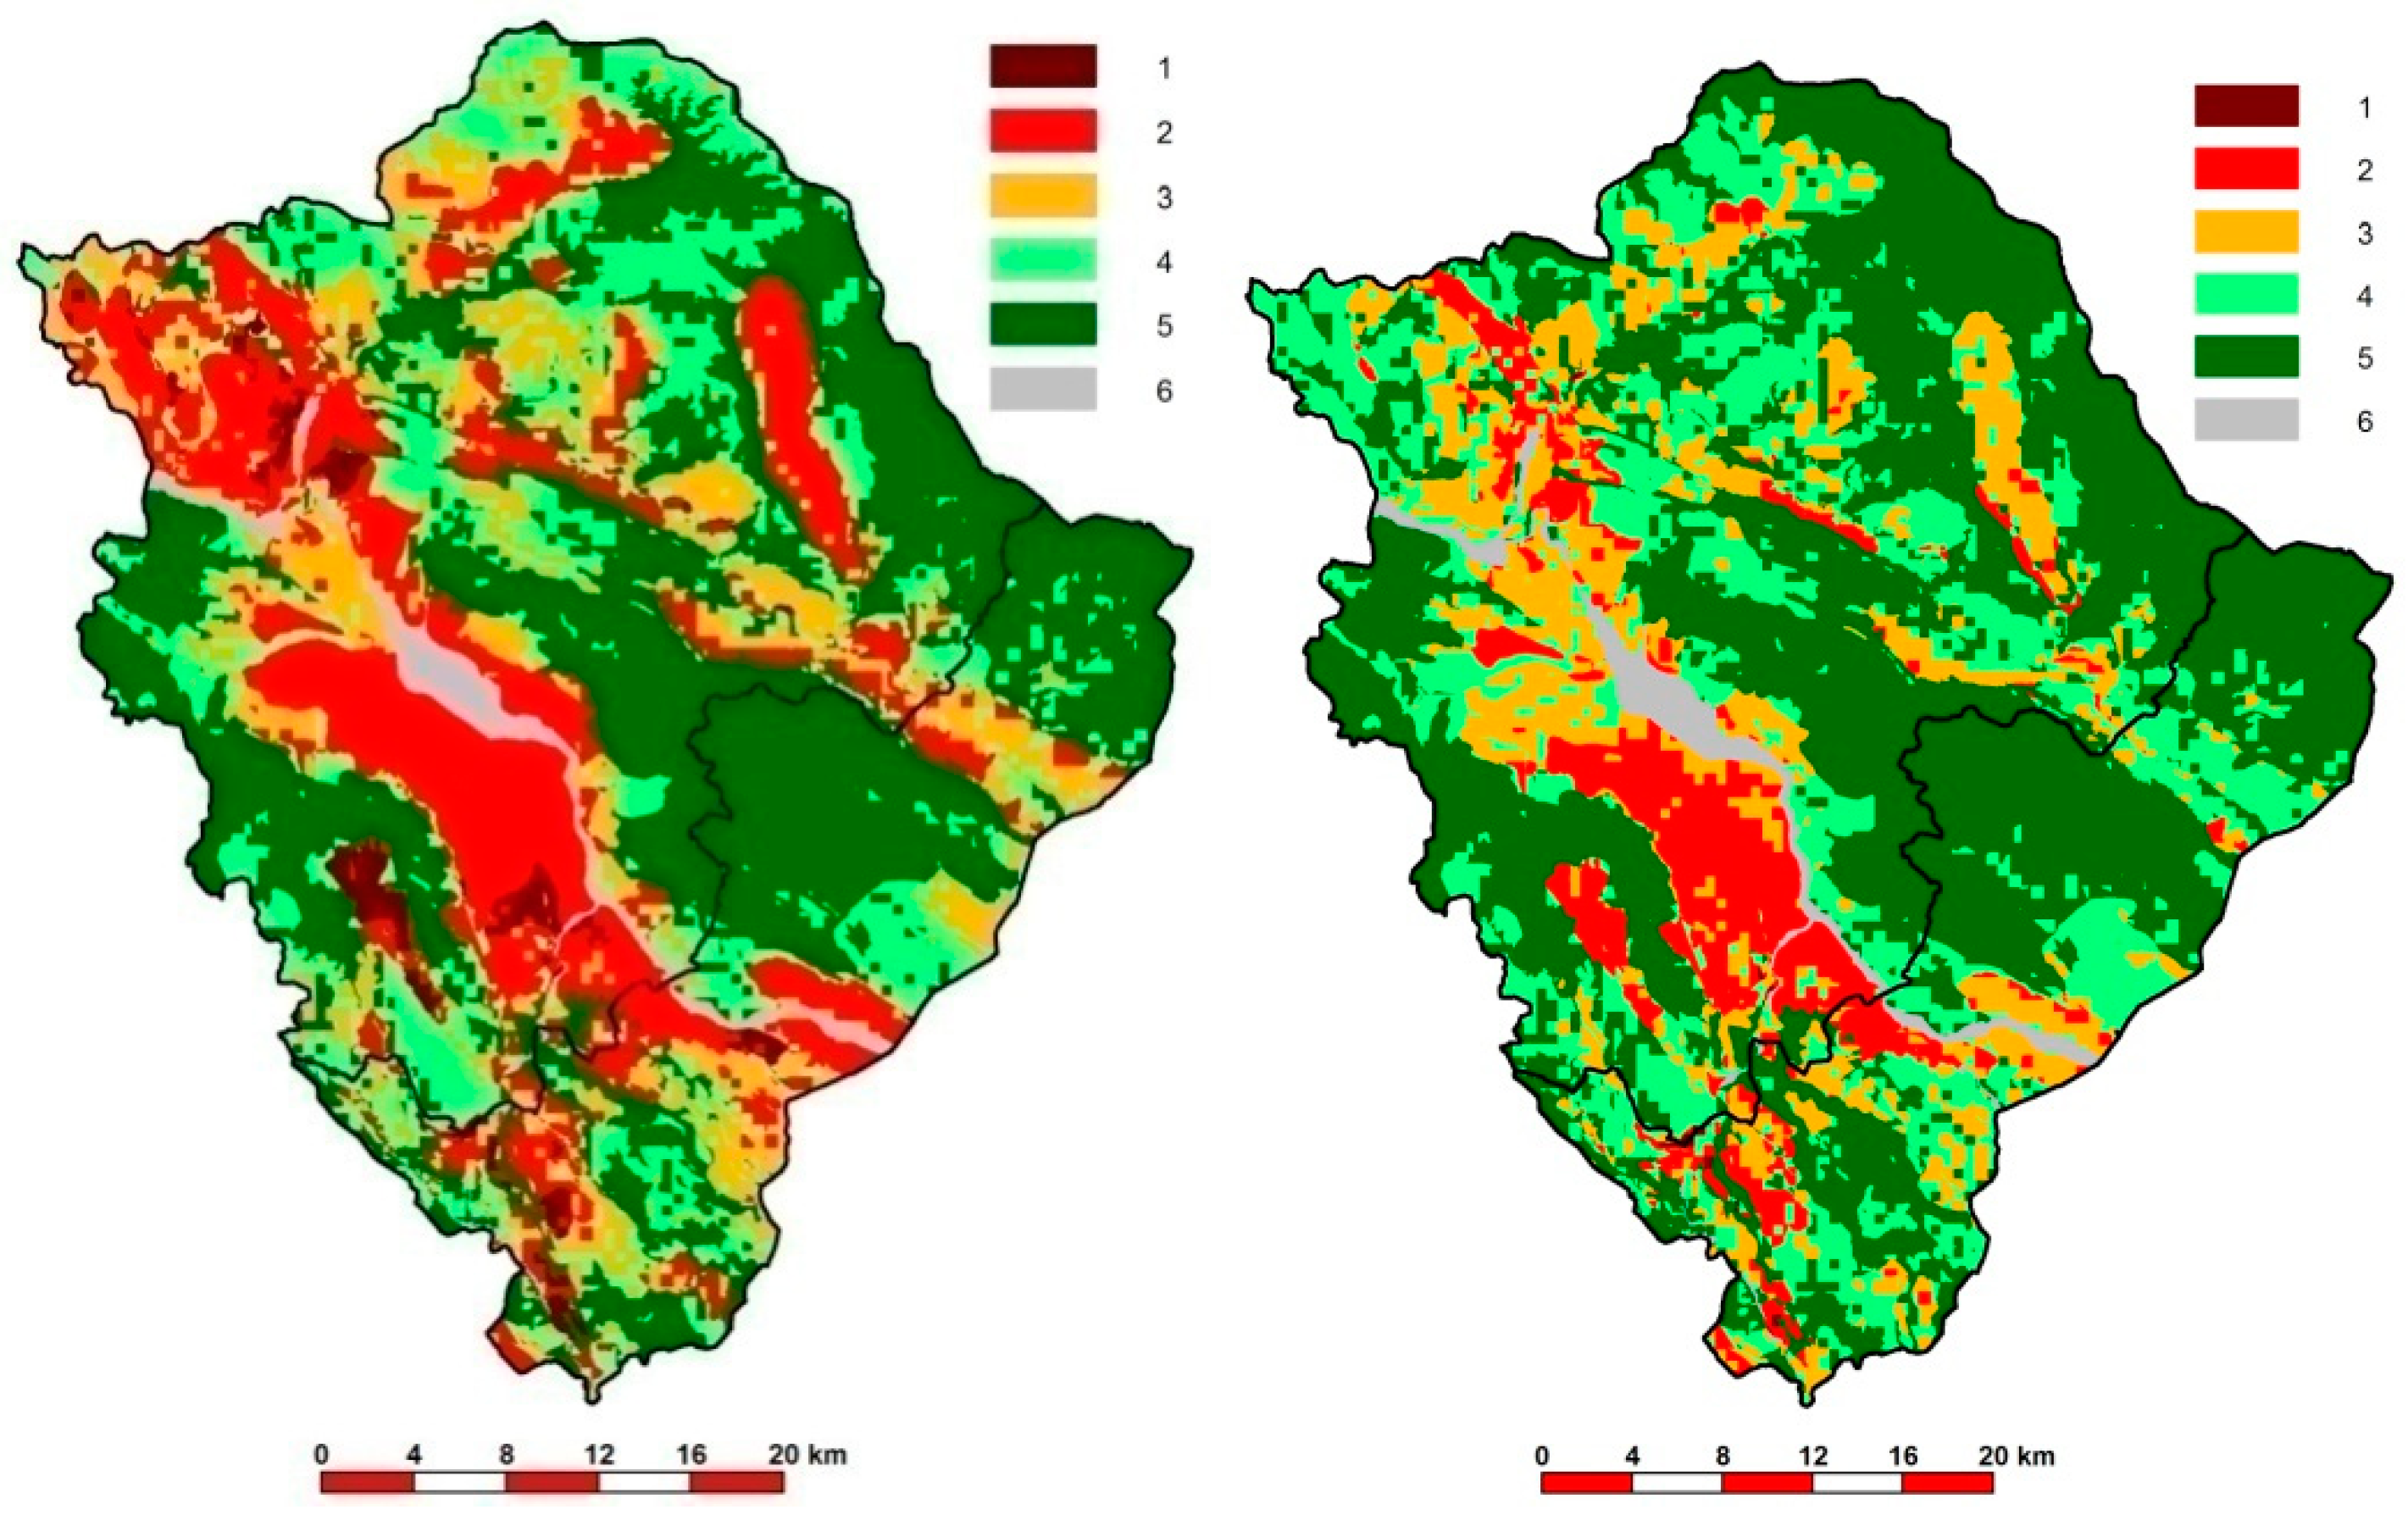
Spatial-temporal redistribution of erosion intensity is given in Figure 2, and changes in the erosion coefficient in Figure 3. According to EPM, the excessive erosion and intensive erosion categories were spread on 327.6 km2 (18.6%) of the study area in 1971, while in 2011 this area comprised only 113.8 km2 (6.6%). The results also indicate that 428.9 km2 (25.0%) in 1971 was under the influence of medium erosion, while in 2011 this area was 452.6 km2 (26.4%). A significant part of the territory with a surface of 922.9 km2 (53.8%) in 1971 and 1103.9 km2 (64.4%) in 2011 was influenced by weak erosion and very weak erosion. Only 2.6% of the territory was under the opposite process of accumulation.
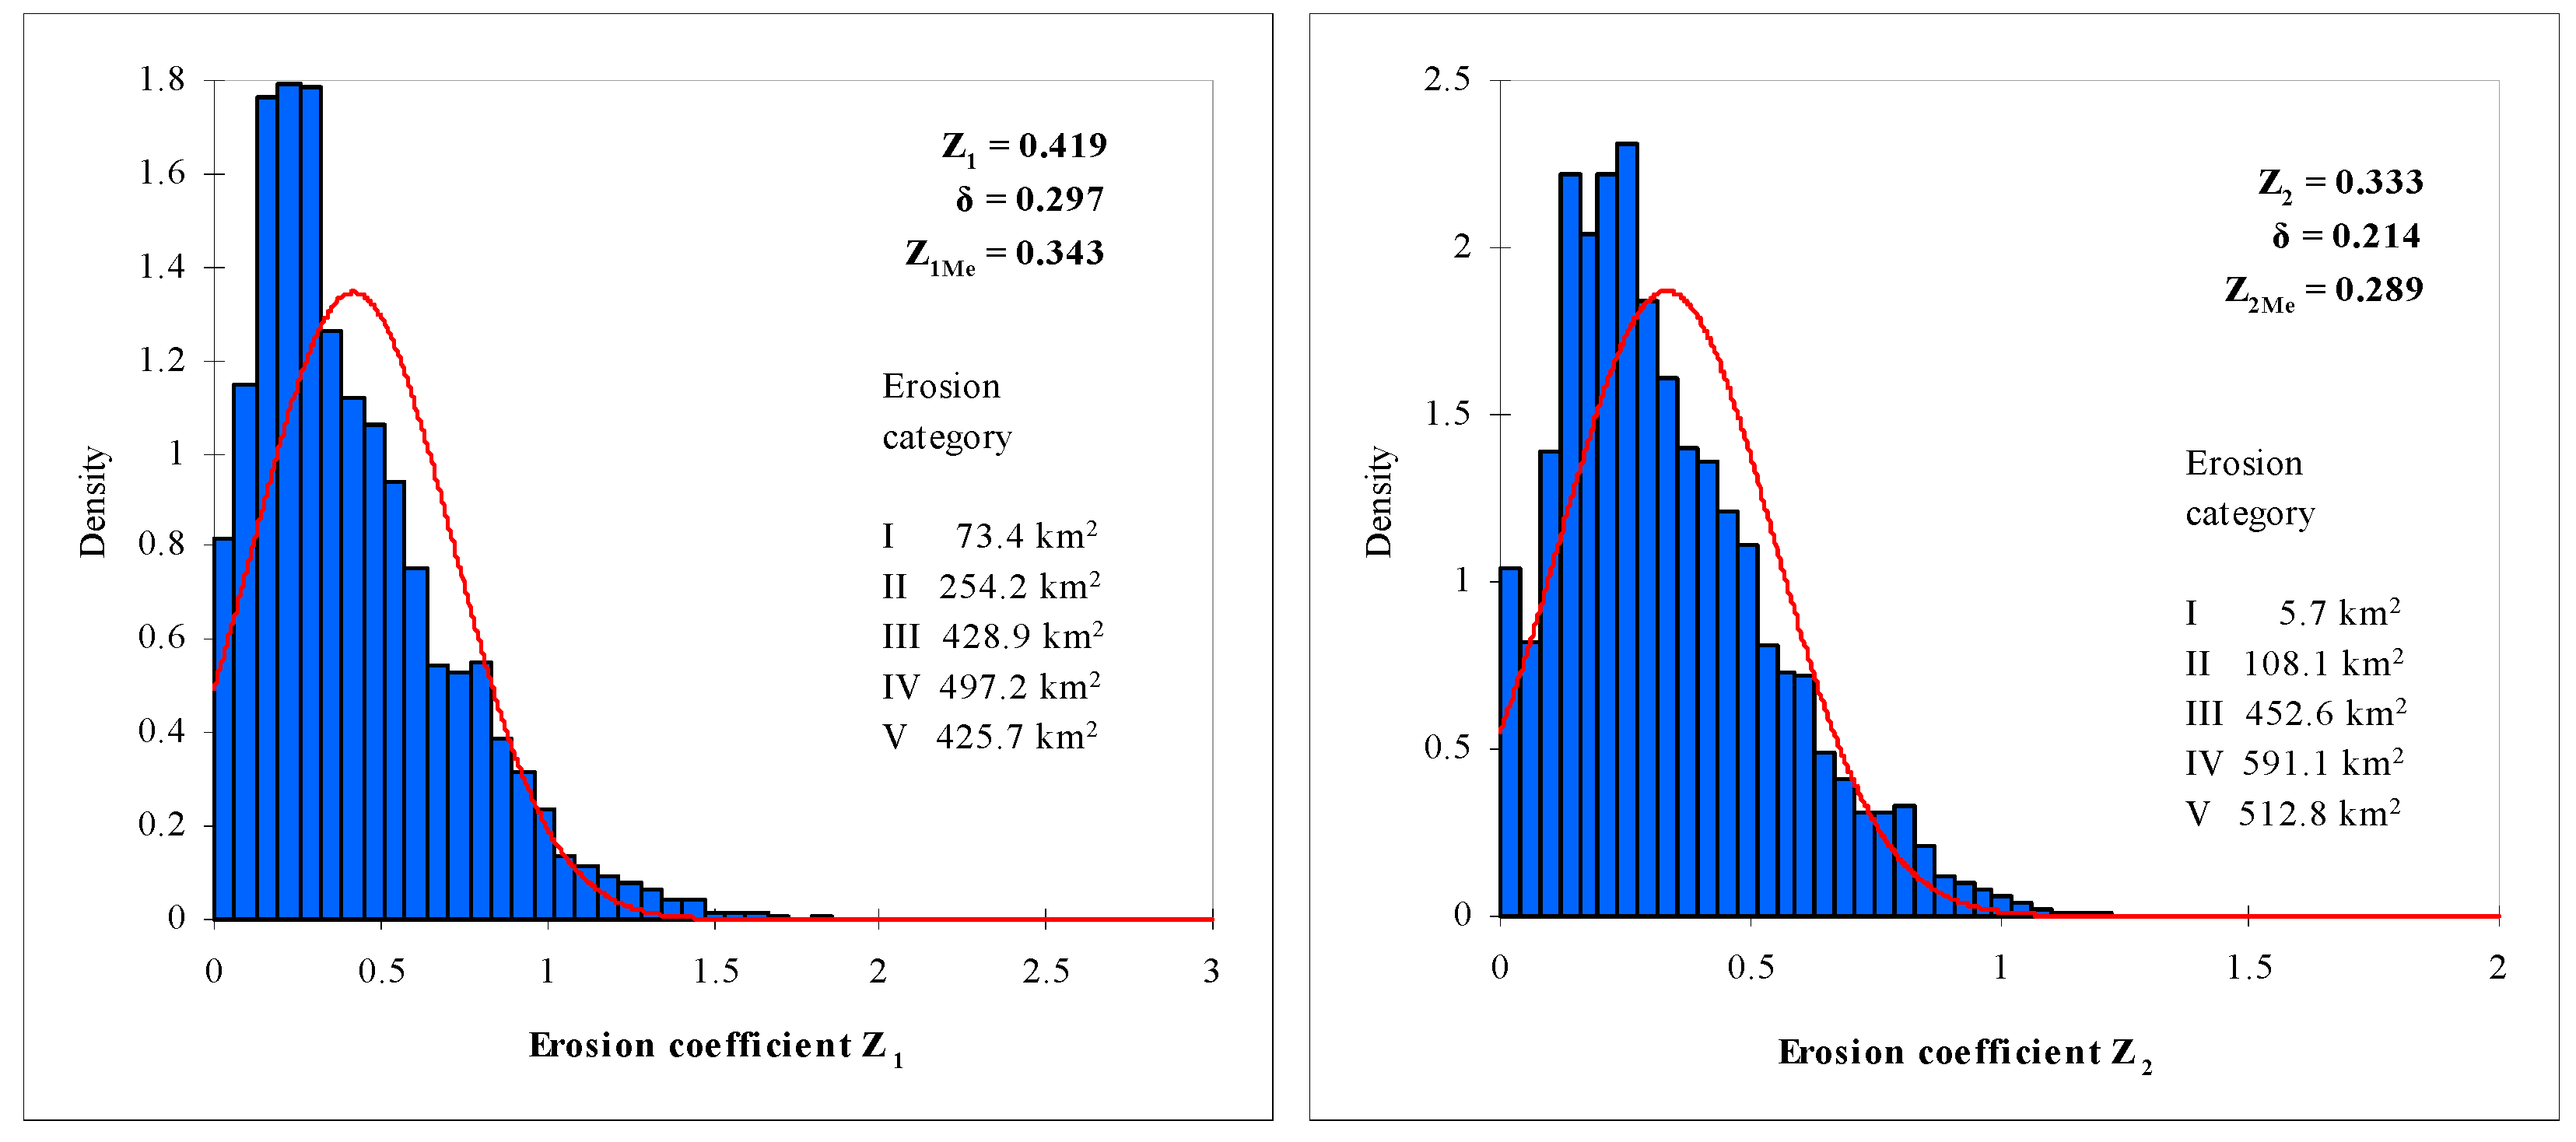
According to the coefficient and erosion category, erosive processes in 1971 were in the category of medium erosion, Z1 = 0.419, i.e., category III of destruction. The average erosion coefficient in 2011 was Z2 = 0.333 (category II of destruction). It can be concluded that the resulting changes during the analyzed period caused the reduction in intensity of the erosive process for one category (Figure 3).
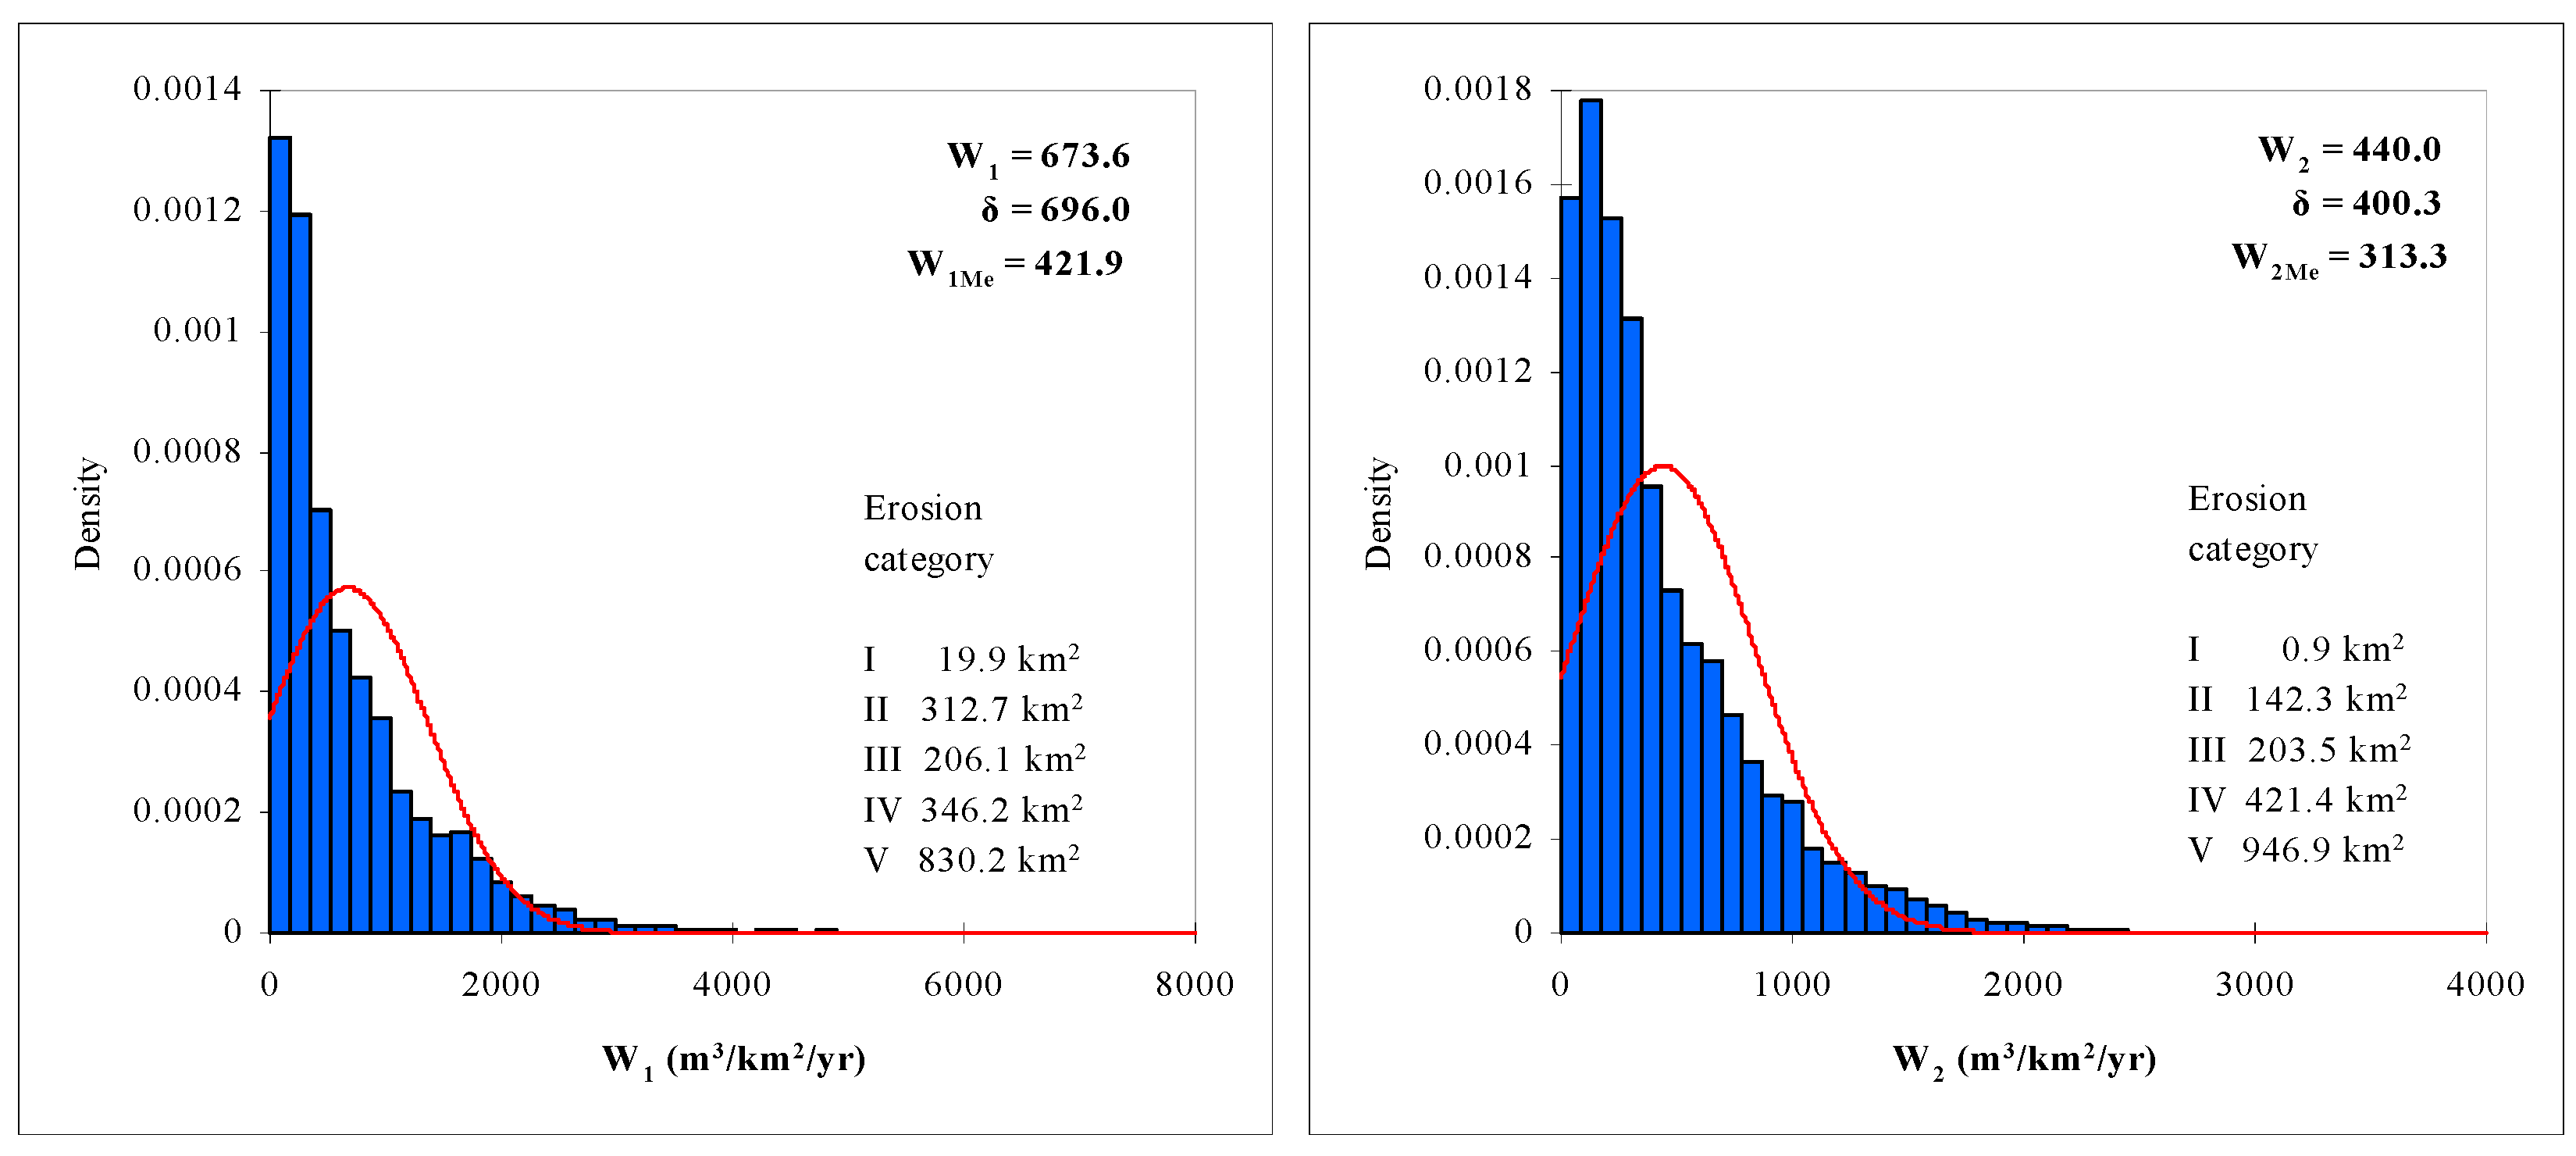
Spatial distribution of the average specific annual gross erosion in m3/km2/year in the rural areas of Pirot and Dimitrovgrad municipalities is presented in Figure 4. The results indicate that more than 78% (1368 km2) of the observed territory is under significant, weak, and very weak erosion. Medium erosion is in almost 12% (206 km2) of the study area. Intensive erosion, which ranges from 1200 to 3000 m3/km2/year, occupied 8% (142 km2), and extensive erosion, at more than 3000 m3/km2/year, occupied extremely small areas.
The results show that specific annual gross erosion was W1 = 673.6 m3/km2/year in 1971 and W2 = 440.0 m3/km2/year in 2011 (Figure 4), which means that the reduction in erosion was 35%. The biggest changes in this period were referred to erosion categories I and II. Areas in erosion categories I and II comprised about 20% of the observed territory in 1971, with a decline of 57% in 2011. On the other hand, there has been increase in the size of areas in erosion categories IV and V to 21.7% in 1971 and 14.1% in 2011.

4.2. Transformation of Rural Settlements Toward Sustainable Rural Development

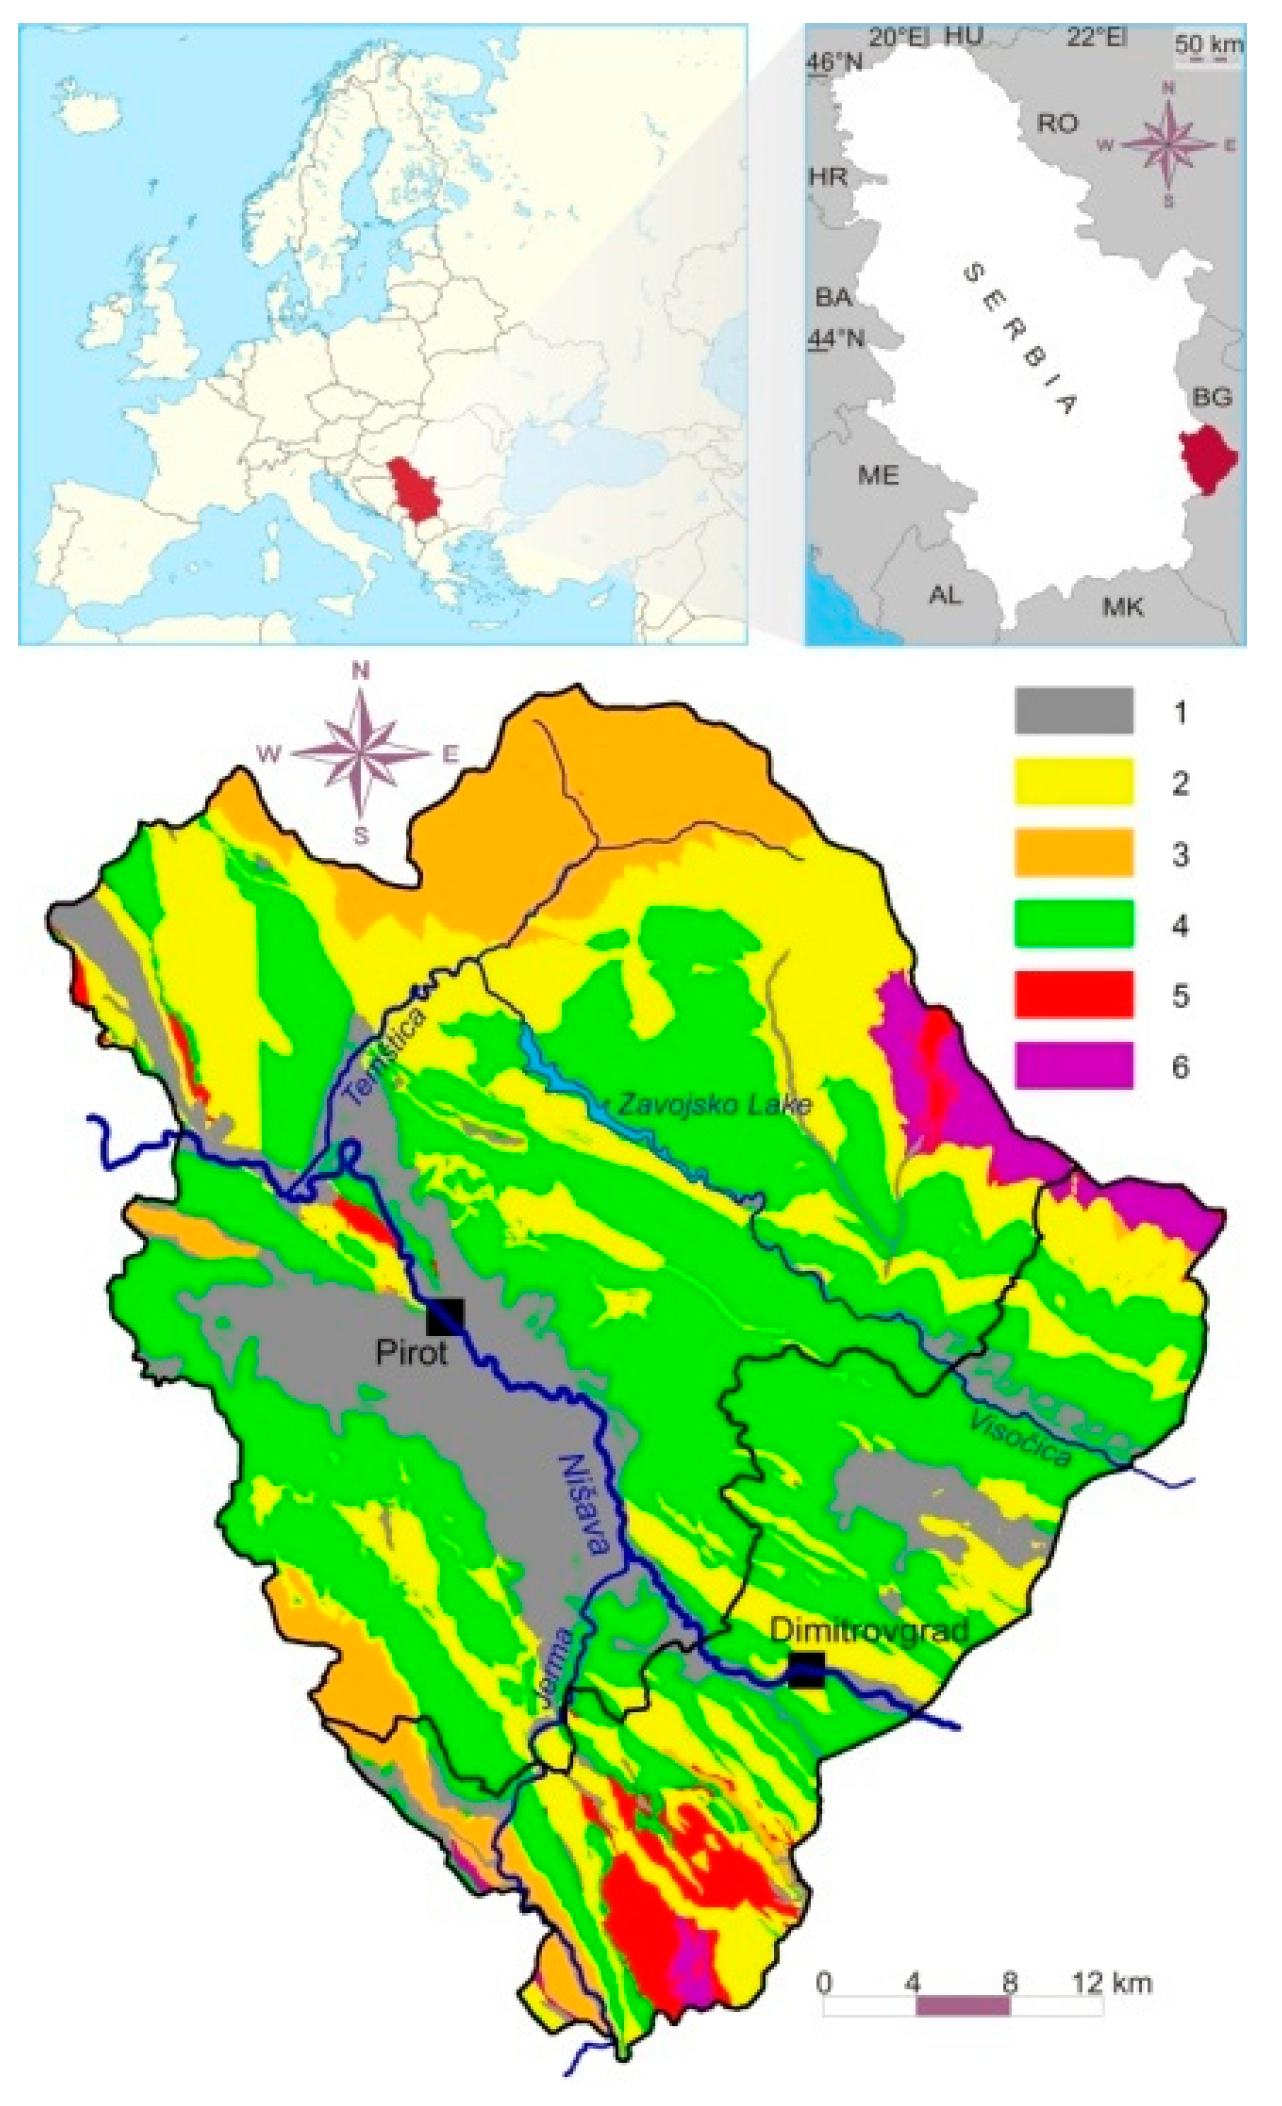
Demographic development of mountainous, remote, and border zones in Serbia has been described as unfavorable in the long term, presenting several problems which correlate with elements of economic, cultural, social, historical, political, and other systems [54]. Major demographic and land use changes have occurred in rural, especially mountainous, areas in recent decades, which are seen in processes of intensive depopulation and abandonment of agriculture [55].
The Region of Southern and Eastern Serbia is the area most affected with negative natural changes and emigration processes, while having the greatest population decrease on a national level (1961: 1,874,293; 2011: 1,563,916 people). The municipalities of Pirot and Dimitrovgrad are situated in this region, and they have the same demographic trends as the whole region. In Pirot municipality, depopulation processes caused by negative rates of natural change and net migration rate led to a population decrease of more than 10,000 inhabitants in the last 50 years (1961: 68,073; 2011: 57,928), and in Dimitrovgrad municipality of 12,000 inhabitants in the same period (1961: 22,082; 2011: 10,118). In rural areas of these two municipalities, the population decline was even sharper: in 111 rural settlements, there was a population decrease in the observed period of 40,000 people (1961: 63,627; 2011: 22,823).
Migration from rural to urban areas due to increased standards of living was a major factor in the intensive depopulation, especially in rural settlements at higher elevation zones, distant from main roads, with a lack of appropriate connectivity between central settlements and transport infrastructure and no strategy of economic development, in the first agricultural production in the last few decades [56]. The urban settlements of Dimitrovgrad and Pirot, as multipurpose centers in the study area, had the most significant influence on the development of the surrounding villages. Due to processes of urbanization, industrialization, and deagrarization in the last 50 years, urban settlements attracted people from rural areas, primarily those in the working and fertile period of their lives [
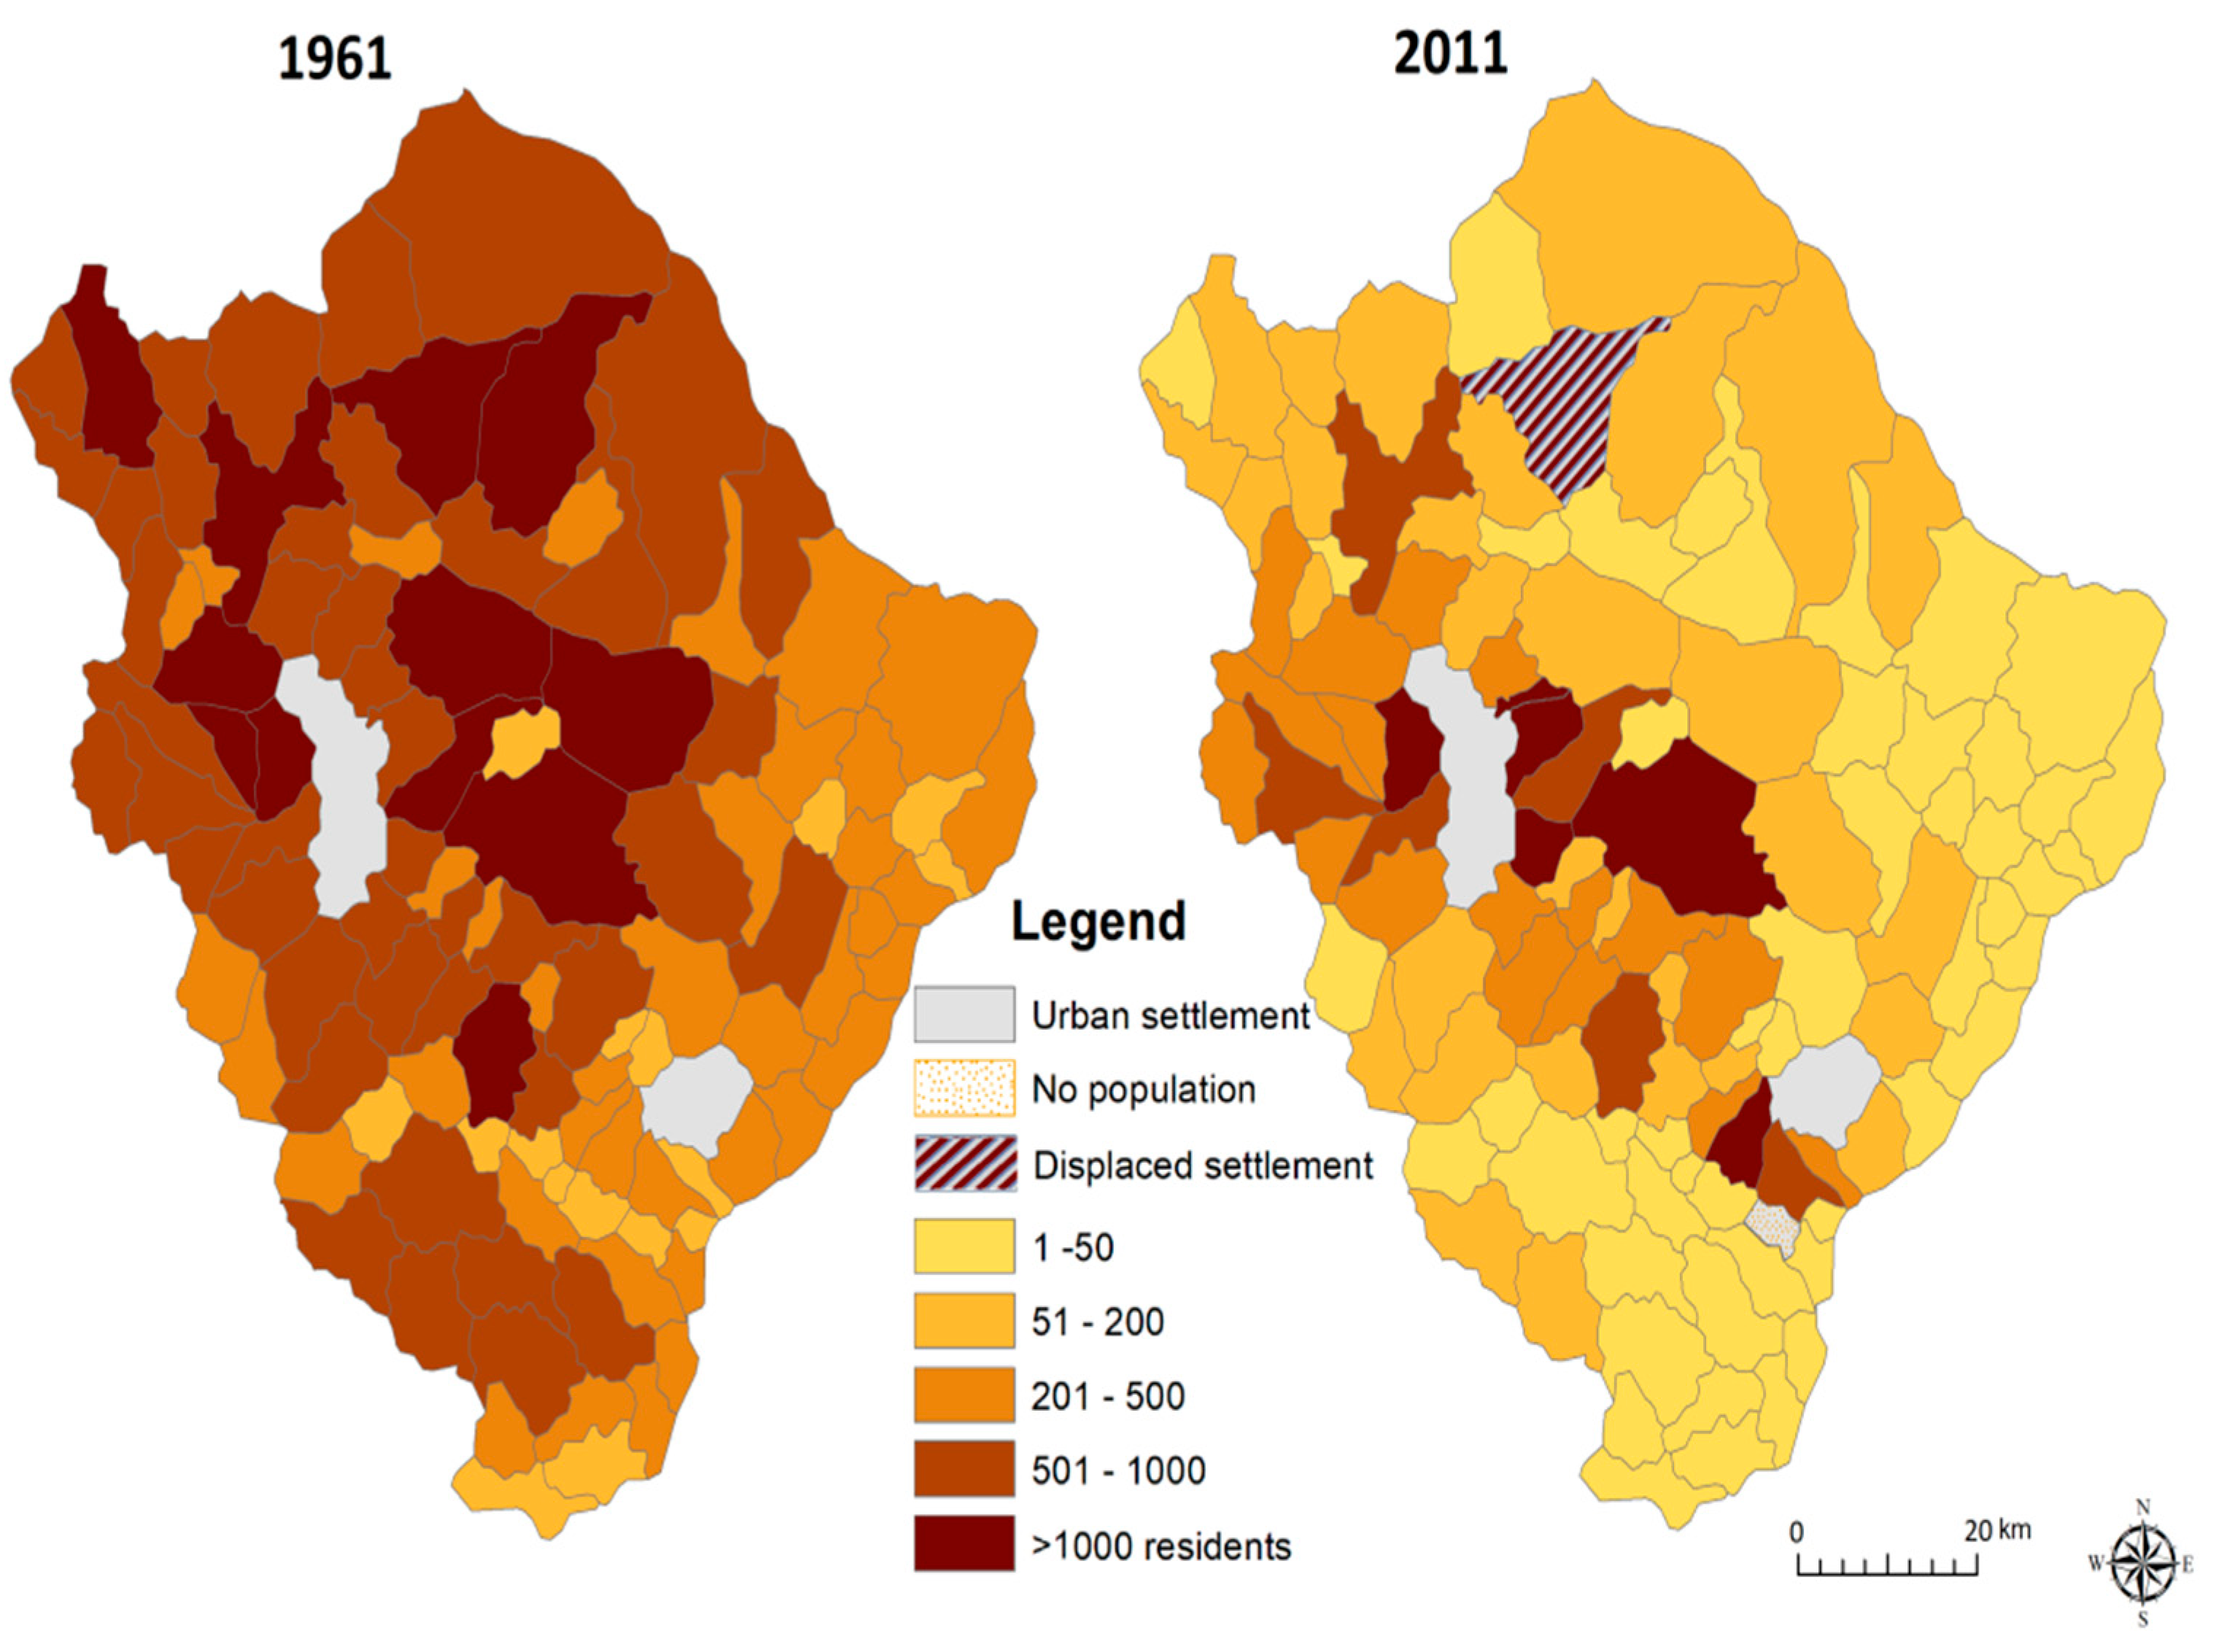
55]. This is reflected in an increased number of small rural settlements with fewer than 200 inhabitants (1961: 16 settlements with 2389 inhabitants; 2011: 82 settlements with 4040 inhabitants), highlighting the occurrence of settlements with fewer than 50 people (1971: 1 settlement with 49 inhabitants; 2011; 51 settlements with 994 inhabitants). In addition, the village Novi Zavoj was relocated after flooding during the construction of the reservoir for hydropower and now is situated in the suburban zone of Pirot (Figure 5).
The process of extinction of rural settlements and the drastic decline in the rural population have lasted for several decades. According to the last census in 2011, 67 rural settlements (60%) had fewer than 100 inhabitants (in 1961 only 1 settlement) (Figure 5 and Figure 6), while 17 rural settlements had fewer than 10 inhabitants. The abandoned Prača settlement represents the example of the depopulation process in rural settlements of Pirot and Dimitrovgrad municipalities. Therefore, the future existence of the majority of rural settlements, primarily in the higher elevation zones, is in great danger.
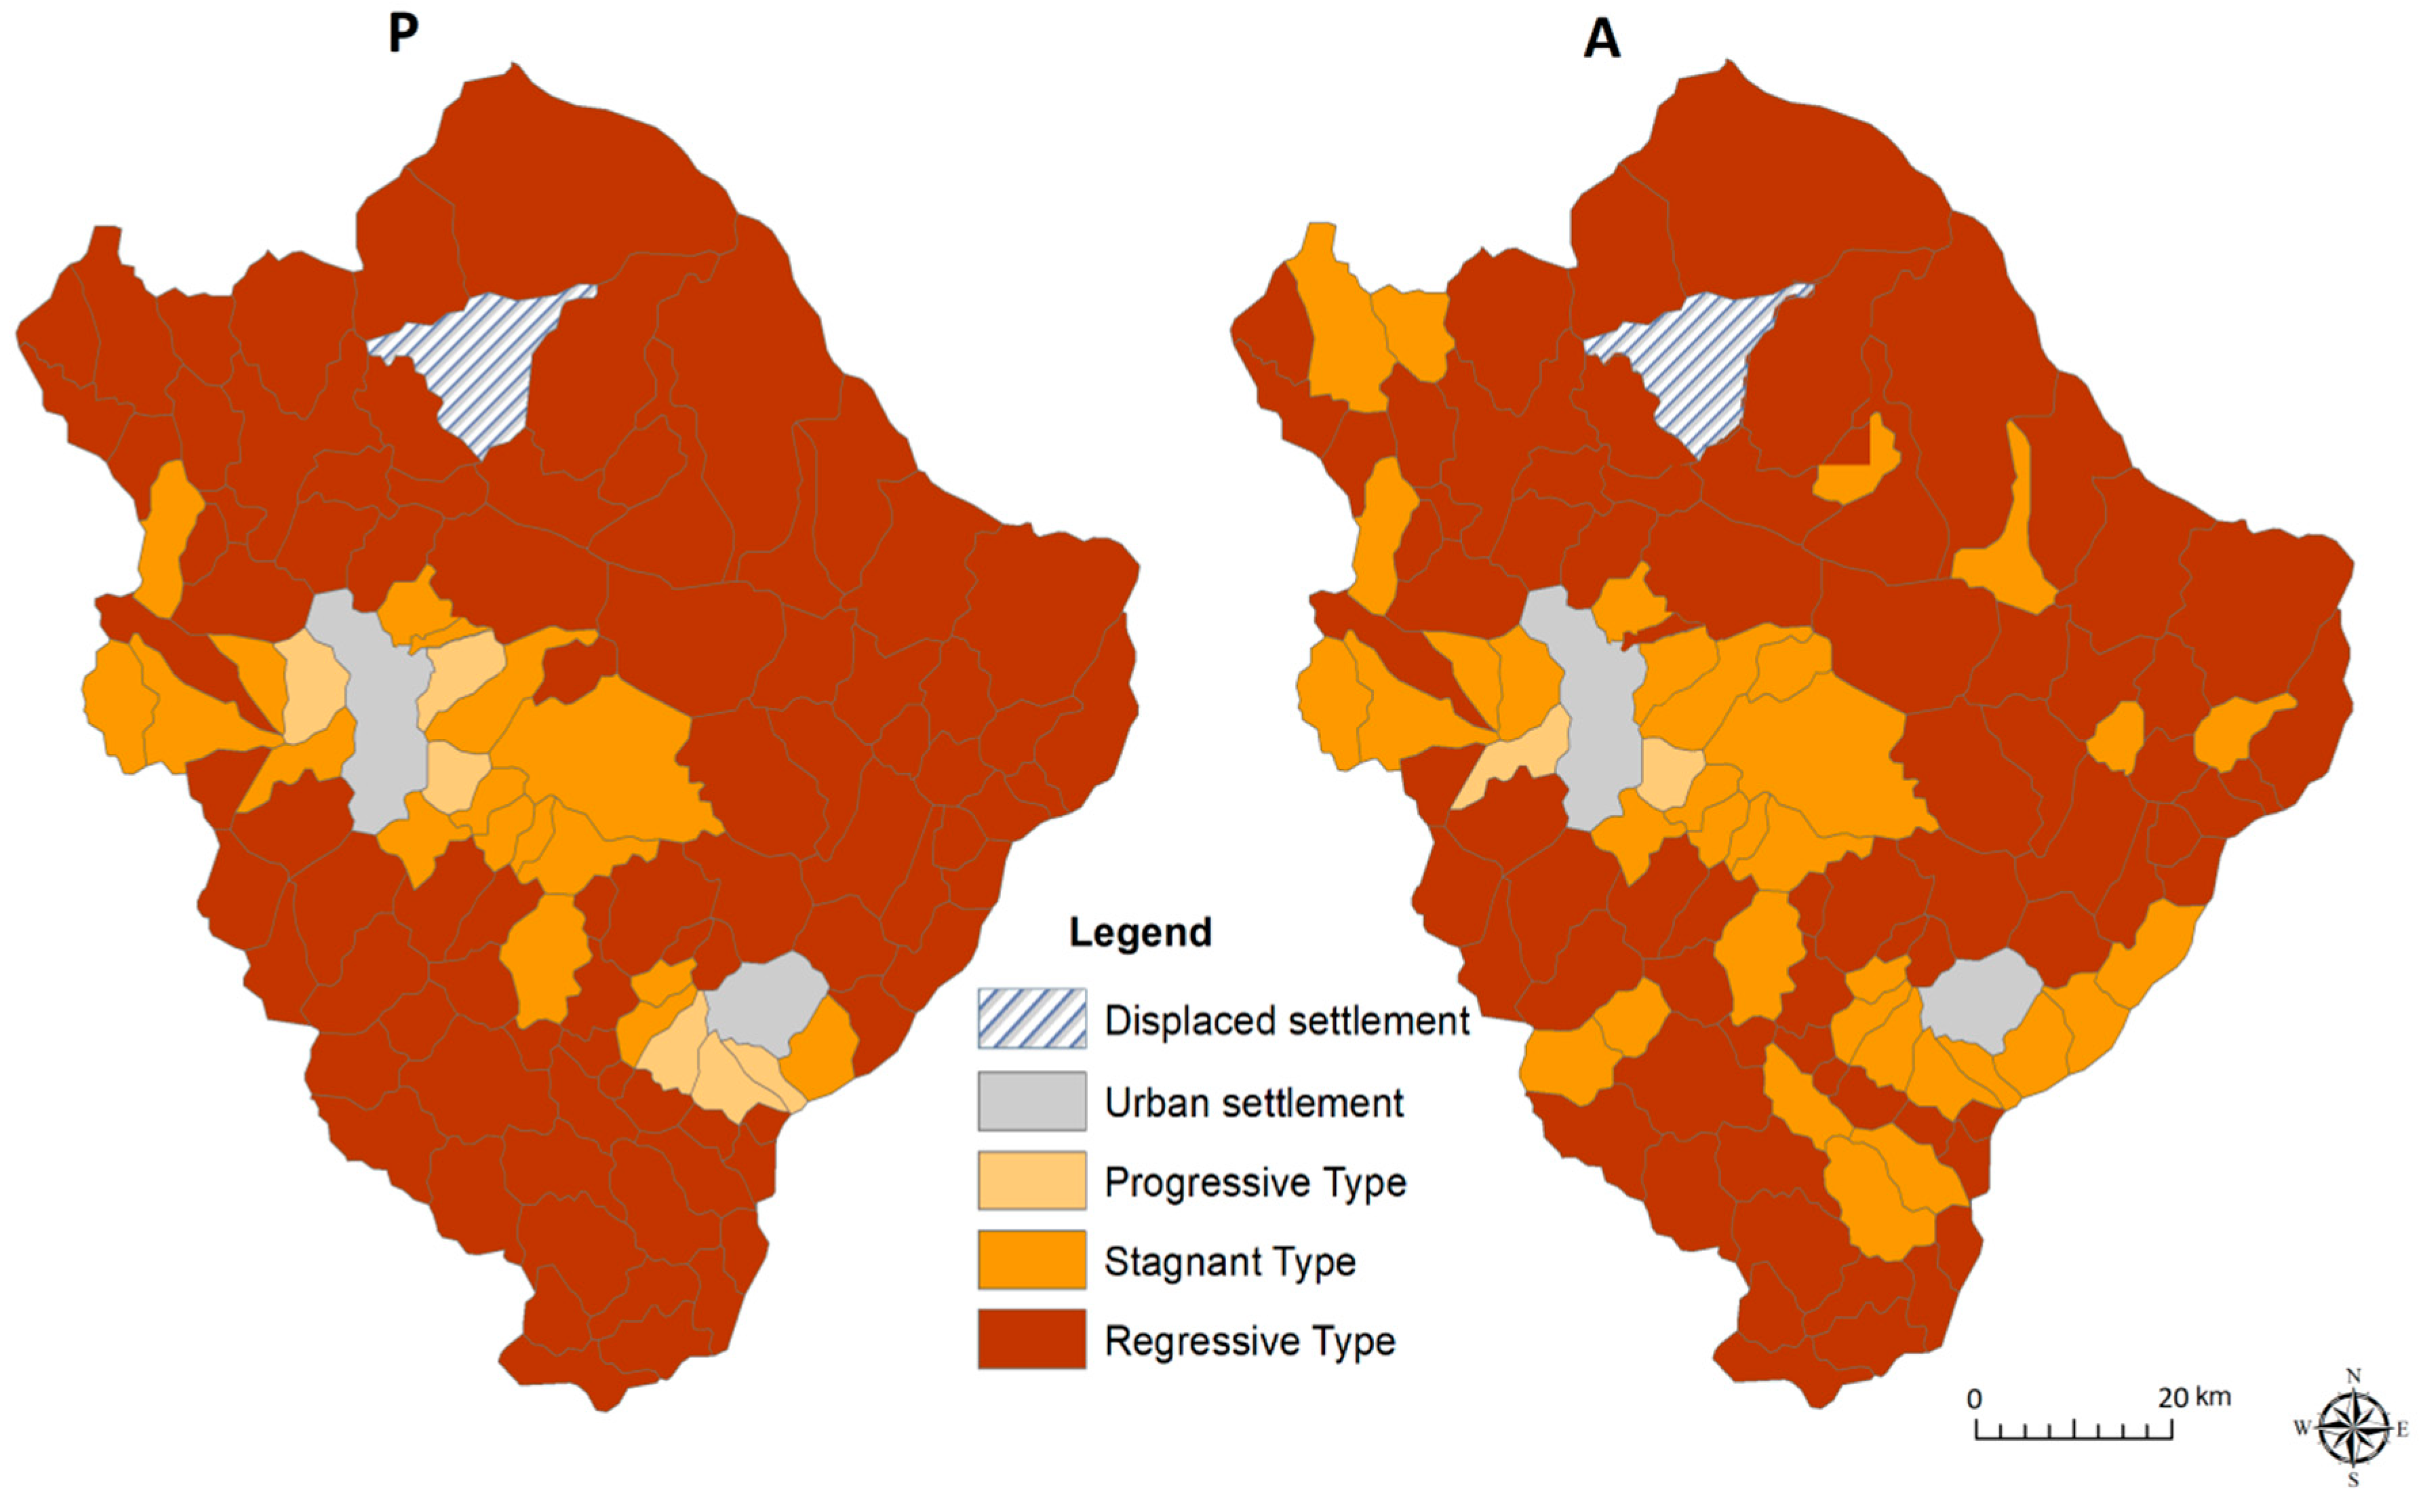
To conduct a more precise analysis of the impact of demographic and agrarian transformation on erosion intensity in the observed municipalities, typology of rural settlements was carried out according to population changes and changes in arable land. Based on the proportional changes in the number of inhabitants and amount of arable land in rural settlements in 1961 and 2011, these types of changes are shown in Figure 7. According to the net relative change in the number of inhabitants, a deficit in relation to the expected hypothetical change was recorded in 87 villages (78.4%), and according to the net relative change in the arable areas in 73 villages (65.8%).
Progressive population changes (Pp) are characterized by positive values of net relative population change (PRj > 64.13%). This type comprises six rural settlements (5.4%) located in the suburban zone of Pirot and Dimitrovgrad, along corridor X-E75 (Niš–Pirot–Dimitrovgrad–Sofia toward corridor IV in the direction of Istanbul), in the elevation area up to 500 m. Progressive change of the arable land (Ap) with the positive value of the net relative change (ARj > 69.32%) referred to only two settlements located in the periurban region of Pirot, PoljskaRžana and BarjeČiflik, which recorded an increase of the area under arable land.
Stagnant population change (Ps) with positive net relative change (0 < PRj < 64.13%) was represented in 18 rural settlements (16.2%). They are located in the periurban zone of Pirot and Dimitrovgrad, spreading around those two towns and rural settlements of the progressive type, along the X-E75 corridor, mainly in the elevation zone up to 500 m. In addition, 36 villages of the stagnant type of arable land (As) are located in this area, together with some rural settlements at an elevation zone above 500 m (mainly mountain and border villages). Despite the positive net relative change (0 < ARj < 69.32%), those rural settlements are characterized by a moderate decline in areas under arable land.
Regressive population change (Pr) has a negative value of the net relative change (0 > PRj > −64.13%). This type is represented in 87 rural settlements (78.4%), which are located in mountainous, border, and isolated areas distant from urban centers. The highest number of rural settlements of this type (86.2%) is concentrated in elevation zones over 500 m. These villages correspond with the regressive type of change of arable land (Ar), with 73 villages with negative net relative change (0 < ARj < −69.32%).

4.3. Determination of Controlling Factors

Previous studies [14] have shown that, among all the variables contained in the EPM model, the coefficient of soil protection X is the most significant controlling factor in erosion change. Since this research aims to determine the factors controlling soil erosion from the perspective of anthropogenic influence on land use change, two criteria were used: determination of changes in erosion intensity according to the criterion of classification of settlements caused by changes in population development and arable land, and according to the criterion of elevation differentiation.
For this study, correlation analysis was used. Such a statistical analysis shows the level of dependence between the selected variables (here, erosion coefficient, elevation zone, rural population, arable land, type of settlement according to demographic indicators, and share of arable land). Mathematical interactions between various variables are described in the correlation matrix (Table 3). Overall, our results display high significance between variables. Values of correlations for the function Z = f(h) show a strong dependence in reducing erosion with increasing altitude (r = −0.98). Additionally, the results show that the values of correlations between elevation (h) and other variables have a negative cone, with a maximum of r = −0.94 for the function h = f(Pr) and a minimum r = −0.53 for the function h = f(Ar). Analysis of the spatial distribution of settlements according to elevation zone and population size indicates a high degree of correlation (r = −0.85) between altitude and intensity of the depopulation process, h = f(P). The very strong relationship h = f(Pr) is explained by the fact that the increase of altitude shows the intense trend of decreasing in number of inhabitants in settlements of the regressive type of population change (Pr). In general, it can be concluded that statistical analyses show a strong level of dependence between a decrease in population, arable land, and erosion coefficient with an increase in altitude.
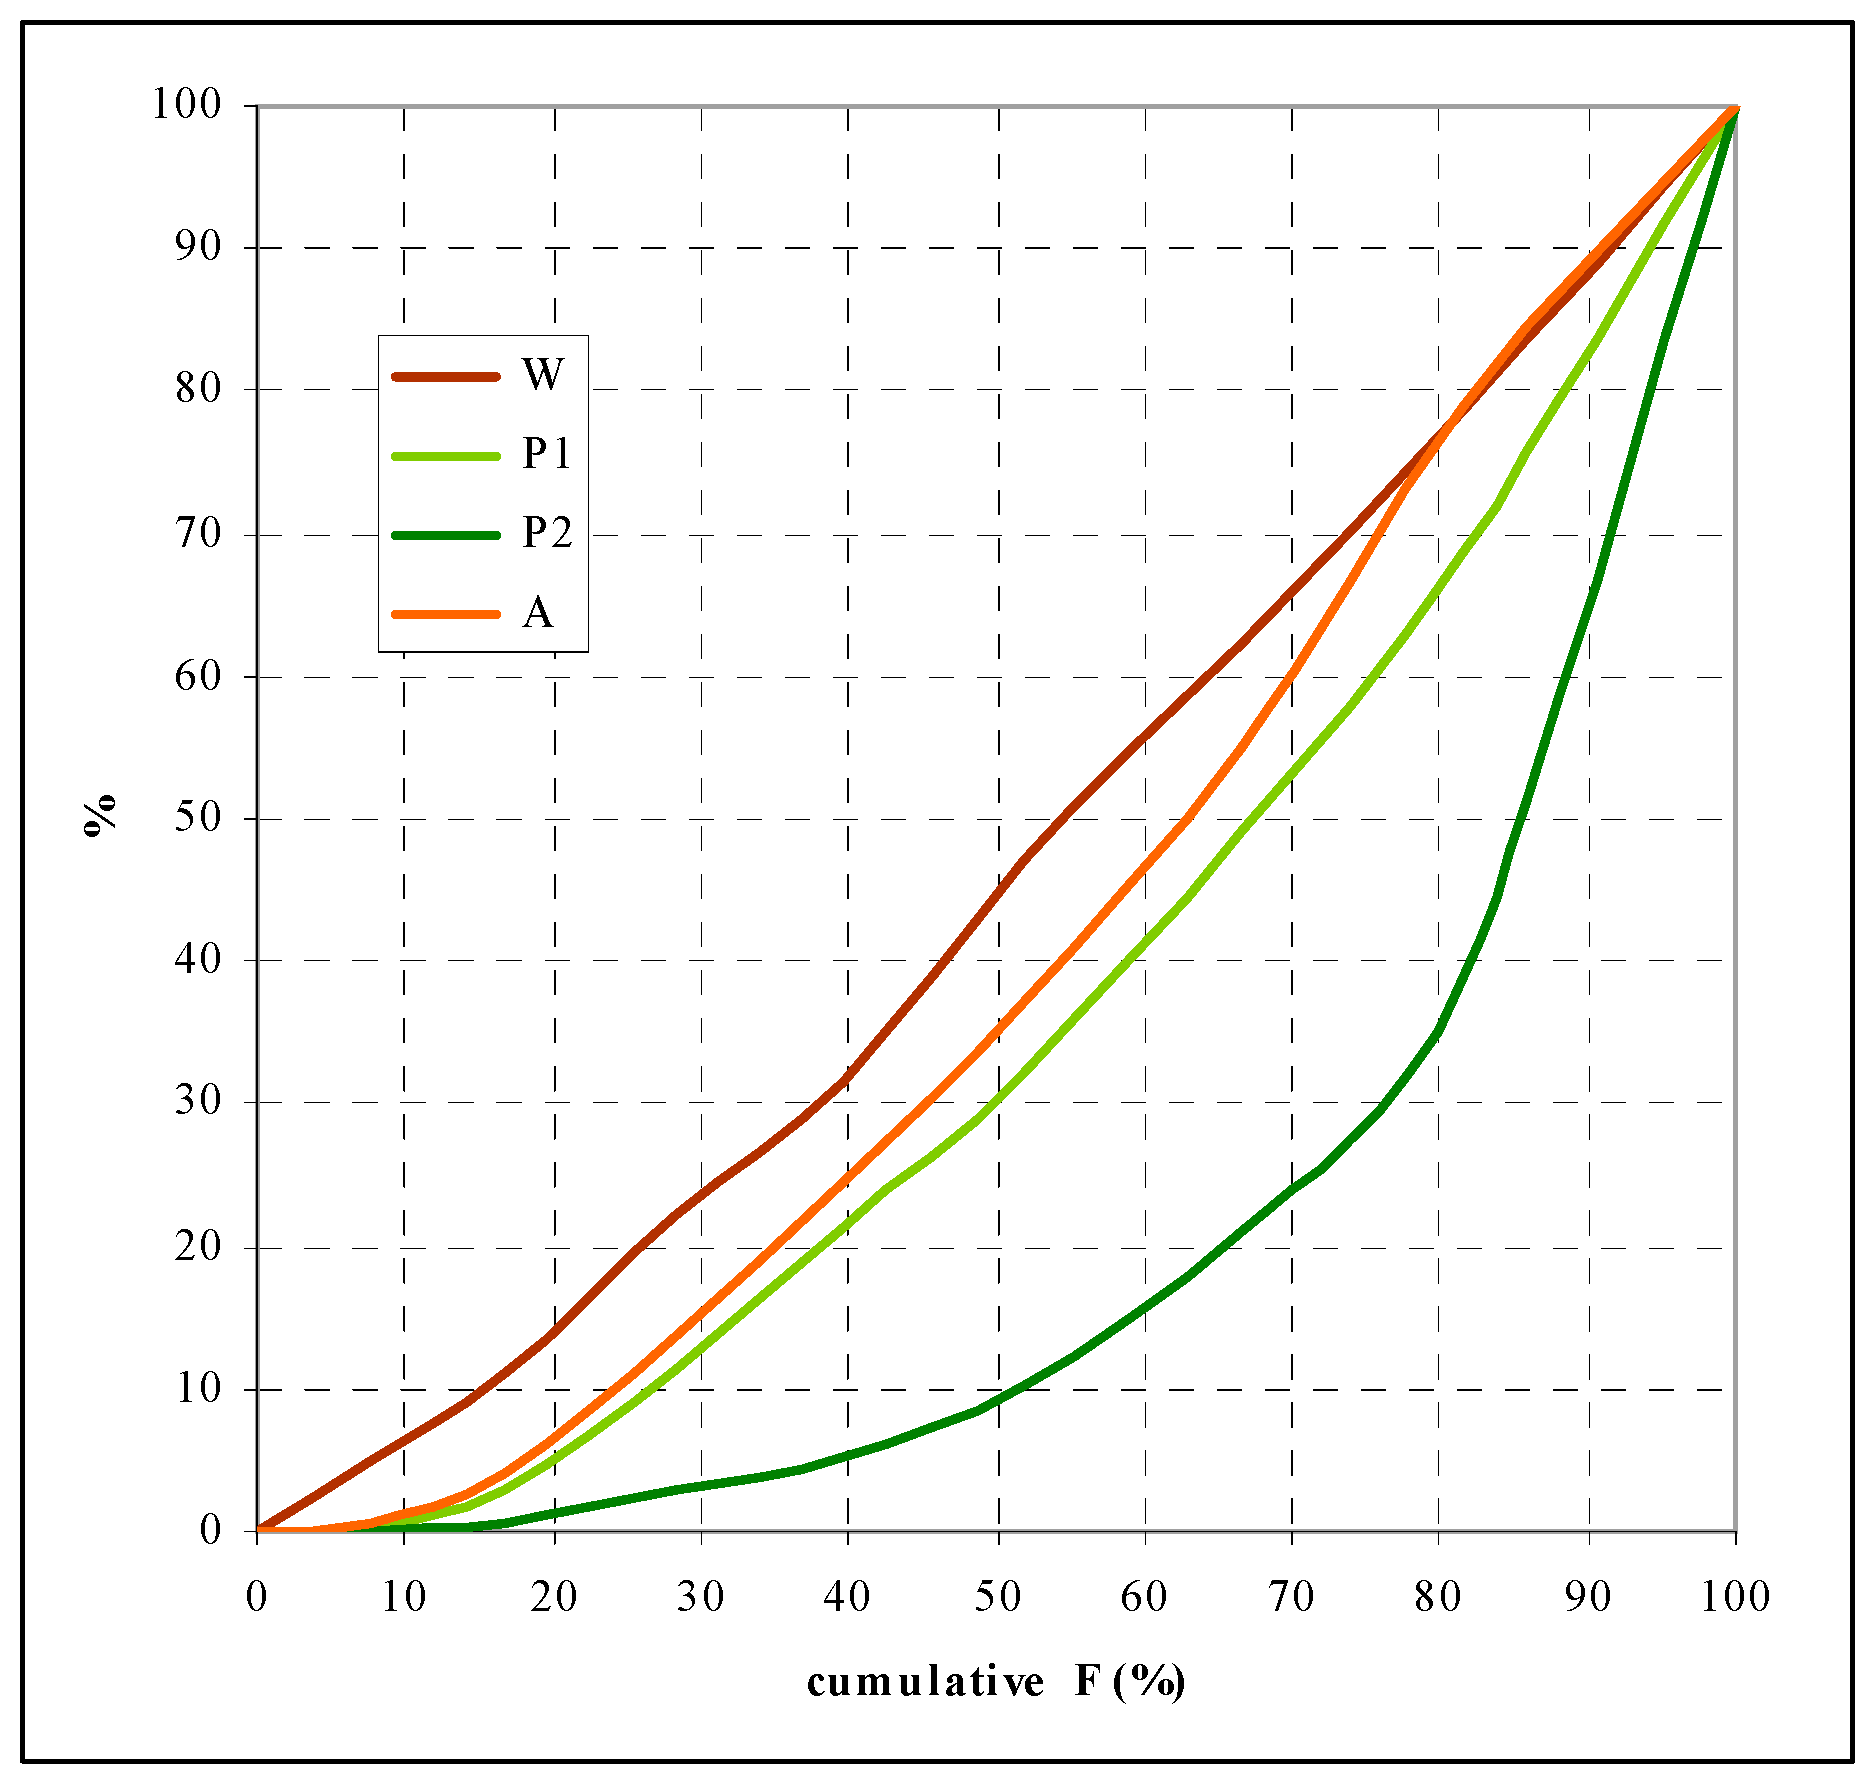
Considering the exponential character of the trend of decreasing number of inhabitants in the period 1961–2011, the largest deviation from the “line of perfect equality” (diagonal) is shown by the cumulative curve of the population (P2) for 2011 (Figure 8). Thus, in the rural area of the municipalities of Pirot and Dimitrovgrad, in 1971, the cumulative share of population was 32% in 50% of the cumulative area, while, according to the last census in 2011, the cumulative share of the population was only 10.3%. A consequence of such intensity of depopulation has been a decrease of arable land by 37% (cumulative curve A), which resulted in decreased erosion intensity by 47% (cumulative curve W) from 1971 to 2011 (Figure 8).

4.4. Effects of Anthropogenic Impact on Change of Erosion Rate

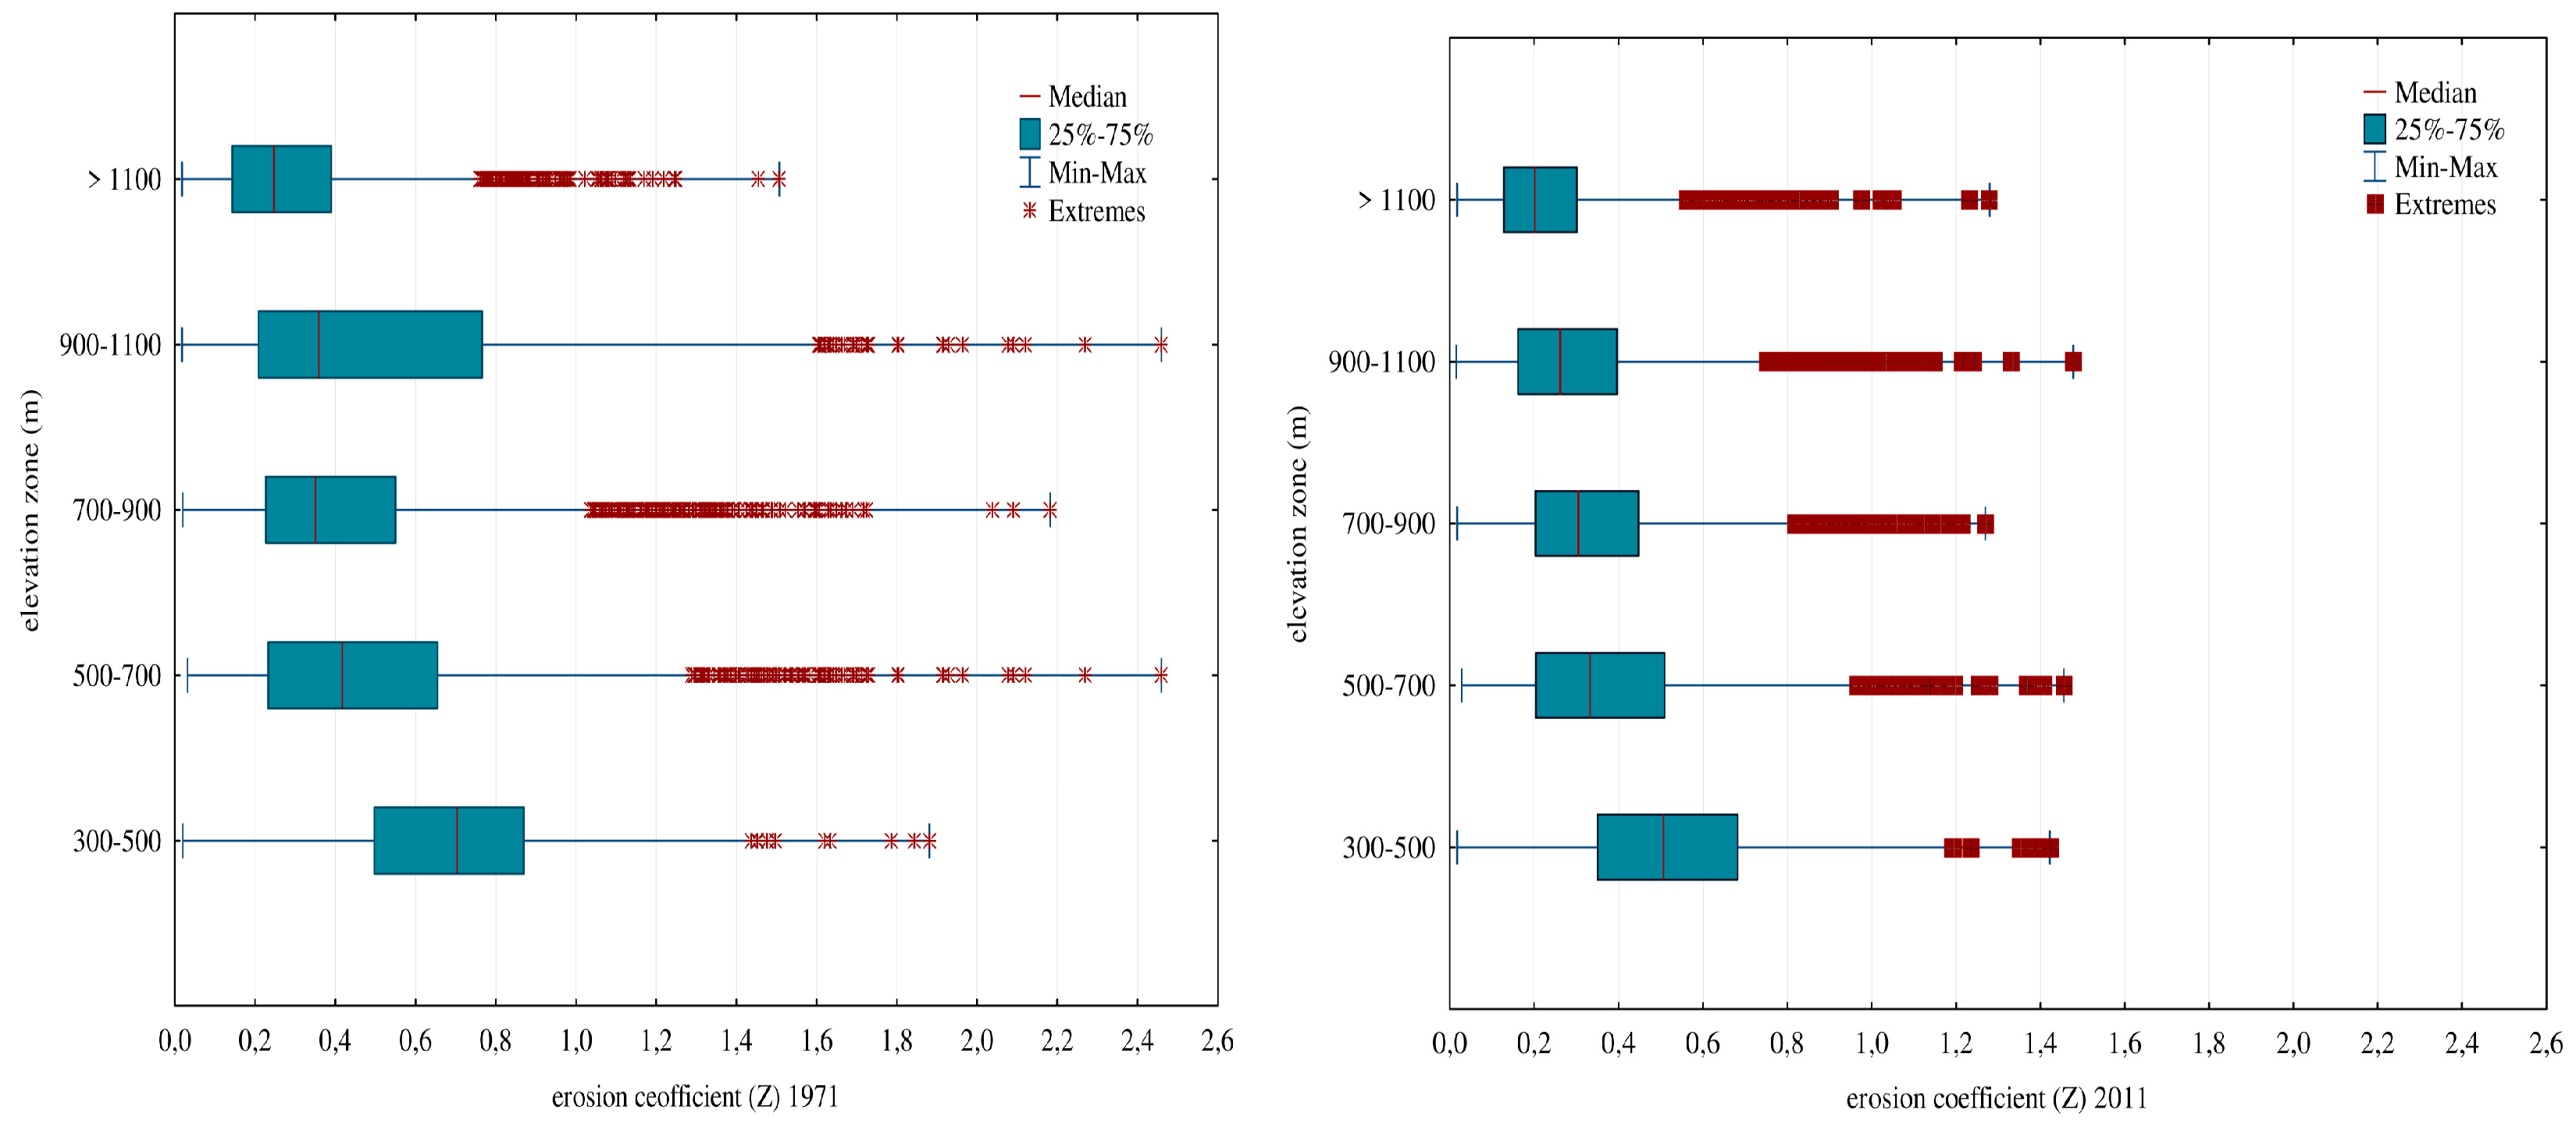
According to the results of the correlation analysis, the spatial distribution of the changes in the intensity of erosion through elevation zones emphasizes the influence of the anthropogenic factor. This also reflects the character of the changes in the functioning of demographic and agrarian transformation of the area. In this context, further analysis in this paper will be developed in the direction of reconnaissance of observed changes at the level of selected elevation zones: 300–500 m, 500–700 m, 700–900 m, 900–1100 m, and >1100 m. Distribution of the erosion coefficient (Z) according to erosion category in different elevation zones are given in Table 4.
In the elevation zone 300–500 m, the mean erosion coefficient was Z1 = 0.688 in 1971, with a median value of Z1Me = 0.761. Specific annual gross erosion had a recorded value of W1 = 1415 m3/km
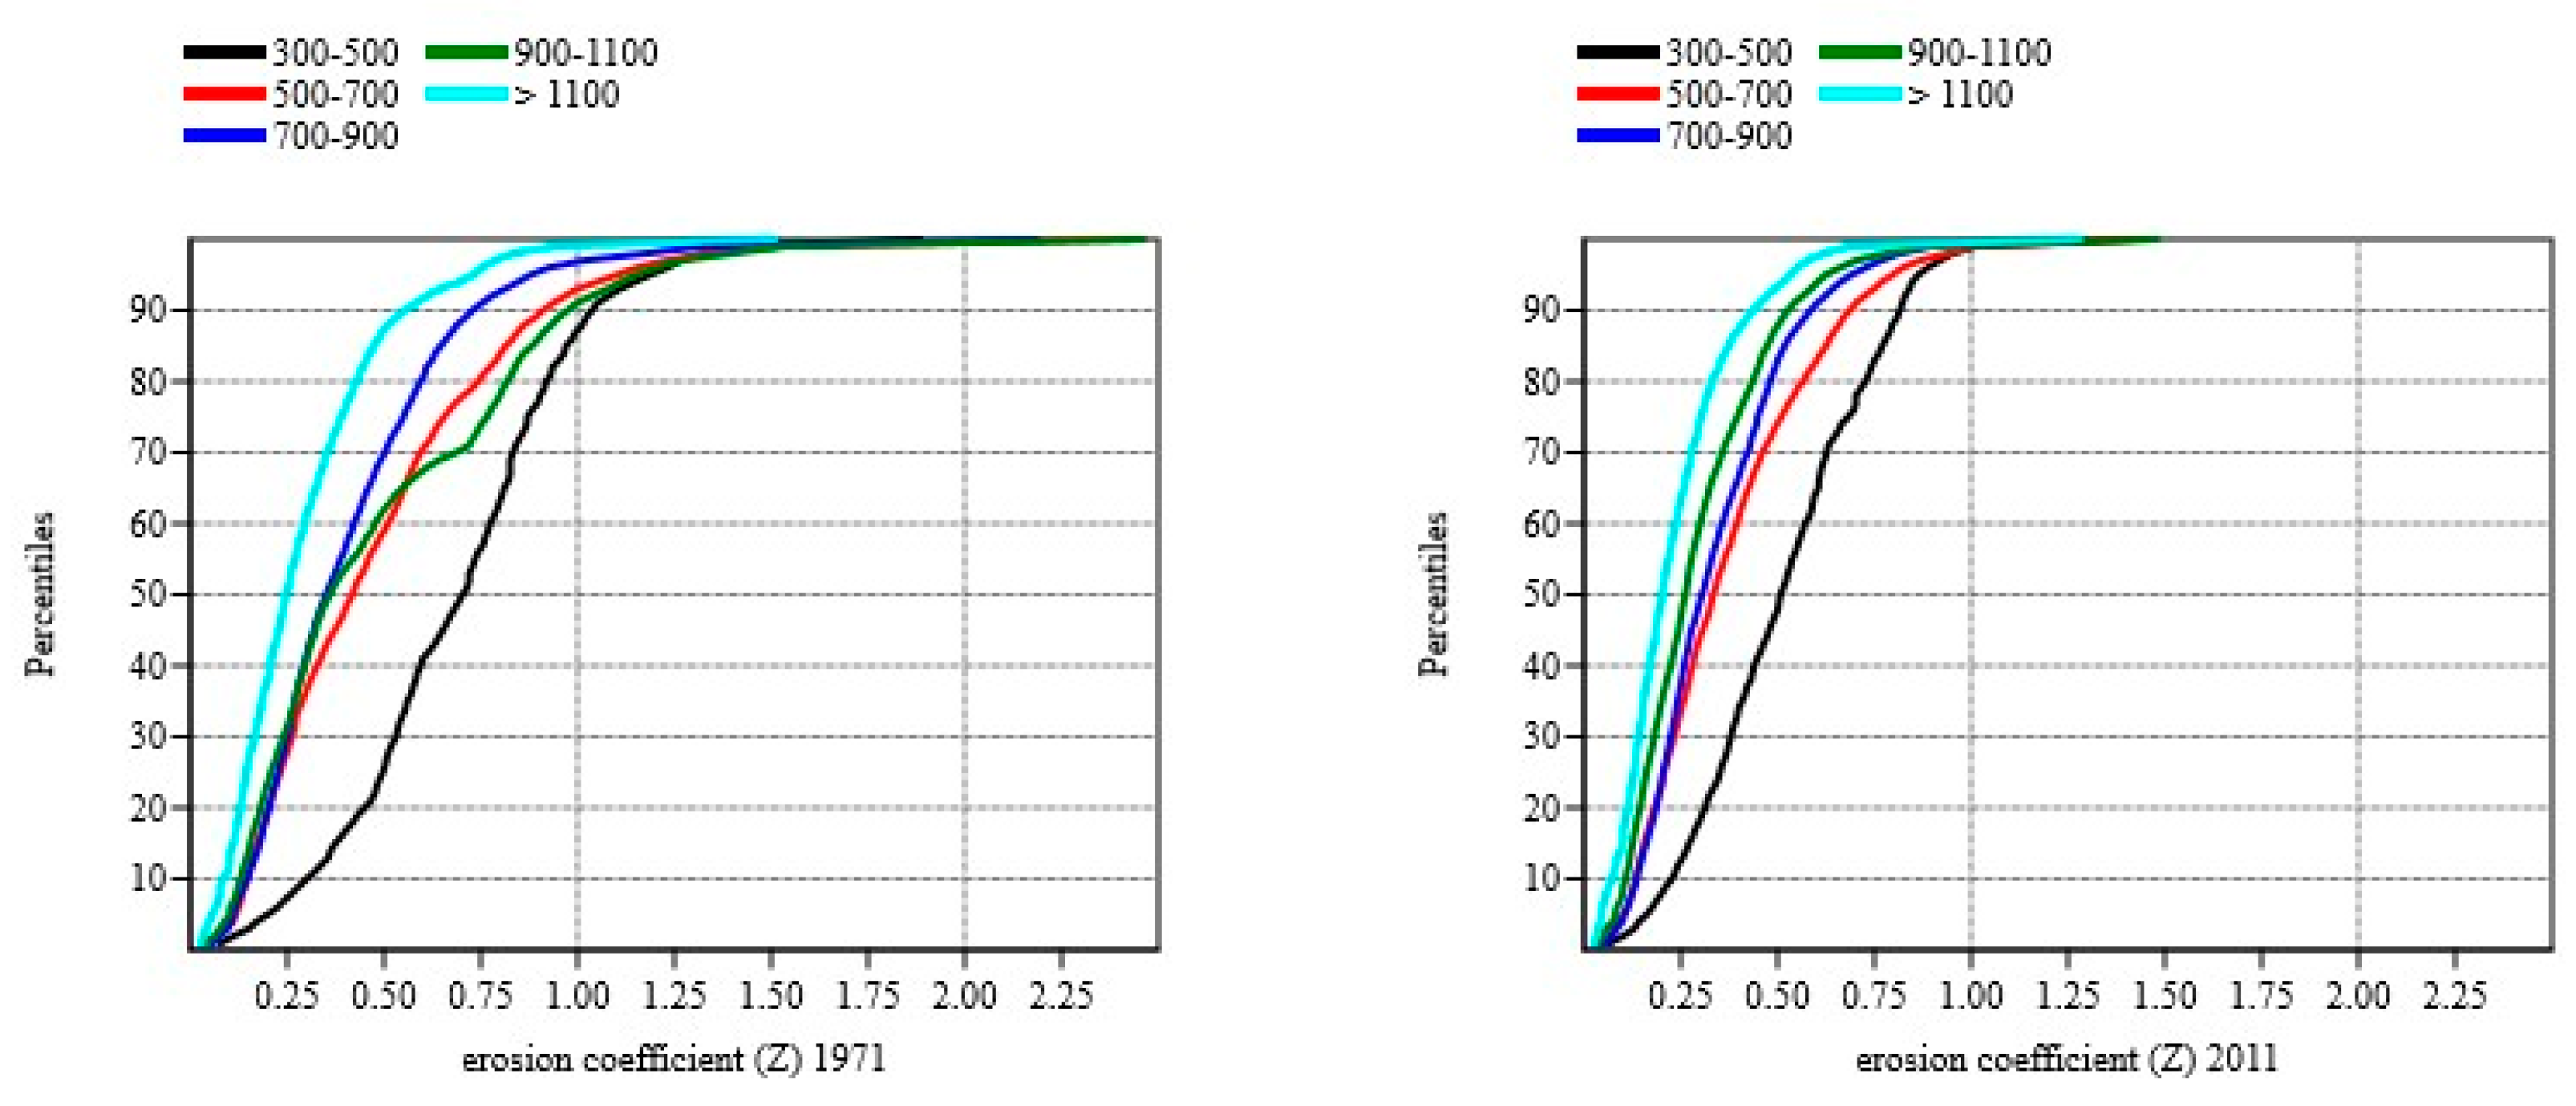
2/year. The curve of the relative cumulative frequency of the erosion coefficient determined by elevation zones in 1971 (Figure 9) shows the least expressed asymmetry toward the right in relation to other elevation zones. This means that in this elevation zone a significant part of the area is under strong human impact. The values of the erosion coefficient shown in Figure 10 (left) are indicated on this. Namely, within the frequency distribution (more than 25% and less than 75% of the available data), the erosion coefficient ranges Z1 = 0.495–0.870. In addition, according to Table 4, it can be concluded that 51.8% of the elevation zone 300–500 m belongs to the intensive and excessive erosion category (Z1 > 0.70)
The erosion intensity in the analyzed period showed a decreasing trend, but still corresponded to high values: the mean erosion coefficient for 2011 was Z2 = 0.514, median value was Z2Me = 0.507 and specific annual gross erosion was W2 = 1075 m3/km2/year. The curve of the relative cumulative frequency of the erosion coefficient for 2011 (Figure 9) shows a tendency of asymmetry to the right in relation to the previous period. This means that there has been a reduction of the human impact on soil. According to Figure 10 (right), it can be seen that the distribution of the frequency of the coefficient of erosion between 25% and 75% of the available data has lower values compared to the previous period (Z2 = 0.351–0.682). However, 22% of the total area of the elevation zone 300–500 m is still under the intensive erosion category. Generally, it can be concluded that, in the period 1971–2011, in the elevation zone 300–500 m, there was a 24%decrease of erosion.
A relatively small decrease in erosion in relation to higher altitudes can be explained by the fact that settlements located in elevation zone 300–500 m, due to their geographical location (the valley of Nišava and along the main road Niš–Pirot–Dimitrovgrad), had relatively stable demographic development (1961: 25,283; 2011: 18,028 inhabitants). Rural settlements with 1000 inhabitants in this elevation zone did not drastically changed population size during the observed period. Additionally, the smallest rural settlements, with fewer than 50 people, were not represented in 1961, and 50 years later their number increased in only two rural settlements. The number of inhabitants in so-called suburban settlements and in those with important infrastructural facilities increased in the recent period. On the other hand, a decrease in population occurred in rural settlements far from communication and urban centers.
Elevation zone 300–500 m is characterized by very strong anthropogenic pressure in all rural settlements of the progressive population type (Pp), 15 settlements of the stagnant population type (Ps), and 12 settlements of the regressive population type (Pr) located in this zone. In this context, changes in the intensity of erosion can be observed within each separate type of settlement.
In this zone, all settlements of progressive type (Pp) are characterized by an increase in total population during the research period (1961: 3789; 2011: 8027 inhabitants) and an increase in the concentration of the rural population: 15% of rural inhabitants in 1961 and 45% in 2011 lived in settlements of this type (Table 5). The development of these rural settlements is closely related to the urbanization and industrialization of the municipality centers Pirot and Dimitrovgrad. Since progressive settlements are located in the suburbs of these cities, their development has been taking place since the mid-20th century under the condition of transmission of urban elements and contents. That has significantly reduced the existing differences between rural and urban areas. According to these characteristics, this group of settlements corresponds with the stagnant type of change in arable land (As) (coefficient of correlation r = 0.98), which, despite the positive net change, is characterized by a decrease in arable land (1961: 5620 ha; 2012: 3030 ha) and corresponds to the 15 settlements of stagnant type of change of arable land (As) (Table 6). PoljskaRžana, located in the periurban zone of Pirot, is the only settlement of a progressive type that resisted the aforementioned rural–urban conflict and retained significant areas under arable land (progressive, Pp, and progressive arable type, Ap), which is explained by the development of market-oriented suburban agriculture. Due to geographical location, population and agrarian potential, rural settlements of the progressive population type (Pp) recorded the highest erosion rates. In some parts of the area, the mean erosion coefficient in 1971 was Z1 = 0.782 and in 2011 was Z2 = 0.703, with corresponding specific annual gross erosion of W1 = 1590 m3/km2/year and W2 = 1352 m3/km2/year, respectively.
Rural settlements of the stagnant type of population change (Ps), located in elevation zone 300–500 m, recorded a decline in total population (1961: 12,985; 2011: 7477 inhabitants) (Table 5). This group of stagnant type of settlements exclusively corresponds to the stagnant type of changes in arable land (As) (coefficient of correlation r = 0.99), characterized by a significant decrease in the arable land (1961: 5620 ha; 2012: 3030 ha) (Table 6). BarjeČiflik, a suburban Pirot settlement, is the only settlement that recorded an increase in area under the arable land (stagnant population, Ps, and progressive arable type, Ap), which is explained by the development of market-oriented suburban agriculture. Rural settlements of the stagnant type in this elevation zone are mainly primary and secondary rural centers that, in conditions of depopulation, deagrarization, and economic decay, managed to maintain demographic vitality and functional significance. Those settlements have good infrastructure connections to the urban centers, which causes a daily circulation of population of working age, but also immigration from undeveloped and isolated villages. According to these characteristics, the mean erosion coefficient in this type of settlement did not register significant changes and had relatively high values: Z1 = 0.692 in 1971 and Z2 = 0.614 in 2011. Specific annual gross erosion had a very high value of W1 = 1121 m3/km2/year in 1971, and W2 = 1065 m3/km2/year in 2011.
Rural settlements of the regressive type of population change (Pr) in elevation zone 300–500 m recorded a drastic decline in the total population (1961: 8509; 2011: 2524 inhabitants), which was primarily due to poor traffic connections (Table 5). In line with that, these settlements mostly correspond to the regressive type of change in arable land (Ar), and recorded a significant decline in areas under arable land (1961: 3865 ha; 2012: 1406 ha) (Table 6). As a consequence of these depopulation and deagrarization processes, these settlements had the largest reduction in erosion compared to the previous type of settlements (Z1 = 0.468, Z2 = 0.331, or W1 = 752 m3/km2/year, W2 = 420 m3/km2/year).
In elevation zone 500–700 m, the main erosion coefficient Z1 = 0.484 declined to Z2 = 3.777 in the period 1971–2011. In this elevation zone, the highest decrease in erosion intensity of 38.1% was recorded (specific annual gross erosion in 1971: W1 = 993.8 m3/km2/year, and in 2011: W2 = 615.0 m3/km2/year). The biggest changes occurred in erosion categories I and II. The areas under intense and excessive erosion amounted to 24.4% of this elevation zone in 1971, with an almost threefold decrease of in 2011 (Table 4).
In elevation zone 500–700 m there are three settlements of stagnant population type (Ps) and 26 settlements of regressive population type (Pr). This elevation zone is characterized by an intensive decrease in total population (1961: 17,128; 2011: 2977 inhabitants) (Table 5). It is important to emphasize that half of the rural settlements of the regressive type in this elevation zone are in the process of demographic extinction; they are in the category of small settlements with fewer than 50 inhabitants with a median age of population 60 years and more. This group of settlements mostly corresponds to the regressive arable land type (Ar) (coefficient of correlation r = 0.77), and in conditions of intensive deagrarization and changes in land use recorded a drastic reduction (1961: 8236 ha; 2012: 1975 ha), with more than half of these settlements having an area of less than 50 ha (Table 6).
In the elevation zone 700–900 m, the mean erosion coefficient in 1971 was Z1 = 0.411, and in the higher elevation zone 900–1000 m it was higher, Z1 = 0.489. The curve of the relative cumulative frequency of the erosion coefficient Z for the elevation zone 900–1100 m shows a certain deviation in relation to the lower and higher elevation zones. The largest deviation is observed at the 70th percentile (Figure 9), which indirectly indicates that certain parts of this area suffered significant human impact on soil. In particular, as much as 10% of the surface had a mean erosion coefficient Z1 ˃ 0.70. Anthropogenic influences in certain mountain areas in the middle of the 20th century were related to the intense deforestation and degradation of grazing land due to the development of livestock. Average specific annual gross erosion in this mountain region was W1 = 612 m3/km2/year.
Although almost half of the rural settlements are located in elevation zones 700–900 m and 900–1000 m, they are characterized by extremely negative demographic potential. This area is characterized by the presence of rural settlements exclusively of the regressive population type (Pr), whose population during the research period decreased by 92% (1961: 21,216; 2011: 1818 inhabitants) (Table 5). In line with that, 73% of the villages have fewer than 50 inhabitants. In accordance with current depopulation flows, the villages in this altitude zone have recorded an intensive decline of arable land (1961: 11,950 ha; 2012: 2083 ha), and correspond exclusively with the regressive arable land type (Ar) (Table 6).
Due to general depopulation and the abandonment of agricultural areas, vegetation spread rapidly and infiltration of the soil grew [5]. Recent studies have shown that growth and development of vegetation leads to a reduction in erosion and penetration of sediments after abandonment of agricultural land. The mean erosion coefficient has a very small amount, Z2 = 0.319, and specific annual gross erosion is W1 = 447 m3/km2/year, which indicates that more than 70% of the area is in the very weak and weak erosion categories. However, it is important to emphasize that some settlements in this elevation zone during the studied period achieved a positive net relative change in arable land; nevertheless, they recorded a real “loss” and were stagnant arable type (As). Those are small rural settlements with intensive depopulation processes located on StaraPlanina Mountain, as well as some border villages that in recent years started developing rural tourism [57] [58] and multifunctional agriculture with the intention of revitalizing the rural settlements. For this reason, these settlements have a slightly higher erosion coefficient than the average of the elevation zone in which they are located (Z2 = 0.415). However, it should be emphasized that many problems can arise from fire [58], because a part of the study area is characterized by summer fires, especially at StaraPlanina Mountain [59]. Fires pose a serious short-term risk of soil erosion, but can also result in land degradation and sometimes desertification over the long term. This indicates the vulnerability of the mountain ecosystem, especially of soil systems, and an intensification of the erosion process, which could increase in the future due to climate change [60].
The results presented in Table 4 indicate that only 20% of the observed area is at elevations higher than 1100 m and that there is insignificant very weak erosion and weak erosion (86.5% of the total area in this zone). This is understandable, because there are no rural settlements located in this altitude zone, and also because these areas are covered by forests and lands with low erosion rates [13]. The vulnerability of mountain and forest ecosystems due to human impact on soil at these altitudes can result in an intensification of erosive processes to the level of extreme erosion [61], considering that, according to the spatial plan for the StaraPlanina Mountain region, construction of several ski paths is planned [62].

5. Conclusions

The Republic of Serbia, such as many countries in transition, is facing demographic shrinkage, especially in rural areas. Processes of industrialization, urbanization, and deagrarization have resulted in marginalization, devaluation, and devastation of rural areas, especially in remote, border, and mountainous regions. Consequently, decreased human impact on soil has a direct impact on land use and soil erosion processes. The rural areas of Pirot and Dimitrovgrad municipalities are among the most intensively shrinking regions in the country at the beginning of the 21st century. Intensive processes of depopulation, emigration, population aging, and economic decay are the driving forces of the population decrease, which amounts to 65% (1961–2011). Those processes were followed by a dynamic reduction of arable land by 69% (1961–2012). Together, these have affected reduction of erosion intensity by 35% in last 50 years.
A comparative analysis of the erosion coefficient, according to the criteria of elevation and human impact on soil indicated by the typology of population change and change in arable land, shows that the highest erosion intensity was in the lower elevation zones with a significant concentration of rural population. On the other hand, in higher elevation zones, which are characterized by intensive depopulation, erosion intensity shows a significant reduction. Quantitative indicators of the analysis show that, in the elevation zone up to 500 m, all settlements of the progressive type (Pp) and a majority of settlements of the stagnant type (Ps)were concentrated, which corresponds to the progressive type (Ap) and stagnant type (As) of changes in arable land. They also show a decrease in erosion by 24%. On the other hand, in the elevation zones above 500 m, rural settlements of the regressive type of population change (Pr) and arable land (Ar) are the most represented. Reduction of human impact on soil results in a decrease in erosion intensity by 38%.
In comparison to European Union standards, Republic of Serbia represents an insufficiently urbanized country in which rural areas are spread over three-quarters of the territory, with around 90% of settlements and almost half of state population. It must be considered that sustainable development of the rural areas must be accepted as strategic priority to avoid deeper regional disparities. In development agendas, rural areas in Serbia must not be neglected, but provided with adequate policies, spatial plans, and strategies (global and local) that acknowledge the value of their natural and cultural environment. Since Serbia lacks sustainable rural strategies at the local level that contain the human impact on erosion intensity, the findings clarified in this paper could be imperative toward developing appropriate strategies. This is especially relevant to remote, peripheral, and mountain rural regions such as Pirot and Dimitrovgrad municipalities, where rural development in lower elevation zones has to be focused on settlements that preserve attributes of demographic and economic vitality. On the other hand, land abandonment in higher elevation zones can produce environmental benefits, e.g., soil and biodiversity protection, water accumulation and flood control, development of recreational facilities, etc.
The Serbian institutions responsible for land management currently lack the instruments to effectively manage land use.National and local institutions are making the effort to establish ecologically sustainable, socially equitable and efficient land use management practices. Following the political and economic changes, the post-socialist transition created a new institutional framework based on a market-oriented system. This implies new challenges for land use planning and land development in rural as well as in urban areas. One of the recently adopted strategic documents is “Strengthening of Municipal Land Management in Serbia”, which identifies insufficient land management tools, development or improvement of respective tools based on EU good practices, by testing and incorporating them in the national legal framework. However, there is a deficiency in land management strategies considering the research of the impact of demographic processes on erosion intensity in Serbia. Among various demographic processes, depopulation represents the main driving force of changes in rural areas in Serbia. Consequently, the changes in land use spontaneouslyoccurred, which resulted in reducing soil erosion intensity. Recent documents of land use management in Serbia highlights the importance of minimizing land degradation, and rehabilitation of degraded areas by using the erosion control issues such as conservation, rotation of crops, mulching, vegetative filter strips, terraces and grass paths. Considering the importance of demographic factors on land use changes and erosion intensity, their implementation in strategic documents of land use managementis essential.

Acknowledgments

This paper is part of project 43007 (sub project No. 9) and project 176017, both financed by the Ministry of Education, Science and Technological Development of the Republic of Serbia.

Author Contributions

Sanja Manojlović and Marija Antić had the original idea for the study; Sanja Manojlović, Marija Antić and Mikica Sibinović conceived and designed methodology; All authors organized and analyzed the data bases; Ivana Carević, Mikica Sibinović and Tanja Srejić contributing in mapping; Sanja Manojlović, Marija Antić and Danica Šantić wrote the paper. All authors read and approved the final manuscript.

Conflicts of Interest

The authors have declared no conflict of interest.

References

  1. Karlen, D.L.; Rice, C.W. Soil Degradation: Will Humankind Ever Learn? Sustainability 2015, 7, 12490–12501. [Google Scholar] [CrossRef] [Green Version]
  2. Kohnke, H.; Bertrand, A.R. Soil Conservation; Mc. Graw Hill Book Company: New York, NY, USA, 1959; pp. 1–219. [Google Scholar]
  3. Hurni, H.; Tato, K.; Zeleke, G. The Implications of Changes in Population, Land Use, and Land Management for Surface Runoff in the Upper Nile Basin Area of Ethiopia. Mt. Res. Dev. 2005, 25, 147–154. [Google Scholar] [CrossRef]
  4. Piccarreta, M.; Capolongo, D.; Boenzi, F.; Bentivenga, M. Implications of decadal changes in precipitation and land use policy to soil erosion in Basilicata, Italy. Catena 2006, 65, 138–151. [Google Scholar] [CrossRef]
  5. García-Ruiz, J.M. The effects of land uses on soil erosion in Spain: A review. Catena 2010, 81, 1–11. [Google Scholar] [CrossRef]
  6. Zarei, A.R.; Mokarram, M. Assessment of soil erosion and sediment yield changes using erosion potential model: Case study of Sangcharak catchment in Fars, Iran. Int. J. Agric. Resour. Gov. Ecol. 2016, 12, 344–356. [Google Scholar]
  7. Erskine, W.D.; Peacock, C.T. Late Holocene flood plain development following a cataclysmic flood. In The Structure, Function and Management Implications of Fluvial Sedimentary Systems, Proceedings of the International Symposium, Alice Springs, Australia, 2–6 September 2002; Dyer, F.J., Thoms, M.C., Olley, J.M., Eds.; IAHS Publication: Oxfordshire, UK, 2002; pp. 177–184. [Google Scholar]
  8. Ananda, J.; Herath, G. Soil erosion in developing countries: A socio-economic appraisal. J. Environ. Manag. 2003, 68, 343–353. [Google Scholar] [CrossRef]
  9. Walling, D. Human impact on land-ocean sediment transfer by the world’s rivers. Geomorphology 2006, 79, 192–216. [Google Scholar] [CrossRef]
  10. Dragićević, S.; Stepić, M. Changes of the erosion intensity in the Ljig River basin—The influence of the antropogenic factor. Bull. Serbian Geogr. Soc. 2006, 85, 37–44. [Google Scholar] [CrossRef]
  11. Dragićević, S.; Milevski, I. Human Impact on the Landscape—Examples from Serbia and Macedonia. In Global Change—Challenges for Soil Management; Zlatic, M., Ed.; Advances in Geoecology; Catena Verlag: Reiskirchen, Germany, 2010; Volume 41, pp. 298–309. ISBN 978-3-923381-57-9. [Google Scholar]
  12. Dragićević, S.; Martinović, M.; Sibinović, M.; Novković, I.; Tošić, I.; Babović, S. Recent Change of the Erosion Intensity caused by socio-demographic and land use changes in Knjaževac Municipality, Serbia. In Chalenges: Sustainable Land Management—Climatic Change; Zlatić, M., Kostadinov, S., Eds.; Advance in Geoecology; Catena Verlag: Reiskirchen, Germany, 2014; Volume 43, pp. 271–286. ISBN 9783923381616. [Google Scholar]
  13. Perović, V.; Djordjević, A.; Životić, L.; Nikolić, N.; Kadović, R.; Belanović, S. Soil Erosion Modelling in the complex terrain of Pirot Municipality. Carpath. J. Earth Environ. Sci. 2012, 7, 93–100. [Google Scholar]
  14. Manojlović, S.; Antić, M.; Sibinović, M.; Dragićević, S.; Novković, I. Soil erosion response to demographic and land use changes in the Nišava River basin, Serbia. Fresenius Environ. Bull. 2017, 26, 7547–7560. [Google Scholar]
  15. Spasovski, M.; Šantić, D. Population perspectives of the mountain areas in Serbia-trends and perspectives. In Proceedings of the International Scientific Symposium, Macedonian Geographical Society, Ohrid, Macedonia, 12–15 September 2013; pp. 267–275. [Google Scholar]
  16. Spasovski, M.; Šantić, D.; Radovanović, O. Historical stages in transition of natural replacement of the Serbian population. Bull. Serbian Geogr. Soc. 2012, 92, 23–60. [Google Scholar] [CrossRef]
  17. Šabić, D.; Vujadinović, S.; Milinčić, M.; Golić, R.; Stojković, S.; Joksimović, M.; Filipović, D.; Šećerov, V. The Impact of FDI on the Transitional Economy in Serbia—Changes and Challenges. Acta Polytech. Hung. 2012, 9, 65–84. [Google Scholar]
  18. Martinović, M.; Ratkaj, I. Sustainable Rural Development in Serbia: Towards a Quantitative Typology of Rural Areas. Carpath. J. Earth Environ. Sci. 2015, 10, 37–48. [Google Scholar]
  19. Bajat, B.; Blagojevic, D.; Kilibarda, M.; Tosic, I. Spatial analysis of the temperature trends in Serbia during the period 1961–2010. Theor. Appl. Climatol. 2013, 121, 289–301. [Google Scholar] [CrossRef]
  20. Milovanović, B. Climate of the Mountain StaraPlanina; Geografical Institute “Jovan Cvijic” SASA: Belgrade, Serbia, 2010; pp. 1–135. ISBN 978-86-80029-45-0. [Google Scholar]
  21. Milovanović, B.; Schuster, P.; Radovanović, M.; VakanjacRistić, V.; Schneider, C. Spatial and temporal variability of precipitation in Serbia for the period 1961–2010. Theor. Appl. Climatol. 2017, 130, 687–700. [Google Scholar] [CrossRef]
  22. Kräutner, H.G.; Krstić, B.P. Geological Map of the Carpatho-Balkanides between Mehadia, Oravita, Niš and Sofia; Geoinstitut: Belgrade, Serbia, 2003. [Google Scholar]
  23. Karamata, S.; Kräutner, H.G.; Krstić, B. Terranes of Serbia and neighbouring areas. In Terranes of Serbia. The Formation of the Geologic Framework of Serbia and the Adjacent Regions; Knežević-Djordjević, V., Kräutner, H.G., Krstić, B.P., Eds.; University of Belgrade, Faculty of Mining and Geology: Belgrade, Serbia, 1996; pp. 25–40. [Google Scholar]
  24. Dragićević, S.; Novković, I.; Carević, I.; Živković, N.; Tošić, R. GeohazardAssessmenth in the Eastern Serbia. Forum Geogr. 2011, 10, 10–19. [Google Scholar] [CrossRef]
  25. Gavrilović, S. Engineering of Torrents and Erosion; Journal of Construction: Belgrade, Serbia, 1972; pp. 1–292. [Google Scholar]
  26. Mustafić, S.; Kostadinov, S.; Manojlović, P. Risk of artificial lake “Zavoj” to processes of erosion—Methodological, knowing and protecting aspect. Bull. Serbian Geogr. Soc. 2008, 88, 29–42. [Google Scholar] [CrossRef]
  27. Kostadinov, S.; Zlatić, M.; Dragićević, S.; Novković, I.; Košanin, O.; Borisavljević, A.; Lakićević, M.; Mladjan, D. Anthropogenic influence on erosion intensity changes in the Rasina river watershed—Central Serbia. Fresenius Environ. Bull. 2014, 23, 254–263. [Google Scholar]
  28. Milanović, M.; Tomić, M.; Perović, V.; Radovanović, M.; Mukherjee, S.; Jakšić, D.; Petrović, M.; Radovanović, A. Land degradation analysis of mine-impacted zone of Kolubarain Serbia. Environ. Earth Sci. 2017, 76, 580. [Google Scholar] [CrossRef]
  29. Tošić, R.; Dragićević, S.; Lovrić, N. Assessment of Soil Erosion and Sediment Yield Changes Using Erosion Potential Model—Case Study: Republic of Srpska (BiH). Carpath. J. Earth Environ. Sci. 2012, 7, 147–154. [Google Scholar]
  30. Blinkov, I. An Approach for Conversion of Erosion Data Produced by EPM Method in Weight Measure. In Challenges: Sustainable Land Management—Climate Change; Zlatić, M., Kostadinov, S., Eds.; Advance in Geoecology; Catena Verlag: Reiskirchen, Germany, 2014; Volume 43, pp. 109–119. ISBN 9783923381616. [Google Scholar]
  31. De Vente, J.; Poesen, J. Predicting soil erosion and sediment yield at the basin scale: Scale issue and semi-quantitative models. Earth Sci. Rev. 2005, 71, 95–125. [Google Scholar] [CrossRef]
  32. Tazioli, A. Evaluation of erosion in equipped basins: Preliminary results of a comparison between the Gavrilovic model and direct measurements of sediment transport. Environ. Geol. 2009, 565, 825–831. [Google Scholar] [CrossRef]
  33. Amini, S.; Rafiei, B.; Khodabakhsh, S.; Heydari, M. Estimation of erosion and sediment yield of Ekbatan Dam drainage basin with EPM, using GIS. Iran. J. Earth Sci. 2010, 2, 173–180. [Google Scholar]
  34. Efthimiou, N.; Lykoudi, E.; Panagoulia, D.; Karavitis, C. Assessment of soil susceptibility to erosion using the EPM and RUSLE MODELS: The case of Venetikos River Catchment. Glob. Nest J. 2016, 18, 164–179. [Google Scholar]
  35. Lazarević, R. The Erosion Map of Serbia. Scale 1:500000; Institute of Forestry: Belgrade, Serbia, 1983. [Google Scholar]
  36. Irwin, E.; Geoghegan, J. Theory, data, methods: Developing spatially explicit economic models of land use change. Agric. Ecosyst. Environ. 2001, 85, 7–23. [Google Scholar] [CrossRef]
  37. Ashby, D.L. Geographical Redistribution of Employment: An Examination of the Elements of Change. Surv. Curr. Bus. 1964, 44, 13–20. [Google Scholar]
  38. Barff, R.; Knight, P. Dynamic shift share analysis. Growth Chang. 1988, 19, 1–10. [Google Scholar] [CrossRef]
  39. Zaccomer, G.P. Shift-Share Analysis with Spatial Structure: An Application to Italian Industrial Districts. Transit. Stud. Rev. 2006, 13, 213–227. [Google Scholar] [CrossRef]
  40. Huaxiong, Z.; Fang, Y. Research on regional economy and industrial structure based on Dynamic Shift-share analysis: An empirical analysis of Six Provinces in central China. In Proceedings of the International Conference on Business Computing and Global Informatization (BCGIn), Shanghai, China, 29–31 July 2011; pp. 62–66. [Google Scholar]
  41. Zelinsky, W.A. Method for Measuring Change in the Distribution of Manufacturing Activity: The United States, 1939–1947. Econ. Geogr. 1958, 34, 95–126. [Google Scholar] [CrossRef]
  42. Curtis, C.W. Shift-Share Analysis as a Technique in Rural Development Research. Am. J. Agric. Econ. 1972, 52, 267–270. [Google Scholar] [CrossRef]
  43. Esteban-Marquillas, J.M. A Reinterpretation of Shift-Share Analysis. Reg. Urban Econ. 1972, 2, 249–261. [Google Scholar] [CrossRef]
  44. Nguyen, D.T.; Martinez Saldivar, M.L. Pattern of agricultural growth in Mexican states, 1960–71: A shift and share analysis. Reg. Stud. 1979, 13, 161–179. [Google Scholar] [CrossRef]
  45. Darryl, R.H.; Alasdair, G.M.; Swales, J.K. Shift-share analysis of regional growth and policy: A critique. Oxf. Bull. Econ. Stat. 2009, 51, 15–34. [Google Scholar]
  46. Franklin, R.; Plane, D. A shift-share method for the analysis of regional fertility change: An application to the decline in childbearing in Italy, 1952–1991. Geogr. Anal. 2004, 36, 1–21. [Google Scholar] [CrossRef]
  47. Franklin, R. An Examination of the Geography of Population Composition and Change in the United States, 2000–2010—Insights from Geographical Indices and a Shift-Share Analysis. Popul. Space Place 2014, 20, 18–36. [Google Scholar] [CrossRef] [PubMed]
  48. Göler, D.; Grčić, M.; Ratkaj, I. Tendenzen der jüngerenindustriellenEntwicklung in Serbien und ihreregionaleDifferenzierung—UntersuchtmiteinemquantitativenAnalyseansatz (Recent development and spatial differentiation of industry in Serbia—A quantitative analysis). Mitt. ÖsterreichischenGeogr. Ges. 2007, 149, 109–132. [Google Scholar]
  49. Sibinović, М. Structural changes in the rural planting areas of Belgrade region. Bull. Serbian Geogr. Soc. 2012, 92, 111–132. [Google Scholar] [CrossRef]
  50. Sibinović, M.; Winkler, A.; Grčić, M. Agriculture in a Transitional Crisis Period: Crop Production in the Administrative Region of Belgrade from 1991 to 2002. Mitt. Österreichischen Geogr. Ges. 2014, 156, 293–310. [Google Scholar] [CrossRef]
  51. Martinović, М. Types of population dynamics in settlements of Zaplanje area. Bull. Serbian Geogr. Soc. 2012, 92, 133–152. [Google Scholar] [CrossRef]
  52. Martinović, M.; Ratkaj, I. Types of changing in demographic development of setlements on mountain Suva Planina and possibilities for revitalization. In Proceedings of the Scientific Conference with International Participation, Plan and Normative Protection of the Environment, Palić, Serbia, 4–6 April 2013; pp. 139–145. [Google Scholar]
  53. Antić, M.; Šantić, D.; Kasanin-Grubin, M.; Malić, A. Sustainable rural development in Serbia—Relationship between population dynamics and environment. J. Environ. Prot. Ecol. 2017, 18, 323–331. [Google Scholar]
  54. Vojković, G.; Stojanović, B. Golija: Population development and perspectives. Population 2006, 44, 35–64. [Google Scholar] [CrossRef]
  55. Ivković, М.; Todorić, Ј. Hypsometric Distribution of the Population in the Settlements of Pirot District; Collection of Papers—Faculty of Geography; University of Belgrade: Beograd, Serbia, 2013; pp. 151–178. [Google Scholar]
  56. Spasovski, M.; Šantić, D. Trends in the distribution and concentration of the population of Serbia—First-class demographic challenges at the beginning of the 21st century. In Proceedings of the Scientific Conference with International participation, Problems and Challenges of Contemporary Geographical Science and Teaching, Kopaonik, Serbia, 8–10 December 2011; pp. 57–72. [Google Scholar]
  57. Anđelković, G.; Pavlović, S.; Đurđić, S.; Belij, M.; Stojković, S. Tourism climate comfort index (TCCI)—An attempt to evaluate the climate comfort for tourism purposes: The example of Serbia. Glob. Nest J. 2016, 18, 482–493. [Google Scholar]
  58. García-Ruiz, J.M.; Nadal-Romero, E.; Lana-Renault, N.; Begueria, S. Erosion in Mediterraneanl and scapes: Changes and future challenges. Geomorphology 2013, 198, 20–36. [Google Scholar] [CrossRef] [Green Version]
  59. Jovanović, R.; Bjelac, Ž.; Miljković, O.; Terzić, A. Spatial analysis and mapping of fire risk zones and vulnerability assessment—Case study Mt. Staraplanina. J. Geogr. Inst. Jovan Cvijić Prev. Educ. Nat. Disasters 2013, 63, 213–226. [Google Scholar]
  60. Radovanović, M.; Gomes, J.F.P. Solar Activity and Forest Fire; Geographical Institute “Jovan Cvijić” SASA: Belgrade, Serbia, 2008; pp. 1–171. ISBN 978-86-80029-40-5. [Google Scholar]
  61. Ristić, R.; Košanin-Grubin, M.; Radić, B.; Nikić, Z.; Vasiljević, N. Land Degradation at the StaraPlanina Ski Resort. Environ. Manag. 2012, 49, 580–592. [Google Scholar] [CrossRef] [PubMed]
  62. Spatial Plan of Nature Park Area and Tourist Region Staraplanina. Available online: https://translate.google.cn/#auto/en/Prostorni%20plan%20podru%C4%8Dja%20Parka%20prirode%20i%20turisti%C4%8Dke%20regije%20Stara%20planina (accessed on 14 March 2018).
Figure 1. Geographical position and simplified geological map of the Pirot and Dimitrovgrad municipalities: (1) Quaternary and Cenozoic sedimentary cover; (2) Mesozoic clastic sediments; (3) Paleozoic clastic sediments; (4) complex of carbonate rocks; (5) igneous rocks; and (6) metamorphic rocks.
Sustainability 10 00826 g001
Figure 2. Map of erosion intensity in 1971 (left) and 2011 (right): (1) excessive erosion; (2) intensive erosion; (3) medium erosion; (4) weak erosion; (5) very weak erosion; and (6) accumulation.
Sustainability 10 00826 g002
Figure 3. Histograms presenting coefficient erosion Z1in 1971 (left) and Z2 in 2011 (right): Z, average value; δ, standard deviation; ZMe, median value; (I) excessive erosion; (II) intensive erosion; (III) medium erosion; (IV) weak erosion; (V) very weak erosion.
Sustainability 10 00826 g003
Figure 4. Histograms presenting specific annual gross erosion W1 in 1971 (left) and W2 in 2011 (right): W, average value; δ, standard deviation; WMe, median value; (I) excessive erosion; (II) intensive erosion; (III) medium erosion; (IV) weak erosion; (V) very weak erosion.
Sustainability 10 00826 g004
Figure 5. Population change (P) and number of rural settlements with fewer than 100 inhabitants (S), 1948–2011 (determination coefficient R2 at the 95% confidence level).
Sustainability 10 00826 g005
Figure 6. Rural settlements according to population size, 1961 and 2011.
Sustainability 10 00826 g006
Figure 7. Types of settlements (1961–2011/2012) according to population changes (left) and changes in arable land (right).
Sustainability 10 00826 g007
Figure 8. Lorenz curves of spatial distributions of erosion intensity, population, and arable land (F, cumulative percentage of basin area; W, cumulative percentage of decreased erosion intensity in the period 1971–2011; P1, cumulative percentage of population in 1961; P2, cumulative percentage of population in 2011; A, cumulative percentage of decreased arable land in the period 1961–2011).
Sustainability 10 00826 g008
Figure 9. Curves of relative cumulative frequency of the erosion coefficient in 1971 (left) and 2011 (right) determined by elevation zones.
Sustainability 10 00826 g009
Figure 10. Box plots of the erosion coefficient at different elevation zonesin 1971 (left) and 2011 (right): median value, range between 25% and 75% available data, minimum, maximum, and extreme values.
Sustainability 10 00826 g010
Table 1. Descriptive variables used in the erosion coefficient (Z).
Coefficient of Soil ResistanceY
Fine sediments and soils without erosion resistance0.80–1.00
Sediments, moraines, clays, and other rocks with little resistance0.60–0.80
Weak rock, schistose, stabilized0.50–0.60
Rock with moderate erosion resistance0.30–0.50
Hard rock, erosion resistant0.10–0.30
Coefficient of soil protectionX
Areas without vegetal cover0.08–1.00
Damaged pasture and cultivated land0.06–0.80
Damaged forest and bushes, pasture0.04–0.06
Coniferous forest with little grove, scarce bushes, bushy prairie0.20–0.40
Thin forest with grove0.05–0.20
Mixed and dense forest0.05–0.20
Coefficient of erosion and stream network development φ
Whole watershed affected by erosion0.90–1.00
50–80% of catchment area affected by surface erosion and landslides0.80–0.90
Erosion in rivers, gullies, and alluvial deposits, karstic erosion0.60–0.70
Erosion in waterways on 20–50% of the catchment area0.30–0.50
Little erosion on watershed0.10–0.20
Table 2. EPM erosion qualitative categorization and range of erosion coefficient (Z) and specific annual gross erosion (W0).
Erosion CategoryErosion IntensityRange of ZRange of W0 (m3/km2/year)
IExcessive erosion>1.01˃3000
IIIntensive erosion0.71–1.001200–3000
IIIMedium erosion0.41–0.70800–1200
IVWeak erosion0.21–0.40400–800
VVery weak erosion0.01–0.20100–400
Table 3. Correlation statistics of principal component analysis. Correlation coefficient r (Pearson) close to 1 or −1 suggests a strongly positive or negative correlation between variables. Values in bold are different from 0, with a significance level α = 0.05 (h, elevation zone; P, rural population; A, arable land; Pp, progressive type of population change; Ps, stagnant type of population change; Pr, regressive type of population change; Ap, progressive type of change of arable land; As, stagnant type of change of arable land; As, regressive type of change of arable land).
VariablesHPAPpPsPrApAsArZ
h1−0.855−0.927−0.775−0.830−0.944−0.775−0.872−0.529−0.983
P−0.85510.9580.9900.9970.6860.9900.9930.2560.844
A−0.9270.95810.9190.9340.8470.9190.9390.5200.877
Pp−0.7750.9900.91910.9940.5831.0000.9780.1650.767
Ps−0.8300.9970.9340.99410.6400.9940.9950.1830.831
Pr−0.9440.6860.8470.5830.64010.5830.6860.7670.882
Ap−0.7750.9900.9191.0000.9940.58310.9780.1650.767
As−0.8720.9930.9390.9780.9950.6860.97810.1980.881
Ar−0.5290.2560.5200.1650.1830.7670.1650.19810.378
Z−0.9830.8440.8770.7670.8310.8820.7670.8810.3781
Table 4. Distribution of the erosion coefficient (Z) according to erosion category in different elevation zones in 1971 and 2011 (percentage).
Elevation Zone (m)F(km2)F(%)Very Weak Erosion (%)Weak Erosion (%)Medium Erosion (%)Intensive Erosion (%)Excessive Erosion (%)
1971201119712011197120111971201119712011
300–5002541000.74.92.214.822.641.641.422.010.40.5
500–70036010021.725.924.734.528.329.816.58.27.90.6
700–90045310023.027.535.841.131.327.97.43.22.50.3
900–110029410034.638.532.936.121.723.18.72.02.10.3
>110035410037.647.837.838.718.112.96.10.60.40.1
Table 5. Spatial differentiation in the share of population in 1961 and 2011 according to type of population change (Pp, Ps, Pr).
Elevaton Zone (m)Population 1961Population 2011
PpPsPrTotalPpPsPrTotal
300–500378912,985850925,28380277477252418,028
500–700 211215,01617,128 84421332977
700–900 19,27419,274 16601660
900–1100 19421942 158158
Total378915,09744,74163,62780278321647522,823
Table 6. Spatial differentiation in the share of arable land in 1961 and 2012 according to type of population change (Pp, Ps, Pr).
Elevaton Zone (m)Arable Land (ha) 1961Arable Land (ha) 2012
PpPsPrTotalPpPsPrTotal
300–50015785620386511,0631091303014065527
500–700 89673408236 64013361975
700–900 10,96310,963 20002000
900–1100 987987 8383
Total1578651623,15531,2491091367048259586

