Carbon Reduction Measures-Based LCA of Prefabricated Temporary Housing with Renewable Energy Systems


1
School of Architecture, Nanjing Tech University, Nanjing 211816, China
2
Department of Civil and Environmental Engineering, University of Alberta, Edmonton, AB T6G 1H9, Canada
3
Science & Technology Development Center of Jiangsu Provincial Department of Housing and Urban-Rural Development, Nanjing 210036, China
4
School of Architecture and Built Environment, Deakin University, Geelong 3220, Australia
*
Author to whom correspondence should be addressed.
Sustainability 2018, 10(3), 718; https://doi.org/10.3390/su10030718
Submission received: 13 February 2018
/
Revised: 2 March 2018
/
Accepted: 2 March 2018
/
Published: 6 March 2018
Abstract
:Temporary housing plays an important role in providing secure, hygienic, private, and comfortable shelter in the aftermath of disaster (such as flood, fire, earthquake, etc.). Additionally, temporary housing can also be used as a sustainable form of on-site residences for construction workers. While most of the building components used in temporary housing can be manufactured in a plant, prefabrication technology improves the production efficiency of temporary housing; furthermore, integrated renewable energy systems, for example, solar photovoltaic (PV) system, offer benefits for temporary housing operations. In order to assess the environmental impacts of prefabricated temporary housing equipped with renewable energy systems, this study first divides the life cycle of temporary housing into six stages, and then establishes a life cycle assessment (LCA) model for each stage. Furthermore, with the aim of reducing the environmental impacts, life cycle carbon reduction measures are proposed for each stage of temporary housing. The proposed methodology is demonstrated using a case study in China. Based on the proposed carbon reduction measures, the LCA of a prefabricated temporary housing case study building equipped with renewable energy systems indicates a carbon emissions intensity of 35.7 kg/m2·per year, as well as a reduction in material embodied emissions of 18%, assembly emissions of 17.5%, and operational emissions of 91.5%. This research proposes a carbon reduction-driven LCA of temporary housing and contributes to promoting sustainable development of prefabricated temporary housing equipped with renewable energy systems.
1. Introduction
The occurrence of natural disasters has been increasing in recent decades, such as the Wenchuan earthquake in China in 2008, the typhoon Morakot disaster in Taiwan in 2009, and the earthquake in the Philippines in 2017, all of which not only resulted in enormous financial loss and casualties, but also destroyed millions of buildings and left victims homeless. According to statistics, natural disasters in China destroyed 24,800 buildings and damaged 250,000 buildings in 2015 [1]. After disasters occur, disaster relief (DR) shelters play an important role in providing victims with secure, hygienic, private, and comfortable temporary residences until they are able to settle in new permanent dwellings. Post-disaster reconstruction usually takes several years, during which period several types of DR shelters are built to provide victims with temporary residences. During the first few weeks after a disaster, emergency activities, such as rescue, medical treatment, and victims camping, must be conducted immediately. Quarantelli [2] refers to shelters in this stage as emergency and temporary shelters, typically comprising various tents. Temporary housing should then be built to accommodate daily activities for victims for the next six months to three years, until they are able to move into permanent dwellings. Similarly, temporary housing can also be used as on-site residences for construction workers [3].
Given that temporary housing is becoming more utilized in light of an increasing number of natural disasters [4], the environmental impacts of temporary housing are receiving increasing attention. For example, the “K house” is examined as a form of temporary housing (Xia et al. [5]); the base of this house uses an enormous amount of concrete, and the rivet joints, which are commonly used for envelope connections, result in a significant amount of concrete waste after these temporary houses are demolished, and therefore several panels cannot be reused due to serious damage [5]. Therefore, the “K house” is not an environmentally friendly solution and overlooks sustainability considerations. Furthermore, Chen et al. [6] indicate that some temporary housing products have poor sound insulation and thermal performance as a result of inadequate wall construction design. Xia et al. [4] also found the same problem in the “K house” (which was widely used after the Wenchuan earthquake in 2008 in China); thermal bridges and thin wall insulation layers result in poor thermal performance and an increase in operating energy. Song et al. [7] reveal that using composite walls constructed with air gaps and insulation can improve the thermal performance of temporary housing.
Temporary housing is of an urgent nature, thus prefabrication technology provides time-sensitive solutions for temporary housing including the benefits of fast delivery, quick assembly, and easy reuse and recycling. Furthermore, prefabrication technology has been proven to be an environmentally friendly construction approach. Yepes et al. [8] describe a methodology to optimize cost and carbon emissions during the design of precast-prestressed concrete road bridges and indicate the relationship between cost reduction and carbon reduction. However, Atmaca reports that the operational phase still contributes the largest portion of carbon emissions (more than 90%) to the life cycle of temporary housing [9]. Relevant passive design such as natural ventilation, sunshade design and improvement of building envelope thermal performance has been applied to reduce operations energy consumption and greenhouse gas (GHG) emissions according to different climate conditions as an important methodology. Additionally, implementing renewable energy systems will significantly reduce carbon emissions from temporary housing. Solar photovoltaic and solar thermal systems have been used for many years around the world, and with the maturing technology and decreasing production cost, solar energy systems are being gradually considered for deployment in temporary housing [10].
In an effort to reduce the environmental impacts of temporary housing, Potangaroa [11] and Arslan [12] introduce several cases using multiple strategies, including the reuse, recycling, and minimizing of energy, to achieve sustainable shelters in post-disaster reconstruction. As one of the most important indexes of greenhouse gas (GHG) emissions, carbon emissions of buildings are receiving increasing attentions in accessing the sustainability of performance [13]. Considering specific carbon reduction measures, the present research aims to conduct life cycle assessment (LCA) for prefabricated temporary housing equipped with renewable energy systems. The detailed research objectives of this study include: (1) identifying the life cycle of prefabricated temporary housing; (2) proposing a research framework to evaluate carbon emissions of temporary housing; (3) proposing solutions to reduce carbon emissions of temporary housing; and (4) conducting LCA of temporary housing based on the proposed carbon reduction measures, and ascertaining the reduced carbon emissions. The proposed carbon reduction-driven LCA of temporary housing equipped with renewable energy systems improves and promotes the sustainability of this type of prefabricated temporary housing.
2. Research Methodology
2.1. Life Cycle of Prefabricated Temporary Housing
As displayed in Figure 1, the life cycle of a building constructed by means of the conventional construction method is usually divided into four stages [14]: (1) construction materials preparation; (2) on-site construction; (3) building operations; and (4) building demolition. However, in some research, the name of stages is not always the same: for example, Penadés-Plà et al. [15] use the “manufacturing” to replace “construction materials preparation”, the content is still the same. Considering the prefabrication process of temporary housing, the life cycle of temporary housing is divided into six stages in the present research: (1) construction materials preparation; (2) building elements prefabrication; (3) logistics; (4) on-site assembly; (5) building operations; and (6) building disposal.
The detail LCA framework of temporary housing is demonstrated in Figure 2, which includes: (1) construction material preparation, where raw materials (stone, metal ores and wood) are transformed into building materials, including steel profiles, aluminum profiles, masonry units, wood profiles, wood boards, and glass, among others; (2) elements prefabrication, where manufactured construction materials are used to prefabricate specific components (windows, doors, equipment), panels (wall panels, floor panels, and roof panels), and modules (integrated construction units) in various factories; (3) logistics, which involves the arrangement of transportation tools, routes, and sequence is of great importance to the carbon emissions control for this stage; (4) on-site assembly, which primarily includes site establishment, foundation construction, and elements assembling; (5) building operations, which consist of daily use, routine maintenance, and renovation; and (6) building disposal, in which waste disposal, recycling, and reuse of materials are the main contents at the disposal stage—this is a vital stage for temporary housing, given that temporary housing is usually demolished and reconstructed several times during the life cycle.
2.2. Carbon Reduction Measures of Prefabricated Temporary Housing
One of the research objectives of this study is to propose carbon reduction measures for temporary housing and to conduct LCA based on the proposed carbon reduction measures. Given that the operational phase contributes the largest proportion to the life cycle emissions of a building, some related studies primarily focus on the reduction measures of the building operation stage [14]. However, carbon reduction and control during the construction stage exert significant influence on relieving short-term environmental pressure in developing countries such as China. In order to reduce the life cycle impacts of temporary housing, building design and construction planning are utilized as the means in this research.
- (1)
- Building design and material selection: (a) the utilization of passive and active energy-saving techniques during building design promotes low carbon emissions for the operations stage; (b) material selection is crucial for carbon reduction during the material preparation and building disposal stages, thus low embodied carbon emissions materials, as well as recyclable and reusable materials are considered in this research. Additional, emission-optimized structure design in terms of geometry and amount of materials is of great importance for carbon reduction in design stage [16].
- (2)
- Construction planning: (a) given that prefabrication has been proven as an environmentally friendly construction approach [8], prefabrication technology is highly recommended for temporary housing construction in the present research; (b) assembly technology of prefabricated building components is emphasized in this research to reduce carbon emissions of the on-site assembly and building disposal stages; furthermore, transportation planning of prefabricated building components will also reduce carbon emissions in the logistics stage.
The proposed carbon reduction-driven LCA is demonstrated in Figure 3: (1) initial building design and construction planning is assessed with regard to carbon emissions; (2) various carbon reduction measures are taken into account, and the life cycle impacts are calculated and compared with one another; and (3) on the condition that the proposed carbon reduction measures are able to reduce carbon emissions, the proposed carbon reduction measures are implemented. Utilizing the proposed process, the LCA of temporary housing is conducted based on carbon reduction measures, and carbon reduction is achieved during the design and construction planning stages of temporary housing, which significantly promotes the sustainable development of temporary housing.
2.3. LCA Inventories
Data collection is vital to LCA models; an ideal building LCA model should be built on the basis of two types of data: existing databases and case-specific data [14]. Existing databases usually contain basic carbon emissions inventories of construction materials, products, and energy consumption, such as Ecoinvent in Switzerland, LCI in America, LCA Data in Europe, and BELES and EBALANCE in China. Ju et al. [17] indicate that the CO2 emission factor for the same type of material in different databases reveal significant differences (30% at most) due to various manufacturing techniques. Penadés-Plà et al. [15] also indicate that obtaining the environmental impacts will be more reliable in one place and time, and more with one technology than another. As a result, selecting the appropriate existing data is essential for a specific project.
Structural materials, building envelope materials, and decorative materials are considered as primary building construction materials in several previous studies, although auxiliary materials that assist in on-site construction and building equipment materials also need to be considered given that they have direct relationships with construction projects. The function and emission factors of some common materials and components used in temporary housing (in China) are listed in Appendix Table A1 and Table A2. However, each specific construction project has many customized products, the CO2 emission factors of which need to be collected through various approaches such as questionnaire survey and on-site survey. The manufacturing process of each type of customized component, panel, and module should be investigated carefully in order to offer accurate data for the LCA model.
Non-renewable energy resources encompass a significant proportion of the LCA of buildings, such as coal, oil, natural gas, and so on. However, in order to promote sustainable improvement of the building industry, clean and renewable energy resources (such as solar energy, wind energy, geothermal energy, and biomass energy) are becoming widely used in building operations. Emission factors of some energy resources commonly used in buildings are summarized in Appendix Table A3. However, when it comes to a specific case, some values should be adjusted to local standards. For example, as shown in Appendix Table A4, the CO2 emission of electricity varies significantly in various districts of China. Furthermore, site-specific data (e.g., for transport tools, logistics, assembly tools, working time, waste disposal factors) also should be collected through various survey methods.
As is summarized in Table 1, in the present research, existing data combing case-specific data is unavoidable. Local existing data is ideal, but in the absence of local data, the data of a nearby area can be supplemented; for the factory prefabrication, on-site assembly, and demolition phases, specific data is collected from the developer, contractor, and subcontractors, as well as on-site survey, which includes the manufacturing process, energy consumption, transportation mode, and waste disposal.
2.4. Life cycle Impact Assessment
The present analytical framework established for the LCA assessment of traditional buildings [14,18] is effective under most conditions. Nevertheless, for the construction phase the assessment is based on the on-site construction model, which is not suitable for the prefabrication process. Based on the energy consumption estimation of the prefabrication process, the present research optimizes the current framework. As mentioned before, six phases are defined for the calculation of temporary housing life cycle carbon emissions, to which a unified Equation (1) can be applied.
where ELPB-t represents the total carbon emissions of temporary housing life cycle; and Em (material embodied emissions), Ep (prefabrication emissions), El (logistic emissions), Ea (assemble emissions), Eo (operation emissions), and Ed (disposal emissions) represent the carbon emissions of the six stages mentioned in Section 2.1, respectively. Specific methods and equations of this concept are presented in the following sections.
ELPB-t = Em + Ep + El + Ea + Eo + Ed
2.4.1. Material Embodied Emissions
Light structures have been proven to significantly reduce carbon emissions [13,19]; however, several types of light structures, including steel, wood, aluminum, and plastic, result in various impacts on the LCA results. Furthermore, reducing the quantities of certain materials with high carbon emissions is also an effective method for carbon reduction in the material preparation stage.
According to the factory customization features of prefabricated buildings, the building components are divided into two types: common and customized. The calculation for common building materials and components follows a widely recognized method [18]. (The material carbon emission factors used commonly in China are listed in Appendix Table A1 and Table A2.)
2.4.2. Prefabrication Emissions
Customized products are inevitable in buildings, and the carbon emissions of prefabrication primarily depend on the complexity of the manufacturing process. Applying a more standardized production line and reducing the type and quantity of special components (requiring the use of additional molds) will help to achieve carbon reduction in the prefabrication stage.
The calculation for prefabrication emissions (Ep), including carbon emissions from prefabricating components, panels, and modules, uses a method according to the energy consumption estimation of production processes,
where Ec, Eg, and Ez represent the carbon emissions for a type c component, type g panel, and type z module, respectively; Nc, Ng, and Nz represent the total number of type c components, type g panels, and type z modules, respectively. And the calculation method for Ec, Eg, and Ez is based on the energy consumption and carbon emission factor of a specific production process as follows:
where Pj and Py represent the rated power of the machines used in type j and type y production processes, respectively; Tj and Ty represent the working time of type j and type y production processes, respectively; EFe represents the carbon emission factor of electricity consumption in the local area; EFy represents the carbon emission factor of type y energy consumption in the local area; and N(c,g,z) represents the number of type c, g, and z elements.
2.4.3. Logistics Emissions
The specific process of logistics can be divided into three phases: (1) the shift from factory storage yard to trucks (the first vertical transport); (2) the transport from factory to construction site (the horizontal transport); and (3) the shift from trucks to construction yard (the second vertical transport). Phases 1 and 3 are usually ignored in traditional transport models. Logistics emissions are primarily dependent on the arrangement of transport planning, including (1) rational selection of hoisting equipment and transport tool with appropriate energy consumption or new energy resources such as electricity; and (2) rational arrangement of hoisting process and transport route. According to 20.
Intergovernmental Panel on Climate Change (IPCC) [20], the equation of logistics emissions (El) is expressed as
where Ever1 represents the carbon emissions of the first vertical transport, Ehor represents the carbon emissions of the horizontal transport, and Ever2 represents the carbon emissions of the second vertical transport. The detailed equations are as follows:
where Gv represents the fuel consumption rate of type v machine used in vertical transport of an element; Pv represents the rated power of type v machine; Tv represents the unit working time of type v machine; ρv represents the energy density of type v machine; EFv represents the carbon emission factor of type v energy consumption; and N(k,c,g,z) represents the number of type k, c, g, and z elements.
where m(c,g,z) represents the quality of type c component, type g panel, and type z module; S(c,g,z) represents the transport distance of type c component, type g panel, and type z module; H(c,g,z) represents the unit energy consumption for transporting type c component, type g panel, and type z module; and EFhor(c,g,z) represents the carbon emission factor of transport tool energy consumption for type c component, type g panel, and type z module. The loss rate of type c component, type g panel, and type z module can be ignored due to the very limited loss quantities.
El = Ever1 + Ehor + Ever2
The typical transport tool in China is a diesel truck. According to the China Statistical Yearbook [21], diesel consumption by diesel trucks is 6.3 × 10⁻² L/(t km). Taking into consideration that most trucks are empty when returning to the factory, the fuel consumption for this trip can be assumed to be two-thirds that of the full load condition [22]. Therefore, the synthetic fuel consumption for trucks can be calculated as 5/6 × 6.3 × 10−2 L/(t km) = 5.25 × 10⁻² L/(t km). Consequently, the carbon emission factor of diesel trucks is 14.2 × 10⁻² kgCO2/(t km).
2.4.4. Assembly Emissions
Carbon emissions during the on-site assembly stage, Ea, primarily consist of two parts: construction machinery operation and provisional measures. As for the prefabrication method, the assembly process for temporary housing can be easily simulated and accurately computed. As a result, the carbon emissions of assembly machinery operation can be assessed effectively in the design phase. The carbon emissions of provisional measures can be estimated based on energy consumption records, and can be ignored in the present study given that the construction period of temporary housing is short, and few provisional measures are carried out for low-rise buildings. Accordingly, assembly emissions (Ea) can be described by the following equation:
where Elif(k,c,g,z) represents the carbon emissions of the operation of machinery used for lifting type k, c, g, and z elements; and Econ(k,c,g,z) represents the carbon emissions of machinery operation used for connecting type k, c, g, and z elements. If no machinery operation is used for lifting one type of element, then Elif(k,c,g,z) = 0. The detailed equation of Elif(k,c,g,z) is the same as that of Equation (4-1), and the detailed equation of Econ(k,c,g,z) can be expressed as
where Qi represents the number of type i joints for an assembly element, Pi represents the rated power of type i machine operation, and Ti represents the unit time for connecting unit joints. According to Equation (4–1), the number of joints and connection time are the critical factors of carbon emissions control on assembly stage. Decreasing the number of joints, applying faster connection technology, and optimizing the assembly process based on virtual construction technology are the primary methods to improve assembly efficiency.
Ea = Elif(k,c,g,z) + Econ(k,c,g,z)
2.4.5. Operation Emissions
Both passive and active energy-saving technologies have been proven to be effective in energy reduction at the building operation stage. For temporary housing, improving the thermal performance of building envelope and applying available renewable energy systems should be considered based on the environment and technical background of the specific case.
Carbon emissions of building usage mainly involve daily operations, maintenance, and renovation, and can be expressed as
where Eu represents the carbon emissions of daily usage (e.g., for energy consumption of heating, cooling, lighting, elevators, and operation of household appliances), and Emr represents the carbon emissions of extra materials consumption in maintenance service and renovation of building elements (e.g., for envelope components, equipment, and furniture).
Eo = Eu + Emr
For the evaluation of existing buildings, Eo is usually calculated by actual monitoring data based on energy consumption. Although, for the assessment of new-built buildings, Eo can be estimated based on simulation results using software such as Energy-plus, Green Building Studio, and E-Quest. In order to ensure the reliability of the simulation results, the energy consumption of various building equipment types (e.g., for heating, cooling, and lighting) and household appliances must be calculated based on building functions, behavioral habits of users, and internal thermal comfort requirements. Based on the simulation results, the equation for Eo can be expressed as follows:
where ECH represents the carbon emissions of heating and cooling, EI represents the carbon emissions of lighting and other electric equipment, Y represents the durable years of the assessed building, θ represents the correction factor of emission reduction, and μ represents the time-weighting factor, according to Zhang et al. [23]; μ is found to be 0.745 in the present study.
Eu = (ECH + EI) × Y × θ × μ
As mentioned before, Emr represents the carbon emissions due to maintenance and renovation of a building, which depends primarily on local living standards. However, Emr usually accounts for a very small amount of the life cycle and is consequently ignored [24]. In the event that engineering changes occur, such as the entire renovation of a building, Emr should be considered using Equations (2)–(4) based on the specific engineering requirements.
2.4.6. Disposal Emissions
Based on previous studies, the carbon emissions at the building disposal stage mainly result from three parts: building demolition, logistics, and recycling and reuse of materials. Temporary housing will generally be demolished and reconstructed several times, thus using joints that are easily detachable assists in the reduction of carbon emissions caused by material loss and waste disposal efforts during demolition and the reconstruction process; for example, using a bolted connection in the place of a rivet joint and replacing a concrete basement with detachable foundation components. The equation for disposal emissions can be expressed as
where Edem, Edl, and Ere represent the carbon emissions of the three parts mentioned above (building demolition, logistics, and recycling and reuse of materials), respectively. Relevant studies have shown that the energy consumption of demolition is nearly 90% of that of the construction phase [25]. As for prefabricated temporary housing, the demolition process is nearly identical to that of the on-site assembly phase. As a result, the demolition emissions (Edem) can be considered equal to the assembly emissions (Ea). Similarly, considering that the weight of demolition is usually more than 90% of the building’s construction weight [18], the logistics emissions at the disposal stage (Edl) can be considered as 90–99% (determined per specific case) of logistics emissions (El) on the condition that transport distance remains unchanged.
Ed = Edem + Edl + Ere
Generally, recycling and reuse emissions (Ere) are both less than zero given that both can retrieve a portion of embodied emissions of materials. Although carbon emissions caused by the disposal treatments of recycling and reuse are inevitable; the recycled materials are later reused, saving more embodied emissions of materials. The carbon emissions calculation method for recycling and reuse emissions can be found in the study by Zhang and Wang [18]. Additionally, some simplified methods are summarized according to Zhong [26] and Ying et al. [27]: the embodied energy benefit acquired from recycling is approximately 20% of recycled materials; the embodied energy benefit acquired from reuse is approximately 30% of reused materials. However, superfluous computation of recycling and reuse emissions should be avoided for some materials whose carbon emission factors have previously included the recycling factor (e.g., for materials marked with an asterisk (*) in Appendix Table A1 and Table A2).
The indices for the carbon emissions assessment of temporary housing can be expressed from the following aspects: (1) annual average carbon emissions, EOA; (2) carbon emissions at various life cycle stages, i; and (3) carbon emissions of various building elements, i. The detailed equations can be expressed as follows:
where A represents the building area; Yl represents the service life of the building; Ei represents Em (material embodied emissions), Ep (prefabrication emissions), El (logistic emissions), Ea (assemble emissions), Eo (operation emissions), or Ed (disposal emissions); Eci denotes the carbon emissions of a type of element (e.g., for concrete, wood, steel, or glass; structure, envelope, equipment; component, panel, module); and Ect represents the total carbon emissions of building materials. Annual average carbon emissions (EOA) and carbon emissions in different life cycle stages (i) have been proven as effective means of quantitative analysis [14]. The carbon emissions of various building elements (i) can be used to conduct a specific analysis on carbon emissions of differing building compositions, which will contribute to the carbon reduction control measures in the design phase.
EOA = ELPB-t∕A∕Yl
Φi = Ei∕ELPB-t × 100%
Fi = Eci∕Ect × 100%
3. Case Study
The methodology described above is applied in order to assess a new type of temporary housing in China—the “Micro House”. The Micro House is one of a series of multifunction aluminum building products manufactured by an aluminum building materials factory in Nanjing, China, which offers various solutions by means of temporary construction techniques, including but not limited to disaster relief (DR) shelters using modular design and construction methods. The Micro House is designed for use as a temporary residence and has a service life of 20 years.
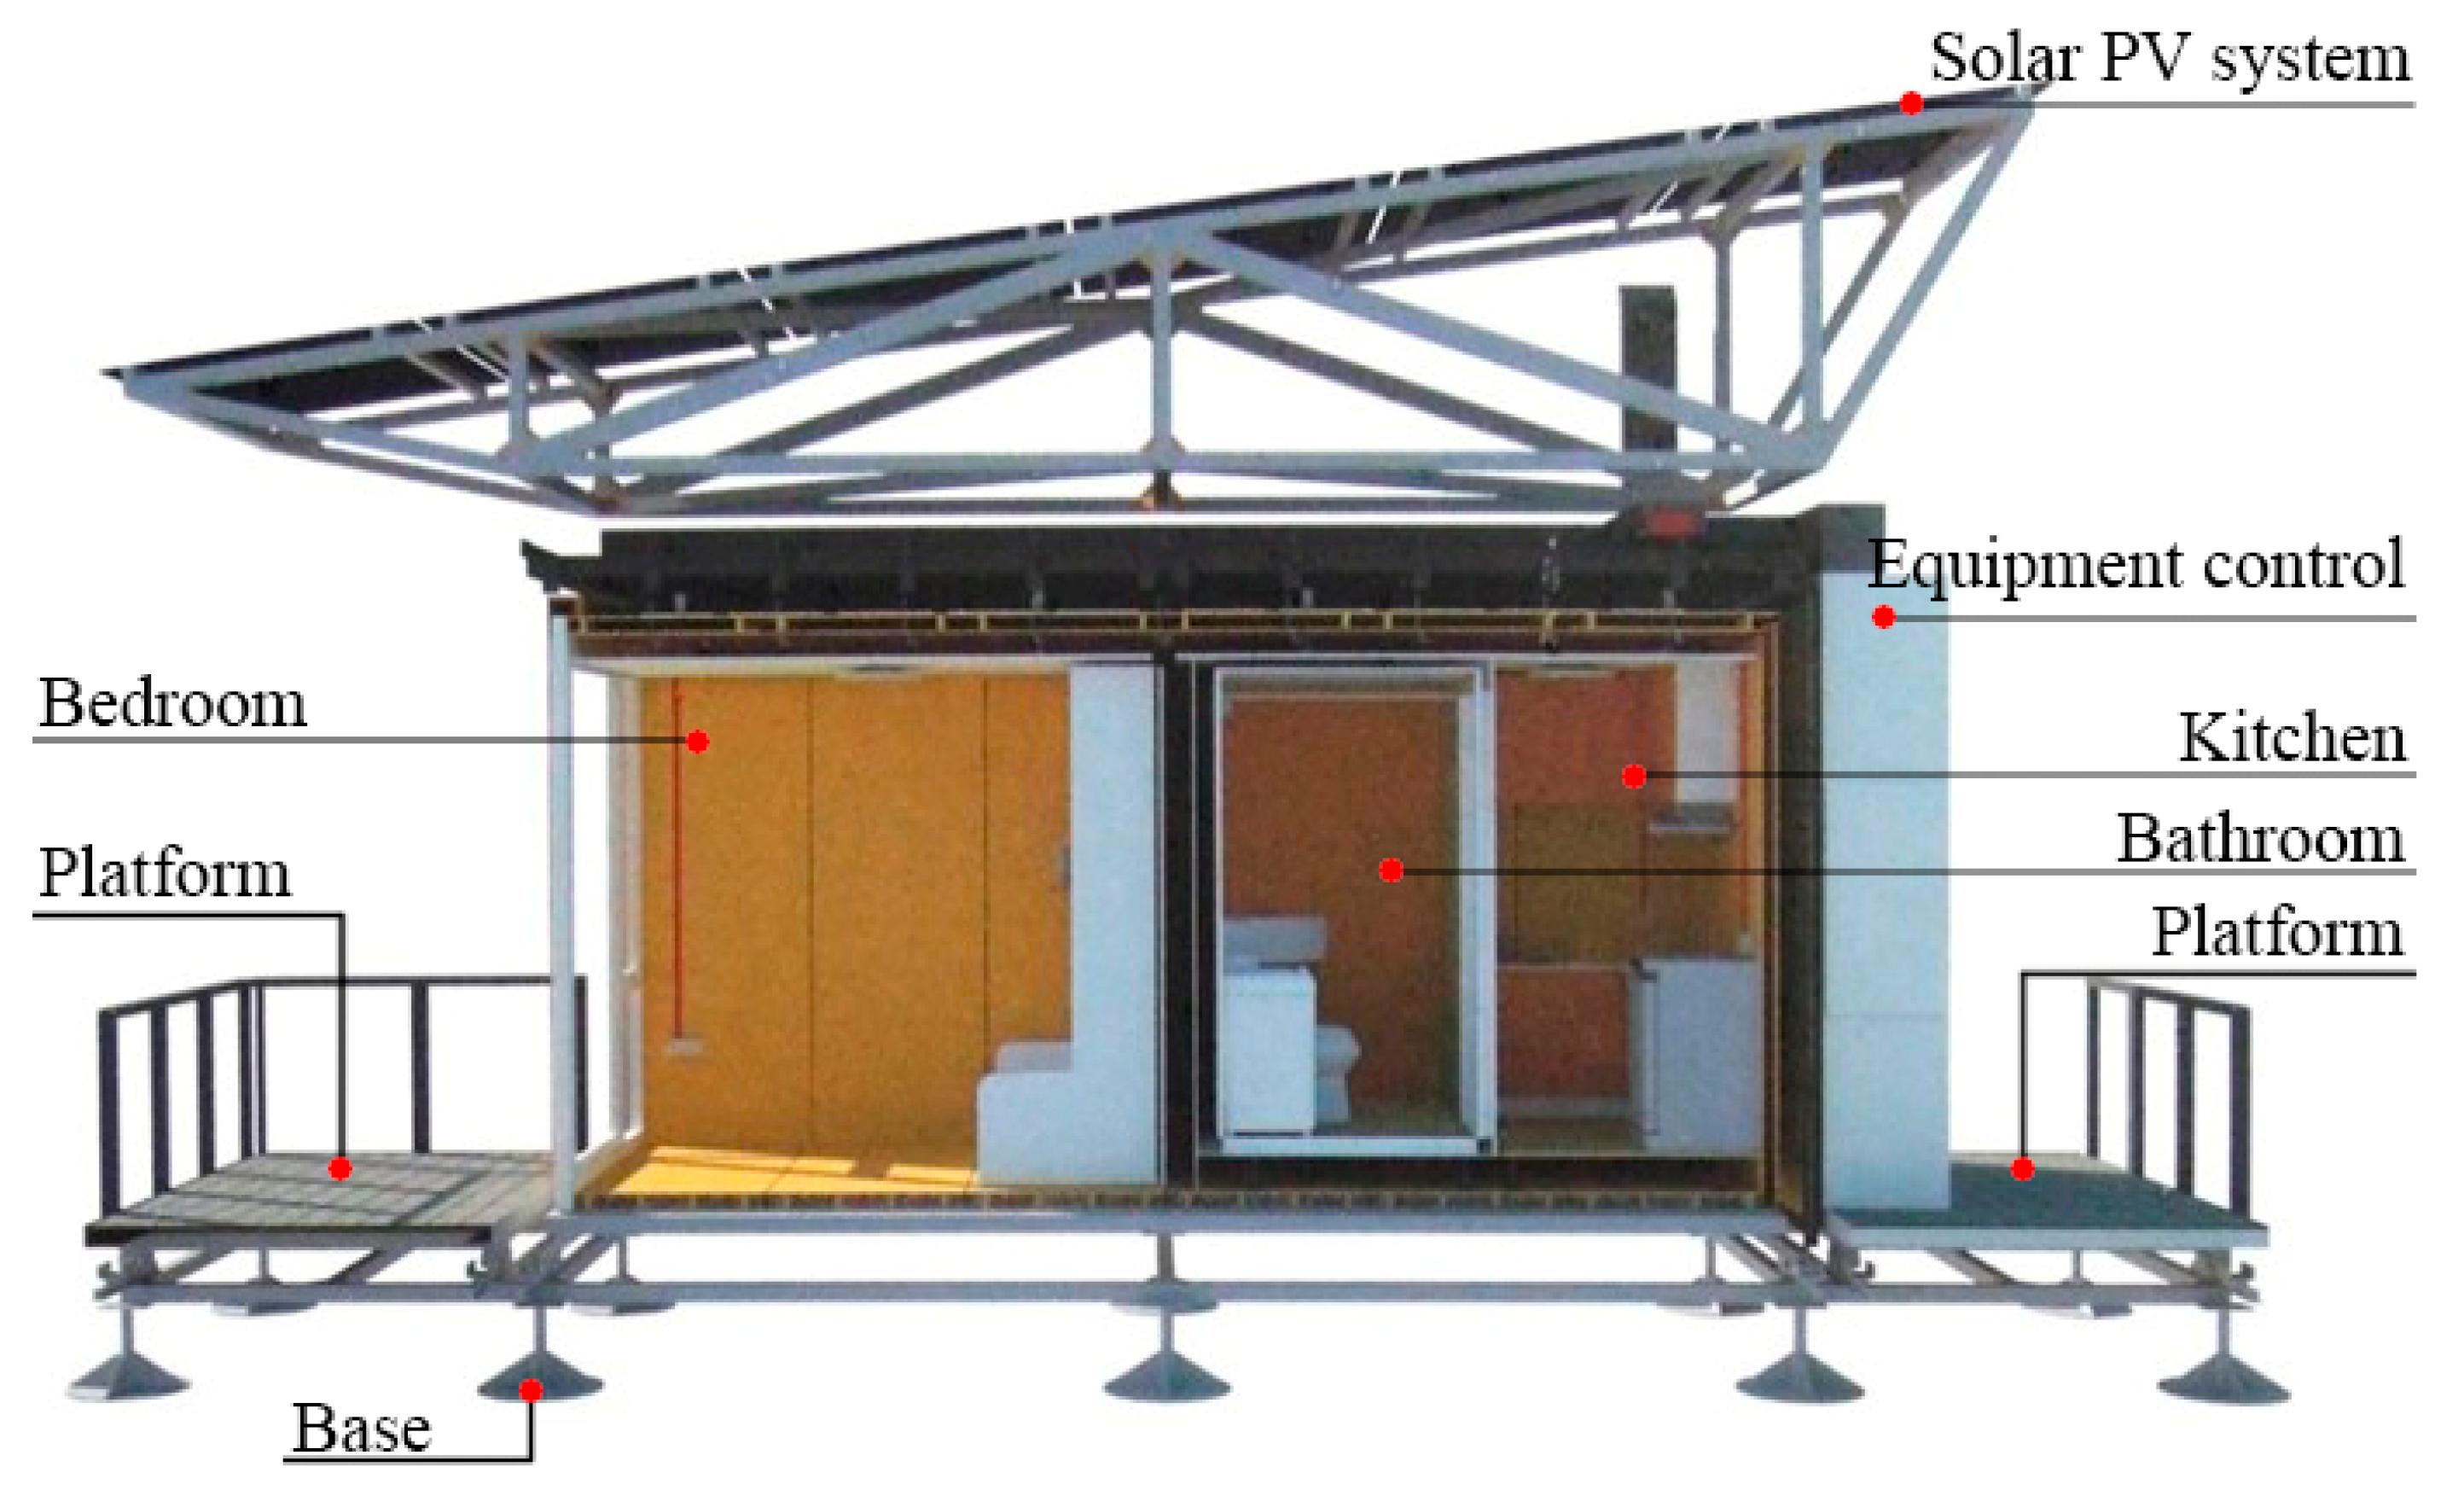
As presented in Figure 4, Figure 5 and Figure 6, the Micro House contains two basic construction units, 6 m × 3 m × 3 m and 6 m × 2 m × 3 m, providing a 30 m2 indoor area and 10 m2 outdoor platform. The Micro House includes one bedroom, bathroom, and kitchen to facilitate the daily life of a small family with three people. (The prefabricated components of the Micro House are presented in Appendix Table A5.) Additionally, solar photovoltaic and solar thermal systems are deployed to supply daily operating energy; as a result, the house is independently sustainable for at least one month without the support of the municipal grid. The Micro House is a lightweight, green construction that is easily transported and can be reused several times. Furthermore, regarding the building’s end of life, most construction materials of the Micro House can be partly or completely reused or recycled. The primary construction materials of the Micro House are presented in Table 2.
The Micro House is built using two main modules, which have been fabricated to 85% completion in a factory. These two modules are integrated with structures, exterior envelope, doors, windows, furniture, plumbing, and electrical, as well as finishes. The manufacturing process of each type of customized component, panel, and module has been investigated prior to factory prefabrication, in addition to transport and site assembly information, which are presented in Table 3 and Table 4, and Appendix Table A6.
The energy sources in the operation stage originate from the solar photovoltaic system and municipal power grid. Energy Plus (8.1) is utilized to establish the building’s energy consumption during the building operations stage; the main parameters of location, weather, load requirement, and energy supply of the solar photovoltaic system are presented in Table 5. It can be assumed that three people occupy the Micro House and occupant schedules differ for weekdays and holidays (including weekends). The weekdays are divided into two periods: 8:00 a.m.–5:00 p.m. (working time), and 5:00 p.m.–8:00 a.m. (rest time). Because Nanjing is in the south of China, the heating, ventilation, and air conditioning (HVAC) system only functions during the summer (June–September) and winter (November–February). During rest time (night time), the HVAC system provides heating while the temperature is below 20 °C and provides cooling when the temperature is above 26 °C. During work time (daytime), the heating setpoint is 10 °C and cooling setpoint is 36 °C, which ensures the load is operating at a low intensity. As for holidays, the HVAC system works continuously to maintain an indoor temperature between 20–26 °C.
Most building materials of the Micro House can be reused or recycled at the end of the building’s life cycle. The replacement cycle of the primary materials used in the Micro House is presented in Table 6 [28,29]. It should be noted that the service life of each material of the Micro House is greater than that of the building (20 years). Generally, the demolition and reconstruction process will lead to additional carbon emissions as a result of material loss during the entire life cycle of temporary housing; however, through the verification of several construction-deconstruction-reconstruction experiments of the Micro House, the material loss is observed to be minimal due to the module assembly techniques.
4. Results and Discussion
4.1. LCA Based on Carbon Reduction Measures
Based on the calculation of life cycle carbon emissions, the annual average emissions (EOA) of the case study building is 35.7 kg·m−2·per year−1. Compared with some cases evaluated in Turkey, where annual average emissions (EOA) are of 255 kg/m2·year [9], the Micro House presents more carbon reduction potentials. The prefabricated temporary housing (PH) in Turkey has a gross floor area of 70 m2 with one story, and it is built using steel structures and concrete foundations with a 25-year lifespan. Through the improvement of construction techniques and use of passive designs, the PH in Turkey has decreased carbon emissions by about 48%, compared with container houses in Turkey. There are several differences between Micro House and P H: (1) the LCA database and calculation are different between China and Turkey; (2) the cases in Turkey use more unrecyclable materials such as concrete, which increase the material embodied emissions (concrete foundations contribute about 38–40% carbon emissions on construction phase [9]) and building disposal emissions; and (3) no renewable energy technology is applied in cases of Turkey, which leads to an increase of the operation emissions during building’s life span. Additionally, the carbon reduction potential can be developed further with the extension of the building’s service life. According to the service life of materials listed in Table 6, the computed long-life carbon emissions of the Micro House are presented in Table 7. It is found that the annual average emissions (EOA) of a Micro House with a service life of 100 years are 23.5 kg/m2·year, which leads to an additional 34% carbon reduction compared with a service life of 20 years. Consequently, increasing the service life of temporary housing will result in greater carbon reduction.
The carbon emissions at various life cycle stages (i) are as demonstrated in Figure 7. It is found that material embodied emissions comprise the largest proportion of total emissions (81.5%), while operations emissions contribute only 12%. However, according to previous studies, operation emissions often contribute the greatest proportion (60–90%) [14]. The deployment of renewable energy systems is the key cause of this change in operation emissions, which will be interpreted in detail in the following sections.
4.1.1. Assessment of Material Embodied Emissions (Em)
It is found that aluminum and solar photovoltaic cells contribute the largest proportion to the total material embodied emissions during the design stage; thus, the following corresponding measures are taken to reduce the consumption of two materials as presented in Table 8: (1) utilizing wood rather than aluminum as the interior wall panel material; and (2) applying passive energy-saving technologies to decrease the area of solar photovoltaic cells from 26.7 m2 to 20.0 m2; as a result, material embodied emissions can be additionally decreased by approximately18%.
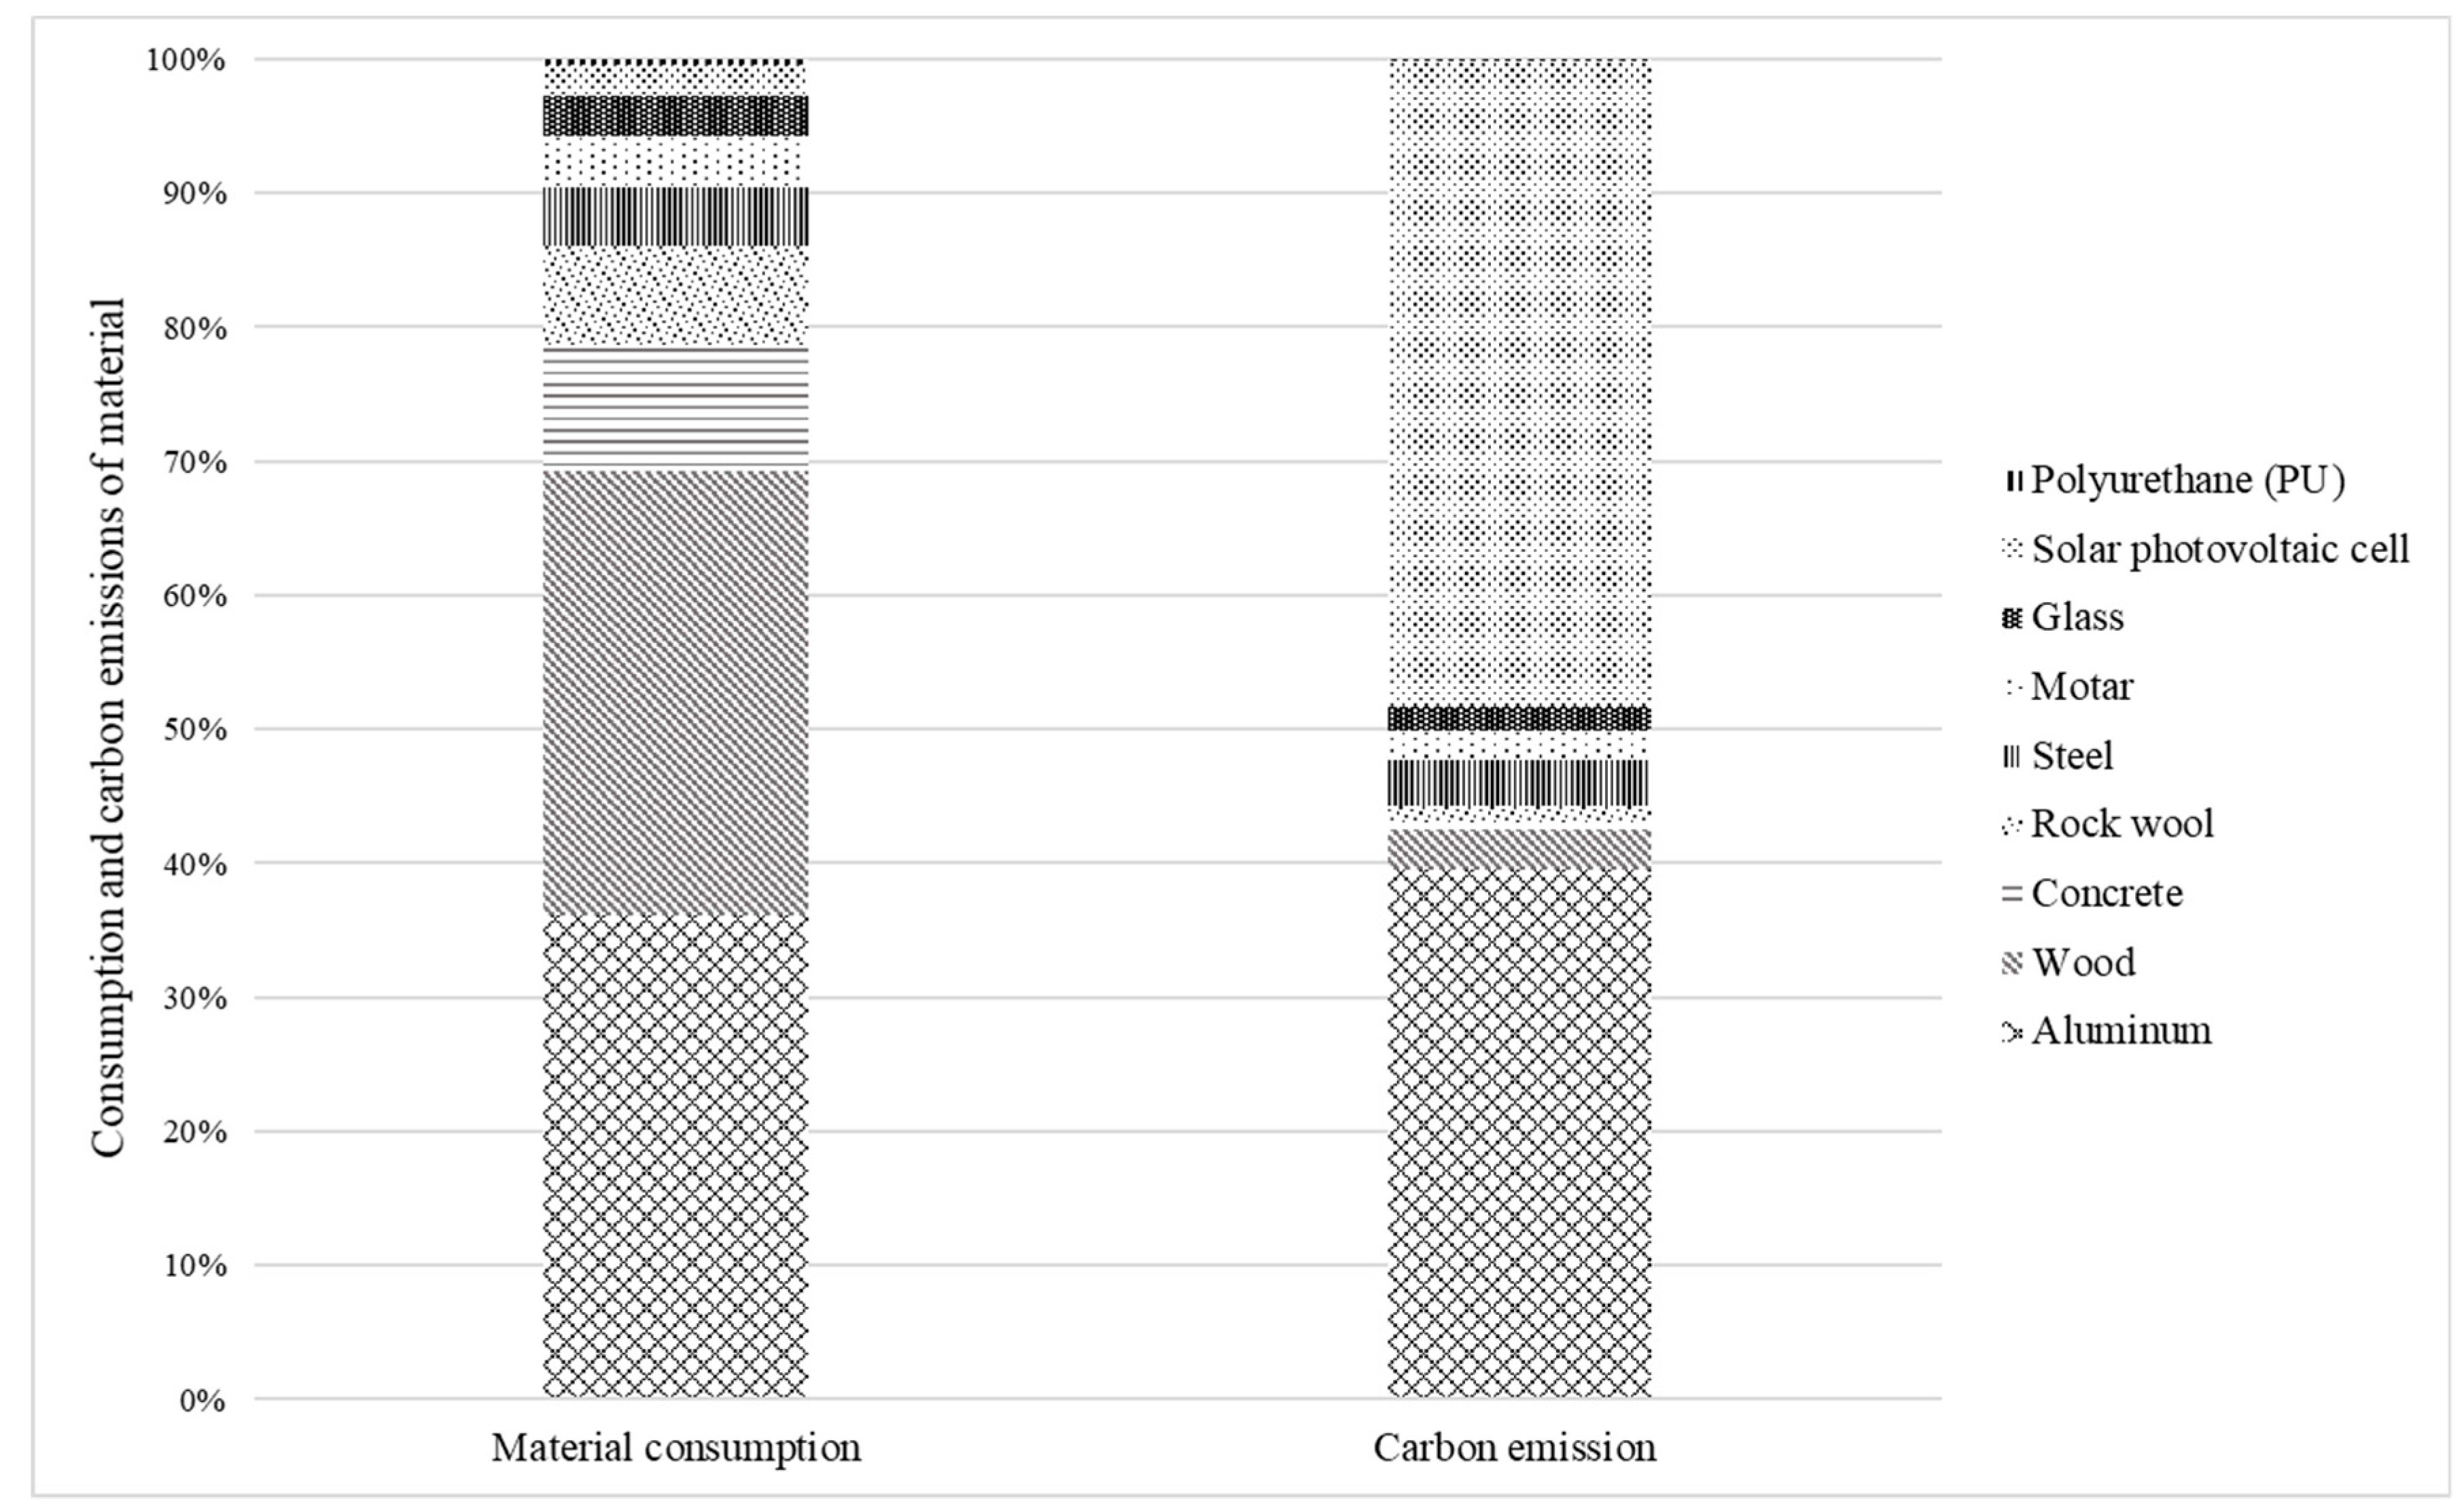
The carbon emissions of various materials and the relationship between material consumption and carbon emissions in the preparation stage of common materials are estimated in Figure 8. It can be observed that aluminum and wood occupy the greatest proportion of material consumption in Micro House, 37.7% and 34.5%, respectively. However, solar photovoltaic cells contribute the largest proportion to the total material embodied emissions (48.1%) as a result of the high carbon emission factor. In comparison, as the second-most-used material in the case study house, wood only contributes 3.1% to the total material embodied emissions. Consequently, the negative impact of solar photovoltaic systems in the material preparation stage should also be considered in addition to the positive impact shown in the building’s operation stage.
4.1.2. Assessment of Prefabrication Emissions (Ep), Logistics Emissions (El), and Assembly Emissions (Ea)
As one of a series of the multifunction aluminum building products, more than 95% of the customized products used in the Micro House are manufactured on an existing production line (as well as previously used molds), which leads to a reduction in carbon emissions and energy savings.
Furthermore, all the connections between the various components, panels, and modules are designed to be easily detachable by means of three customized construction techniques: (1) a well-designed foundation component, which is lightweight and height-adjustable, is appropriate for various sites, and can be quickly assembled and demolished with little waste; (2) a fast bayonet connection technique, which requires no machine operation and is designed to secure the wall panel efficiently; and (3) a special designed slide construction reduces working time for module positioning and gap filling. Additionally, construction plan is improved for several critical processes, resulting in a faster assembly time of six hours or less, as shown in Table 9. Finally, assembly emissions (Ea) are reduced by 17.5% through carbon reduction control measures. Although the proportion of assembly emissions is relatively small, considering the significant number of post-disaster temporary housing units regularly being used (and reused), improving the assembly efficiency is significant to the reduction of carbon emissions.
The combined emissions from the prefabrication, logistics, and assembly stages of the Micro House are equal to the carbon emissions of the conventional construction stage. Carbon emissions of these three stages of the Micro House combined are 0.96 t (Figure 7), among which, logistics emissions contribute the greatest proportion (approximately 82%), whereas assembly emissions contribute only 14%. Compared with the proportion contributed by traditional on-site construction operations, an average of approximately 70% [18], the assembly emissions of prefabricated temporary housing decrease significantly due to the highly efficient assembly process mentioned above. On the other hand, during the assembly stage, the carbon emissions are primarily emitted from the operation of large machinery used for lifting (0.13 t), while the emissions from the operation of connecting joints are so minor (0.12 × 10⁻³ t) that they can be ignored.
4.1.3. Assessment of Operational Emissions (Eo)
The simulation results of energy consumption and energy generation during the building’s first year of usage are simulated in Energy-plus and are presented in Table 10. According to Equations (5) and (5-1), the operation emissions (Eo) of the Micro House during its 20-year service life are 40.62 t, as presented in Table 11. Based on the attenuation efficiency factor of solar power systems (approximately 1.5% every year), the amount of carbon emissions counteracted by solar power over 20 years is approximately 37.20 t; as a result, the comprehensive result of operation emissions for the Micro House is 3.42 t. Although the use of renewable energy systems increases the material embodied emissions by 11.2 t, it contributes to the carbon reduction of operational phase by 37.2 t, and 29.32 t (50.6%) for the total emissions.
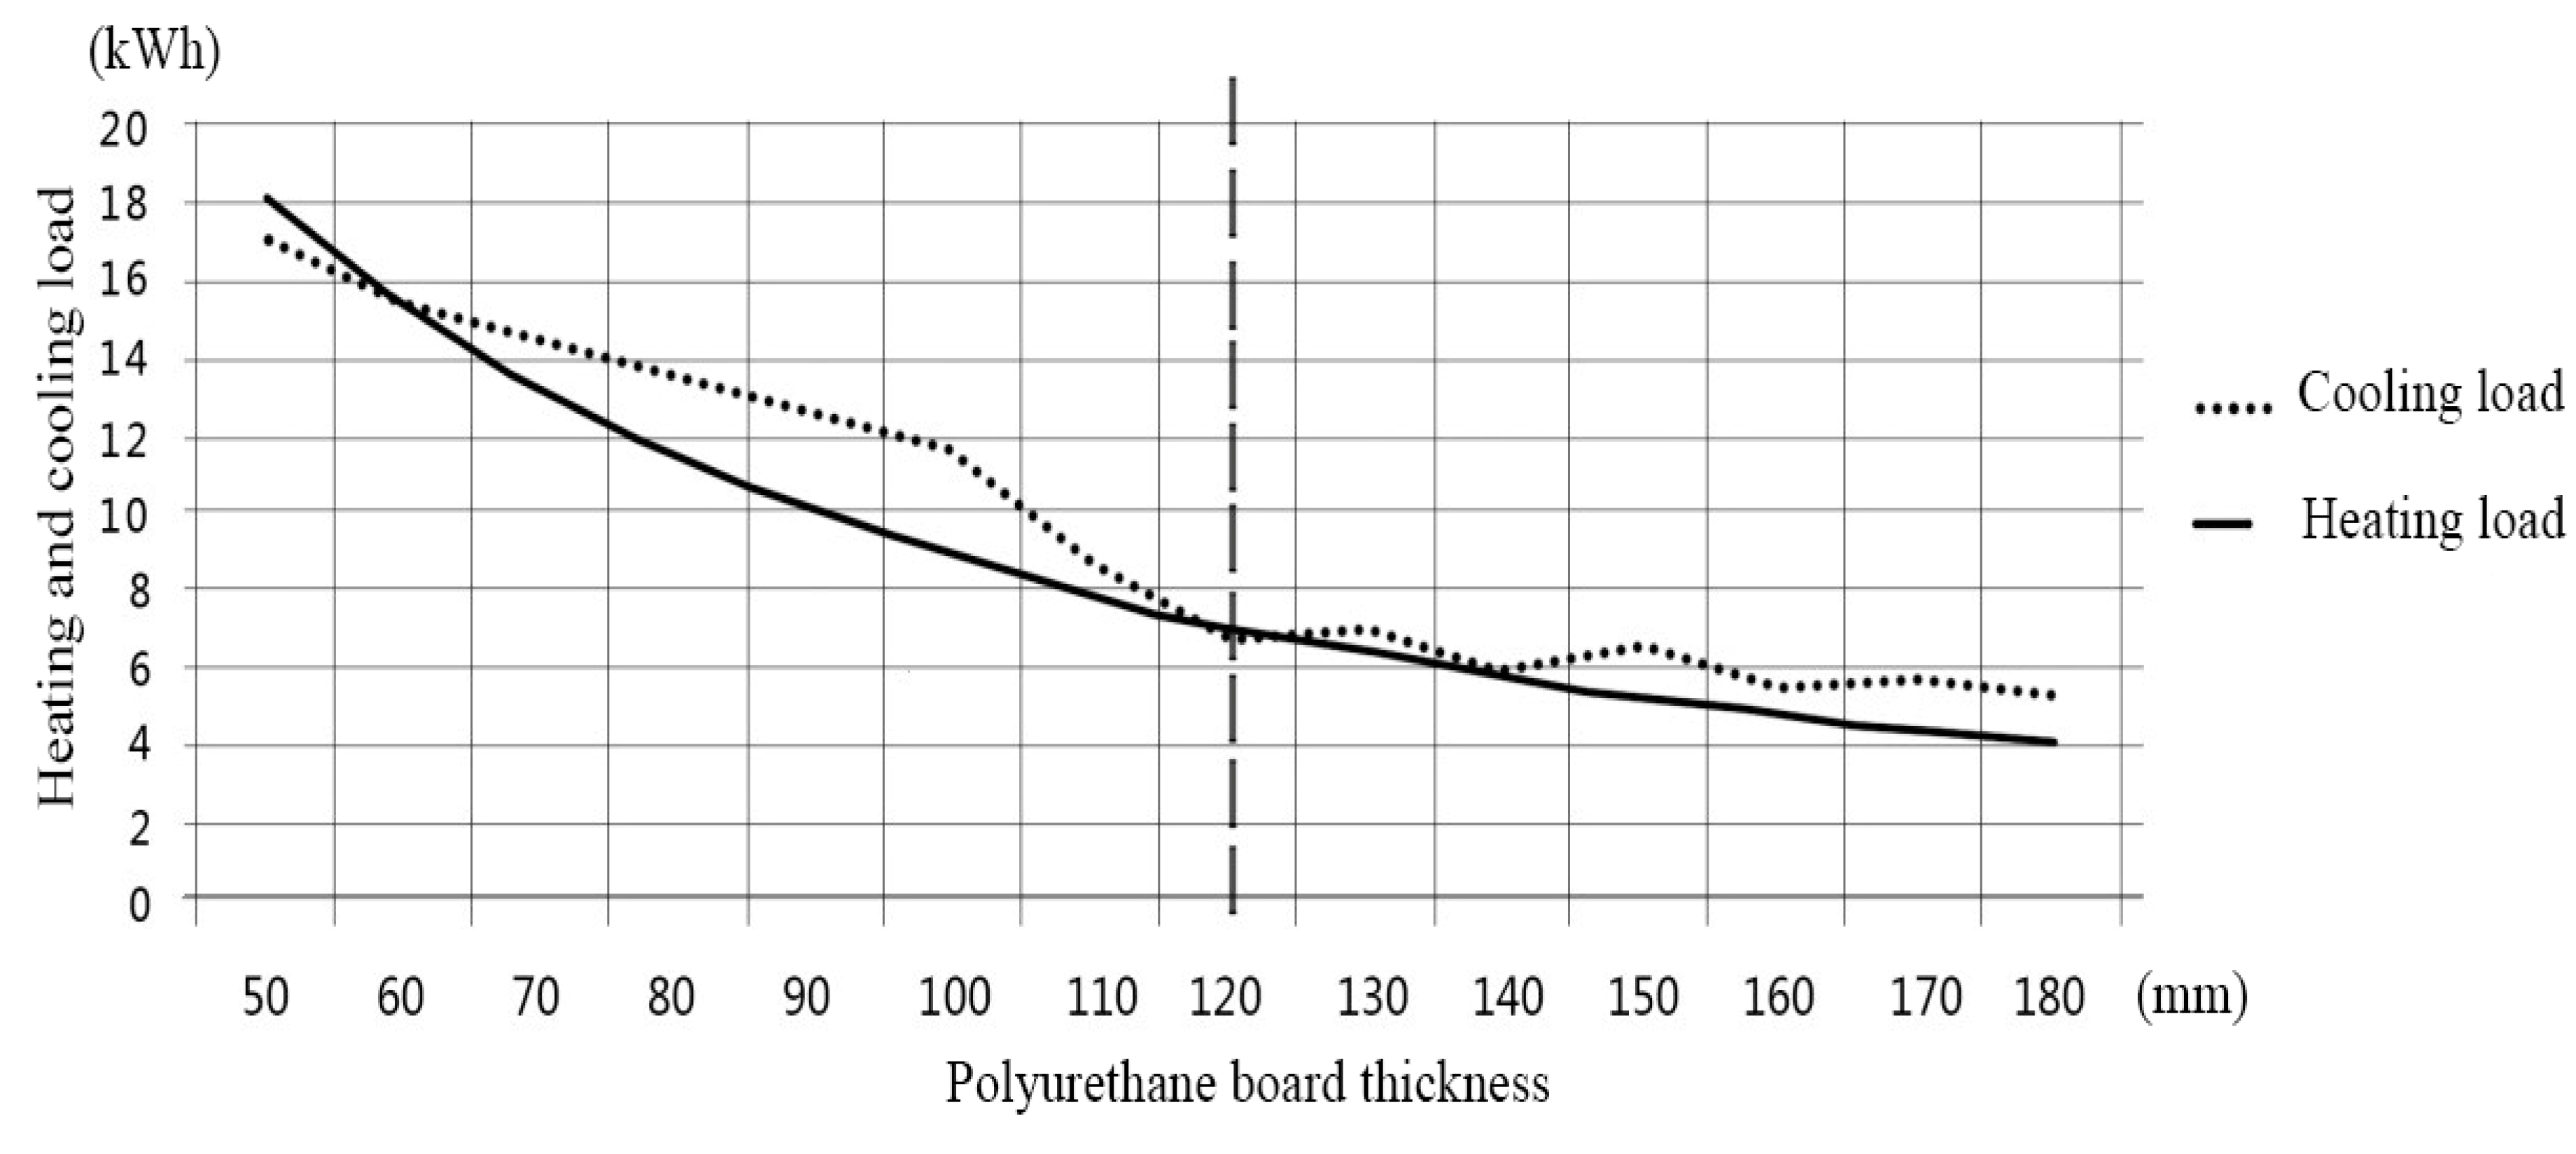
Passive energy-saving technology, such as natural ventilation, sun-shade design, and optimization of thermal performance of building envelope, are also considered to reduce the energy consumption at the design stage. As presented in Figure 9, the decreasing amplitude of cooling and heating loads tends to be slow in cases where the thickness of polyurethane board is more than 120 mm. This suggests that a polyurethane board with a thickness greater than 120 mm will have little effect on energy savings while adding unnecessary capital cost. Through conversion, the equivalent thermal resistance (R) of 120 mm polyurethane board is 5 m2·k/W, which was set as the design target of the thermal performance for the temporary housing envelope. Based on the simulation results, an integrated sandwich panel wall system—comprising an aluminum plate (3 mm), polyurethane board (60 mm), wood board (25 mm), rock wool (70 mm), and wood board (25 mm)—is customized for the Micro House, which has a thermal resistance (R) of 4.96 m2·k/W ≈ 5 m2·k/W. Additionally, building envelopes that consist of multiple layers also help to prevent the formation of cold-bridge effect.
4.1.4. Assessment of Disposal Emissions (Ed)
The present study verifies that few components are damaged (less than 1%) during the demolition and reconstruction stage, which helps to reduce the carbon emissions due to materials loss and the waste disposal procedure during the reconstruction process. For this case, the carbon emissions from materials recycling and reuse (Ere) are not considered given that the recycling factor of primary construction materials has already been considered in the material embodied emissions. Based on a survey regarding the weight of disposable materials from demolition and logistics information, the disposal emissions (Ed) are 0.91 t.
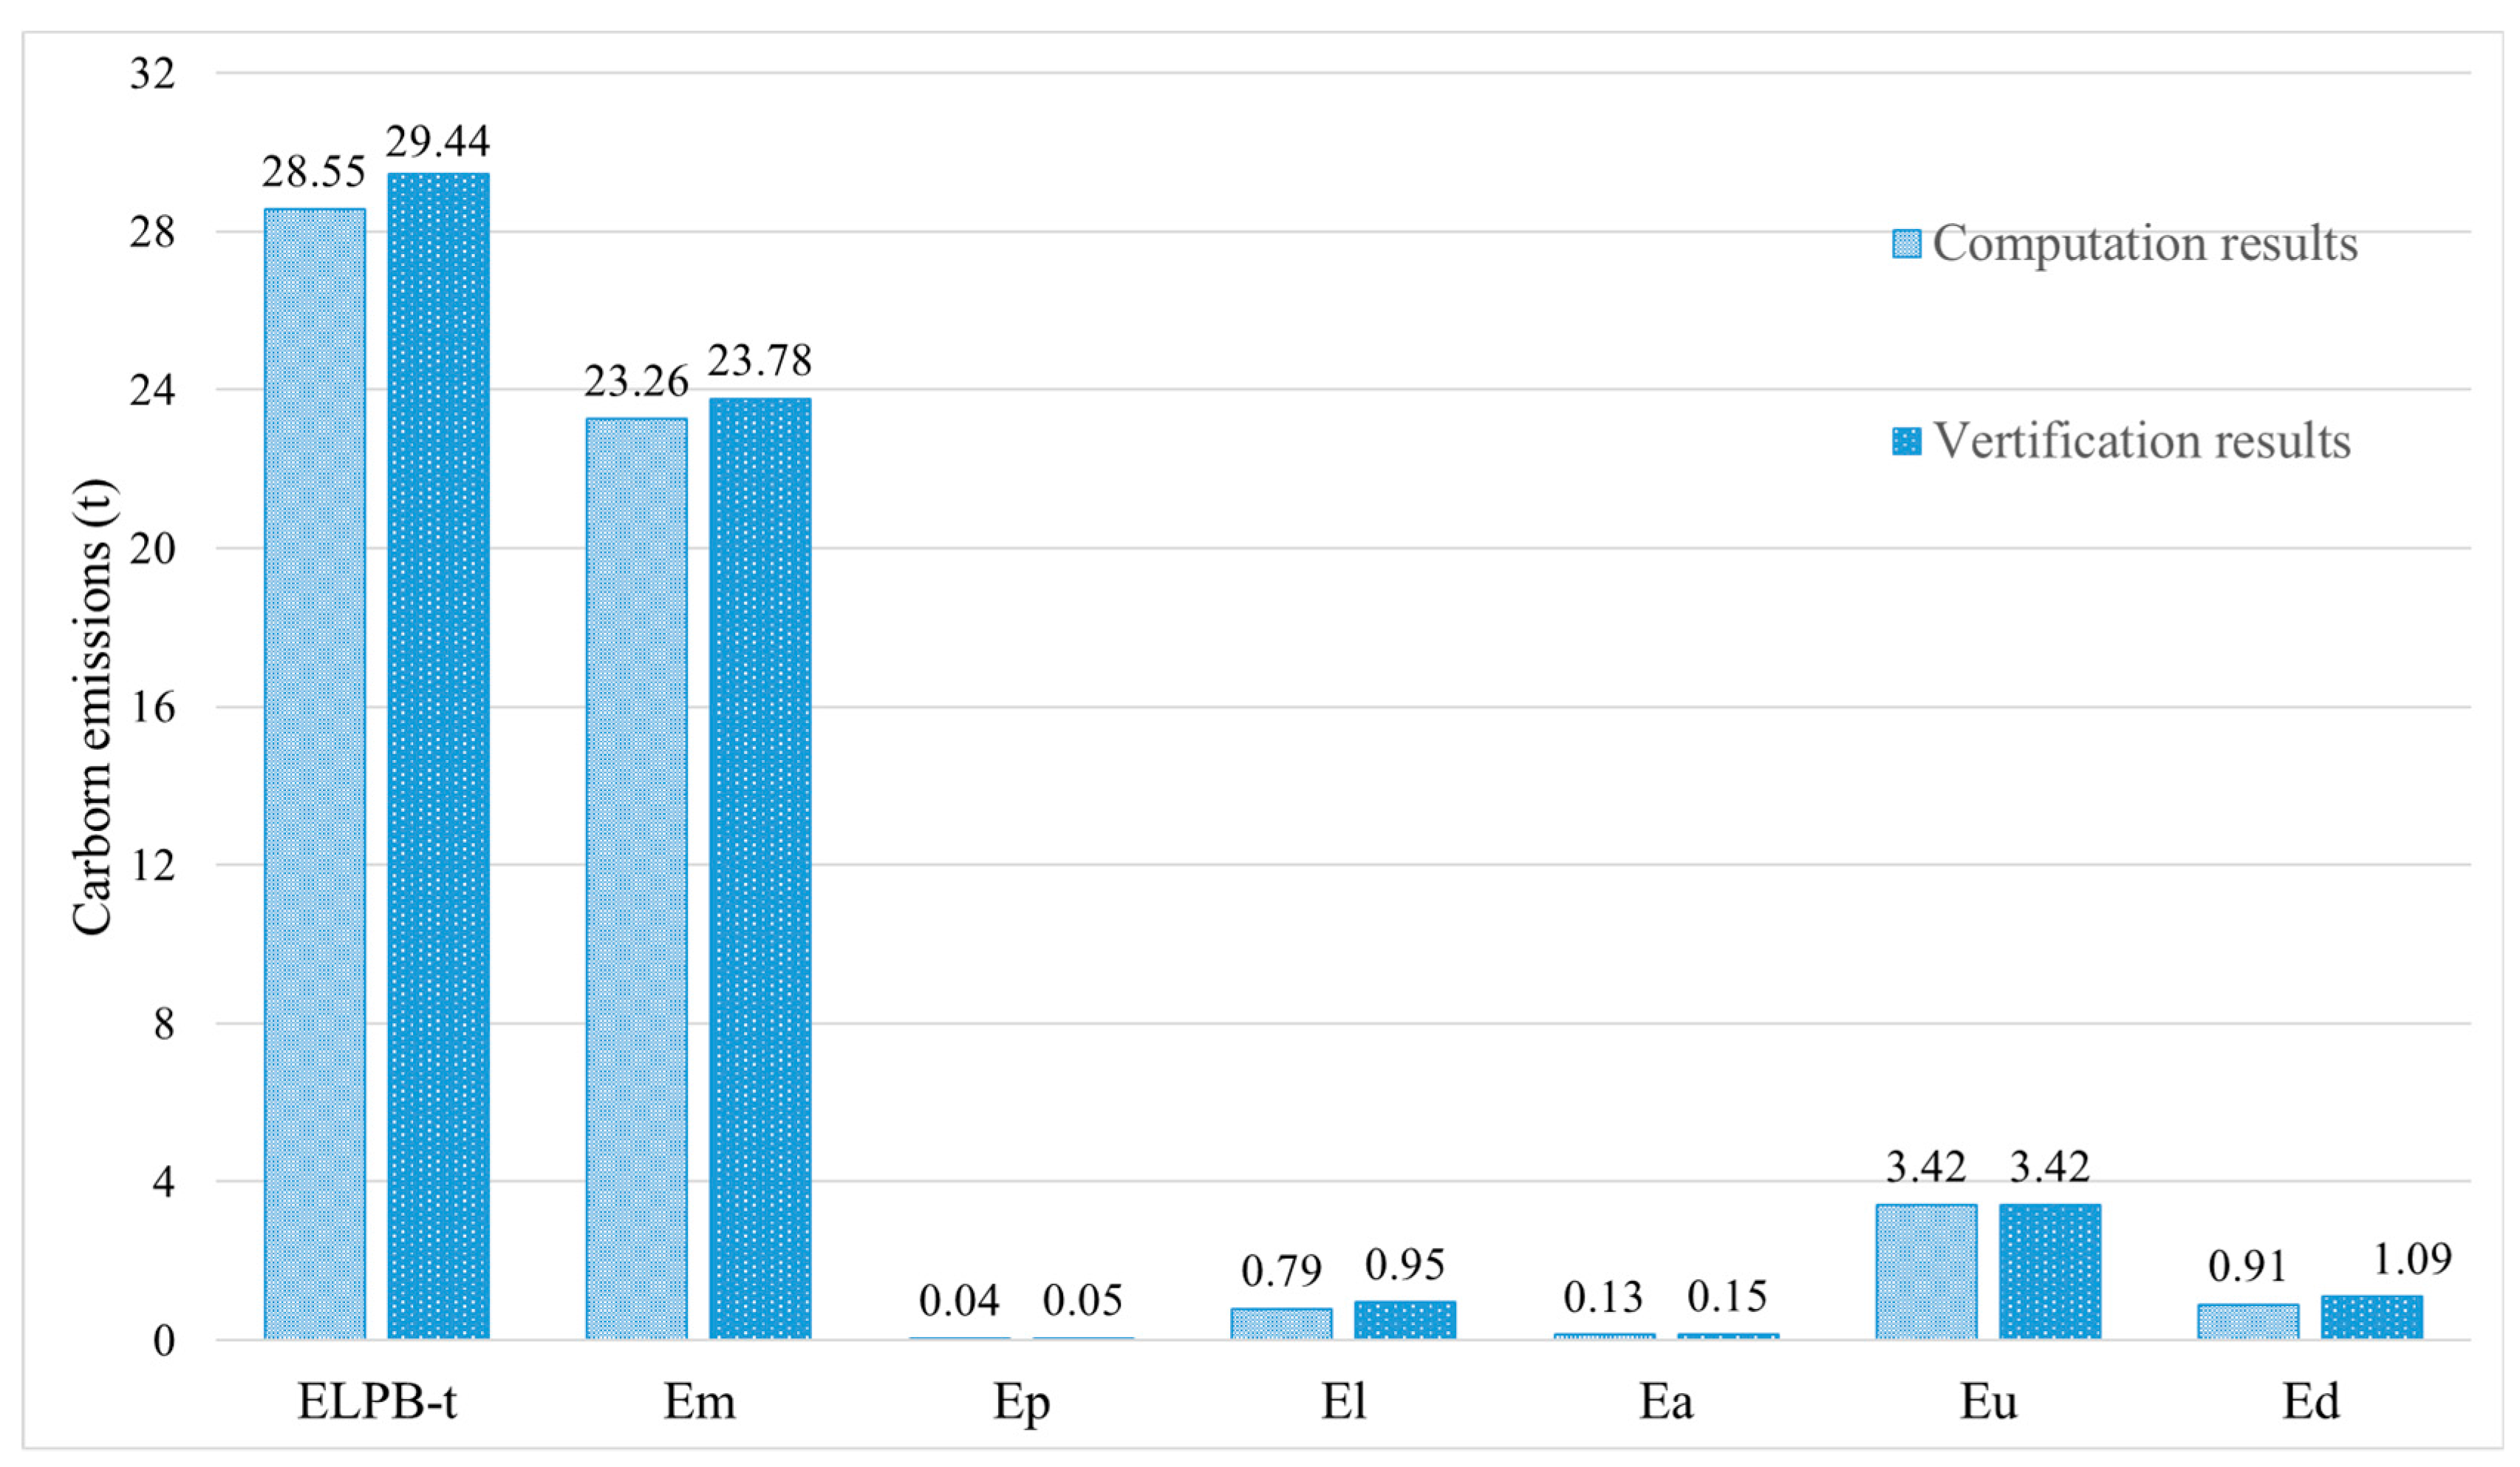
4.2. Verification of LCA Results
The comparison of computation results in the design stage and verification results are presented in Figure 10. All processes, including prefabrication, logistics, on-site assembly, demolition, and reconstruction, are recorded accurately based on investigation and site monitoring. Since the case study building is newly built, the calculations of operation emissions are primarily dependent upon the simulation results. The following can be observed from Figure 10 the computation and verification results are similar, and the verification results for each phase of the building life cycle are slightly higher than those of the computation results. The loss of materials and certain uncontrollable manual operations (working time and error correction) during the construction stage are the primary factors that lead to the increase of carbon emissions in actual working conditions. Overall, the LCA assessment for prefabricated temporary housing is reliable and benefits from the deployment of predictable prefabrication technology.
5. Conclusions
An integrated classification throughout the life cycle of prefabricated temporary housing is presented in this paper; the life cycle of prefabricated temporary housing is divided into six stages. The collection method of carbon emissions data, graded equations, and three indices (EOA,i, and i.) driven by carbon reduction measures are proposed to establish an LCA framework, which is demonstrated using a case study—the Micro House in China.
The Micro House is a new aluminum temporary housing product designed to employ renewable energy systems and modular assembly techniques. Through verification, the assessment method is effective for predicting and controlling the life cycle carbon emissions of temporary housing. For the Micro House case study, the annual average carbon emissions (EOA) are 35.7 kg·m−2·per year−1, revealing strong carbon reduction potential compared with certain evaluated cases. Additionally, a further carbon reduction potential could be achieved by extending the service life of temporary housing. Moreover, through the specific carbon reduction measures analyzed in this paper, stages that result in high carbon emissions during the temporary housing life cycle are improved, including: (1) material embodied emissions; (2) assembly emissions; and (3) operation emissions.
The systematic framework proposed in this study can be utilized as a standard method for carbon assessment and control for prefabricated temporary housing at the design stage. Furthermore, carbon emissions inventories can be integrated with a building information modeling (BIM) platform, and the LCA of prefabricated temporary housing will be conducted intelligently and efficiently for various scenarios of prefabricated temporary housing, which will be the direction of future study.
Acknowledgments
This research is funded by National Natural Science Foundation of China (Grant NO. 51708282) and Jiangsu Government Scholarship.
Author Contributions
Ling Dong and Hong Xian Li conceived and designed the experiments; Yu Wang collected data and analyzed the data; Boya Jiang contributed reagents/materials/analysis tools; Ling Dong and Hong Xian Li wrote the paper; Mohamed Al-Hussein reviewed the paper.
Conflicts of Interest
The authors declare no conflict of interest.
Appendix A. LCA Inventory

Table A1.
Function and CO2 emission factors of commonly used materials of temporary housing.
| Material | Function | CO2 Emission Factor | Source |
| Steel | Structure | 1.72 * tCO2/t | [30] |
| Wood | Structure/Component | 0.20 tCO2/t | [30] |
| Aluminum | Structure/Component | 1.02 * tCO2/t | [30] |
| Glass | Component | 1.40 tCO2/t | [31] |
| Building pottery | Decoration | 1.40 tCO2/t | [32] |
| Gypsum | Decoration | 0.23 tCO2/t | [33] |
| Concrete | Foundation | 0.48 tCO2/m3 | [34] |
| Concrete block | Foundation | 0.12 tCO2/m3 | [35] |
| Cement mortar | Binding | 0.40 tCO2/m3 | [36] |
| Rubble | Site disposal | 0.002 tCO2/t | [30] |
Note: the factors marked with * refer to a consideration of recycling.
Table A2.
Function and CO2 emission factors of some commonly used components of temporary housing.
| Component | Function | CO2 Emission Factor | Source |
|---|---|---|---|
| Steel bar, Steel profiles | Structure | 0.98 * tCO2/t | [37] |
| Aluminum profiles | Structure | 2.37 * tCO2/t | [37] |
| Aluminum window (5 mm) | Component | 20.15 kgCO2/m2 | [37] |
| Plywood | Panels | 0.27 tCO2/m3 | [25] |
| Wood floor (2 mm) | Decoration | 5.75 kgCO2/m2 | [37] |
| Plasterboard (9 mm) | Non-load bearing | 15.64 kgCO2/m2 | [37] |
| Building coating | Decoration | 2.60 tCO2/t | [31] |
| Rock wool | Insulation | 0.35 tCO2/t | [37] |
| Polyurethane (PU) | Insulation | 1.20 tCO2/t | [32] |
| Polystyrene | Insulation | 3.10 tCO2/t | [38] |
| Polyvinyl chloride (PVC) | Equipment | 4.70 tCO2/t | [33] |
Note: the factors marked with * refer to a consideration of recycling.
Table A3.
CO2 emission factors of some commonly used energy resources.
| Energy Type | CO2 Emission Factor | Source |
|---|---|---|
| Coal | 2.06 kg CO2/kg | [20] |
| Diesel | 3.18 kg CO2/L | [20] |
| Natural gas | 2.04 kg CO2/m3 | [20] |
| Gasoline | 2.24 kg CO2/L | [20] |
| Electricity (on average) | 0.97 kg CO2/kWh | [39] |
| Solar photovoltaic system | 0.05–0.25 kg CO2/kWh | [40] |
Table A4.
CO2 emission factors of electricity in China, 2009 [39].
Table A4.
CO2 emission factors of electricity in China, 2009 [39].
| Power Grid Name | CO2 Emission Factors (kg CO2/kWh) |
|---|---|
| Huabei Region | 0.78 |
| Dongbei Region | 0.72 |
| Huadong Region | 0.68 |
| Huazhong Region | 0.58 |
| Xibez Region | 0.64 |
| Nanfang Region | 0.57 |
| Hainan Province | 0.73 |
Appendix B. Case Study
Table A5.
Main Micro House building components.
| Component | Element Type | Elements |
|---|---|---|
| Common products | Structure | Aluminum profile, steel fastener, steel slide rail. |
| Envelope | Polyurethane foam, rock wool, wood boards, steel screws, bolts, aluminum windows and doors. | |
| Equipment (water, electric, HVAC) and household appliances | Solar photovoltaic cell, aluminum profile, PVC pipes, air conditioner, electric water heater, smoke exhaust, fridge, television, cabinet, washing machine, lamps. | |
| Other (furniture, platform) | Kitchen ware, hand sink, wall cabinet, folding bed, sliding partition wall, treated wood boards, steel screws, bolts, steel fastener. | |
| Customized products | Structure | Screw jack footing, customized concrete base plate, customized aluminum fastener. |
| Envelope | Aluminum cladding panels, aluminum roof panels, interior wood sandwich panels, aluminum cover-strip, customized steel fastener. | |
| Equipment (water, electric, HVAC) and household appliances | Aluminum equipment box, customized aluminum fastener, customized steel fastener. | |
| Other (furniture, platform) | Aluminum desk and chairs, aluminum handrail, steel stairs. |
Table A6.
Prefabrication emissions (Ep) inputs.
| Customization Product | Manufacture Process | Machinery Operation Index | ||||
|---|---|---|---|---|---|---|
| Machine Type | Pj (kw)/Py (t/h) | Working Time (h) | Energy Source | Quantity (Piece) | ||
| Exterior envelop aluminum plate | Shear | Numeric control hydraulic pendulum shearing machine, QC12K-4 × 4000 | Pj:7.5 | 1/12 | Electricity | 5 |
| Bend | CNC hydraulic pendulum bending machine, WC67K-160T-6000 | Pj:15 | 1/12 | Electricity | ||
| Press | Open-type inclinable press, J23-40 | Pj:3 | 1/60 | Electricity | ||
| Roof aluminum plate | Shear | Numeric control hydraulic pendulum shearing machine, QC12K-4 × 4000 | Pj:7.5 | 1/6 | Electricity | 2 |
| Bend | CNC hydraulic pendulum bending machine, WC67K-160T-6000 | Pj:15 | 1/6 | Electricity | ||
| Press | Open-type inclinable press, J23-40 | Pj:3 | 1/6 | Electricity | ||
| Foundation component | Cutting | Flame cutting machine, G01-30 | Py:0.82 × 10⁻³ | 1/10 | Ethyne | 8 |
| Weld | Aluminum welding machine, WSE315P | Pj:0.09 | 1/4 | Electricity | ||
| Connection | Electricity wrench, P18-FF-12 | Pj:0.3 | 8 | Electricity | ||
| Customized fittings | Shear | Numeric control hydraulic pendulum shearing machine, QC12K-4 × 4000 | Pj:7.5 | 1/60 | Electricity | 40 |
| Weld | CNC hydraulic pendulum bending machine, WC67K-160T-6000 | Pj:15 | 1/12 | Electricity | ||
| Press | Open-type inclinable press, J23-40 | Pj:3 | 1/60 | Electricity | ||
References
- People, ‘Natural Disaster Affected 186 Million People and Caused 819 People’s Death in 2015 in China’. 2016. Available online: http://politics.pEople.com.cn/n1/2016/0111/c1001-28038455.html (accessed on 10 September 2017).
- Quarantelli, E. General and particular observations on sheltering and housing in American disasters. Disasters 1982, 4, 277–281. [Google Scholar] [CrossRef]
- Wang, T.; Li, Y.L.; Zhang, L.M.; Li, G.J. Case Study of Integrated Prefab Accommodations System for Migrant On-Site Construction Workers in China. J. Prof. Issues Eng. Educ. Pract. 2016, 142, 05016005. [Google Scholar] [CrossRef]
- Félix, D.; Branco, J.M.; Feio, A. Temporary housing after disasters: A state of the art survey. Habitat Int. 2013, 40, 136–141. [Google Scholar] [CrossRef] [Green Version]
- Xia, H.; Zhu, J.X. Thermal Design of Lightweight Building Envelope—Built Cases of NEWBUD Light Gauge Composited Building System. Archit. J. 2014, 545, 106–111. [Google Scholar]
- Chen, P.-T.; Yao, G.C.; Yu, C.; Liu, L.-F.; Ju-Huey, W.; Huang, C.-H. A comparison of residents’ satisfaction with temporary housing—A case study of two temporary housing types in southern Taiwan. J. Chin. Inst. Eng. 2014, 37, 635–642. [Google Scholar] [CrossRef]
- Song, Y.; Mithraratne, N.; Zhang, H. Life-time performance of post-disaster temporary housing: A case study in Nanjing. Energy Build. 2016, 128, 394–404. [Google Scholar] [CrossRef]
- Yepes, V.; Martí, J.V.; García-Segura, T. Cost and CO2 emission optimization of precast–prestressed concrete U-beam road bridges by a hybrid glowworm swarm algorithm. Autom. Constr. 2015, 49, 123–134. [Google Scholar] [CrossRef]
- Atmaca, N. Life-cycle assessment of post-disaster temporary housing. Build. Res. Inf. 2017, 45, 524–538. [Google Scholar] [CrossRef]
- Young, W.R., Jr. History of Applying Photovoltaics to Disaster Relief. Florida Solar Energy Center/University of Florida 1679 Clearlake Road, Cocoa, FL 32922, USA, 1994. Available online: http://www.fsec.ucf.edu/en/publications/pdf/fsec-cr-934-96.pdf (accessed on 20 September 2017).
- Potangaroa, R. Sustainability by design: The challenge of shelter in post disaster reconstruction. Procedia-Soc. Behav. Sci. 2015, 179, 212–221. [Google Scholar] [CrossRef]
- Arslan, H. Re-design, re-use and recycle of temporary houses. Build. Environ. 2007, 42, 400–406. [Google Scholar] [CrossRef]
- Bonamente, E.; Cotana, F. Carbon and Energy Footprints of Prefabricated Industrial Buildings: A Systematic Life Cycle Assessment Analysis. Energies 2015, 8, 12685–12701. [Google Scholar] [CrossRef]
- Li, D.Z.; Chen, H.X.; Hui, E.C.M.; Zhang, J.B.; Li, Q.M. A methodology for estimating the life-cycle carbon efficiency of a residential building. Build. Environ. 2013, 59, 448–455. [Google Scholar] [CrossRef]
- Penadés-Plà, V.; Martí, J.V.; García-Segura, T.; Yepes, V. Life-Cycle Assessment: A Comparison between Two Optimal Post-Tensioned Concrete Box-Girder Road Bridges. Sustainability 2017, 9, 1864. [Google Scholar] [CrossRef]
- Molina-Moreno, F.; Martí, J.V.; Yepes, V. Carbon embodied optimization for buttressed earth-retaining walls: Implications for low-carbon conceptual designs. J. Clean. Prod. 2017, 164, 872–884. [Google Scholar] [CrossRef]
- Ju, Y.; Cheng, Y. Research on the Building Carbon Emission Calculation Method in Compliance with the Theory of Full Life-cycle—Based upon Statistical Analysis of CNKI’s Domestic Literature dated between 1997~2013. Resid. Technol. 2014, 5, 32–37. [Google Scholar]
- Zhang, X.C.; Wang, F.L. Life-cycle assessment and control measures for carbon emissions of typical buildings in China. Build. Environ. 2015, 86, 89–97. [Google Scholar] [CrossRef]
- Wen, R.; Qi, S.J.; Jrade, A. Simulation and Assessment of Whole Life-Cycle Carbon Emission Flows from Different Residential Structures. Sustainability 2016, 8, 807. [Google Scholar] [CrossRef]
- Intergovernmental Panel on Climate Change. 2006 IPCC Guidelines for National Greenhouse Gas Inventories. Energy. Volume 2. 2006. Available online: http://www.ipcc-nggip.iges.or.jp/public/2006gl/vol2.html (accessed on 1 October 2017).
- National Bureau of Statistics of the People’s Republic of China. Chinese Statistical Yearbook 2013. 2014. Available online: http://www.stats.gov.cn/tjsj/ndsj/2013/indexch.htm (accessed on 5 October 2017).
- Yang, Q.M. Quantificational Life Cycle Assessment of Environmental Impact of Construction Productions. Master’s Thesis, Tianjin University, Tianjin, China, 2009. (In Chinese). [Google Scholar]
- Zhang, L.; Huang, Y.R.; Huang, X. Assessment of Building Life Cycle Carbon Emissions Based on Standard Calculation Platform. Huazhong Archit. 2012, 30, 32–34. [Google Scholar]
- Tian, Y.W.; Zhao, Q.; Jian, G. Study on the life-cycle carbon emission and energy-efficiency management of the large-scale public buildings in Hangzhou, China. In Proceedings of the 2011 International Conference of Computer and Management (CAMAN), Wuhan, China, 19–21 May 2011. [Google Scholar]
- Guo, H.B.; Liu, Y.; Chang, W.S.; Shao, Y.; Sun, C. Energy Saving and Carbon Reduction in the Operation Stage of Cross Laminated Timber Residential Buildings in China. Sustainability 2017, 9, 292. [Google Scholar] [CrossRef]
- Zhong, P. Studies on Energy Consumption and Environment Impact of Building Life Cycle. Master’s Thesis, Sichuan University, Chengdu, China, 2005. (In Chinese). [Google Scholar]
- Ying, C.; Yan, Z. Models for life-cycle energy consumption and environmental emissions in residential buildings. J. Tsinghua Univ. Sci. Technol. 2010, 50, 325–329. (In Chinese) [Google Scholar]
- Johnstone, I.M. Energy and mass flows of housing: A model and example. Build. Environ. 2001, 36, 27–41. [Google Scholar] [CrossRef]
- Adalberth, K. Energy use during the life cycle of buildings: A method. Build. Environ. 1997, 32, 317–320. [Google Scholar] [CrossRef]
- Yan, Y. Research of Energy Consumption and CO2 Emission of Building in Zhejiang Province Based on Life Cycle Assessment. Master’s Thesis, Zhejiang University, Hangzhou, China, 2011. (In Chinese). [Google Scholar]
- Wang, S.Q. Life Cycle Assessment of Residential Building Energy Consumption in Severe Cold Region. Master’s Thesis, Harbin Institute of Technology, Harbin, China, 2007. (In Chinese). [Google Scholar]
- Bing, L. Research on the Technology System and the Calculation Method of Carbon Emission of Low-Carbon Building. Ph.D. Thesis, Huazhong University of Science & Technology, Wuhan, China, 2012. (In Chinese). [Google Scholar]
- Wang, X. Life Cycle Assessment for Carbon Emission of Residential Building. Master’s Thesis, Tianjin University, Tianjin, China, 2012. (In Chinese). [Google Scholar]
- Yu, D.W.; Tan, H.W.; Ruan, Y.J. A future bamboo-structure residential building prototype in China: Life cycle assessment of energy use and carbon emission. Energy Build. 2011, 43, 2638–2646. [Google Scholar] [CrossRef]
- Li, Z.; Feng, Q.G.; Lu, L.H. Analysis of environmental impact on the recycled aggregate concrete hollow blocks. Concrete 2013, 6, 114–117. (In Chinese) [Google Scholar]
- Wang, F.L.; Zhu, F.; Zhang, X.C.; Wang, H.Y. Comparison and analysis of structure design and carbon emissions of a 17-storey residential building in Harbin. J. Harbin Inst. Technol. 2014, 46, 11–15. (In Chinese) [Google Scholar]
- Zhang, Y.S. Evaluation of Carbon Dioxide Reduction of Life Cycle for Buildings. Ph.D. Thesis, National Cheng Kung University, Tainan, Taiwan, 2002. (In Chinese). [Google Scholar]
- Shao, G.F.; Zhao, X.L.; Gao, Y.J.; Zhang, M.X.; Huo, S.X. Research on calculation means of carbon emission of building material. New Build. Mater. 2012, 2, 75–77. (In Chinese) [Google Scholar]
- Yin, S.C. Study of Life-Cycle Carbon Emission in Buildings. Master’s Thesis, Harbin Institute of Technology, Harbin, China, 2007. (In Chinese). [Google Scholar]
- Varun, I.K.; Bhat, R.P. LCA of renewable energy for electricity generation systems—A review. Renew. Sustain. Energy Rev. 2009, 13, 1067–1073. [Google Scholar] [CrossRef]
Figure 1.
Life cycle stages of buildings with differing construction methods.
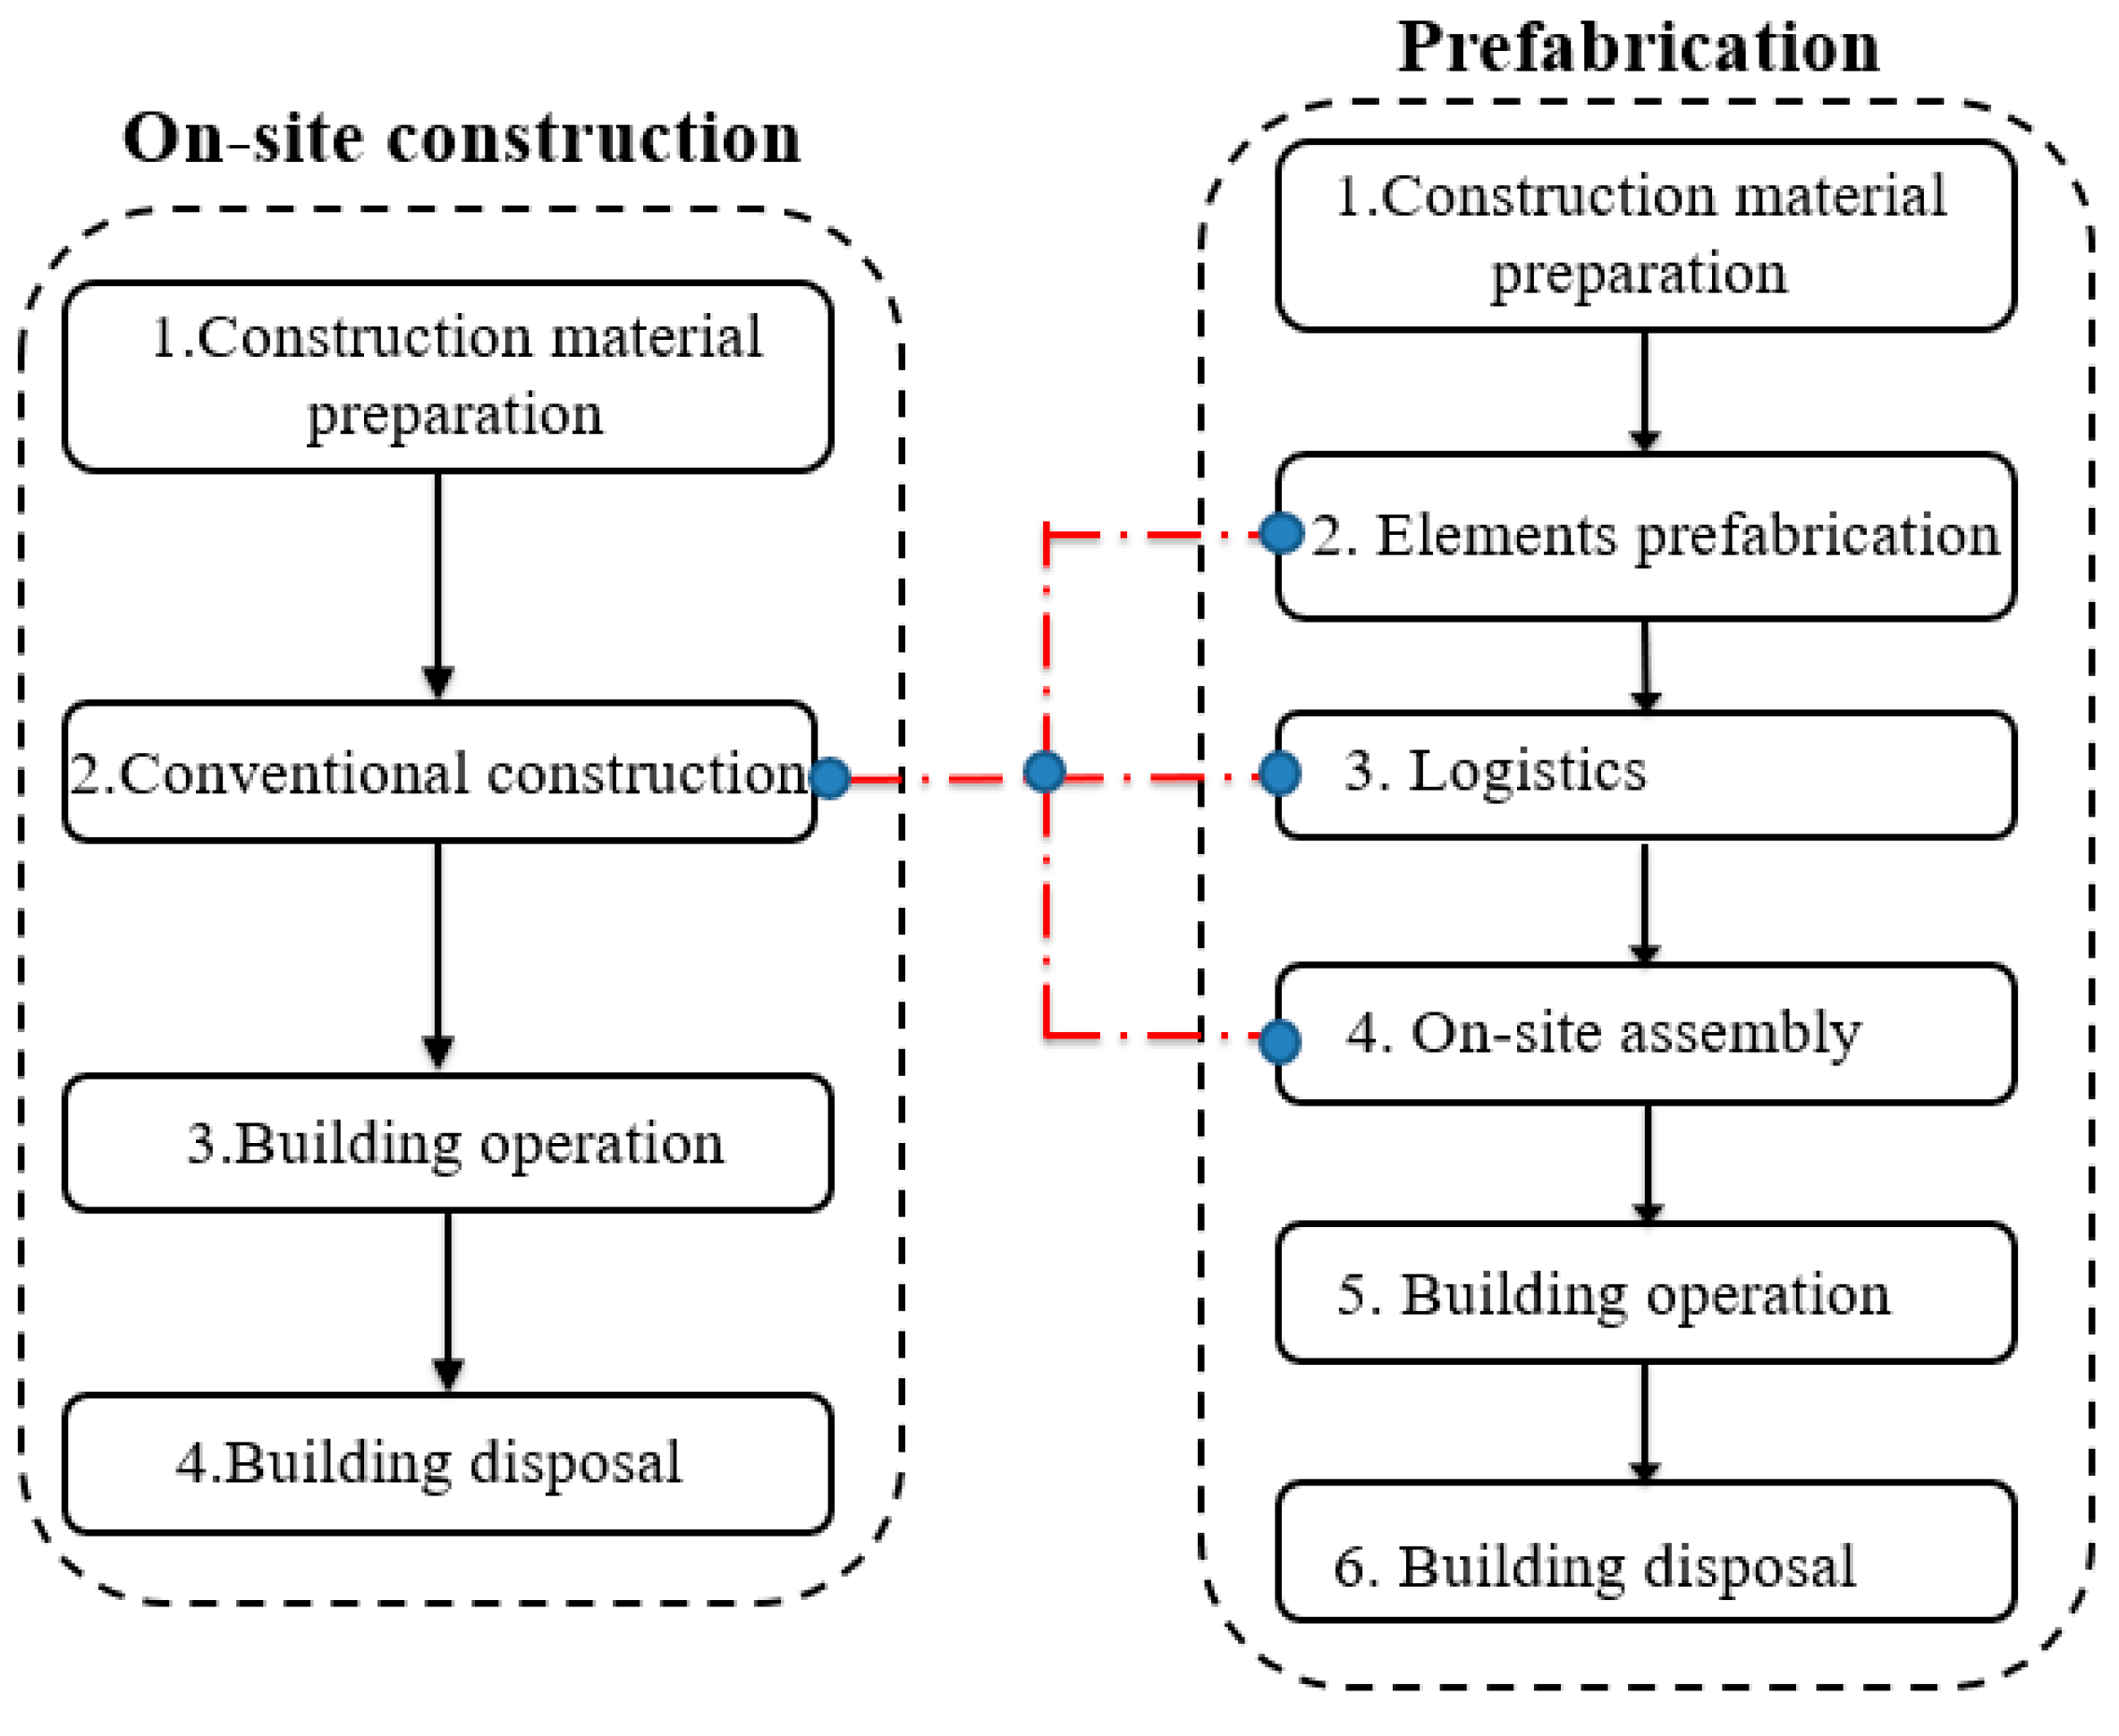
Figure 2.
Life cycle of prefabricated temporary housing.
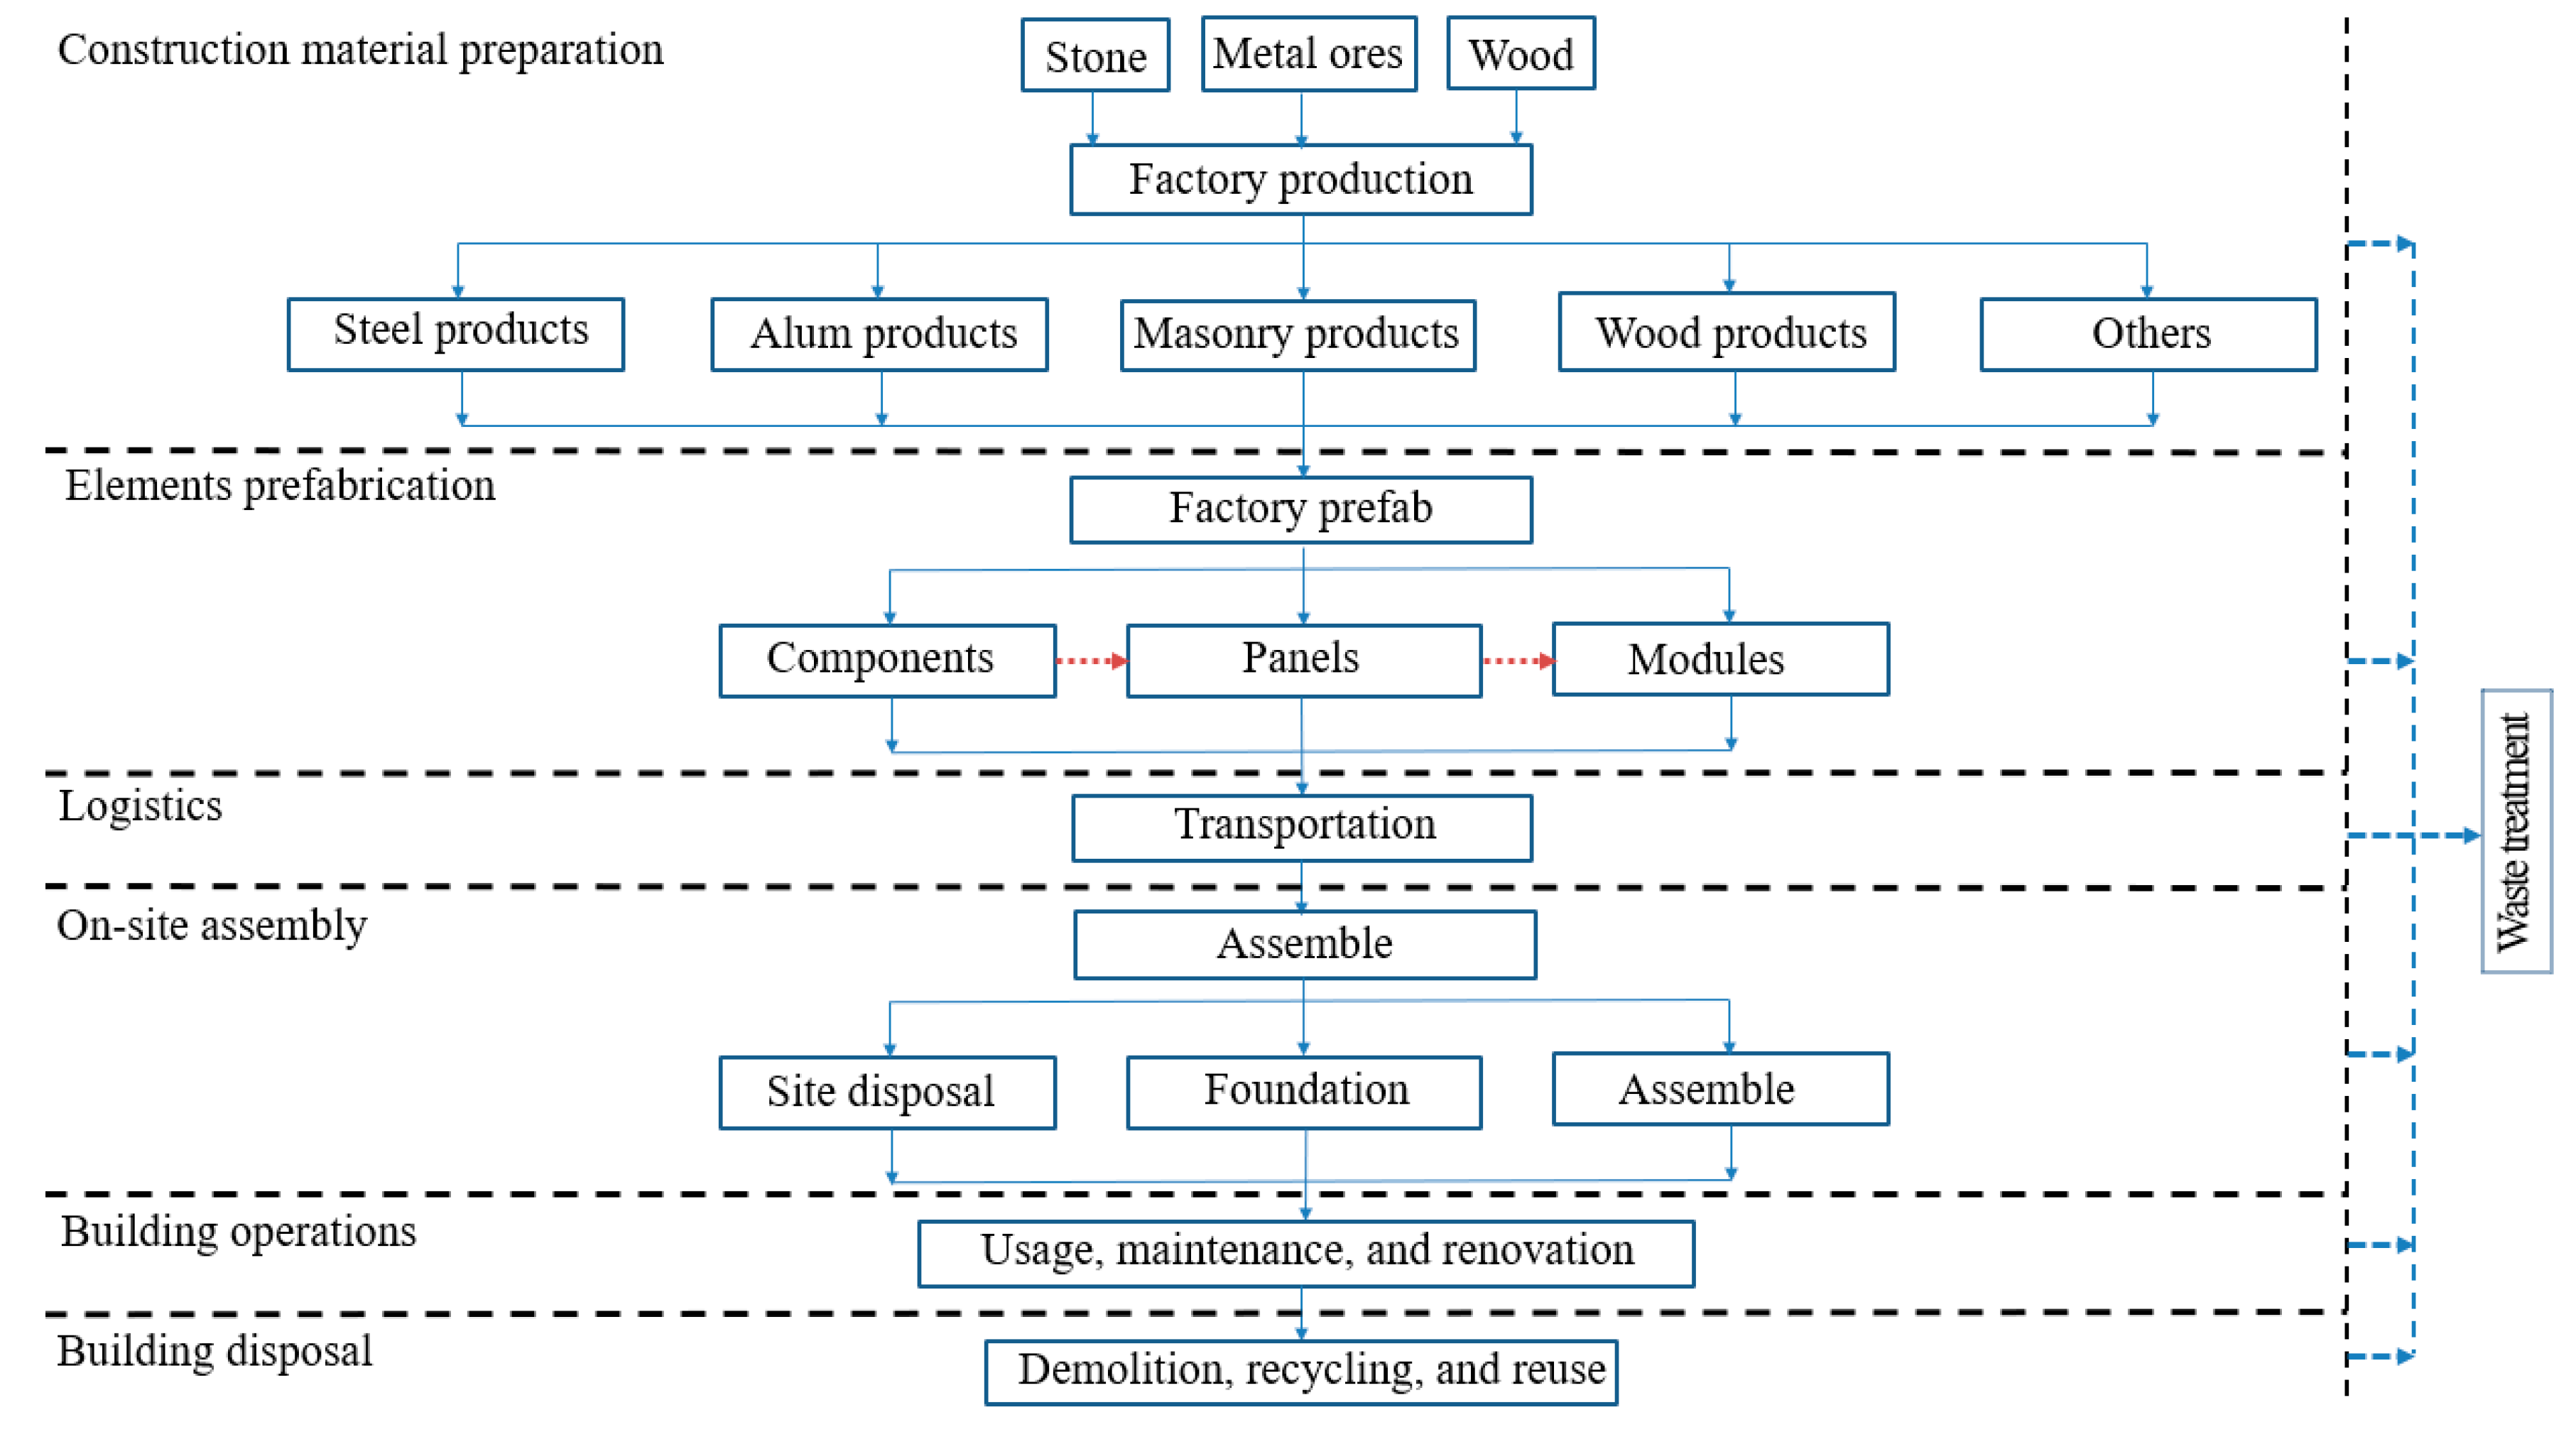
Figure 3.
Carbon reduction process during the design stage.
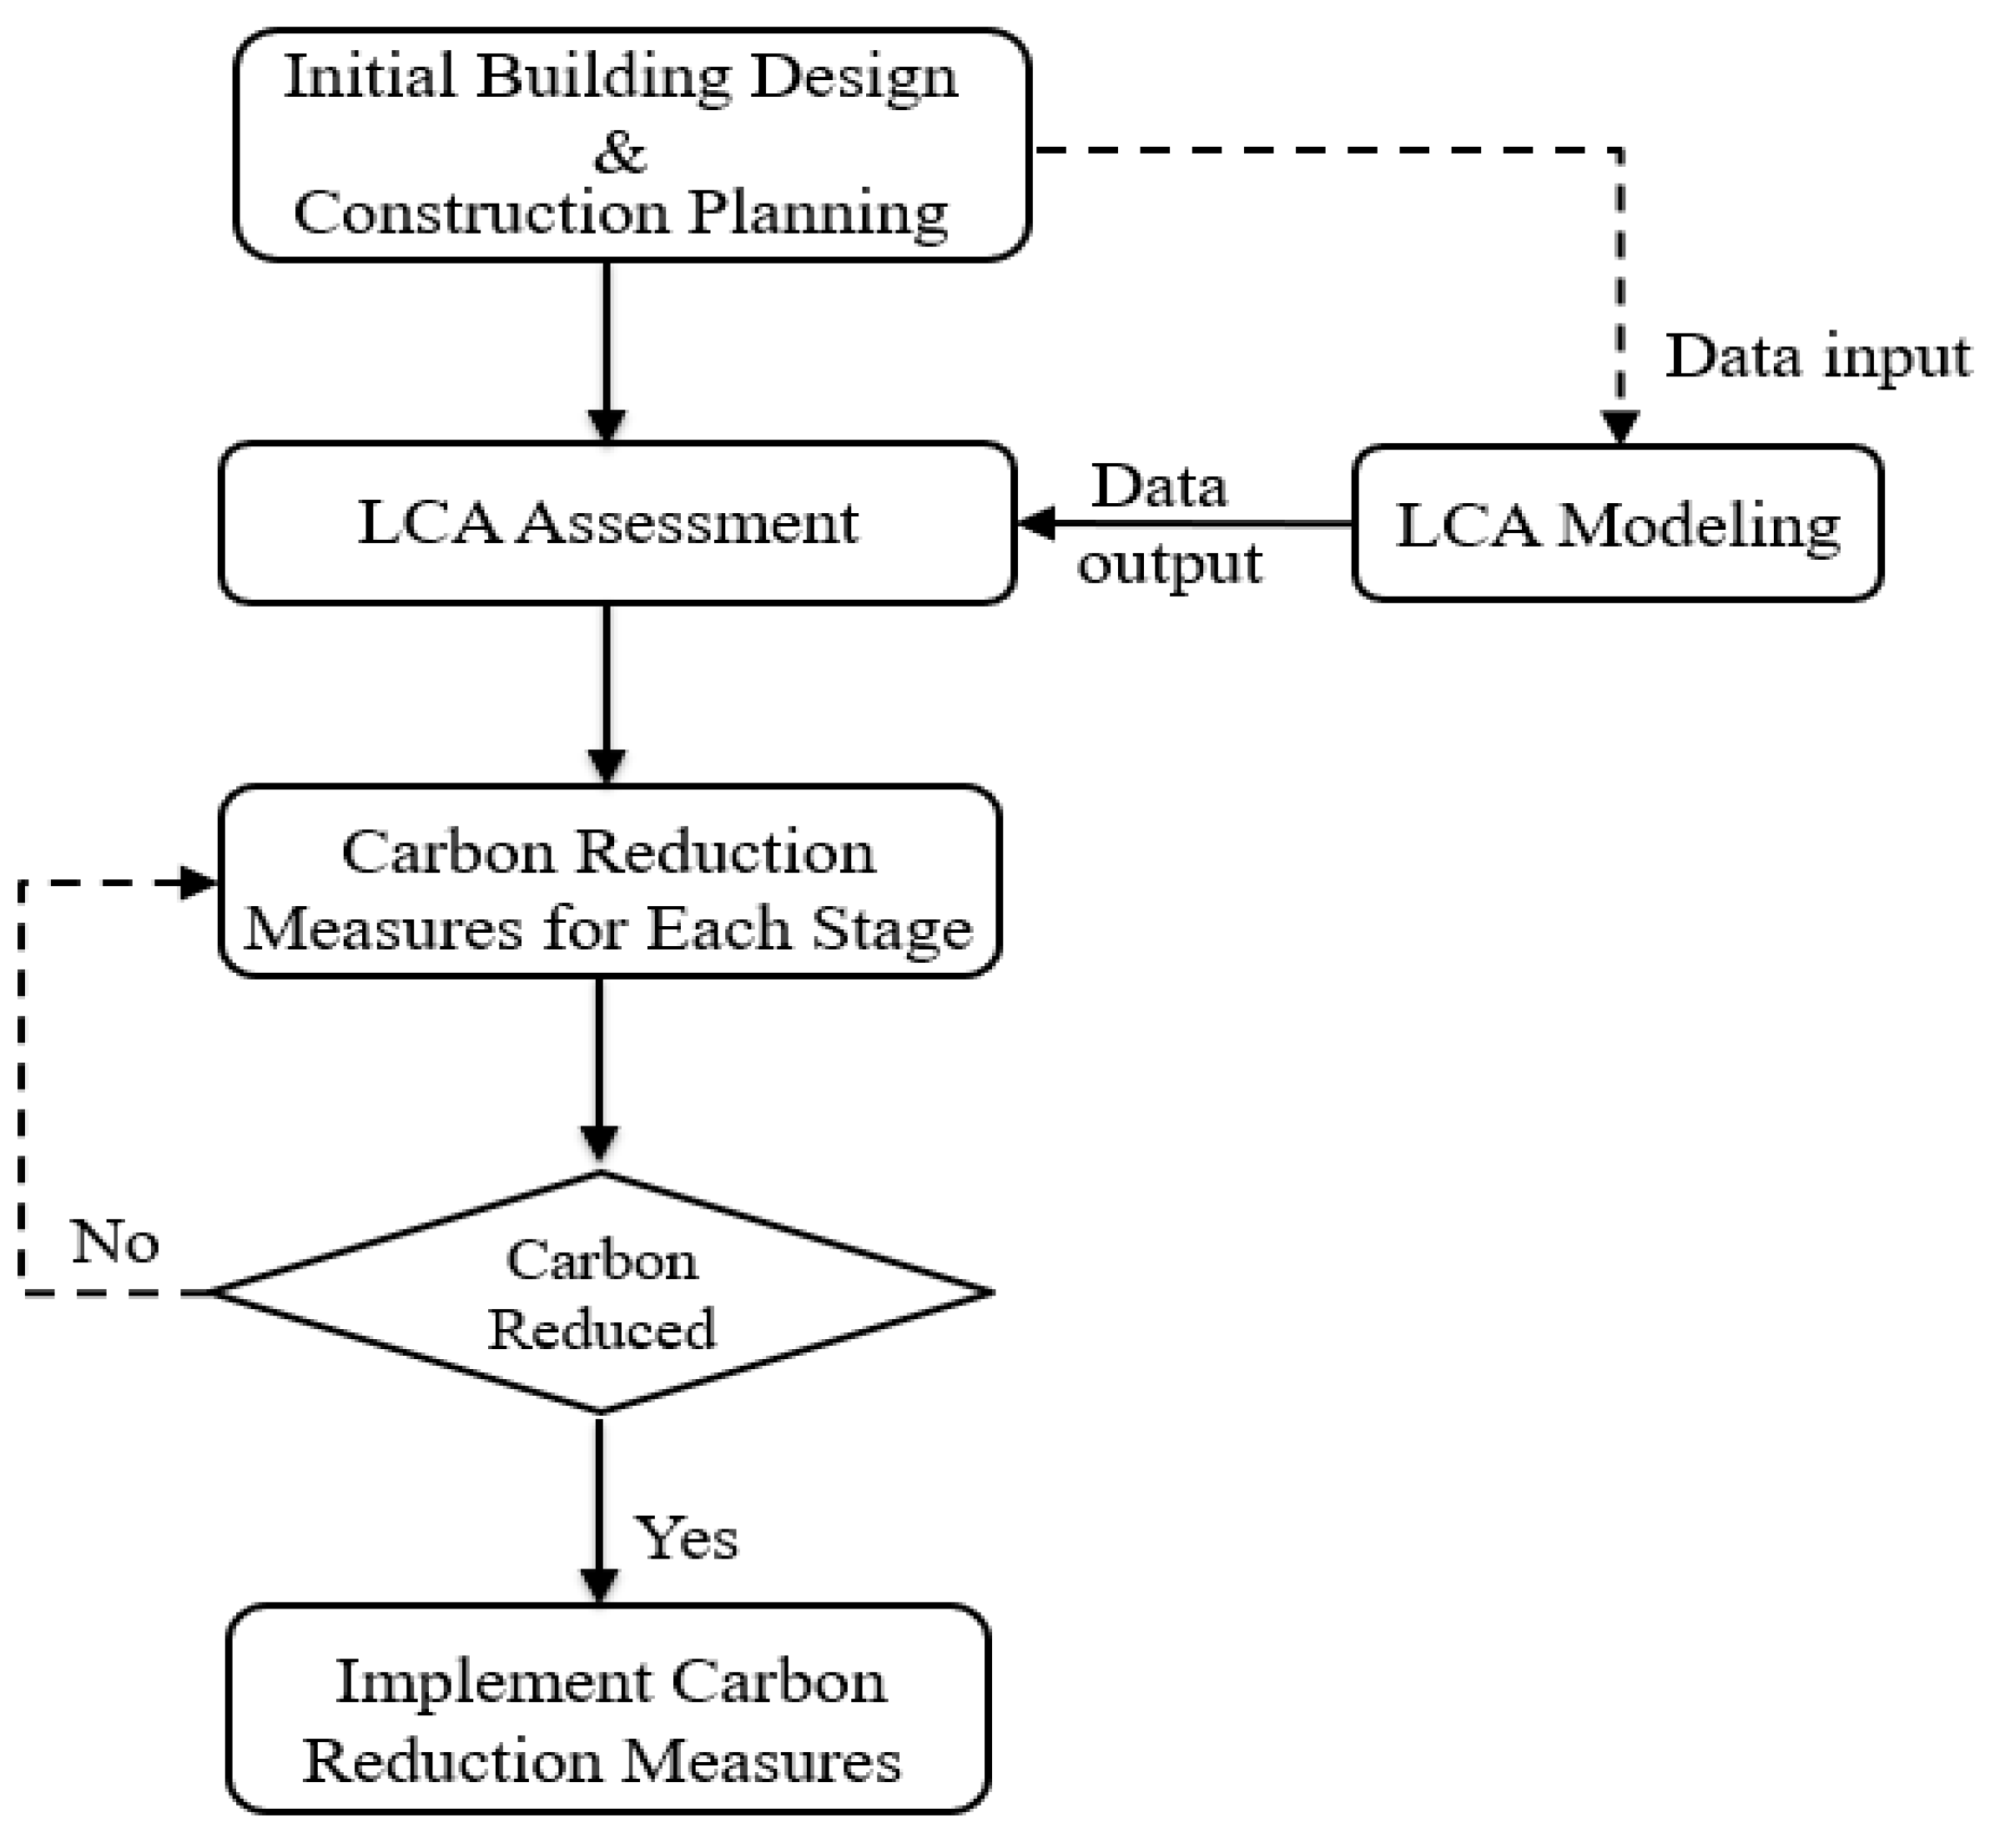
Figure 4.
Floor plan.
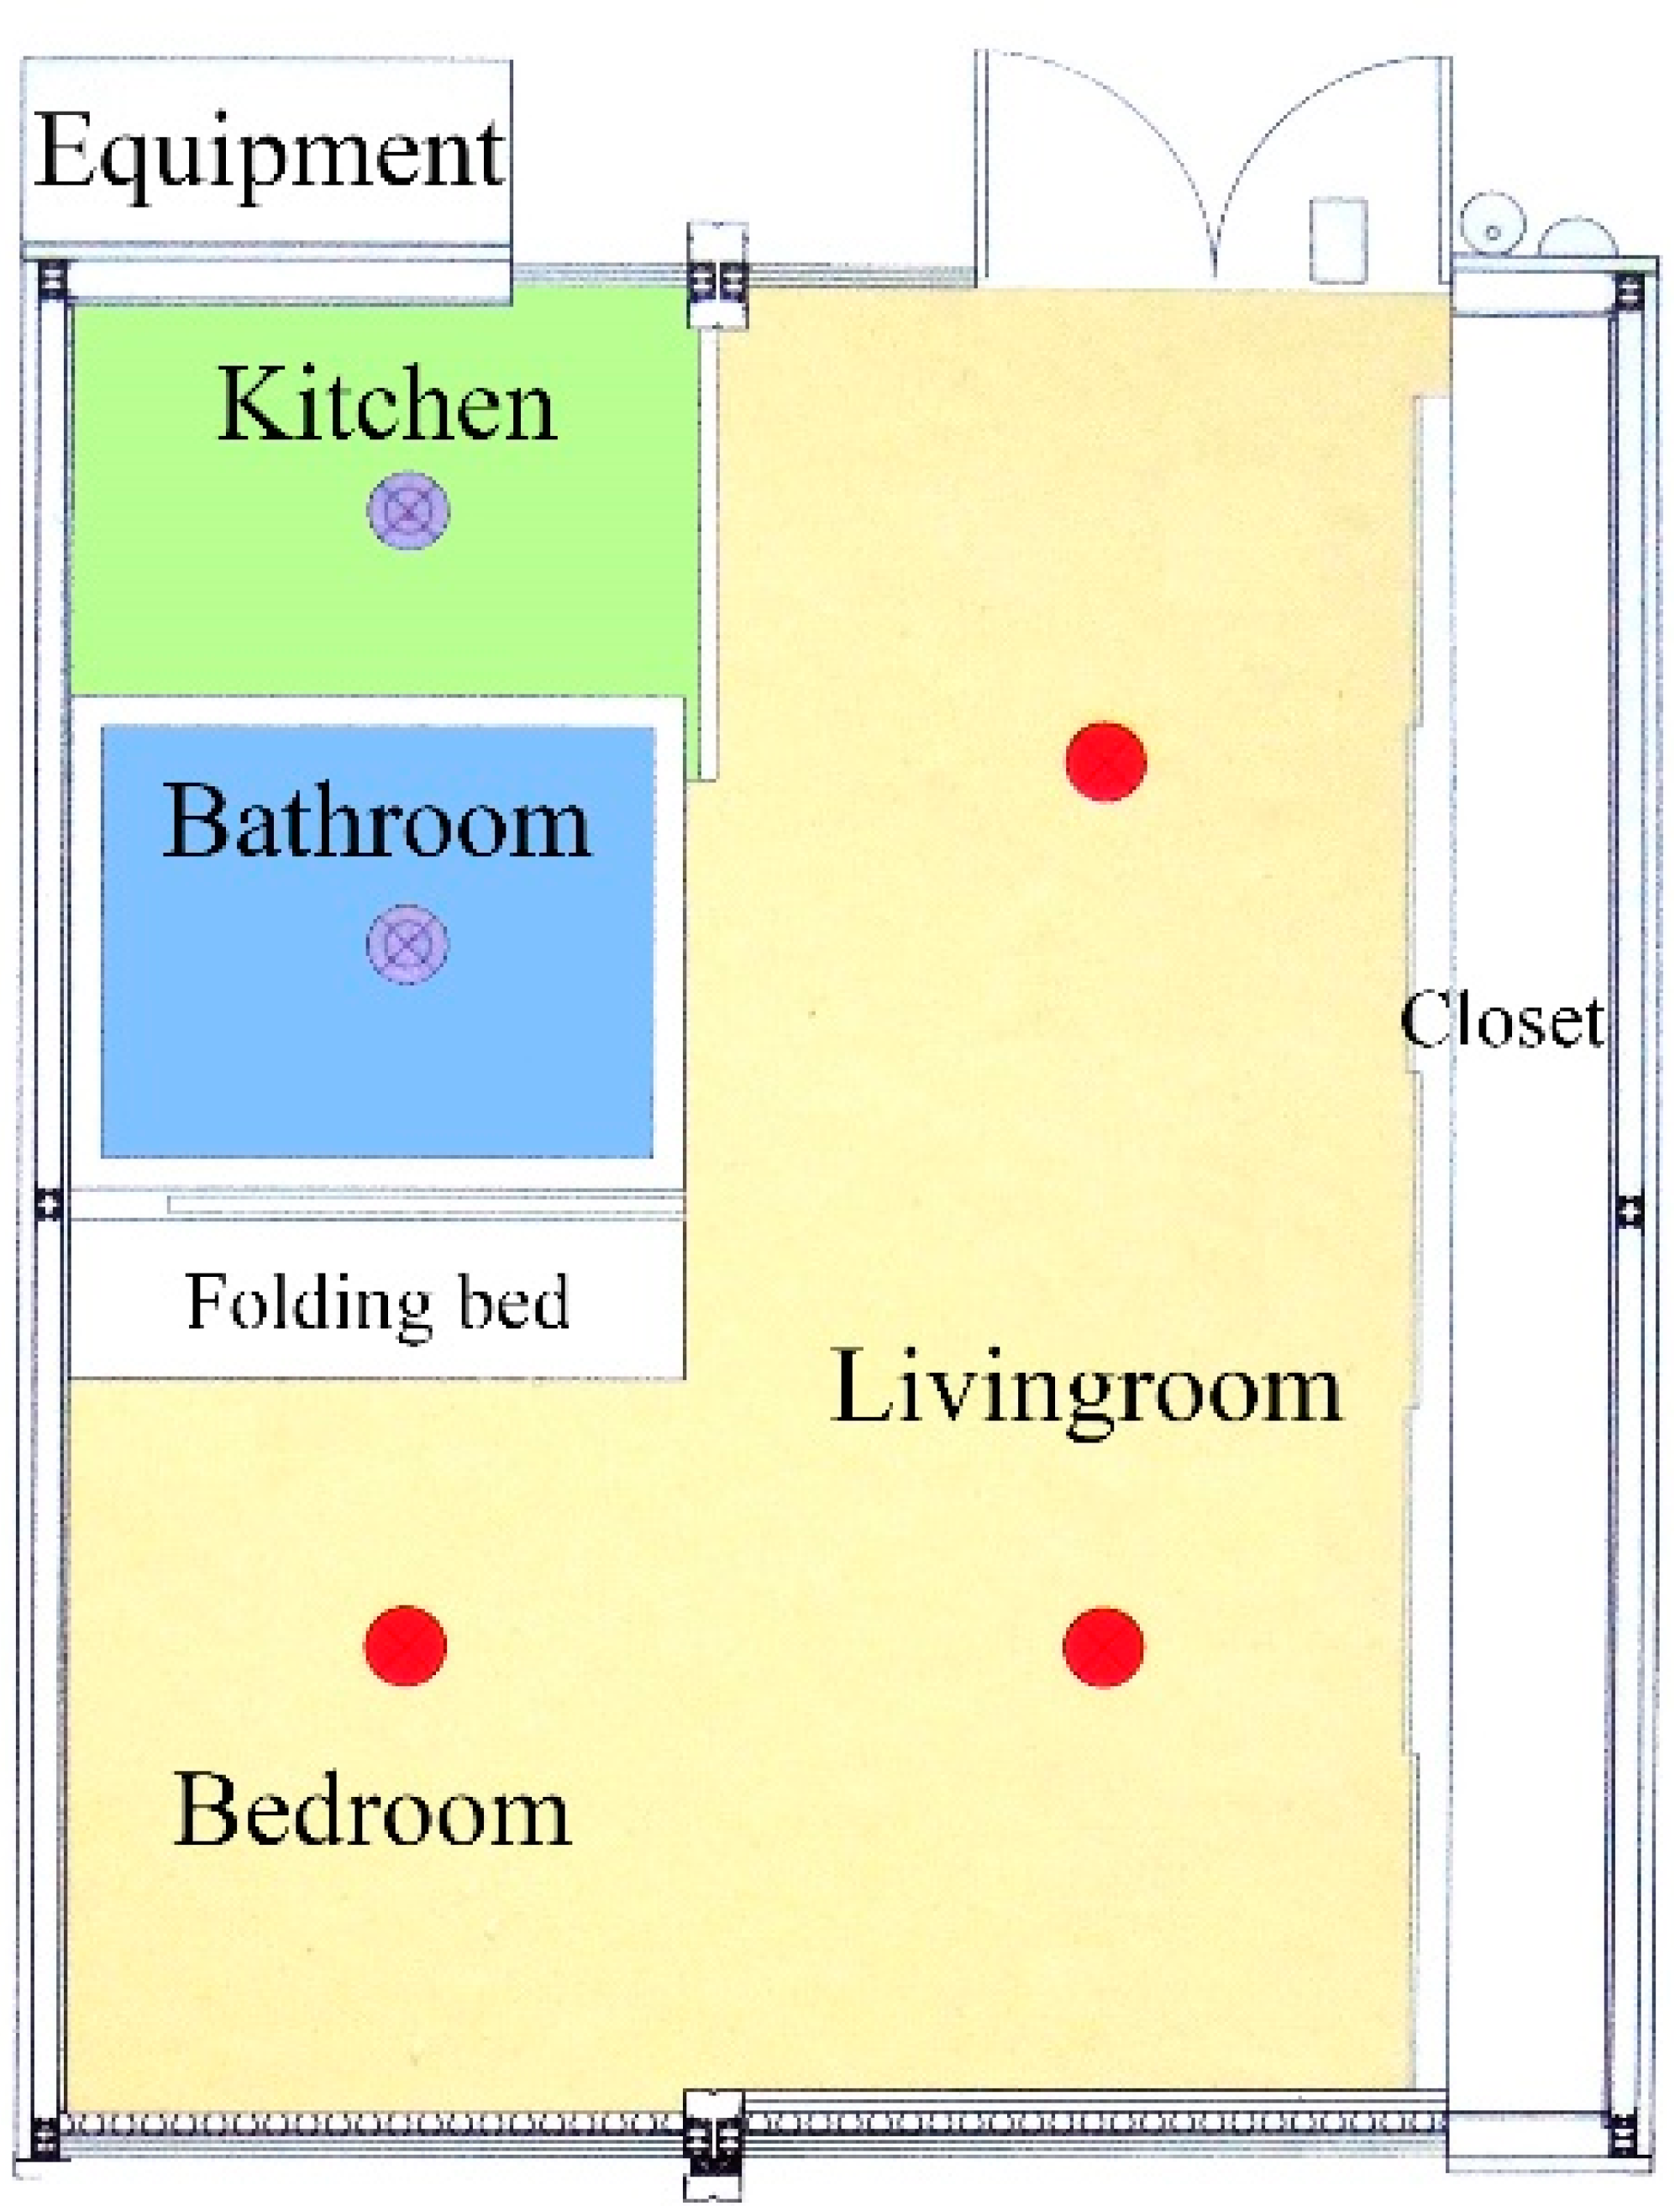
Figure 5.
Module design.
Figure 6.
Main Micro House components.

Figure 7.
Carbon emissions at various life cycle stages (i) of Micro House.
Figure 8.
Proportion of material consumption and carbon emissions of materials.

Figure 9.
Heating and cooling load vs. polyurethane board thickness.

Figure 10.
Comparison of computation results and verification results.

Table 1.
Specific data collection method for temporary housing. Life cycle assessment (LCA).
| LCA Phases | Existing Data | Case-Specific Data |
|---|---|---|
| Materials preparation | Basic construction materials | |
| Elements prefabrication | Common products | Custom products: manufacturing process, engineering quantity, unit power consumption. |
| Logistics | Energy resources | Transport tools, distance. |
| On-site assembly | Energy resources | Assembly tools, construction time. |
| Operations | Energy resources | Building function, power demands (e.g., for heating, cooling, and lighting), statistical working time. |
| Disposal | Energy resources | Demolition quantity, demolition tools, working time, factors of waste disposal (transportation, recycling, and reuse). |
Table 2.
Primary construction materials consumption.
| Material Type | Qty | Unit | Disposal Method |
|---|---|---|---|
| Aluminum | 3.87 | t | Ruse/Recycle |
| Steel | 0.47 | t | Ruse/Recycle |
| Concrete | 0.23 | m3 | Recycle |
| Wood | 3.54 | t | Reuse/Recycle |
| Glass | 0.31 | t | Reuse/Recycle |
| Polyurethane (PU) | 0.04 | t | Recycle |
| Rock wool | 0.80 | t | Recycle |
| Solar photovoltaic cell | 0.25 | t | Bury |
Table 3.
Main machinery equipment used in customized production process.
| Machinery Equipment Name | Type | Power Rate (Pv) | Energy Resource |
|---|---|---|---|
| Flame cutting machine | G01-30 | 0.82 × 10⁻³ (t/h) | Ethyne |
| Open-type inclinable press | J23-40 | 3.00 (kw) | Electricity |
| Aluminum welding machine | WSE315P | 0.09 (kw) | Electricity |
| Numeric control hydraulic pendulum shearing machine | QC12K-4 × 4000 | 7.50 (kw) | Electricity |
| Computer numerical control (CNC) hydraulic pendulum bending machine | WC67K-160T-6000 | 15.00 (kw) | Electricity |
| Electricity wrench | P18-FF-12 | 0.30 (kw) | Electricity |
| Electricity drill | J1Z-FF05-10A | 0.50 (kw) | Electricity |
Table 4.
Main machinery equipment used in transportation and site assembly phases.
| Machinery Equipment Name | Type | Power Rate (Pv) (kw) | Consumption Rate (Gv) [g/(kw·h)] | Fuel Consumption [(L/t·100 km)] |
|---|---|---|---|---|
| Forklift (diesel oil) | LG70DT | 81 | 231 | - |
| Crane truck (diesel oil) | QY8A | 105 | 200 | - |
| Truck (diesel oil) | Junchi 4800 | - | - | 28.6 |
Table 5.
Main simulation parameters.
| Type | Content | Detail Setting |
|---|---|---|
| Basic parameters | Location | Nanjing (dimension: 32°, longitude: 118.8°) |
| Meteorological data | “Energy Plus Energy Simulation Software—Weather Data—Nanjing_Jiangsu_CHN Design_Conditions” | |
| Simulation duration | 1/1–12/31 | |
| Simulation time-frequency | 4 times/h | |
| Interior load | People | 3 |
| Lighting | 8 W/m2 | |
| Electricity equipment power rate | 16 W/m2 | |
| Ventilation | 6 times/h | |
| Energy supply | Area of solar photovoltaic cell | 20 m2 (12 pieces) |
| Angle of solar photovoltaic cell | 7.5° | |
| Photo-electro transition rate | 18% | |
| Generation power | 2760 W (12 W × 230 W) |
Table 6.
Service life of main materials.
| Construction Element | Material | Service Life (Years) |
|---|---|---|
| Structure | Aluminum profile | 100 |
| Steel fastener | 100 | |
| Envelope | Aluminum sheets | 40 |
| Wooden boards | 30 | |
| Insulation | 40 | |
| Aluminum doors and windows | 60 | |
| Equipment | Solar photovoltaic cell | 20 |
| Platform | Wooden boards | 30 |
Table 7.
Long-life carbon emissions computation of the Micro House.
| Service Life | Material Embodied Emissions (Em) (t) | Prefabrication Emissions (Ep) (t) | Logistics Emissions (El) (t) | Assembly Emissions (Ea) (t) | Operation Emissions (Eo) (t) | Disposal Emissions (Ed) (t) | Total Emissions (ELPB-t) (t) | Annual Average Emissions (EOA) (kg·m−2·year−1) |
|---|---|---|---|---|---|---|---|---|
| 20 years | 23.26 | 0.04 | 0.79 | 0.13 | 3.42 | 0.91 | 28.55 | 35.7 |
| 40 years | 34.46 | 0.04 | 0.81 | 0.15 | 6.84 | 0.94 | 43.24 | 27.0 |
| Renovation of equipment: once | ||||||||
| 60 years | 47.20□ | 0.07□ | 0.97□ | 0.19 | 10.26□ | 1.18□ | 59.87□ | 24.9 |
| Renovation of envelope: once; Renovation of equipment: twice | ||||||||
| 100 years | 73.60 | 0.10 | 1.33 | 0.31 | 17.10 | 1.65 | 94.09 | 23.5 |
| Renovation of envelope: twice; Renovation of equipment: four times | ||||||||
Table 8.
The carbon reduction measures for materials.
| Primary Design | Implementation Plan | |
|---|---|---|
| Interior wall panel material consumption and carbon emissions | Aluminum (0.76 t) | Wood (2.06 t) |
| Carbon emissions (1.80 t) | Carbon emissions (0.41 t) | |
| Solar photovoltaic cells consumption and carbon emissions | 16 (pieces) | 12 (pieces) |
| Carbon emissions (14.93 t) | Carbon emissions (11.20 t) | |
| Total material embodied emissions (Em) | 28.38 t | 23.26 t |
Table 9.
The assembly process optimization at the design stage.
| Optimization Content | Initial Construction Plan (minutes) | Improved Construction Plan (minutes) |
|---|---|---|
| Foundation assembly | 30 | 20 |
| Interior wall panel connection | 45 | 25 |
| Module location and fixing | 60 | 30 |
| Working time of crane | 45 | 35 |
| Assembly emissions (Ea) | 0.15 t | 0.13 t |
Table 10.
Simulation results of energy consumption and energy generation during first year.
| Cooling Load | Heating Load | Lighting | Electrical Equipment | Total Energy Requirement | Solar Power Generation | |
|---|---|---|---|---|---|---|
| Energy consumption (kWh) | 2569.60 | 317.76 | 713.23 | 1363.27 | 2901.17 | 3154.37 |
| Carbon emissions (kg) | 577.3 | 1453.6 | 2030.8 | 2208.1 | ||
Table 11.
Comparison of carbon emissions with/without renewable energy systems.
| Proposal Type | Material Embodied Emissions (Em) (t) | Operation Emissions (Eo) (t) | Total Emission (ELPB-t) (t) |
|---|---|---|---|
| Proposal with solar photovoltaic system | 23.26 | 3.42 | 28.55 |
| Proposal without solar photovoltaic system | 12.06 | 40.62 | 57.87 |
© 2018 by the authors. Licensee MDPI, Basel, Switzerland. This article is an open access article distributed under the terms and conditions of the Creative Commons Attribution (CC BY) license (http://creativecommons.org/licenses/by/4.0/).
Share and Cite
MDPI and ACS Style
Dong, L.; Wang, Y.; Li, H.X.; Jiang, B.; Al-Hussein, M. Carbon Reduction Measures-Based LCA of Prefabricated Temporary Housing with Renewable Energy Systems. Sustainability 2018, 10, 718. https://doi.org/10.3390/su10030718
AMA Style
Dong L, Wang Y, Li HX, Jiang B, Al-Hussein M. Carbon Reduction Measures-Based LCA of Prefabricated Temporary Housing with Renewable Energy Systems. Sustainability. 2018; 10(3):718. https://doi.org/10.3390/su10030718
Chicago/Turabian StyleDong, Ling, Yu Wang, Hong Xian Li, Boya Jiang, and Mohamed Al-Hussein. 2018. "Carbon Reduction Measures-Based LCA of Prefabricated Temporary Housing with Renewable Energy Systems" Sustainability 10, no. 3: 718. https://doi.org/10.3390/su10030718
Note that from the first issue of 2016, this journal uses article numbers instead of page numbers. See further details here.