Linking Importance–Performance Analysis, Satisfaction, and Loyalty: A Study of Savannah, GA

Recreation, Parks, & Tourism Resources Program, School of Natural Resources, West Virginia University, Morgantown, WV 26506, USA
*
Author to whom correspondence should be addressed.
Sustainability 2018, 10(3), 704; https://doi.org/10.3390/su10030704
Submission received: 13 February 2018
/
Revised: 24 February 2018
/
Accepted: 1 March 2018
/
Published: 5 March 2018
(This article belongs to the Special Issue Sustainable Urban Tourism)
Abstract
:Importance–performance analysis (IPA) has been widely used to examine the relationship between importance, performance, and overall satisfaction in tourism destinations. IPA implicitly assumes that attribute performance will have little impact on overall satisfaction when stated importance is low. However, this assumption is rarely tested. This study, for the first time, tested this assumption by including attributes in each IPA quadrant into a second-order structural equation model. Results indicate that attributes with lower ratings of importance in the “low priority” and “potential overkill” quadrants do not contribute to overall satisfaction, regardless of performance, while the opposite is true for attributes in the “keep up the good work” quadrant with higher ratings of importance and performance, thus confirming the validity of this assumption. This novel approach allowed us to take a fresh look at an old debate, and the results suggest stated importance may be more useful than previously thought. Theoretical, methodological, and managerial implications are discussed.
1. Introduction
Although it is widely agreed that sustainability conceptually consists of three dimensions—environmental, social/cultural, and economic—it is argued that “sustainability cannot simply be a ‘green’ or ‘environmental’ concern, no matter how crucial those aspects of sustainability are” [1] (p. 1). Instead, more attention should be paid to other aspects of sustainability, including economic development and social justice. The economic development of a destination largely depends on having high quality tourism experiences and resulting satisfaction provided by the destination. Economically satisfied tourists are more likely to pay more, recommend others to the destination, and to visit again [2,3]. Thus, tourist satisfaction plays a crucial role in contributing to the success of a destination [4,5].
A tourism destination is usually composed of various attributes, involving accommodation, food, activities, shopping, and services, among others. It is the tourist’s perceptions of these attributes in a destination that interact to form a composite image of it [6], which affects his or her overall satisfaction. In most cases, it is very unlikely that a tourist will experience all attributes in a destination during a single trip. Moreover, attributes experienced may not be equally important [7]. For example, if a person’s main purpose to visit a destination is for snorkeling, then the opportunity to observe various and colorful marine life would be of high importance to him/her. Accordingly, the snorkeling experience would have a considerable impact on his/her overall satisfaction at the destination. In contrast, other attributes (e.g., sightseeing, hiking, etc.) that are not central to the main purpose of his/her trip may mean less in terms of their importance and performance [8]. Thus, an attribute in a destination may have different meanings for different tourists, and may not contribute equally to overall satisfaction. As a result, “determining the attributes of a product or service most important to overall quality, as perceived by consumers, is central to tourism, marketing and management” [9] (p. 295). It is also argued that “if visitors state that an attribute is ‘not at all important’ to their visits then performance of this attribute is expected to be irrelevant to their overall satisfaction” [9] (p. 296). Although attribute importance and performance, attribute-level satisfaction, and overall satisfaction have been extensively examined in the literature using Importance–Performance Analysis (IPA), few, if any, have attempted to link IPA with overall satisfaction in a structural equation model (SEM) or regression analysis—the two most commonly used statistical methods in the field of tourism satisfaction studies—to test relationships between attributes in each IPA quadrant with overall satisfaction. It should be noted that IPA implies that “attribute performance will have little influence on overall satisfaction when self-stated importance is low” [9] (p. 296). However, “this assumption is rarely tested in the literature and yet without confirmation of the validity of this assumption management should interpret conclusions based on IPA with caution” [9] (p. 296). To fill this research gap, this study aims to use the attributes in each IPA quadrant as observed variables in SEM to test the assumption that “overall satisfaction will be influenced less by attribute performance when the self-stated importance of the attribute is low” [9] (p. 303).
While SEM has been widely used in the fields of hospitality and tourism, advanced SEM techniques, such as higher-order modeling, remain scant [10]. It is argued that higher-order modeling (e.g., a second-order construct) has advantage over first-order modeling if several first-order constructs can be meaningfully conceptualized at a higher-order of abstraction, in that a higher-order modeling can increase the model fit and “recognize the contribution and retain the idiosyncratic nature of each first-order construct” [10] (p. 635). For this reason, second-order modelling was used for this study.
We begin with a review of literature on IPA, the relationships between importance, performance, and satisfaction, and the relationship between satisfaction and loyalty. This review lays the foundation for the development of five hypotheses. We then describe the methods used and present and discuss findings from the data analysis. Finally, implications for theory and practice are discussed.
2. Literature Review
2.1. Importance–Performance Analysis
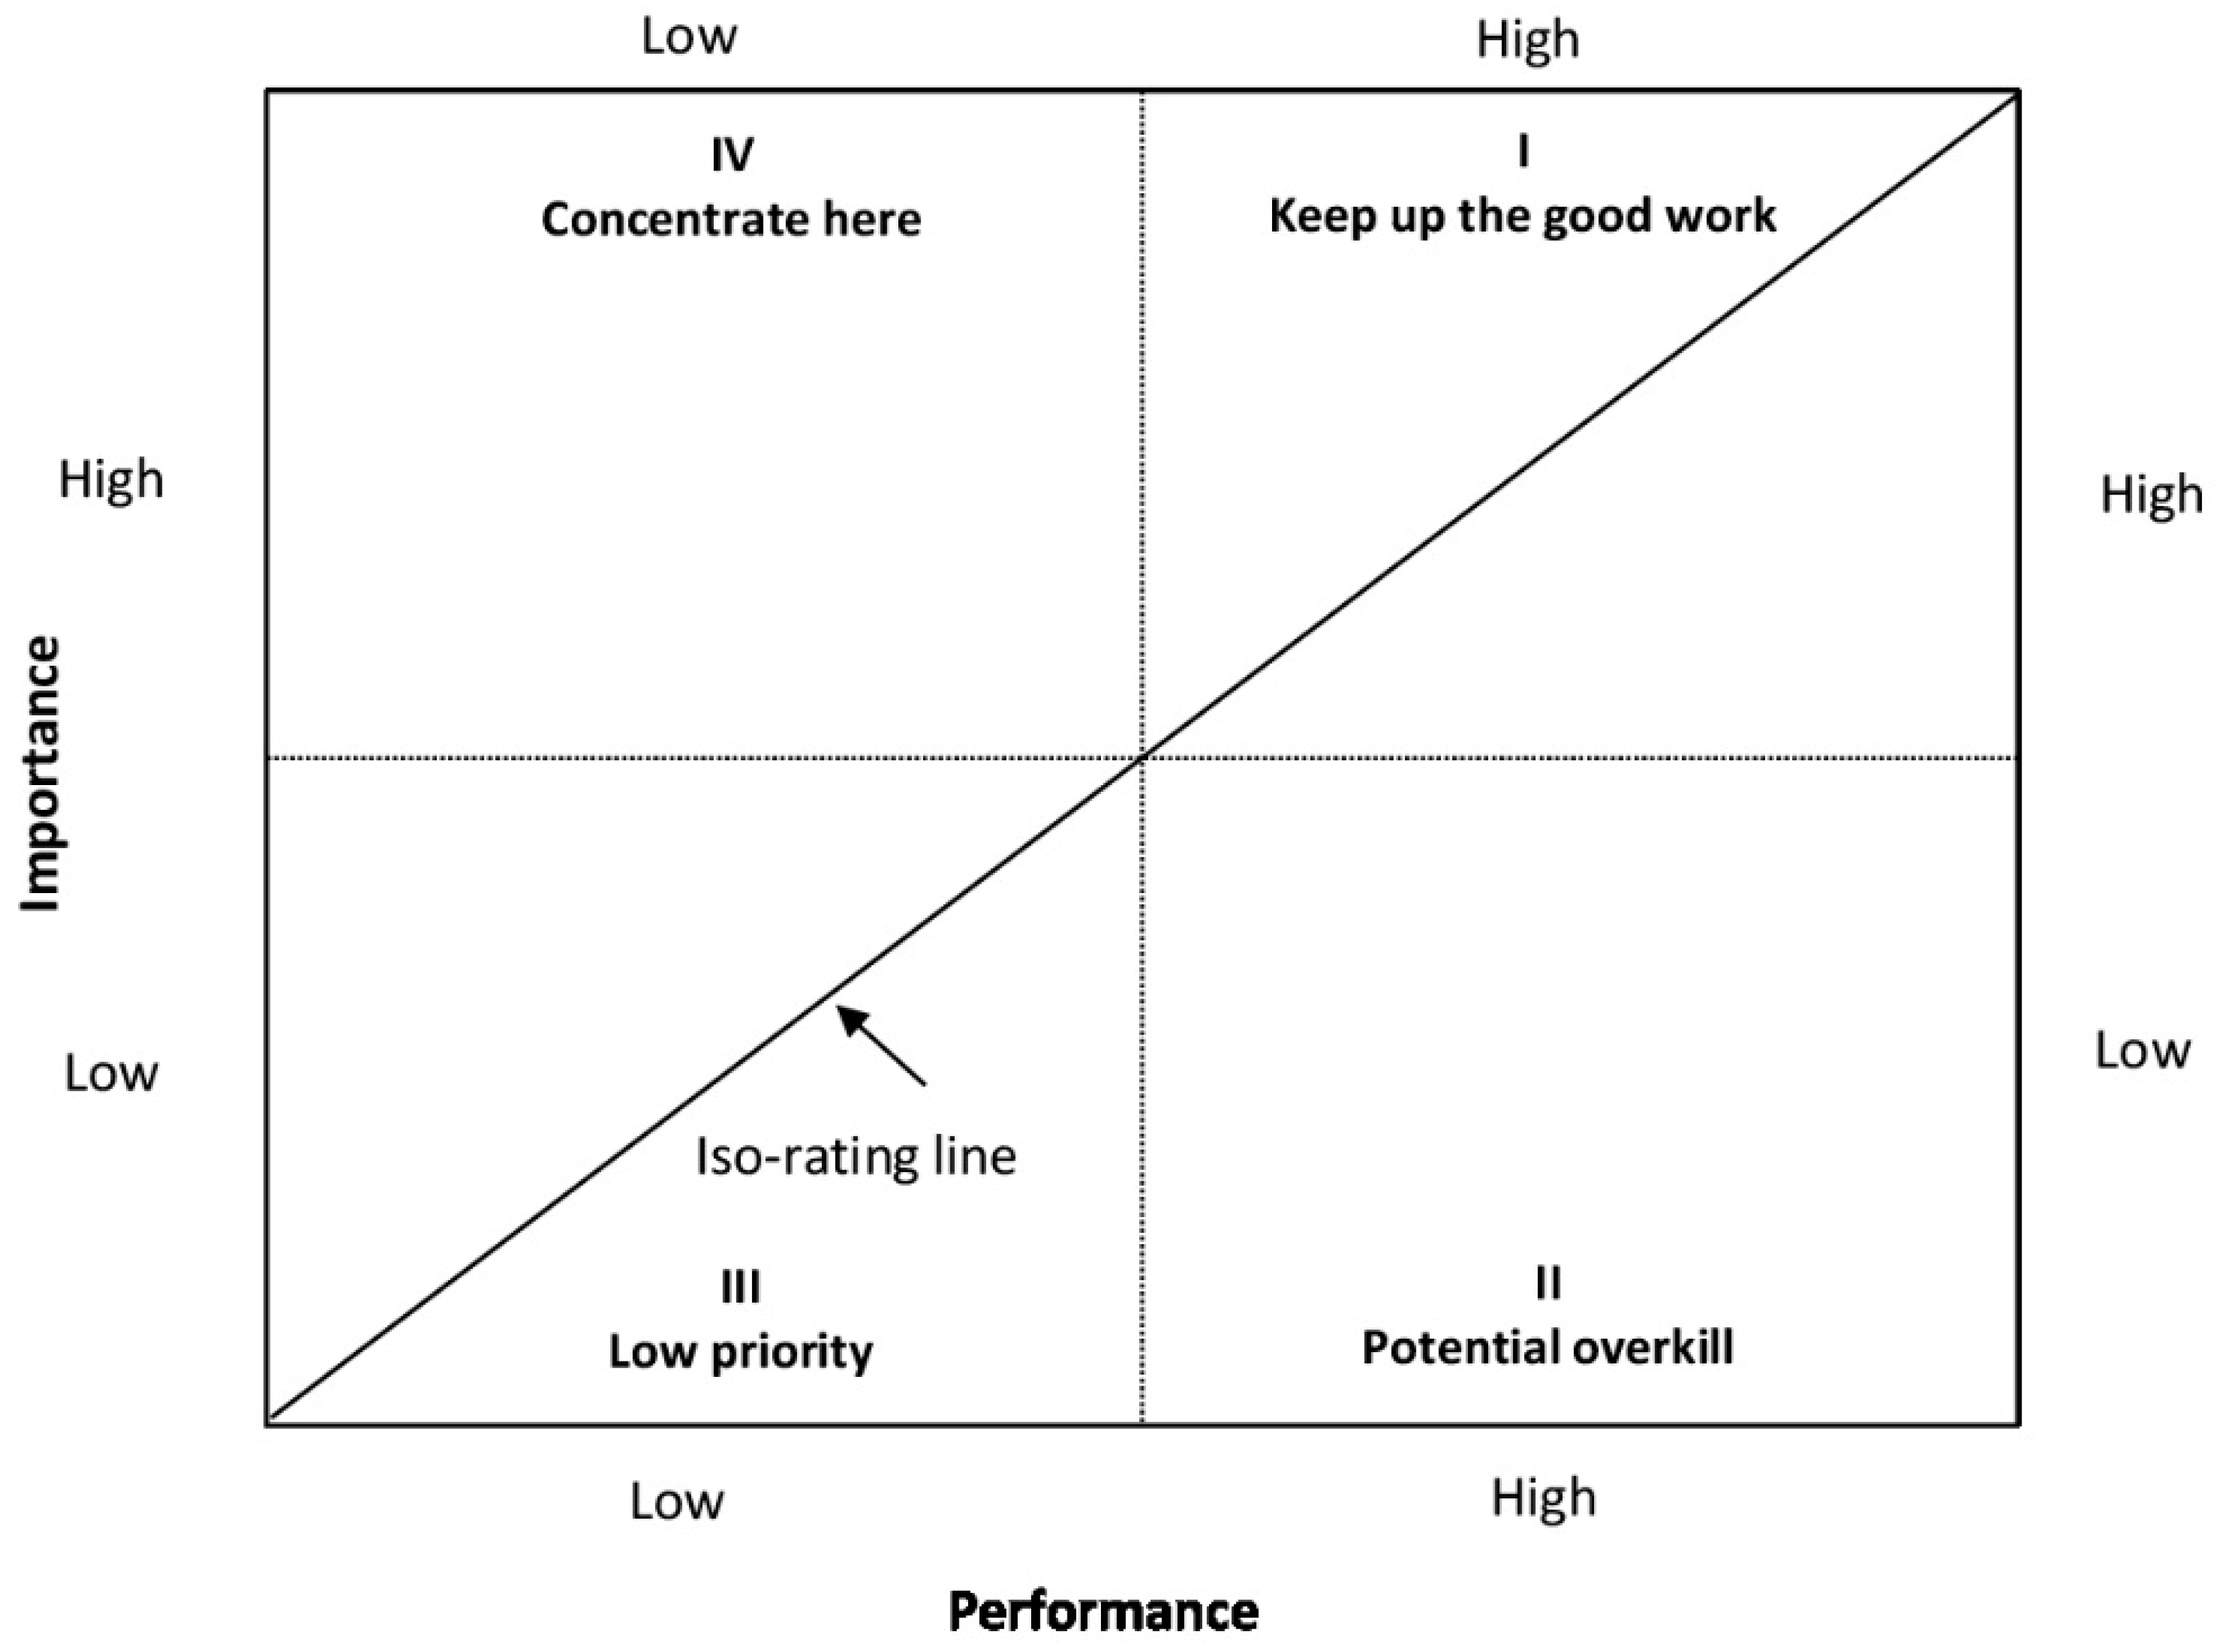
The IPA framework was introduced in marketing research to understand customers’ satisfaction by matching their perceptions toward attribute importance and performance [11]. Importance and performance ratings are displayed on a two-dimensional grid, and fall into one of four quadrants—“keep up the good work”, “potential overkill”, “low priority” and “concentrate here” (Figure 1). Another classification approach is to insert an upward 45° diagonal line (i.e., iso-rating or iso-priority line) to identify management priorities. Items on the line imply that performance equals importance, while items above the line indicate that performance fails to meet importance and thus requires improvement [12,13].
The use of the IPA has suffered criticism. One controversial issue is where the intersecting lines or crosshairs should be positioned [14,15,16]. The two commonly used approaches are scale-centered and data-centered, whereas the scale middle is used [17,18,19,20] for the former, and the average of all importance or performance ratings is used [21,22,23,24,25,26,27] for the latter. Relatively, “the majority of researchers use the mean values of actual importance and performance ratings when specifying the thresholds” [15] (p. 45). This study followed this approach with a slight modification [28], wherein the mean of the mean differences (0, 0), instead of the original ratings, was used as the crosshairs. If Excel or SPSS is used, all points will be automatically and effectively positioned in the IPA grid, with the crosshairs being positioned as (0, 0) and the iso-rating line positioned diagonally through the origin (0, 0) [28]. Data-centered methods have been used in a number of studies measuring satisfaction in the field of tourism studies [29,30,31,32,33].
Another controversial issue is the use of stated or absolute importance directly obtained from tourists vs. derived importance indirectly obtained from statistical methods (i.e., multiple regression analysis [9,34]; partial correlation analysis [22,23]; and simple regression analysis [35,36,37]). Although the use of the derived importance has advantages over the stated importance (i.e., reduced social desirability bias and fatigue bias [37,38]), this approach is not without limitations. Apart from the possible multicollinearity issue among attributes [39], some multiple regression analyses or partial correlation analyses may generate negative coefficients which “violates the positive relationship between service attributes and overall satisfaction in practice” [37] (p. 456). Although this indirect approach has gained popularity among some researchers, it is found that the stated importance is more robust than the derived importance in predicting overall satisfaction [9,40] and brand choice [41]. Thus, for the purpose of this study, stated importance was used.
Although there are some methodological limitations with the IPA in terms of its validity and reliability, the method has been widely used to measure product and service quality because of its simplicity, intuitiveness, and effectiveness [42]. While the IPA was initially designed as a market technique to elucidate management strategies of a business, its application has extended to many areas of services industries, including hospitality and tourism [15], wherein tourists’ satisfaction at the attribute level is examined along with attribute importance and performance.
2.2. Importance, Performance, and Satisfaction
Satisfaction is defined as “a judgement that a product or service feature, or the product or service itself, provides a pleasurable level of consumption-related fulfilment” [43] (p. 13). Satisfaction has been viewed as an outcome of a mental process where the perceived performance of a product or service is compared with various standards (e.g., expectations). How satisfied an individual is largely depends on whether his/her perceived performance exceeds or equals expectations, or not. An individual feels satisfied if positive disconfirmation (i.e., performance exceeds expectations) occurs, while negative disconfirmation (i.e., performance fails to meet expectations) results in dissatisfaction. There are two methods for measuring disconfirmation: inferred measure and direct measure [44]. In an inferred measure, “the score for the measured standard of comparison is subtracted from the score for perceptions” while a direct measure directly asks the consumer to indicate on a Likert scale about his/her expectations being “better than expected” or “worse than expected” [44] (p. 121).
In most cases, expectations are measured before the purchase/consumption of a product/service, while service quality and satisfaction are measured on site [44]. However, it is not realistic to obtain people’s expectations before leaving for a destination, nor it is accurate to assess their expectations on site by asking them to recall what they expected before leaving [31]. Alternatively, much of the research has chosen to measure attribute importance and performance and then examine the extent to which these two measures correlate with the attribute-level satisfaction or overall satisfaction [4,9,45,46]. However, some have used perceived performance or quality of service as a priori to measure satisfaction [9,31], although these constructs are conceptually different [45].
It is suggested that importance and expectations are potential antecedents to performance [11]. In other words, attribute performance could be directly influenced by attribute importance. Some argue that importance is positively related to performance [14]. Previous studies have found that both importance and performance have significant effects on overall satisfaction. For example, it is found that both importance and performance significantly and directly contribute to satisfaction; the impact of performance, however, is more significant than importance [4]. Moreover, importance indirectly impacts satisfaction via its impact on performance. A study [47] measured service quality in several types of tourism businesses, finding that the mean perception of performance scores is a good or better evaluation of perceived service quality than the computed quality score of perceptions minus expectations. Similar findings have also been reported in several other studies [48,49]. Performance was also found to be a better predictor of the service quality than importance and other predictors [45] (e.g., expectations, importance times expectations, importance minus performance, importance times performance, performance minus expectations, and importance times the difference between performance and expectations), although these predictors are also significantly and positively related to the overall measure of quality.
Contrary to these findings on performance being more significant than importance in predicting overall satisfaction, a study [50] in Australia involving visits to various aspects of aboriginal culture suggested that attribute importance determined satisfaction ratings. Another study [51] tested the relationship between product categories, product attributes, and satisfaction for shopping, finding that product attribute importance and satisfaction were significantly correlated for Japanese tourists visiting Hawaii. It is argued that importance and performance are interdependent and cannot be separately treated when overall satisfaction is examined, based on the rationale that “overall satisfaction will be influenced less by attribute performance when the self-stated importance of the attribute is low” [9] (p. 303). In other words, the performance of an attribute, regardless of its quality, may not affect a tourist’s overall satisfaction if the tourist did not experience or did not care too much about the attribute, while the opposite would be true for attributes with high levels of importance and performance. This assumption leads to the following four hypotheses:
Hypothesis 1 (H1).
Attributes in the “keep up the good work” quadrant will significantly and positively contribute to overall satisfaction.
Hypothesis 2 (H2).
Attributes in the “concentrate here” quadrant will significantly and negatively predict overall satisfaction.
Hypothesis 3 (H3).
Attributes in the “low priority” quadrant will not contribute to overall satisfaction.
Hypothesis 4 (H4).
Attributes in the “potential overkill” quadrant will not contribute to overall satisfaction.
2.3. Satisfaction and Loyalty
Loyalty, in the marketing literature, has been defined in three dimensions: attitudinal, behavioral intention, and actual behavior [52]. Attitudinal loyalty refers to expressed liking for a destination/establishment or festival/event without overt intentions, while behavioral intention is defined by intention to revisit, recommend, and say positive things about a person’s experience. In addition, willingness to pay more and likelihood to switch are also included in some studies to measure behavioral intention [53,54]. Finally, behavior loyalty refers to the actual purchase of a product/service (e.g., proportion of nights/visitors/dollars spent at a particular brand or property, frequency of visits, and actual patronization of a destination) [52].
Satisfaction is considered a necessary step towards the formation of loyalty [55]. The relationship between satisfaction and loyalty has been measured in numerous studies on festivals [56], hospitality [53], and tourism [57]. A strong positive relationship between satisfaction and loyalty was found in a meta-analysis of festival literature [56]. This positive relationship was also found in another meta-analysis of hospitality literature [52] and in most other individual studies on tourism destinations [58]. Thus, the following hypothesis is proposed:
Hypothesis 5 (H5).
Overall satisfaction will significantly and positively predict loyalty.
3. Methods
3.1. Study Area
The city of Savannah, Georgia, USA (our study location), is located at 32°3′3″N, 81°6′14″W. With a total area of 202.3 km2, it is the largest city in Chatham County and the fourth largest city in Georgia. In 2015, it had an estimated population of 145,674 [59].
Savannah (founded in 1733) is internationally known as the first planned city in the US. The size of the downtown area is among the largest National Historic Landmark Districts in the country and is abundant in cultural and historical attractions. The downtown area has unique architecture and historic buildings in addition to its nature-based attractions, such as coastal islands, botanical gardens, and city parks. It is famous for its 22 nature-dominated and parklike public squares that contain woods and gardens. Savannah’s city plan is organized around the squares which are the main components of the city’s urban forests.
The unique and elegant architecture, fountains, ornate ironwork, and green squares have been a major interest for over 50 million visitors in the last 10 years [60]. In 2014, more than 13.4 million people visited the city. Of those visitors, 7.6 million were overnight tourists and 5.8 million were day-trippers [61]. Savannah offers a variety of tourism attractions and visitors’ activities (e.g., city trolley and carriage tours around the public squares and architecture, boating along the Savannah River, dinning in restaurants, shopping antique and souvenir stores, attending guided night walks, and attending festivals and special events).
3.2. Data Collection
The study used a convenient sample of visitors walking in the Rousakis Plaza/River Street, a popular attraction in the city. A convenience sampling method is used to collect a nonprobability sample and has been widely used by “almost all of the major public opinion polling groups, political polling groups, and market research organization” [62] (p. 49). Study participants (aged 18 years or older) were asked to complete an on-site questionnaire consisting of visitors’ trip characteristics, perceptions of tourism attributes (i.e., importance, performance, and satisfaction), overall satisfaction, and loyalty. Savannah’s Park and Tree Department, the Savannah Visitor Information Center, and other project collaborators helped to develop the study instrument. Sampling took place from July 2008 to August 2009.
3.3. Measurement
Visitors’ perceptions of attribute importance, performance, and satisfaction were measured by 23 items on a 7-point Likert scale (1 = the least important, 7 = the most important for importance; 1 = strongly disagree, 7 = strongly agree for performance; and 1 = extremely dissatisfied, 7 = extremely satisfied for attribute-level satisfaction and overall satisfaction). Likewise, destination loyalty (i.e., behavioral intention) was also measured on a 7-point Likert scale (1 = strongly disagree, 7 = strongly agree). Visitors were also asked to provide information on their socio-demographics (i.e., gender, age, education, occupation, and residency) and trip characteristics (i.e., lengths of stay, frequency of visits, group size, and expenditures). Finally, they were asked to provide comments in an open-ended question about the study and tourism in the city.
3.4. Data Analysis
The expectation–maximization algorithm [63] was used to replace missing data before conducting data analyses. A total of 36 questionnaires were excluded from the 640 returned questionnaires due to systematic incomplete responses or responses with skeptical patterns. This reduced the sample size to 604 for further analysis. After the screening, the missing rate was less than 5% for all variables, which is inconsequential [64].
In addition, data skewness and kurtosis for observed variables were also tested. If absolute values of univariate skewness and univariate kurtosis for a sample are within 2 and 3, respectively, the data can be considered not to “extremely” deviate from the normal distribution [65]. The normality assessment indicated that the absolute values of all endogenous variables met the criteria, except for the four loyalty items, whose skewness values met the criteria of less than 2, but kurtosis values were greater than 3, ranging from 3.6 to 5.3, resulting in a moderate violation of normality. To correct this non-normality issue, the maximum likelihood bootstrapping technique with 10,000 bootstraps was used [66].
Data analyses consisted of four steps. First, gap analysis was conducted using pairwise t-tests to examine the extent to which perceptions of importance and performance matched one another. Second, IPA was conducted with attributes being graphically displayed on the I-P grids. Third, factor analysis was also conducted for the five items measuring loyalty, and for the attributes in each quadrant. Finally, SEM was analyzed to test the five proposed hypotheses.
For the factor analysis, principal components analysis was conducted to obtain latent variables. The varimax rotation and eigenvalues of 1.00 or more were used to identify potential factors. The appropriateness of the data for factory analysis was tested using the Kaiser–Meyer–Olkin (KMO) measure of sampling adequacy and Bartlett’s test of sphericity. A cut-off point of 0.45 was used to select items for a factor [67]. Cronbach’s alpha coefficients were calculated to estimate the reliability of factors. Although a Cronbach’s alpha value of 0.70 [68] is commonly accepted for measuring a scale’s reliability, it is also acceptable to have a lower value of 0.60 in exploratory studies and in research in the social sciences and psychology [69,70].
In a SEM analysis, if p > 0.05, the model is acceptable. However, a p-value is usually less than 0.05 due to the χ2 value being sensitive to sample size as well as model complexity. This would lead to a well-fitting model being rejected if judged by this criterion [71]. Alternatively, a ratio of χ2/df as high as 5 was used to assess a model fit [72].
Several other indices, such as RMSEA (Root Mean Square Error of Approximation), CFI (Comparative Fit Index), IFI (Incremental Fit Index), NFI (Normed-Fit Index), RFI (Relative Fit Index), and TLI (the Tucker–Lewis Index) have also been used in the literature to judge a model fit. A RMSEA value ranging from 0.05 to 0.10 indicates a fair fit [73], while 0.90 is commonly used as the cut-off criterion for CFI, IFI, NFI, RFI, and TLI. However, 0.95 has also been recommended as the threshold for a better fit [74].
4. Results
4.1. Sample Characteristics
In total, 1219 visitors were approached, with 640 agreeing to fill the questionnaire, resulting in a response rate of 52.5%. The majority of respondents were females (57.0%), aged 26 to 54 (47.3%), well educated, and affluent. Most of respondents (66.2%) had visited the city at least once prior to the current trip. In addition, the average group size was 3.22 persons and the length of stay was 2.77 days.
4.2. Gap Analysis
Table 1 presents the paired-sample t-tests for mean differences between performance and importance. Attribute satisfaction is also presented in the table. As shown, the mean values for importance, performance, and attribute satisfaction were 5.73, 5.60, and 5.64, respectively. The mean for overall satisfaction was 6.04. “Personal safety and security” had the highest rating on importance (M = 6.31), while the item “attractive architecture/buildings” was rated highest on performance (M = 6.28) and satisfaction (M = 6.27). In contrast, “good night-life/entertainment” was rated lowest on importance (M = 4.83), and “parking availability” was rated lowest on both performance (M = 4.14) and satisfaction (M = 4.25).
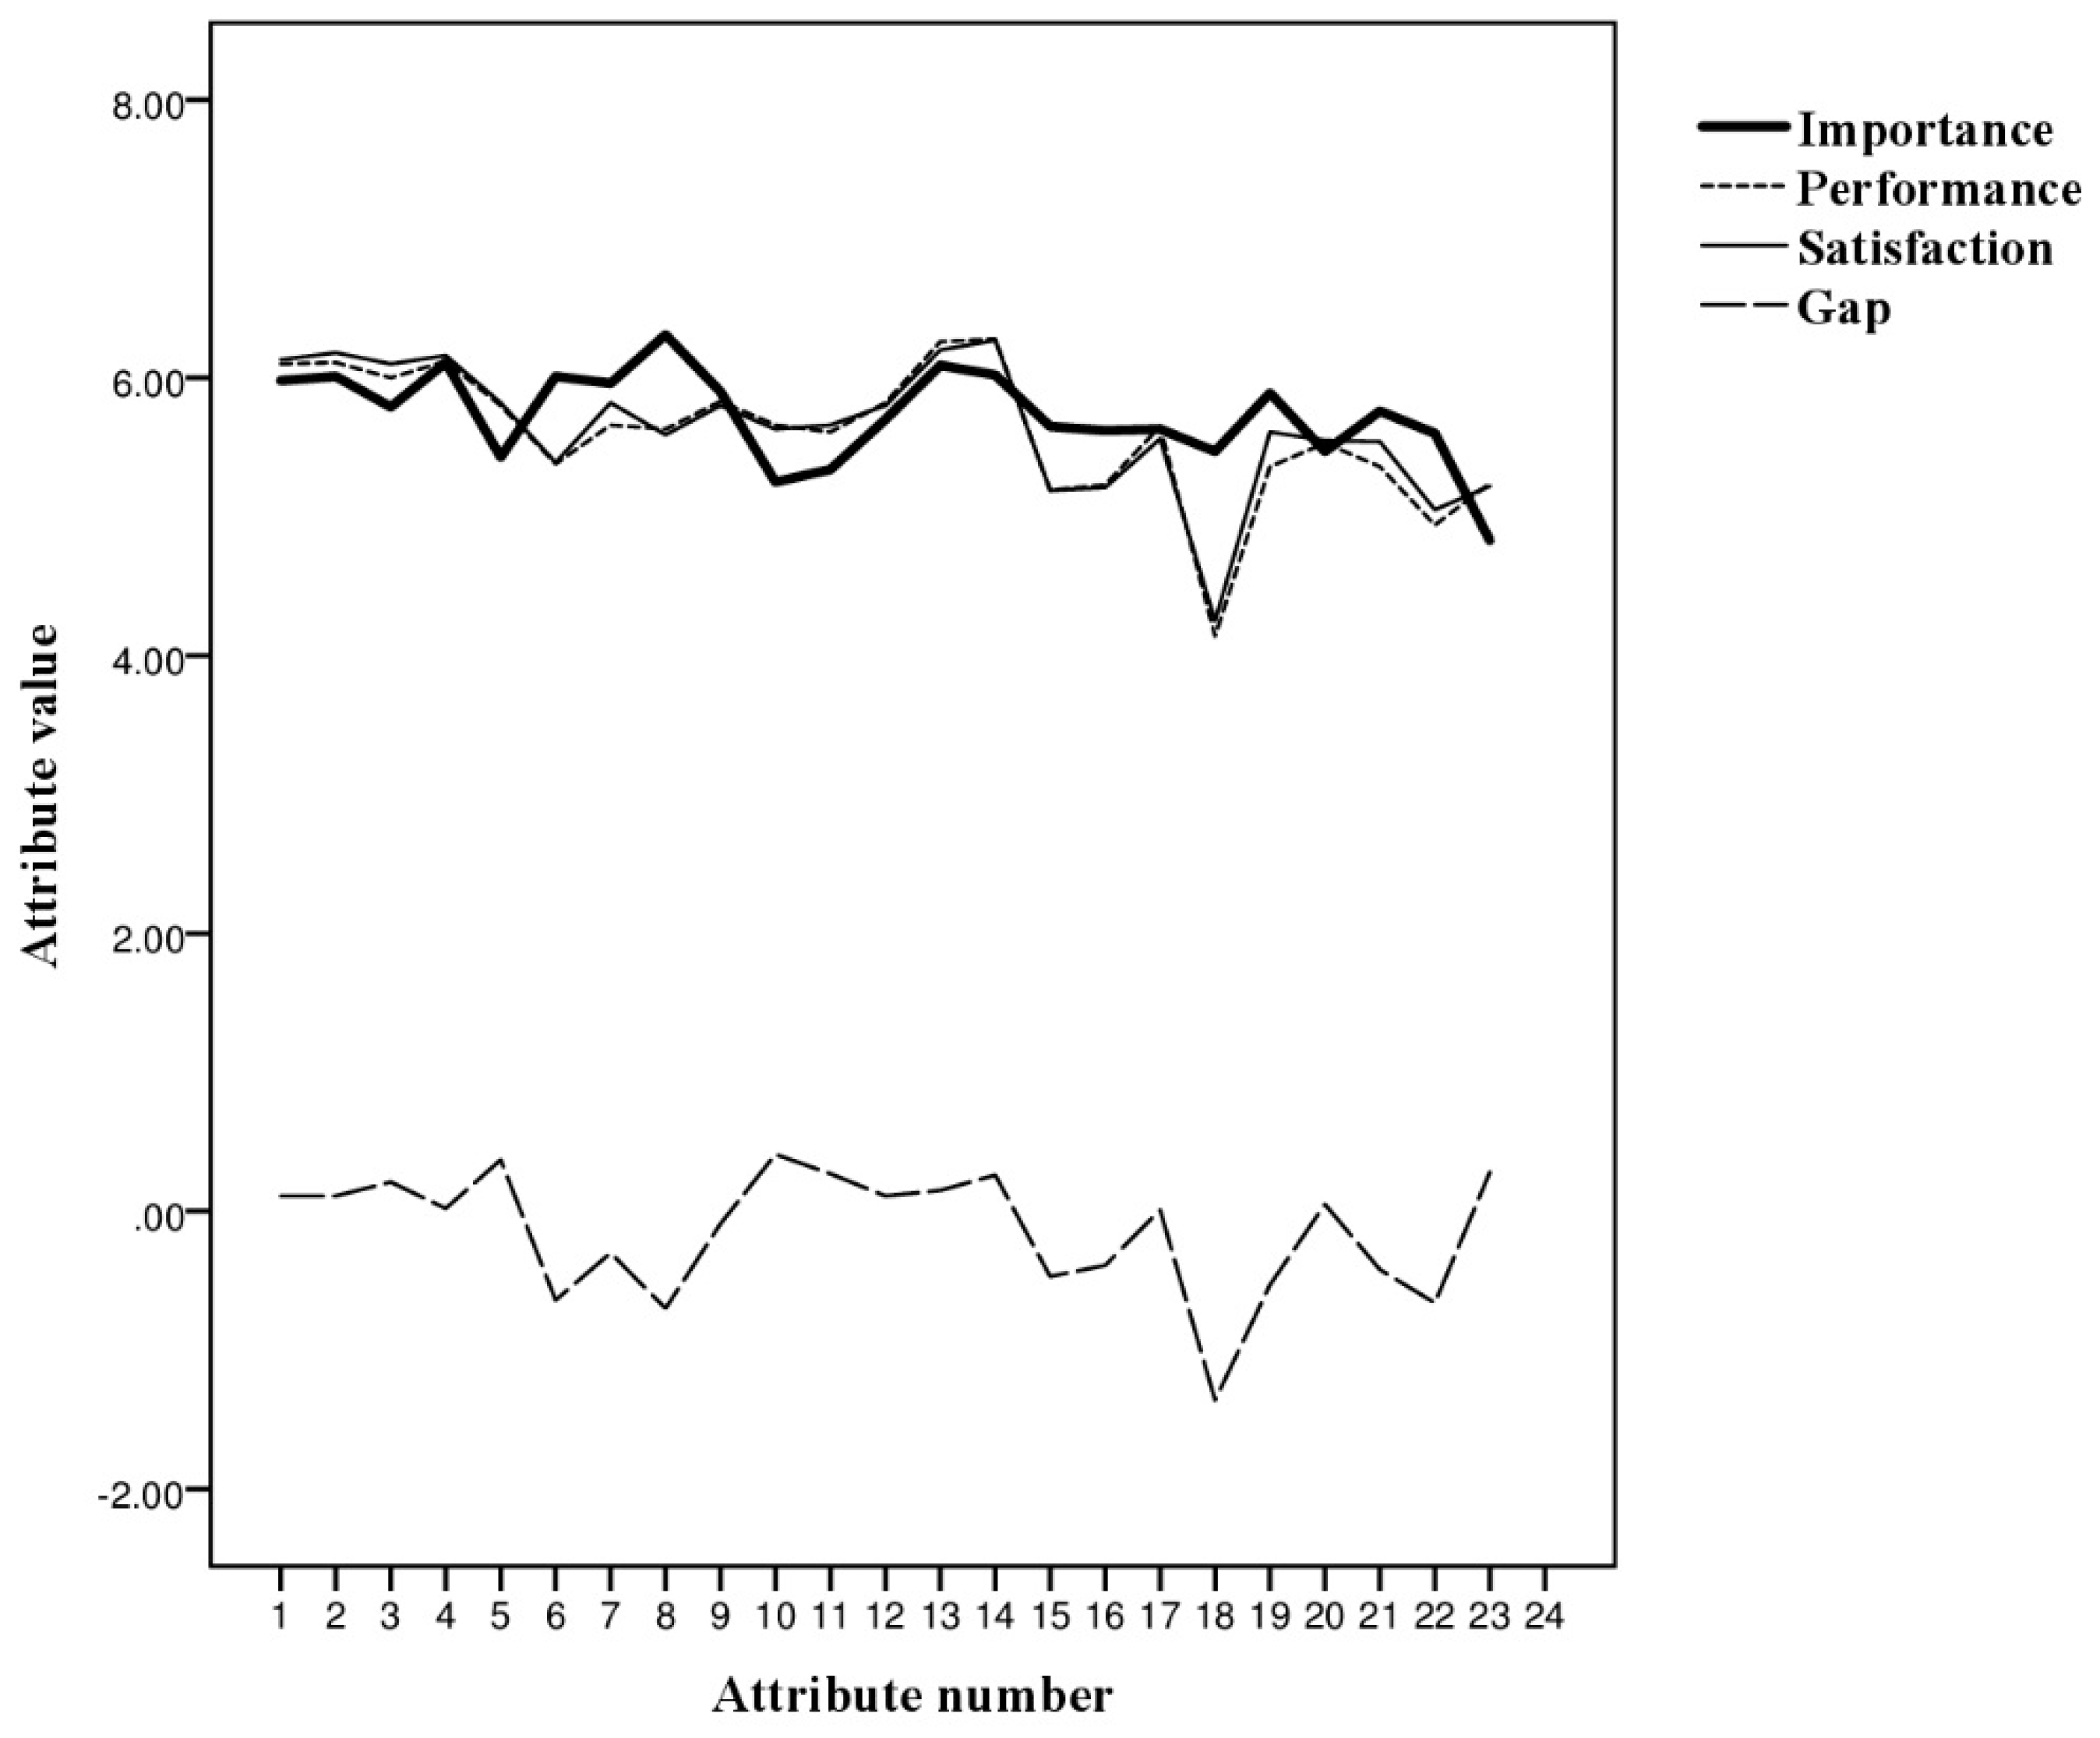
t-Tests showed that 19 out of 23 pairs were significantly different, with nine items measuring safety, price, and food/service being significantly lower in performance than in importance. However, 10 items, measuring green space, variety of restaurants, shops, and accommodation, and entertainment/nightlife had a significantly higher performance than importance. A correlation analysis indicated that performance, importance, and attribute satisfaction are highly correlated with one another. It is worth noting that attribute performance and attribute satisfaction are highly correlated, with the coefficient being 0.985, which is close to 1.0, suggesting a perfect match between attribute performance and attribute satisfaction (Figure 2). As the figure shows, the two lines representing attribute performance and attribute satisfaction are aligned very well.
4.3. Importance–Performance Analysis
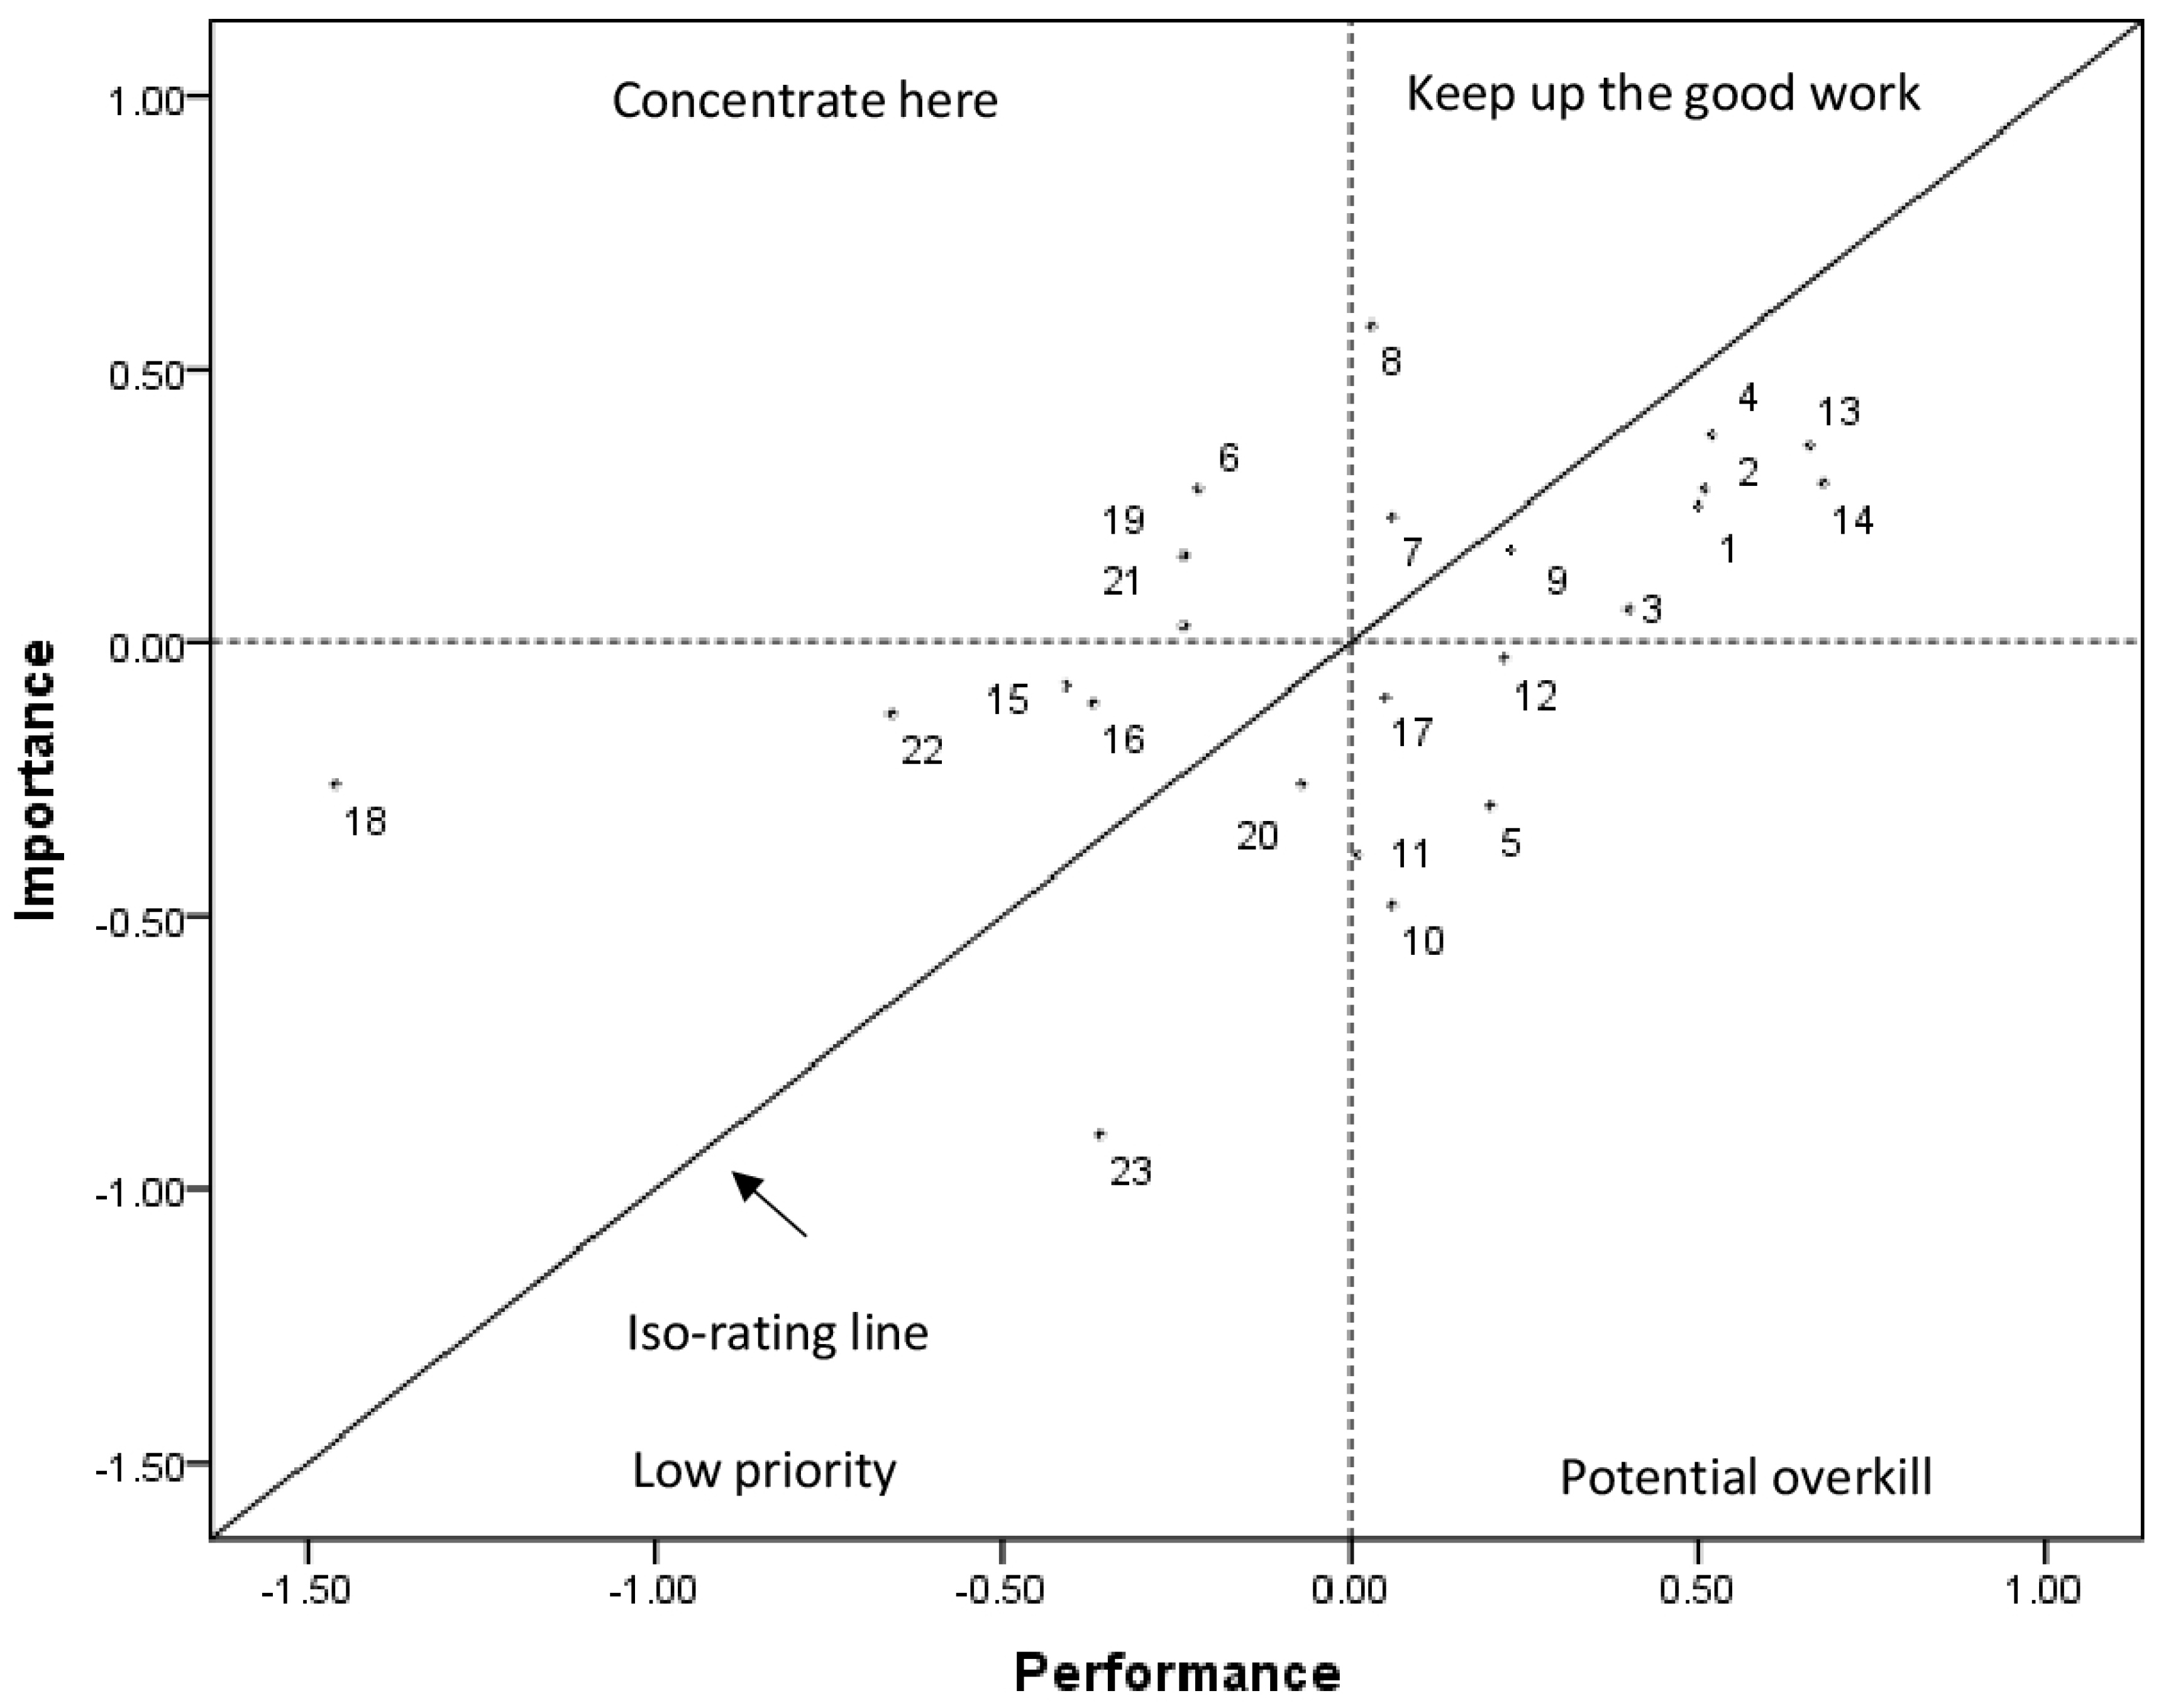
As mentioned in the methods section, neither the midpoint of the scale (i.e., 4.0 out of 7.0), nor the mean values of the raw scores, were used to determine the position of the crosshairs in the I-P grid. Instead, the mean (which is 0) of the mean differences between the raw scores for importance or performance and associated means was used to determine the position of the crosshairs. The results are displayed in Figure 3. If judged by the iso-rating line, all 14 items below the diagonal line perform well (i.e., items 1–4 on green space, items 5, 10 and 11 on variety of products, item 9 on friendliness of local people, items 12–14 on cultural and heritage resources, item 17 on information/welcome centers, and item 23 on good night-life/entertainment), while the nine items above the line require special attention to improve (i.e., item 6 on street cleanliness, items 7 and 8 on safety, items 15, 16, and 22 on price, item 18 on parking, and items 19 and 21 on food and restaurant service). Interestingly, these nine items are identical to the nine items whose performance is perceived significantly lower than their importance in the gap analysis.
Alternatively, if judged by the four quadrants, the four green space items (i.e., items 1–4), three safety items (i.e., items 7–9) and two heritage items (i.e., items 13 and 14) are located in the “keep up the good work” quadrant. Item 6 “street cleanliness” and two other items on food and restaurant service (i.e., items 19 and 21) are in the “concentrate here” quadrant. Three items, measuring the price of food/accommodation, attractions, and meals (i.e., items 15, 16 and 22), along with another three items, measuring parking (item 18), variety of cuisine (item 20), and nightlife/entertainment (item 23) are positioned in the “low priority” grid. Finally, five items are in the “potential overkill” area, including three items involving the variety of products (i.e., items 5, 10 and 11), one item regarding cultural attractions (item 12), and one regarding information/welcome centers (item 17).
4.4. Factor Analysis
A factor analysis was conducted for the five items measuring loyalty (KMO = 0.89, p < 0.001 for Bartlett’s test of sphericity), generating one factor (85.69% of total variance was explained, Cronbach’s α = 0.95). (Table 2). These five items were used as observed variables to measure loyalty in the SEM analysis.
A factor analysis was also conducted to confirm that items in each quadrant measure the same construct. The results show that the “keep up the good work” quadrant consists of three factors—“green space”, “safety”, and “heritage”—each explaining 34.25%, 14.29%, and 13.63% of the total variance, respectively, with a cumulative variance of 62.18% (Table 3). In addition, two factors are found in the “low priority” area (Table 4), while the “concentrate here” quadrant and “potential overkill” quadrants each have one factor (Table 5 and Table 6).
The existence of subscales in the two quadrants warrants a second-order factor being included in the SEM. However, factor two, which consists of two attributes (i.e., attributes 20 on cuisine and 23 on night life) in the “low priority” quadrant, was excluded from the SEM for two reasons. First, the two attributes are not conceptually linked. Second, inclusion of the factor in the model resulted in a poorer fit.
4.5. Importance–Performance Quadrants and Structural Equation Modeling
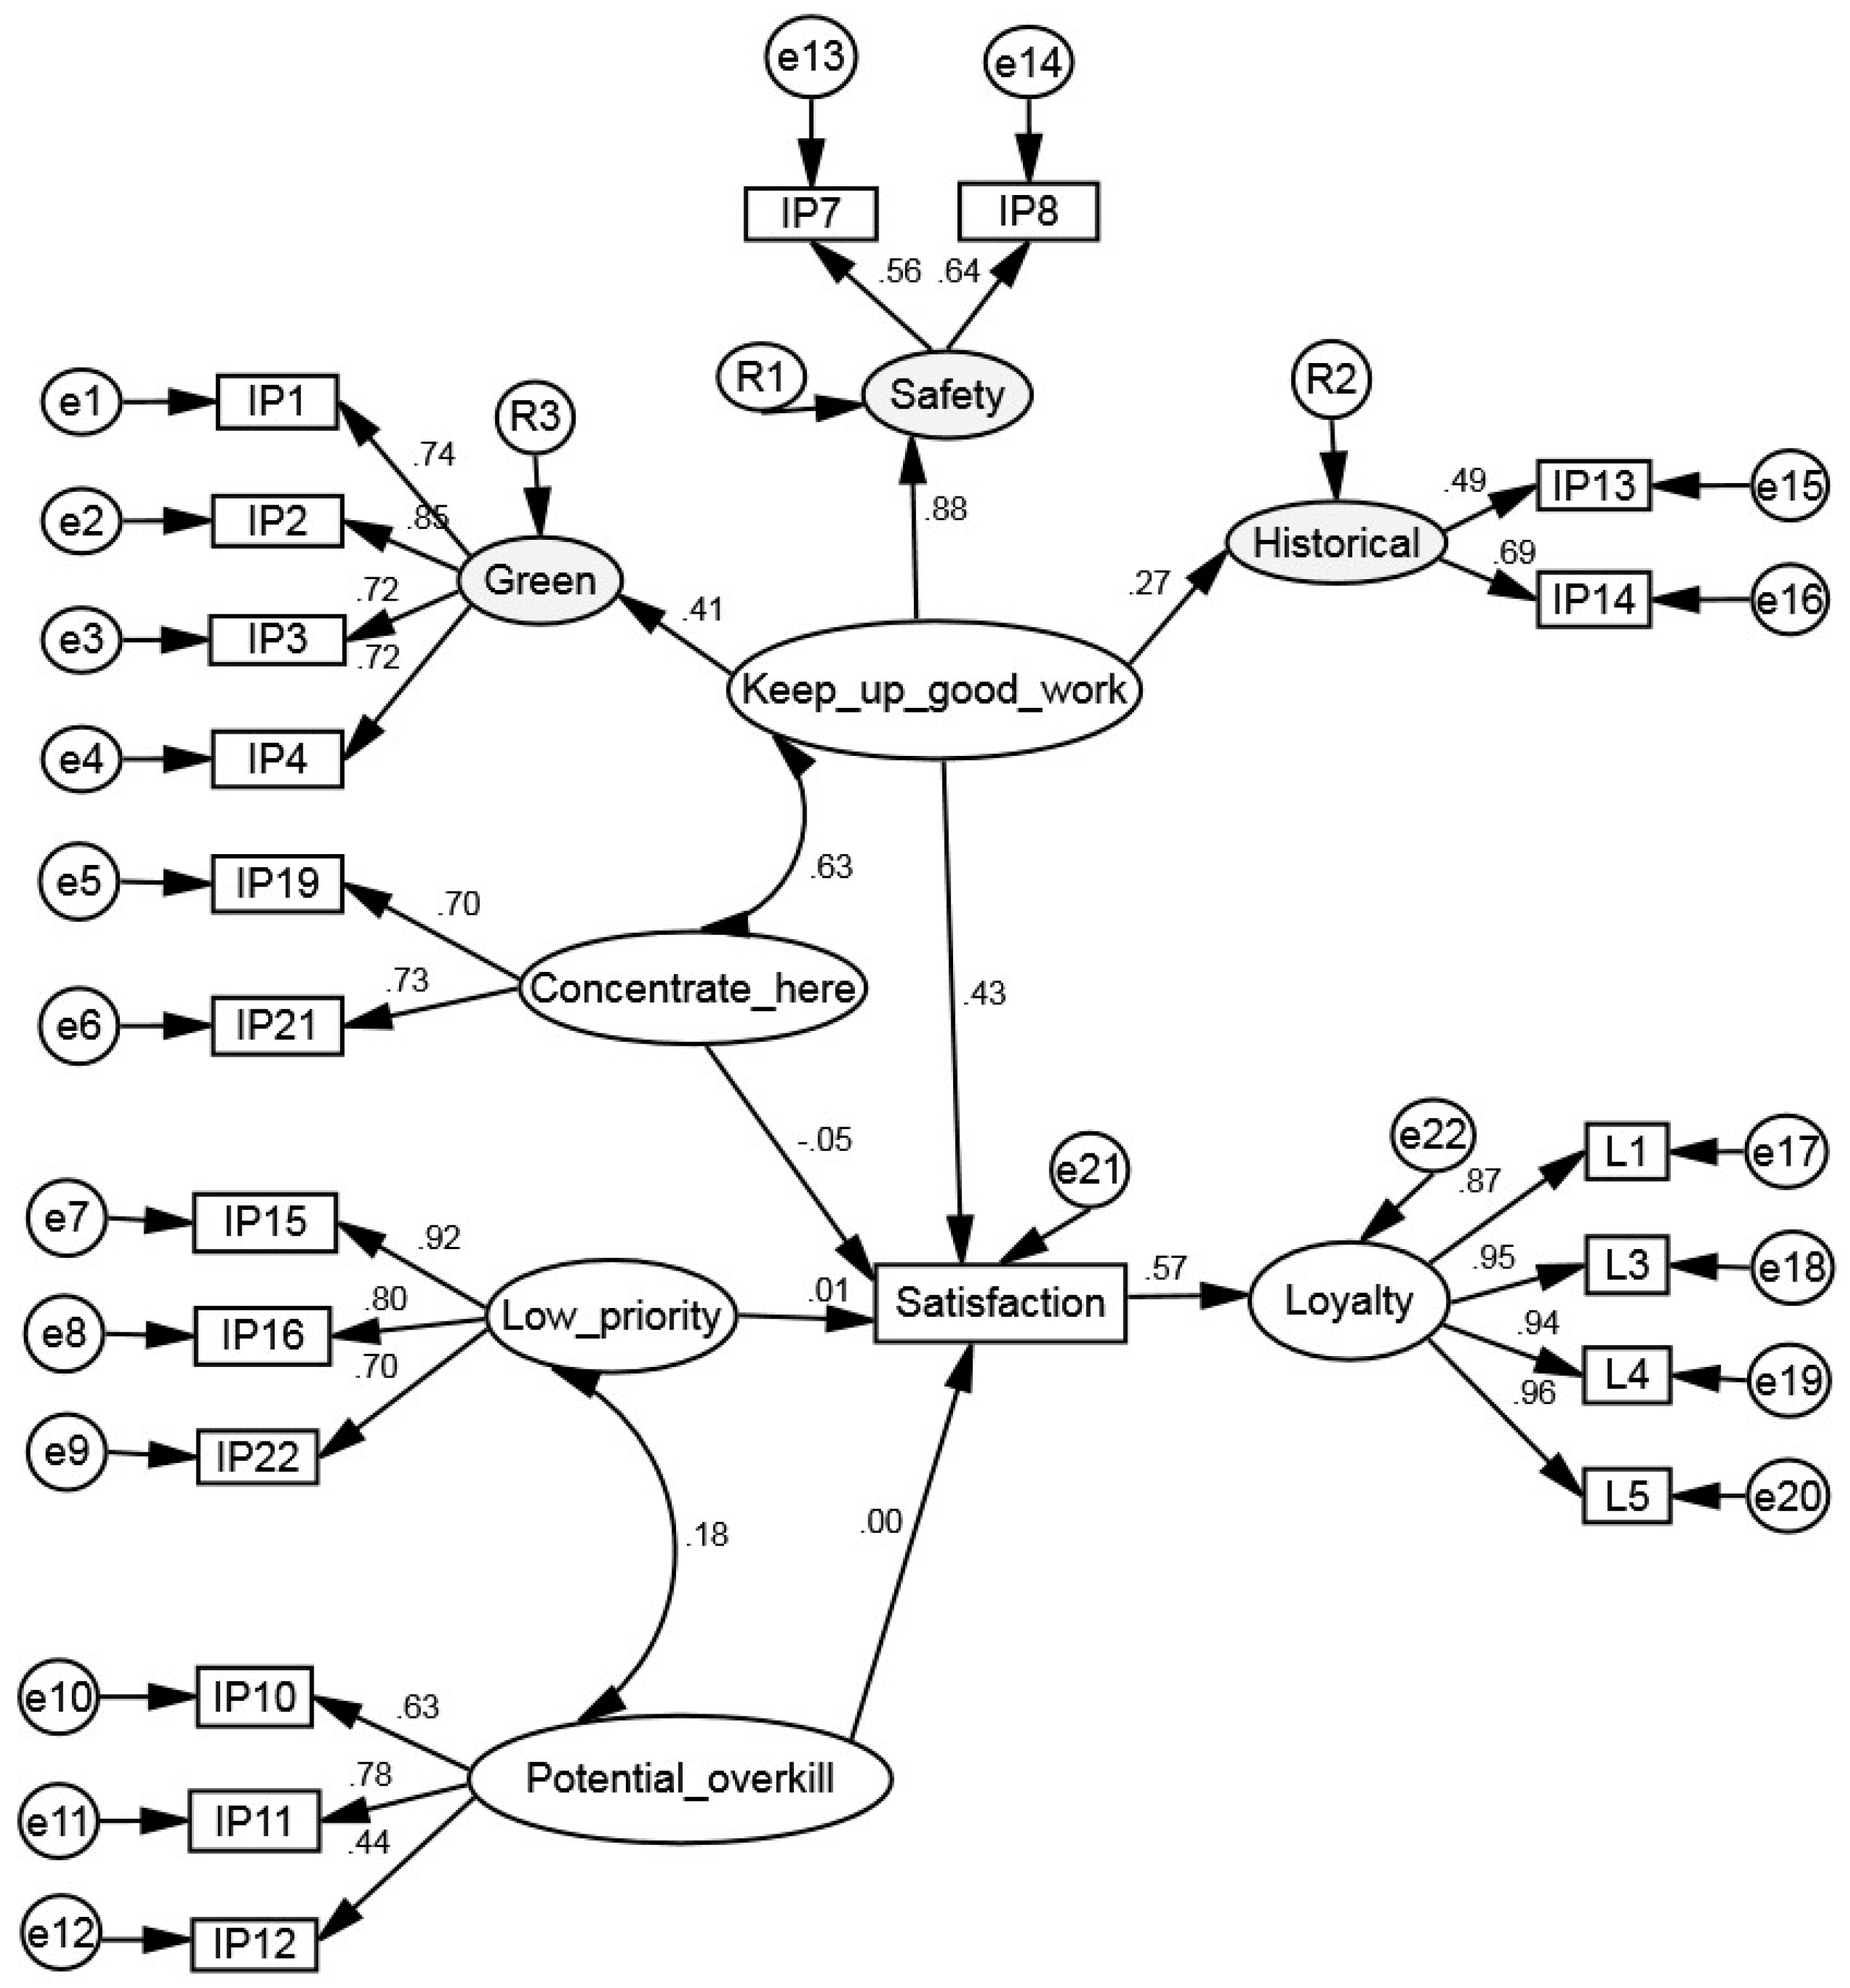
In order to test H1-H5 with regard to relationships between items in each IPA quadrant with overall satisfaction, covariance arrows were initially added to all exogenous variables. This resulted in a poor model fit. A good model fit was achieved when only the covariance links between “keep up the good work” and “concentrate here”, and between “low priority” and “potential overkill” were kept in the model (Figure 4).
Although the p-value for the model is less than 0.05, other indices (e.g., χ2/df = 3.36, RMSEA = 0.063, CFI = 0.93, IFI = 0.93, NFI = 0.91, RFI = 0.90, TLI = 0.92) indicate a good model fit. This shows that the first-order constructs—“green space”, “safety”, and “heritage”—are all significantly and positively related to the second-order construct of “keep up the good work”, which significantly and positively correlates with overall satisfaction (r = 0.43, p < 0.001, R2 = 0.19). Thus, H1 is supported.
Interestingly, none of other three constructs—“concentrate here”, “low priority”, and “potential overkill”—were significantly related to overall satisfaction. Specifically, “concentrate here” was negatively related to overall satisfaction (r = −0.05, p > 0.05), albeit not at the significant level of 0.05. This leads to the partial support of H2. The regression weights for “low priority” and “potential overkill” were 0.01 and 0.00, respectively, which indicates that items in these two quadrants have little to zero impact on overall satisfaction. Hence, H3 and H4 are fully supported. Finally, overall satisfaction significantly and positively contributes to loyalty (r = 0.57, p < 0.001, R2 = 0.33), leading to the support of H5.
5. Discussion
At least four findings from this study are worthy of discussion. First, the results from the IPA reveal that Savannah as a tourism destination performs well, with the majority of attributes (i.e., 14 out of 23) being below the iso-rating line, which means that performance exceeds importance. In addition, there were nine attributes in the “keep up the good work” quadrant as opposed to three in the “concentrate here” area, suggesting the city is highly attractive due to its green space, unique heritage, and safety. Thus, to remain competitive in the market, the city needs to maintain or enhance the quality of these important attributes, particularly the unique architectural buildings and green space featured by the park-like public squares. It should be noted that architectural buildings and green space attributes are still under the “keep up the good work” quadrant, even when judged by the iso-rating line. This finding not only endorses previous studies on urban forests in cities (i.e., historical attractions/architectural buildings and green space were ranked the top two most important attributes for the city in a previous study [75]; pubic squares were ranked the highest in scenic beauty [76]) but reflects the real appeal of tourism attractions in the city. For instance, unique architecture, ornate ironwork, fountains and green squares were among the top motives for people to visit the city [60]. This, in turn, corroborates the use of stated importance for the IPA. A previous study [26] also reported that safety and natural merits (e.g., nice weather, outstanding scenery, etc.) are among the most important attributes perceived by visitors to Guam.
It should be noted that results using the iso-rating line as a classification threshold are consistent with those using a gap analysis, where t-tests have shown that performance is perceived to be significantly lower than importance. This substantiates another previous study [19] which argued that the data-centered method can provide closer agreement with the results of gap analysis. It also endorses a study [77] on stakeholders’ perceptions of challenges facing rural communities in the Appalachian region, where attributes above the iso-rating line (i.e., performance < importance) represented most of those identified by t-tests.
Second, the mean value of performance (M = 5.60) is closest to that of the attribute-level satisfaction (M = 5.64), and the overall satisfaction rating of 6.04 is the highest measured. It is likely that a tourist’s overall experience/satisfaction is primarily affected by several main attributes, and, in this study, this could be heritage and green space, which have the highest rating of attribute-level satisfaction (i.e., architectural buildings with a mean value of 6.27 are ranked the highest, followed by historical attraction, M = 6.20, and the four green space attributes with mean values ranging from 6.10 to 6.18).
Third, there is a debate in the literature about the use of absolute vs. relative measures of importance and performance to predict overall satisfaction. Relative importance was thought, in some studies, to be more valuable to managers than absolute importance [9]. Our study partially endorses this assertion, albeit in a different manner. That is, we argue that it is the relative differences between performance and importance, and the relative differences within quadrants of performance and importance, as represented by the IPA grid, that determine overall satisfaction. Attributes in each IPA quadrant are positioned relative to the mean values of importance and performance and observed variables in the SEM (Figure 4) represent the differences between performance and importance of relevant attributes in each quadrant. The modeling of relative values proved to be quite effective in predicting overall satisfaction and provides a strong empirical support for the importance–performance analysis which assumes that “overall satisfaction will be influenced less by attribute performance when the self-stated importance of the attribute is low” [9] (p. 303). The model indicates that attributes with lower importance in the “low priority” and “potential overkill” have no contribution to overall satisfaction, while the opposite is true for attributes in the “keep up the good work” quadrant with higher importance and performance ratings.
Fourth, and lastly, this study used a second-order factor in the SEM, a technique that has rarely been used in tourism literature. According to some researchers [77,78], a second-order model can never produce a better model fit than a first-order model. However, our study shows that the opposite is true, and thus, is in favor of the use of SEM methods that include a second-order structure; this has also been tested and recommended in another study [10]. It should be noted that alternative models without the inclusion of second-order constructs have been tried, but with poorer fits. In addition to the better model fit, inclusion of a second-order factor in SEM has two additional advantages. First, it avoids the addition of the scores of manifest variables into an aggregate score, as practiced by some researchers who have treated the aggregated variables as reflective of a higher-order construct [10]. Second, it allows for the inclusion of as many observed variables as possible in the SEM and thus provides the chance to test the impact of those observed variables, some of which will have to be excluded from the model otherwise. For instance, if the second-order factor was not used in the SEM (Figure 4) that tests H1–H4, attributes 7, 8, 13, and 14 would have to be removed in order to achieve a model with acceptable fit indices.
6. Conclusions
A tourism destination is composed of a set of attributes which may have different meanings to different people. Tourists “have to choose which of the attractions they wish to visit and which to skip” [79] (p. 742) due to time/budget constraints and varying preferences for attributes. Therefore, an urban tourism experience rarely depends on the totality of a city’s attributes, but on one or several major attributes [75]. To remain competitive in the tourism market, each tourism destination must have one or several attributes as the core resources and attractors [80] that are distinct and unique from others. This study shows that green space and architectural buildings are the two such attributes with higher ratings of importance, performance, and attribute-level satisfaction than other attributes in the city. Apart from this, this study has important theoretical, methodological, and managerial implications.
Theoretically, this study, for the first time, tested the assumption, using SEM, that performance of an attribute will not significantly predict overall satisfaction if the attribute importance is relatively low, while the opposite is true when attribute importance is high. Thus, the validity of IPA was tested and confirmed. That said, future studies need to factor the relative importance (i.e., importance ratings minus the average importance value) into the model.
Methodologically, this study introduced the use of a second-order factor into the SEM, a technique that has rarely been used in tourism literature. It was shown that SEM with the inclusion of a second-order factor not only performed better than without it, but also allowed for the test of individual manifest variables which would be otherwise aggregated or removed.
Managerially, the green elements in the city which had higher importance, performance, and satisfaction ratings, as perceived by tourists, play a vital role in attracting tourists, and thus decision makers and planners should understand the trade-offs among different land use choices. If green space is not justified for its existence in terms of economic revenue generated from tourism and other sources, it may give way to residential or commercial development [81].
This study is not without limitations. First, there is no guarantee that a tourist who responded to all attributes has actually experienced each of them. To avoid this, future research may need to add a column “not applicable” to the Likert-scale measures. Second, biases on responses may exist due to the use of the convenience sampling method. Since a random sample is not realistic for a street survey, future research needs to conduct surveys at other sites (e.g., public squares, restaurants/bars, shopping centers, and hotels) to reduce potential response biases. Finally, several observed variables, particularly those measuring loyalty were not normally distributed, which may affect the statistical power of the analysis. However, this non-normality impact is likely to be small given the use of maximum likelihood estimators which are relatively robust to violations of normality assumptions [82] and the use of 10,000 bootstraps for the correction of the non-normality data [66]. Having said this, future studies need to increase sample size to improve the normal distribution of the data.
In conclusion, this study used a novel approach by including attributes in each IPA quadrant as observed variables in a second-order SEM to test the assumption that attributes with lower importance ratings will have little influence on overall satisfaction, regardless of their performance. This novel approach allowed us to take a fresh look at the old debate regarding the use of stated vs. derived importance methods for the predication of overall satisfaction, and the results suggest that stated importance may be more useful than previously thought.
Acknowledgments
This study was jointly funded by the U.S. Forest Service National Urban and Community Forestry Assistance Program as recommended by the National Urban and Community Forestry Advisory Council [07-DG-11420004-030], the USDA National Institute of Food and Agriculture McIntire Stennis project [1014379], and the West Virginia Agricultural and Forestry Experiment Station (Scientific Article Number 3337).
Author Contributions
Jinyang Deng contributed to the conception and design, data collection, data analysis, and manuscript preparation. Chad Pierskalla participated in conception and design, data collection, result interpretation, and manuscript proofreading and editing.
Conflicts of Interest
The authors declare no conflict of interest.
References
- Bramwell, B.; Lane, B. Priorities in sustainable tourism research. J. Sustain. Tour. 2008, 16, 1–4. [Google Scholar] [CrossRef]
- Baker, D.A.; Crompton, J.L. Quality, satisfaction and behavioral intentions. Ann. Tour. Res. 2000, 27, 785–804. [Google Scholar] [CrossRef]
- Yoon, Y.; Uysal, M. An examination of the effects of motivation and satisfaction on destination loyalty: A structural model. Tour. Manag. 2005, 26, 45–56. [Google Scholar] [CrossRef]
- Abooali, G.; Omar, S.I.; Mohamed, B. The importance and performance of a destination’s attribute on senior tourists’ satisfaction. Int. J. Asian Soc. Sci. 2015, 5, 355–368. [Google Scholar] [CrossRef]
- Meng, F.; Tepanon, Y.; Uysal, M. Measuring tourist satisfaction by attribute and motivation: The case of a nature-based resort. J. Vacat. Mark. 2006, 14, 41–56. [Google Scholar] [CrossRef]
- Gartner, W.C. Temporal influence on image change. Ann. Tour. Res. 1986, 13, 635–644. [Google Scholar] [CrossRef]
- Limburg, B. City marketing: A multi-attribute approach. Tour. Manag. 1998, 19, 415–417. [Google Scholar] [CrossRef]
- Matzler, K.; Sauerwein, E. The factor structure of customer satisfaction: An empirical test of the importance grid and the penalty reward-contrast analysis. Int. J. Serv. Ind. Manag. 2002, 13, 314–332. [Google Scholar] [CrossRef]
- Taplin, R.H. The value of self-stated attribute importance to overall satisfaction. Tour. Manag. 2012, 33, 295–304. [Google Scholar] [CrossRef]
- Koufteros, X.; Babbar, S.; Kaighobadi, M. A paradigm for examining second-order factor models employing structural equation modeling. Int. J. Prod. Econ. 2009, 120, 633–652. [Google Scholar] [CrossRef]
- Martilla, J.A.; James, J.C. Importance-performance analysis. J. Mark. 1997, 41, 77–79. [Google Scholar] [CrossRef]
- Bacon, D.R. A comparison of approaches to importance-performance analysis. Int. J. Mark. Res. 2003, 45, 55–77. [Google Scholar] [CrossRef]
- Slack, N. The importance-performance matrix as a determinant of improvement priority. Int. J. Oper. Prod. Manag. 1994, 14, 59–76. [Google Scholar] [CrossRef]
- Oh, H. Revisiting importance-performance analysis. Tour. Manag. 2001, 22, 617–627. [Google Scholar] [CrossRef]
- Sever, I. Importance-performance analysis: A valid management tool? Tour. Manag. 2015, 48, 43–53. [Google Scholar] [CrossRef]
- Dwyer, L.; Knezevic Celbar, L.; Edwards, D.; Mihalic, T. Fashioning a destination tourism future: The case of Slovenia. Tour. Manag. 2012, 33, 305–316. [Google Scholar] [CrossRef]
- Chen, T.; Lee, Y. Kano two-dimensional quality model and important-performance analysis in the student’s dormitory service quality evaluation in Taiwan. J. Am. Acad. Bus. Camb. 2006, 9, 324–330. [Google Scholar]
- Tarrant, A.; Smith, E.K. The use of modified importance-performance framework to examine visitor satisfaction with attributes of outdoor recreation settings. Manag. Leis. 2002, 7, 69–82. [Google Scholar] [CrossRef]
- Tonge, J.; Moore, S.A. Importance-satisfaction analysis for marine-park hinterlands: A Western Australian case study. Tour. Manag. 2007, 28, 768–776. [Google Scholar] [CrossRef]
- Tontini, G.; Silveira, A. Identification of satisfaction attributes using competitive analysis of the improvement gap. Int. J. Oper. Prod. Manag. 2007, 27, 482–500. [Google Scholar] [CrossRef]
- Beldona, S.; Cobanoglu, C. Importance-performance analysis of guest technologies in the lodging industry. Cornell Hotel Restaur. Adm. Q. 2007, 48, 299–312. [Google Scholar] [CrossRef]
- Deng, W.J. Using a revised importance–performance analysis approach- the case of Taiwanese hot springs tourism. Tour. Manag. 2007, 28, 1274–1284. [Google Scholar] [CrossRef]
- Deng, W.J.; Kuo, Y.F.; Chen, W.C. Revised importance-performance analysis: Three-factor theory and benchmarking. Serv. Ind. J. 2008, 28, 37–51. [Google Scholar] [CrossRef]
- Enright, M.J.; Newton, J. Tourism destination competitiveness: A quantitative approach. Tour. Manag. 2004, 25, 777–788. [Google Scholar] [CrossRef]
- Joppe, M.; Martin, D.W.; Waalen, J. Toronto’s image as a destination: A comparative importance-satisfaction analysis by origin of visitor. J. Travel Res. 2001, 39, 252–260. [Google Scholar] [CrossRef]
- Lee, C.K.; Lee, G. Cross-cultural comparison of the image of Guam perceived by Korean and Japanese leisure travelers: Importance-performance analysis. Tour. Manag. 2009, 30, 922–931. [Google Scholar] [CrossRef]
- Li, S.; Wong, M.C. S.; Luk, S. The importance and performance of key success factors of international joint venture hotels in China. Chin. Econ. 2006, 39, 83–94. [Google Scholar] [CrossRef]
- Deng, J.; McGill, D.; Arbogast, D. Perceptions of challenges facing rural communities: An importance-performance analysis. Tour. Anal. 2017, 22, 219–236. [Google Scholar] [CrossRef]
- Johann, M. The importance-performance analysis: An evaluation of tourist satisfaction with the destination attributes. Int. J. Econ. Pract. Theor. 2014, 4, 572–578. [Google Scholar]
- Matzler, K.; Bailom, F.; Hinterhuber, H.H.; Renzl, B.; Pichler, J. The asymmetric relationship between attribute-level performance and overall customer satisfaction: A reconsideration of the importance–performance analysis. Ind. Mark. Manag. 2004, 33, 271–277. [Google Scholar] [CrossRef]
- Nisco, A.D.; Riviezzo, A.; Napolitano, M.R. An importance-performance analysis of tourist satisfaction at destination level: Evidence from Campania (Italy). Eur. J. Tour. Res. 2015, 10, 64–75. [Google Scholar]
- Pan, F.C. Practical application of importance-performance analysis in determining critical job satisfaction factors of a tourist hotel. Tour. Manag. 2015, 46, 84–91. [Google Scholar]
- Ziegler, J.; Dearden, P.; Rollins, R. But are tourists satisfied? Importance-performance analysis of the whale shark tourism industry on Isla Holbox, Mexico. Tour. Manag. 2012, 33, 692–701. [Google Scholar] [CrossRef]
- Dolinsky, A.L.; Caputo, R.K. Adding a competitive dimension on importance–performance analysis: An application to traditional health care systems. Health Mark. Q. 1991, 8, 61–79. [Google Scholar] [CrossRef] [PubMed]
- Alegre, J.; Garau, J. The factor structure of tourist satisfaction at sun and sand destinations. J. Travel Res. 2011, 50, 78–86. [Google Scholar] [CrossRef]
- Alpert, M.I. Identification of determinant attributes: A comparison of methods. J. Mark. Res. 1971, 8, 184–191. [Google Scholar] [CrossRef]
- Chen, K.; Chen, H. Applying importance-performance analysis with simple regression model and priority indices to assess hotels’ service performance. J. Test. Evaln. 2014, 42, 455–465. [Google Scholar] [CrossRef]
- Azzopardi, E.; Nash, R. A critical evaluation of importance-performance analysis. Tour. Manag. 2013, 35, 222–233. [Google Scholar] [CrossRef]
- Matzler, K.; Fuchs, M.; Schubert, A.K. Employee satisfaction: Does Kano’s model apply? Total Qual. Manag. Bus. Excell. 2004, 15, 1179–1198. [Google Scholar] [CrossRef]
- Chu, R. Stated-importance versus derived-importance customer satisfaction measurement. J. Serv. Mark. 2002, 16, 285–301. [Google Scholar] [CrossRef]
- Chrzan, K.; Malcom, D. How to improve brand tracking research: A frozen pizza case study. Int. J. Mark. Res. 2009, 51, 723–733. [Google Scholar]
- Lai, I.K.W.; Hitchcock, M. Importance–performance analysis in tourism: A framework for researchers. Tour. Manag. 2015, 48, 242–267. [Google Scholar] [CrossRef]
- Oliver, R.L. Satisfaction: A Behavioral Perspective on the Consumer, 2nd ed.; Irwin McGraw-Hill: Boston, MA, USA, 2010; ISBN 0765617706. [Google Scholar]
- Liljander, V.; Strandvik, T. Different comparison standards as determinants of service quality. J. Consum. Satisf. Dissatisfaction Complain. Behav. 1993, 6, 118–132. [Google Scholar]
- Crompton, J.L.; Love, L.L. The predictive validity of alternative approaches to evaluating quality of a festival. J. Travel Res. 1995, 34, 11–24. [Google Scholar] [CrossRef]
- Griffin, A.; Hauser, J.R. The voice of the customer. Mark. Sci. 1993, 12, 1–27. [Google Scholar] [CrossRef]
- Fick, G.R.; Ritchie, J.R.B. Measuring service quality in the travel and tourism industry. J. Travel Res. 1991, 29, 2–9. [Google Scholar] [CrossRef]
- Churchill, G.A.; Surprenant, C. An investigation into the determinants of customer satisfaction. J. Mark. Res. 1982, 19, 491–504. [Google Scholar] [CrossRef]
- Cronin, J.J.; Taylor, S.A. Measuring service quality: A reexamination and extension. J. Mark. 1992, 56, 55–68. [Google Scholar] [CrossRef]
- Ryan, C.; Huyton, J. Balanda tourists and aboriginal people. Ann. Tour. Res. 2002, 29, 631–647. [Google Scholar] [CrossRef]
- Reisinger, Y.; Turner, L.W. The determination of shopping satisfaction of Japanese tourists visiting Hawaii and the Gold Coast compared. J. Travel Res. 2002, 41, 167–176. [Google Scholar] [CrossRef]
- Tanford, S. Antecedents and outcomes of hospitality loyalty: A meta-analysis. Cornell Hosp. Q. 2016, 57, 122–137. [Google Scholar] [CrossRef]
- Baral, N.; Stern, M.J.; Bhattarai, R. Contingent valuation of ecotourism in Annapurna Conservation Area, Nepal: Implications for sustainable park finance and local development. Ecol. Econ. 2008, 66, 218–227. [Google Scholar] [CrossRef]
- López-Mosquera, N.; Sánchez, M. Cognitive and affective determinants of satisfaction, willingness to pay, and loyalty in suburban parks. Urban For. Urban Green. 2014, 13, 375–384. [Google Scholar] [CrossRef]
- Oliver, R.L. Whence consumer loyalty? J. Mark. 1999, 63, 33–44. [Google Scholar] [CrossRef]
- Tanford, S.; Jung, S. Festival attributes and perceptions: A meta-analysis of relationships with satisfaction and loyalty. Tour. Manag. 2017, 61, 209–220. [Google Scholar] [CrossRef]
- Zhang, H.; Fu, X.; Cai, L.A.; Lu, L. Destination image and tourist loyalty: A meta-analysis. Tour. Manag. 2014, 40, 213–223. [Google Scholar] [CrossRef]
- Som, A.P.M.; Shirazi, S.F.M.; Marzuki, A.; Jusoh, J. A critical analysis of tourist satisfaction and destination loyalty. J. Glob. Manag. 2011, 2, 178–183. [Google Scholar]
- U.S. Census Bureau. Population and Housing Unit Estimates. Available online: http://www.webcitation.org/6YSasqtfX?url=http%3A%2F%2Fwww.census.gov%2Fprod%2Fwww%2Fdecennial.html (accessed on 22 February 2018).
- Visit Savannah. History of Savannah. Available online: http://www.visitsavannah.com/essential-savannah/history-of-savannah.aspx (accessed on 22 February 2018).
- Savannah Area Chamber. Tourism Industry. Available online: http://www.savannahchamber.com/economic-development/tourism (accessed on 22 February 2018).
- Fowler, F.J. Survey research methods. In Applied Research Methods Series, 2nd ed.; Bickman, L., Rog, D.J., Eds.; SAGE: Newbury Park, CA, USA, 1992; Volume 1, ISBN 9780803950498. [Google Scholar]
- Veen, R.V.D.; Song, H. Impact of the perceived image of celebrity endorsers on tourists’ intentions to visit. J. Travel Res. 2014, 53, 211–224. [Google Scholar] [CrossRef]
- Schafer, J.L. Multiple imputation: A primer. Stat. Methods Med. Res. 1999, 8, 3–15. [Google Scholar] [CrossRef] [PubMed]
- Kline, R.B. Principles and Practice of Structural Equation Modeling, 2nd ed.; Guilford Press: New York, NY, USA, 2005; ISBN 1593850751. [Google Scholar]
- Song, Z.; Xing, L.; Chathoth, P.K. The effects of festival impacts on support intentions based on residents’ ratings of festival performance and satisfaction: A new integrative approach. J. Sustain. Tour. 2015, 23, 316–337. [Google Scholar] [CrossRef]
- Comrey, A.; Lee, H. A First Course in Factor Analysis, 2nd ed.; Lawrence Erlbaum Associates: Hillsdale, NJ, USA, 1992; ISBN 0805810625. [Google Scholar]
- Nunnally, J.C. Psychometric Theory, 3nd ed.; McGraw-Hill: New York, NY, USA, 1994; ISBN 007047849X. [Google Scholar]
- Aron, A.; Aron, E.N. Statistics for Psychology, 5th ed.; Prentice-Hall: Englewood Cliffs, NJ, USA, 2008; ISBN 0136010571. [Google Scholar]
- Hair, J.F.; Black, W.C.; Babin, B.J.; Anderson, R.E. Multivariate Data Analysis, 7th ed.; Prentice Hall: Upper Saddle River, NJ, USA, 2010; ISBN 0138132631. [Google Scholar]
- Anderson, J.C.; Gerbing, D.W. Structural equation modeling in practice: A review and recommended two-step approach. Psychol. Bull. 1988, 103, 411–423. [Google Scholar] [CrossRef]
- Wheaton, B.; Muthén, B.; Alwin, D.F.; Summers, G.F. Assessing reliability and stability in panel models. In Sociological Methodology, 1st ed.; Heise, D.R., Ed.; Jossey-Bass: San Francisco, CA, USA, 1977; pp. 84–136. ISBN 978087589286. [Google Scholar]
- MacCallum, R.C.; Browne, M.W.; Sugawara, H.M. Power analysis and determination of sample size for covariance structure modeling. Psychol. Methods 1996, 1, 130–149. [Google Scholar] [CrossRef]
- Hooper, D.; Coughlan, J.; Mullen, M.R. Structural equation modelling: Guidelines for determining model fit. Electron. J. Bus. Res. Methods 2008, 6, 53–60. [Google Scholar]
- Deng, J.; Kathryn, A.; Pierskalla, C.; McNeel, J. Linking urban forests and urban tourism: A case of Savannah, GA. Tour. Anal. 2010, 15, 167–181. [Google Scholar] [CrossRef]
- Pierskalla, C.D.; Deng, J.; Siniscalchi, J.M. Examining the product and process of scenic beauty evaluations using moment-to-moment data and GIS: The case of Savannah, GA. Urban For. Urban Green. 2016, 19, 212–222. [Google Scholar] [CrossRef]
- Marsh, H.W.; Hocevar, D. Application of confirmatory factor analysis of the study of self-concept: First and higher order factor models and their invariance across groups. Psychol. Bull. 1985, 97, 562–582. [Google Scholar] [CrossRef]
- Anaau, R.C.; Thompson, B. Second-order confirmatory factor analysis of the WAIS-III. Assessment 2000, 7, 237–246. [Google Scholar]
- Shoval, N.; Raveh, A. Categorization of tourist attractions and the modeling of tourist cities: Based on the co-plot method of multivariate analysis. Tour. Manag. 2004, 25, 741–750. [Google Scholar] [CrossRef]
- Ritchie, J.R.B.; Crouch, G.I. The Competitive Destination, a Sustainable Tourism Perspective, 1st ed.; CABI Publishing: Cambridge, UK, 2003; ISBN 9781845930103. [Google Scholar]
- Majumdar, S.; Deng, J.; Zhang, Y.; Pierskalla, C. Using contingent valuation to estimate the willingness of tourists to pay for urban forests: A study in Savannah, Georgia. Urban For. Urban Green. 2001, 10, 275–280. [Google Scholar] [CrossRef]
- Reinartz, W.; Haenlein, M.; Henseler, J. An empirical comparison of the efficacy of covariance-based and variance-based SEM. Int. J. Res. Mark. 2009, 26, 332–344. [Google Scholar] [CrossRef]
Figure 1.
Importance–Performance grid.

Figure 2.
Graphs of importance, performance, satisfaction, and the gap.

Figure 3.
Importance–performance analysis of destination attributes in Savannah, GA.

Figure 4.
The structural relationships between items in each importance–performance analysis (IPA) quadrant, overall satisfaction, and loyalty. Notes: (1) please refer to Table 2, Table 3, Table 4, Table 5 and Table 6 for the observed variables measuring importance and performance and (2) to increase the model fit, not all items were used in the model.


Table 1.
Paired-sample t-tests for mean differences between performance and importance.
| Item | Mean | Gap (P − I) | t | p | ||
|---|---|---|---|---|---|---|
| P | I | S | ||||
| 1. Beauty of public squares | 6.09 | 5.98 | 6.13 | 0.11 | 2.75 | 0.006 |
| 2. Beauty of tree-lined streets/boulevards | 6.11 | 6.01 | 6.18 | 0.11 | 2.63 | 0.009 |
| 3. Beauty of trees in neighborhoods | 6.00 | 5.79 | 6.10 | 0.21 | 4.61 | 0.000 |
| 4. Beauty of gardens and parks | 6.13 | 6.11 | 6.16 | 0.02 | 0.39 | 0.699 |
| 5. Wide selection of restaurants/bars | 5.80 | 5.43 | 5.82 | 0.37 | 5.65 | 0.000 |
| 6. Street cleanliness | 5.38 | 6.02 | 5.39 | −0.64 | −11.24 | 0.000 |
| 7. Peaceful/restful atmosphere | 5.65 | 5.95 | 5.82 | −0.30 | −5.58 | 0.000 |
| 8. Personal safety and security | 5.62 | 6.31 | 5.59 | −0.70 | −12.48 | 0.000 |
| 9. Friendliness of local people | 5.83 | 5.91 | 5.80 | −0.09 | −1.57 | 0.116 |
| 10. Wide variety of shops | 5.67 | 5.26 | 5.63 | 0.41 | 6.89 | 0.000 |
| 11. Wide choice of accommodation | 5.61 | 5.34 | 5.66 | 0.27 | 5.16 | 0.000 |
| 12. Interesting cultural attractions | 5.82 | 5.71 | 5.80 | 0.11 | 2.30 | 0.022 |
| 13. Interesting historical attractions | 6.25 | 6.10 | 6.20 | 0.15 | 3.93 | 0.000 |
| 14. Attractive architecture/buildings | 6.28 | 6.02 | 6.27 | 0.26 | 5.74 | 0.000 |
| 15. Reasonable price for food/accommodation | 5.19 | 5.65 | 5.19 | −0.47 | −7.96 | 0.000 |
| 16. Reasonable price for attractions/activities | 5.23 | 5.62 | 5.21 | −0.39 | −6.79 | 0.000 |
| 17. Helpfulness of information/welcome centers | 5.65 | 5.63 | 5.56 | 0.01 | 0.14 | 0.890 |
| 18. Parking availability | 4.14 | 5.47 | 4.25 | −1.36 | −15.04 | 0.000 |
| 19. Quality of food | 5.36 | 5.89 | 5.61 | −0.53 | −10.79 | 0.000 |
| 20. Wide variety of cuisine | 5.53 | 5.47 | 5.55 | 0.05 | 1.03 | 0.305 |
| 21. Service in restaurants | 5.36 | 5.76 | 5.54 | −0.42 | −8.11 | 0.000 |
| 22. Reasonable price of meals | 4.94 | 5.60 | 5.05 | −0.66 | −11.23 | 0.000 |
| 23. Good night-life/entertainment | 5.24 | 4.83 | 5.22 | 0.28 | 4.68 | 0.000 |
| Average | 5.60 | 5.73 | 5.64 6.04 * | |||
Note: P = performance, I = importance, S = attribute satisfaction. * The mean for overall satisfaction.
Table 2.
Summary results of the factor analysis of items measuring loyalty.
| Code | Factor (Proportion): Scale Name and Items | M | SD | Unrotated Factor |
|---|---|---|---|---|
| 1 | ||||
| Factor 1: Loyalty | 6.33 | 0.93 | ||
| L1 | Savannah is a place worthy of visiting again | 6.36 | 1.00 | 0.931 |
| L2 | I will revisit the city for pleasure trips | 6.18 | 1.20 | 0.863 |
| L3 | I will recommend Savannah to family or friends | 6.37 | 0.96 | 0.952 |
| L4 | I will say positive things to other people | 6.39 | 0.95 | 0.933 |
| L5 | I will recommend to those who want advice | 6.36 | 0.94 | 0.947 |
| Eigenvalues | 4.28 | |||
| % of variance | 85.69 | |||
| Cumulative % | 85.69 | |||
| Standardized Cronbach’s a | 0.95 |
Kaiser–Meyer–Olkin (KMO) = 0.89, p < 0.001. Only one component was extracted and rotated methods cannot be applied.
Table 3.
Summary results of the factor analysis of items in the “keep up the good work” quadrant.
| Code | Factor (Proportion): Scale Name and Items | M | SD | Rotated (varimax) Factors | ||
|---|---|---|---|---|---|---|
| 1 | 2 | 3 | ||||
| Factor 1: Green space | 1.15 | 0.84 | ||||
| IP1 | Beauty of public squares | 0.11 | 1.02 | 0.822 | 0.047 | 0.018 |
| IP2 | Beauty of tree-lined streets/boulevards | 0.10 | 0.98 | 0.866 | 0.107 | 0.031 |
| IP3 | Beauty of trees in neighborhoods | 0.20 | 1.11 | 0.781 | 0.151 | 0.061 |
| IP4 | Beauty of gardens and parks | 0.01 | 0.94 | 0.770 | 0.171 | 0.173 |
| Factor 2: Safety | −0.49 | 1.13 | ||||
| IP7 | Peaceful/restful atmosphere | −0.33 | 1.32 | 0.075 | 0.769 | 0.057 |
| IP8 | Personal safety and security | −0.71 | 1.36 | 0.089 | 0.822 | −0.064 |
| Factor 3: Heritage | 0.20 | 0.83 | ||||
| IP13 | Interesting historical attractions | 0.15 | 0.96 | 0.013 | 0.067 | 0.828 |
| IP14 | Attractive architecture/buildings | 0.26 | 1.05 | 0.130 | 0.021 | 0.784 |
| Eigenvalues | 3.08 | 1.29 | 1.23 | |||
| % of variance | 34.25 | 14.29 | 13.63 | |||
| Cumulative % | 48.55 | 62.18 | ||||
| Standardized Cronbach’s a | 0.84 | 0.53 | 0.51 | |||
KMO = 0.80, p < 0.001. Item 9 was removed from factor 2 due to its loading on factors lower than 0.45, and because its item–total correlation is less than 0.30.
Table 4.
Summary results of the factor analysis of items in the “low priority” quadrant.
| Code | Factor (Proportion): Scale Name and Items | M | SD | Rotated (Varimax) Factors | |
|---|---|---|---|---|---|
| Factor 1 | Factor 2 | ||||
| Factor 1: Price | −0.72 | 1.23 | |||
| IP15 | Reasonable price for food/accommodation | −0.47 | 1.43 | 0.867 | −0.199 |
| IP16 | Reasonable price for attractions/activities | −0.39 | 1.39 | 0.826 | −0.188 |
| IP18 | Parking availability | −1.35 | 2.17 | 0.542 | −0.074 |
| IP22 | Reasonable price of meals | −0.66 | 1.44 | 0.843 | 0.009 |
| Factor 2: Night-life | 0.18 | 1.08 | |||
| IP20 | Wide variety of cuisine | 0.05 | 1.26 | 0.236 | 0.791 |
| IP23 | Good night-life/entertainment | 0.30 | 1.35 | 0.216 | 0.798 |
| Eigenvalues | 2.54 | 1.33 | |||
| % of variance | 42.35 | 22.40 | |||
| Cumulative % | 64.75 | ||||
| Standardized Cronbach’s a | 0.75 | 0.54 | |||
KMO = 0.70, p < 0.001.
Table 5.
Summary results of the factor analysis of items in the “concentrate here” quadrant.
| Code | Factor (Proportion): Scale Name and Items | M | SD | Unrotated Factor |
|---|---|---|---|---|
| 1 | ||||
| Factor 1: | −0.53 | 0.97 | ||
| IP6 | Street cleanliness | −0.66 | 1.41 | 0.611 |
| IP19 | Quality of food | −0.52 | 1.19 | 0.818 |
| IP21 | Service in restaurants | −0.41 | 1.26 | 0.816 |
| Eigenvalues | 1.71 | |||
| % of variance | 56.94 | |||
| Cumulative % | 56.94 | |||
| Standardized Cronbach’s a | 0.60 |
KMO = 0.60, p < 0.001. Only one component was extracted and rotated methods cannot be applied.
Table 6.
Summary results of the factor analysis of items in the “potential overkill” quadrant.
| Code | Factor (Proportion): Scale Name and Items | M | SD | Unrotated Factor |
|---|---|---|---|---|
| 1 | ||||
| Factor 1: Variety | 0.27 | 0.93 | ||
| IP5 | Wide selection of restaurants/bars | 0.34 | 1.62 | 0.477 |
| IP10 | Wide variety of shops | 0.40 | 1.47 | 0.766 |
| IP11 | Wide choice of accommodation | 026 | 1.26 | 0.777 |
| IP12 | Interesting cultural attractions | 0.09 | 1.17 | 0.608 |
| Eigenvalues | 1.98 | |||
| % of variance | 39.71 | |||
| Cumulative % | 39.71 | |||
| Standardized Cronbach’s a | 0.59 |
KMO = 0.70, p < 0.001. Item 17 was removed due to its loading on factors lower than 0.45, and because its item–total correlation was less than 0.30. Only one component was extracted and rotated methods cannot be applied.
© 2018 by the authors. Licensee MDPI, Basel, Switzerland. This article is an open access article distributed under the terms and conditions of the Creative Commons Attribution (CC BY) license (http://creativecommons.org/licenses/by/4.0/).
Share and Cite
MDPI and ACS Style
Deng, J.; Pierskalla, C.D. Linking Importance–Performance Analysis, Satisfaction, and Loyalty: A Study of Savannah, GA. Sustainability 2018, 10, 704. https://doi.org/10.3390/su10030704
AMA Style
Deng J, Pierskalla CD. Linking Importance–Performance Analysis, Satisfaction, and Loyalty: A Study of Savannah, GA. Sustainability. 2018; 10(3):704. https://doi.org/10.3390/su10030704
Chicago/Turabian StyleDeng, Jinyang, and Chad D. Pierskalla. 2018. "Linking Importance–Performance Analysis, Satisfaction, and Loyalty: A Study of Savannah, GA" Sustainability 10, no. 3: 704. https://doi.org/10.3390/su10030704
Note that from the first issue of 2016, this journal uses article numbers instead of page numbers. See further details here.