Article

Comparing the Effects of Vehicle Automation, Policy-Making and Changed User Preferences on the Uptake of Electric Cars and Emissions from Transport

by
Christoph Mazur
1,2,*,
Gregory J. Offer
3,
Marcello Contestabile
4 and
Nigel Brandon Brandon
2
1
Chemical Engineering Department, Imperial College London, London SW7 2AZ, UK
2
Earth Science and Engineering Department, Imperial College London, London SW7 2AZ, UK
3
Mechanical Engineering Department, Imperial College London, London SW7 2AZ, UK
4
Centre for Environmental Policy, Imperial College London, London SW7 2AZ, UK
*
Author to whom correspondence should be addressed.
Sustainability 2018, 10(3), 676; https://doi.org/10.3390/su10030676
Submission received: 3 January 2018 / Revised: 19 February 2018 / Accepted: 22 February 2018 / Published: 2 March 2018
(This article belongs to the Special Issue Sustainable Transport: Transport, Environment, and Development)

Abstract

:
Switching energy demand for transport from liquid fuels to electricity is the most promising way to significantly improve air quality and reduce transport emissions. Previous studies have shown this is possible, that by 2035 the economics of alternative powertrain and energy vectors will have converged. However, they do not address whether the transition is likely or plausible. Using the UK as a case study, we present a systems dynamics model based study informed by transition theory and explore the effects of technology progress, policy-making, user preferences and; for the first time, automated vehicles on this transition. We are not trying to predict the future but to highlight what is necessary in order for different scenarios to become more or less likely. Worryingly we show that current policies with the expected technology progress and expectations of vehicle buyers are insufficient to reach global targets. Faster technology progress, strong financial incentives or a change in vehicle buyer expectations are crucial but still insufficient. In contrast, the biggest switch to alternatively fuelled vehicles could be achieved by the introduction of automated vehicles. The implications will affect policy makers, automotive manufactures, technology developers and broader society.

1. Introduction

In order to keep greenhouse gas (GHG) emissions below the target of 450 ppm of CO2-equivalent in the atmosphere by 2050, it is necessary to reduce GHG emissions by at least 50% relative to 2050. To allow for growth elsewhere, for many industrial economies this translates into a reduction by 80% or more [1]. Furthermore, to compensate for sectors of the economy where this is too difficult such as aviation and construction, it is likely that road transport will have to reduce GHG emissions by 95% or more [2]. This is only possible with an almost complete move to electricity [1,3]. This electrification depends on the success of a range of technologies such as plug-in hybrid (PHEVs), battery electric (BEVs) and hydrogen fuel cell vehicles (FCEVs). It is argued that, all these technologies are likely to be needed in a future road transport system, each playing a different role [1,4,5,6].
Governments are aware of this and most are doing something about it and in recent years have been creating and applying a variety of policies and regulations with the aim of promoting the uptake of electric vehicles. However, such policies are understandably often influenced by other national interests such as energy security, local air quality and economic development [7]. They also seem to have failed to address the barriers and externalities effectively, as the uptake has been significantly slower than many of the targets that were set, except for a few isolated examples (Norway or the Netherlands) [4,8,9].
Many previous studies have identified barriers for uptake of technologies, that go beyond purely technological or financial [10,11,12,13,14]. They already contributed to the understanding of past and future transitions and their challenges how to manage these [15,16,17]—also for future mobility and transport [18,19,20,21] with a number of quantitative studies [22,23]. In summary, they outline that the uptake of low carbon technologies has been hindered by factors that go beyond pure technology (battery/fuel cell performance or lifetime) and financial barriers (capital costs).
Now, with the increasing number of vehicles being offered by manufacturers and the automotive industry investing in the ability to supply large numbers of vehicles, there is an urgent need to test existing and possible future policies and measures to see if they are likely to deliver the outcome needed.
Furthermore, there is another technology revolution, automated vehicles, which has the potential to radically change the way that we own and use cars. It has already been argued that it could change all assumptions about global demand for mobility services and hence invalidate all previous attempts at predicting future energy demand from transport regardless whether it is from liquid fuels or electricity [24]. But how realistic is this?
To answer these questions, this study uses a systems dynamics model to explore the influence of different policies and measures on the uptake of electric vehicles and GHG emissions. It then simulates the effect of automated vehicles in the model based upon simplistic but plausible assumptions to assess the potential impact of this technology on the plausibility of meeting the required GHG emission reduction targets.

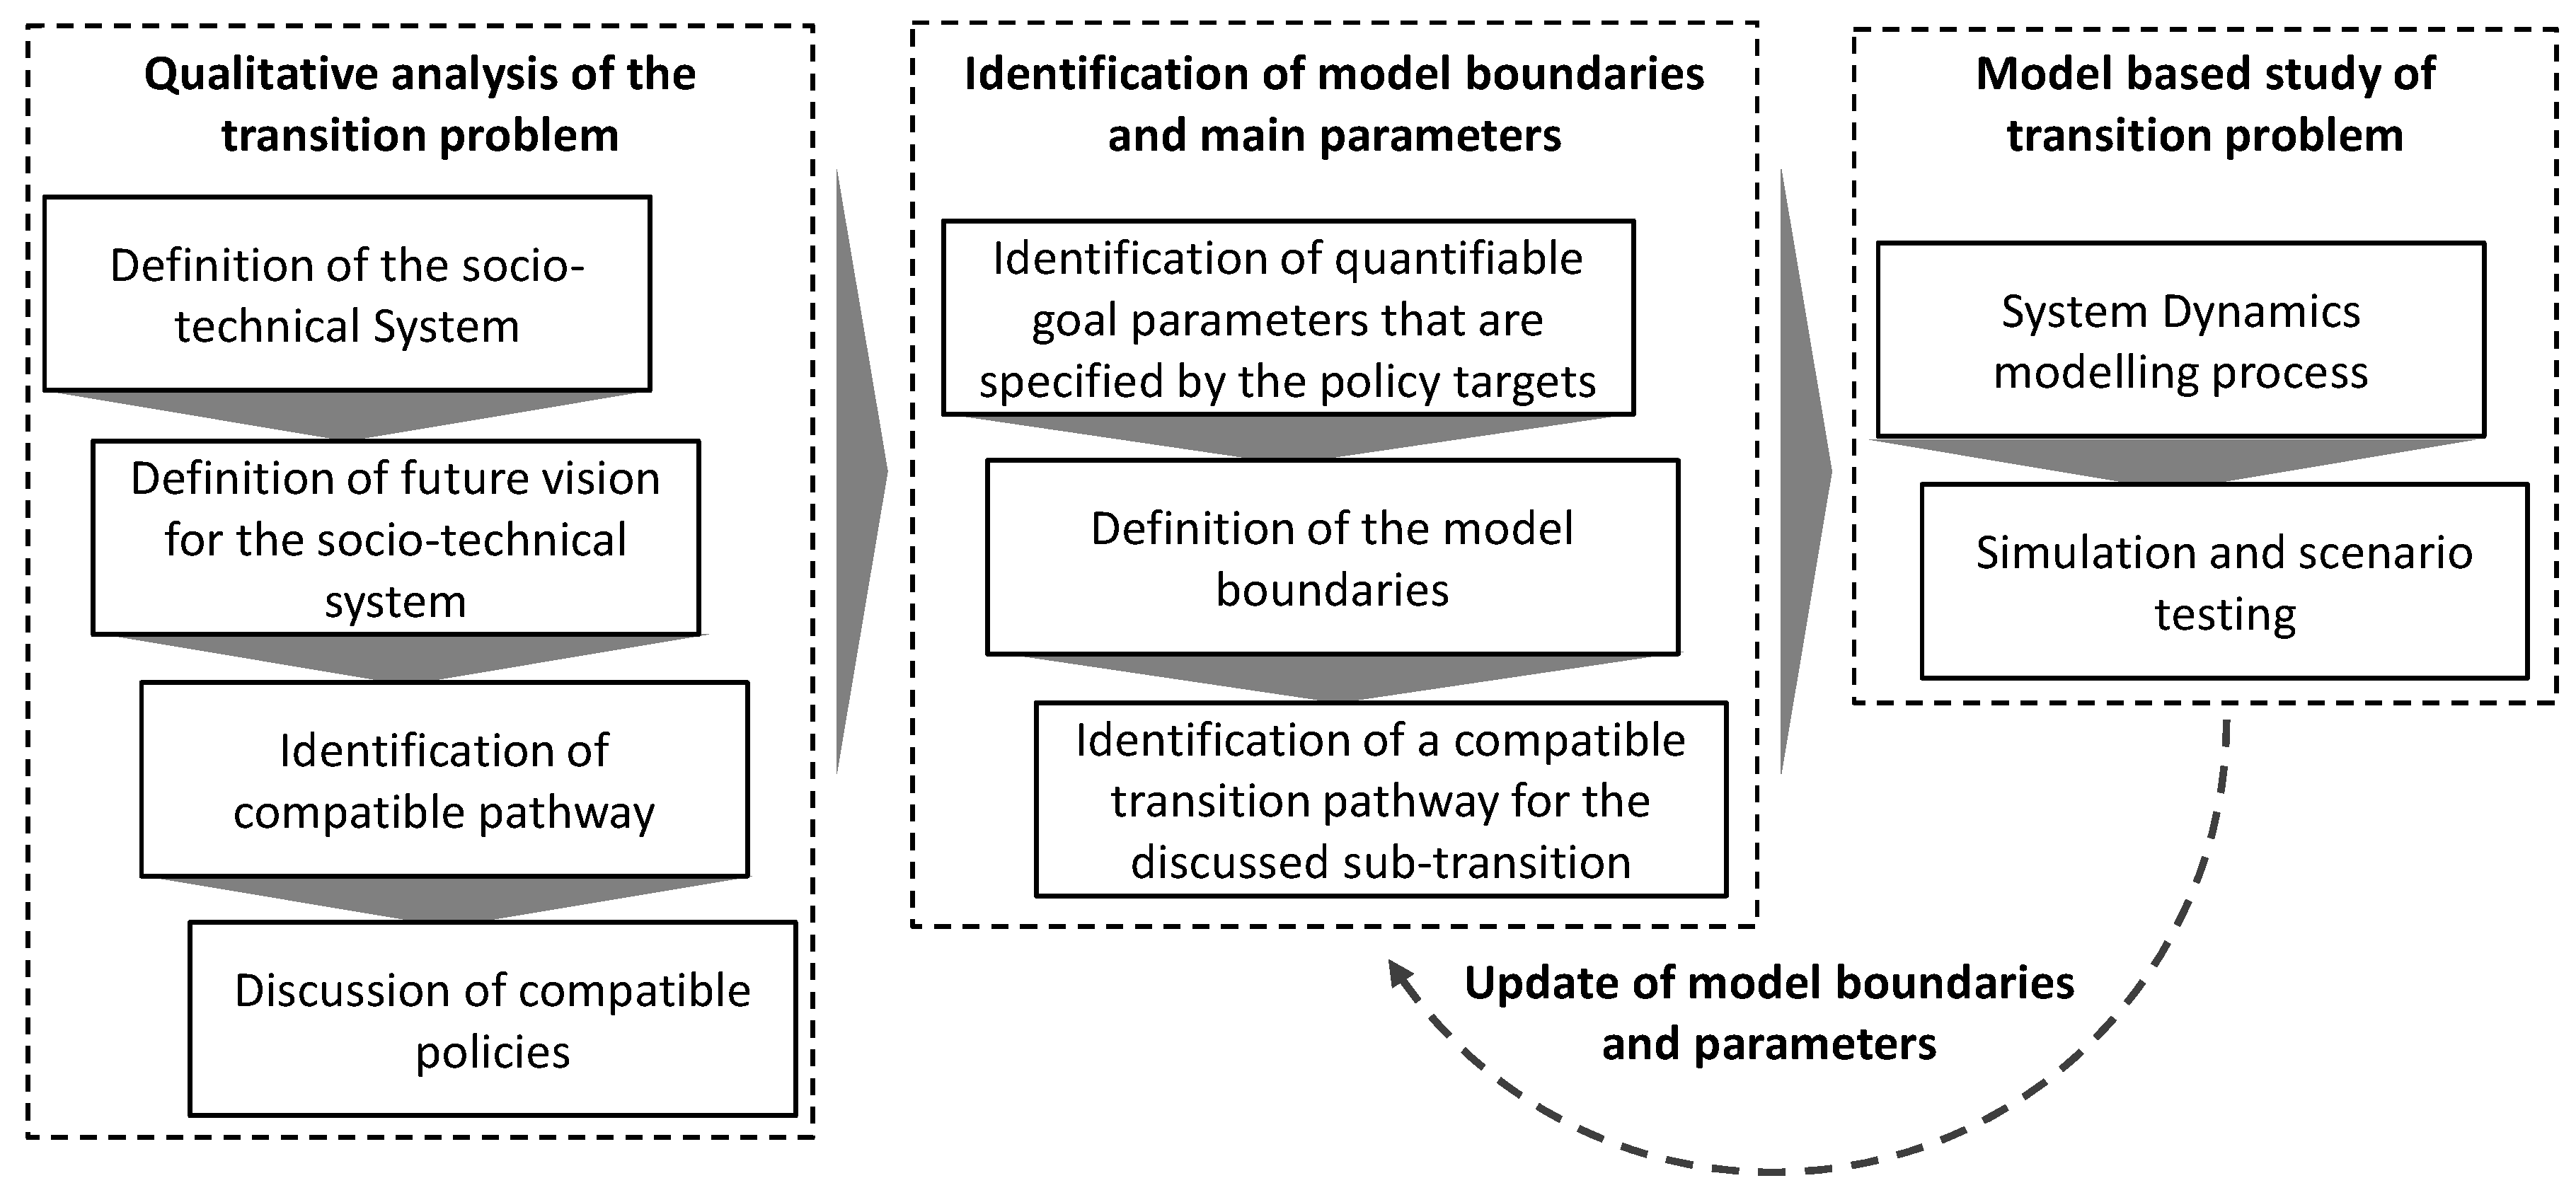
2. Materials and Methods
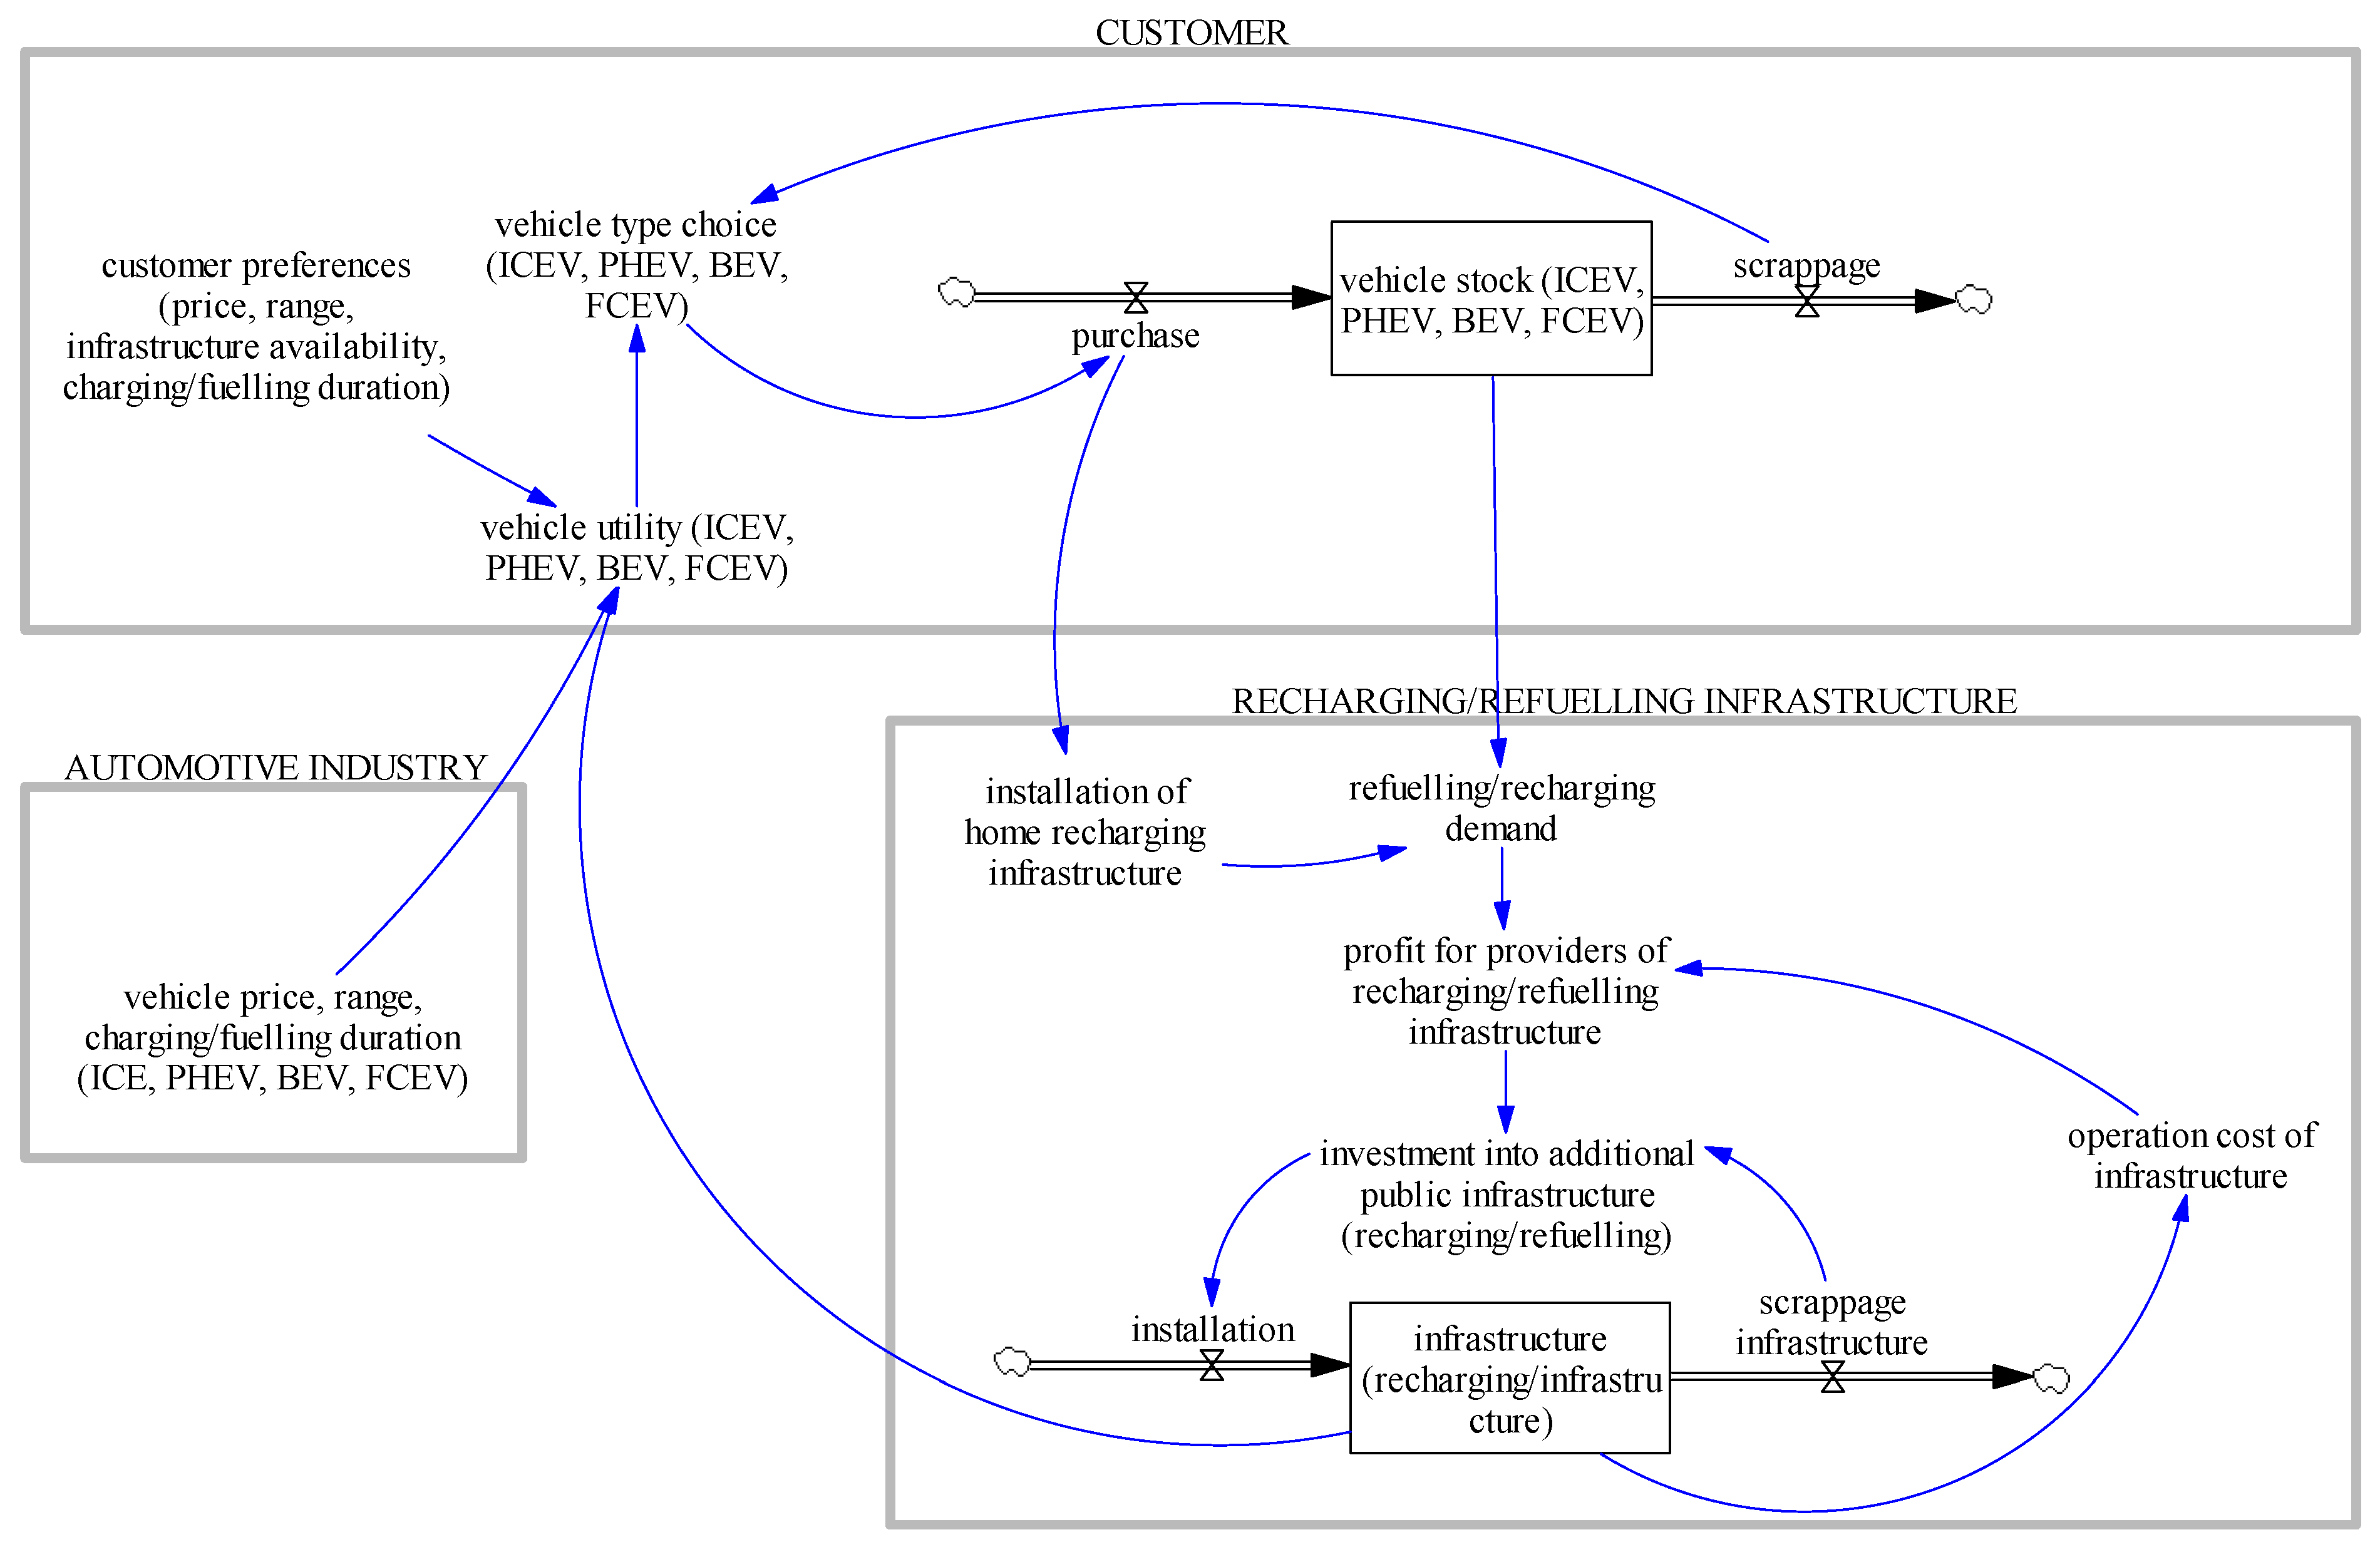
This study builds upon previous work and combines the insight from socio-technical studies that provide an understanding of general barriers [10,11,15,16,17] with the quantitative (system modelling approaches) [19,20,22,25] to include feedbacks and the rate of technology progress (batteries and fuel cells), different policies for the transition to electric mobility in industrialized countries, the effects of different user expectations and a possible uptake of Automated vehicles—and compares these. This is done by exploring the effect of various assumptions in a systems dynamics model that are designed to emulate or simplify the effect of particular policies or technological developments or other efforts. By doing so this paper is not attempting to explicitly predict the future, instead to explore what is possible and what might be necessary in order to ensure particular scenarios happen. A description of the systems dynamics model is included briefly below, with a full description including the underpinning assumptions and equations outlined in Section 2.2 and Section 2.3. Such types of models [19,25,26] have already been used successfully in the past to describe the uptake of low carbon vehicles but have not drawn on the insights of socio-technical research or tested the implications of autonomous vehicles.
The model is used to explore faster technology progress, changing consumer preferences, different policies and the effect of automated vehicles on the uptake of electric vehicles. These scenarios are then compared to a business-as-usual control scenario with assumptions simulating the present-day situation as closely as possible. This goes greatly beyond recent studies that have discussed the impact of autonomous vehicles on GHG emissions only and did not consider the impact on the likelihood of the transition [24,27].

2.1. Model Overview

System Dynamics has proven its usefulness in a number of studies [25,28,29,30] which successfully explored the behaviour of systems during technology diffusion scenarios. And, recent research [22,31] has already outlined the possibility or started successfully incorporating parts of Transition Science and the Multi-Level Perspective into System Dynamics. Figure 1 outlines the approach that has been taken to conduct this study.
In past work [7], the transition problem has been analysed in a qualitative manner in order to determine what types of policies are suitable to satisfy the policy makers targets. To allow a model based analysis of the transition in a second step, model boundaries and the main parameters have been identified. This then led to the creation of a model that is specific to the identified transition policy targets. Between the third and second step there is an iterative feedback loop which is driven by this explorative modelling approach. The modelling approach itself follows a standardized system dynamics approach [32].
In past studies [33] it was shown that the UK government is focussed on environmental targets and especially the 80% GHG emission reduction by 2050. The UK also has industrial goals as it would like to support and grow its local automotive industry. This includes indigenous manufacturing of its foreign owned local car manufacturers as well as the local indigenous suppliers. A compatible pathway that can link the current state of the system with the desired future state of the system is the reconfiguration pathway—where the current regime players (car manufacturers) still exist but where suppliers will be replaced by new ones.
This implies that the change to electric vehicles is executed by the current main part of the regime (mainly automotive industry) that stays stable while the suppliers of the regime are replaced by new or currently niche ones. This implies that the existing automotive industry will be part of the model.
There are a number of compatible policy measures. They include the support of the supply side through subsidizing industry R&D projects as well as the support of the demand side through the help of subsidies. These can include infrastructure subsidies, vehicle purchase subsidies or tax reductions for low emission vehicles. However, while a number of compatible policies have been outlined it is unclear so far which ones are likely to be effective in reaching the targets outlined here.
Focusing on the environmental target in this study, the 80% GHG emission reduction by 2050 and taking into account the average lifetime of a vehicle, means that all newly sold vehicles would have to be zero-emission vehicles already before 2040. To describe this with the help of a simulation it is necessary to model the system that defines which vehicle type is sold—hence the market penetration of each drive-train technology: internal combustion engine vehicle (ICEV), PHEV, BEV or FCEV. And as the existing car manufacturers are expected to continue to exist and to deliver these vehicles, the model will not have to describe the evolution of this industry endogenously. Assuming all vehicle types are available, the vehicle sale itself and therefore the choice of the vehicle type is mainly determined by the customers who choose the vehicle. Therefore, it is necessary to model the customer choice of the vehicle type for each year. However, the values for these parameters depend on the vehicle type and are defined by the automotive industry that designs and builds the different vehicle types for the market. Hence the automotive manufacturers are also part of the model. The same goes for the infrastructure providers whose actions determine the availability of recharging/refuelling possibilities as well as the recharging time and hence this is also related to the decision preferences of the customers.
To summarize, a model that will look into the choice between the various vehicle types and therefore the diffusion of zero emission vehicles will have to include the following components (or actors) (cf. Figure 2):
  • Customer choice (choice of the vehicle type)
  • Automotive industry (provision of the different vehicle types)
  • Recharging/refuelling infrastructure providers (provision of recharging infrastructure)
It can be seen in Figure 2 there is one major feedback loop between the Customer (vehicle choice) and the Recharging/Refuelling infrastructure. There are also further exogenous factors such as the specification of the vehicle (Automotive industry) as well as the customers’ preferences or the operation cost of the infrastructure that can influence this major loop. However, the major loop is still the infrastructure availability and vehicle penetration loop.
The question is then, to what extent do the exogenous variables change the dynamic behaviour of the system and what dynamics are embedded into the system. And even more relevant for the discussion in this section, how do exogenously introduced policy variables such as subsidies, legislation or taxes affect this system?
The main outcome of the automotive industry part of the model is the availability and price of the vehicle drive train types. While in the current regime vehicles are mainly ICEVs, the future target requires the use of BEVs, PHEVs or FCEVs; though PHEVs should ideally operate mainly in electric mode. These three (BEVs, FCEVs and PHEVs) are referred to as niches in this work as they are currently the possible alternatives that are competing with the regime (ICEVs) as well as with each other. However, bearing in mind that a majority of the vehicles produced in the UK are exported abroad and a majority of the vehicle actually sold in the UK are imported from abroad, the influence that the UK has on the global provision of alternative vehicles is assumed to be negligible.
As a result, it is assumed here that the global automotive industry will dictate the types of vehicle technology, prices and specification of vehicle sold globally and in the UK. This is supported by the fact that the big manufacturers as well as lead markets for automobiles such as California have historically determined what vehicle types and solutions dominate [33,34,35]. As a result, the automotive industry and especially the provided vehicle types will be described in an exogenous way. This allows a variety of available scenarios [6] to be used that outline possible future vehicle types, prices, drive ranges etc.
The recharging/refuelling infrastructure providers provide the means to refuel or recharge the vehicle fleet. This is relevant for the model as the customer choice with regard to alternative vehicles is also influenced by the provision of recharging/refuelling infrastructure. While it exists for petrol, it is still limited for BEVs and PHEVs and hardly exists yet for hydrogen.
As this service is entirely provided by stakeholders within the UK and additionally can be directly affected by policy makers (e.g., through subsidies) it will be modelled in an endogenous way.
The customer component determines which type of the vehicle is chosen by the customers. In order to describe this part, it is necessary to know the preferences of the customer with regard to the various vehicle parameters. Furthermore, it is necessary to know how many vehicles are being purchased per year and how the stock is changing.
Hence a major part of the modelling is focusing on this aspect, especially as this is the main component that determines the diffusion of the vehicle types and therefore the satisfaction of the policy target.

2.2. Model Equations

According to UK Department for Transport [36] a number of specific characteristics are taken into account by the customer when they are thinking of the purchase of a low emission vehicle. These parameters are mainly (1) price (or total cost of ownership (TCO)); (2) the range and (3) the recharging/refuelling (cf. Table 1). The recharging/refuelling can be further split into recharging/refuelling duration as well as the availability of recharging/refuelling possibilities. These have been aggregated in a utility factor, with weights based upon a study commissioned by the UK Government [36]. While consumers may discount in their purchase decisions capital costs and operating cost differently, we have chosen not to separate these for their decision due to simplicity.
The market share of each vehicle type depends in our approach on the probability which vehicle type is being chosen. This is based upon a ‘multinomial logit choice’ discrete choice approach as already used in past studies [25,26,37,38,39,40]. More details on the specific discrete choice approach that has been applied in this study can be found in UNECE Transport Division [40,41,42]. Beyond that, Table 1 outlines the main model equations.

2.3. Data

This section outlines the initial values as well as sources for the various parameters: Table 2 the constant and initial parameters for the customer component, Table 3 for the infrastructure and Table 4, Table 5, Table 6 and Table 7 for the automotive industry.
The calibration of the model is difficult as there is hardly any data on the diffusion of the various vehicle types that goes beyond 2011, especially as the vehicle choice (PHEV and BEV) had been very limited—it is even limited right now in 2017.
Still with purchase data provided for 2011 until 2013 the model (cf. Table 8) and particularly the scale factors of the discrete choice model have been calibrated (cf. Table 2).

2.4. Assumptions

The result is based upon a number of assumptions. First, it strongly depends on how the prices of the vehicles will develop over time. There are a vast number of studies available on the future cost of different vehicle powertrains. However, in order to not study this, which will obviously favour the powertrain with the lowest cost, it has been assumed that all powertrains will converge to similar costs [6] and instead increases in funding for technology development will affect how quickly they converge. This means that this paper studies the effect of other measures.
Secondly in this model the automotive industry is described exogenously. It does not therefore provide any constraints with regard to the speed of setting up new manufacturing capacities that would provide the demanded vehicle types, ignoring any feedback between this and the policies introduced or consumer preferences. Also required investments into production capacities are not taken into account here. For example, it is entirely possible that the major players in the automotive industry could decide to support one technology over another and predetermine the future, but it is impossible to predict and therefore model this.
Thirdly, the effect of significant increases in demand for mobility services caused by the introduction of automated vehicles was not considered but as discussed in previous work, could lead to an increase in GHG emissions solely due to increased demand [24].

3. Results

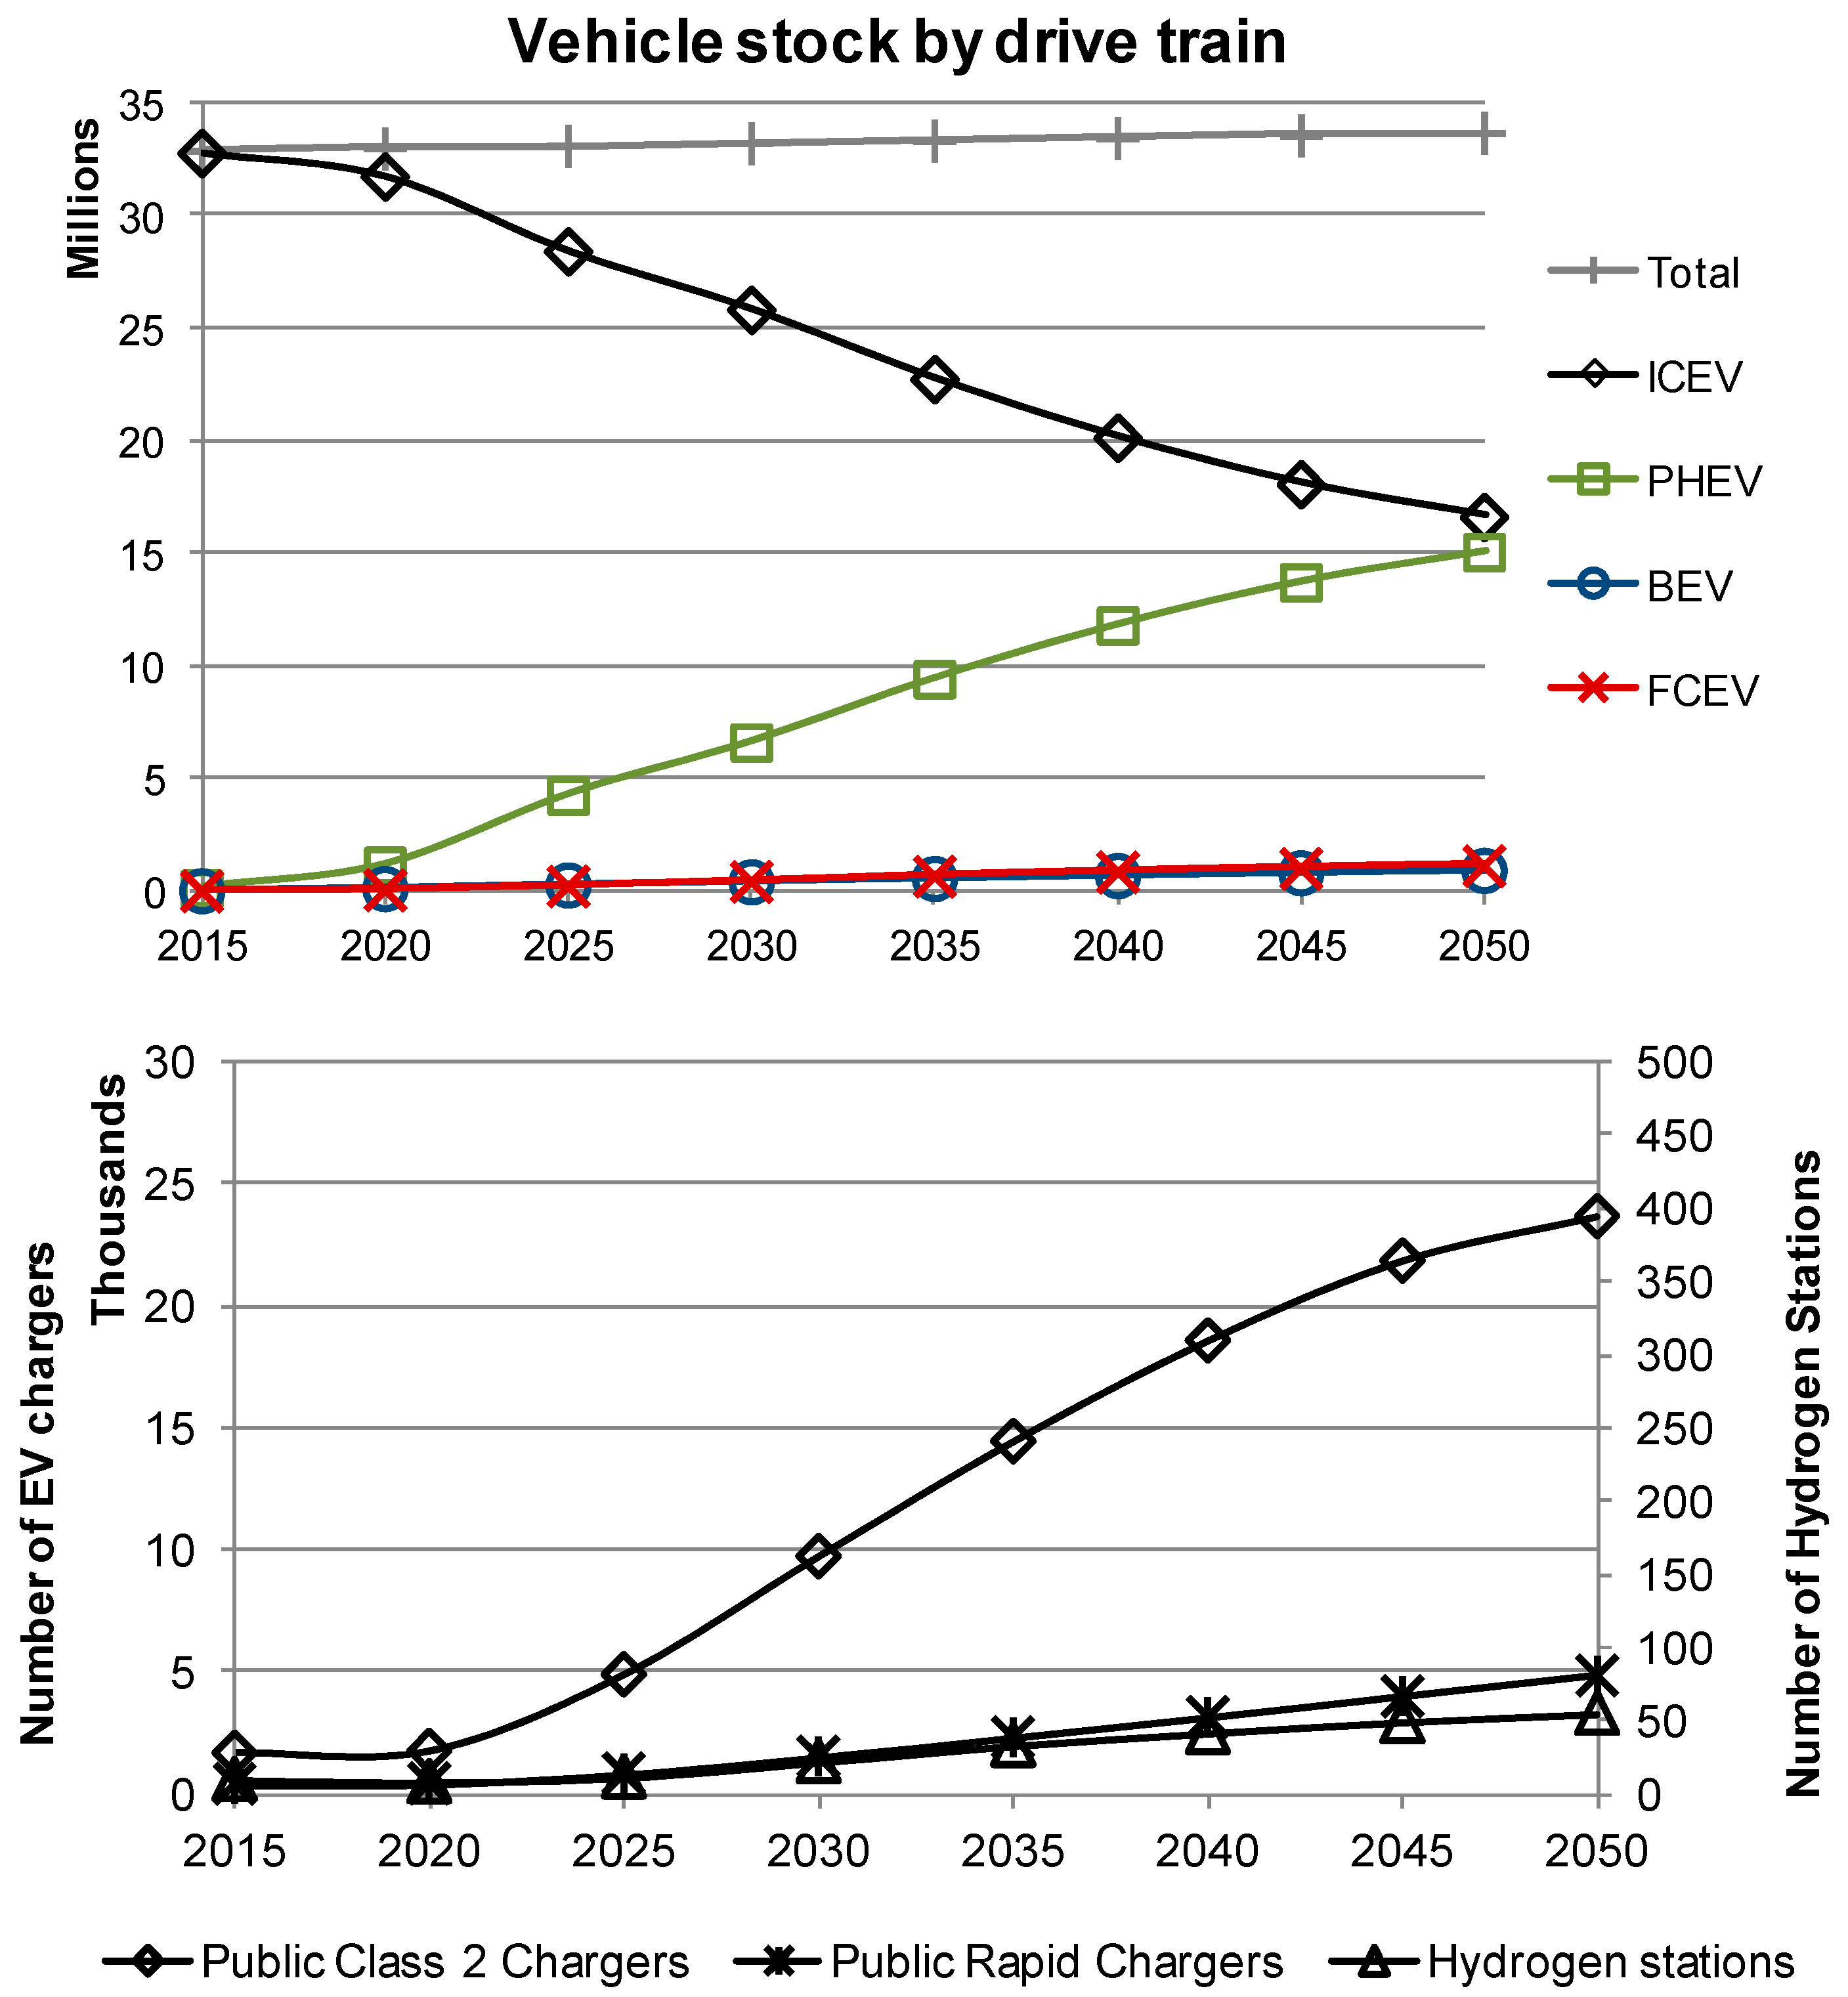
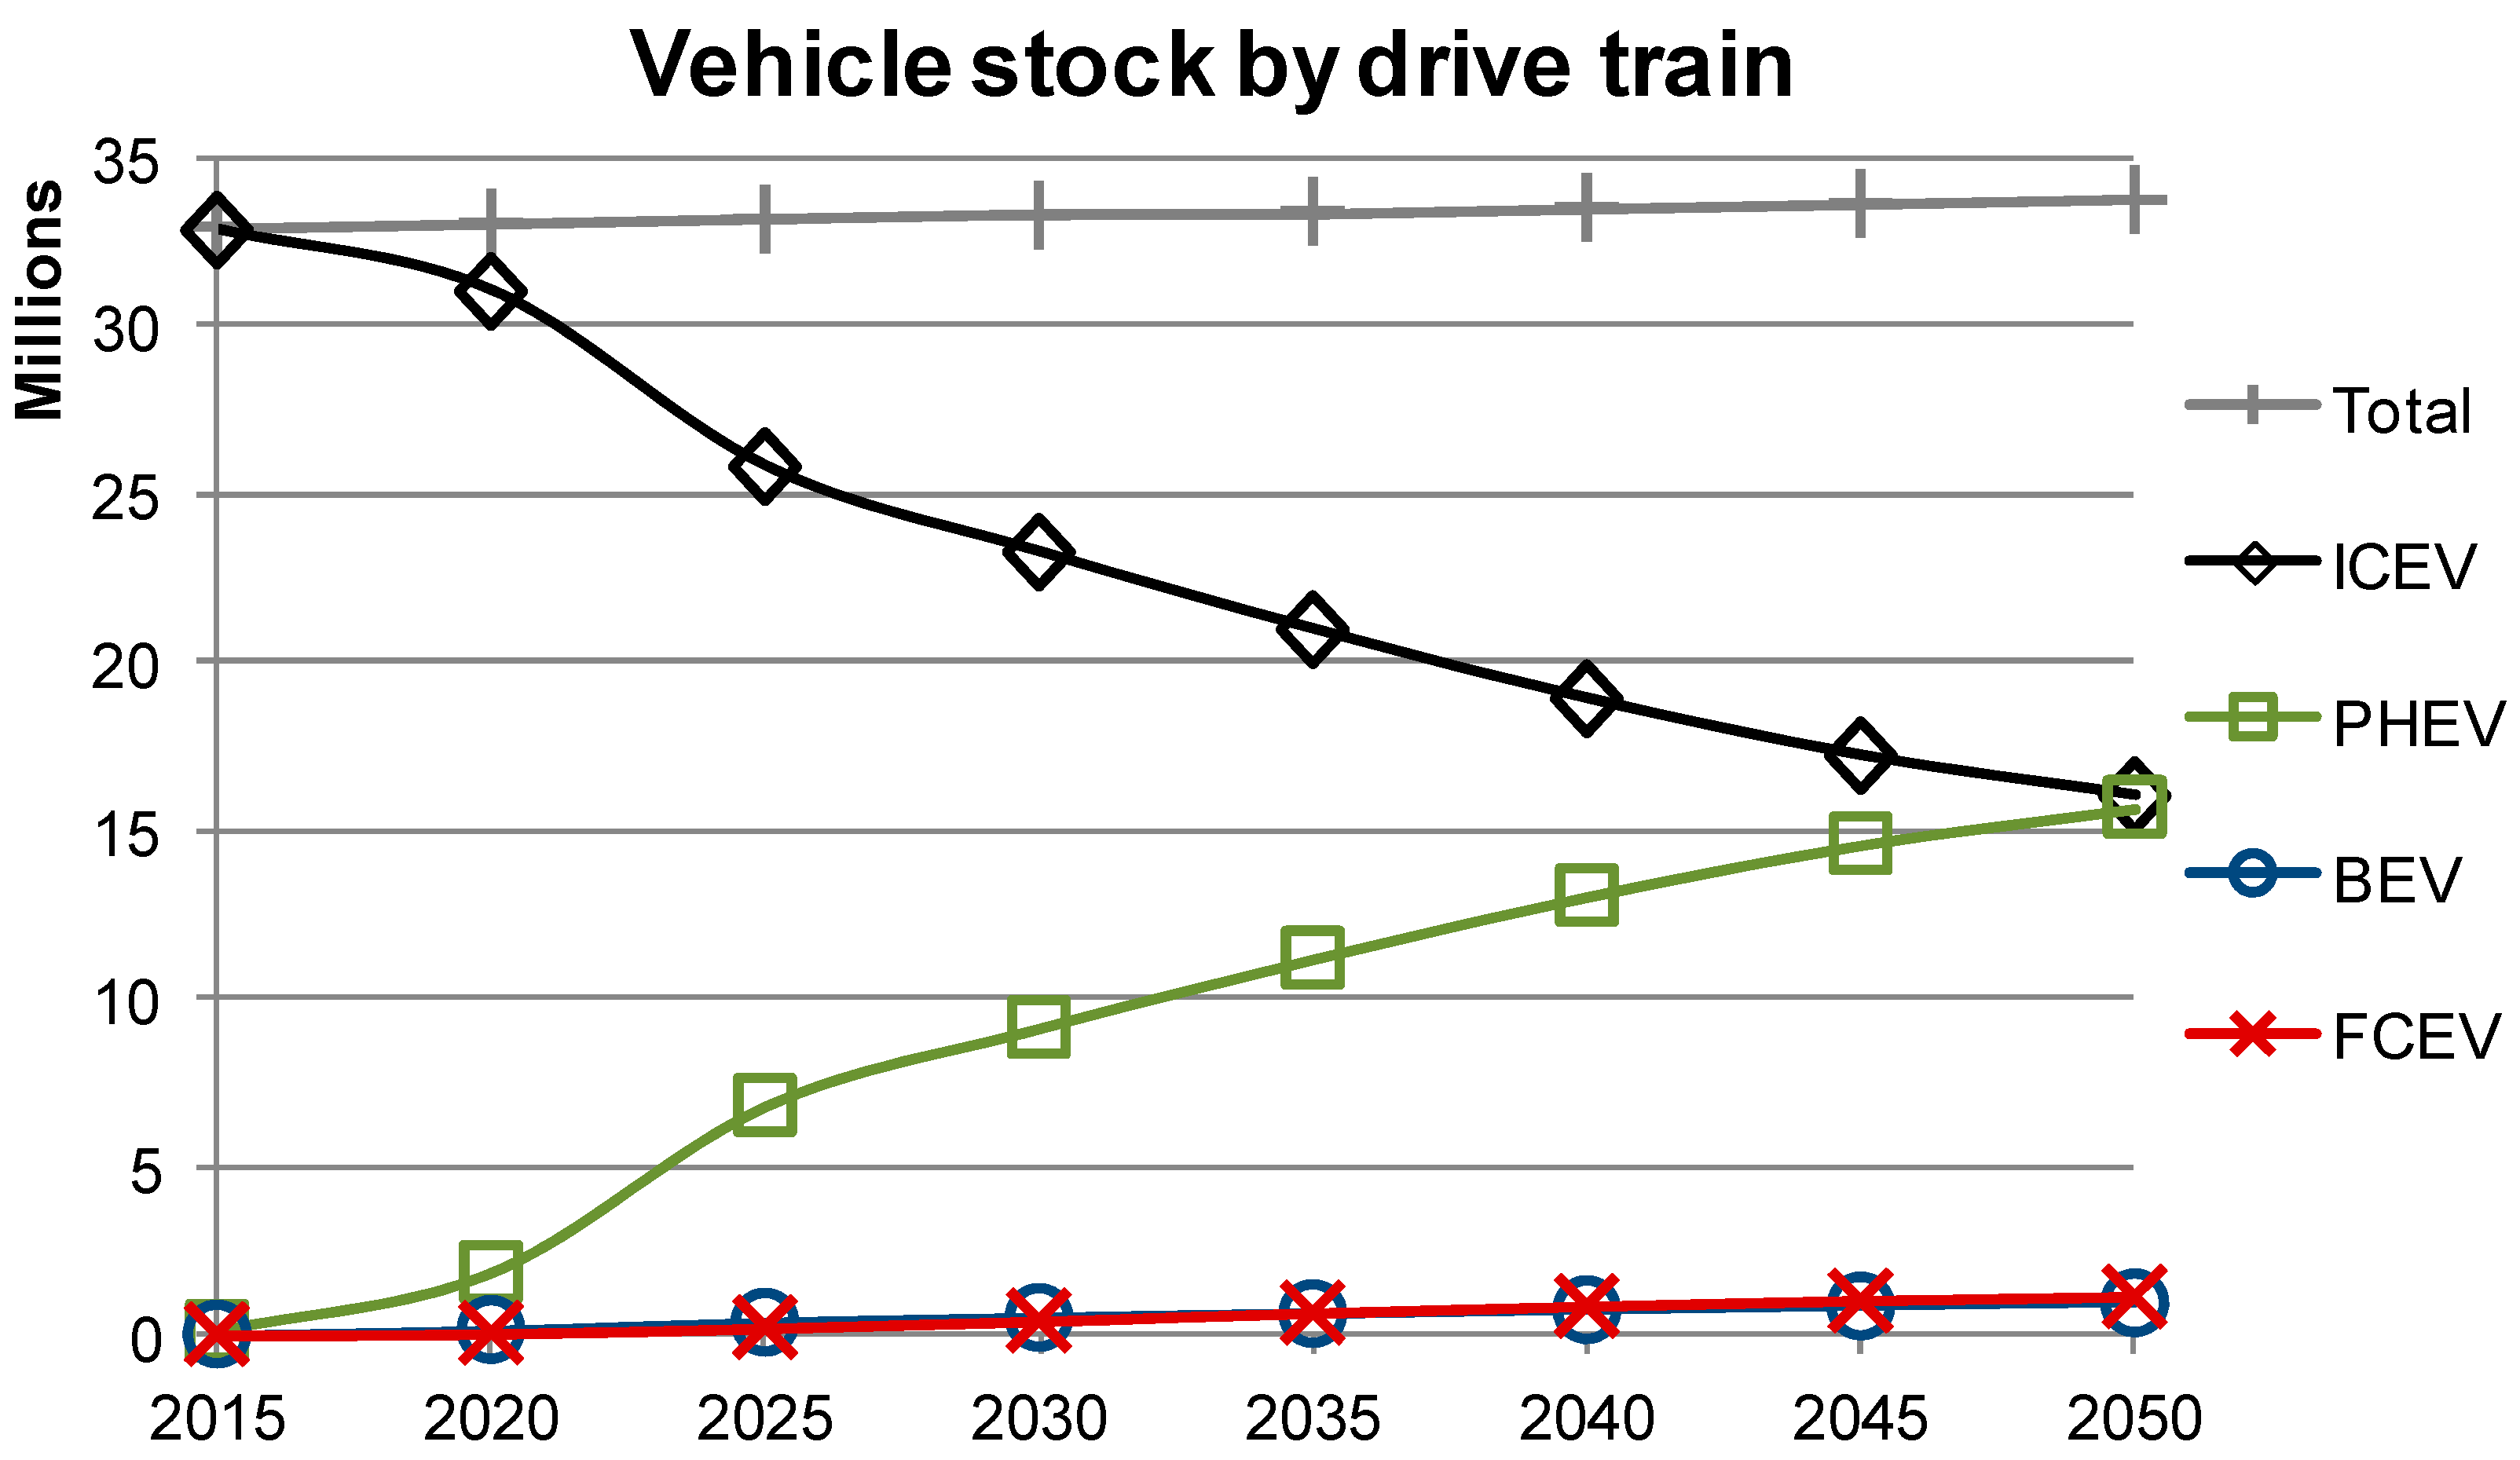
3.1. Business-as-Usual Scenario

In order to explore how changes in technology, policy or consumer preferences affect the uptake of low emission vehicles, firstly, a business-as-usual scenario for the United Kingdom until 2050 has been simulated. Using a system dynamics model, the vehicle stock as well as the infrastructure is modelled. This model takes into account the long-term development of the total vehicle stock, current cost predictions for the different drive train technologies [6] and consumer preferences with regards the vehicle performance [36]. These preferences affect the consumer choice. Furthermore, to reproduce the influence of current policy, vehicle purchase grants for low emission vehicles (€6500) and for recharging infrastructure (75%) have been taken into account as well (maintained until 2025 in order to describe an optimistic case).
As shown in Figure 3, it can be seen that in the business-as-usual scenario the diffusion is not likely to satisfy the policy makers’ targets. The GHG emissions in 2050 are shown in Figure 8 and have only been reduced by about 30% and most transport energy demand is met with fossil fuels. The share of ICEVs only decreases by around 50% until 2050 and they are mainly replaced by PHEVs. Though PHEVs are expected to be driven mainly in full electric mode, this is insufficient to reduce emissions significantly enough. Furthermore, there is hardly any uptake of zero tailpipe emission vehicles such as BEVs or FCEVs.

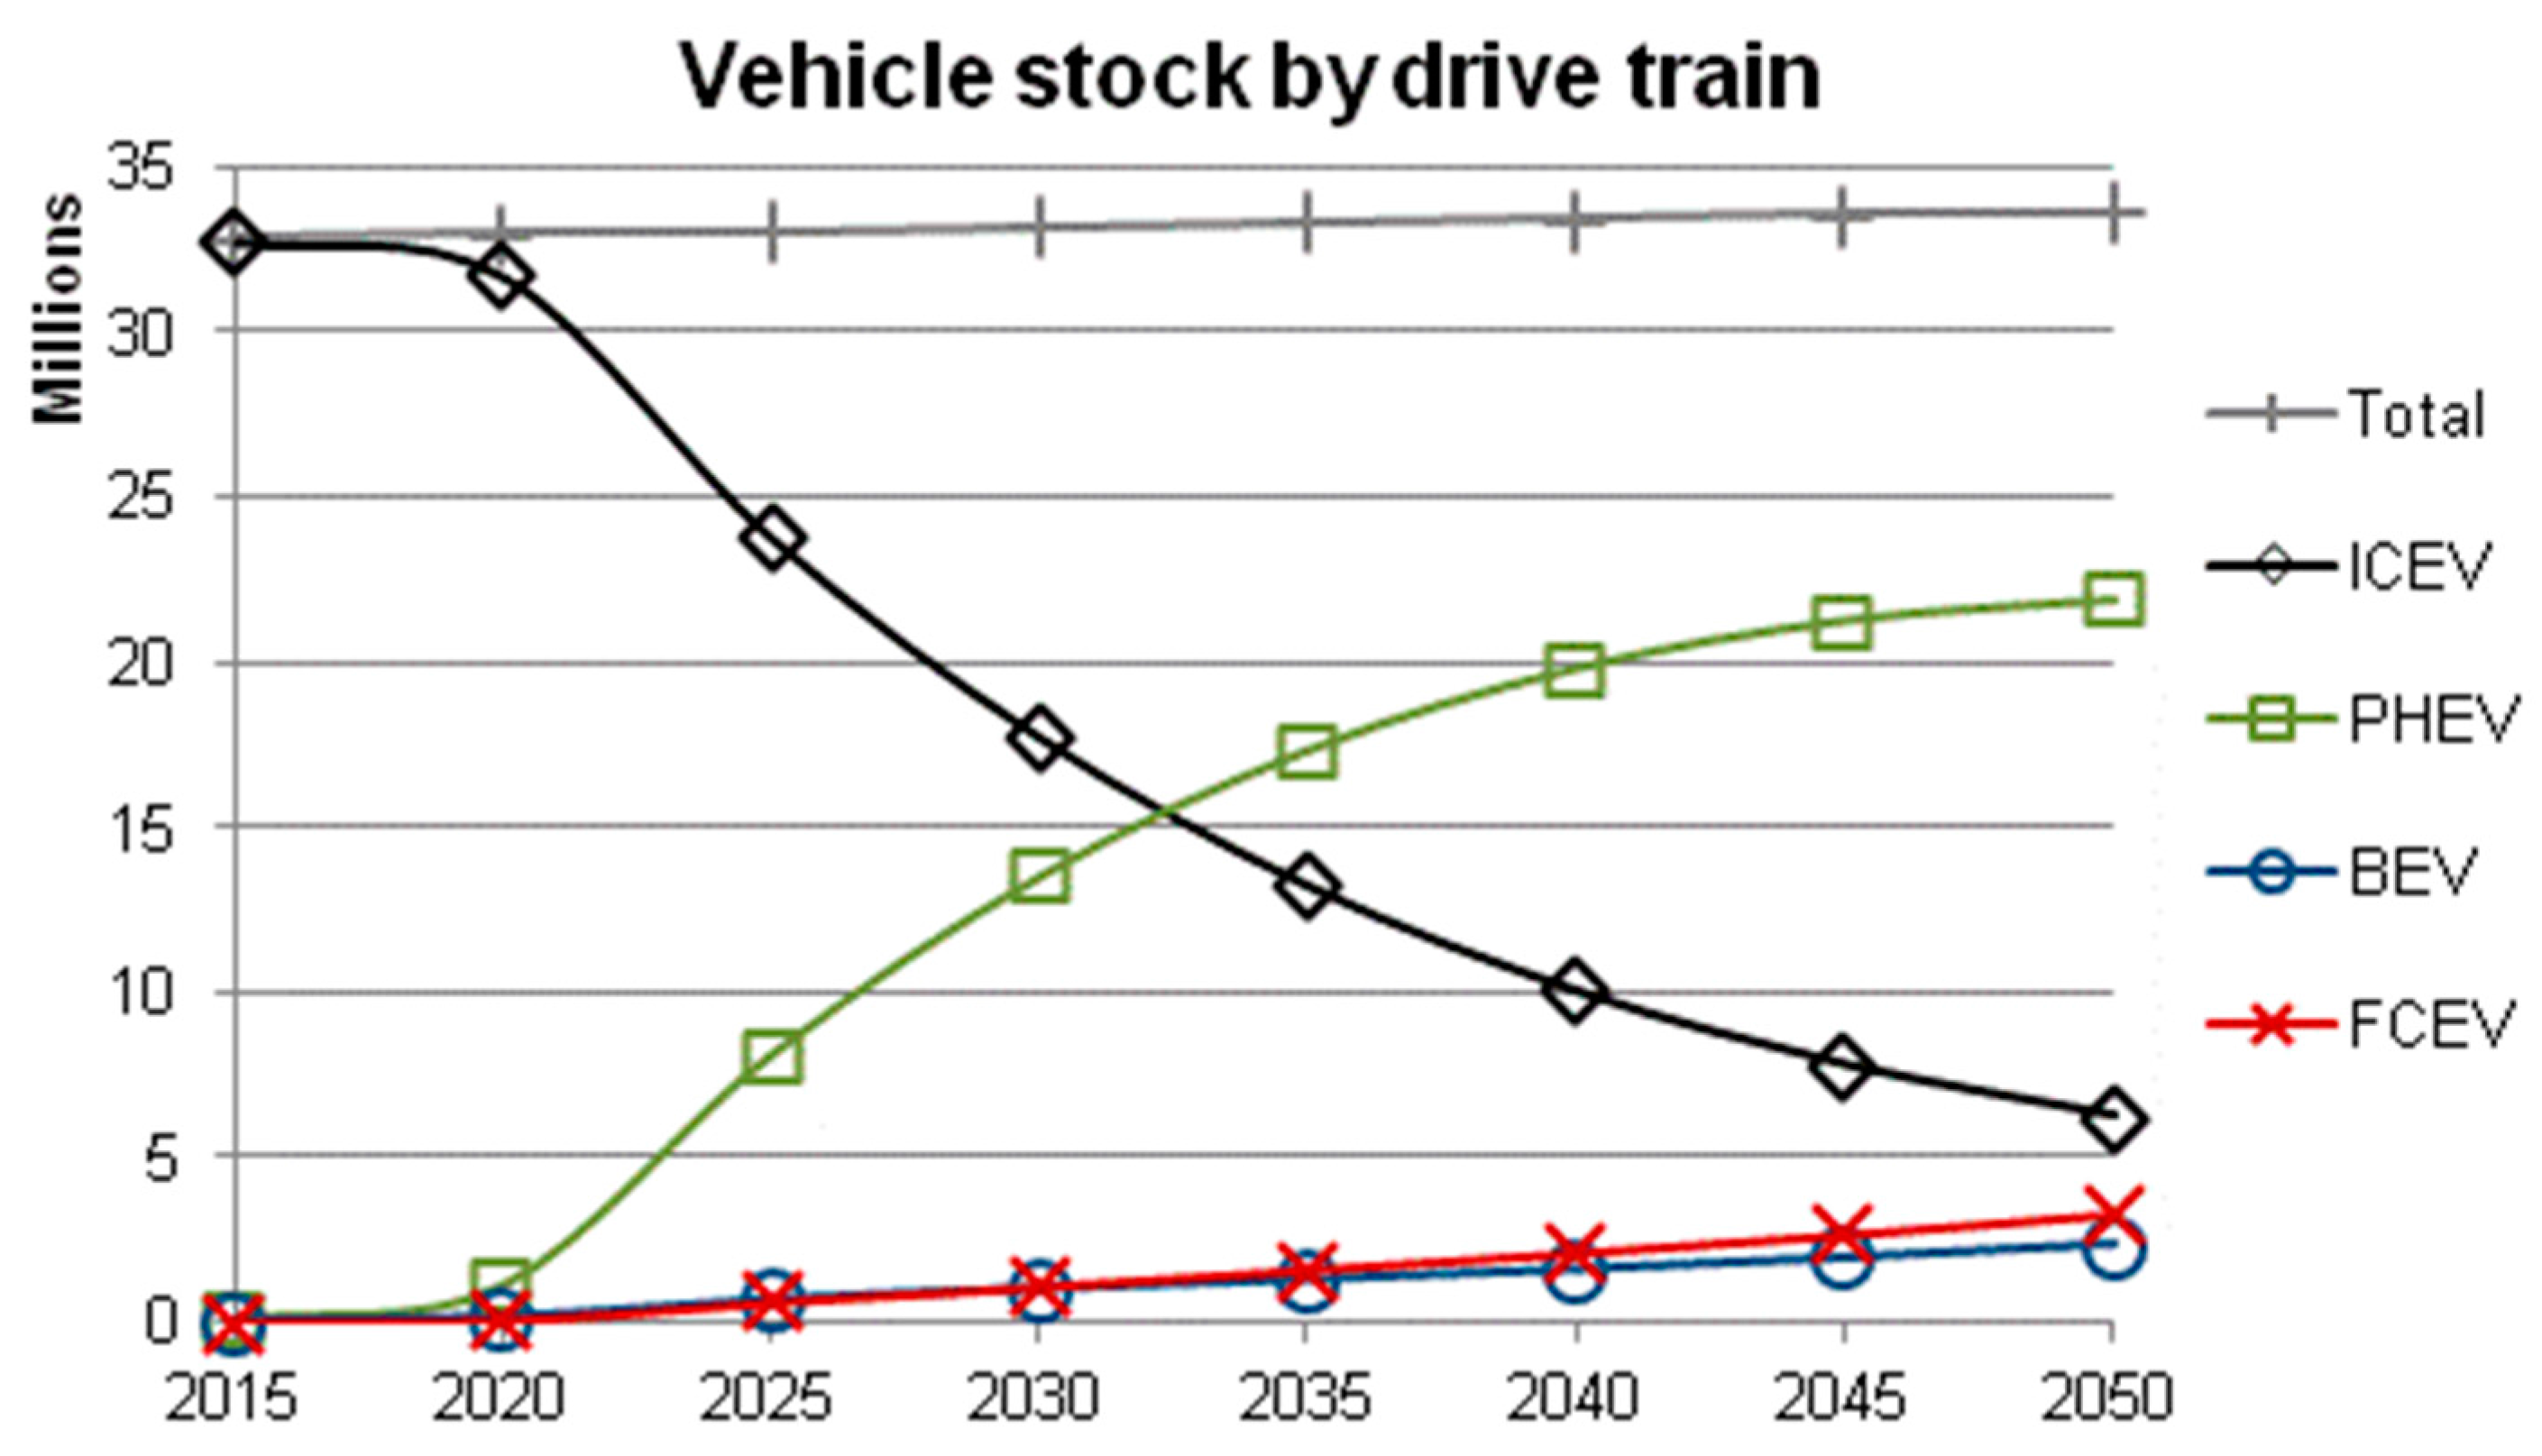
3.2. Technology Optimistic Scenario

In the recent years, battery technology performance and cost have improved faster than expected [55]. In this scenario the cost curves for the PHEV, BEV and FCEV, between 2015 and 2020 (see Table 9 for changes) have been changed so they reflect a faster convergence against the predicted long-term costs from the business as usual case (see Method Table 7). The long-term costs of each alternative powertrain relative to the others, however, have not been changed as it is assumed in this study that the long-term assumptions will be still valid. This was also done to ensure that a winner is not predetermined, as it is all too easy to conclude that FCEVs will beat BEVs or vice versa just by playing around with the assumptions [56].
As shown in Figure 4 it can be seen that the move to PHEVs happens faster, while the overall result is similar to the one outlined in the reference case—hence technology progress on its own is not sufficient to reach policy targets, particularly as user preferences such as range anxiety still play a crucial role.

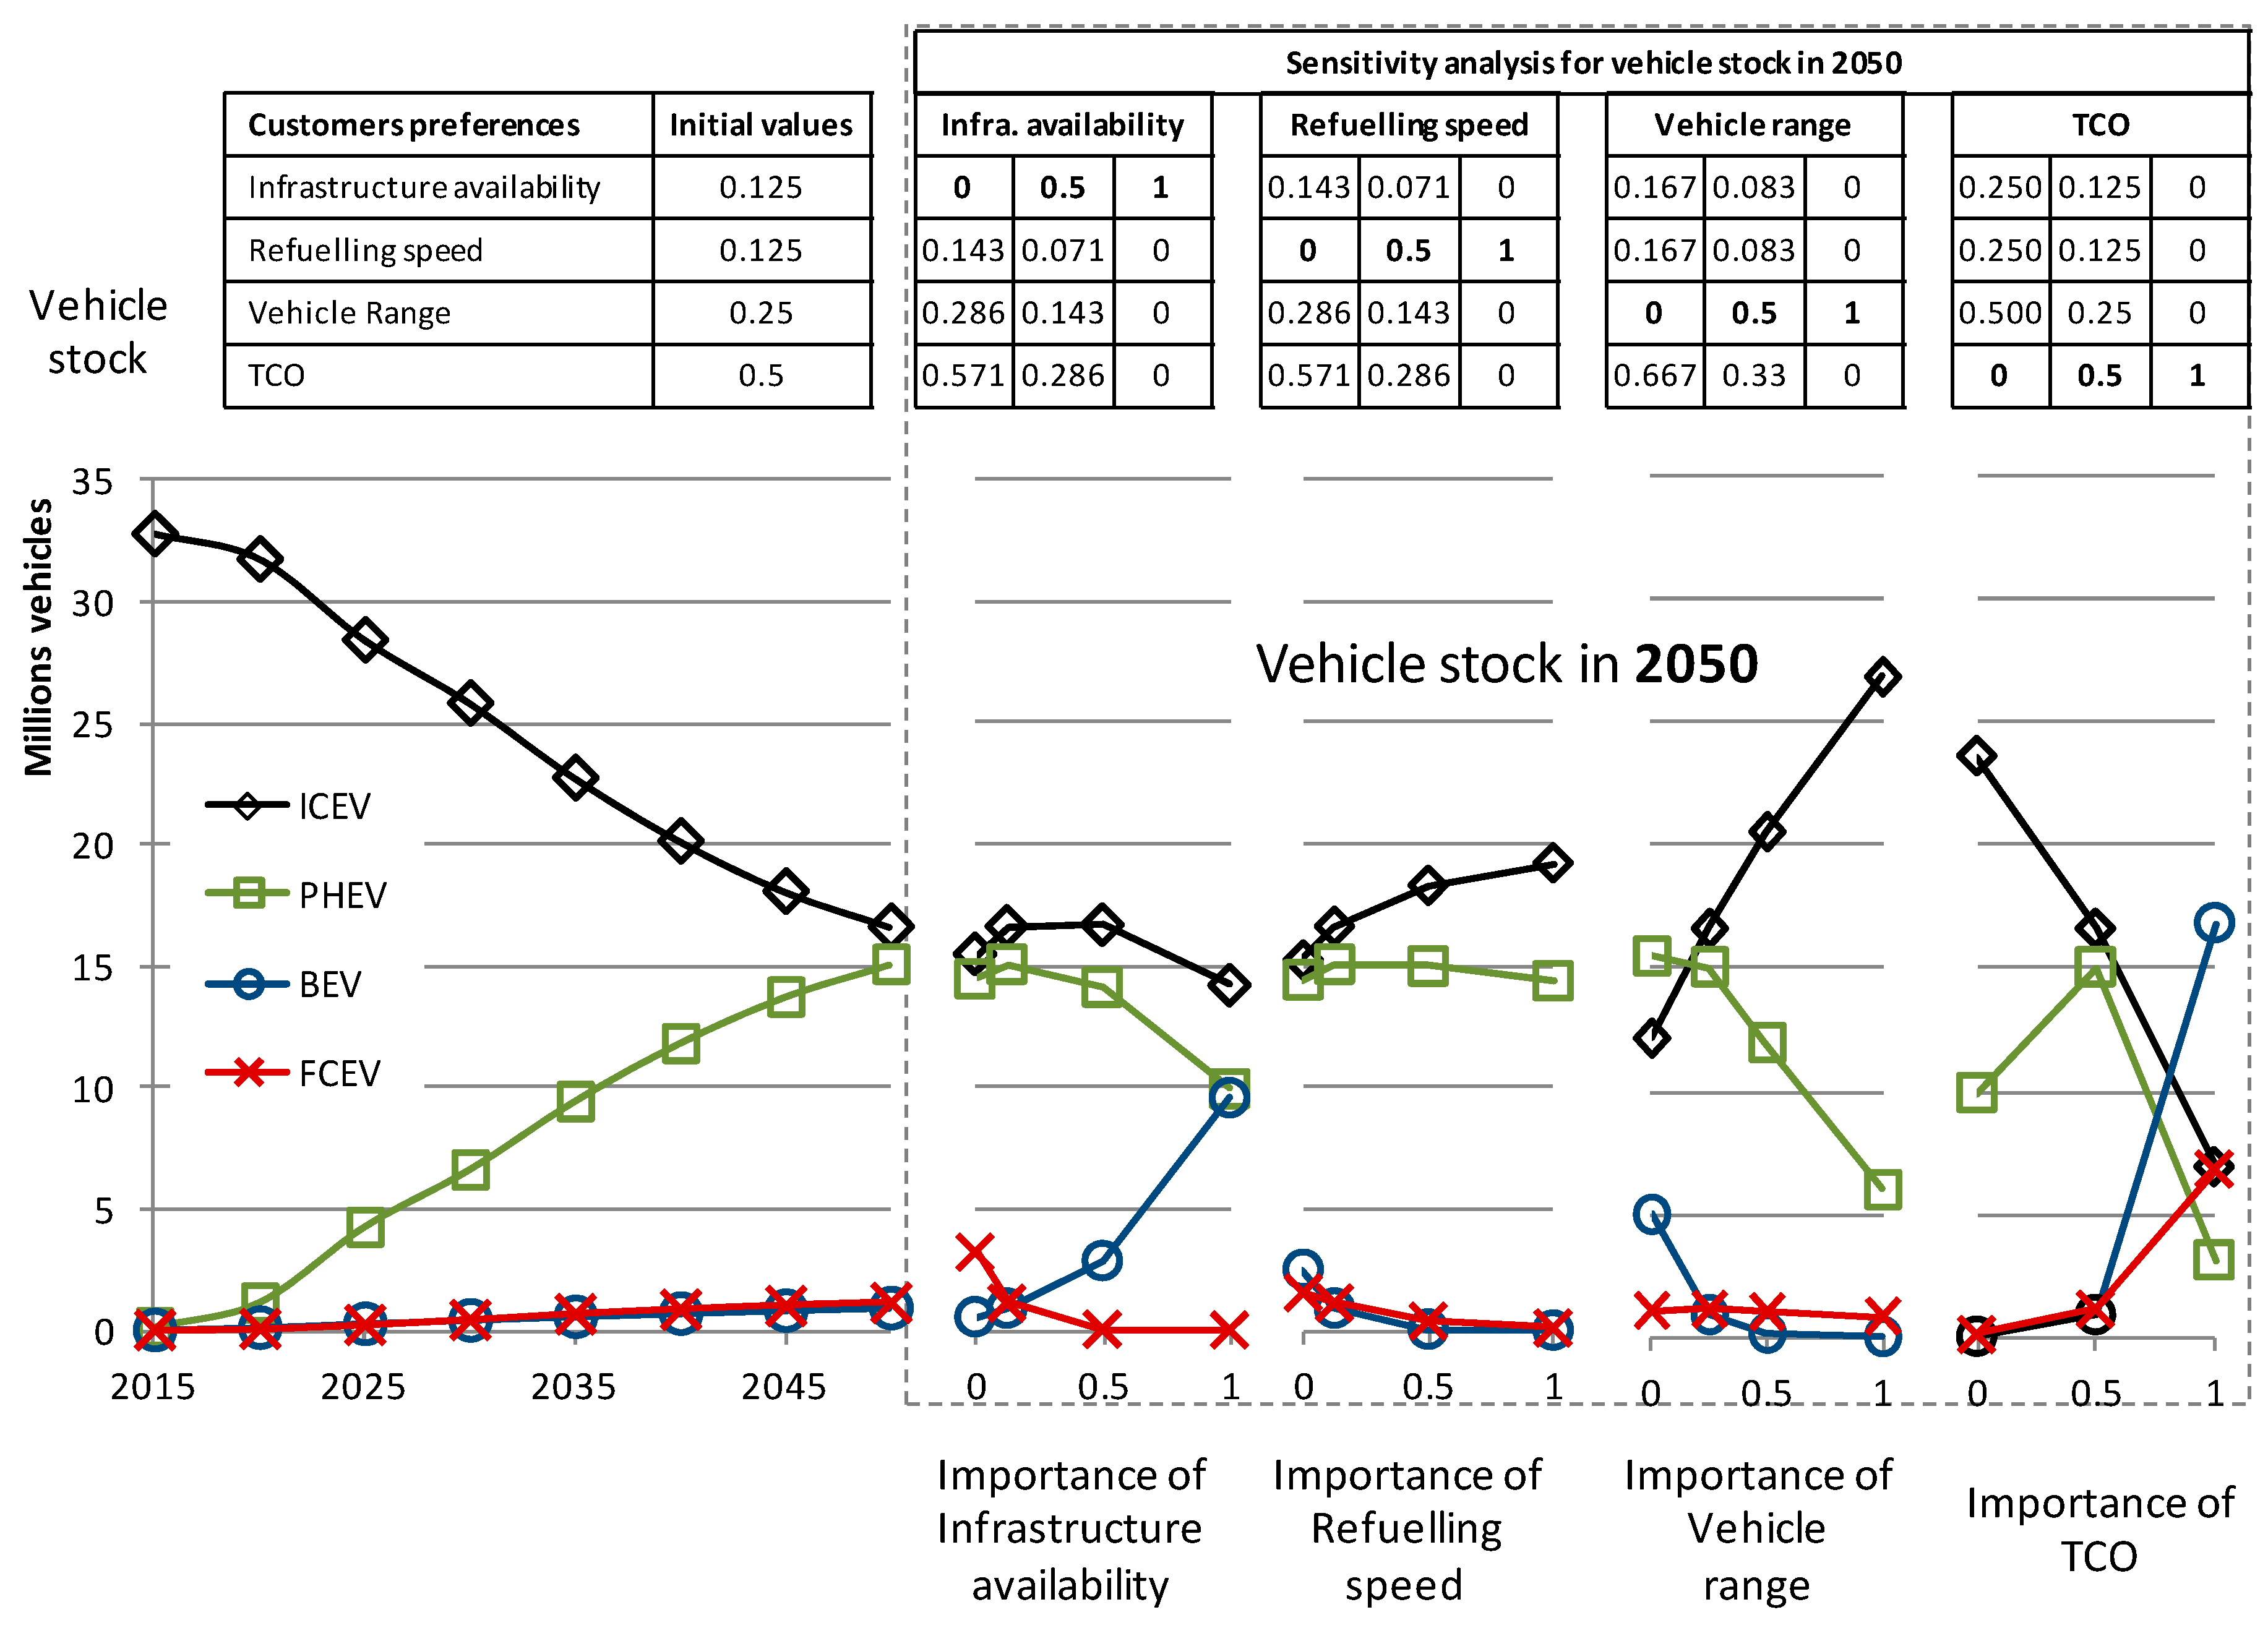
3.3. Changing Customers’ Preferences and Expectations

The consumer choice of a vehicle type strongly depends on the preferences with regards to vehicle range, recharging time and the TCO. To assess the effect of these preferences a sensitivity analysis on these buyers’ preferences, were varied one at a time with values of 0, 0.5 and 1.0, reflecting the extremes of each preference. As shown in Figure 5, the effects on the result for 2050 are shown on the right-hand side, against the business-as-usual scenario on the left.
The 4 graphs on the right illustrate each preference’s extremes (0, 0.5, 1), infrastructure availability, refuelling speed, vehicle range and TCO. The values of the other preferences are normalized with respect to the examined preference, so that they always add up to 1.
Figure 5 shows that the outcome is strongly affected by these parameters. The TCO has a significant impact on the outcome. As BEVs and FCEVs are cheaper to run the more importance the purchaser places on TCO the fewer ICEVs and PHEVs are likely to be bought and more BEVs and FCEVs. The effect of a known phenomenon, range anxiety, can also be reproduced. As BEVs suffer from range anxiety and long recharging times, the less importance the purchaser places on vehicle range the more BEVs are likely to be bought. An increase in the importance of infrastructure availability also leads to a higher share of BEVs. However, the diffusion of the recharging stations is driven in this model mainly by the uptake of PHEV. An increase in the importance of the refuelling speed favours PHEVs and ICEVs, as the recharging of BEVs takes more time.
Interestingly the results show that FCEVs do not reach dominance in any scenario. Furthermore, while the diffusion of ICEVs, BEVs and FCEVs peaks with extreme values of some preferences; this is not the case for PHEVs. This is due to the fact that these ‘hybrid’ vehicles combine the advantages as well as disadvantages of both BEVs and ICEVs.
As even in countries like Germany, with large indigenous automotive industries, the car industry chooses its technologies largely independently of the solutions favoured by policy makers [33], the only aspects that policy makers can influence are the availability of infrastructure, the economics of the different vehicle types and customer preferences. As discussed, TCO is the most important preference and the only scenario where ICEVs and PHEVs do not dominate and instead the zero emission BEVs and FCEVs dominate. Therefore, scenarios where the vehicle owner would value the TCO the most are worth further investigation. While such a scenario may not be likely for private vehicle owners, it might be more likely for owners of commercial fleets, such as car sharing, rental companies and fleet operators, as it can be assumed that owners of commercial fleets will be more likely to engage with low emission vehicles that lead to significantly lower running costs.

3.4. More Radical Policy-Making Scenario

If the current policy regimes are not sufficient to reach a higher diffusion of low emission vehicles one possibility would be to improve the TCO by introducing further financial incentives. This has happened in Norway, where such actions have led to a significant uptake of electric vehicles [8]. However, such policies require significant public expenditure that not every country can afford. Fleet emission limits, i.e., fines, are another method and put the burden of cost on the industry and/or consumer. In addition, cities could play an interesting leading role, as in order to comply with certain pollution limits cities like London have already introduced the Ultra-Low Emission Zone and the Congestion Charge which is free for zero emission vehicles and by 2020 this is expected to be £12.50 per day in London for polluting vehicles.
Figure 6 shows the effect of simulating an aggressive emissions tax from 2020, modelled as a tax on ICEVs of €3,250 (€16.25 fee for 200 days). PHEVs, BEVs and FCEVs are assumed to be exempt, including PHEVs as they could operate in urban areas in zero emission mode. For this scenario, it is also assumed that the purchase grant for PHEVs is phased out in 2020 and petrol taxes are continuously increased by 3% per year starting from 2020 onwards. Such measures lead to a diffusion scenario that is significantly more favourable for BEVs and FCEVs, however, the market is still dominated by ICEVs and PHEVs.
The results show that aggressive taxes on ICEVs has little impact except favouring PHEVs over ICEVs.

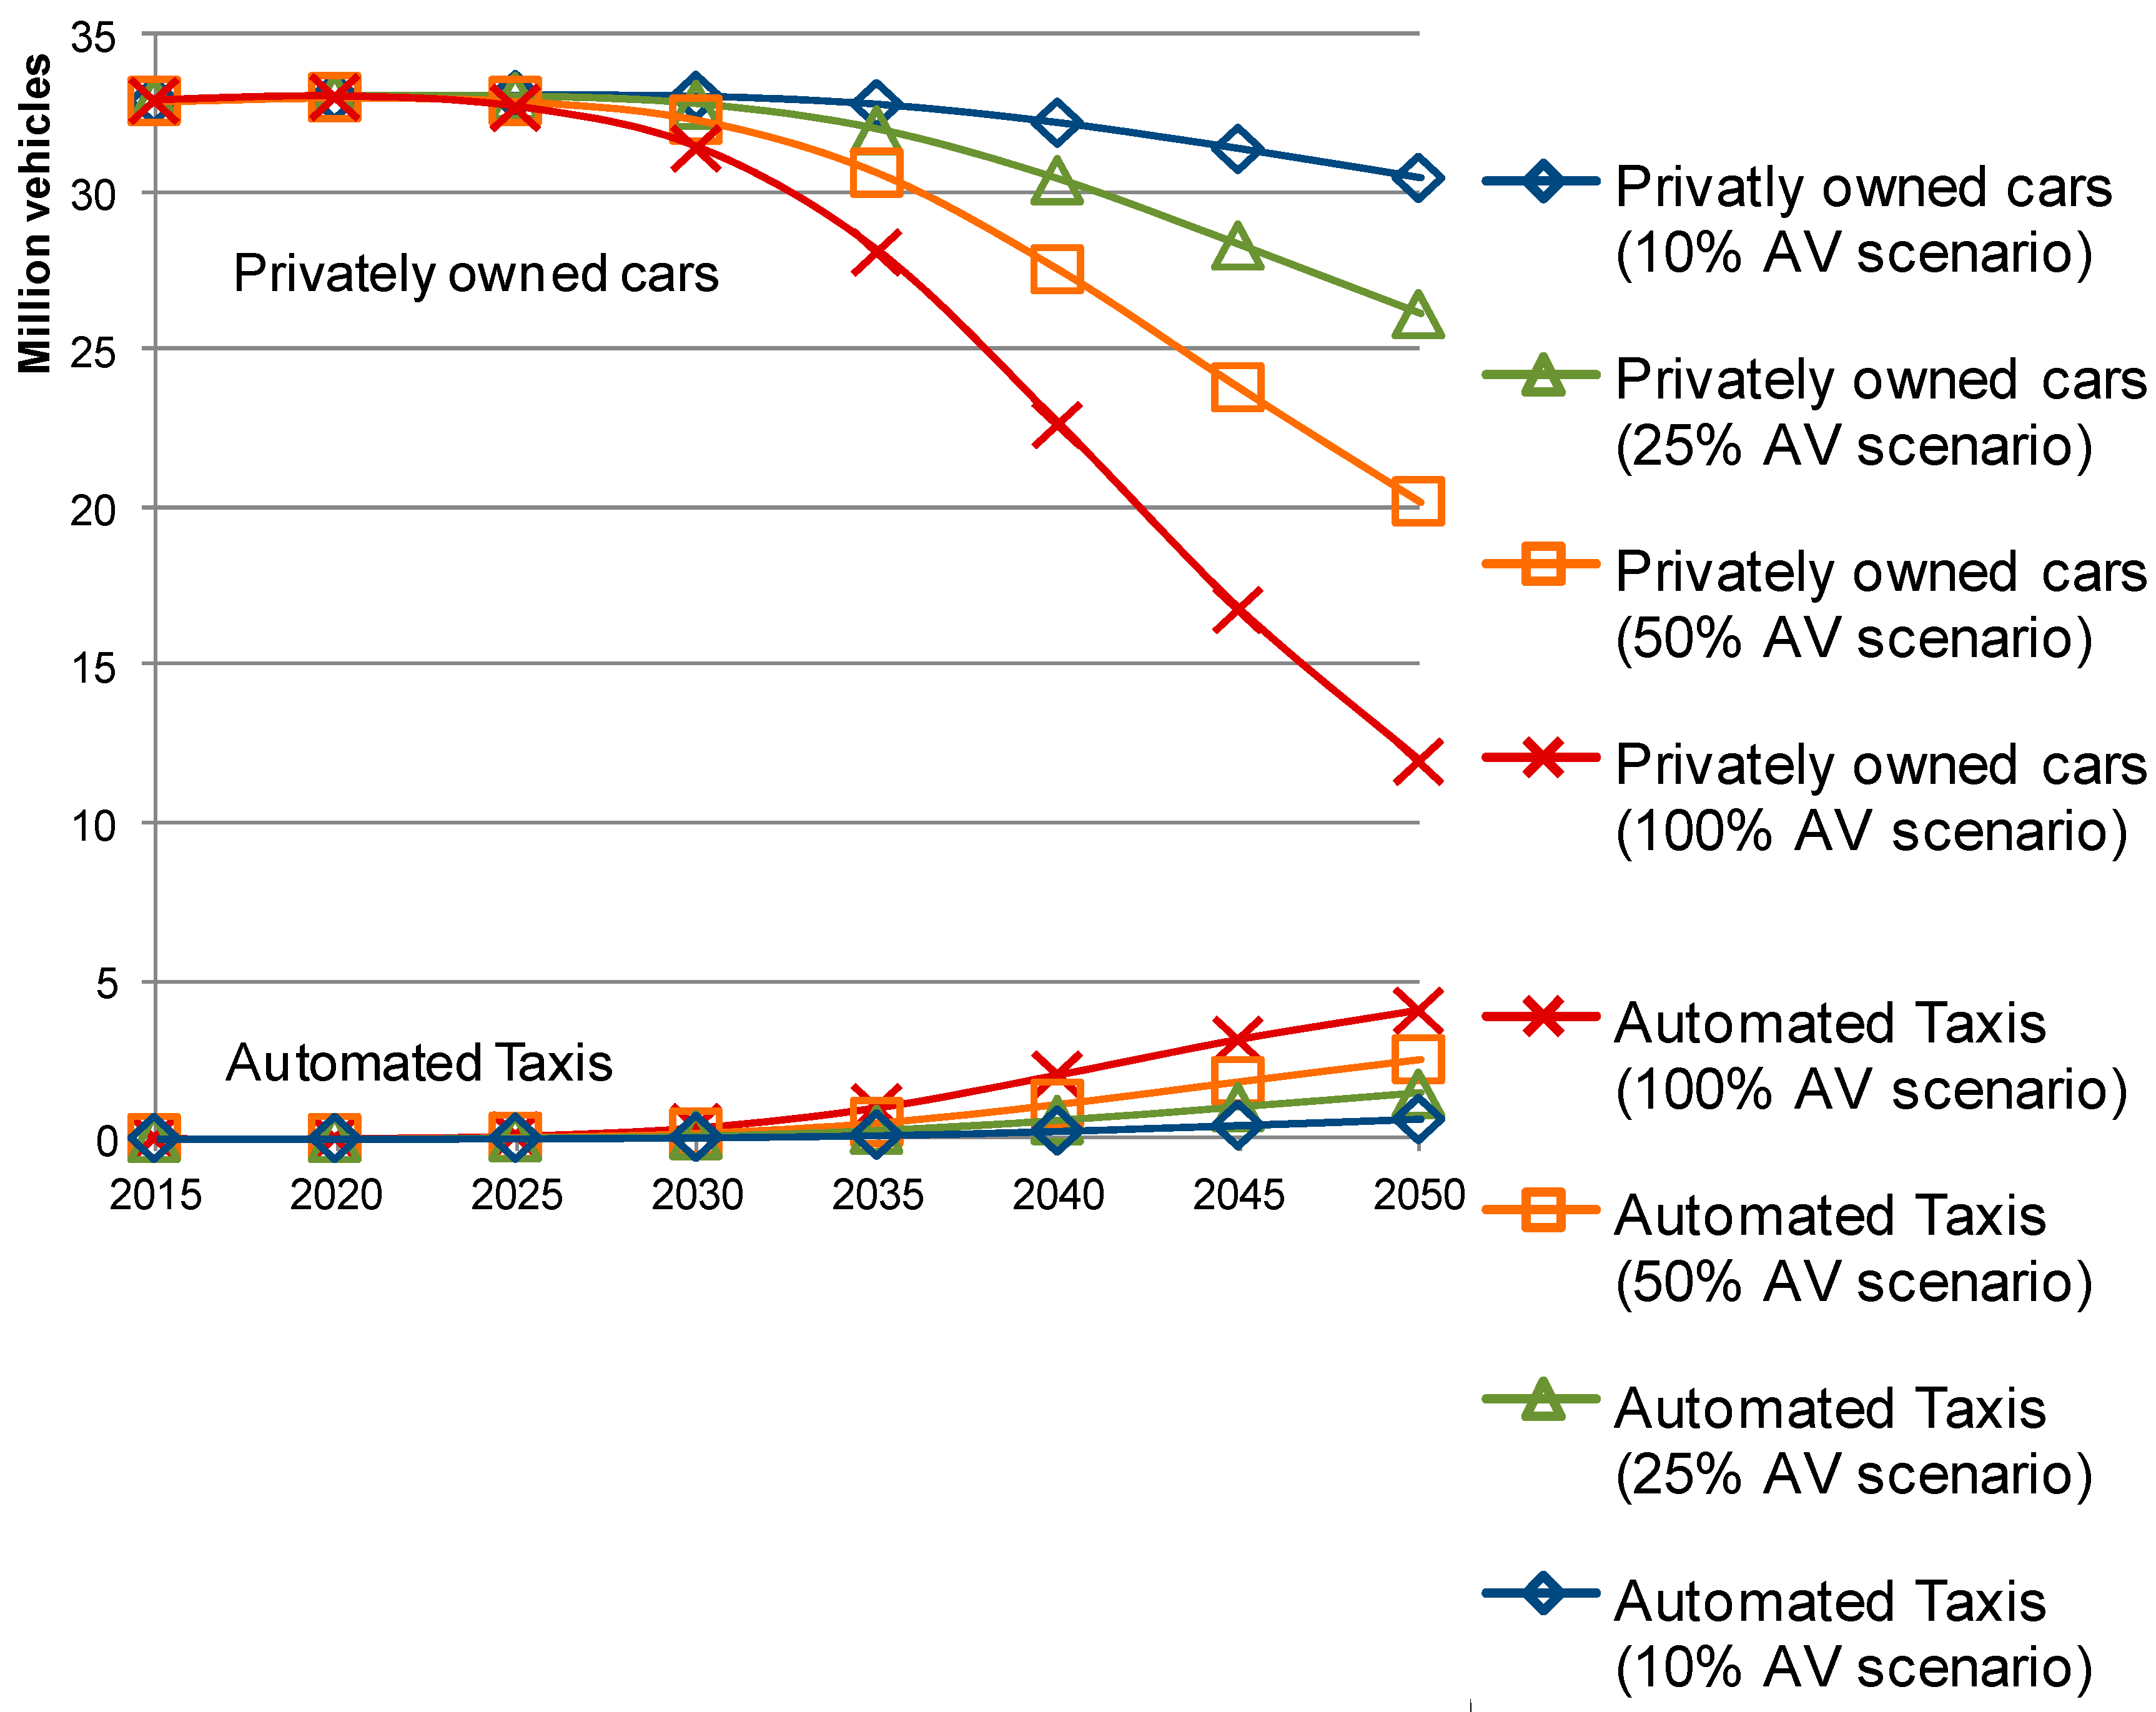
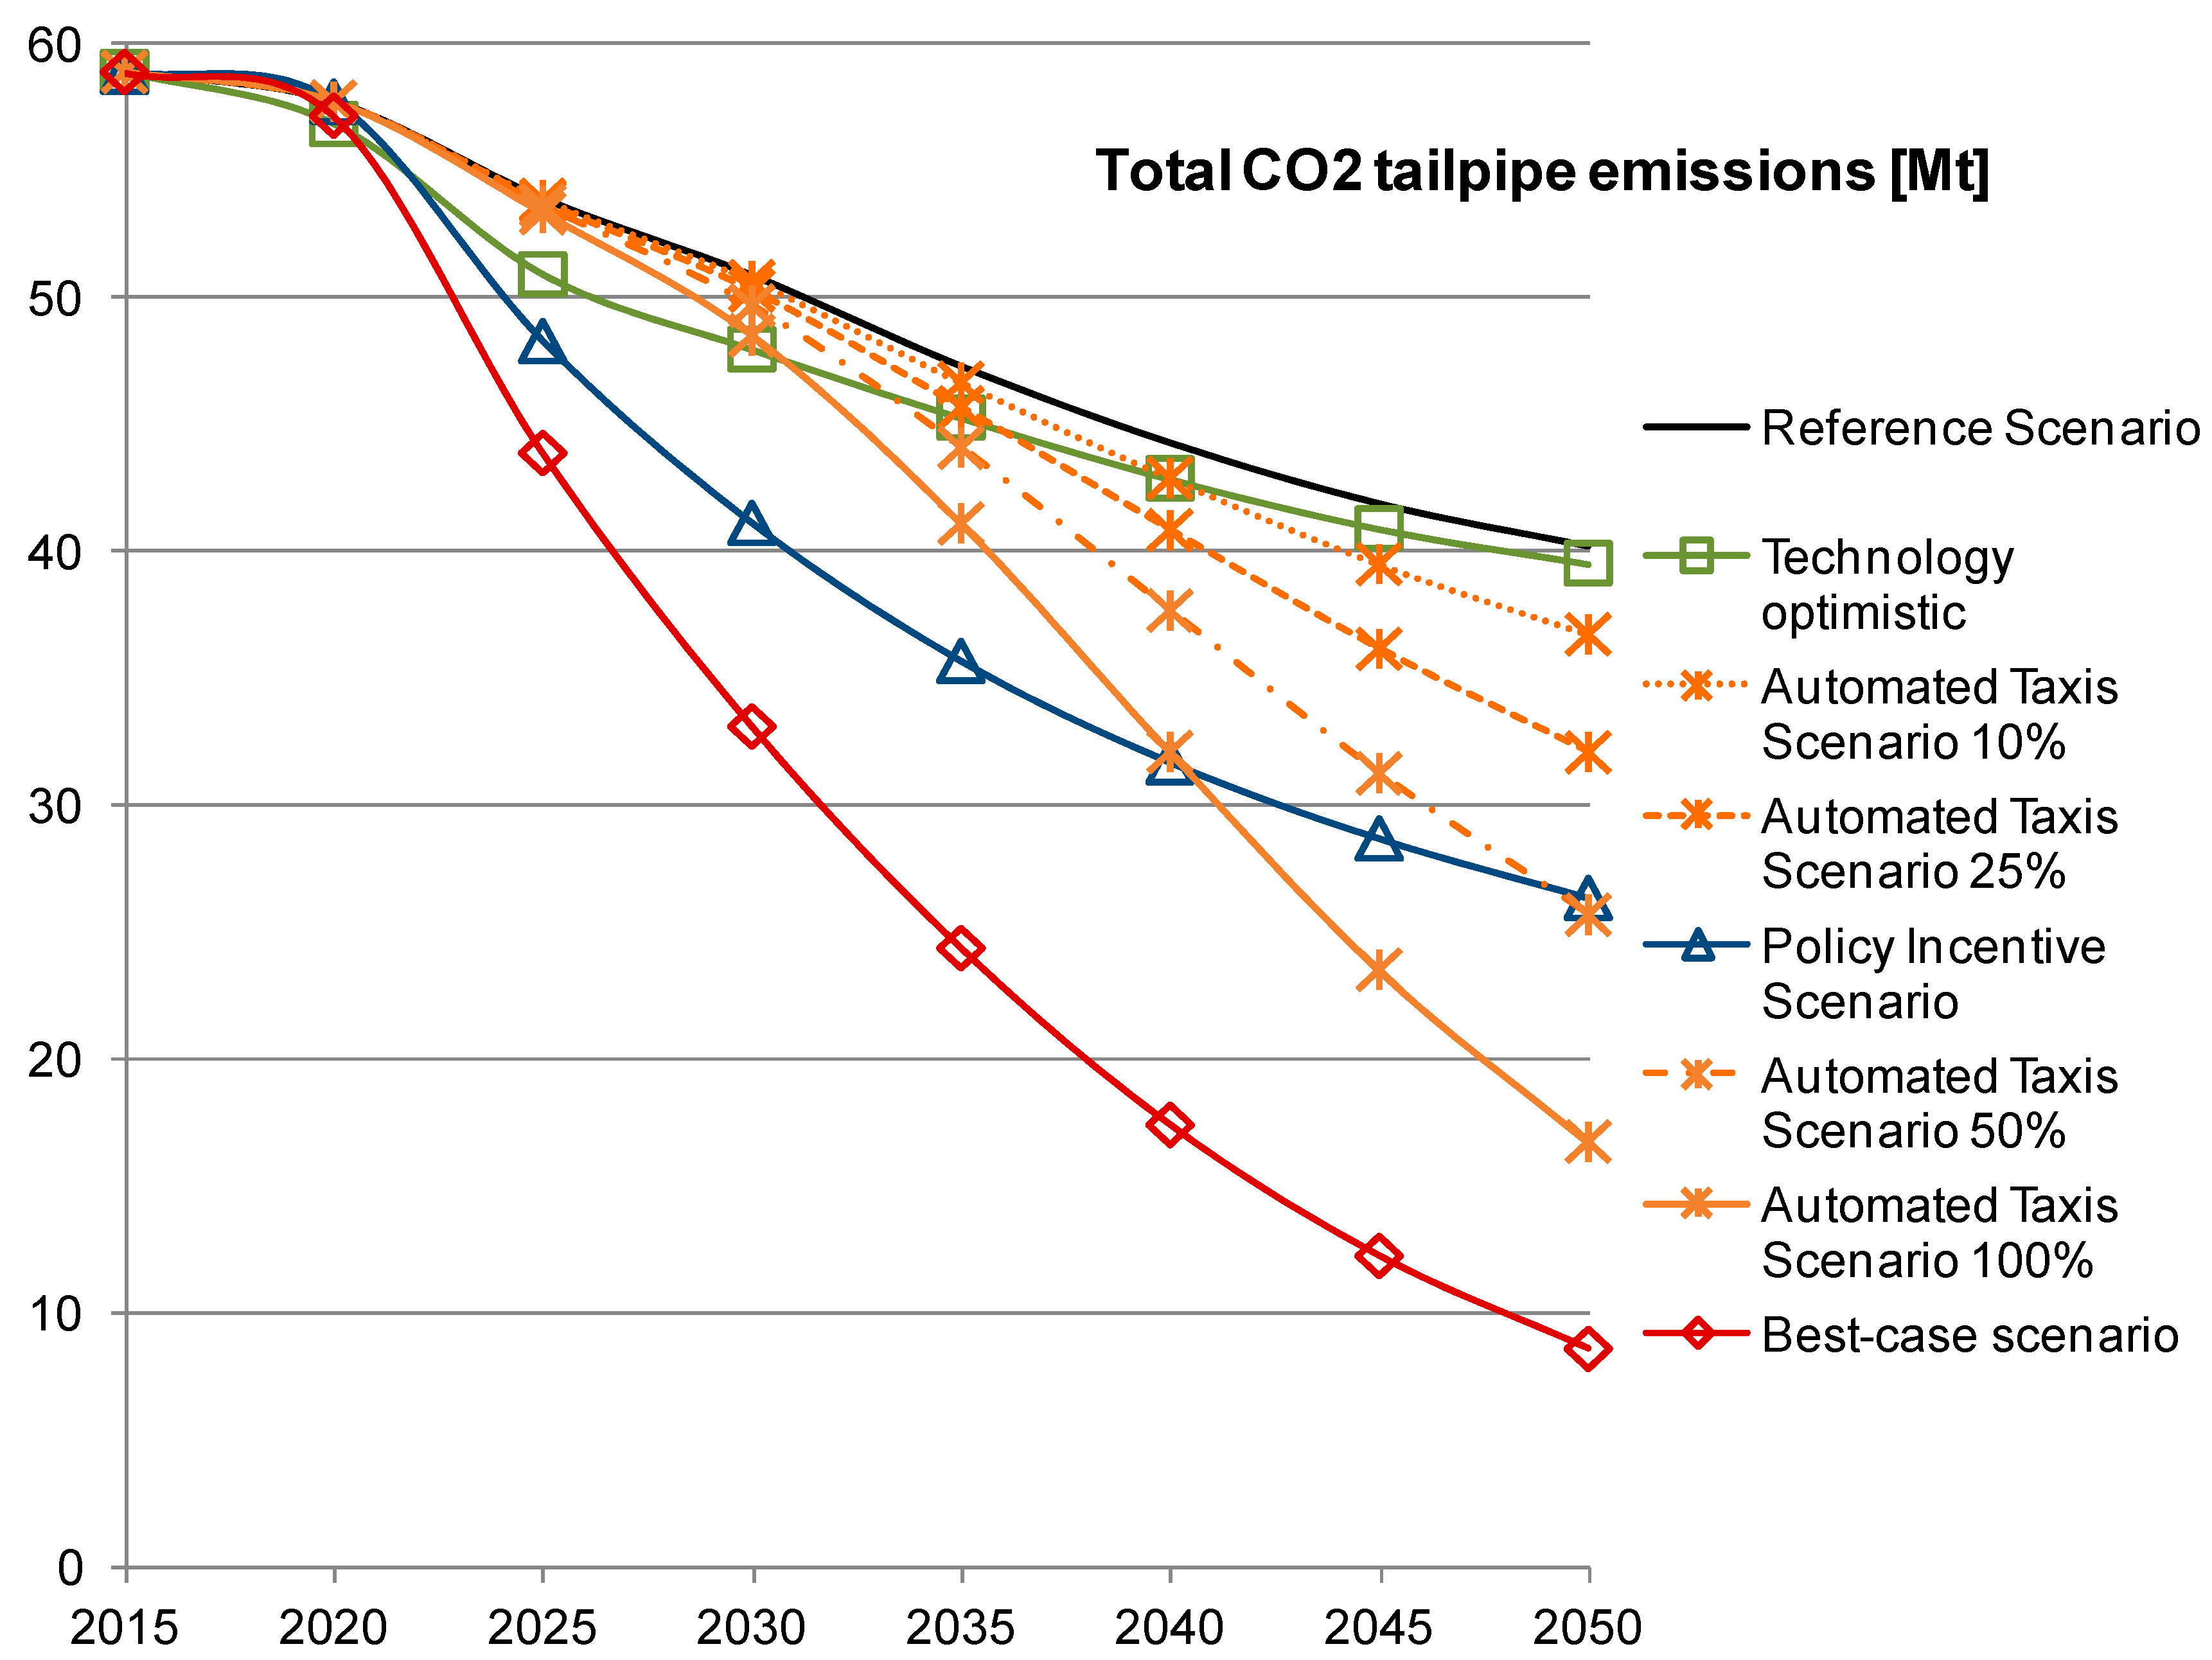
3.5. The Role of Automated Vehicles and Novel Business Models

In this scenario, the introduction of automated vehicles is expected to support a rapid increase of cheap car sharing and taxi schemes as drivers become obsolete.
There had been a lot of media coverage and discussion about how autonomous cars will affect different aspects of mobility and how they actually would look like [27,57,58,59,60,61,62]. However, as these discussions are at a very early stage and there is barely any data on the use—or design [63,64,65]—of self-driving taxis, this study has applied assumptions that describe the AV as a copy of currently operating taxis—though without a driver who needs to be paid. Staying as close as possible to the current reality, this way it was possible to focus solely on the interrelation between the AV technology as an enabler for self-driving autonomous taxis and the uptake of electrified drivetrains in general. Future research and developments, as well as commercial implementation of such services will provide data for more accurate modelling. The assumptions are listed in the following paragraphs.
Assuming that such vehicles fleets will be operated on a profit basis by commercial companies, it is therefore assumed the customer preference will be driven entirely by TCO as issues like recharging time, vehicle range and infrastructure availability can all be managed by the fleet operator. It is also assumed that the vehicle utilisation for automated vehicles, i.e., the annual mileage, is significantly increased to 57,750 km although its lifetime is reduced to only 6.6 years—reflecting the current use of taxis [66]. The model predicts this would lead to fleet owners purchasing solely zero emission vehicles, 93% BEVs and 7% FCEVs by 2050. However, the question remains how many private vehicle buyers will give up private ownership in return for automated taxi services.
As there has been done little research [67,68] on the answer to this question, in order to determine the effect of introducing automated vehicles, we have conducted a sensitivity analysis on different levels of substitution. In the pessimistic scenario, it has been assumed that only 10% of private vehicle buyers in 2050 would substitute their vehicle replacement purchase by the use of automated taxi services. For the extreme scenario, it is assumed that in 2050 100% of private car owners whose car has reached the end of life decide to adopt automated taxi services instead. Two scenarios assuming 25% and 50% are also explored. The rate of change from 2020 to 2050 is described through the help of S-curves, starting the replacement from 2020 onwards, when the first automated vehicles are assumed to reach the market.
These assumptions are made, not because it is believed this is how the transition will occur but because there is very little evidence to establish how the transition might occur and this was considered to be plausible based upon the status of the technology and the time taken from introduction to saturation of a new technology taking 30 years.
For simplicity reasons, it is assumed that the total annual vehicle kilometres driven by all cars is the same as the reference scenario with the difference that the kilometres that would have been travelled by a privately-owned vehicle are now travelled by automated vehicles. However, as the annual mileage per vehicle is higher, this means that for every 5.5 private cars only 1 automated vehicle is needed but they are replaced more often. As they are autonomous we have not added any costs for the driver to the model. Figure 7 illustrates how the number of vehicles in the private fleet develops in comparison to the commercial automated taxis fleet.

3.6. Bringing Everything Together—The Best-Case Scenario

This scenario deliberately pushes most assumptions to their extremes to explore the effect of compounding the most effective features of all the scenarios described above. In this scenario, the optimum technology case (cf. technology optimistic scenario), a continuous change of private car buyers’ preferences towards automated taxi (cf. Method Table 10), the strict policy measures (€3250 annual fee for ICEVs; stop of vehicle grant for PHEVs from 2021; increase in fuel tax by 3% annually) and a gradual move to 100% AVs by 2050 is simulated—hence an aggregate of the scenarios that have been presented above.
Figure 8 shows the effect of all the scenarios explored on the vehicle fleet emissions in the UK. It is clear that a change to automated vehicles as an individual measure has the greatest effect and leads to the lowest emissions. However, it can be seen that the best-case scenario—the combination of the different measures—leads to a quicker decrease in emissions in the period 2020 to 2030, mostly driven by technology and policy assumptions, but that they are insufficient in the long run and only in combination with automated vehicles are they capable of delivering deep and lasting reductions in emissions. However, it is worth noting that the automated vehicle scenario, due to the use of the S curves over 30 years, needs to start from 2020 in order to have a significant effect.

4. Discussion

We have applied a socio-technical systems research informed model based approach to assess the effects of different policies and new technologies on the achievement of the UK government’s targets with regard to an exogenously described automotive industry. In comparison to past work, these results are consistent with the overall picture that has been already described by other studies [30,69] and illustrate that financial incentives play a crucial role in reducing GHG emissions. Similar to other Multi-level Perspective informed approaches [70], this study also confirms that higher customer preferences for TCO (e.g., fuel costs) leads to a scenario where zero emission vehicles dominate and ICEVs and PHEVs lose out.
Improvements in battery and fuel cell technology and especially a significant decrease in costs will improve the uptake of battery electric and fuel cell vehicles in the short term. However, assuming all powertrain technologies converge to the similar levels of cost does not change the end result.
Influencing car buyer’s preferences is the single most important measure on its own in the current paradigm. Adapting them in such a way that range anxiety and the fear of infrastructure availability are alleviated improves the position of both BEVs and FCEVs. If the full TCO is taken into account then BEVs are likely to be become the dominant choice.
However, worryingly we show that all these factors combined are unlikely to be sufficient to meet long term emissions reduction targets. A transition towards zero emission vehicles is not likely to happen based upon current policies (vehicle purchase & infrastructure subsidies), car buyer’s preferences and alternative powertrain technology development rates. This is because ICEVs and PHEVs are too favoured by the existing system and especially consumer preferences. This means that the majority of private passenger car transport would still rely on fossil fuels and GHG emission reduction targets would be missed.
However, we show the effect of automated vehicles for the first time and have shown that the biggest reduction in GHG emissions from transport could be achieved by the introduction of automated vehicles as automated taxi services. Taking into account the introduction of automated vehicles has a bigger impact than any other measure and combined with other assumptions it is possible to construct scenarios where a 95% GHG emission reduction targets from road transport could almost be achieved.
However, knowing how plausible or likely this is requires a much better understanding of how automated vehicles could affect our transport systems, particularly how we purchase and use vehicles or mobility services and how this affects which powertrain technology becomes dominant.
These conclusions should be of profound interest to policy makers, automotive manufactures, technology developers and broader society as a whole, as they suggest that we cannot meet targets to reduce GHG emissions to acceptable levels without the parallel introduction of zero emissions vehicles and automated vehicles together.

Acknowledgments

We gratefully acknowledge funding from the Grantham Institute for Climate Change (Imperial College London), the Climate Knowledge and Innovation Community (Climate-KIC of the European Institute of Innovation and Technology EIT) and the UK EPSRC through the grant “SUPERGEN 14: Delivery of Sustainable Hydrogen” and a Career Acceleration Fellowship for Gregory Offer, award number EP/I00422X/1.

Author Contributions

Christoph Mazur created the model, gathered the data and conducted the simulation, as well as wrote the article. Gregory J. Offer helped creating the storyline and conclusions, as well as conducted major reviews of the finished product. Marcello Contestabile gave advice on the creation of the model as well as the approach and reviewed the early draft. Nigel Brandon Brandon reviewed early draft versions as well as helped scoping the project itself.

Conflicts of Interest

The authors declare no conflict of interest.

References

  1. IEA. Energy Technology Perspectives 2010: Scenarios and Strategies to 2050; IEA: Paris, France, 2010. [Google Scholar]
  2. DECC. The Carbon Plan: Delivering Our Low Carbon Future; DECC: London, UK, 2011. [Google Scholar]
  3. Howey, D.D.; North, D.R.; Martinez-Botas, D.R. Road Transport Technology and Climate Change Mitigation; No. Briefing Paper No. 2; Grantham Institute for Climate Change: London, UK, December 2010. [Google Scholar]
  4. IEA. Hybrid and Electric Vehicles—The Electric Drive Gains Tractions; IEA: Paris, France, 2013. [Google Scholar]
  5. IPPC. CLIMATE CHANGE 2014 Synthesis Report; IPPC: Rome, Italy, 2014. [Google Scholar]
  6. McKinsey & Company. A Portfolio of Power-Trains for Europe: A Fact-Based Analysis—The Role of Battery Electric Vehicles, Plug-In Hybrids and Fuel Cell Electric Vehicles; McKinsey & Company: New York, NY, USA, 2010. [Google Scholar]
  7. Mazur, C.; Contestabile, M.; Offer, G.J.; Brandon, P.N. Assessing and comparing German and UK transition policies for electric mobility. Environ. Innov. Soc. Transit. 2015, 14, 84–100. [Google Scholar]
  8. ICCT. Driving Electrification a Global Comparison of Fiscal Incentive Policy for Electric Vehicles; ICCT: Washington, DC, USA, May 2014. [Google Scholar]
  9. IEA. Energy Technology Perspective; IEA: Paris, France, 2014. [Google Scholar]
  10. Geels, F.W. Processes and patterns in transitions and system innovations: Refining the co-evolutionary multi-level perspective. Technol. Forecast. Soc. Chang. 2005, 72, 681–696. [Google Scholar]
  11. Jacobsson, S.; Bergek, A. Transforming the energy sector: The evolution of technological systems in renewable energy technology. Ind. Corp. Chang. 2004, 13, 815–849. [Google Scholar]
  12. Shove, E.; Walker, G. CAUTION! Transitions ahead: Politics, practice, and sustainable transition management. Environ. Plan. A 2007, 39, 763–770. [Google Scholar]
  13. Teubal, M. What is the systems perspective to Innovation and Technology Policy (ITP) and how can we apply it to developing and newly industrialized economies? J. Evol. Econ. 2002, 12, 233–257. [Google Scholar]
  14. Unruh, G.C. Understanding carbon lock-in. Energy Policy 2000, 28, 817–830. [Google Scholar]
  15. Jacobsson, S.; Bergek, A. Innovation system analyses and sustainability transitions: Contributions and suggestions for research. Environ. Innov. Soc. Transit. 2011, 1, 41–57. [Google Scholar]
  16. Markard, J.; Raven, R.; Truffer, B. Sustainability transitions: An emerging field of research and its prospects. Res. Policy 2012, 41, 955–967. [Google Scholar]
  17. Van Den Bergh, J.C.J.M.; Truffer, B.; Kallis, G. Environmental innovation and societal transitions: Introduction and overview. Environ. Innov. Soc. Transit. 2011, 1, 1–23. [Google Scholar]
  18. Collantes, G.; Sperling, D. The origin of California’s zero emission vehicle mandate. Transp. Res. Part A Policy Pract. 2008, 42, 1302–1313. [Google Scholar]
  19. Kieckhafer, K.; Walther, G.; Axmann, J.; Spengler, T. Integrating agent-based simulation and system dynamics to support product strategy decisions in the automotive industry. In Proceedings of the 2009 Winter Simulation Conference (WSC), Austin, TX, USA, 13–16 December 2009; pp. 1433–1443. [Google Scholar]
  20. Schwanen, T.; Banister, D.; Anable, J. Scientific research about climate change mitigation in transport: A critical review. Transp. Res. Part A Policy Pract. 2011, 45, 993–1006. [Google Scholar] [Green Version]
  21. Tran, M.; Banister, D.; Bishop, J.D.K.; McCulloch, M.D. Realizing the electric-vehicle revolution. Nat. Clim. Chang. 2012, 2, 328–333. [Google Scholar]
  22. Auvinen, H.; Ruutu, S.; Tuominen, A.; Ahlqvist, T.; Oksanen, J. Process supporting strategic decision-making in systemic transitions. Technol. Forecast. Soc. Chang. 2015, 94, 97–114. [Google Scholar]
  23. Bakker, S.; Trip, J.J. Policy options to support the adoption of electric vehicles in the urban environment. Transp. Res. Part D Transp. Environ. 2013, 25, 18–23. [Google Scholar]
  24. Offer, G.J. Automated Vehicles and Electrification of Transport. Energy Environ. Sci. 2015, 8, 26–30. [Google Scholar]
  25. Struben, J.; Sterman, J. Transition challenges for alternative fuel vehicle and transportation systems. Environ. Plan. B Plan. Des. 2008, 35, 1070–1097. [Google Scholar]
  26. Struben, J.J.R. Essays on Transition Challenges for Alternative Propulsion Vehicles and Transportation Systems; Massachusetts Institute of Technology, Sloan School of Management: Cambridge, MA, USA, 2006. [Google Scholar]
  27. Greenblatt, J.B.; Saxena, S. Autonomous taxis could greatly reduce greenhouse-gas emissions of US light-duty vehicles. Nat. Clim. Chang. 2015, 5, 860–863. [Google Scholar]
  28. Keles, D.; Wietschel, M.; Most, D.; Rentz, O. Market penetration of fuel cell vehicles-Analysis based on agent behaviour. Int. J. Hydrogen Energy 2008, 33, 4444–4455. [Google Scholar]
  29. Meyer, P.E.; Winebrake, J.J. Modeling technology diffusion of complementary goods: The case of hydrogen vehicles and refueling infrastructure. Technovation 2009, 29, 77–91. [Google Scholar]
  30. Shepherd, S.; Bonsall, P.; Harrison, G. Factors affecting future demand for electric vehicles: A model based study. Transp. Policy 2012, 20, 62–74. [Google Scholar]
  31. Charalabidis, Y.; Loukis, E.; Androutsopoulou, A. Enhancing Participative Policy Making through Modelling and Simulation: A State of the Art Review. In Proceedings of the European, Mediterranean & Middle Eastern Conference on Information Systems, Athens, Greece, 30–31 May 2011. [Google Scholar]
  32. Sterman, J. Business Dynamics; Irwin: Martinsville, OH, USA, 2000. [Google Scholar]
  33. Mazur, C.; Contestabile, M.; Offer, G.J.; Brandon, N.P. Understanding the drivers of fleet emission reduction activities of the German car manufacturers. Environ. Innov. Soc. Transit. 2015, 16, 3–21. [Google Scholar]
  34. Budde, B.; Alkemade, F.; Weber, K.M. Expectations as a key to understanding actor strategies in the field of fuel cell and hydrogen vehicles. Technol. Forecast. Soc. Chang. 2012, 79, 1072–1083. [Google Scholar]
  35. Jänicke, M.; Jacob, K. Lead markets for environmental innovations: A new role for the nation state. Glob. Environ. Polit. 2004, 4, 29–46. [Google Scholar]
  36. UK Department for Transport. Public Attitudes to Electric Vehicles; UK Department for Transport: London, UK, June 2014.
  37. Augustin, N.H.; Cummins, R.P.; French, D.D. Exploring spatial vegetation dynamics using logistic regression and a multinomial logit model. J. Appl. Ecol. 2001, 38, 991–1006. [Google Scholar]
  38. Contestabile, M. A Model-Based Analysis of European Policies to Support Hydrogen Fuel Cells in Road Transport. Ph.D. Thesis, Imperial College London, London, UK, 2012. [Google Scholar]
  39. Supple, D.R. Managing the Transition toward Self-Sustaining Alternative Fuel Vehicle Markets: Policy Analysis Using a Dynamic Behavioral Spatial Model. Ph.D. Thesis, Massachusetts Institute of Technology, Cambridge, MA, USA, 2007. [Google Scholar]
  40. UNECE Transport Division. ForFITS—User Manual (Chapter 18—Vehicles, Powertrain Choice (Logit)). Available online: http://www.unece.org/trans/theme_forfits.html (accessed on 14 November 2013).
  41. Hensher, D.A.; Rose, J.M.; Greene, W.H. Applied Choice Analysis: A Primer; Cambridge University Press: Cambridge, UK, 2005. [Google Scholar]
  42. Koppelman, F.S.; Bhat, C. A Self Instructing Course in Mode Choice Modeling: Multinomial and Nested Logit Models; U.S. Department of Transportation Federal Transit Administration: Washington, DC, USA, 2006.
  43. Offer, G.J.; Contestabile, M.; Howey, D.A.; Clague, R.; Brandon, N.P. Techno-economic and behavioural analysis of battery electric, hydrogen fuel cell and hybrid vehicles in a future sustainable road transport system in the UK. Energy Policy 2011, 39, 1939–1950. [Google Scholar]
  44. Kurani, K.S.; Axsen, J.; Caperello, N.; Davies-Shawhyde, J.; Dempster, P.; Kempster, M.; Nesbitt, K.A.; Stillwater, T. Plug-In Hybrid Electric Vehicle (PHEV) Demonstration and Consumer Education, Outreach, and Market Research Program: Volumes I and II; University of California at Davis: Davis, CA, USA, 2010. [Google Scholar]
  45. Chang, D.; Erstad, D.; Lin, E.; Rice, A.F.; Goh, C.T.; Tsao, A.A.; Snyder, J. Financial Viability of Non-Residential Electric Vehicle Charging Stations; Luskin Center for Innovation: Los Angeles, CA, USA, 2012. [Google Scholar]
  46. RACFoundation. UK Fuel Market Review; RACFoundation: London, UK, 2013. [Google Scholar]
  47. E. Institute. Retail Marketing Survey 2013; E. Institute: Glendale, AZ, USA, 2013. [Google Scholar]
  48. UK H2 Mobility. UK H2 Mobility Project—Refuelling Infrastructure; UK H2 Mobility: London, UK, 2014. [Google Scholar]
  49. Wiederer, A.; Philip, R. Policy Options for Electric Vehicle Charging Infrastructure in C40 Cities; The National Academies of Sciences, Engineering, and Medicine: Washington, DC, USA, 2010. [Google Scholar]
  50. Element Energy. Strategies for the Uptake of Electric Vehicles and Associated Infrastructure Implications; Element Energy: Cambridge, UK, 2009. [Google Scholar]
  51. Bushman, R.M.; Piotroski, J.D.; Smith, A.J. Capital allocation and timely accounting recognition of economic losses. J. Bus. Financ. Account. 2011, 38, 1–33. [Google Scholar]
  52. US Environmental Protection Agency. Fuel Economy Guide; US Environmental Protection Agency: Washington, DC, USA, 2014.
  53. AEA. A Review of the Efficiency and Cost Assumptions for Road Transport Vehicles to 2050—Report for the Committee on Climate Change; AEA: Nashville, TN, USA, 2012. [Google Scholar]
  54. SMMT. SMMTs Electric and ALTERNATIVELY-Fuelled Vehicle Registration Figures for MONTH and the Year-to-Date; SMMT: London, UK, 2014. [Google Scholar]
  55. Nykvist, B.; Nilsson, M. Rapidly falling costs of battery packs for electric vehicles. Nat. Clim. Chang. 2015, 5, 329–332. [Google Scholar]
  56. Contestabile, M.; Offer, G.J.; Slade, R.; Jaeger, F.; Thoennes, M. Battery electric vehicles, hydrogen fuel cells and biofuels. Which will be the winner?. Energy Environ. Sci. 2011, 4, 3754–3772. [Google Scholar]
  57. Davidson, P.; Spinoulas, A. Driving alone versus riding together—How shared autonomous vehicles can change the way we drive. Road Transp. Res. 2016, 25, 51–66. [Google Scholar]
  58. Fagnant, D.J.; Kockelman, K.M. The travel and environmental implications of shared autonomous vehicles, using agent-based model scenarios. Transp. Res. Part C Emerg. Technol. 2014, 40, 1–13. [Google Scholar]
  59. Clark, B.; Parkhurst, G.; Ricci, M. Understanding the Socioeconomic Adoption Scenarios for Autonomous Vehicles: A Literature Review; University of the West of England, Bristol: Bristol, UK, 2016. [Google Scholar]
  60. Cohen, T.; Jones, P.; Cavoli, C. Social and Behavioural Questions Associated with Automated Vehicles; UCL Transport Institute: London, UK, 2017. [Google Scholar]
  61. Hörl, S.; Ciari, F.; Axhausen, K.W. Recent perspectives on the impact of autonomous vehicles. In Arbeitsberichte Verkehrs-und Raumplan; Institute for Transport Planning and System: Zürich, Switzerland, 2016. [Google Scholar]
  62. Schreurs, M.A.; Steuwer, S.D. Autonomous driving-political, legal, social, and sustainability dimensions. In Autonomous Driving: Technical, Legal and Social Aspects; Springer: Berlin, Germany, 2016; pp. 149–171. [Google Scholar]
  63. Langdon, P.; Politis, I.; Bradley, M.; Skrypchuk, L.; Mouzakitis, A.; Clarkson, J. Obtaining design requirements from the public understanding of driverless technology. In Proceedings of the International Conference on Applied Human Factors and Ergonomics, Los Angeles, CA, USA, 17–21 July 2017; pp. 749–759. [Google Scholar]
  64. Politis, I.; Langdon, P.; Bradley, M.; Skrypchuk, L.; Mouzakitis, A.; Clarkson, P.J. Designing autonomy in cars: A survey and two focus groups on driving habits of an inclusive user group, and group attitudes towards autonomous cars. In Proceedings of the International Conference on Applied Human Factors and Ergonomics, Los Angeles, CA, USA, 17–21 July 2017; pp. 161–173. [Google Scholar]
  65. MIT Technology Review. How Do You Design an Autonomous Car from Scratch? MIT Technology Review: Cambridge, MA, USA, 2017. [Google Scholar]
  66. Goodbody. Economic Review of the Small Public Service Vehicle Industry; Goodbody Economic Consultants in Association with Faber Maunsell and IMS Millward Brown (Commission for Taxi Regulation); Goodbody: London, UK, 2014. [Google Scholar]
  67. IEEE. News Release on Intelligent Transportation System. 2012. Available online: http://www.ieee.org/about/news/2012/5september_2_2012.html (accessed on 30 October 2017).
  68. Sprei, F. Disrupting mobility. Energy Res. Soc. Sci. 2017, 37, 238–242. [Google Scholar]
  69. Van der Vooren, A.; Brouillat, E. Evaluating CO2 reduction policy mixes in the automotive sector. Environ. Innov. Soc. Transit. 2015, 14, 60–83. [Google Scholar]
  70. Kohler, J.; Whitmarsh, L.; Nykvist, B.; Schilperoord, M.; Bergman, N.; Haxeltine, A. A transitions model for sustainable mobility. Ecol. Econ. 2009, 68, 2985–2995. [Google Scholar]
Figure 1. Approach followed by this study to inform the model based system dynamics study by insights based upon the MLP framework.
Sustainability 10 00676 g001
Figure 2. Simplified illustration of the model and its components.
Sustainability 10 00676 g002
Figure 3. Vehicle stocks per drive train (top) and recharging/refiling infrastructure uptake (bottom) until 2050 for business as usual scenario.
Sustainability 10 00676 g003
Figure 4. Vehicle stocks per drive train until 2050 for a technology optimistic scenario.
Sustainability 10 00676 g004
Figure 5. Sensitivity analysis of consumer purchase preferences for the vehicle stock in 2050.
Sustainability 10 00676 g005
Figure 6. Vehicle stocks per drive train until 2050 for a more radical policy scenario.
Sustainability 10 00676 g006
Figure 7. Substitution of private cars by automated vehicles assumed in this study.
Sustainability 10 00676 g007
Figure 8. Vehicle fleet emissions until 2050 for each scenario.
Sustainability 10 00676 g008
Table 1. Main model equations.
Vehicle stock d   v e h i c l e   s t o c k i d   t = d   ( p u r c h a s e   o f   n e w i s c r a p p i n g i ) d   t
Vehicle scrapping s c r a p p i n g i =   v e h i c l e   s t o c k i v e h i c l e   l i f e t i m e
Total vehicle demand t o t a l   v e h i c l e   d e m a n d = ( i s c r a p p i n g i ) × ( 1 + c h a n g e   i n   v e h i c l e   d e m a n d )
Annual purchase of each vehicle type p u r c h a s e   o f   n e w   [ v e h i c l e   t y p e   i ] = t o t a l   v e h i c l e   d e m a n d × s h a r e   o f   [ v e h i c l e   t y p e   i ]
Probability to choose a certain vehicle type p r o b a b i l i t y   t o   c h o o s e   [ v e h i c l e   t y p e   i ] = e μ U t i l i t y j i e μ U t i l i t y j
0 p r o b a b i l i t y   t o   c h o o s e   [ v e h i c l e   t y p e   i ] 1
i p r o b a b i l i t y   t o   c h o o s e   [ v e h i c l e   t y p e   i ] = 1
U t i l i t y i = V i + ε i with U being identical for deterministic component V
Actual market share of each vehicle type s h a r e   o f   [ v e h i c l e   t y p e   i ]   = T e c h n o l o g y   a v a i l a b i l i t y i × p r o b a b i l i t y   t o   c h o o s e   [ v e h i c l e   t y p e   i ] i ( T e c h n o l o g y   a v a i l a b i l i t y i × p r o b a b i l i t y   t o   c h o o s e   [ v e h i c l e   t y p e   i ] )
Utility for each vehicle type U t i l i t y i = k ( r e l a t i v e   p e r f o r m a n c e   o f   p a r a m e t e r k × w e i g t h k )
Total cost of Ownership T C O i = p u r c h a s e   p r i c e + f u e l   c o s t + t a x e s p u r c h a s e   g r a n t
Recharging station availability r e c h a r g i n g   s t a t i o n   a v a i l a b i l i t y = t o t a l   c a p a c i t y   a v a i l a b l e   u t i l i z a t i o n   f a c t o r d e m a n d   f o r   c h a r g i n g   c a p a c i t y
Station availability (compared to other stations) s t a t i o n   a v a i l a b i l i t y = min ( a b s o l u t e   s t a t i o n   a v a i l a b i l i t y , r e l a t i v e   s t a t i o n   a v a i l a b i l i t y )
Hydrogen station availability compared to theoretically needed number of stations a b s o l u t e   s t a t i o n   a v a i l a b i l i t y = min ( t o t a l   n u m b e r   o f   h y d r o g e n   s t a t i o n t o t a l   n u m b e r   o f   s t a t i o n s   n e e d e d   i n   t h e   U K , 1 )
Hydrogen station availability in comparison to hydrogen vehicles r e l a t i v e   s t a t i o n   a v a i l a b i l i t y = min ( n u m b e r   o f   h y d r o g e n   s t a t i o n s n u m b e r   o f   F C E V h i s t o r i c a l   r a t i o   b e t w e e n   p e t r o l   s t a t i o n s   a n d   I C E V s , 1 )
Total recharging capacity at public stations t o t a l   c h a r g i n g   c a p c i t y = p u b l i c   c h a r g i n g   c a p a c i t y
Total change in Rapid and Standard chargers d   c h a r g e r s d t = d   ( i n s t a l l a t i o n   o f   c h a r g e r s c r a p p a g e   o f   c h a r g e r s ) d t .
Annual revenues for each charger r e c h a r g i n g   r e v = r e c h a r g i n g   d e m a n d r a t i o   o f   r e c h a r g i n g   a t   p u b l i c   s t a t i o n s m a r k u p   o n   e l e c t r i c t y   c o s t e l e c t r i c i t y   c o s t
Annual recharging infrastructure cost (similar for hydrogen infrastructure) a n n u a l   r e c h a r g i n g   i n f r a s t r u c t u r e   c o s t = c h a r g e r   t y p e ( n u m b e r   o f   c h a r g e r i n s t a l l t i o n   c o s t l i f e t i m e + a n n u a l   m a i n t e n a n c e + e x p e c t e d   R O C I i n s t a l l a t i o n   c o s t )
Average recharging time a v e r a g e   r e c h a r g i n g   t i m e = ( a v e r a g e   b a t t e r y   s i z e ) / ( a v e r a g e   r e c h a r g i n g   p o w e r )
Table 2. General parameters for customer model component.
Customer
Name of VariableValueUnitComment
vehicle stock ICEV (t = 2011)33,000,000vehiclesinitial vehicle stock derived from SMMT reports
vehicle stock HEVs/PHEV (t = 2011)100,000vehicles
vehicle stock BEV (t = 2011)2000vehicles
vehicle stock FCEV (t = 2011)0vehicles
change in vehicle demand1percentAnnual increase in sales
scale factor ICEV µ1-Determined through calibration based upon historical data. The scale factor for ICEV has been left at 1. Then the PHEV and BEV factors have been adapted iteratively until the modelled sales numbers matched the real ones for the period of 2011–2013. The factor for FCEVs is the same as the ICEV factor as both vehicle drive trains are similar for the user.
scale factor PHEV µ1.69-
scale factor BEV µ0.985-
scale factor FCEV µ1-
weight of TCO50%from UK government study on customer preferences concerning alternative vehicles [36]
weight of vehicle range25%
weight of infrastructure availability12.5%
weight of refuelling time12.5%
annual km driven10,500km[36]
PHEV kilometres driven in EV mode41%Calculation based upon an EV range of an Honda Accord Hybrid of 15 miles and the distribution of miles driven in the UK according to [43]
BEVs energy recharged at home80%Calculation based upon an EV range of an Mercedes Benz B Class of 85 miles and the distribution of miles driven in the UK according to [43]
PHEVs energy charged at public stations5%Based on a PHEV usage patterns study [44] where it had been observed that 2 of 34 (ca. 6%) drivers had been charging their vehicles also not at home.
Table 3. General and initial parameters for the infrastructure providers.
Infrastructure
Name of VariableValueUnitComment
petrol price (t = 2010)0.7€/litrePre-tax predictions based on [6]
electricity price (t = 2010)100€/MWhPre-tax predictions based on [6]
hydrogen price (t = 2010)16.6€/kgPre-tax predictions based on [6]
mark-up electricity cost80percentBased upon proposed scenarios by [45]
mark-up H2 cost6percentTypical margins of petrol stations [46]
ratio of petrol stations per vehicle1/3660Stations per vehicleBased upon historical data [46,47]. The parameter has been determined with the help of current number petrol stations and the total number of vehicles on UK’s roads
total number of hydrogen stations needed1150stationsBased upon estimate of [48]
initial stock of Class 2 chargers1670Public chargersAccording to http://chargemap.com/stats/united-kingdom there are in total 1758 charging points. 95% correspond to Class 2 chargers.
initial stock of Rapid chargers400Public chargersAccording to http://chargemap.com/stats/united-kingdom there are in total 1758 charging points. 5% correspond to Rapid chargers.
initial stock of hydrogen stations10stationsEstimate based upon h2stations.org
average power of domestic charger3kW[49]
average power of Class 2 charger3kW[49]
average power of Rapid charger50kW[49]
lifespan of EV chargers10Years[49]
lifespan of hydrogen stations30Years[49]
ratio of BEV owners with domestic charging capability80percentBased upon demographics of BEV and PHEV users [50]
installation cost of Class 2 charger4000[49]
installation cost of Rapid charger50,000[49]
operation & maintenance cost of EV charger10percentin percent of initial purchase cost [49]
expected ROCI (Return on Capital Invested) for infrastructure5.5percentBased upon study undertaken on average return rates [51]
Table 4. General and initial automotive parameters.
Automotive Parameters
Name of VariableValueUnitComment
vehicle lifetime14.5yearsCalibrated. With 14.5 years for the scrapping the total demand for vehicles corresponds to real data provided by SMMT
ICEV petrol consumption0.078L/kmBased upon the fuel economy of a Honda Accord [52]
PHEV petrol consumption0.051L/kmBased upon the fuel economy of a Honda Accord in HEV mode [52]
PHEV electricity consumption0.23kWh/kmBased upon a Honda Accord in EV mode [52]
BEV electricity consumption0.18kWh/kmBased upon a Nissan Leaf [52]
FCEV hydrogen consumption0.0104kg/kmBased upon a Honda FCX Clarity [52]
ICEV range (t = 2010)900kmFor first year derived from [6]
PHEV range (t = 2010)800kmFor first year derived from [6]
BEV range (t = 2010)130kmFor first year derived from [6]
FCEV range (t = 2010)700kmFor first year derived from [6]
refuelling time ICEV2minOwn experience
refuelling time PHEV2minOwn experience
refuelling time FCEV4minhttp://www.ukh2mobility.co.uk/fcevs/
ICEV price (t = 2010)20,000For first year derived from [6], updated with 2014 prices based on http://www.greencarsite.co.uk
PHEV price (t = 2010)47,000For first year derived from [6], updated with 2014 prices based on http://www.greencarsite.co.uk
BEV price (t = 2010)85,000For first year derived from [6], updated with 2014 prices based on http://www.greencarsite.co.uk
FCEV price (t = 2010)160,000For first year derived from [6], updated with 2014 prices based on http://www.greencarsite.co.uk
Year when sale of FCEV starts2016 Expected sales start of FCEVs in the UK
Table 5. Range of the different vehicle types (based upon [6]).
in km20102050
ICEV9001300
PHEV8001200
BEV130220 1
FCEV700850
1 The assumption of the predicted increase in BEV range is based upon [6], While this is less than current ICEVs can achieve and there are calls for BEVs with higher ranges, we do not model Electric Vehicles with a much higher range (bigger batteries), as the UK National Travel Survey [43] has shown that most of the trips executed in the UK are below 40 km in average.
Table 6. Fuel cost assumptions (based upon [6]).
2010201520202030203520402050
Petrol [€/L]0.70.750.730.850.880.920.98
Electricity [€/MWh]100120140140140135125
Hydrogen [€/kg]16.69.96.654.74.54.4
Table 7. Input values for price of the different vehicle types (based upon [6]) and updated with 2014 prices based on http://www.greencarsite.co.uk and [53].
in €20152020203020402050
ICEV20,50022,00022,00022,00021,000
PHEV41,80034,00025,00024,00023,500
BEV43,00036,00026,00024,50023,500
FCEV60,00038,00026,00024,70023,700
Table 8. Approximate BEV and PHEV registrations in the UK (rounded values based upon [54]).
PHEV HEV (Historic Data)PHEV HEV (Modelled)EV (Historic Data)EV (Modelled)
201123,00021,91811001082
201227,00026,17813001564
201330,00031,44325002449
Table 9. Adapted input values for price of the different vehicle types in a technology optimistic scenario (based upon [6] and updated with 2014 prices based on http://www.greencarsite.co.uk and [53].
in €20152020203020402050
ICEV20,50022,00022,00022,00021,000
EV optimistic scenarioPHEV41,80029,000 (34,000)25,00024,00023,500
BEV43,00030,500 (36,000)26,00024,50023,500
FCEV60,00034,500 (38,000)26,00024,70023,700
Table 10. Adapted weights for preferences for the vehicle choice.
Infrastructure AvailabilityRecharging DurationRangeTCO
Initial weights (2015)12.5%12.5%25%50%
Adapted weights (2025)5%5%10%80%

