Can Next-Generation Vehicles Sustainably Survive in the Automobile Market? Evidence from Ex-Ante Market Simulation and Segmentation


1
Department of Industrial and Management Systems Engineering, Kyung Hee University, 1732 Deogyeong-daero, Giheung-gu, Yongin, Gyeonggi 17104, Korea
2
Department of Civil, Architectural, and Environmental Engineering, The University of Texas at Austin, 301 East Dean Keeton Street, C1700, Austin, TX 78712, USA
3
Graduate School of Technology & Innovation Management, Hanyang University, 222 Wangsimni-ro, Seongdong-gu, Seoul 04763, Korea
*
Author to whom correspondence should be addressed.
Sustainability 2018, 10(3), 607; https://doi.org/10.3390/su10030607
Submission received: 8 January 2018
/
Revised: 13 February 2018
/
Accepted: 24 February 2018
/
Published: 27 February 2018
Abstract
:Introduced autonomous and connected vehicles equipped with emerging technologies are expected to change the automotive market. In this study, using stated preference (SP) data collected from choice experiments conducted in Korea with a mixed multiple discrete-continuous extreme value model (MDCEV), we analyzed how the advent of next-generation of vehicles with advanced vehicle technologies would affect consumer vehicle choices and usage patterns. Additionally, ex-ante market simulations and market segmentation analyses were conducted to provide specific management strategies for next-generation vehicles. The results showed that consumer preference structures of conventional and alternative fuel types primarily differed depending on whether they were drivers or non-drivers. Additionally, although the introduction of electric vehicles to the automobile market is expected to negatively affect the choice probability and mileage of other vehicles, it could have a positive influence on the probability of purchasing an existing conventional vehicle if advanced vehicle technologies are available.
1. Introduction
In an era of “smart” technologies, which are expected to perform work or make decisions traditionally done by humans, consumers are increasingly exposed to products featuring so-called smart technologies, such as smart phones and smart televisions. In this regard, public interest in the next generation of vehicles with smart technologies such as autonomous driving, voice recognition, and smart device connectivity, is rising.
However, the academic and industrial sectors have yet to agree upon a single definition of the next generation of vehicles with smart technologies; each business, institution, and research team has established its own definition. Due to the fusion of automotive technology and information technology (IT), other terms have arisen as well, such as connected car, infotainment system, autonomous car, driverless car, and self-driving car. These terms share similar meanings but also lack clear definition. In this study, we define the next generation of vehicles with smart technologies as including the following concepts: a connected car, infotainment system, and autonomous car.
This trend has gained momentum as the associated technology has become more advanced. Various next-generation vehicle applications have been studied, including communications, sensing, driver assistance, and fully autonomous vehicles. Although the next-generation vehicle market is still in its infancy and automobile manufacturers have hesitated to adopt many smart technologies, cars with smart technologies will gain a larger share of the automobile market as the demand for next-generation vehicles increases.
According to Nelson [1], the percentage of a car’s total cost represented by electronic components is projected to gradually increase from 35% in 2010 to 50% in 2030. Additionally, Koslowski [2] mentioned that the automobile industry should also consider the fast-changing digital lifestyle and needs of consumers. Therefore, the influence of next-generation vehicles on the existing car market, particularly as driven by consumer preferences, is a worthwhile topic of research.
One of the related topics that has recently drawn researchers’ attention to is investigating consumer preferences for alternative fuel vehicles (AFVs, hereafter) and their attributes. Due to growing concerns about global air pollution and depleting fossil fuels, research developing and deploying vehicles operated with environment-friendly fuels have been accelerated to reduce dependency on fossil fuels in transportation sector, which accounted for 65% of the total oil consumed worldwide in 2015 [3]. These efforts have leaded to start releasing various types of AFVs (e.g., electric vehicles, vehicles fueled with biofuels) in the existing car market and necessitated in-depth examination of not only their environmental impact [4,5,6,7], but also how the existing car market will react to this change. Another emerging market segment is that of alternative fuel vehicles (AFVs, hereafter), such as hybrid and electric cars. Extensive research has been conducted to investigate consumer preferences for AFVs and their attributes. Earlier studies focusing on consumer preference towards AFVs used aggregate models and revealed preference (RP) data to forecast vehicle demand [8,9]. However, due to a need to incorporate various detailed variables, researchers have begun to concentrate on disaggregate models using stated preference (SP) data. Survey data has been utilized with various discrete choice models to analyze more detailed information regarding consumer preferences for specific vehicle characteristics [10,11,12,13,14,15,16,17]. Recently, consumer preferences for AFVs, which are more eco-friendly than conventional vehicles, were analyzed [10,12,13,14,15,16,18,19,20]. However, although recent studies rigorously estimated heterogeneous consumer preference for alternative fuel vehicles using discrete choice models based on either random regret minimization (RRM) or random utility maximization (RUM) framework, they normally incorporated attributes which are directly related to the AFV such as driving range, recharging time etc. Therefore, the objective of this study was to assess the impact of the next generation of vehicles with advanced vehicle technologies on the existing car market by considering smart technologies that can create synergistic effects with AFVs for vehicle sales.
However, because advanced vehicles with features such as autonomous driving, voice commands, and other smart functions have generally not yet entered the market, RP data cannot be applied for the analysis. Thus, choice experiments were more appropriate for considering smart technologies that have not yet been launched. Furthermore, because a consumer may potentially operate more than one vehicle within a household, a multiple-choice situation was considered. Therefore, a multiple discrete-continuous extreme value (MDCEV) model was used to analyze consumer preference regarding vehicle choice and usage.
With estimation results from the MDCEV model, this study forecast consumer vehicle usage for eight vehicle types: gasoline, diesel, hybrid, and electric (each fuel type combined with and without advanced vehicle technologies to yield a total of eight types), via market simulation. Additionally, we performed market segmentation based on estimated coefficients and socio-demographic variables to clarify which consumer groups preferred a particular vehicle type. The market simulation and market segmentation results provided sufficient information about the potential next-generation car market and helped guide marketing strategies, such as target marketing.
The remainder of this paper has been structured between the following four sections. First, a literature review summarized studies evaluating the automotive preferences of consumers. In the next section, the MDCEV model is briefly explained, followed by a description of choice experiments and data. The following section presents the main results and discussions from estimations of the MDCEV model, market simulation, and market segmentation. Finally, the core conclusions and implications of the study are presented.
2. Literature Review
Predicting consumer responses to specific features is essential to the incorporation of new equipment and technology in automotive product lines, thus necessitating choice modeling within the transportation field.
Earlier studies analyzed the automotive choices of consumers based on aggregate econometrics models with RP data. The Chase Econometric Associates [8] model is the most renowned; however, several other models, such as that of Difiglio and Kulash [9], were subsequently developed. The primary limitation of these models is that they assume only two vehicle characteristics affect consumer choices: car price and fuel economy. Thus, most models incorporate car price and fuel economy as the sole explanatory variables, which is insufficient to properly represent the diverse preferences of consumers.
The first attempt to overcome the limitations of prior aggregate models was made by Lave and Train [21], who introduced SP data collected by a survey and the multinomial logit (MNL) model for the development of a disaggregate model of auto-type choice. Since that study, myriad papers have been published to develop discrete choice models to analyze consumer preferences and forecast demand [11,17,22].
However, since the models in the aforementioned studies were not independent of the irrelevant alternatives (IIA) assumption, their results were not realistic in many AFV choice cases. Thus, considerable efforts have been made to overcome this problem through the introduction of discrete choice models, such as the nested multinomial logit (NMNL) models, mixed logit (ML) models, and probit models. By developing NMNL models and binomial logit models for both vehicle choice and fuel choice, Bunch et al. [23] showed that (i) range (the distance a fully-fueled vehicle can travel prior to requiring refueling) was a pivotal attribute for clean-fuel vehicle choice, and (ii) range and fuel costs were key attributes for fuel choice in California. Brownstone et al. [24] introduced the ML model and compared the resulting estimates with those of the MNL model, concluding that the ML models yielded a better fit than the MNL models that showed large heterogeneity regarding consumer preference for AFVs.
Recently, some researchers have applied non-traditional methods to investigate car buyers’ preferences for AFVs. Ahn et al. [18] and Shin et al. [19] used the MDCEV model, which was based on the MNL model developed by Bhat [25,26], with Bayesian estimation instead of the classical approach for AFV preference. Based on these estimates, Ahn et al. [18] showed that the introduction of AFVs would discourage fossil fuel consumption and the emission of pollutants, while Shin et al. [19] probed the impact of subsidization and tax incentives to promote electric vehicle usage, revealing that purchase price subsidies were more effective than tax incentives for encouraging environmental improvements. The prior studies are summarized in Table 1.
A review of the aforementioned literature raised some issues. First, although a wide range of studies have been performed regarding consumer preferences for AFVs through discrete choice models, few studies incorporated smart technologies that may play an important role toward boosting AFV usage as core attributes. Second, most studies did not provide detailed information regarding the consumer group with the greatest interest in purchasing the next generation of vehicles with advanced vehicle technologies. In fact, without solving this issue, it was difficult to provide fundamental information that could be utilized to devise consumer-specific strategies and policies to encourage next-generation vehicle usage and adoption of smart technologies.
Hence, using SP data and the MDCEV model, which simultaneously reflected consumer choice and usage information, this study investigated the heterogeneous preferences of consumers regarding smart technologies and fuel types. Then, based on an estimated utility function of the consumer, we performed market share simulations under various scenarios to analyze the impact of the next-generation vehicles on the existing vehicle market in addition to market segmentation to reveal the lead user groups of the next-generation vehicles.
3. Model Specifications and Data
3.1. The Multiple Discrete-Continuous Extreme Value (MDCEV) Model
For this study, a mixed MDCEV was applied to analyze the impact of the emergence of smart technologies on the existing market in terms of vehicle choice and usage patterns. Developed by Bhat [25,26], this model could analyze both choice and usage patterns and consider heterogeneity by setting assumptions about the distribution of each parameter [18,25,26].
According to its specification, the utility function of each consumer was represented with Equation (1) when the ith consumer selected J alternatives among a total of K alternatives, and the quantity of each used by the ith consumer was [18,19,25,26].
In this utility function, represents attributes of the jth alternative, and is the baseline utility from choosing the jth alternative. The existence of an interior or corner solution is determined by parameter [25,26]. is a satiation parameter representing the degree of diminishing marginal utility. To satisfy the law of diminishing marginal utility, the satiation parameter, , should possess a value between zero and one, as . In this study, was assumed to be nonzero to allow for a corner solution and was also assumed to be the same for all alternatives due to the identification problem between and (see Bhat [25]).
The baseline utility , which was always positive, was defined in an exponential form with Equation (2); thus, Equation (1) could be rewritten as a random utility, as in Equations (3). In Equation (3), β represents the coefficients of explanatory variables, and describes the error term that follows a standard extreme value distribution.
Because rational consumers seek to maximize their utility under budget constraints, budget constraints were recognized as essential parts of the model when analyzing the optimal behaviors of consumers. The constraints could be defined by the total usage of all alternatives as in Equation (4):
represents vehicle usage of the jth alternative. This study used individual annual vehicle mileage as the budget constraint, M. For the budget constraint, information regarding individual annual vehicle mileage was first collected and presented to each consumer as a budget constraint. To solve the utility maximization problem from Equation (3) with the budget constraint shown in Equation (4), the Lagrangian method and Kuhn-Tucker condition could be used. According to these techniques, the optimal choice and usage patterns of consumers could be written as shown in Equation (5) [25]:
where, , .
In Equation (5), I indicates the total number of chosen alternatives. If a consumer picked only one alternative (I = 1), the equation converged to the MNL model. However, if the distribution for each parameter was assumed, then the mixed MDCEV model emerged; the probability of a mixed MDCEV model is shown in Equation (6):
Because the mixed MDCEV model is not a closed form, a computational complexity problem could arise. Therefore, for the estimation procedure, a Bayesian estimation method was applied to lessen any computational complexity and local maximization problems arising in the classical method [25,26,27,28,29,30,31].
3.2. Choice Experiments and Data Description
To estimate consumers’ preferences regarding smart technologies and fuel types and to investigate the influence of newly introduced smart technologies to the existing vehicle market, either RP or SP data was needed. However, since certain smart technologies are not available in the current vehicle market, RP data is not applicable. Therefore, SP data was used in choice experiments [32].
This paper is based on a survey conducted in Korea; the survey was originally designed to investigate the attitudes of consumers toward eco-friendly products and smart devices, including the next generation of vehicles with advanced vehicle technologies such as smart technologies. The responses of 639 individuals were compiled to create a representative sample of the Korean population using a purposive quota sampling method. The survey was performed face-to-face by well-trained interviewers from an experienced company in 2012. This paper included both drivers and non-drivers or non-vehicle owners as research targets. We assumed non-drivers to be potential customers within the next-generation vehicle market because all consumer groups would be able to operate next-generation vehicles without difficulty if autonomous driving systems were to become available. In addition, we asked the respondents’ household income and their budget structure to derive their decision based on their budget constraints. A summary of the sample is presented in Table 2.
To set up choice experiments, a set of attributes and levels was created to compose alternative cards representing various fuel types and smart technologies. The attributes used were fuel type, body type, fuel cost, purchase price, accessibility of fueling stations, and smart technologies. The four fuel types included were gasoline, diesel, hybrid, and electric. With regard to smart technologies, various options are being developed, including smart device connectivity (content sharing, home appliance remote controls, etc.), voice recognition (enables drivers to control driving-irrelevant functions such as opening windows and controlling stereo volume using voice commands), autonomous driving (keeping a vehicle in a lane, automatic speed control, automatic parking, etc.), in-vehicle internet connections (providing Wi-Fi to other devices), and driving-related applications (providing driving-relevant information such as traffic information). Because many combinations of smart technologies are possible, this study simply assumed “smart technologies” to be a dummy variable, being either equipped or not equipped. The reason we assume smart technologies as a dummy variable is that if the attribute, “Smart technologies” is specified into detail levels, possible number of alternatives increase dramatically. According to [33], there is some reliability issues on the estimation results in case that too many attributes and levels are included in the conjoint analysis. Therefore, this study simplifies smart technologies to analyze the effect of next-generation vehicles on the automobile market. Table 3 provides detailed information regarding the attributes and attribute levels.
Consequentially, the possible alternatives per level of measurement were 4 × 2 × 3 × 4 × 3 × 2 = 576. Because the respondents could not express preferences for all possible cases, this study reduced the number of possible cases through fractional factorial design, maintaining orthogonality among attributes. Therefore, 24 alternatives from all possible cases were chosen through the fractional factorial design method. Because the respondents could still have a burden to express their preference for 24 alternatives, this study divided 24 alternatives into six sets that each set include 4 alternatives. Additionally, to improve reliability of survey results, we reduced the survey length and time. Thus, three choice sets among six sets were provided to each respondent.
4. Results and Discussion
4.1. Overview of Vehicle Market in South Korea
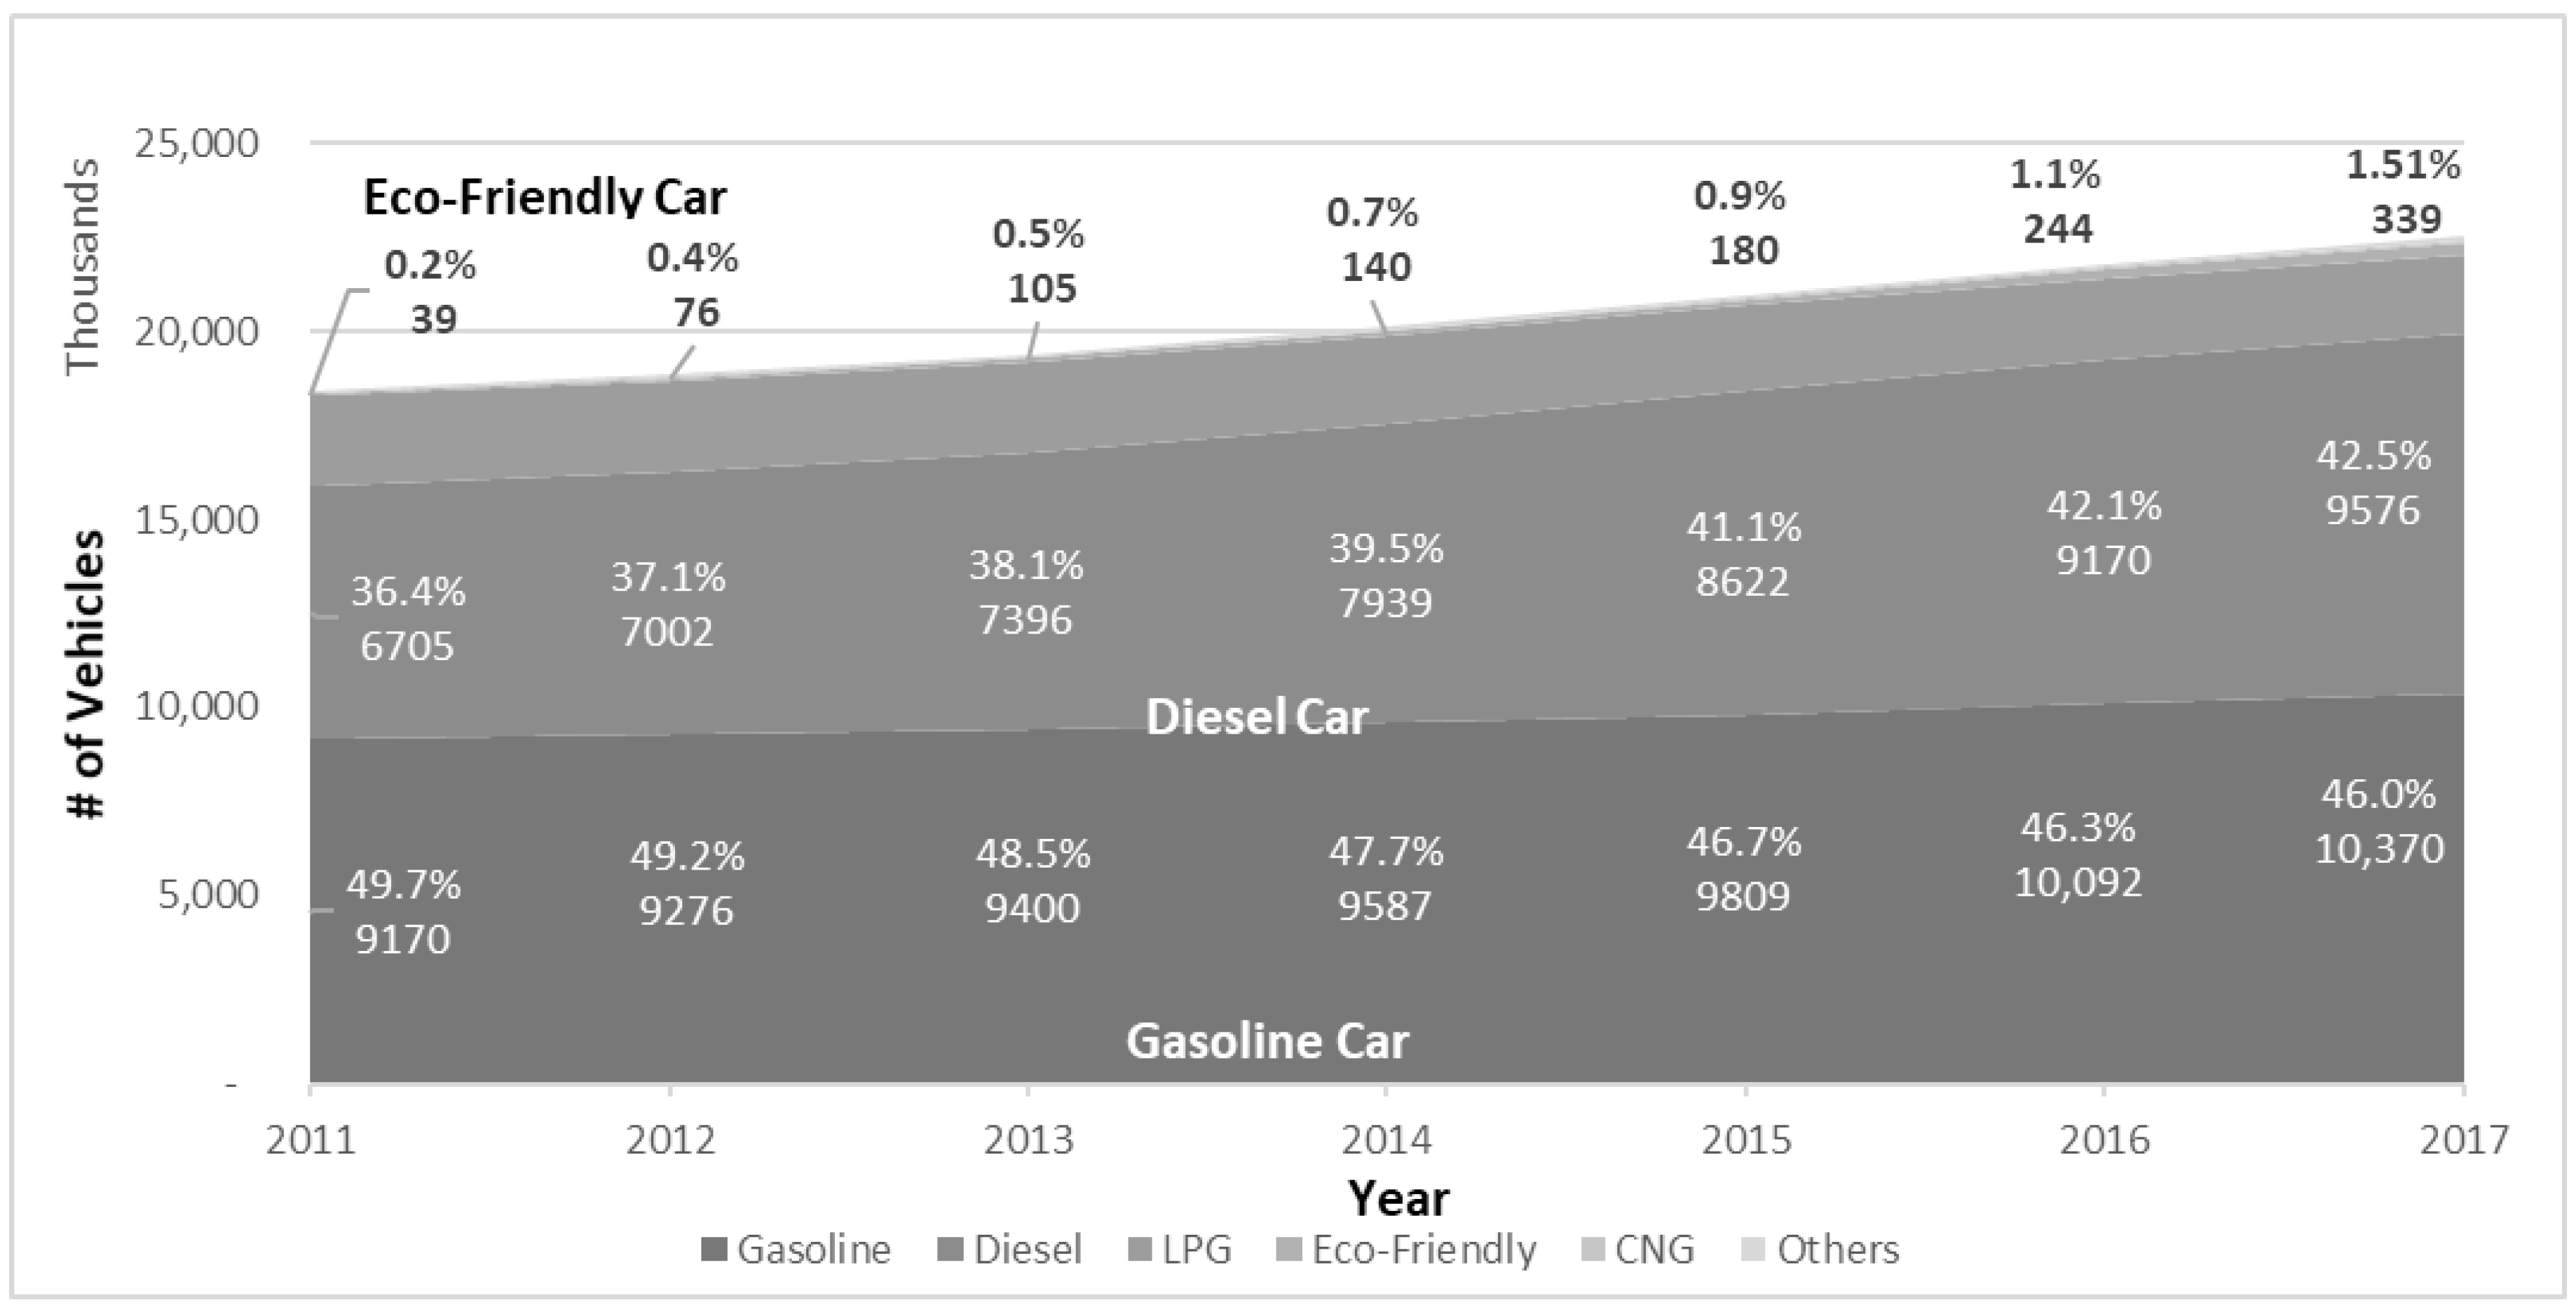
As of 2017, the total number of registered vehicles in South Korea was reported as 22.5 million approximately including all types of vehicles. This indicates that at least a vehicle is owned per every 2.3 people [34]. Compared with that of the previous year, the rise in the number was about 725 thousand, indicating 3.3% increase. The total number of registered vehicles in South Korea has continues to increase since 1966, and the annual average growth rate for the last 10 years was 3.2% [35].
Due to the government’s recent efforts to promote the introduction and usage of eco-friendly vehicles (hybrid vehicles, electric vehicles, and hydrogen vehicles), the number of eco-friendly vehicles is dramatically increasing. For instance, the number of hybrid vehicles registered in 2017 was 313,856; however, it had been 223,216 in 2016, which denotes 35% increase in its number. This trend is more noticeable in the case of electric vehicles and hydrogen vehicles: 131% and 95% increase in their numbers respectively [36]. Though the proportion of those eco-friendly vehicles (1.5%) are yet negligible in comparison to that of vehicles operated with conventional fuels, these recent trends may imply the potential growth of eco-friendly car market in South Korea (in Figure 1).
4.2. Estimation Results
This section presents the estimation results for consumer preferences regarding the selection and usage of next-generation vehicles based on SP data from choice experiments. Because each household could practically own more than one vehicle, choice experiments were designed to consider a multiple-choice situation. Regarding the allocation of car usage, the annual mileage of respondents was used as a budgetary constraint. Based on this information, respondents decided their usage of each chosen alternative.
As mentioned earlier, this study considered the following four different fuel types: gasoline, diesel, hybrid, and electric; these were defined as dummy variables. To estimate the dummy variables, “gasoline” was set as the fuel type reference. Meanwhile, vehicle type and smart technologies were also defined as dummy variables. For vehicle type, “SUV” was defined as 1; in order words, “sedan” was set as the reference for vehicle type. If smart technologies were provided, we defined the response to be 1. Moreover, this study assumed that the fuel cost and purchase price coefficients exhibited a log-normal distribution because rational consumers possess a negative preference for higher costs, which is a one-directional preference [37]. The measurement units for fuel cost, purchase price, and fueling station accessibility were 100 KRW/km (0.09 USD/km), KRW 10 million (USD $9165.9), and 100%, respectively. The remaining coefficients for each independent and satiation variable were assumed to possess a normal distribution.
Regarding an estimation method, this study adopted a Bayesian method in generating 20,000 draws through Gibbs sampling to estimate each coefficient of the MDCEV model [18,19,31]. The first 10,000 draws were discarded to exclude the initial value effect (burn-in period), and every 10th draw among the remaining 10,000 were retained to estimate each coefficient. Therefore, every coefficient in the model was based on the 1000 retained draws. To interpret the estimation results from a traditional perspective, this study used 2000 draws, which were additionally extracted from distributions of the estimation parameters. The specific estimation results of the baseline utility and satiation parameters are shown in Table 4.
For all respondents, results for the baseline utility estimations showed that consumers generally preferred, in descending order, hybrid, gasoline, diesel, and electric vehicles. However, because the mean value for hybrid vehicles was not statistically significant, consumer preference for hybrids did not differ from that of gasoline. Thus, consumers generally preferred hybrid and gasoline vehicles to other fuel types. These results were consistent with Harrop and Das [38], who indicated that the demand for hybrid vehicles would be greater than that for pure electric vehicles. Electric cars elicited the weakest preference due to their limited range and battery recharging times.
Comparing the estimated baseline utilities among respondents’ group, drivers preferred hybrid vehicles to other vehicles, which may have been due to their substantial fuel cost savings during an age of high oil prices. However, unlike drivers, non-drivers mostly preferred gasoline vehicles, the most familiar alternative.
Regarding cost-related attributes, the fuel cost and purchase price coefficients in all three groups exhibited significant negative values (as expected, because these attributes negatively affected consumers’ willingness to purchase a vehicle). Specifically, by comparing the part-worth for each fuel cost and purchase price, the vehicle purchase probability was more significantly affected by fuel costs than purchase price. This result differed from that of a previous study. Shin et al. [19] showed that consumers were affected by changes in purchase price rather than changes in fuel costs. This difference was attributed to increasing oil prices rather than increasing domestic vehicle prices (in response to competition with imported vehicles). According to Korea National Oil Corporation (http://www.knoc.co.kr/), the gasoline price increased 1525.87 KRW/l in 2007 to 1985.76 KRW/l in 2012. Because the survey of this study conducted in 2012, respondents recognized the increase trend of oil price. Meanwhile, Consumer Insight [39] describes that the domestic vehicle price increased 17.6% during the 5 years if we assume that trend of vehicle price is linear. Compared with the variation of vehicle price, the increase ratio of gasoline price (30.1%) is greater than vehicle price. This result suggests that, when a company sets the sales price for a newly developed vehicle, fuel costs should be considered rather than sticker prices.
For the other attributes, respondents in all three groups preferred SUVs to sedans, but not at a statistically significant level. According to the Korean Ministry of Land, Infrastructure, and Transport [40], the ratio of SUVs to all newly registered vehicles increased from 18.3% in 2013 to 21.4% in 2014, and the trend is expected to continue. Therefore, consumer preferences for SUVs could gradually increase in the future. In all three groups, regarding fueling station accessibility, consumer utility for a selected next-generation vehicle increased when fueling station accessibility increased. Regarding smart technologies, respondents in all three groups significantly preferred the availability of smart technologies. Additionally, to provide economic value to smart technologies, the marginal willingness-to-pay (MWTP) for adopting smart technologies based on the estimates of the coefficients was calculated as in Table 4. The estimation result for the average MWTP for adopting smart technologies was 7.24 million KRW (USD $6636) for all respondents.
According to the satiation parameter results that represent a diminishing marginal utility of car usage, we determined the market potential for each fuel type. For instance, if a certain fuel type had a higher satiation value, , than other fuel types, the additional utility from car usage was relatively lower than that of other fuel type, and we expected that the market for this fuel type would have a lower market potential than other fuel types. From this perspective, electric vehicles yielded the lowest satiation values and were promising regarding market potential among the four fuel types. Meanwhile, the satiation parameter results of drivers and non-drivers revealed different trends: in the driver group, conventional fuel types such as gasoline and diesel possessed a greater market potential than that of alternative fuels such as hybrids and electrics. In the non-driver group, alternative fuel types possessed a greater market potential than that of conventional fuel types. These results indicate that non-drivers are more concerned about environmental improvements rather than convenience, while drivers are more concerned about convenience than environmental effects.
4.3. Market Simulations
Based on the estimation results of the MDCEV model, market simulations were conducted to forecast the vehicle mileage of consumers under a scenario in which the next generation of vehicles with advanced vehicle technologies were introduced to the market. In other words, because market simulation investigates the introduction impact of next-generation vehicles on existing automobile market, the change between with and without next-generation vehicles should be analyzed. Therefore, firstly we designed scenario 1 as automobile market without next-generation vehicles. Secondly, we designed scenario 2 as automobile market with next-generation vehicles, but not available smart technologies. Lastly, we designed plausible scenario 3 to analyze the effect of introduction of smart features to the automobile market. Because smart technologies could be added to vehicles running on any fuel type, we analyzed which next-generation car type could dominate the automobile market in scenario 3. In summary, three hypothetical scenarios were proposed:
- Scenario 1: Neither electric vehicles nor smart technologies exist in the automobile market.
- Scenario 2: Electric vehicles are widespread, but smart technologies do not exist in the automobile market.
- Scenario 3: Electric vehicles are widespread, and smart technologies are available in the automobile market.
Based on these three scenarios, we performed simulations to forecast the optimal choice and mileage of consumers using the estimated results for each attribute and annual car mileage for each respondent. Prior to performing the market simulations, it was assumed that the annual mileage of each individual was fixed to a typical usage level, with all consumers attempting to maximize utility within their vehicle mileage constraint. Based on these assumptions, the optimal car mileage for consumer i with fuel type j, mij, was analyzed as shown in Equation (7):
where, , , and are estimation result values from the MDCEV model. Mi represents the annual car mileage constraint for each consumer i and is a given value. Based on Equation (7), we analyzed the optimal vehicle mileage of consumer i for each fuel type, mij.
Table 5 denotes the assumed specific attribute levels for each vehicle, xj. According to the Korean National Oil Corporation (KNOC, www.knoc.co.kr), the average price for gasoline and diesel from January 2018 to February 2018 was 1554.4 KRW/l (USD $1.42/l) and 1348.1 KRW/l (USD $1.24/l), respectively. Additionally, based on information from the Korea Energy Management Corporation (www.kemco.or.kr/transport/), which provided vehicle performance statistics for mid-size vehicles in the market, it was assumed that the fuel efficiency of a gasoline sedan was 12.2 km/l, 9.1 km/l for a gasoline SUV, 14.1 km/l for a diesel sedan, 11.6 km/l for a diesel SUV, 17.5 km/l for a hybrid sedan, 15.5 km/l for a hybrid SUV, 5.1 km/kwh for an electric sedan, and 4.4 km/kwh for an electric SUV. Based on this information, this study determined fuel costs for each vehicle. The current market price for released products was used to set the attribute level of the purchase price, as in Shin et al. [19]. Of particular note, it was assumed that fueling station accessibility for gasoline, diesel, and hybrid vehicles was 100%, but was 50% for electric vehicles due to limitations with regard to charging infrastructure.
Under Scenarios 1–3 with the aforementioned attribute levels, the choice probability and average usage for each vehicle type were simulated. Because this study focused on the introduction impact of next-generation vehicles on existing market, we investigated car mileage pattern results and choice probability changes following the introduction of electric vehicles and smart technologies (See Table 6). According to Ahn et al. [18] and Shin et al. [19], the simulation results do not match actual market share in the automobile industry because the scenario was built on a hypothetical situation that could not include all real-world alternatives. That is, the gap between the study results and the current automobile-market data arose because the scenario presents a hypothetical situation [18,19]. However, Ahn et al. [18] and Shin et al. [19] also mentioned that changes in general consumption trends with regard to vehicle usage patterns caused by the introduction of vehicles using new fuels could be explained for consumer trend. Therefore, Table 6 shows the change in car mileage pattern and choice probability following the introduction of electric vehicles and smart technologies.
By comparing Scenarios 1 and 2, a change in consumer vehicle choice and usage patterns of vehicles after the introduction of electric vehicles could be simulated. The introduction of electric vehicles would negatively affect mileage of other vehicle fuel types due to low fuel costs and an environment-friendly image. However, electric vehicles would positively affect the choice probability of other vehicle fuel types. We expected that the introduction of electric vehicles would activate the current automobile market.
However, by comparing Scenarios 2 and 3, it was deduced that the introduction of vehicles with smart technologies generally yielded negative effects with regard to the choice probability of most vehicle fuel types without smart technologies, except for normal diesel vehicles, which do not include smart technologies. Additionally, the results showed that gasoline vehicles with smart technologies were largely preferred to the alternatives, revealing that smart technologies could effectively boost the sales of gasoline vehicles. These findings are congruous with discussions from previous studies [41,42].
In summary, assuming that other technical attributes (e.g., engine displacement) remain unchanged, with the exception of fuel cost, purchase price, and fueling station accessibility, the introduction of electric vehicles to the automobile market was expected to yield a negative impact with regard to the mileage of other vehicles, but a positive impact with regard to the choice probability of other vehicles. Meanwhile, the introduction of vehicles with smart technologies negatively influenced the choice probability of vehicles without smart technologies. Thus, although electric vehicles were introduced, only if smart technologies were available would vehicles using conventional fuels (represented by gasoline and diesel) maintain their current position in the automobile market. Of particular note, the simulation results showed that the reductions in mileage and choice probability for hybrid vehicles were highest in response to the introduction of electric vehicles and smart technologies.
4.4. Market Segmentation
Along with the market simulation, market segmentation was conducted using estimation results of this study and consumer socio-demographic variables to clarify which consumer groups preferred a particular vehicle type. In analysis, we only considered consumers’ main vehicle type and we did not consider their second vehicle type. As for consumer socio-demographic variables, we considered respondents’ sex, age, monthly household income and their number of family. With regard to market segmentation, the SPSS TwoStep clustering method was used because it is a rigorous clustering method that can deal with both continuous and categorical attributes [43].
The analysis was conducted in two ways. Analysis 1 was a market segmentation based on the fuel types of all vehicles (see Table 7), while Analysis 2 was a market segmentation based on the fuel types of advanced vehicles with smart technologies (see Table 7). In market segmentation, we consider all possible vehicles that are combinations of fuel type, body type and smart technologies. Analysis 1 provided general information regarding each subgroup in the automobile market for target marketing, while Analysis 2 provided specific information regarding advanced vehicle subgroups. Prior to analysis, optimal choice data from Scenario 3 and consumer socio-demographic variables (such as age, sex, and income) were combined to form a new data set for clustering analysis. Table 7 shows the results of Analyses 1 and 2.
Analysis 1 in Table 7 indicates that consumers who prefer gasoline vehicles form the largest cluster (44.3%), Cluster A1. They are estimated to be relatively old female with high household income and have large family members. Meanwhile, consumers preferring hybrid vehicles form second largest cluster (35.7%), Cluster A2 and are estimated to be relatively young male with small household income and have small family members. Lastly, as for the Cluster A3, because the survey of this study conducted before dieselgate, we assume that consumers recognize diesel type as clean diesel having low emissions compared with gasoline. Thus, diesel or electric is favored by small group of consumers (20.0%) and their socio-demographic variables are normally estimated to be intermediate level compared to consumers in cluster A1 and A2.
Meanwhile, market segmentation results with a focus on fuel types with smart technologies, Analysis 2 in Table 7 are quite different compared to Analysis 1. Analysis 2 in Table 7 indicates that the share of consumers who prefer gasoline vehicles, Cluster B1 is estimated to be 36.6%. In addition, they are estimated to be relatively old female with intermediate household income and have average family members. Although they still form the largest cluster, its share decreases from 44.3% to 36.6%. On the other hands, consumers who prefer diesel or electric, Cluster B2 can form second largest cluster (35.8%). Their socio-demographic variables are estimated to be relatively average level except household income and size of family. Finally, hybrid is preferred by small group of consumers (27.5%) who are estimated to be relatively young male with small household income and have small family members.
In summary, gasoline vehicles (including smart technologies) were generally preferred by relatively older individuals. However, hybrid vehicles (including smart technologies) were favored by relatively young consumers with low household incomes and small families. From the estimates of clustering analyses, we can conjecture that gasoline vehicle, representative conventional fuel type is normally preferred by the conservatives who are relatively risk-averse to the new alternatives and focus on the proven applications and hybrid is preferred by the people who are relatively attracted to the new technology seeking efficiency. However, if we focus on fuel types with smart technologies, the relative size of vehicle market using conventional fuel type (gasoline) or transitional fuel type (hybrid) can decrease significantly meanwhile the relative size of vehicle of the diesel or electric fuel can soar up.
5. Conclusions and Remarks
This study examined the impact of introducing next-generation vehicles with advanced vehicle technologies to the existing car market. Specifically, this study analyzed the effect of introducing next-generation vehicles with smart technologies to the automobile market through market simulations. Market segmentation was also performed by identifying the specific vehicle types preferred by certain consumer groups. A mixed MDCEV model was used with SP data to analyze consumer preferences for the future automobile market.
The prevalence of smart technologies such as autonomous functions may resolve problems associated with human error, enhance convenience, and provide new business opportunities for industries related to electric vehicles and smart technologies. The results indicate that satiation parameters for electric vehicles yield the highest value per unit. Therefore, the potential of electric vehicles is higher than that of other vehicle types. Additionally, this study compared the preferences of a driver group to a non-driver group. Consumers in the driver group possessed a positive preference for hybrid vehicles with a fuel cost advantage, while non-drivers preferred gasoline vehicles. With regard to smart technologies, results from all three groups revealed that consumers indicated a significantly positive preference to add smart technologies to their selected alternative. Additionally, the average MWTP to adopt smart technologies was 7.24 million KRW (USD $6636) for all respondents.
According to the market simulation results, the introduction of an electric vehicle without smart technologies was more likely to positively influence the purchase probability of other vehicle types, such as gasoline, diesel, and hybrid vehicles. However, the introduction of vehicles with smart technologies to existing vehicles had a negative influence on purchase probability for most existing vehicles without smart technologies. In addition, although electric vehicles and smart technologies were introduced, vehicles using conventional fuels (represented by gasoline and diesel) would maintain their current position in the automobile market.
This study also analyzed the vehicle fuel type preferences of specific consumer groups, with the aim of establishing target marketing strategies. Based on the market segmentation results, we could divide automobile consumers into three categories: the first group preferring gasoline vehicles, the second preferring hybrid vehicles, and the third favoring diesel or electric vehicles. For instance, hybrid vehicles were chosen by consumers who were relatively young with low household incomes and small families (this same group indicated a preference for vehicles with smart technologies). Based on the clustering analysis results, we could suggest specific market strategies for next-generation vehicles promoted with a preferred fuel type.
Although this study provided a substantial analysis of preferences for next-generation vehicles with advanced vehicle technologies, certain limitations were evident. First, due to an uncertainty of technological trends, the development of smart technologies could proceed in unexpected directions. However, this study considered smart technologies as only one dummy variable, representing the availability of smart technologies. Thus, choice experiments considering various smart technologies as separate attributes would enable a more detailed analytical forecast for next-generation vehicles. Second, this study used SP data for the analysis. As mentioned earlier, the estimation results from SP data could be overestimated. Moreover, although this study clarifies the respondents’ budget plan and their household income before their decision on choice experiments, SP data could not guarantee whether respondents are the decision maker at home to decide which car to buy. Therefore, combining SP data with RP data could increase the validity of the results by using the model of Hensher [44] which reflect scale difference between RP and SP data. Lastly, this study did not consider the timing of consumer decisions because a static model was used as opposed to a dynamic model. Thus, the research model of this study could be expanded by considering the dynamic model of Cirillo et al. [45]. Despite these shortcomings, the estimation results and market simulations of this study could be utilized to establish useful management and marketing strategies for next-generation vehicles with advanced vehicle technologies in the automobile market.
Acknowledgments
This work was supported by the National Research Foundation of Korea Grant funded by the Korean Government (NRF-2017R1C1B5074293), the Korea Ministry of Environment as Climate Change Correspondence R&D Program (2014001300001).
Author Contributions
Jungwoo Shin and Jae Young Choi conceived and designed the research; Jungwoo Shin and Taehoon Lim collected data and analyzed the data; Moo Yeon Kim and Jungwoo Shin contributed to progress of research idea; Jungwoo Shin, Taehoon Lim, Moo Yeon Kim and Jae Young Choi wrote the paper. All authors have read and approved the final manuscript.
Conflicts of Interest
The authors declare no conflict of interest.
References
- Nelson, S.P. Challenges and Technologies: The Human Friendly Vehicle in 2030 and Beyond; Freescale Semiconductor, Inc.: Mansfield, TX, USA, 2009; Available online: www.freescale.com/files/training_pdf/VFTF09_AA106.pdf (accessed on 29 January 2017).
- Koslowski, T. Your Connected Vehicle Is Arriving. Technology Review. 2012. Available online: www.technologyreview.com/news/426523/your-connected-vehicle-is-arriving/ (accessed on 29 January 2017).
- International Energy Agency (IEA). Statistics—World Energy Balances; IEA: Paris, France, 2017. [Google Scholar]
- Brady, J.; O’Mahony, M. Travel to Work in Dublin. The Potential Impacts of Electric Vehicles on Climate Change and Urban Air Quality. Transp. Res. Part D Transp. Environ. 2011, 16, 188–193. [Google Scholar] [CrossRef]
- Hawkins, T.R.; Gausen, O.M.; Strømman, A.H. Environmental Impacts of Hybrid and Electric Vehicles—A Review. Int. J. Life Cycle Assess. 2012, 17, 997–1014. [Google Scholar] [CrossRef]
- Costagliola, M.A.; Prati, M.V.; Florio, S.; Scorletti, P.; Terna, D.; Iodice, P.; Buono, P.; Senatore, A. Performances and Emissions of a 4-stroke Motorcycle Fueled with Ethanol/Gasoline Blends. Fuel 2016, 183, 470–477. [Google Scholar] [CrossRef]
- Iodice, P.; Senatore, A. Influence of Ethanol-Gasoline Blended Fuels on Cold Start Emissions of a Four-stroke Motorcycle. Methodology and results. SAE Tech. Pap. 2013. [Google Scholar] [CrossRef]
- Chase Econometric Associates. The Effect of Tax and Regulatory Alternatives on Car Sales and Gasoline Consumption; NTIS Report No. PB-234622; Chase Econometric Associates, Inc.: New York, NY, USA, 1974. [Google Scholar]
- Difiglio, C.; Kulash, D. Marketing and Mobility; Report of a Panel of the Interagency Task Force on Motor Vehicle Goals Beyond 1980, Publication FEA/D-76/333; Federal Energy Administration: Washington, DC, USA, 1976. [Google Scholar]
- Beck, M.J.; Chorus, C.G.; Rose, J.M.; Hensher, D.A. Vehicle purchasing behaviour of individuals and groups: Regret or reward? J. Transp. Econ. Policy 2013, 47, 475–492. [Google Scholar]
- Choo, S.; Mokhtarian, P.L. What type of vehicle do people drive? The role of attitude and lifestyle in influencing vehicle type choice. Transp. Res. Part A Gen. 2004, 38, 201–222. [Google Scholar] [CrossRef]
- Chorus, C.G.; Koetse, M.J.; Hoen, A. Consumer preferences for alternative fuel vehicles: Comparing a utility maximization and a regret minimization model. Energy Policy 2013, 61, 901–908. [Google Scholar] [CrossRef]
- Hackbarth, A.; Madlener, R. Consumer preferences for alternative fuel vehicles: A discrete choice analysis. Transp. Res. Part D Transp. Environ. 2013, 25, 5–17. [Google Scholar] [CrossRef]
- Hackbarth, A.; Madlener, R. Willingness-to-pay for alternative fuel vehicle characteristics: A stated choice study for Germany. Transp. Res. Part A Policy Pract. 2016, 85, 89–111. [Google Scholar] [CrossRef]
- Hensher, D.A.; Greene, W.H.; Chorus, C.G. Random regret minimization or random utility maximization: An exploratory analysis in the context of automobile fuel choice. J. Adv. Transp. 2013, 47, 667–678. [Google Scholar] [CrossRef]
- Hoen, A.; Koetse, M.J. A choice experiment on alternative fuel vehicle preferences of private car owners in the Netherlands. Transp. Res. Part A Policy Pract. 2014, 61, 199–215. [Google Scholar] [CrossRef]
- Train, K.E.; Winston, C. Vehicle Choice Behavior and the Declining Market Share of U.S. Automakers. Int. Econ. Rev. 2007, 48, 1469–1496. [Google Scholar] [CrossRef]
- Ahn, J.; Jeong, G.; Kim, Y. A forecast of household ownership and use of alternative fuel vehicles: A multiple discrete-continuous choice approach. Energy Econ. 2008, 30, 2091–2104. [Google Scholar] [CrossRef]
- Shin, J.; Hong, J.; Jeong, G.; Lee, J. Impact of electric vehicles on existing car usage: A mixed multiple discrete–continuous extreme value model approach. Transp. Res. Part D Transp. Environ. 2012, 17, 138–144. [Google Scholar] [CrossRef]
- Ziegler, A. Individual characteristics and stated preferences for alternative energy sources and propulsion technologies in vehicles: A discrete choice analysis for Germany. Transp. Res. Part A Gen. 2012, 46, 1372–1385. [Google Scholar] [CrossRef]
- Lave, C.A.; Train, K. A disaggregate model of auto-type choice. Transp. Res. Part A Gen. 1979, 13, 1–9. [Google Scholar] [CrossRef]
- Boyd, J.H.; Mellman, R.E. The effect of fuel economy standards on the U.S. automotive market: An hedonic demand analysis. Transp. Res. Part A Gen. 1980, 14, 367–378. [Google Scholar] [CrossRef]
- Bunch, D.S.; Bradley, M.; Golob, T.F.; Kitamura, R.; Occhiuzzo, G.P. Demand for clean-fuel vehicles in California: A discrete-choice stated preference pilot project. Transp. Res. Part A Gen. 1993, 27, 237–253. [Google Scholar] [CrossRef]
- Brownstone, D.; Bunch, D.S.; Train, K. Joint mixed logit models of stated and revealed preferences for alternative-fuel vehicles. Transp. Res. Part B Methodol. 2000, 34, 315–338. [Google Scholar] [CrossRef]
- Bhat, C.R. A multiple discrete–continuous extreme value model: Formulation and application to discretionary time-use decisions. Transp. Res. Part B Methodol. 2005, 39, 679–707. [Google Scholar] [CrossRef]
- Bhat, C.R. The multiple discrete-continuous extreme value (MDCEV) model: Role of utility function parameters, identification considerations, and model extensions. Transp. Res. Part B Methodol. 2008, 42, 274–303. [Google Scholar] [CrossRef]
- Site, P.D.; Filippi, F.; Giustiniani, G. Users’ preferences towards innovative and conventional public transport. Procedia Soc. Behav. Sci. 2011, 20, 906–915. [Google Scholar] [CrossRef]
- Allenby, G.M.; Rossi, P.E. Marketing models of consumer heterogeneity. J. Econom. 1998, 89, 57–78. [Google Scholar] [CrossRef]
- Edwards, Y.D.; Allenby, G.M. Multivariate analysis of multiple response data. J. Mark. Res. 2003, 40, 321–334. [Google Scholar] [CrossRef]
- Huber, J.; Train, K. On the similarity of classical and Bayesian estimates of individual mean partworths. Mark. Lett. 2001, 12, 259–269. [Google Scholar] [CrossRef]
- Train, K.E. Discrete Choice Methods with Simulation; Cambridge University Press: Cambridge, UK, 2003. [Google Scholar]
- Green, P.E.; Srinivasan, V. Conjoint Analysis in Consumer Research: Issues and Outlook. J. Consum. Res. 1978, 5, 103–123. [Google Scholar] [CrossRef]
- Lim, S.; Huh, S.; Shin, J.; Lee, J.; Lee, Y. Enhancing public acceptance of renewable heat obligation policies in South Korea: Consumer preferences and policy implications. Energy Econ. 2015. [Google Scholar] [CrossRef]
- Ministry of Land, Infrastructure and Transport (MOLIT). Press Releases: The Number of Registered Vehicles Continues to Increase—A Vehicle Owned Per 2.3 People; MOLIT: Sejong City, Korea, 2018. Available online: http://www.molit.go.kr/USR/NEWS/m_71/dtl.jsp?lcmspage=2&id=95080239 (assessed on 10 February 2018).
- Statistics Korea. Current Status on Vehicle Registration; Statistics Korea: Daejeon, Korea, 2018. Available online: http://www.index.go.kr/potal/stts/idxMain/selectPoSttsIdxSearch.do?idx_cd=1257 (assessed on 10 February 2018).
- Ministry of Land, Infrastructure and Transport (MOLIT). Vehicle Registration Statistics December 2017; MOLIT: Sejong City, Korea, 2018. Available online: http://stat.molit.go.kr/portal/cate/statView.do?hRsId=58&hFormId=1244&hDivEng=&month_yn=N (assessed on 10 February 2018).
- Train, K.; Sonnier, G. Mixed Logit with Bounded Distributions of Correlated Partworths. In Applications of Simulation Methods in Environmental and Resource Economics; Scarpa, R., Alberini, A., Eds.; Springer: Dordrecht, The Netherlands, 2005; pp. 117–134. [Google Scholar]
- Harrop, P.; Das, R. Hybrid and Pure Electric Vehicles for Land, Water and Air 2013–2023: Forecasts, Technologies, Players; IDTechEx: Cambridge, UK, 2013; Available online: www.sae.org/images/books/toc_pdfs/MRID005.pdf (accessed on 29 January 2017).
- Consumer Insight. Consumer Report for Vehicles. 2017. Available online: https://www.consumerinsight.co.kr/sub.asp?tcode=t4&code=ins01_view&id=ins01&mode=view&idx=2880 (accessed on 7 February 2018).
- Ministry of Land, Infrastructure and Transport (MOLIT). Accumulated Number of Car Registration Could Exceed 20 Million in This Year; MOLIT: Sejong City, Korea, 2014. Available online: www.molit.go.kr/USR/NEWS/m_71/dtl.jsp?id=95074215 (Korean) (accessed on 29 January 2017).
- Iodice, P.; Senatore, A. Appraisal of Pollutant Emissions and Air Quality State in a Critical Italian Region: Methods and Results. Environ. Prog. Sustain. Energy 2015, 34, 1497–1505. [Google Scholar] [CrossRef]
- Iodice, P.; Senatore, A. Atmospheric Pollution from Point and Diffuse Sources in a National Interest Priority Site Located in Italy. Energy Environ. 2016, 27, 586–596. [Google Scholar] [CrossRef]
- Statistical Package for the Social Sciences (SPSS). The SPSS TwoStep Cluster Component: A Scalable Component Enabling More Efficient Customer Segmentation; SPSS Inc.: Hong Kong, China, 2001; Available online: www.spss.ch/upload/1122644952_The%20SPSS%20TwoStep%20Cluster%20Component.pdf (accessed on 29 January 2017).
- Hensher, D.A. Empirical approaches to combining revealed and stated preference data: Some recent developments with reference to urban mode choice. Res. Transp. Econ. 2008, 23, 23–29. [Google Scholar] [CrossRef]
- Cirillo, C.; Xu, R.; Bastin, F. A dynamic formulation for car ownership modelling. Transp. Sci. 2016, 50, 322–335. [Google Scholar] [CrossRef]
Figure 1.
Registered Vehicles in South Korea by Fuel Types. Source: Ministry of Land, Infrastructure and Transport (MOLIT), Vehicle Registration Statistics December 2017, 2018. [36].
Figure 1.
Registered Vehicles in South Korea by Fuel Types. Source: Ministry of Land, Infrastructure and Transport (MOLIT), Vehicle Registration Statistics December 2017, 2018. [36].

Table 1.
Key literature summary.
| Study | Research Goal | Data | Methodology | Key Findings |
|---|---|---|---|---|
| Bunch et al. [23] | Consumer preference for clean-fuel vehicles |
|
| Range and fuel cost are key attributes for clean-fuel vehicle choice. |
| Brownstone et al. [24] | Joint ML models for consumer preference toward AFVs |
|
| ML models draw improved results over MNL models; using joint SP/RP data is advantageous. |
| Ahn et al. [18] | Demand pattern change induced by AFVs in the vehicle market |
|
| Introducing AFVs would reduce both gasoline and diesel fuel consumption and related emissions. |
| Site et al. [27] | User preference for CTS |
|
| Users prefer automated transportation systems to conventional ones. |
| Shin et al. [19] | Introduction impact of electric vehicles on current car usage |
|
| Potential demand for electric vehicles is higher than for hybrid, diesel, or gasoline vehicles, and purchase price subsidies are more effective for emission reductions. |
| Ziegler [20] | German potential car buyers’ preference for AFVs |
|
| Policies to promote electromobility should target specific population groups: younger people, environmentally aware people, males. |
| Beck et al. [10] | Estimation of Consumer preference for AFVs |
|
| RRM is preferred behavioral mechanism for groups and individuals charging a high degree of responsibility for the choice of the group |
| Chorus et al. [12] | Estimation of Consumer preference for AFVs using RUM and RRM |
|
| RUM and RRM achieve almost identical fit with the data and differ only marginally in terms of predictive ability |
| Hackbarth and Madlener [13] | Estimation of Consumer preference for AFVs and Introduction impact of AFVs |
|
| Conventional vehicles will maintain their dominance in the market after the introduction of AFVs |
| Hensher et al. [15] | Estimation of Consumer preference on automobile fuel using RUM and RRM |
|
| The RRM model achieve a marginally better fit than RUM |
| Hoen and Koetse [16] | Estimation of Consumer preference for AFVs |
|
| Negative preferences for AFVs are large, especially for the electric and fuel cell car Due to limited driving range and refueling times. |
| Hackbarth and Madlener [14] | Estimation of Consumer preference for AFVs |
|
| Estimation of consumers’ WTP and CV for improvements in vehicle attributes |
Table 2.
Sample summary.
| Sample Size | 639 respondents |
| Gender Distribution | 304 (47.6%) males and 335 (52.4%) females |
| Age Distribution | 20–59 (Average: 38.5) |
| Family Monthly Income | 1.4–12 million KRW [USD $1283–$10,999] (Average: 4.14 million KRW [USD $4031]) |
| >Drivers and Non-Drivers | >312 (48.8%) non-drivers and 327 (51.2%) drivers |
Note: KRW denotes Korean won. 1 USD is equal to 1091 KRW as of 10 February 2018.
Table 3.
Attributes and levels of vehicles used in the survey.
| Attributes | Levels | Details |
|---|---|---|
| Fuel Type | Gasoline, Diesel, Hybrid (gasoline + battery), Electric (battery) | Electric vehicles can cover approximately 150 km (81 miles) when fully charged; to recharge, they require a 4-h charge or 2-min battery replacement. |
| Body Type | General Passenger Car, SUV | - |
| Fuel Price (KRW/km) | 200 (0.18 USD/km), 100 (0.09 USD/km), 50 (0.05 USD/km) | - |
| Purchase Price (10,000 KRW) | 2500 (USD $22,915), 3000 (USD $27,498), 3500 (USD $32,081), 4000 (USD $36,664) | Incidental expenses and tax were excluded. |
| Accessibility of Fueling Stations (%) | 100, 80, 50 | The percentage was defined as the ratio of the number of fueling stations for a specific type of fuel to the current number of traditional gas stations. |
| Smart technologies | Equipped, Non-equipped | - |
Table 4.
MDCEV estimation results.
| All Respondents | Drivers | Non-Drivers | |||||
|---|---|---|---|---|---|---|---|
| Baseline | β | Mean | Variance | Mean | Variance | Mean | Variance |
| Variable | Distribution | ||||||
| Gasoline (Base) | Normal | - | - | - | - | - | - |
| Diesel | Normal | −0.5981 ** | 1.0586 ** | −0.1571 | 1.0544 ** | −1.1797 ** | 1.0611 ** |
| Hybrid | Normal | 0.0617 | 1.0951 ** | 1.6563 ** | 1.094 8 ** | −0.6832 | 1.0876 ** |
| Electric | Normal | −1.2838 ** | 1.0466 ** | −0.095 | 1.0365 ** | −1.6388 ** | 1.044 ** |
| SUV | Normal | 0.0371 | 1.0244 ** | 0.0336 | 1.0074 ** | 0.022 | 1.0461 ** |
| Fuel Cost | Log-normal | −1.2271 ** | 2.4808 ** | −1.1317 ** | 2.1456 ** | −1.2815 ** | 2.6826 ** |
| Purchase Price | Log-normal | −0.7261 ** | 0.8433 ** | −0.5798 ** | 0.5416 ** | −0.7837 ** | 0.9583 ** |
| Accessibility of Fueling Station | Normal | 1.6795 ** | 1.0031 ** | 1.5279 ** | 0.9949 ** | 1.7915 ** | 1.0011 ** |
| Smart technologies | Normal | 0.5263 ** | 1.0404 ** | 0.4817 ** | 1.053 ** | 0.5674 ** | 1.0319 ** |
| Satiation | α | Mean | Variance | Mean | Variance | Mean | Variance |
| Variable | Distribution | ||||||
| Gasoline | Normal | 0.0061 ** | 0.0001 ** | 0.0057 ** | 0.0001 ** | 0.0021 ** | 0.0000 ** |
| Diesel | Normal | 0.0063 ** | 0.0000 ** | 0.0044 ** | 0.0000 ** | 0.0034 ** | 0.0000 ** |
| Hybrid | Normal | 0.0062 ** | 0.0001 ** | 0.0013 ** | 0.0000 ** | 0.0041 ** | 0.0000 ** |
| Electric | Normal | 0.0106 ** | 0.0002 ** | 0.0033 ** | 0.0000 ** | 0.0056 ** | 0.0001 ** |
| Number of Respondents | 639 | 327 | 312 | ||||
Note: ** 5% significant level, * 10% significant level.
Table 5.
Attribute levels in the market simulation.
| Attributes | Gasoline | Diesel | Hybrid | Electric | |
|---|---|---|---|---|---|
| Fuel cost (KRW/Km) | Sedan | 127.4 | 95.6 | 88.8 | 18.2 |
| SUV | 170.8 | 116.2 | 100.3 | 21.1 | |
| Purchase price (1 million KRW) | Sedan | 25 | 30 | 35 | 45 |
| SUV | 28 | 33 | 38 | 48 | |
| Accessibility of fueling stations (%) | 100 | 100 | 100 | 50 | |
| SUV (Vehicle Type) | SUV or Sedan | SUV or Sedan | SUV or Sedan | SUV or Sedan | |
| Smart technologies | Provide or Not provide | Provide or Not provide | Provide or Not provide | Provide or Not provide | |
Table 6.
The change in consumption trend following the introduction of electric vehicles and smart technologies.
Table 6.
The change in consumption trend following the introduction of electric vehicles and smart technologies.
| Scenario 1→Scenario 2 (+Electric without Smart Technologies) | Scenario 2→Scenario 3 (+Electric with Smart Technologies) | |||
|---|---|---|---|---|
| Variation on Average Car Usage (km) | Variation in Choice Probability (%) | Variation on Average Car Usage (km) | Variation in Choice Probability (%) | |
| Gasoline | −737.0 | +1.6% | −4336.8 | −2.7% |
| Diesel | −145.7 | +3.1% | −1829.6 | +2.7% |
| Hybrid | −1143.1 | +3.3% | −5036.4 | −11.7% |
| Electric | +2025.8 | +29.7% | −1201.5 | −0.5% |
| Gasoline with smart technologies | - | - | +4409.7 | +83.6% |
| Diesel with smart technologies | - | - | +2461.1 | +65.9% |
| Hybrid with smart technologies | - | - | +4140.9 | +76.7% |
| Electric with smart technologies | - | - | +1392.7 | +38.7% |
Table 7.
The results of clustering analyses 1 and 2.
| Analysis 1 | Size of Cluster (%) | Sex (Male = 1) (Female = 0) | Age (Years) | Monthly Household Income (10,000 KRW) | No. of Family Members | Preferred Fuel Type |
| Cluster A1 | 44.3 | 0.42 | 39.1 | 420 | 3.59 | Gasoline |
| Cluster A2 | 35.7 | 0.54 | 37.7 | 406 | 3.55 | Hybrid |
| Cluster A3 | 20.0 | 0.46 | 38.4 | 412 | 3.66 | Diesel or electric |
| Analysis 2 | Size of Cluster (%) | Sex (Male = 1) (Female = 0) | Age (Years) | Monthly Household Income (10,000 KRW) | No. of Family Members | Preferred Next Fuel Type of Generation Vehicles |
| Cluster B1 | 36.6 | 0.43 | 39.0 | 410 | 3.56 | Gasoline with smart technologies |
| Cluster B2 | 35.8 | 0.47 | 38.3 | 421 | 3.68 | Diesel or electric with smart technologies |
| Cluster B3 | 27.5 | 0.53 | 37.8 | 408 | 3.52 | Hybrid with smart technologies |
© 2018 by the authors. Licensee MDPI, Basel, Switzerland. This article is an open access article distributed under the terms and conditions of the Creative Commons Attribution (CC BY) license (http://creativecommons.org/licenses/by/4.0/).
Share and Cite
MDPI and ACS Style
Shin, J.; Lim, T.; Kim, M.Y.; Choi, J.Y. Can Next-Generation Vehicles Sustainably Survive in the Automobile Market? Evidence from Ex-Ante Market Simulation and Segmentation. Sustainability 2018, 10, 607. https://doi.org/10.3390/su10030607
AMA Style
Shin J, Lim T, Kim MY, Choi JY. Can Next-Generation Vehicles Sustainably Survive in the Automobile Market? Evidence from Ex-Ante Market Simulation and Segmentation. Sustainability. 2018; 10(3):607. https://doi.org/10.3390/su10030607
Chicago/Turabian StyleShin, Jungwoo, Taehoon Lim, Moo Yeon Kim, and Jae Young Choi. 2018. "Can Next-Generation Vehicles Sustainably Survive in the Automobile Market? Evidence from Ex-Ante Market Simulation and Segmentation" Sustainability 10, no. 3: 607. https://doi.org/10.3390/su10030607
Note that from the first issue of 2016, this journal uses article numbers instead of page numbers. See further details here.