How Will Policies of China’s CO2 ETS Affect its Carbon Price: Evidence from Chinese Pilot Regions


1
College of Management and Economics, Tianjin University, Tianjin 300072, China
2
Chemical Engineering Department, Texas A&M University, College Station, TX 77843, USA
*
Authors to whom correspondence should be addressed.
Sustainability 2018, 10(3), 605; https://doi.org/10.3390/su10030605
Submission received: 25 January 2018
/
Revised: 15 February 2018
/
Accepted: 22 February 2018
/
Published: 27 February 2018
(This article belongs to the Section Economic and Business Aspects of Sustainability)
Abstract
:CO2 Emissions Trading Scheme is a key policy instrument for dealing with increasing greenhouse gas emissions. This work aims at giving some policy recommendations on the design of China’s National Emissions Trading Scheme. The experience accumulated in China’s Carbon Emissions Trading Pilots is quite valuable for China’s National Emissions Trading Scheme, so it is important to analyze the determinants of the prices in these pilots. We use the difference-in-differences model to study various policies respectively, including auction, investment access of individual and institutional traders, and carbon forward. Principal components of economy, energy, climate and allowance characteristic are respectively extracted from alternative variables, such as CPI, energy price, extreme temperature, in four categories. These principal components are set as control variables. Results show that these policies play a big role in the price discovery and stabilization. Auction drives the market price to approach the auction completion price. Carbon price exhibits a positive sensitivity to non-regulated entities’ participation and carbon forward. All the significant variables together can reflect most of the pilots’ price information. Policies have heterogeneous impacts on carbon price. The finding is robust to alternative specifications.
1. Introduction
Nowadays, China has become one of the world’s largest fossil energy consumers and greenhouse gases emitters. With growing resources demands and environment constraints globally, China has reached an agreement with other countries on greenhouse gases abatement. The objective of this agreement is to secure world long-run energy supply and protect global environment by promoting the adoption of energy-efficient technologies and the development of renewable energy. To restrict the growing trend of carbon dioxide (CO2) emissions in China, the policymakers choose to learn from the European Union to use a market instrument, CO2 Emissions Trading Scheme (ETS). By creating an effective market for CO2 through some regulations, policymakers give firms an incentive to move towards less fossil-fuel intensive production. The effective operation of ETS is tightly interrelated with the transformation of economic development mode and with the industrial competitiveness.
Implementing an ETS in a rapidly growing economy environment faces many challenges, especially when this country is vast and has regional differences [1,2]. So it is urgent to establish an evaluation index system to measure the feasibility of establishing a united ETS in China [3]. Chinese policymakers of National Development and Reform Commission (NDRC) successively launched seven pilot CO2 ETSs, including Beijing, Tianjin, Shanghai, Hubei, Chongqing, Guangdong and Shenzhen in 2013 and 2014. Now, after more than four years of these precursors’ operation, Chinese government has accumulated a lot of experiences. Does the operation of the pilots give some enlightenment to relevant policymakers? How do we find and use these experiences? These are important issues that researchers are willing to solve. Policy coordination and inter-regional linkages of ETSs have attracted scholars’ attention after China launched its pilot projects [4,5,6]. Up till now, no one has used an accurate quantitative method to study policy effects on carbon price of Chinese pilot areas as a whole. So, probing the general rule of the carbon price in China is imperative. Seeing the big picture will avoid being so blind by the special characters of different pilot areas.
The main issue of a carbon emission trading market is the formation of the carbon price and the maintenance of an equilibrium price trend. If the carbon price is too high, covered entities will not have the production impetus. If the carbon price is too low, the emission reduction will not reach the expected objective. So, knowing the determinants of the carbon price and knowing how to use these determinant elements rationally is essential to the ETS. Analysis of the carbon price in China’s Carbon Emissions Trading Pilots (C-CETPs) helps policymakers draw conclusions on how reliable and robust a policy is. With this information at hand, they can then increase the efficiency of making policies for China’s National Emissions Trading Scheme (CN ETS).
From the fact shown in Figure A1, we can draw a conclusion that carbon pilots in China have some defects needing to be improved at present. At the beginning of carbon allowance trading in C-CETPs, carbon prices in Guangdong, Shanghai, Shenzhen and Tianjin present an obvious downward trend, which means that the initial carbon prices were set too high. This condition highlights that when the cap is not set to an appropriate number and the carbon allowance is not distributed through a scientific method, it is impossible for the carbon price to maintain in a reasonable range. Significant fluctuation of some pilots’ carbon price in the past few years warns us that effective institutional policies need to be made. Thus, understanding price formation mechanism and how to use policies to regulate the operation of China’s carbon market appears of critical importance. In this context, the problem we faced with is as follows: which factors contribute to shape the price formation of CN ETS and how to use appropriate policies to regulate it?
This work aims at giving some policy recommendations on the design of CN ETS. Therefore, it is important to conduct a comprehensive and in-depth analysis of the impact factors of the price in C-CETPs. We assume that carbon prices can reflect enough information of carbon markets, including policy effect. China has set seven pilot regions to test various policy options for the united CN ETS which will be established after 2017. For convenience, we name the region which has implemented certain policy as Policy Implementing Region (PIR). So, in this paper, we will conduct a comprehensive and in-depth analysis on the impact factors of carbon price in C-CETPs.
To reasonably and objectively assess the effect of regulation policies, it is preferable to use an econometric model rather than use a qualitative method, because the classical rules do not necessarily apply to special cases. The difference-in-differences (DID) model is a common way to assess a policy’s effect. Zhang et al. [7] used DID model measuring Porter Hypothesis of carbon trading. Tanaka S. [8] used DID model exploring the impact of environmental regulations in China on infant mortality. Based on PIR’s natural experiment, we choose to use the DID approach to study various policies of C-CETPs respectively. The policy options that we will explore involve many different aspects. First, we need to know that how to allocate quotas would be more effective. Will auction, one of the allocation methods, increase the market efficiency? Second, we need to choose appropriate market participants. Should institutional investors and individual investors be allowed to trade in the ETS? Third, we need to discuss the problem of carbon emissions forward transactions across the country. Did forward transaction guide carbon price correctly? At the same time, we cannot neglect other carbon price influencing factors, including the level of economic and industrial development, the price of energy, the conditions of climate and the characteristics of C-CETPs. We set them as the control variables to prevent the occurrence of heterogeneity between samples in the DID model. This paper uses seven pilot region’s panel data as examples to do an econometric research on policy design of the ETS, which aims to inform government policymakers about the potential effect of certain regulation and formulate relevant policies in CN ETS. Finally, in order to further demonstrate the necessity of certain policies, we will compare the operating conditions of each pilot through their changes in the carbon price and liquidity.
The paper is organized as follows. Section 2 presents a literature review of C-CETPs’ policy designs and carbon price determinants. Section 3 illustrates the variable structure and data. Section 4 introduces the basic model and checks the validity of the identification assumptions. Section 5 analyzes the empirical results. Section 6 gives conclusions and policy implications.
2. Literature Review
2.1. Relevant Studies on Policy Designs in C-CETPs
Since foreign carbon cap-and-trade markets have appeared sharp fluctuations in the price, Chinese policymakers think highly of the design of ETS policies including policies about carbon allowance’s allocation, policies about price discovery and stability mechanism, and policies about management and operation. The policy design of C-CETPs has become the focus of many researchers. Zhang et al. [9] conducted an overall assessment of the seven C-CETPs and identified issues that have emerged in the design process. While several other researchers such as Jiang et al. [10], Wu et al. [11] and Qi et al. [12], just chose one of the seven precursors as the study object and examined some specific aspects of it including their institutional structures and design features. Shen et al. [13] conducted a comprehensive analysis in which they compared China’s CTPs with the California Cap-and-Trade Program in multiple aspects. From all the above papers, we have a detailed understanding of the implementation of C-CETPs’ policies.
The design of carbon allowance’s allocation mechanism is a critical part of the above studies. As one of the core components in a CO2 ETS, allowance’s allocation mechanism affects the fairness among every covered entity. Xiong et al. [14] assessed the allowance allocation mechanism in C-CETPs. Although some innovations had been introduced, he argued that the allocation methods of the C-CETPs still faced serious problems such as allowance oversupply, heavy reliance on historical data, as well as insufficient clarity and transparency. Some scholars have widely believed that auction is better than the traditional methods (Pezzey and Park [15]; Cramton and Kerr [16]; Böhringer and Lange [17]), because auction can avoid the low-efficiency allocation brought by grandfathering [18,19]. Moreover, auction has the function of promoting price discovery, which guarantees the fairness, justice and transparency of the carbon price. So, in this paper, we will discuss the function of auctions in C-CETPs.
The price discovery and stability mechanism also plays a big role in the effective operation of ETS. The premise of promoting price discovery is to ensure the trading activeness. Now some C-CETPs’ liquidity is low. With a very low liquidity trading scheme, the pilot regional carbon markets in China are still far from being well-functioning [20,21]. Policymakers of Shenzhen, Hubei, Guangdong and Beijing successively realized the importance of non-covered entities to participate in the carbon market. They introduced different kinds of players, such as institutional investors and individual investors. Incorporating individuals into the ETS would contribute to the development of low-carbon lifestyles in China [22,23,24,25]. By enhancing the public awareness of carbon trading can motivate market transaction, thereby promoting the price discovery and stability. On the other hand, the lack of derivatives will also hinder the stability of the carbon price. In contrast, the European Union emissions trading scheme (EU ETS) and California ETS have built up the largest two carbon markets by substantial margins in both volume and value. It can be seen that both of them have formed multi-level market structures constituted of spot, forward, future and option markets, in which derivative trading actually occupies a dominant position [26,27,28]. Forward transactions contribute to price discovery at the beginning of EU ETS, which is also beneficial to the price stability and market’s liquidity. However, in China, only Hubei and Guangdong pilots introduced the carbon forward transaction before 31 October 2016. We are interested in the effect of the carbon forward transaction, so we will also explore this policy effect in this paper.
Management and operation of C-CETPs are also important to the stability of carbon price. For example, the time and the rule of the annual verification work in each pilot region lead to a cyclical feature of the trading activity. We can find that covered companies in some pilots tend to purchase quota near the time of verification. In this paper, we will give a conclusion about which pilots’ carbon price are obviously influenced by the verification work so that we can give recommendations on improving markets’ effectiveness.
2.2. The Determinants of the Carbon Price
Since the EU ETS has already been set up for more than a decade, many papers investigated the carbon price determinants in the EU ETS. According to Springer [29] and Christiansen et al. [30], main drivers of carbon prices are policy and regulatory issues, energy prices, weather events and economic activity. Energy prices are the most important drivers of carbon prices due to the ability of power generators to switch between their fuel inputs (Christiansen et al. [30]; Kanen [31]; Bunn and Fezzi [32]; Convery and Redmond [33]). By influencing energy demand, weather conditions may also have an impact on the carbon spot price. To our best knowledge, Mansanet-Bataller et al. [34] and Alberola et al. [35] showed empirical evidence of the weather variable’s impact on CO2 price changes. Alberola found that European Union allowance spot prices react to unanticipated temperatures changes during colder events. Besides, the typical institutional and market events were found to lead to structural price changes. Creti et al. [36] used co-integration approach to investigate the determinants of the carbon price during the two phases of the EU ETS. Aatola et al. [37] used several econometric models and discovered that there is a strong relationship between the electricity prices and gas–coal difference during its first five years (2005–2010) of operation, which are the determinants of EUA forward price.
In addition, there may exist other factors that could affect carbon prices by influencing carbon emissions. Doytch and Uctum [38] reported a list of differentiated foreign direct investment (FDI) effects on CO2 emissions. The results in aggregate, manufacturing and non-financial sectors suggest that flows into these industries increase carbon emissions in the host country, which may influence the carbon price.
2.3. Literature Gap
The above literature in the Section 2.1 specifically introduced the basic characteristics and regulation policies of the seven pioneers. The literature given in the Section 2.2 studied the influential factors of the carbon price. However, to our best knowledge, there still exist some imperfections. Although many researchers are discussing the regulation policies in C-CETPs, none of them have used real data to accurately quantify the effect of specific policy in all the China’s pilot regions. Unlike previous studies, this paper will examine all the seven precursors as a whole. The results of a comprehensive analysis will be more universal.
On the one hand, Chinese carbon market is regulated by the government [39], so we cannot neglect the impact of policy on the carbon price. Lots of non-market features of China’s economy present particular challenges to the implementation of a national ETS, because ETS is a fundamentally market-based instrument [27]. As will be shown throughout this paper, tight regulation of various aspects—combined with the presence of multiple overlapping carbon market’s policies (We define overlapping policies as other relevant provisions of the carbon market.)—all compound the complexity of exploring a CN ETS in China.
On the other hand, the seven pilots in China have distinct characteristics, which cannot be seen as a united market like EU ETS. So, we need to use control variables to make the results more credible. The study method needs to be adjusted if it is used for CN ETS. Hence, we choose to use the DID model and panel regression model to quantitatively analyze the policy effects on carbon price in all the seven pilots.
3. Variables and Data
We consider daily data for the sample period, which starts in the second trade-appearing month of every pilot market and ends on 30 June 2017 (the last day when we collect data). The seven pilot regions did not start at the same date. All the first months’ data are excluded, because deals may have been manipulated by the government at the beginning. Abnormal samples (These samples are clearly beyond reasonable range and may be caused by recording errors.) are deleted, which take up about 0.6%. The final panel consists of unbalanced observations on carbon spot price for seven pilot regions over thousands of days. Data of national statutory holidays and the days which do not have any transactions are also excluded.
3.1. The Carbon Price
The dependent variable is the carbon emissions spot price (Pit in RMB/tCO2), which is calculated as follows:
Turnoverit represents the total amount of money that is received in carbon emissions transaction by the carbon emission exchange i on day t. Volumeit represents the total amount of CO2 allowance that is traded at the carbon emission exchange i on day t.
We get the transaction volume data and the turnover data from a professional carbon market information platform. The website address is http://k.tanjiaoyi.com/. It is approved by the Industrial information department of the China and the State Administration for Industry and Commerce. Its information is collected from all the seven pilot carbon emissions exchanges.
3.2. Control Variables
Based on the previous literature review, we know that many kinds of variables will influence carbon price, including economic level variable, energy variable, climate condition variable, policy variable and C-CETP’s characteristic variable. This paper emphasizes on the policies’ effects, so we set other kinds of influential factors as control variables. We do not clearly know which specific indexes are significantly associated with China’s carbon market price, so we need to screen suitable control variables for the first step. Alternative variables are as follows. First, we check whether each alternative variable has an impact on the carbon price. Then, to prevent the multicollinearity, we respectively extract four principal components from the variables that have significant influence in four different categories.
- (1)
- Economic variables: CPI (last month equals 100), Industrial added value (IAV in 100 million RMB), Industrial added value month-on-month growth rate (IAV_YOY in %). These original data are of monthly frequency. We have processed these data for our regression model. Data of CPI and IAV_YOY are collected from National Bureau of Statistics. Data of IAV is collected from local bureau of statistics websites (Beijing Statistical Information Net: http://www.bjstats.gov.cn. Tianjin Statistical Information Net: http://www.stats-tj.gov.cn. Shanghai Statistical: http://www.stats-sh.gov.cn. Hubei Statistical Bureau Net: http://www.stats-hb.gov.cn. Chongqing Data Net: http://www.cqdata.gov.cn/. Guangdong Statistical Information Net: http://www.gdstats.gov.cn).
- (2)
- Energy variables: Coal price index (COAL_PRICE, index on 1 January 2006 equals 100) reflects the level of coal price; Electricity-coal price (ELE_COAL_PRICE in RMB/ton) represents the price of coal which is used to generate electricity; Industrial natural gas market price (NG_PRICE in RMB/cubic meter) is the market selling price of natural gas which is used for industrial production. Variables about electricity are also included because the power sector was endowed with almost 50% of carbon allowance, which means it is undoubtedly the important subject of carbon trading market. Most electric power in China is generated by firing coal. Coal benchmark on-grid prices (ELEC_PRICE in RMB/MWh) are respectively made by NDRC and the provincial Price Bureau according to limits on the authority of price control. Each province in China executes a unified price for all the newly constructed coal-fired units. The NDRC adjusts the Coal benchmark on-grid price periodically, which affects the profits of coal-fired power plants. These original data are of daily frequency. Power plants in the European Union pay close attention to the profits from producing electricity depending on whether the input is coal (profits are referred to as dark spread) or gas (profits are referred to as spark spread) and to the difference between them, because carbon price is sensitive to them. This logic is described by Kanen [31]. However, things are different in China. Most of China’s power plants are coal-fired power plants now. The natural gas-fired power plant’s proportion is so small that they cannot influence the electric power market. We only consider one similar processed variable in China: Chinese Dark Spread (CHINESE_DS in RMB/MWh). The Chinese Dark Spread represents the theoretical profit that coal-fired power plants in China make from selling a unit of electricity. Their costs come from purchasing fuel which is required to produce that unit of electricity. The calculation method of dark spread in China is different from Europe. We use Coal benchmark on-grid price (In Europe, they use peak electricity price. In China, only on-grid price influences the interests of the power plant.) minus the Coal price for generating a thousand kilowatt hour electricity (According to Chinese present coal-fired power generation efficiency, generating one thousand kilowatt hour electricity consumes about 360 kg standard coal). All the data in this section are provided by Wind database (a professional database in China).
- (3)
- Climate condition variables: According to previous literature, our investigation focuses on the most important dimension of weather: extremely hot and cold degree-days. If the intraday highest temperature is higher than 30-degree centigrade, we call it extremely high temperature (T_H). The corresponding variable, T_H, takes 1; otherwise, T_H takes 0. If the intraday lowest temperature is lower than 0-degree centigrade, we call it extremely low temperature (T_L). The corresponding variable, T_L, takes 1; otherwise, T_L takes 0. Temperature data in Guangdong Province and Hubei Province are calculated by the key city samples’ average temperature weighted by population. We only examine the temperature factor, because China’s hydropower, wind power and solar power’s proportion are very small. We do not consider precipitation and wind scale. Temperature records are collected from a Weather Net (The website is http://www.tianqi.com).
- (4)
- C-CETP’s characteristic variables: Free carbon allowance amount (ALLOWANCE in a million ton), Covered enterprise number (E_NO). Each pilot region has distinct characteristic about regulated enterprise and is computed free quota depending on its covered enterprise and industry. Theoretically speaking, these characteristics can affect their carbon price. These data are shown in Table 1. Data sources include some papers, research reports and all the seven carbon exchange websites [40,41].
3.3. Policy Variables
Policy variables are the core part of this paper. In the model specification, we represent the operation of certain policy in pilot regions with a variable. There are three policy variables to be tested in the following:
- (1)
- Auction (AUCTION): It is a virtual variable, where the values of Shanghai, Shenzhen, Guangdong and Hubei are 1. But we assign no value to the other pilot regions. At the same time, the variable of auction price (AUCTION_PRICE) is introduced. It is used to test whether carbon price is driven by auction price.
- (2)
- Investment access of individual and institutional traders in the carbon market (INV_ACC_IIT): It is a virtual variable. The degree of market participation is not the same in C-CETPs, for there exists thresholds for institutional investors and individuals to participate in carbon trading, such as enterprise net assets limit and personal financial assets limit. Account opening fee and transaction fee also have a huge distinction among different pilot regions. It is extremely difficult to judge actual transaction situation only by policy documents, so we did a market participation survey to collect data from the exchanges. If individual investors and institutional investors in certain pilots trade actively, we assign INV_ACC_IIT values to 1; otherwise, this variable takes 0.
- (3)
- Introduction of carbon forward (FORWARD): It is a virtual variable, where the value of Hubei is 1 and the values of the other pilot regions are 0. The reason is that only Hubei Exchange makes standardized contracts similar as futures, which has the function of hedging and price discovery. Carbon forward of Guangdong can only lock price in the future. They have essential differences in the trading rules. A mature carbon market should have transactions of derivatives in addition to spot trading. So, we assume that the carbon price trend will change because of the introduction of carbon forward transaction.
3.4. Variables Used for Policy Effects’ Test
- (1)
- Verification period (VER_PERIOD): It is a virtual variable, where the values of all the seven pilots during mandatory verification periods are 1. All the carbon pilots have a verification period every year at about June to July. Values of the other days are 0.
- (2)
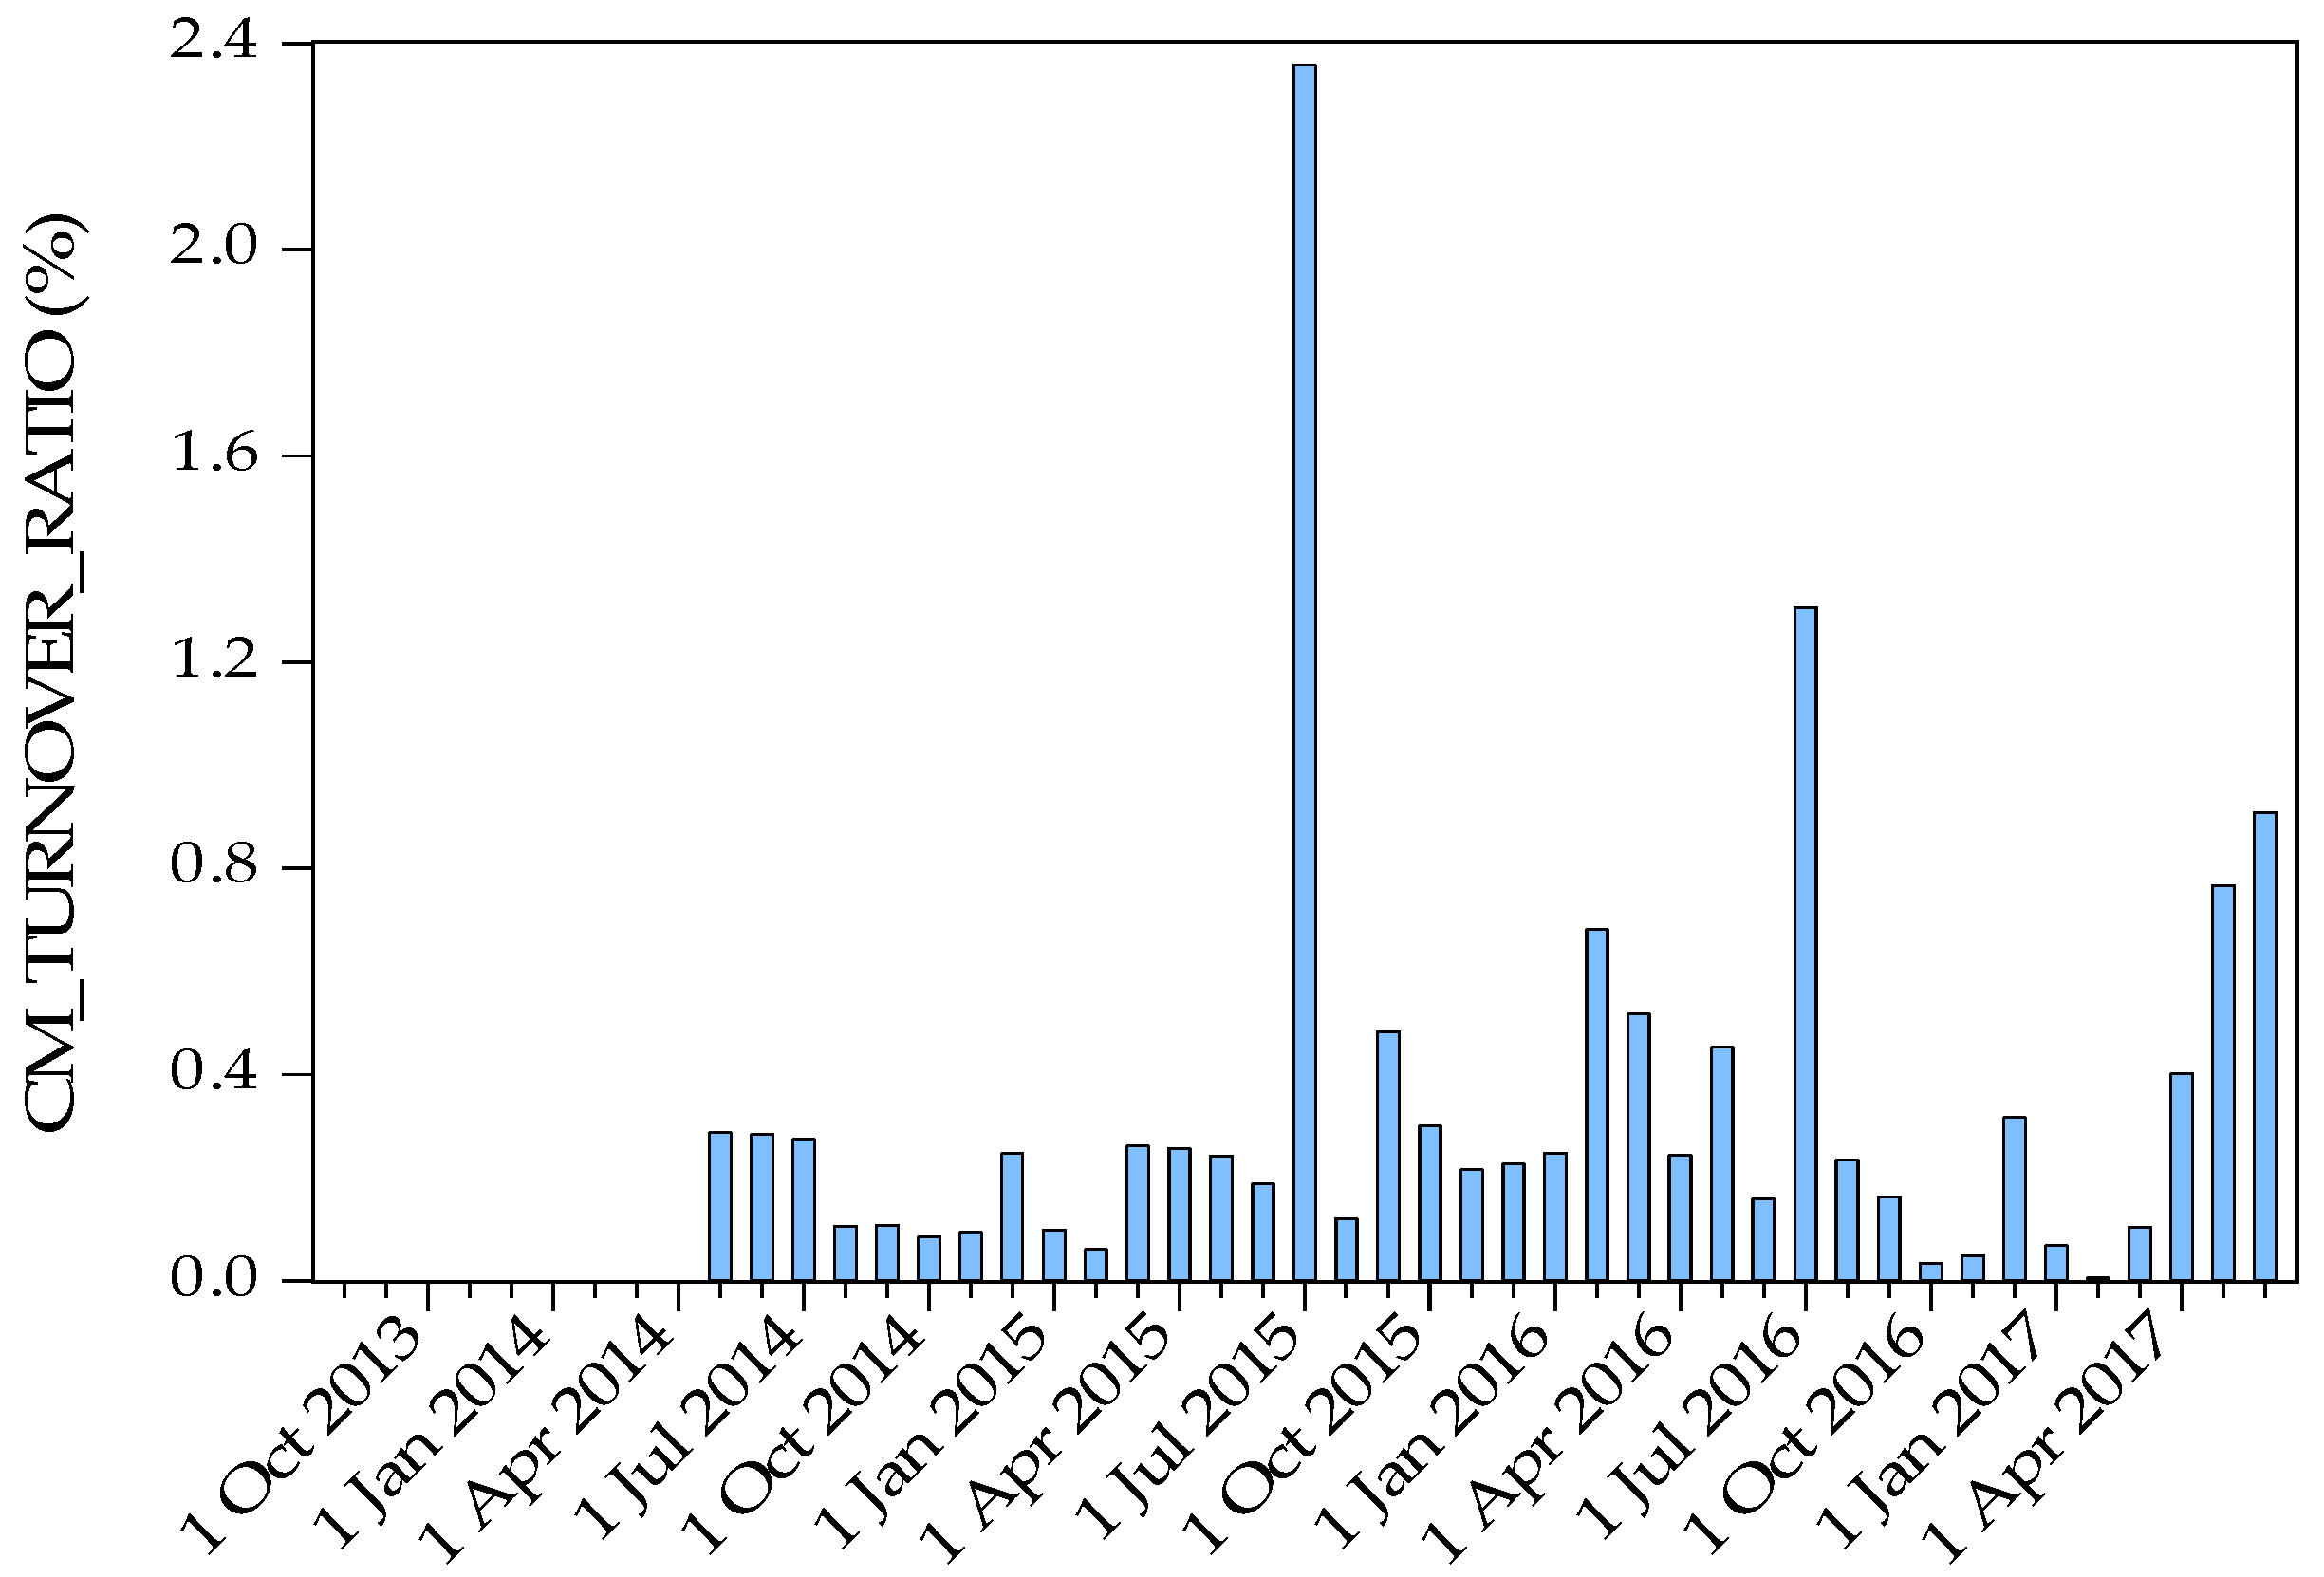
- Carbon market turnover ratio (CM_TURNOVER_RATIO): This variable is used to measure the pilot regions’ market activity level, which is calculated as follows:Volumeit represents the total amount of CO2 allowance that is traded at the pilot i on month t. Allowanceit represents the total free carbon allowance amount at the pilot i for certain compliance year T.
3.5. Summary Statistics
Table 2 presents the descriptive statistics of the baseline samples except for virtual variables.
4. Empirical Framework
4.1. Basic Specification
The DID model is a common way to assess a policy’s effect. We use DID model to respectively study three kinds of policies, including regulation on auction, regulation on investment access of individual and institutional traders, and regulation on CO2 forward trading (The forward discussed here is not in the traditional sense but is similar to futures). To use this approach, we divide the observation object into a treatment group and control group. The treatment group has experienced certain policy at some point; no corresponding policy has been implemented in the control group. The models are set as follows:
The model which tests the correlation between auction and carbon price is set as follows:
In this part, we also test whether AUCTION_PRICE can significantly influence the Pit using the panel regression method. We assume the carbon price was driven by the ultimate auction price. The model is set as follows:
We summarize the auction history in seven pilots in Table 3. The variable values are assigned according to the following table.
The model that tests the correlation between investment access of individual and institutional traders and carbon price is set as follows:
The model that tests the correlation between carbon forward transaction and carbon price is set as follows:
In these models, the DID effect of certain policy can be measured by multiplying policy variable and time variable. The impact of certain regulation on the PIR’s carbon price is respectively represented by π1\π2\π3, which are the most important parameters in the above models. TIMEt is an indicator variable that takes on the value one from the day that the new policy was implemented. Xit (x1it, x2it, x3it, x4it) (i = 1, 2, 3, 4, 5, 6, 7) control for an additional set of principal components that capture economy, energy, climate and other C-CETP’s characteristics at the region by daily level. The region fixed effect, ηi, controls for the permanent heterogeneity across regions. Whereas the time fixed effect, µt, controls for daily-specific shocks that are common to all pilots. εit is the stochastic error term.
4.2. Validity of the Identification Assumptions
The key identification assumption for Equations (3), (5) and (6) to provide a causal inference is that the non-PIRs provide valid counterfactual changes in carbon price for the PIRs, had they not been treated. So, we need test if there is a systematic difference in pre-existing trends in the carbon price. The implemented timings of policies are different in different pilots, so we use several black dashed lines to identify, for the aim to conveniently judge the trend of price changes.
(1) Auction
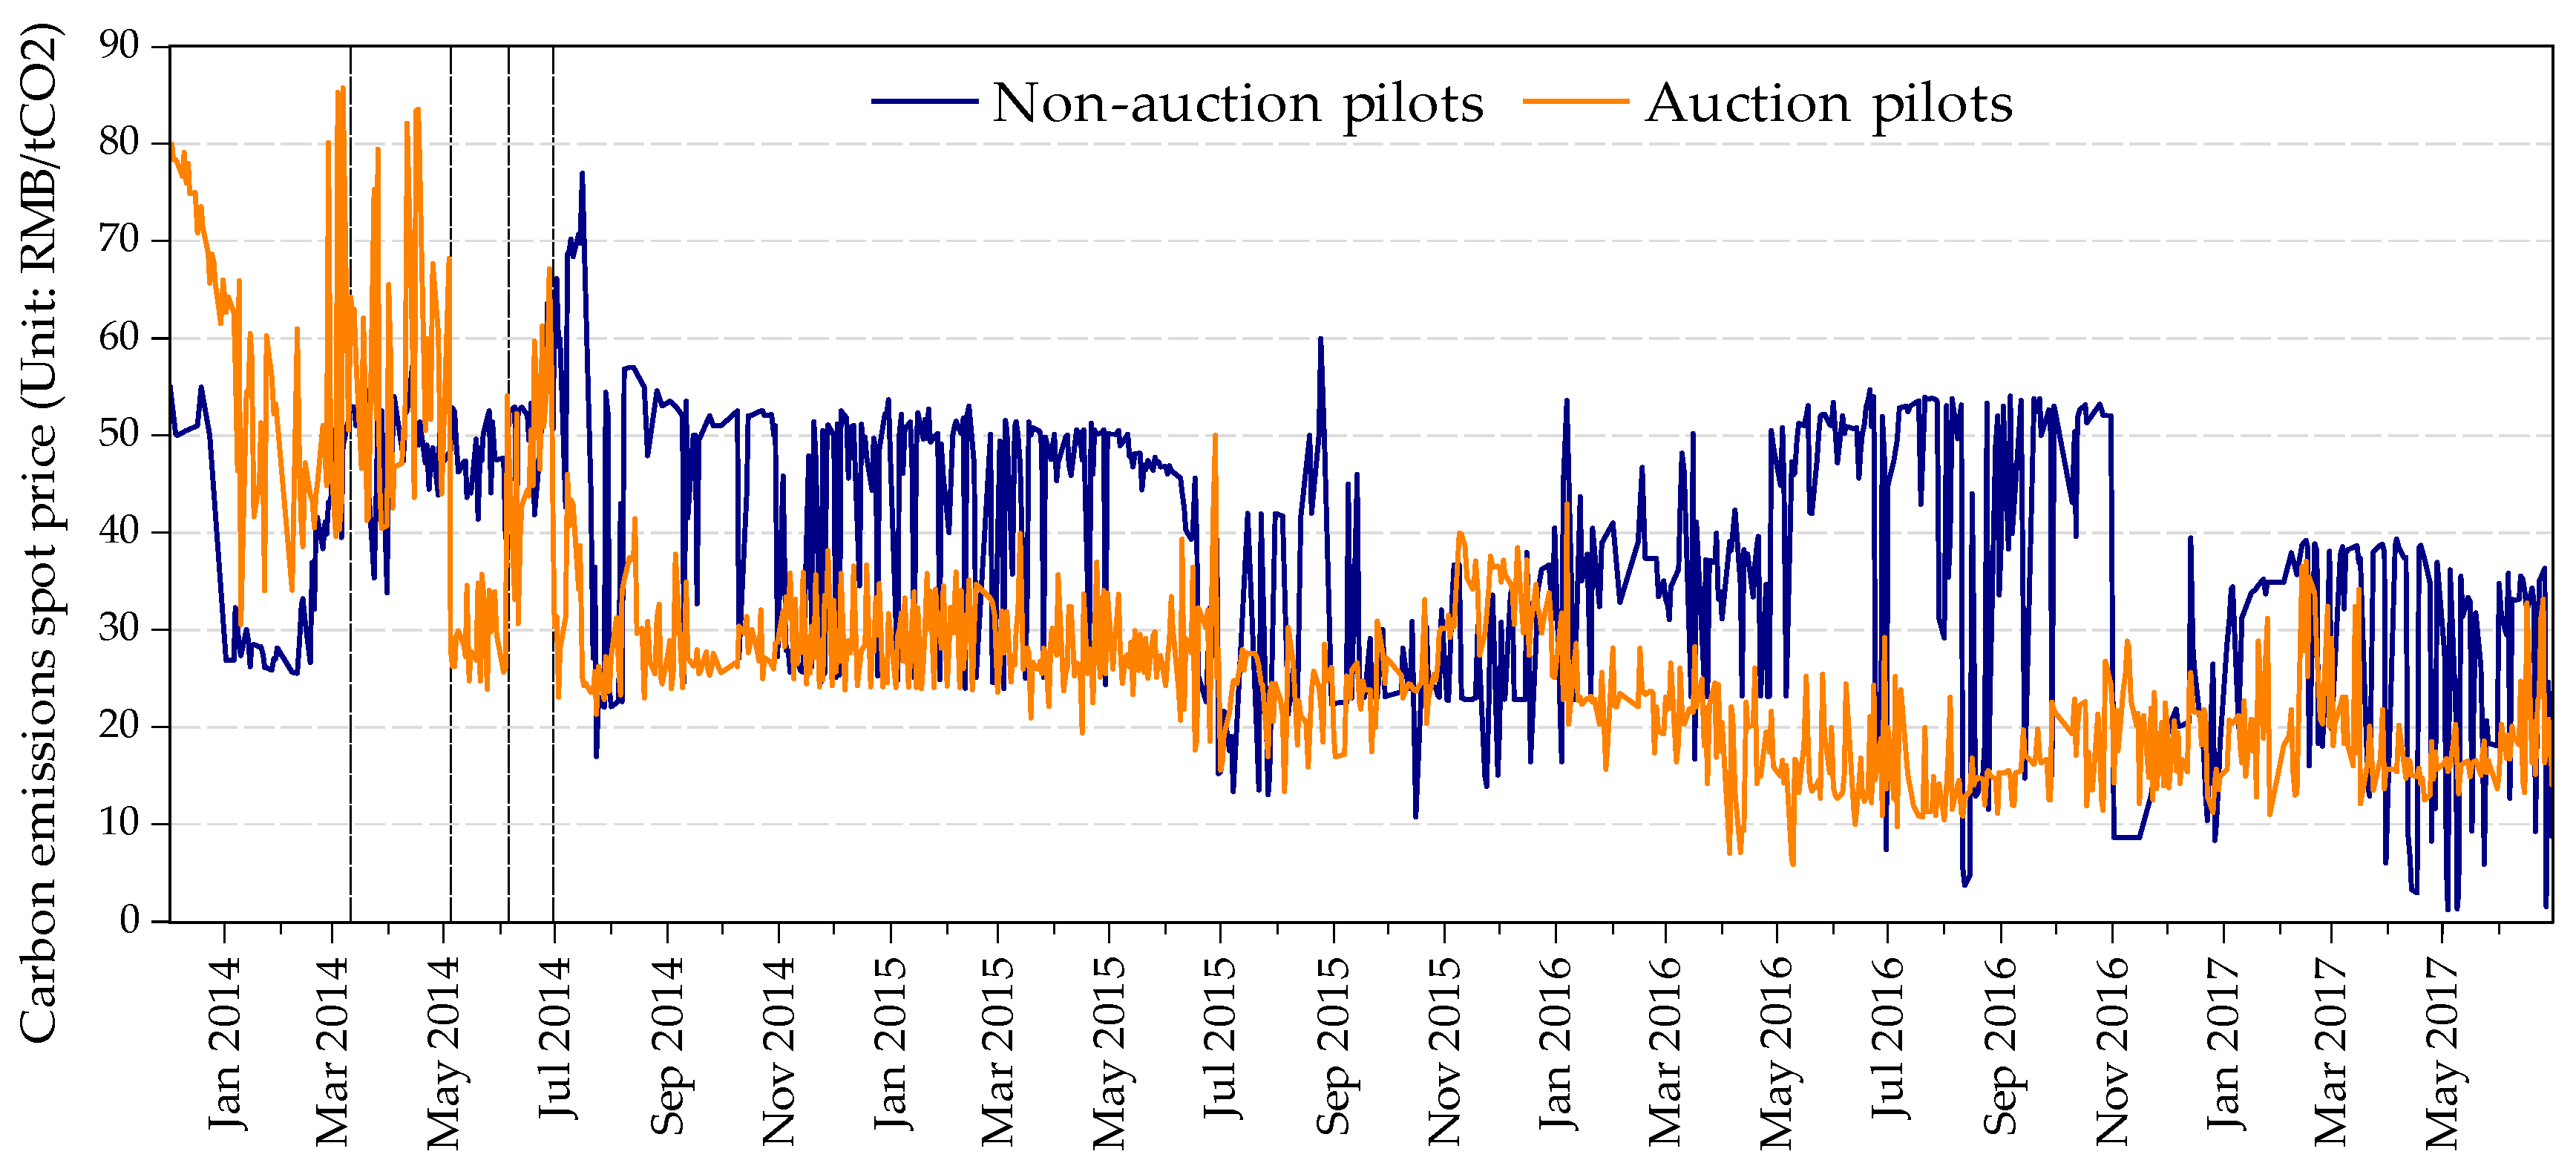
To examine the pre-existing trend, we plot the evolution of carbon price over time between the Auction and the Non-auction pilots in Figure 1. The daily average carbon price is calculated using the volume as the weight. The dashed vertical lines respectively indicate the timing of AUCTION policy’s implementation in Guangdong, Hubei, Shenzhen and Shanghai. The figure provides graphical support that average carbon price in Non-auction pilots was lower than Auction pilots in the pre-intervention period; average carbon price in Non-auction pilots rose between 11 March 2014 and 30 June 2014, while average carbon price in Auction pilots fell during the period. After 30 June 2014, we can see an obvious difference between Non-auction pilots’ average price and Auction pilots’ average price. Notably, the average carbon price was mainly higher in the Non-auction pilots than those in the Auction pilots, which is commensurate with the timing of the AUCTION policy. So, the different carbon price trends are caused by internal factors between the Auction pilots and Non-auction pilots.
(2) Investment access of individual and institutional traders
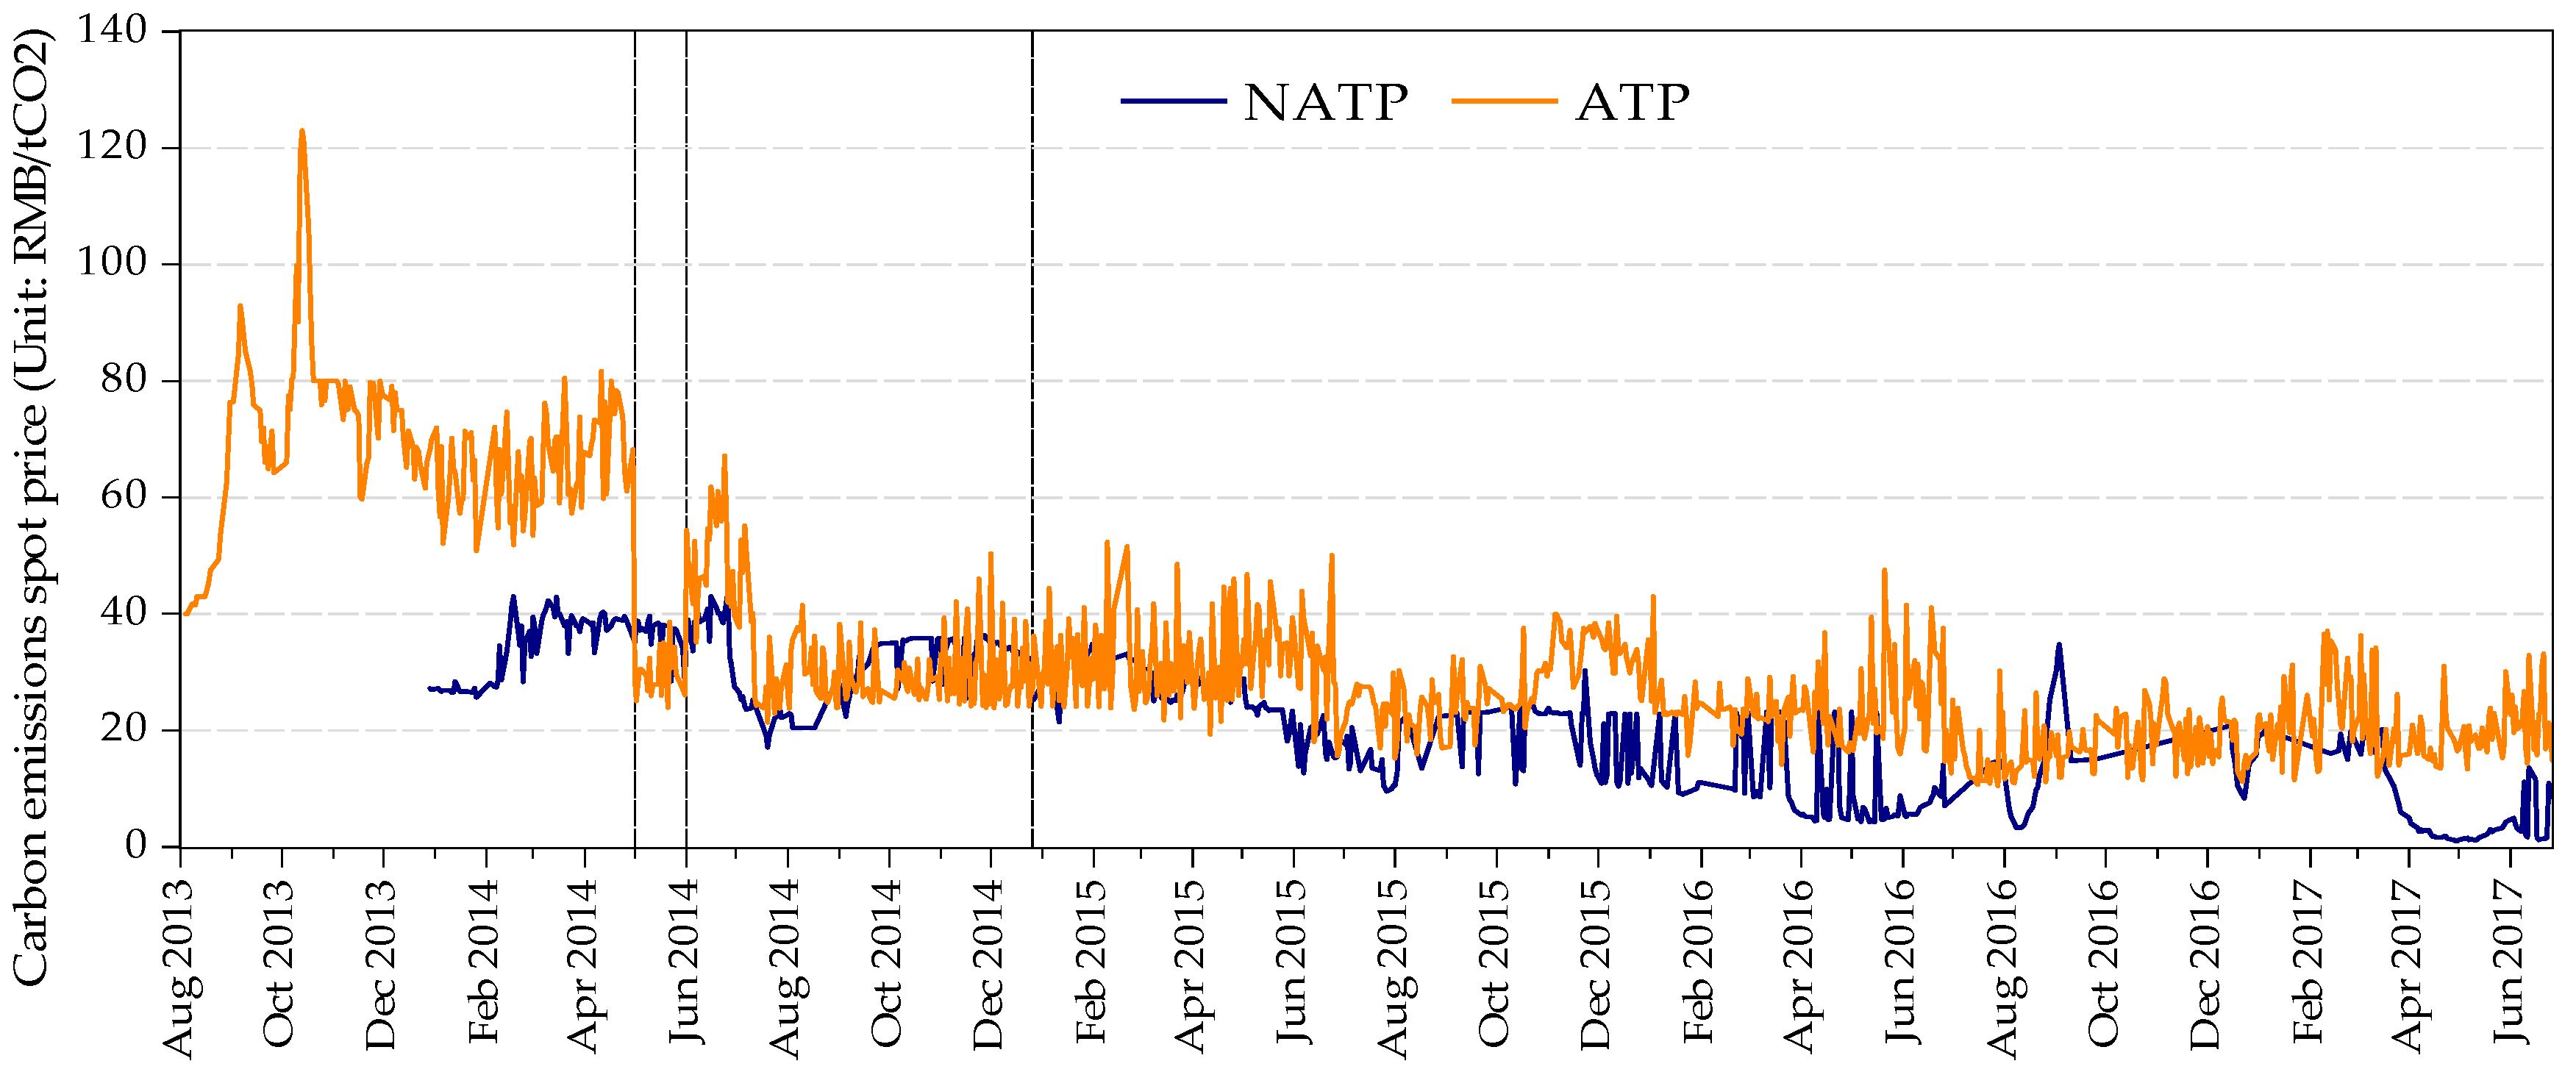
We use the same method to examine the trend of average carbon price between the pilots in which individual investors and institutional investors trade actively (ATP) and the pilots in which these investors do not trade actively (NATP). The daily average carbon price is calculated using the volume as the weight. The dashed vertical lines respectively indicate the timing of INV_ACC_IIT policy’s implementation in Hubei, Guangdong and Beijing. Figure 2 provides graphical support that average carbon price of ATP was obviously higher than NATP in the pre-intervention period; average carbon price of ATP rapidly declined between 5 May 2014 and 30 December 2014, while average carbon price of NATP remained almost unchanged during the period. After 30 December 2014, we can see the average price fluctuation range of NATP is higher than ATP. However, things are different before the policy’s implementation. So, the different carbon price trends are caused by internal factors between the pilots which have different restrictions on participants.
(3) Carbon forward
Figure 3 plots the trend of carbon price between the pilots which opened forward transaction (Forward pilots) and pilots which did not open effective forward transaction (Non-forward pilots). The daily average carbon price is calculated using the volume as the weight. The dashed vertical lines respectively indicate the timing of FORWARD policy’s implementation in Hubei and Shanghai. The figure shows that the average carbon price of Non-forward pilots continues to decline after intervention, while the carbon price of Forward pilots is rising. Notably, we can see the carbon price of Hubei fell from the price range of 20–30 to 10–20. After Shanghai started forward transaction, carbon price rose all the way, suggesting that the previous price was too low. So, the different carbon price trends are caused by internal factors between the Forward pilots and Non-forward pilots.
From the above three parts’ analysis, the carbon prices trends of different pilots changed after the implementation of the three policies, so the hypothesis is correct.
5. Empirical Results and Discussion
We first present the impact of alternative control variables on carbon price and the impact of selected principal components on carbon price. Then we highlight the main impact of ETS policies on carbon price in the subsequent section. In the Section 5.3, we present heterogeneous impact on carbon price depending on energy consumption structure or marketization degree. Finally, we present several robustness checks that support our main findings.
5.1. Main Results about Alternative Variables and Principal Components
In order to choose suitable control variables, we do an econometric specification between economic variables, energy variables, climate condition variables, C-CETP’s characteristic variables and carbon prices. Main results about alternative variables on carbon price are shown in Table 4.
The estimation results show that variables CPI, IAV, IAV_YOY, COAL_PRICE, ELE_COAL_PRICE, NG_PRICE, ELEC_PRICE, CHINESE_DS, T_L, ALLOWANCE and E_NO exhibit a strong impact on China’s carbon price. On the contrary, we find no clear evidence that T_H has any impact on China’s carbon price.
In terms of economy, we find that CPI has a positive impact on carbon price. CPI is usually used as an important index to observe the level of inflation. Carbon allowance is also a kind of commodity, so the price of carbon allowance will rise as the CPI rises. Industrial added value and its year-on-year growth rate have a significant effect on the carbon price, too. This is due to the fact that industrial activities, especially in the heavy industry, produce large amounts of CO2. Each pilot region has included a large number of industrial enterprises and their carbon quotas are limited. Lots of CO2 will be produced when industrial activity is frequent, which will lead to the shortage of carbon allowance. Finally, the carbon price will increase. However, why the coefficient of IAV is negative? Ways to allocate allowance have indirectly affected the carbon price by influencing the total free quota. Seven pilots’ allocation methods’ benchmarks are different. Chongqing is based on highest emissions in any of the years from 2008 to 2012 to ensure the enthusiasm of enterprise participation. At the pilot stage of China’s ETS, the criterion of free quota amount was set relatively loose by officials, which aims at letting as much as possible enterprises participate in carbon trading. So, the carbon quotas at the pilot phase are abundant. Some covered entities try to emit less CO2 for the same industrial output by improving their production technology. Higher IAV does not necessarily mean greater emissions, nor does it necessarily mean tighter quotas. On the other hand, there is a possibility that higher industrial added value is from the uncovered low-emission companies. These two facts may explain the negative correlation between IAV and carbon price.
When it comes to energy, we cannot neglect the fact that all of the five original variables reflecting production cost are significantly correlated with carbon price. These variables’ coefficients are all positive. In Europe, the coefficient of COAL_PRICE is negative, for it becomes profitable for an electric power producer to switch from coal to natural gas when the carbon price is too high. However, due to the limitation of power plant equipment, natural gas is not a substitute for coal in China. Domestic coal prices, especially in thermal coal prices, still largely determined by domestic supply and demand. The more industrial activities use coal, the more CO2 will be released, which leads to the rise in carbon price. At the same time, COAL_PRICE (ELE_ COAL_PRICE) will also rise. Natural gas can reflect some of the carbon price’s information by acting as raw material or fuel of industrial production. Burning natural gas will also release CO2. Chinese natural gas market is gradually opening competition and steadily experiencing natural gas price reform. At present, the market pricing mechanism has been developed. So, the NG_PRICE is largely determined by the market demand. Carbon price changes are positively affected by the ELEC_PRICE variable. Coal benchmark on-grid price is regulated by NDRC that has repeatedly cut ELEC_PRICE to solve the problem of energy structural. ELEC_PRICEs are not the same in different provinces, which are determined by their economic conditions, energy structural and some other factors. So, ELEC_PRICE acts as an intermediary to conduct the economy effects and energy effects. Chinese Dark Spread (CHINESE_DS) represents the profits of coal-firing power generation, which is calculated by ELEC_PRICE and ELE_COAL_PRICE, so it is definitely related to the carbon price.
As for the climate condition, we find that extremely high temperature has no influence on carbon prices and extremely low temperature has a significant impact on carbon price. Cold winters increase the demand for heating fuel, which in turn increases the emissions of CO2. Much to our surprise, extremely high temperature does not show any correlation with the increase in carbon price. Extreme weather conditions indirectly affect the carbon price through heating and power generation. The hot summer weather has increased the demand for air conditioning, which, by common sense, would increase carbon emissions. But why has the carbon price not risen? Most of the pilots use benchmarking method to allocate carbon allowance for power sector. Allowance amount depends on product of carbon intensity’s benchmark value and the generated electric energy production. It is true that electric energy production will increase in extremely hot weather. However, carbon quotas will also proportionate increase along with the increase of power generation. So, it does not necessarily affect the carbon price.
Finally, each pilot region’s average allowance characteristics will undoubtedly affect carbon price. We choose carbon allowance amount and covered entities number to reflect pilots’ characteristics. Obviously, commodity’s supply and demand determine the price. The more sufficient the supply, the lower the price.
To prevent the multicollinearity, principal components are extracted in different categories. Table 5 provides main results on principal components which are used as control variables.
(1) Category 1: Economic and industrial development level
We extract principal components ECON1 and ECON2 from CPI, IAV and IAV_YOY. From the rotated component matrix, we can see that principal component ECON1 mainly reflects the level of prices and inflation. But it can only explain 3% of the carbon price. Principal component ECON2 mainly reflects the industrial added value and the speed of industrial development. From Table 5 we know that it has significant impact on the carbon spot price and it can explain 23% of the price information.
(2) Category 2: Energy and power
We extract principal components ENERGY1 and ENERGY2 from COAL_PRICE, ELE_COAL_PRICE, NG_PRICE, ELEC_PRICE and CHINESE_DS. From the rotated component matrix, we can see that principal component ENERGY1 mainly reflects the power generation profit and the cost of energy consumption. From Table 5 we know that this principal component has a significant impact on the carbon spot price and it explains 5% of the price information.
(3) Category 3: Climate condition
We use H_L as the climate principal component. From Table 5 we know that CLIMATE has a significant impact on the carbon spot price but it only explains 0.73% of the price information.
(4) Category 4: C-CETP’s characteristic
We extract this principal component from ALLOWANCE and E_NO, which mainly reflects the average allowance characteristics among all the covered enterprises. This principal component has a significant impact on the carbon spot price and it explains 38% of the price information. The scarcer the average carbon quota, the higher the carbon price. So, the coefficient of this main component is negative.
To sum up, principal component 4 is not significant. Principal component 1 has pretty weak influence on the carbon price. So, in this paper, we use principal components 2, 3, 5, 6 as control variables.
5.2. Main Results about Policy Effects
(1) Policy effect 1: Auction’s impact on the carbon spot price
We present the DID estimates of the auction’s effect on carbon price in Table 6. From the first row, we can see that auction has a significant negative effect on the carbon price. Carbon prices in C-CETPs were overpriced at the beginning. Auction promotes the price discovery, which drives the market price to approach the auction completion price. Results in Table 7 prove our point of view that auction price has a positive relationship with the carbon price.
(2) Policy effect 2: Participants’ impact on the carbon spot price
We present the DID estimates of the participants’ effect on carbon price in Table 8. Carbon price exhibits a statistically significant and positive sensitivity to INV_ACC_IIT. For the Chinese carbon market, institutional investors are more professional than the covered enterprises for they are experienced in market investment. Investment managers can make a more precise judgment of the market condition. So, their participation contributes to the activity of the carbon market. Although individual investors account for only a small proportion, they are beneficial for the spread of carbon market participation consciousness, which has the meaning of educating the public. So, they can provide liquidity and promote price discovery, resulting in a virtuous circle of the market.
(3) Policy effect 3: Carbon forward’s impact on the carbon spot price
We present the DID estimates of the carbon forward’s effect on carbon price in Table 9. Carbon price exhibits a positive sensitivity to carbon forward. This indicates that carbon prices are currently underpriced and there are upward trends in the future. Hubei pilot introduced carbon forward in April 2016. Carbon forward transaction in Hubei is beneficial for price discovery and the stability of the market price. Shanghai pilot introduced carbon forward in 19 December 2016. Since then, carbon price in Shanghai has risen significantly. Carbon forward trading in Shanghai is beneficial for price discovery.
5.3. Policy Effects Test: Periodic Test of Each Pilot’s Carbon Price
Relevant authorities organize a final settlement of carbon allowance at a certain time every year. If each covered entity is actively managed according to the emission reduction target, the free quota should be enough to be used in that year and there will be no large-scale transaction approaching the verification period. However, many enterprises initially have weak emission reduction awareness. In addition, some pilots’ immature systems lack proper guidance. As a result, many covered entities choose to buy carbon allowance near the deadline of verification, which leads to the sensitivity of carbon price to the verification period. Therefore, this section examines the policies’ effectiveness based on the performance of each pilot’s carbon price and liquidity. Specific verification dates refer to Table 10.
The regression models are set as the following:
In this model, (i = 1, 2, 3, 4, 5, 6, 7) are constants. Each pilot’s verification period effect is represented by (i = 1, 2, 3, 4, 5, 6, 7), controls for an additional set of covariates that capture economy, energy, climate and other C-CETP’s characteristics at the region by daily level. εt are the stochastic error terms.
From the beginning of each carbon pilot’s operation to 30 June 2017, the correlation of each pilot’s carbon price with the verification period is shown in Table 11. Carbon prices and trading volumes would not have a significant cyclical effect after pilots had developed effective policies. Therefore, if the coefficient of VER_PERIOD is significant, the policy effect of this pilot is poor.
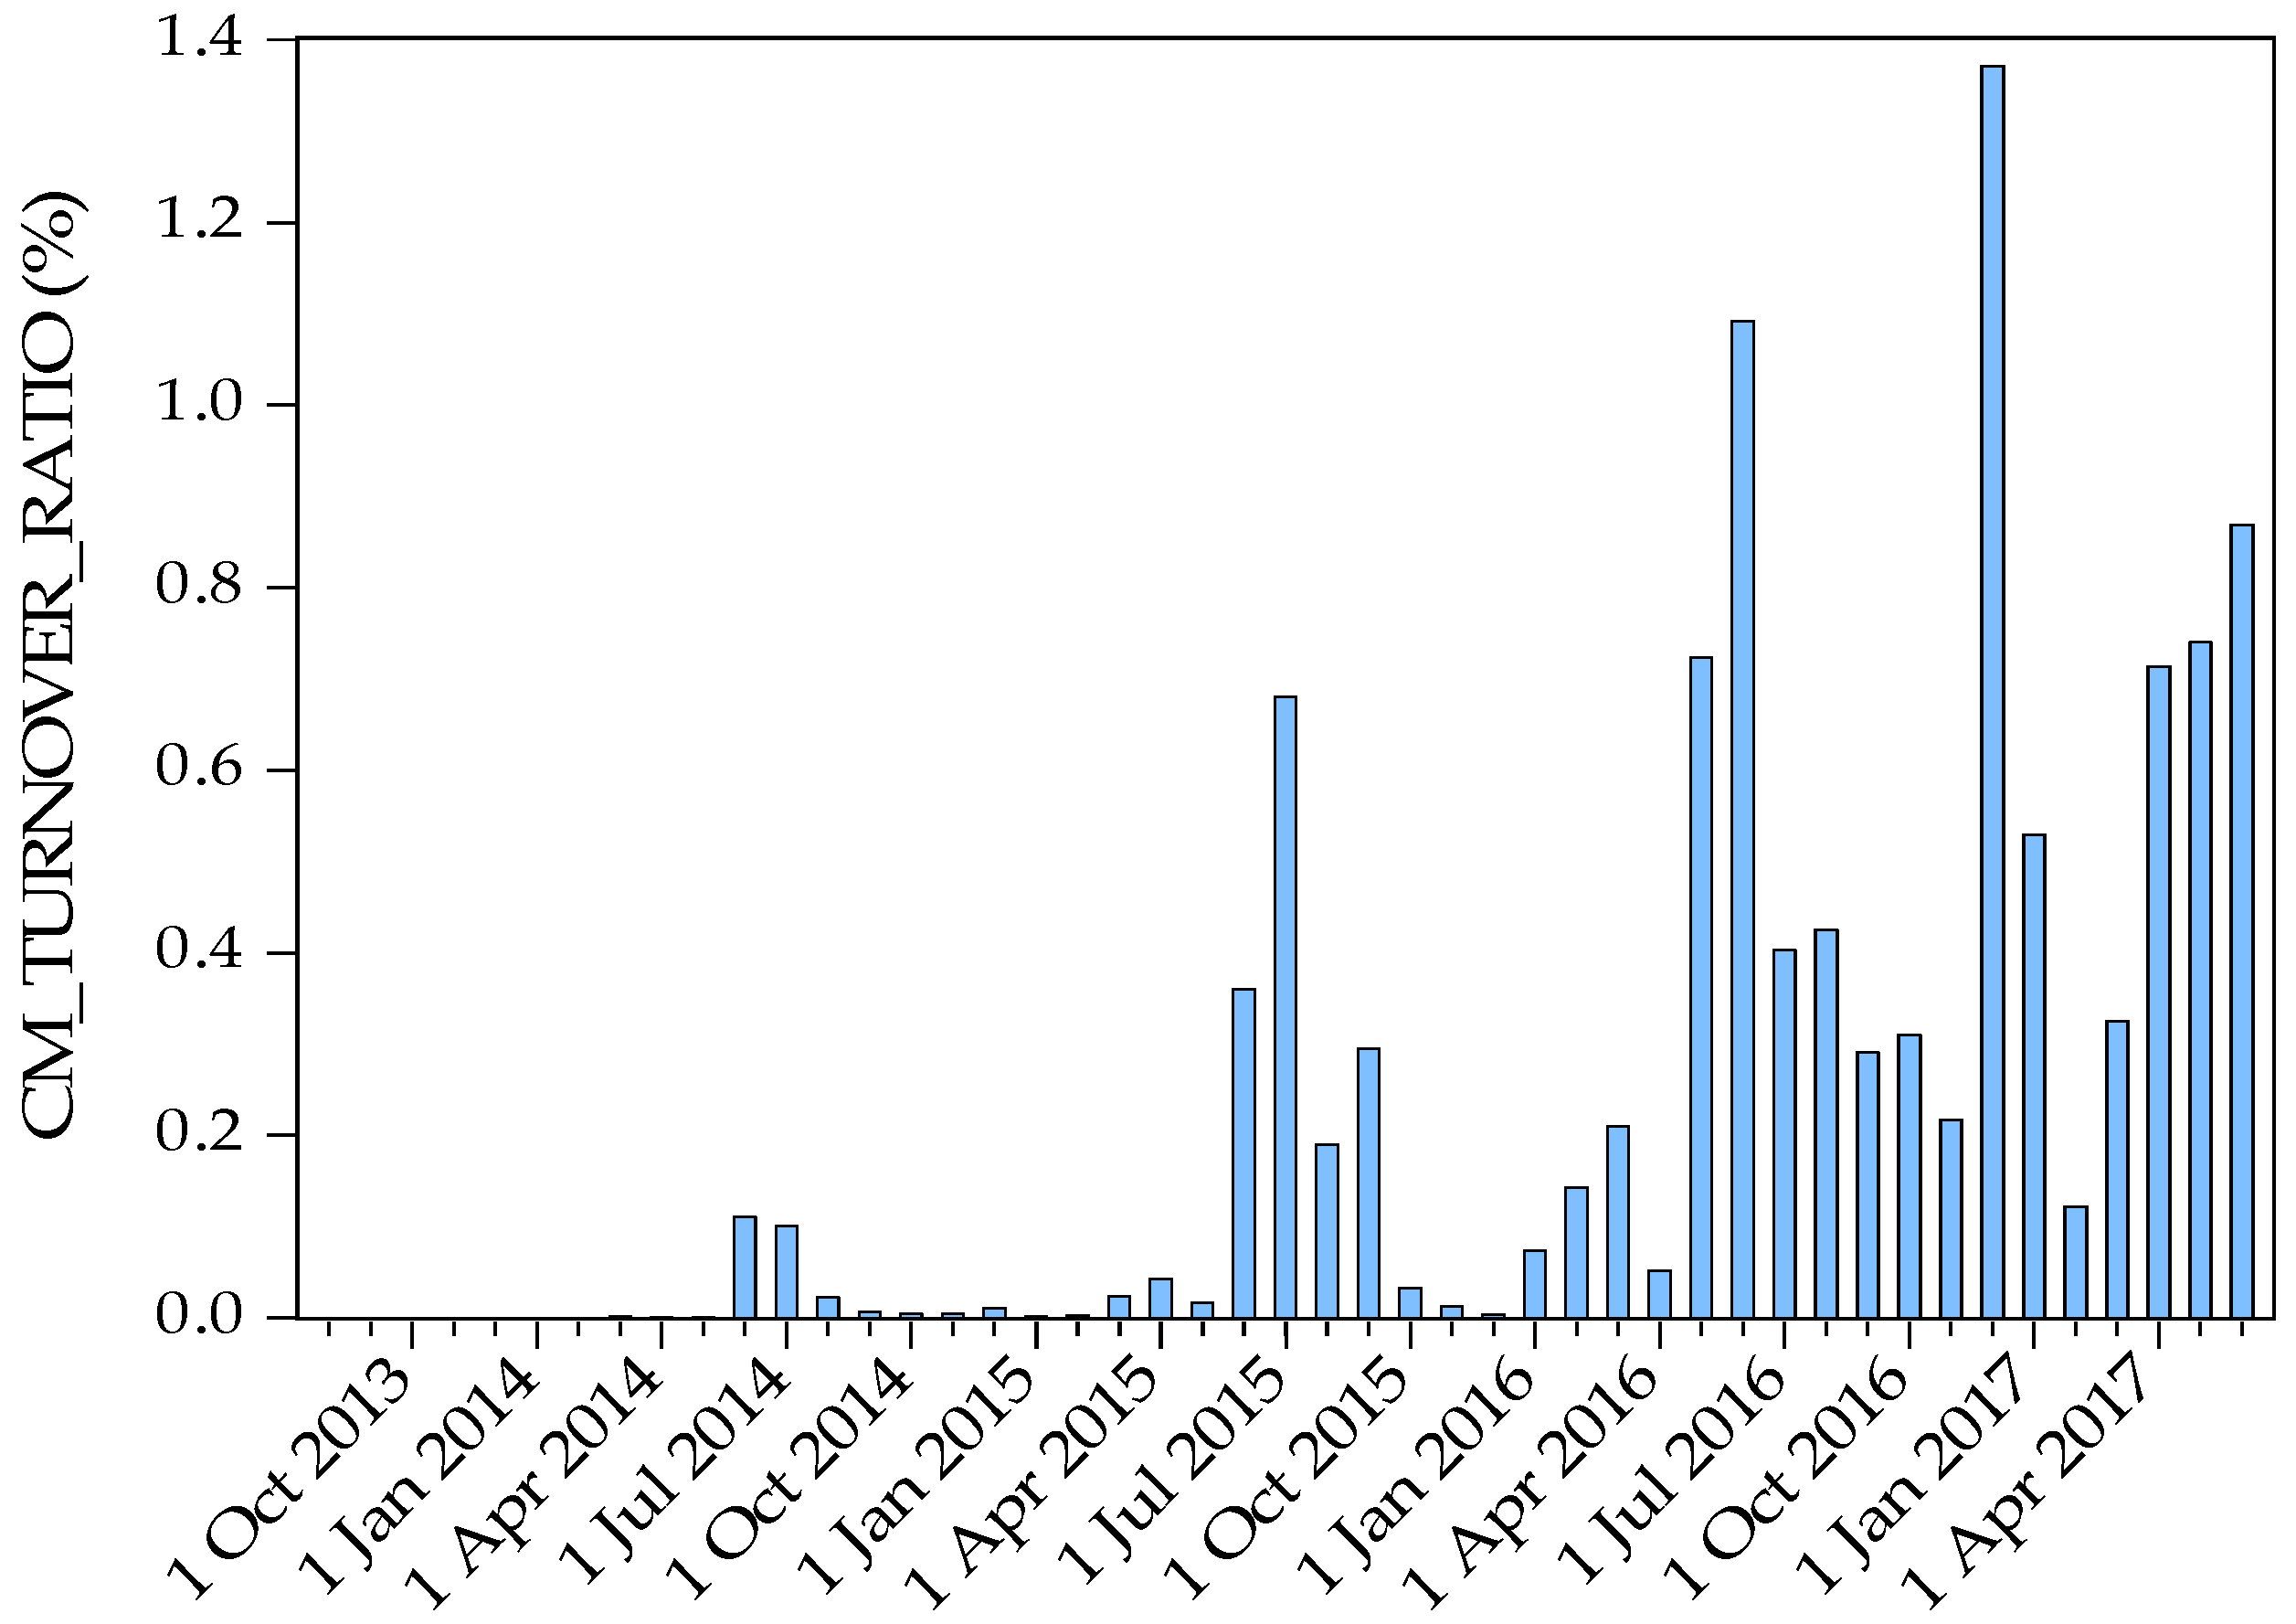
The regression results in Table 11 show that carbon prices of Beijing, Tianjin, Guangdong and Chongqing are significantly influenced by allowance verification work. Beijing does not use auction method to allocate carbon allowance and it sets a high threshold for individual investors to invest. So, participants’ trading enthusiasm is not high at the beginning of the compliance period. The periodicity of CO2 trading in Beijing has become more and more obvious (see Figure 4). The covered entities in Beijing are different from that of other carbon pilots. Besides the enterprises, it also includes public service units such as schools, hospitals and government agencies. These special units are involved in a lot of carbon market constraints and the process of financial approval is complicated. The inactivity of their participation has significantly reduced the liquidity of the carbon market. In February 2016, Guangdong Carbon Exchange launched carbon quotas custody business. On 5 June 2014, Guangdong ETS introduced individual investors and then the auction price continued to fall. But the auction price was set too high at the beginning, so the market liquidity is very weak and presents periodical characteristic (see Figure 5). Later, the auction price dropped to a normal level. So, the market liquidity has obviously been enhanced and the cyclical feature of carbon price has been weakened. The coefficient of Chongqing’s VER_PERIOD is significant, which means its operation is non-effective. This phenomenon can be explained by its self-declaration allowance allocation method. Companies declared too much quota for themselves. So even if near the verification period, enterprises do not face the pressure of quota shortage. We can see from Chongqing’s carbon market turnover ratio in Figure 6, its trading is always inactive. However, after August 2016, the government took measures to recheck allowance for every covered entity. The government withdrew enterprises’ surplus quotas. So, the trading volume and the carbon price obviously rose.
However, not every pilot’s carbon price has a positive correlation with verification period. The coefficient of Tianjin is negative (see Table 11). However, as can be seen from Figure 7, the carbon market turnover ratio of carbon allowance in Tianjin is obviously increased during the verification period. That is because excessive carbon allowances are allocated to enterprises. Lots of enterprise’s quotas need to be sold approaching the verification period, which means supply exceeds demand. This situation is largely caused by the covered entities’ type, which are mostly local state-owned enterprises. So, they tend to be more conservative. On the other hand, the penalties for non-compliance companies are not strict, so they will not actively purchase carbon emission quotas. In response to this problem, the Tianjin authorities did not implement effective regulation policies, so its carbon price has been significantly affected by the verification period.
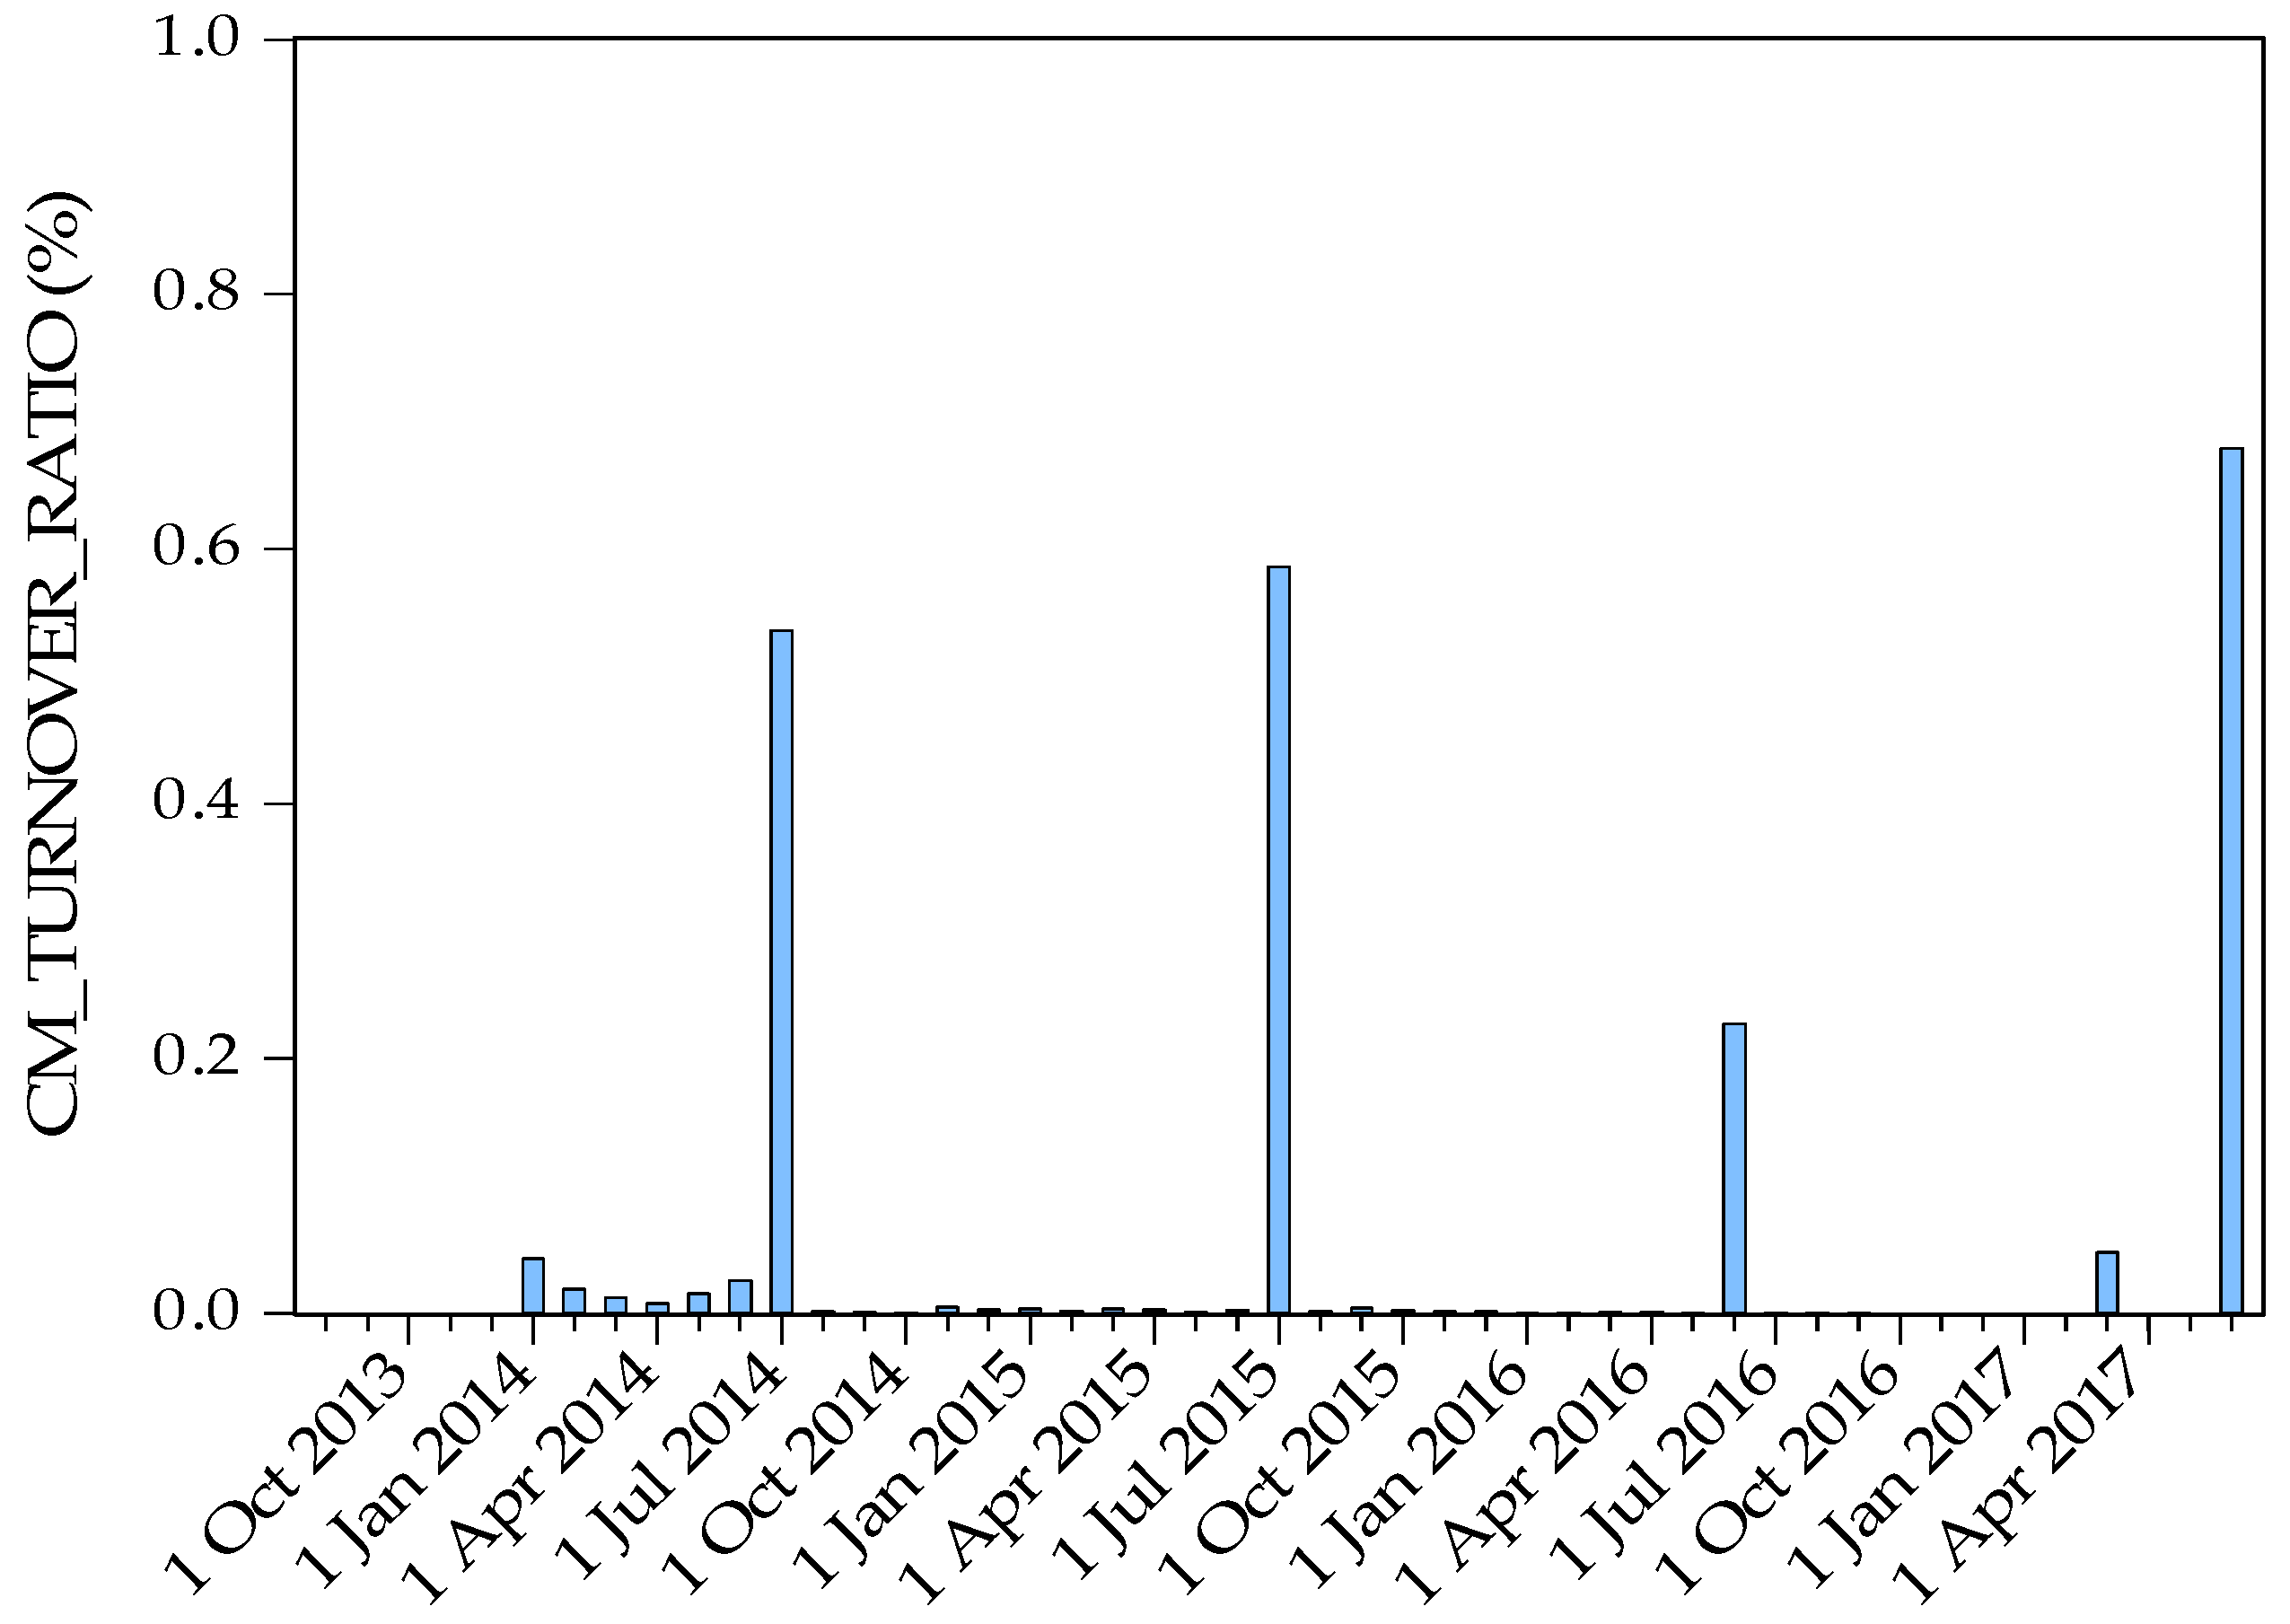
In Hubei Province and Shenzhen, carbon market’s operations are effective, so their carbon prices have little to do with verification periods (see Figure 8 and Figure 9). Hubei held an auction to confirm the initial price before the operation of its carbon market, therefore the initial carbon price is reasonable. Later, carbon forward was introduced in Hubei, which effectively regulates the market. Shenzhen implements auction and introduces individual participants. Its carbon market turnover ratio is higher than that of Beijing, Tianjin, Guangdong and Chongqing.
The carbon market in Shanghai has always been effective. In the early stage, its carbon price is almost irrelevant to the verification period. However, there seems to be a certain correlation in the later period. This is due to the sharp increase of carbon price after the introduction of the carbon forward policy, rather than the impact of the verification period.
5.4. Heterogeneity in the Policies Effect
This part tests the hypothesis that the regulations on ETS may have a heterogeneous impact on carbon price across various subsamples. In this article, two aspects of heterogeneous impact are verified.
We first search for heterogeneity in the policy effects between energy-intensive industries concentrated pilots and the third industry concentrated pilots due to energy consumption structure (coal proportion) difference, given that pilots in which coal occupies pretty large proportion are considered to be more pressing to reduce CO2 emissions. Participants in areas with serious air pollution will be more eager to have good air conditions; thus, they respond to the policies more actively. On the other hand, heterogeneous effects may also reflect the difference on national emission control policy. The government will pay more attention to adjust the energy consumption structure of energy-intensive industries concentrated pilots, then the carbon allowance of serious polluted areas will be restricted stricter. The first and second rows in Table 12 respectively report the estimated effects for energy-intensive industry concentrated pilots (Tianjin: 46.1%, Hubei: 63.8%, Chongqing: 52.0%, Guangdong: 43.2%) and the third industry concentrated area (Beijing: 22.6%, Shanghai: 35.9%, Shenzhen: <43.2%). The coefficients suggest that the auction effect on carbon price is similar between energy-intensive industry concentrated pilots and the third industry concentrated pilots. Both regression results are significant. In contrast, the impact of participant type and forward transaction on carbon market are substantially different. In energy-intensive industry concentrated pilots, INV_ACC_IIT and FORWARD can significantly reduce the carbon price. In third industry concentrated pilots, INV_ACC_IIT does not show any influence on carbon price but FORWARD can significantly raise the carbon price. We can see that the initial setting of energy-intensive industry concentrated pilots’ carbon price is too high.
Next, we explore whether the policy effects differ according to the marketization degree, which is measured by marketization index [42]. Marketization degree refers to the degree of the role played by the market in the allocation of resources. Such heterogeneity is likely to arise because investors in pilots with high marketization degree are more sensitive to the market. Therefore, the policies’ impact on the carbon price should be more significant. The third row in Table 12 reports the estimated effects for the sample of high marketization degree pilots (Beijing: 9.08, Tianjin: 9.17, Shanghai: 9.77, Guangdong: 9.35, Shenzhen: >9.35) and the significance level was 1%. The fourth row in Table 12 presents the estimated effects for the sample of low marketization degree pilots (Hubei: 7.28, Chongqing: 7.78) but the significance level was 5%. The finding verifies that the high marketization degree pilots are more vulnerable to the effects of ETS’s policies.
5.5. Additional Robustness Checks
The findings above leave little room for the scope of confounding factors. In this subsection, we extensively explore additional robustness checks to rule out other possible scenarios. In the first row of Table 13, we examine whether the main findings are robust to eliminate outliers. Specifically, we eliminate samples which dependent variable values are above 99th percentile and below 1st percentile. The results are similar. Another concern is that regional difference may affect policy regulation effect. We take only northern China as examples in the second row and take only southern China as examples in the third row. All these estimates effects remain significantly, showing robustness to alternative specifications. Taken all above together, the collection of these robustness checks substantially limits the scope of omitted variables, leading us to believe that the main findings substantiate the causal impact of policies on carbon price.
6. Conclusions and Policy Implications
To move from pilot phase to formal phase, the CN ETS still faces uncertainties arising from matters such as allowance allocations, economic fundamentals, energy structure, climate condition and trading principles. All of these uncertainties will directly influence the carbon emission reduction efficiency, abatement costs and burden sharing among all the covered entities in China. To help reduce these uncertainties and build an efficient market, we conduct this research work. The results and several policy recommendations are shown as follows.
6.1. Adjust the Allowance Allocation Methods to Coordinate with Regional Characteristics
The results in Appendix A—Table A1 show that C-CETPs’ allowance characteristics can explain most of the price information, approximately 38% (the results are shown in the last row of Table 5). These results remind us that reasonable distribution of carbon allowance is the key to stabilize the market price. The variable which characterizes economics and industrial development of pilots–industrial added value—represents almost 20% of the carbon price. The variable which characterizes energy and power of pilots—coal price and coal benchmark on-grid price—together explains 22.61% of the carbon price. At present, we find that temperature only has a slight impact on the carbon price. To sum up, policymakers need to focus on economic patterns and energy structures in different provinces when they distribute carbon allowances. After the completion of the CN ETS, the carbon price will be unified. As the results show in this paper, the carbon price is closely related to the supply and demand of carbon allowance. The regional economic pattern and energy structure determine the demand for carbon allowance. Government policies determine the supply for carbon allowance. Only when policies match with the actual situation of provinces or industries, can the CN ETS form a reasonable carbon price. A reasonable equilibrium carbon price is the premise of sustainable economic development.
6.2. Introduce Autonomic-Adjusting Measures to the Market in the Short Term, Build Open-to-Public Information Platform in the Long Term
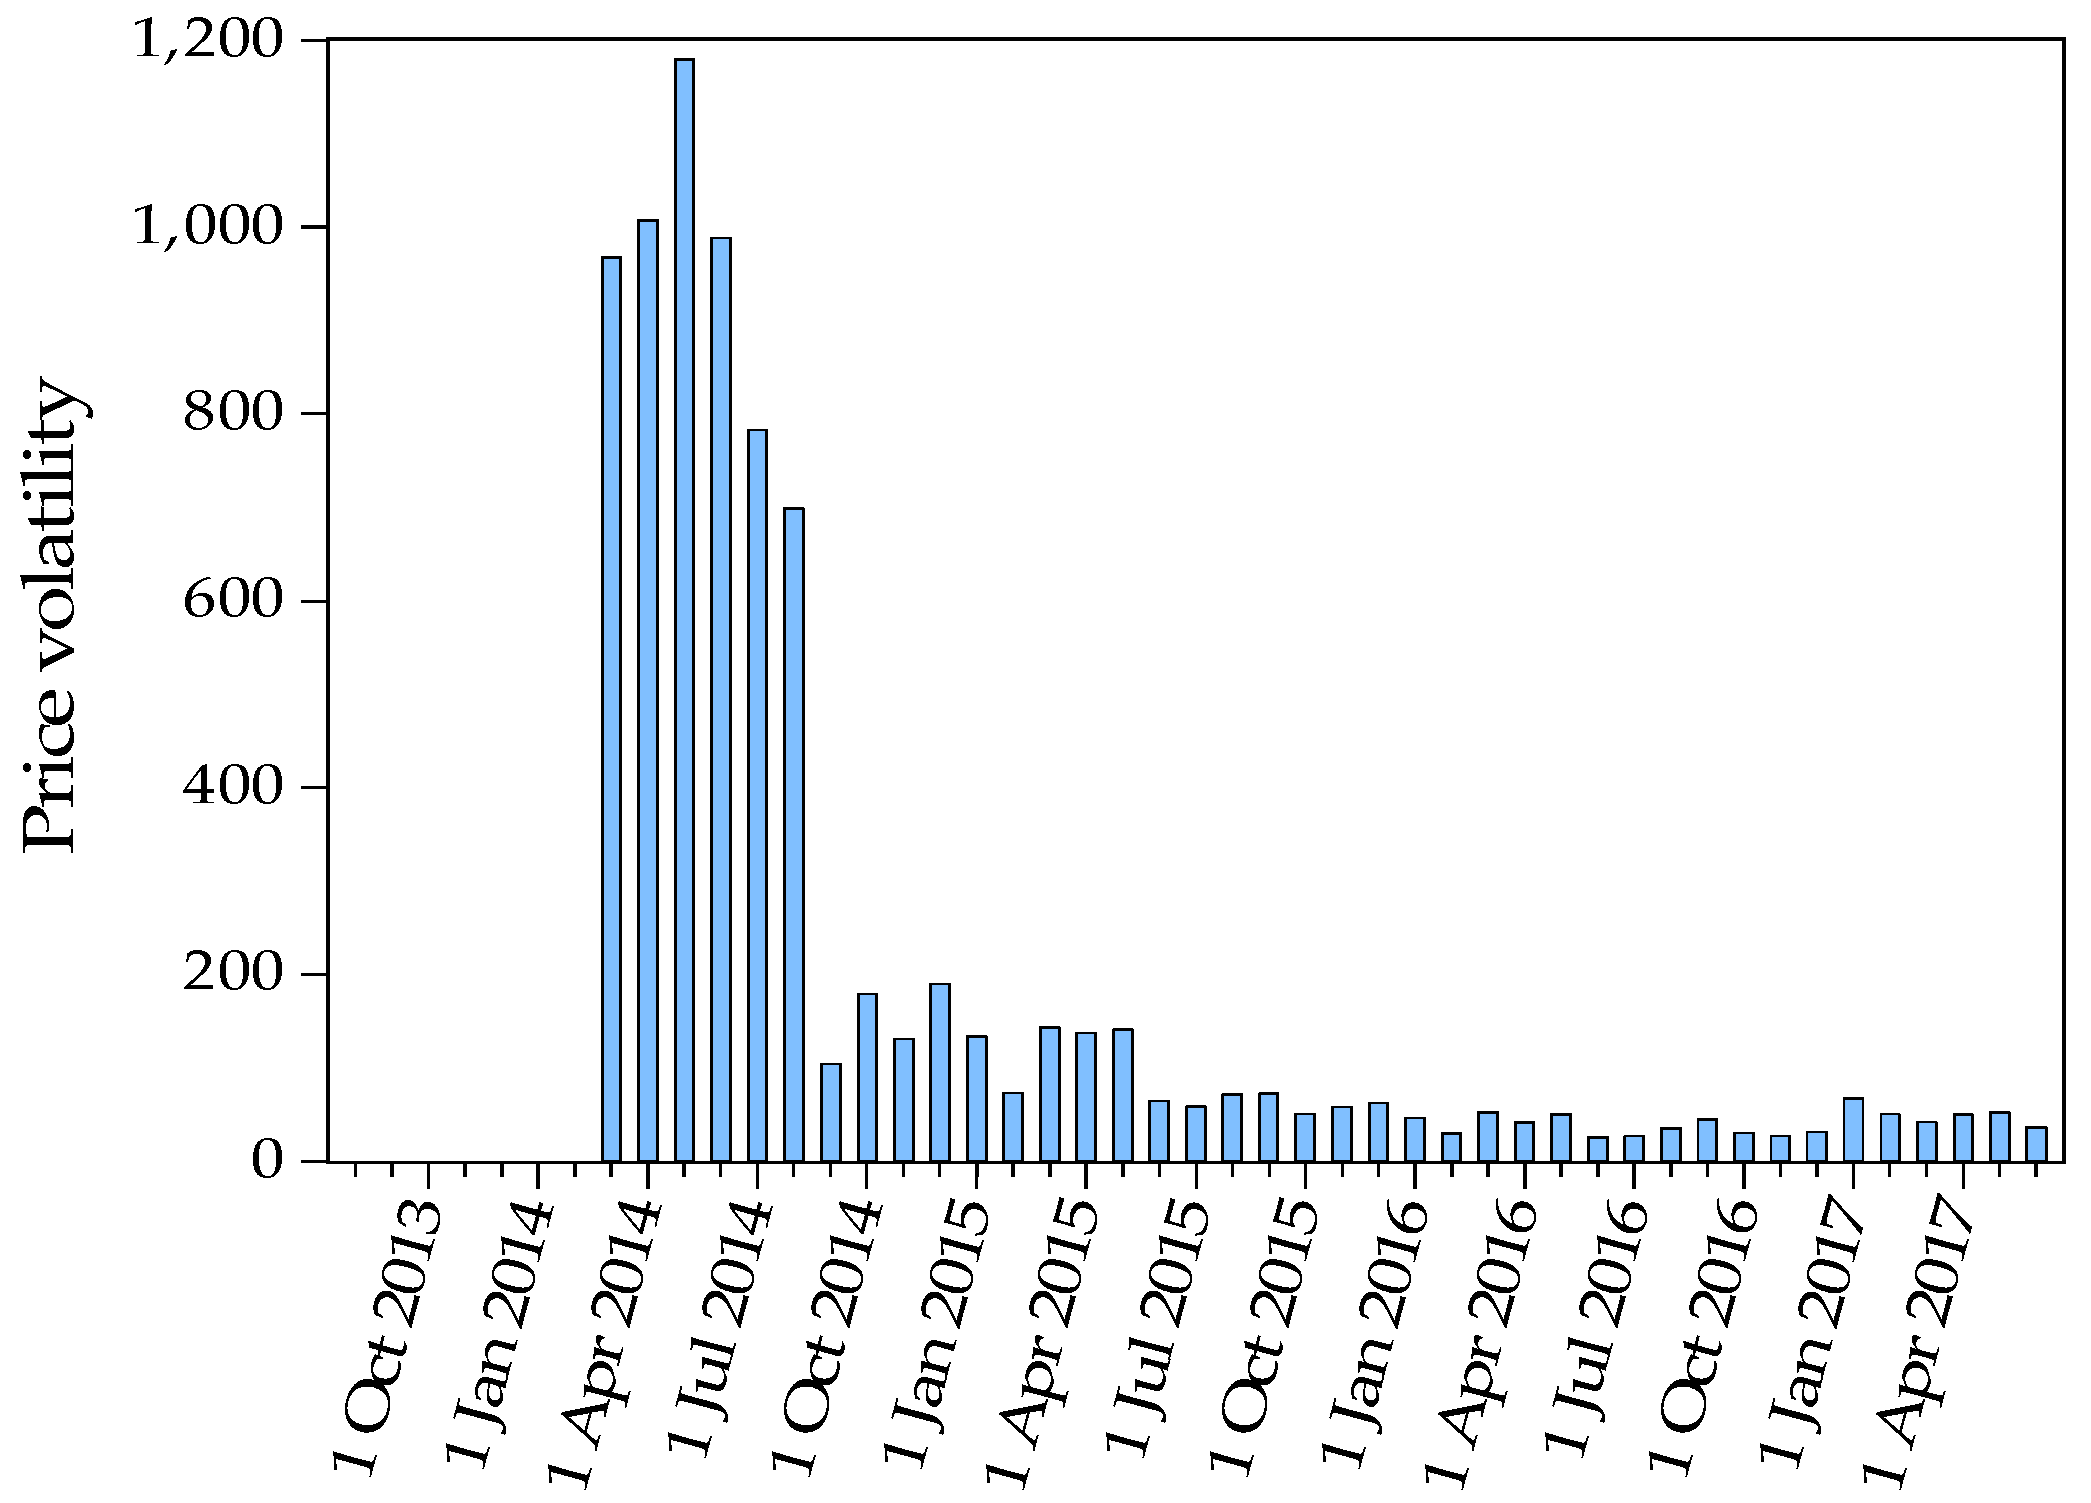
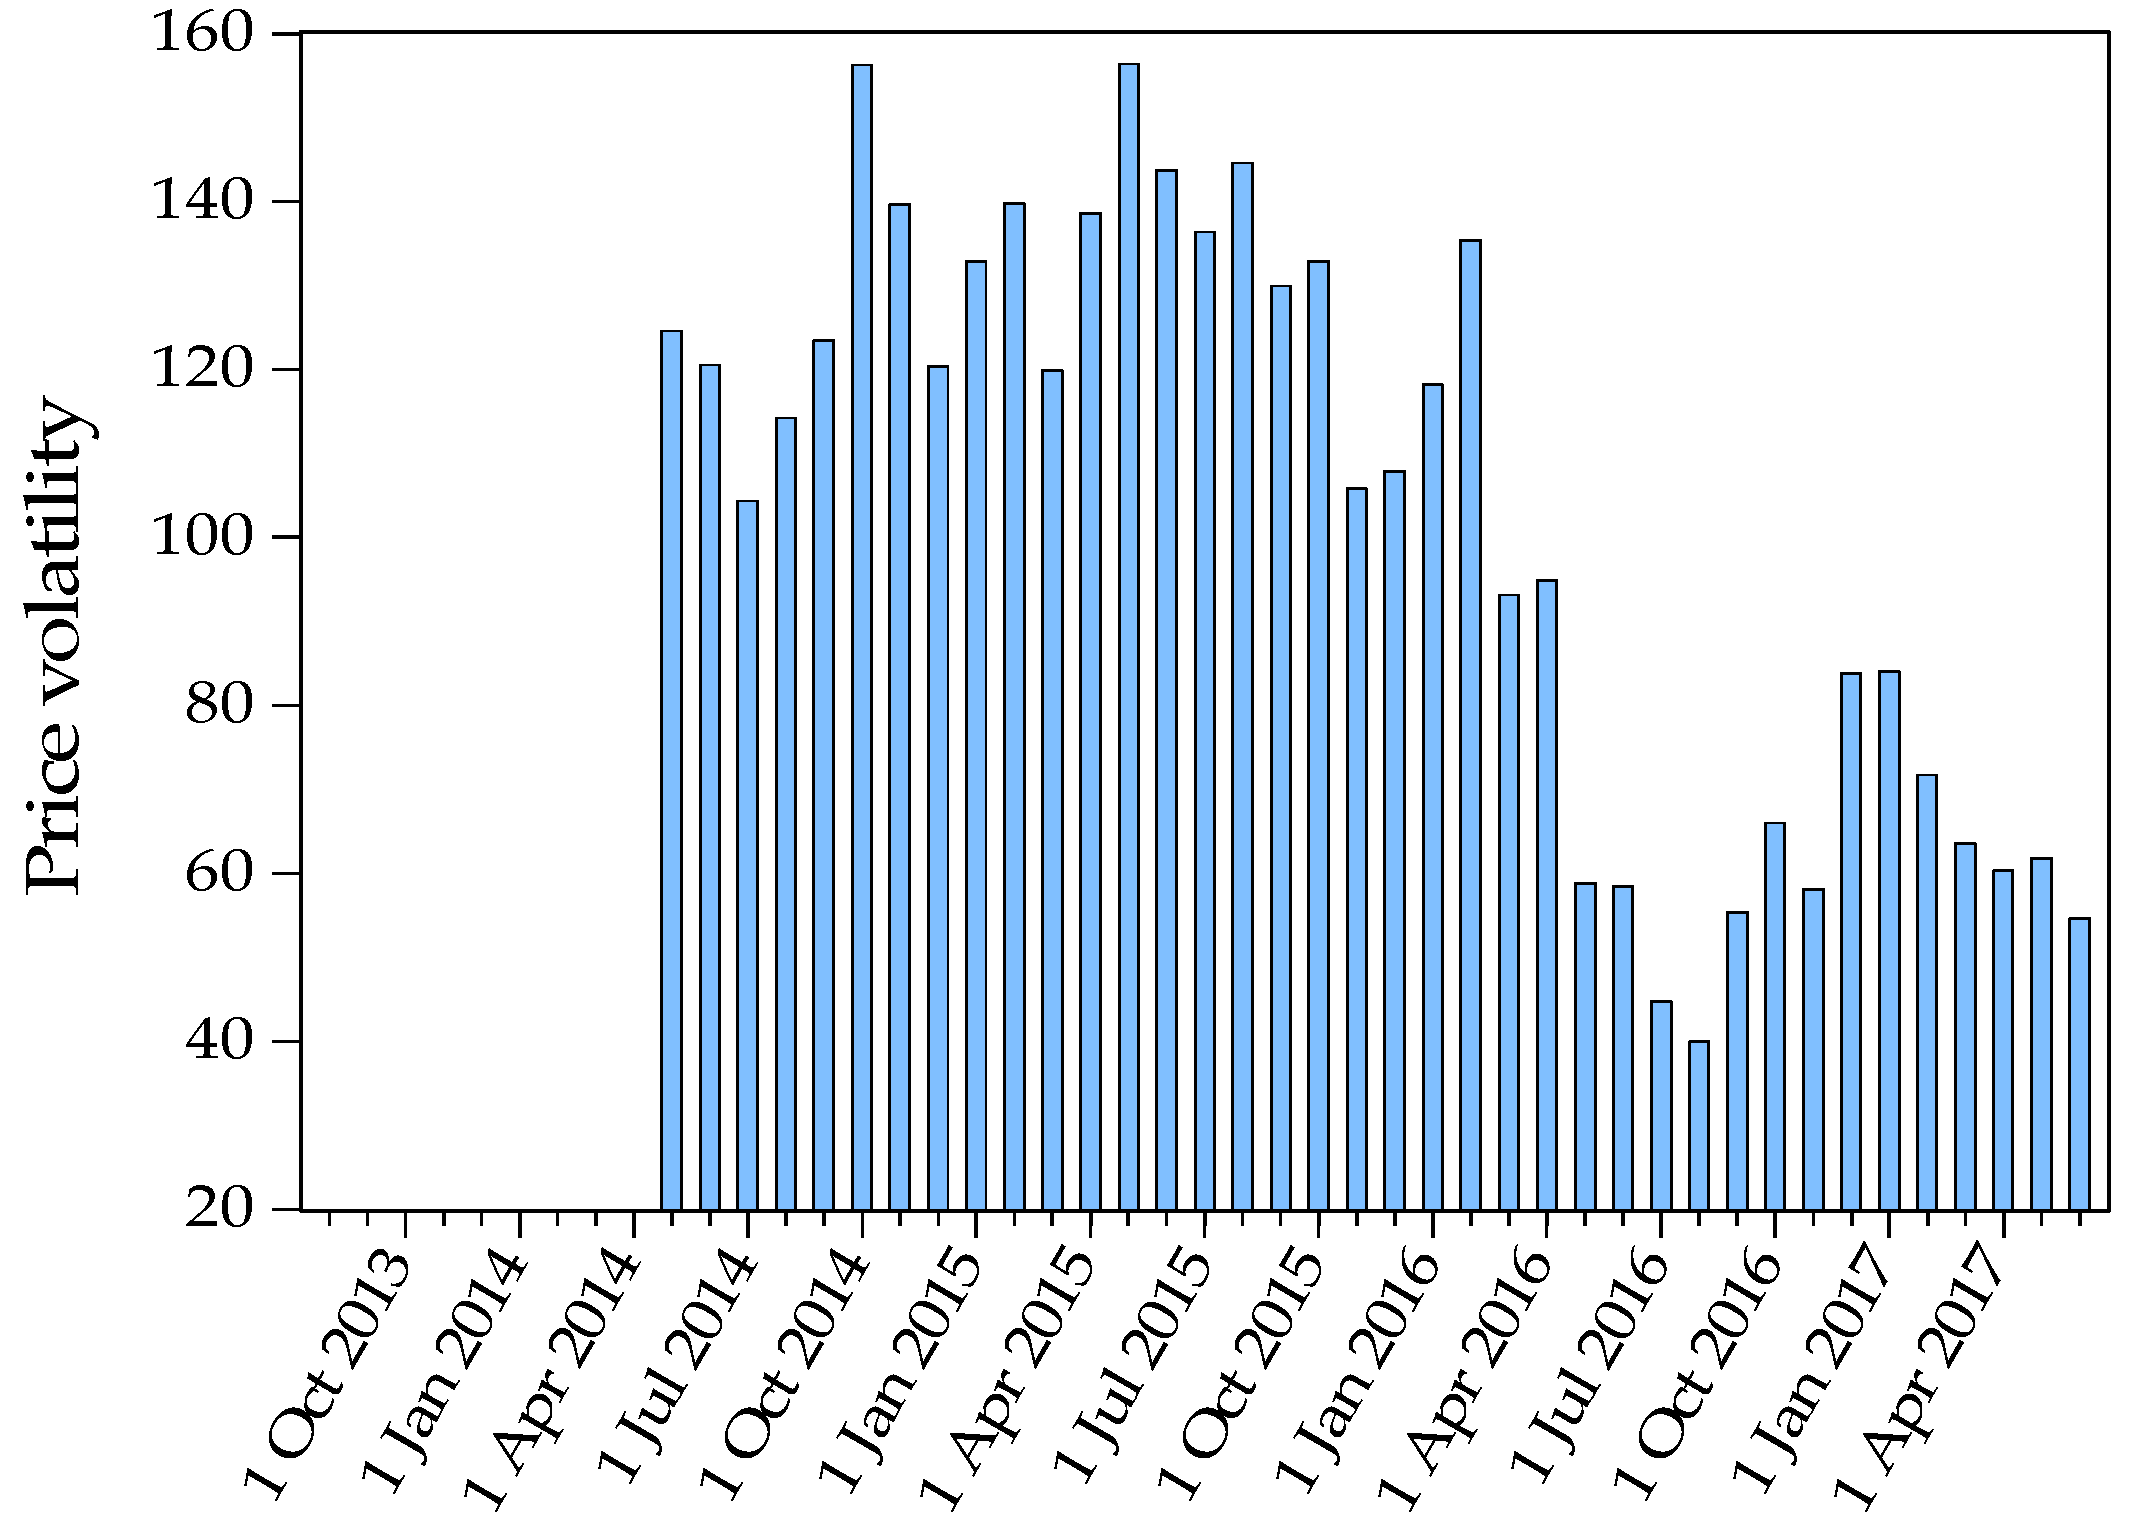
Autonomic-adjusting measures refer to auction, openness to non-regulated players and the introduction of derivative products. The results in Appendix A—Table A1 show that auction can reflect 6% of the carbon price, although auction only takes small proportion in carbon allowance allocation process up to now. As shown in Appendix A—Table A2, auction can also increase market liquidity. Other regions should study the auction mechanism in Guangdong Province, in which carbon price has been stable after auction policy went on for some time (see Figure A2). Authorities should establish a cyclical auction system, so that auction can really become a necessary mean for covered entities to obtain quotas. By this way, a reasonable carbon price can be obtained by the market itself. We shall not let the auction only serve as a way of meeting emissions targets for some enterprises which exceed emission limit. If we do not establish a scientific auction system, the enthusiasm of active participants will be reduced, which is contrary to what we hope. The results in Appendix A—Table A2 show that non-regulated players, including institutional investors and individual investors, can increase market liquidity. After the formation of the CN ETS, the authorities should formulate policies to encourage non-regulated players to participate in the trade, such as reducing service fee and giving some subsidies to annual management fee. In the long run, these approaches are beneficial to a more prosperous market. The introduction of forward transaction can promote price discovery. After the introduction of carbon forward in Shanghai, carbon price has risen sharply. The introduction of forward trading is also conducive to price stability. In Appendix B—Figure A3, we can see that carbon price of Hubei pilot after April 2016 is significantly more stable. Thus, a carbon forward market shall be gradually built after the establishment of the CN ETS, in which a unified standard contract should be used. Carbon forward is an innovation in carbon financial market. The carbon forward in Hubei and Shanghai are conducive to the construction of a multi-level carbon financial market system in the future. The carbon forward price can also guide the prices of over-the-counter trading and spot transaction. In the short term, these effective measures are easy to implement.
However, in the long term, these measures are not enough. Information disclosure is the critical element of an efficient carbon market, which needs to be improved in the long work practice. Government should establish an open information platform to publish the firm-level carbon emission data.
6.3. Gradually Broaden the Scope of Covered Entities and Gradually Extend to Industries with Lower Emission Intensity
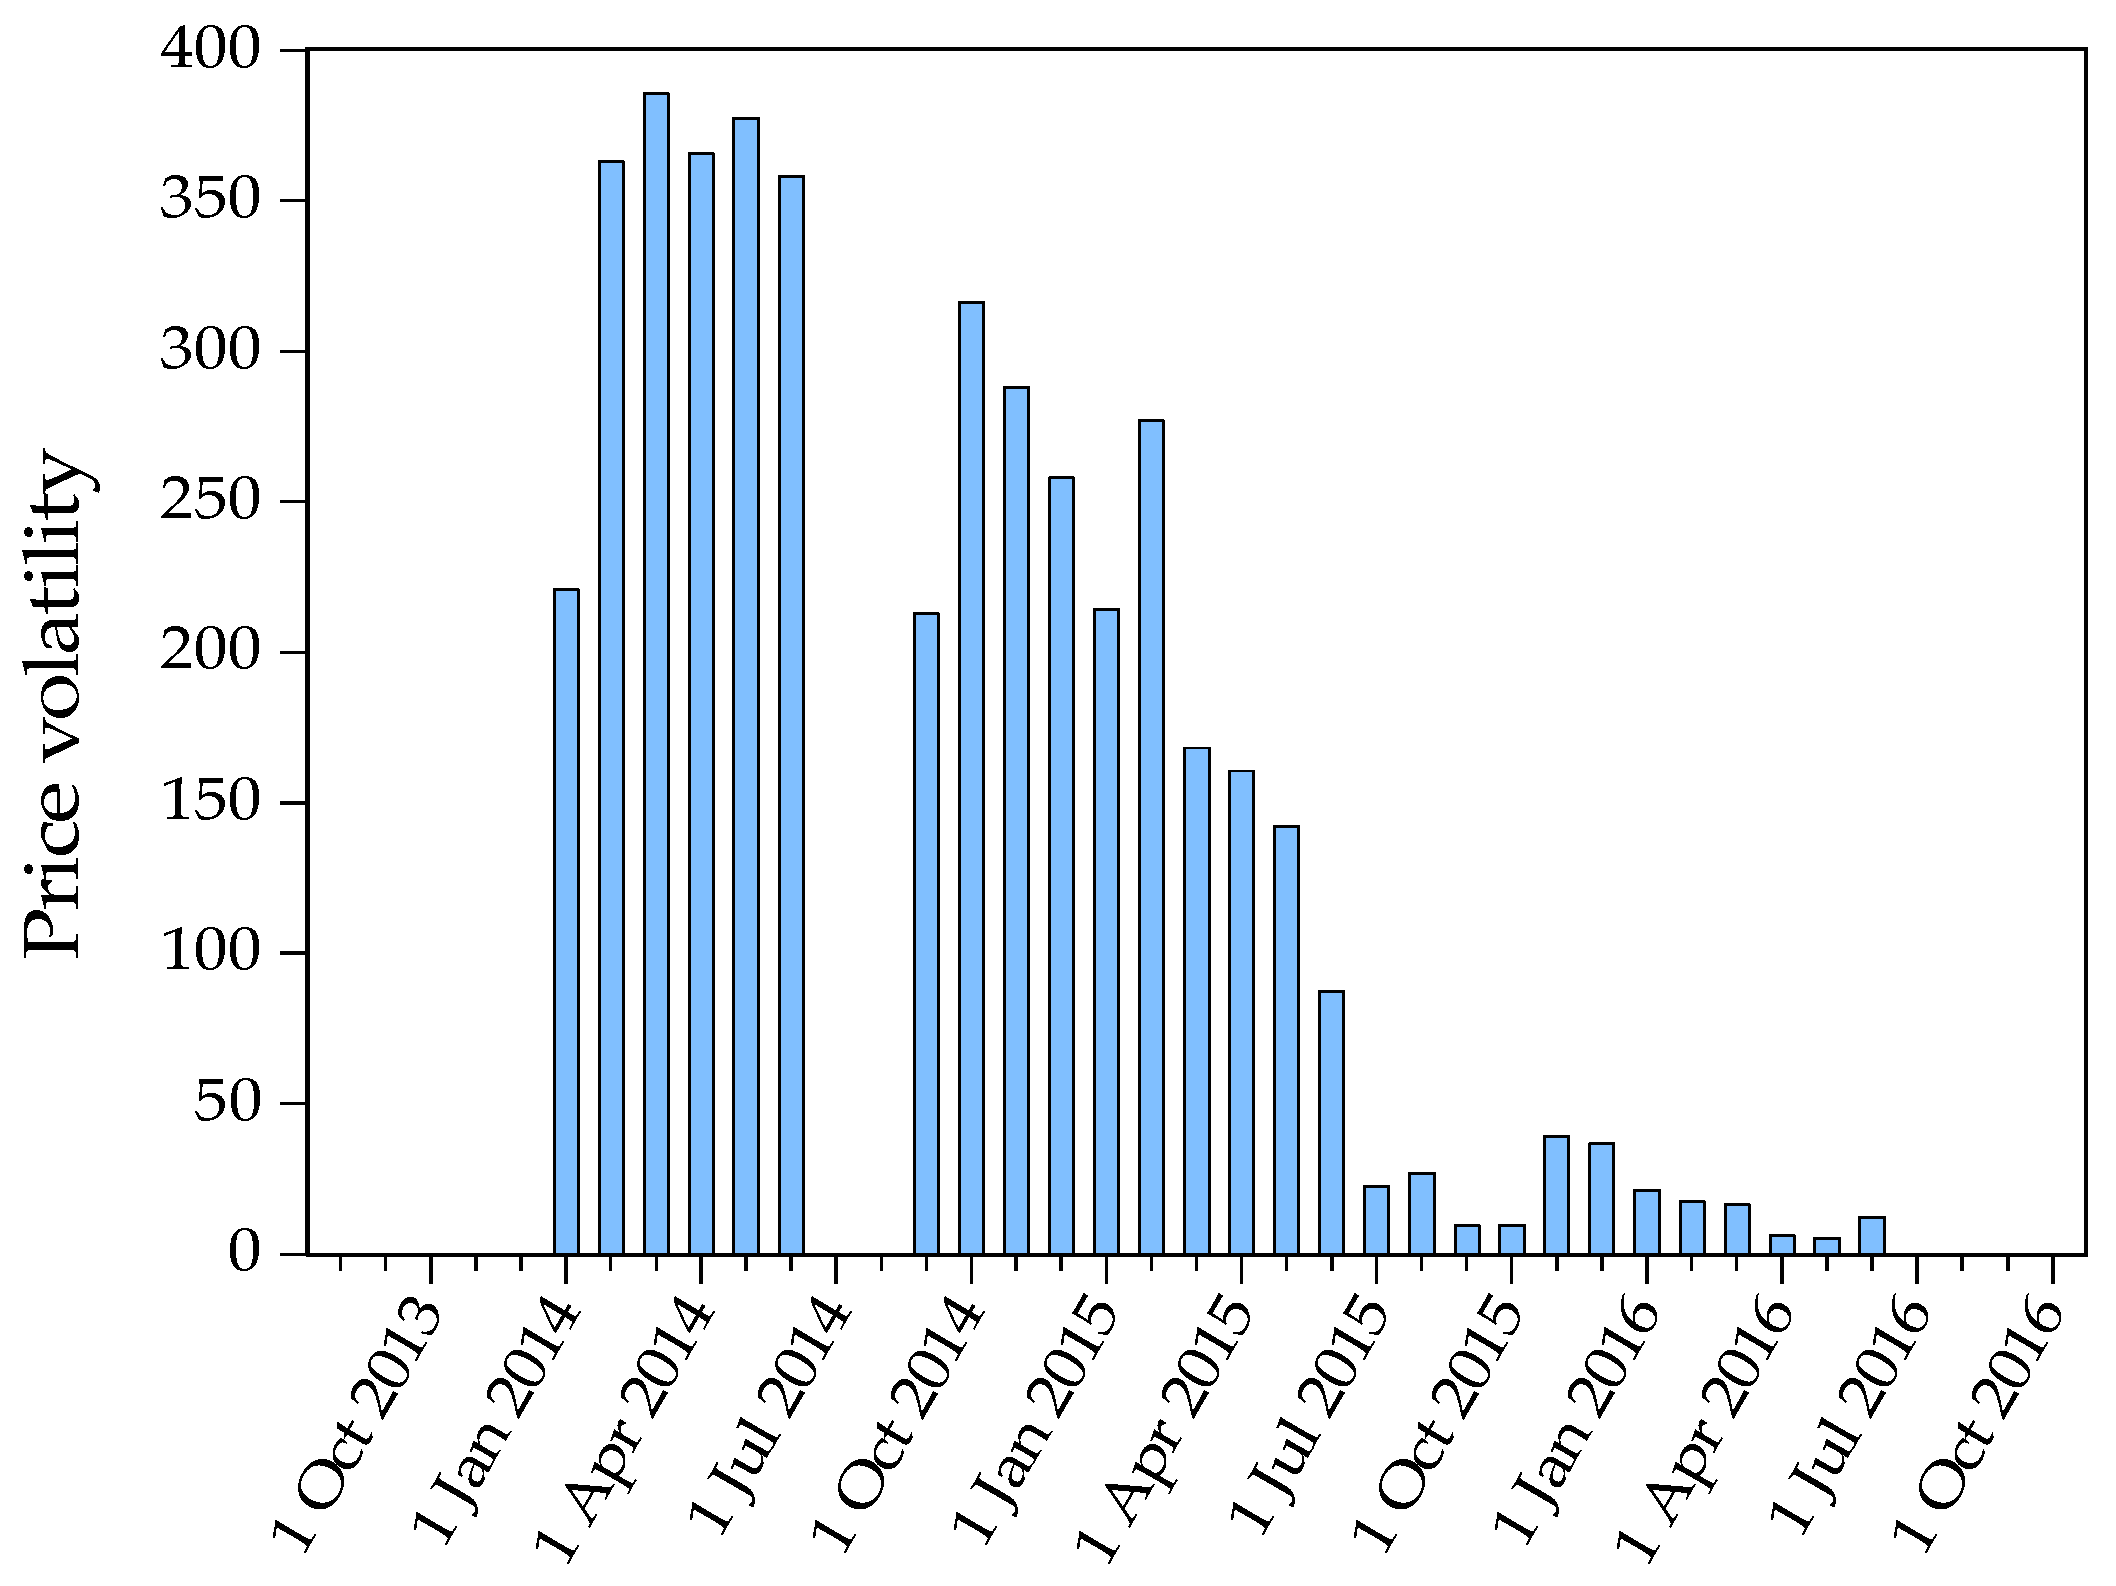
In Appendix B—Figure A4, we can see that price volatility of Shanghai decreased after July 2015, which can be attributed to the rapid expansion of covered entities. Covered entities shall be extended from high emission industry like iron and steel, power, petrochemical, nonferrous metals, building and decorative materials, pulp and paper, textile and rubber to the service industry like port, aviation, hotels, shopping malls, business office buildings. The covered entities can be further extended to auto parts companies, technology companies and even food companies. The expansion of market participant’s scope can increase the transparency of the transaction, making the market price more stable.
6.4. Government Should Have a Long-Term Industry Development Plan and Provide Technology Support for Backward Areas to Improve Their Energy Structure
From Figure A1, we can see an obvious difference of C-CETPs’ equilibrium carbon prices. At the pilot stage, carbon allowances are not stringent, which is in order to enhance the covered entities’ participation enthusiasm. However, after the establishment of CN ETS, allowance restriction will be more and more stringent as the market gradually mature. Energy-intensive companies will be affected significantly, some of which will successfully transform and upgrade, some of which will fail if they cannot afford the high carbon price. In this process, the government should make a reasonable development plan considering the differences in regional economic development and keep to guiding the work of the transformation of enterprises following the principle of fairness. Government should provide technology support for companies in need. Otherwise, it is easy to cause an imbalanced provincial development and form an unreasonable regional industry structure.
Acknowledgments
This paper is funded by the National Science and Technology Support Program of China (No. 2012BAC20B12).
Author Contributions
Jiacheng Man put forward the idea of the article, designed the study, analyzed the data, wrote the paper and revised the manuscript; Chuanze Liu provided some significant advice, did some literature research and revised the manuscript; Zehao Gou provided some professional advice, wrote and revised part of the paper; Baochen Yang revised the manuscript and provided some significant advice. Yunpeng Su provided some significant advice. All authors have read and approved the final manuscript.
Conflicts of Interest
The authors declare no conflict of interest.
Appendix A

Table A1.
R2 of all the independent variables.
| Variable | CPI | IAV | IAV_YOY | COAL_PRICE | ELE_COAL_PRICE |
| R2 | 0.04 | 0.1875 | 0.0372 | 0.0445 | 0.1986 |
| Variable | NG_PRICE | ELEC_PRICE | CHINESE_DS | T_L | ALLOWANCE |
| R2 | 0.0170 | 0.1152 | 0.0615 | 0.0073 | 0.2873 |
| Variable | E_NO | AUCTION | INV_ACC_IIT | FORWARD | VER_PERIOD |
| R2 | 0.3578 | 0.0613 | 0.0031 | 0.0336 | 0.0020 |
Table A2.
Policies’ Impact on liquidity and price volatility.
| Impact on Liquidity | |||
| AUCTION | INV_ACC_IIT | FORWARD | |
| Coefficient | 0.1677 (2.9879) *** | 0.0484 (6.4173) *** | — |
| Impact on Price Volatility | |||
| AUCTION | INV_ACC_IIT | FORWARD | |
| Coefficient | — | 0.0583 (1.7335) * | — |
Notes: T values are shown in brackets. Results are from separate regressions. This table only shows significant results. * Significant at p < 0.1 level. *** Significant at p < 0.01 level.
Appendix B
Figure A1.
Carbon price in C-CETPs from 5 August 2013 to 31 October 2016.
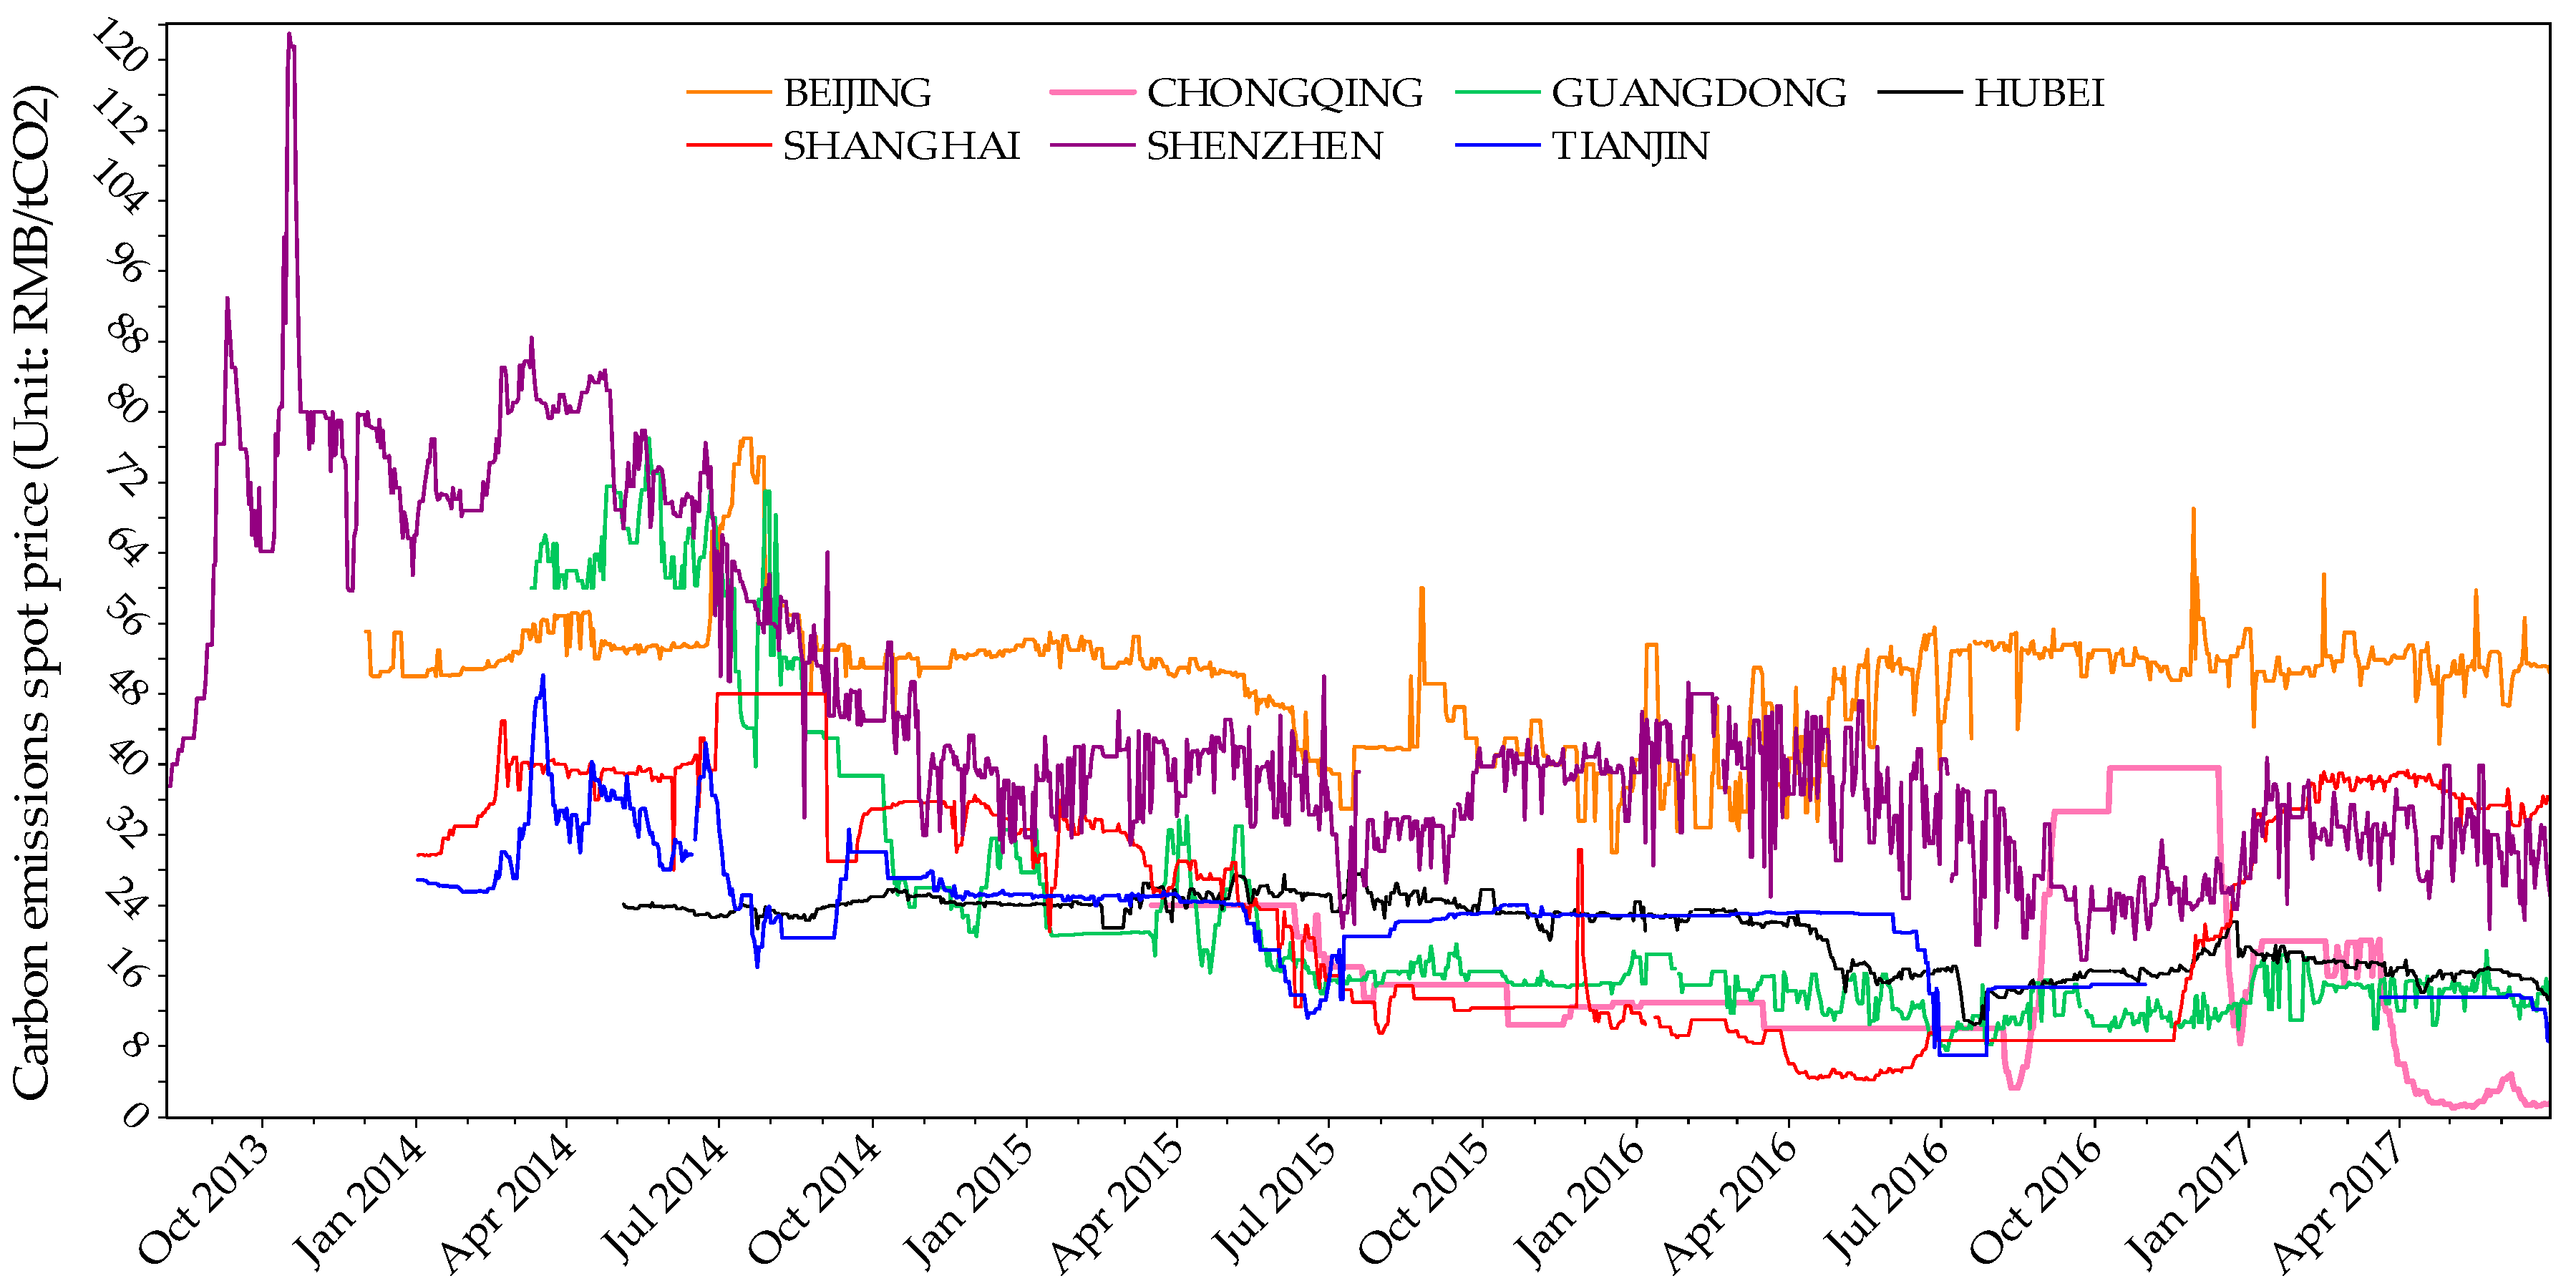
Figure A2.
Price volatility of Guangdong Province.

Figure A3.
Price volatility of Hubei Province.

Figure A4.
Price volatility of Shanghai.

References
- Böhringer, C.; Dijkstra, B.; Rosendahl, K.E. Sectoral and regional expansion of emissions trading. Resour. Energy Econ. 2014, 37, 201–225. [Google Scholar] [CrossRef]
- Perdan, S.; Azapagic, A. Carbon trading: Current schemes and future developments. Energy Policy 2011, 39, 6040–6054. [Google Scholar] [CrossRef]
- Jiang, J.; Xie, D.; Ye, B.; Shen, B.; Chen, Z. Research on China’s cap-and-trade carbon emission trading scheme: Overview and outlook. Appl. Energy 2016, 178, 902–917. [Google Scholar] [CrossRef]
- Chang, Y.-C.; Wang, N. Environmental regulations and emissions trading in China. Energy Policy 2010, 38, 3356–3364. [Google Scholar] [CrossRef]
- Hancheng, D.; Masui, T. Assessing the contribution of carbon emissions trading in China to carbon intensity reduction. Energy Sci. Technol. 2012, 4, 19–26. [Google Scholar]
- Chen, B. The establishment of China’s national carbon emission trading market and its macro-control strategy. China Popul. Resour. Environ. 2013, 23, 9–15, [in Chinese]. [Google Scholar]
- Zhang, C.; Wang, Q.; Shi, D.; Li, P.; Cai, W. Scenario-based potential effects of carbon trading in China: An integrated approach. Appl. Energy 2016, 182, 177–190. [Google Scholar] [CrossRef]
- Tanaka, S. Environmental regulations on air pollution in China and their impact on infant mortality. J. Health Econ. 2015, 42, 90–103. [Google Scholar] [CrossRef] [PubMed]
- Zhang, D.; Karplus, V.J.; Cassisa, C.; Zhang, X. Emissions trading in China: Progress and prospects. Energy Policy 2014, 75, 9–16. [Google Scholar] [CrossRef]
- Jiang, J.J.; Ye, B.; Ma, X.M. The construction of Shenzhen’s carbon emission trading scheme. Energy Policy 2014, 75, 17–21. [Google Scholar] [CrossRef]
- Wu, L.; Qian, H.; Li, J. Advancing the experiment to reality: Perspectives on Shanghai pilot carbon emissions trading scheme. Energy Policy 2014, 75, 22–30. [Google Scholar] [CrossRef]
- Qi, S.; Wang, B.; Zhang, J. Policy design of the Hubei ETS pilot in China. Energy Policy 2014, 75, 31–38. [Google Scholar] [CrossRef]
- Shen, B.; Dai, F.; Price, L.; Lu, H. California’s Cap-and-Trade Programme and Insights for China’s Pilot Schemes. Energy Environ. 2014, 25, 551–575. [Google Scholar] [CrossRef]
- Xiong, L.; Shen, B.; Qi, S.; Price, L. Assessment of allowance mechanism in China’s carbon trading pilots. Energy Procedia 2015, 75, 2510–2515. [Google Scholar] [CrossRef]
- Pezzey, J.C.; Park, A. Reflections on the double dividend debate. Environ. Resour. Econ. 1998, 11, 539–555. [Google Scholar] [CrossRef]
- Cramton, P.; Kerr, S. Tradeable carbon permit auctions: How and why to auction not grandfather. Energy Policy 2002, 30, 333–345. [Google Scholar] [CrossRef]
- Böhringer, C.; Lange, A. On the design of optimal grandfathering schemes for emission allowances. Eur. Econ. Rev. 2005, 49, 2041–2055. [Google Scholar] [CrossRef]
- Cong, R.; Wei, Y.-M. Auction design for the allocation of carbon emission allowances: Uniform or discriminatory price? Int. J. Energy Environ. 2010, 1, 533–546. [Google Scholar]
- Cong, R.-G.; Wei, Y.-M. Experimental comparison of impact of auction format on carbon allowance market. Renew. Sustain. Energy Rev. 2012, 16, 4148–4156. [Google Scholar] [CrossRef]
- Liu, L.; Chen, C.; Zhao, Y.; Zhao, E. China’s carbon-emissions trading: Overview, challenges and future. Renew. Sustain. Energy Rev. 2015, 49, 254–266. [Google Scholar] [CrossRef]
- Munnings, C.; Morgenstern, R.; Wang, Z.; Liu, X. Assessing the design of three pilot programs for carbon trading in China. Resour. Future 2014, 14–36. Available online: https://ideas.repec.org/p/rff/dpaper/dp-14-36.html (accessed on 25 January 2018). [CrossRef]
- Fan, J.; Li, Y.; Wu, Y.; Wang, S.; Zhao, D. Allowance trading and energy consumption under a personal carbon trading scheme: A dynamic programming approach. J. Clean. Prod. 2016, 112, 3875–3883. [Google Scholar] [CrossRef]
- Fan, J.; Wang, S.; Wu, Y.; Li, J.; Zhao, D. Buffer effect and price effect of a personal carbon trading scheme. Energy 2015, 82, 601–610. [Google Scholar] [CrossRef]
- Fan, J.; Wang, S.; Wu, Y.; Li, J.; Zhao, D. Energy-use choices and allowance trading under the personal carbon trading scheme. Nat. Resour. Model. 2015, 28, 1–17. [Google Scholar] [CrossRef]
- Li, J.; Fan, J.; Zhao, D.; Wang, S. Allowance price and distributional effects under a personal carbon trading scheme. J. Clean. Prod. 2015, 103, 319–329. [Google Scholar] [CrossRef]
- Hu, G.; Rong, K.; Shi, Y.; Yu, J. Sustaining the emerging carbon trading industry development: A business ecosystem approach of carbon traders. Energy Policy 2014, 73, 587–597. [Google Scholar] [CrossRef]
- Lo, A.Y.; Howes, M. Powered by the state or finance? The organization of China’s carbon markets. Eurasian Geogr. Econ. 2013, 54, 386–408. [Google Scholar]
- Shen, W. Chinese business at the dawn of its domestic emissions trading scheme: Incentives and barriers to participation in carbon trading. Clim. Policy 2015, 15, 339–354. [Google Scholar] [CrossRef]
- Springer, U. The market for tradable GHG permits under the Kyoto protocol: A survey of model studies. Energy Econ. 2003, 25, 527–551. [Google Scholar] [CrossRef]
- Christiansen, A.C.; Arvanitakis, A.; Tangen, K.; Hasselknippe, H. Price determinants in the EU emissions trading scheme. Clim. Policy 2005, 5, 15–30. [Google Scholar] [CrossRef]
- Kanen, J.L. Carbon Trading and Pricing; Environmental Finance Publications: London, UK, 2006. [Google Scholar]
- Bunn, D.W.; Fezzi, C. Interaction of European Carbon Trading and Energy Prices; Social Science Electronic Publishing: Rochester, NY, USA, 2007. [Google Scholar]
- Convery, F.J.; Redmond, L. Market and price developments in the European Union emissions trading scheme. Rev. Environ. Econ. Policy 2007, 1, 88–111. [Google Scholar] [CrossRef]
- Mansanet-Bataller, M.; Pardo, A.; Valor, E. CO2 prices, energy and weather. Energy J. 2007, 73–92. [Google Scholar] [CrossRef]
- Alberola, E.; Chevallier, J.; Chèze, B.T. Price drivers and structural breaks in European carbon prices 2005–2007. Energy Policy 2008, 36, 787–797. [Google Scholar] [CrossRef]
- Creti, A.; Jouvet, P.-A.; Mignon, V. Carbon price drivers: Phase I versus phase II equilibrium? Energy Econ. 2012, 34, 327–334. [Google Scholar] [CrossRef]
- Aatola, P.; Ollikainen, M.; Toppinen, A. Price determination in the EU ETS market: Theory and econometric analysis with market fundamentals. Energy Econ. 2013, 36, 380–395. [Google Scholar] [CrossRef]
- Doytch, N.; Uctum, M. Globalization and the environmental impact of sectoral FDI. Econ. Syst. 2016, 40, 582–594. [Google Scholar] [CrossRef]
- Yang, B.; Liu, C.; Su, Y.; Jing, X. The allocation of carbon intensity reduction target by 2020 among industrial sectors in China. Sustainability 2017, 9, 148. [Google Scholar] [CrossRef]
- Zhang, X. Analysis of carbon market volume and coverage in pilot regions. China Econ. Trade Herald 2014, 29, 4–6. (In Chinese) [Google Scholar]
- Environomist China Carbon Market Reasearch Report 2017. Available online: http://www.environomist.com/upload/file/20170216171434_40.pdf (accessed on 15 March 2017).
- Wang, X.; Fan, G.; Yu, J. China Provinces Marketization Index Report; Social Science Literature Press: Beijing, China, 2016; pp. 214–218. ISBN 978-7-5201-0022-9. (In Chinese) [Google Scholar]
Figure 1.
Trends in carbon prices.

Figure 2.
Trends in carbon prices.

Figure 3.
Trends in carbon prices.
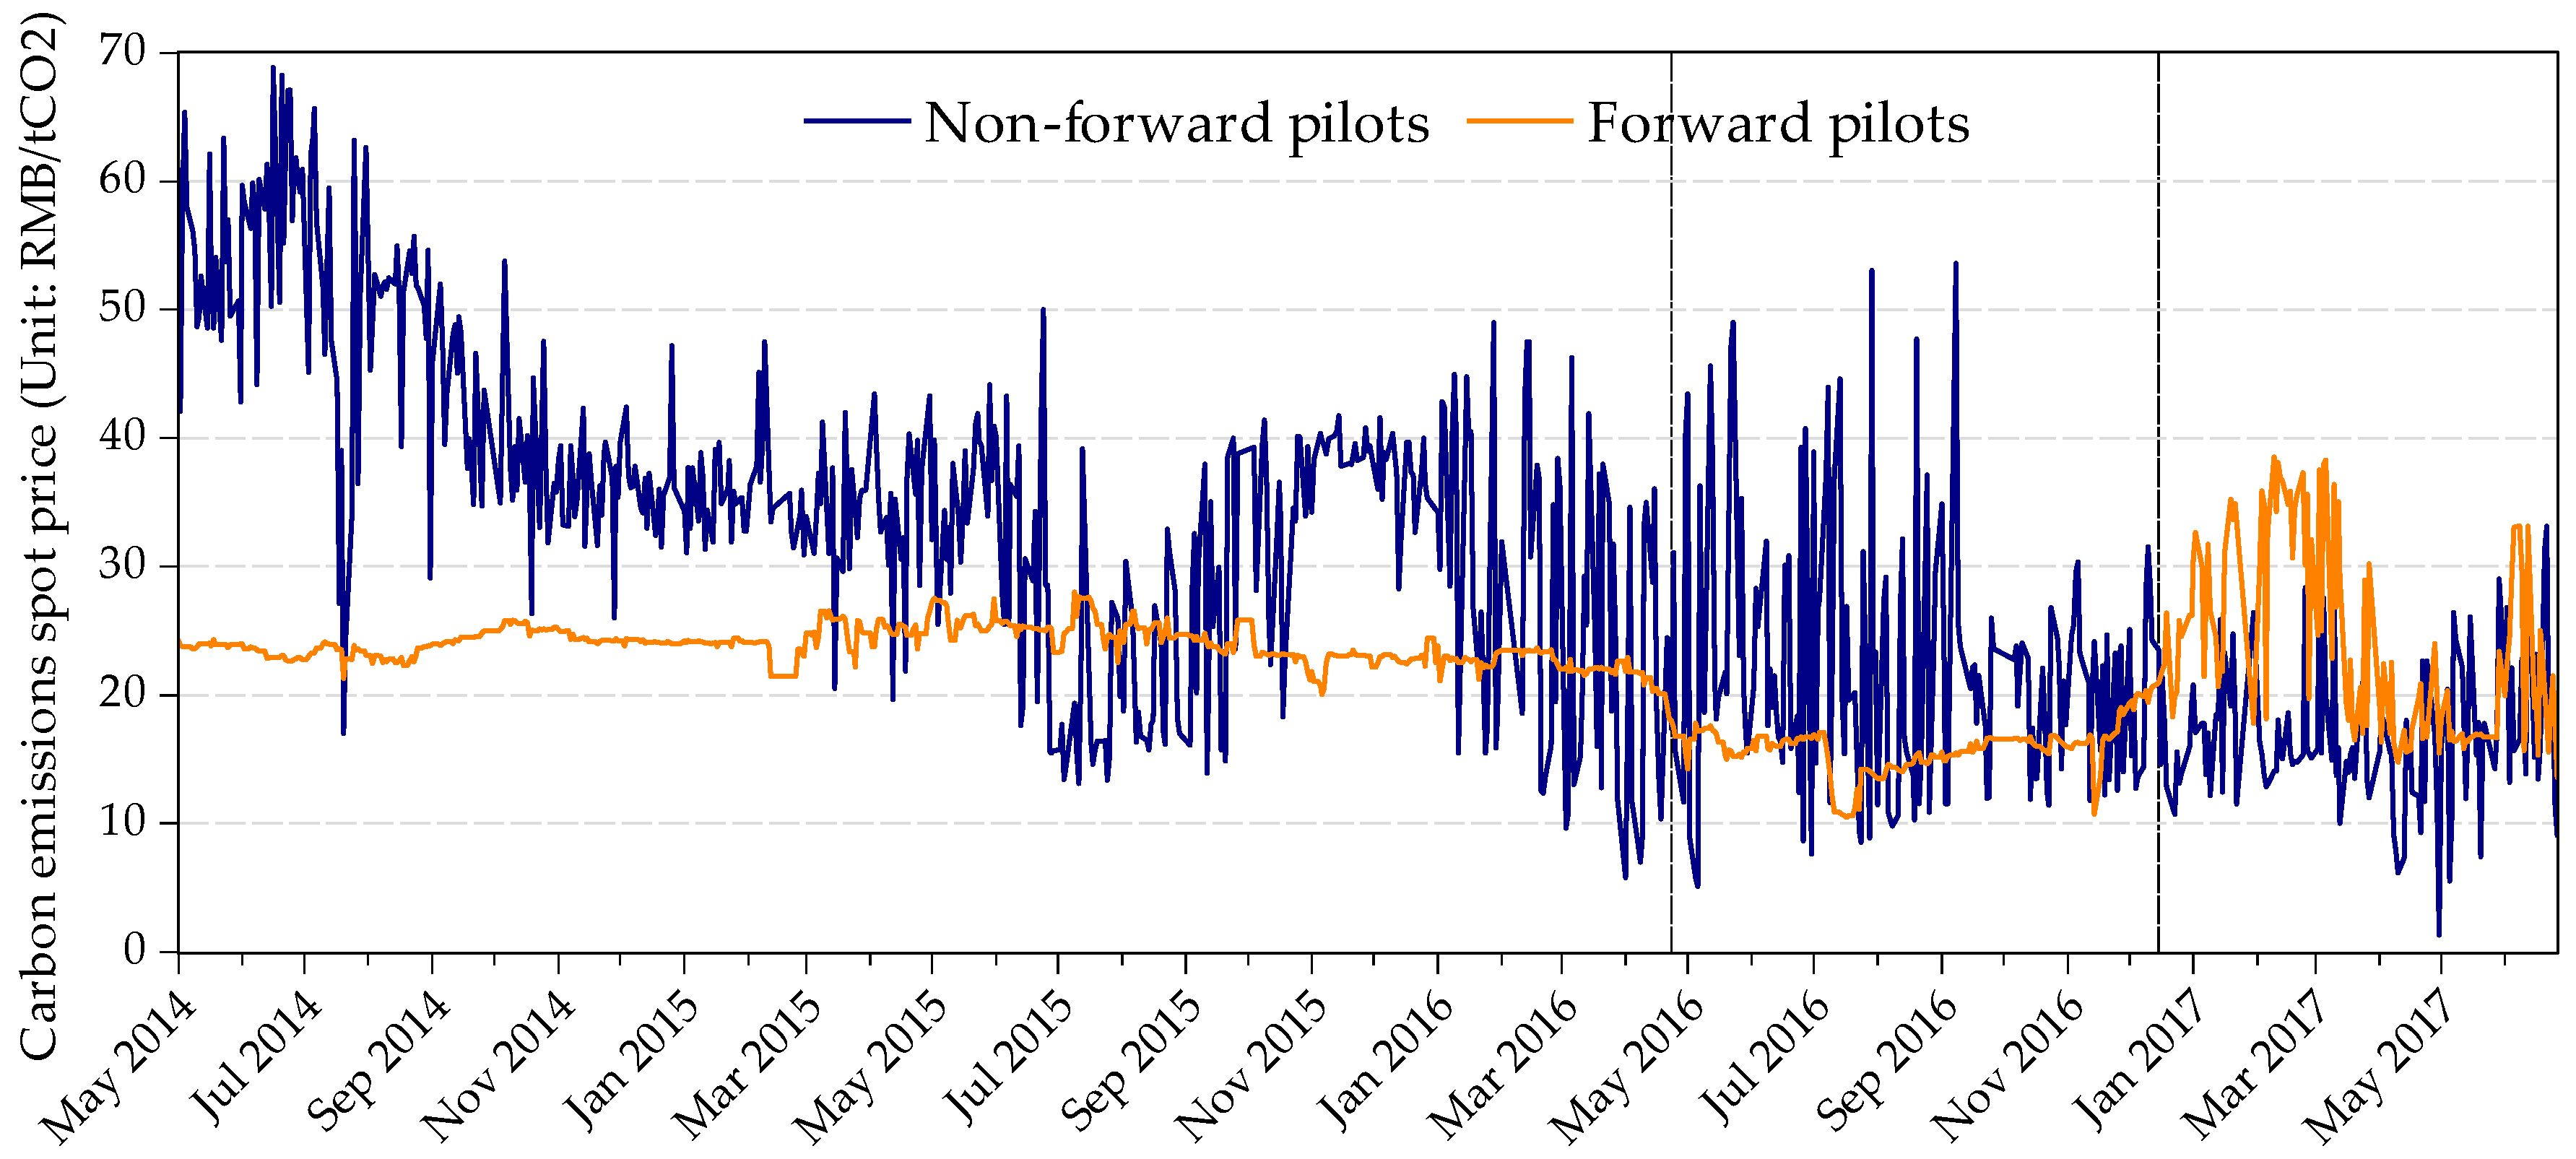
Figure 4.
Monthly turnover ratio of Beijing.
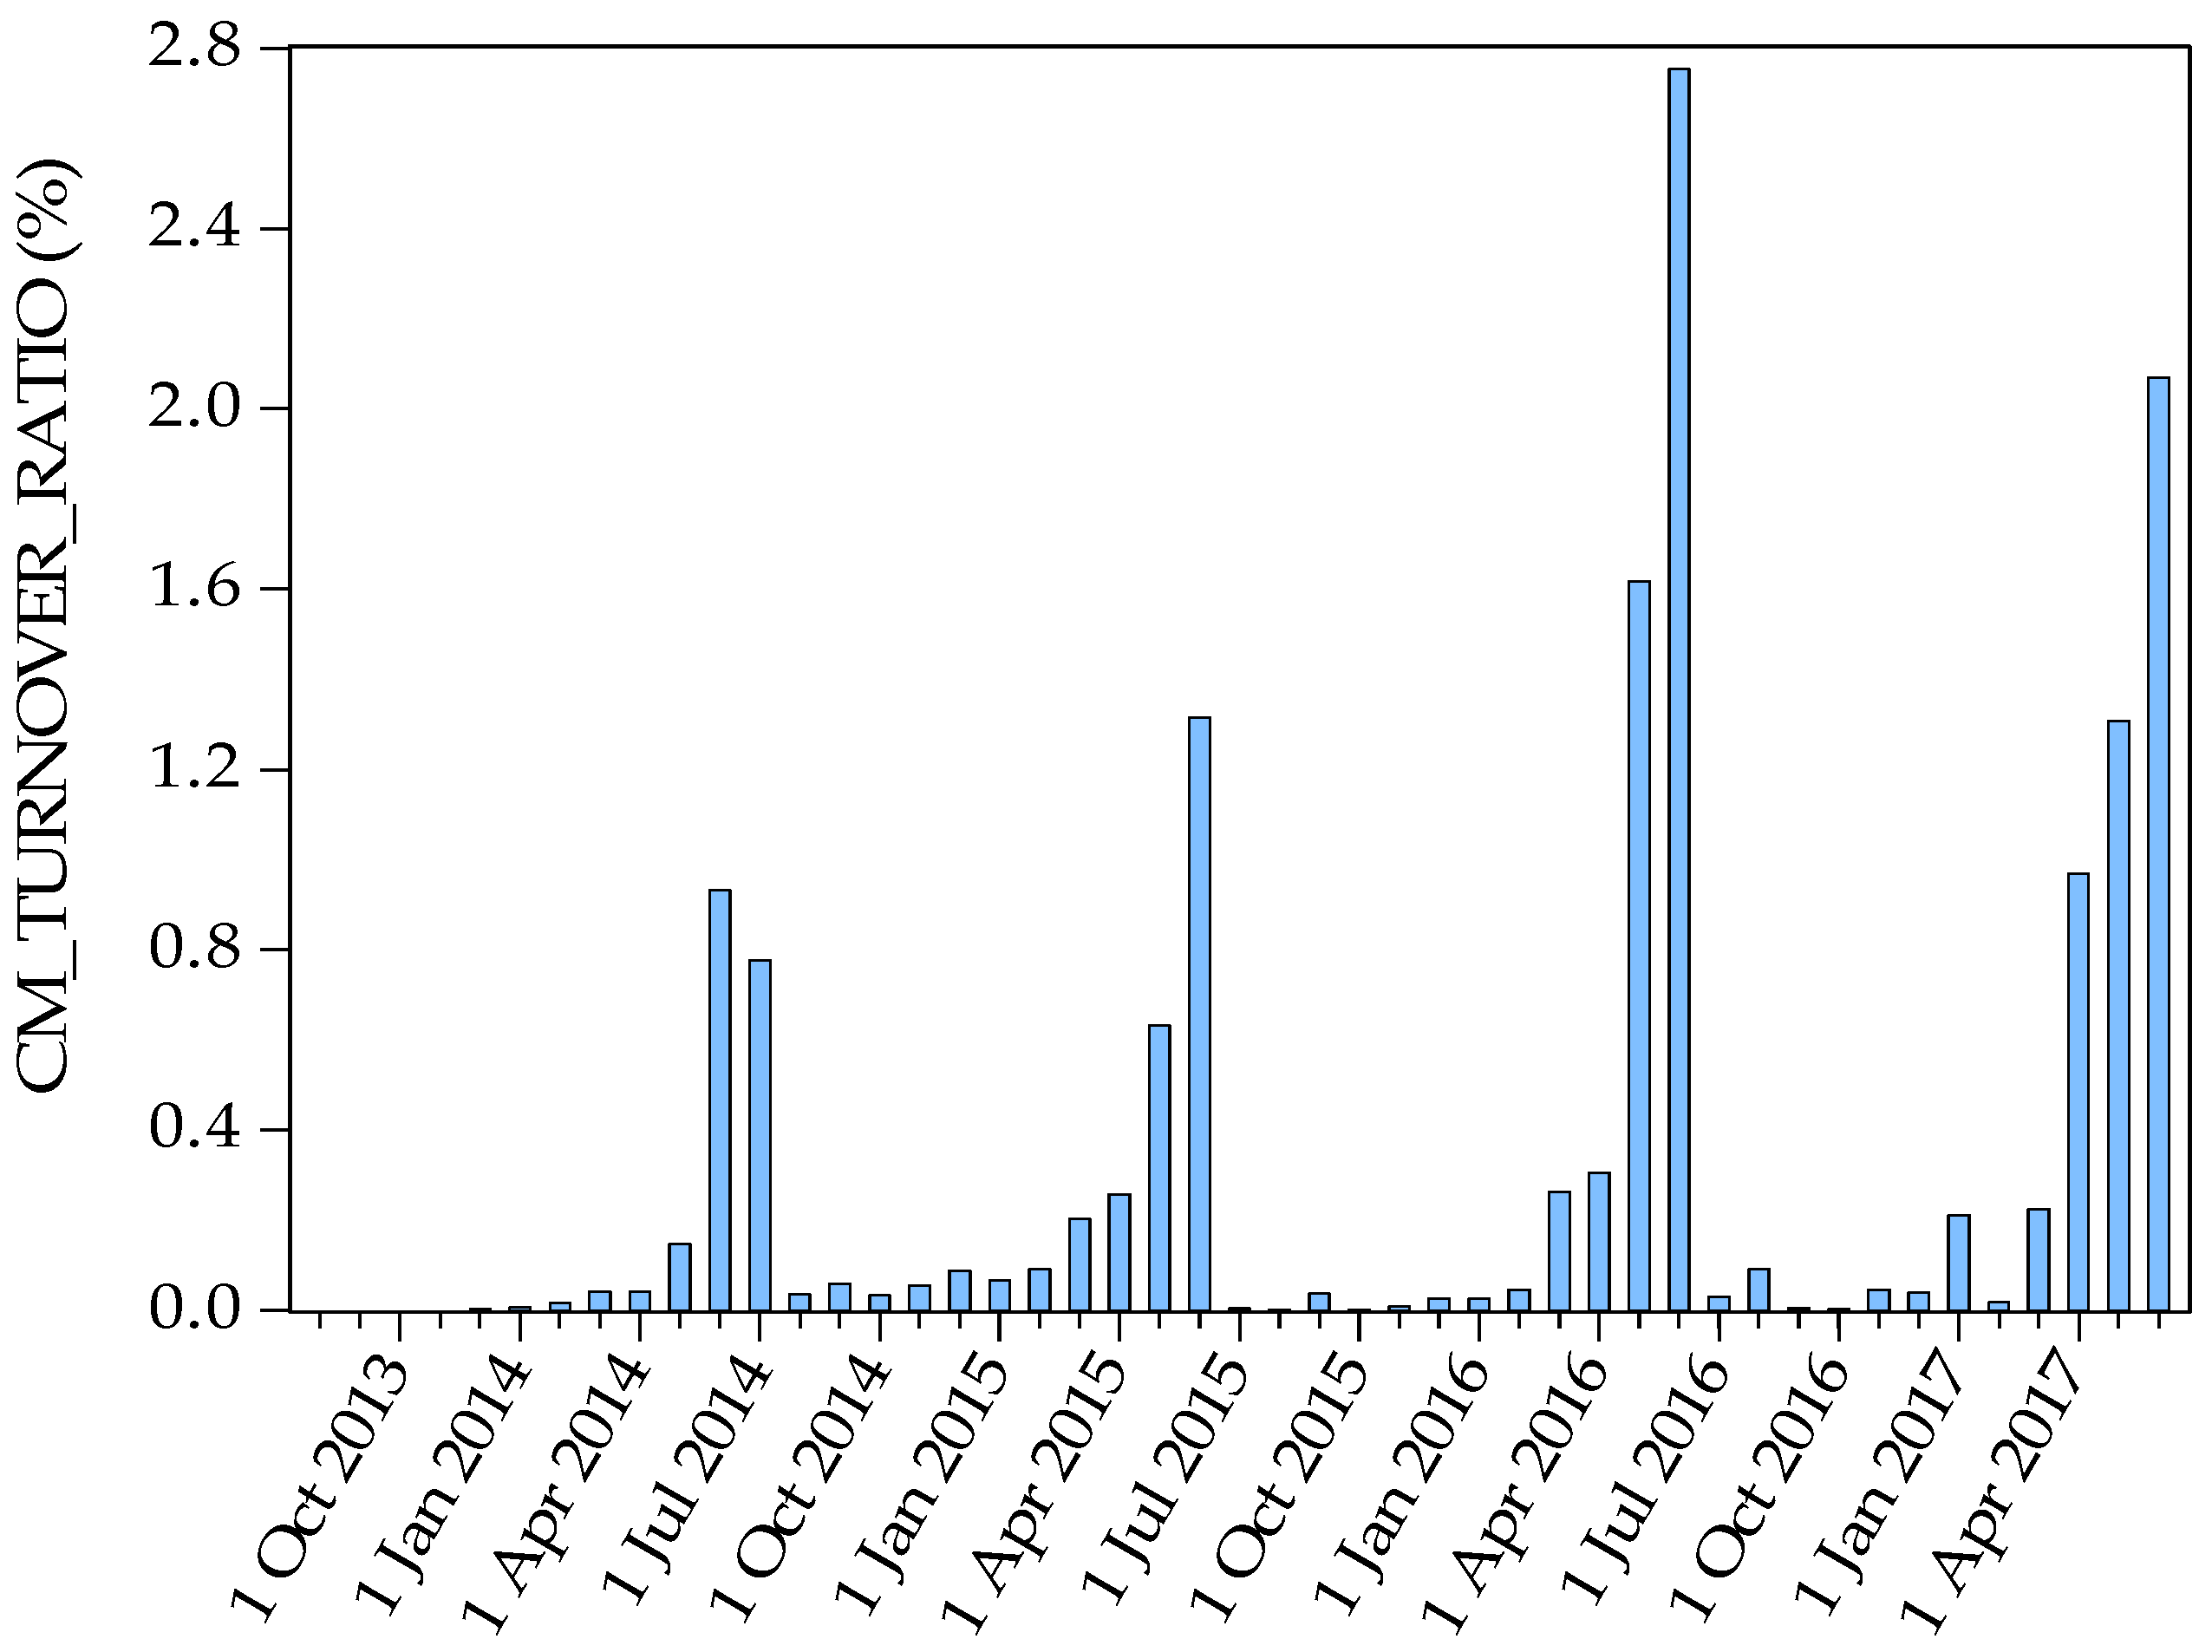
Figure 5.
Monthly turnover ratio of Guangdong.

Figure 6.
Monthly turnover ratio of Chongqing.
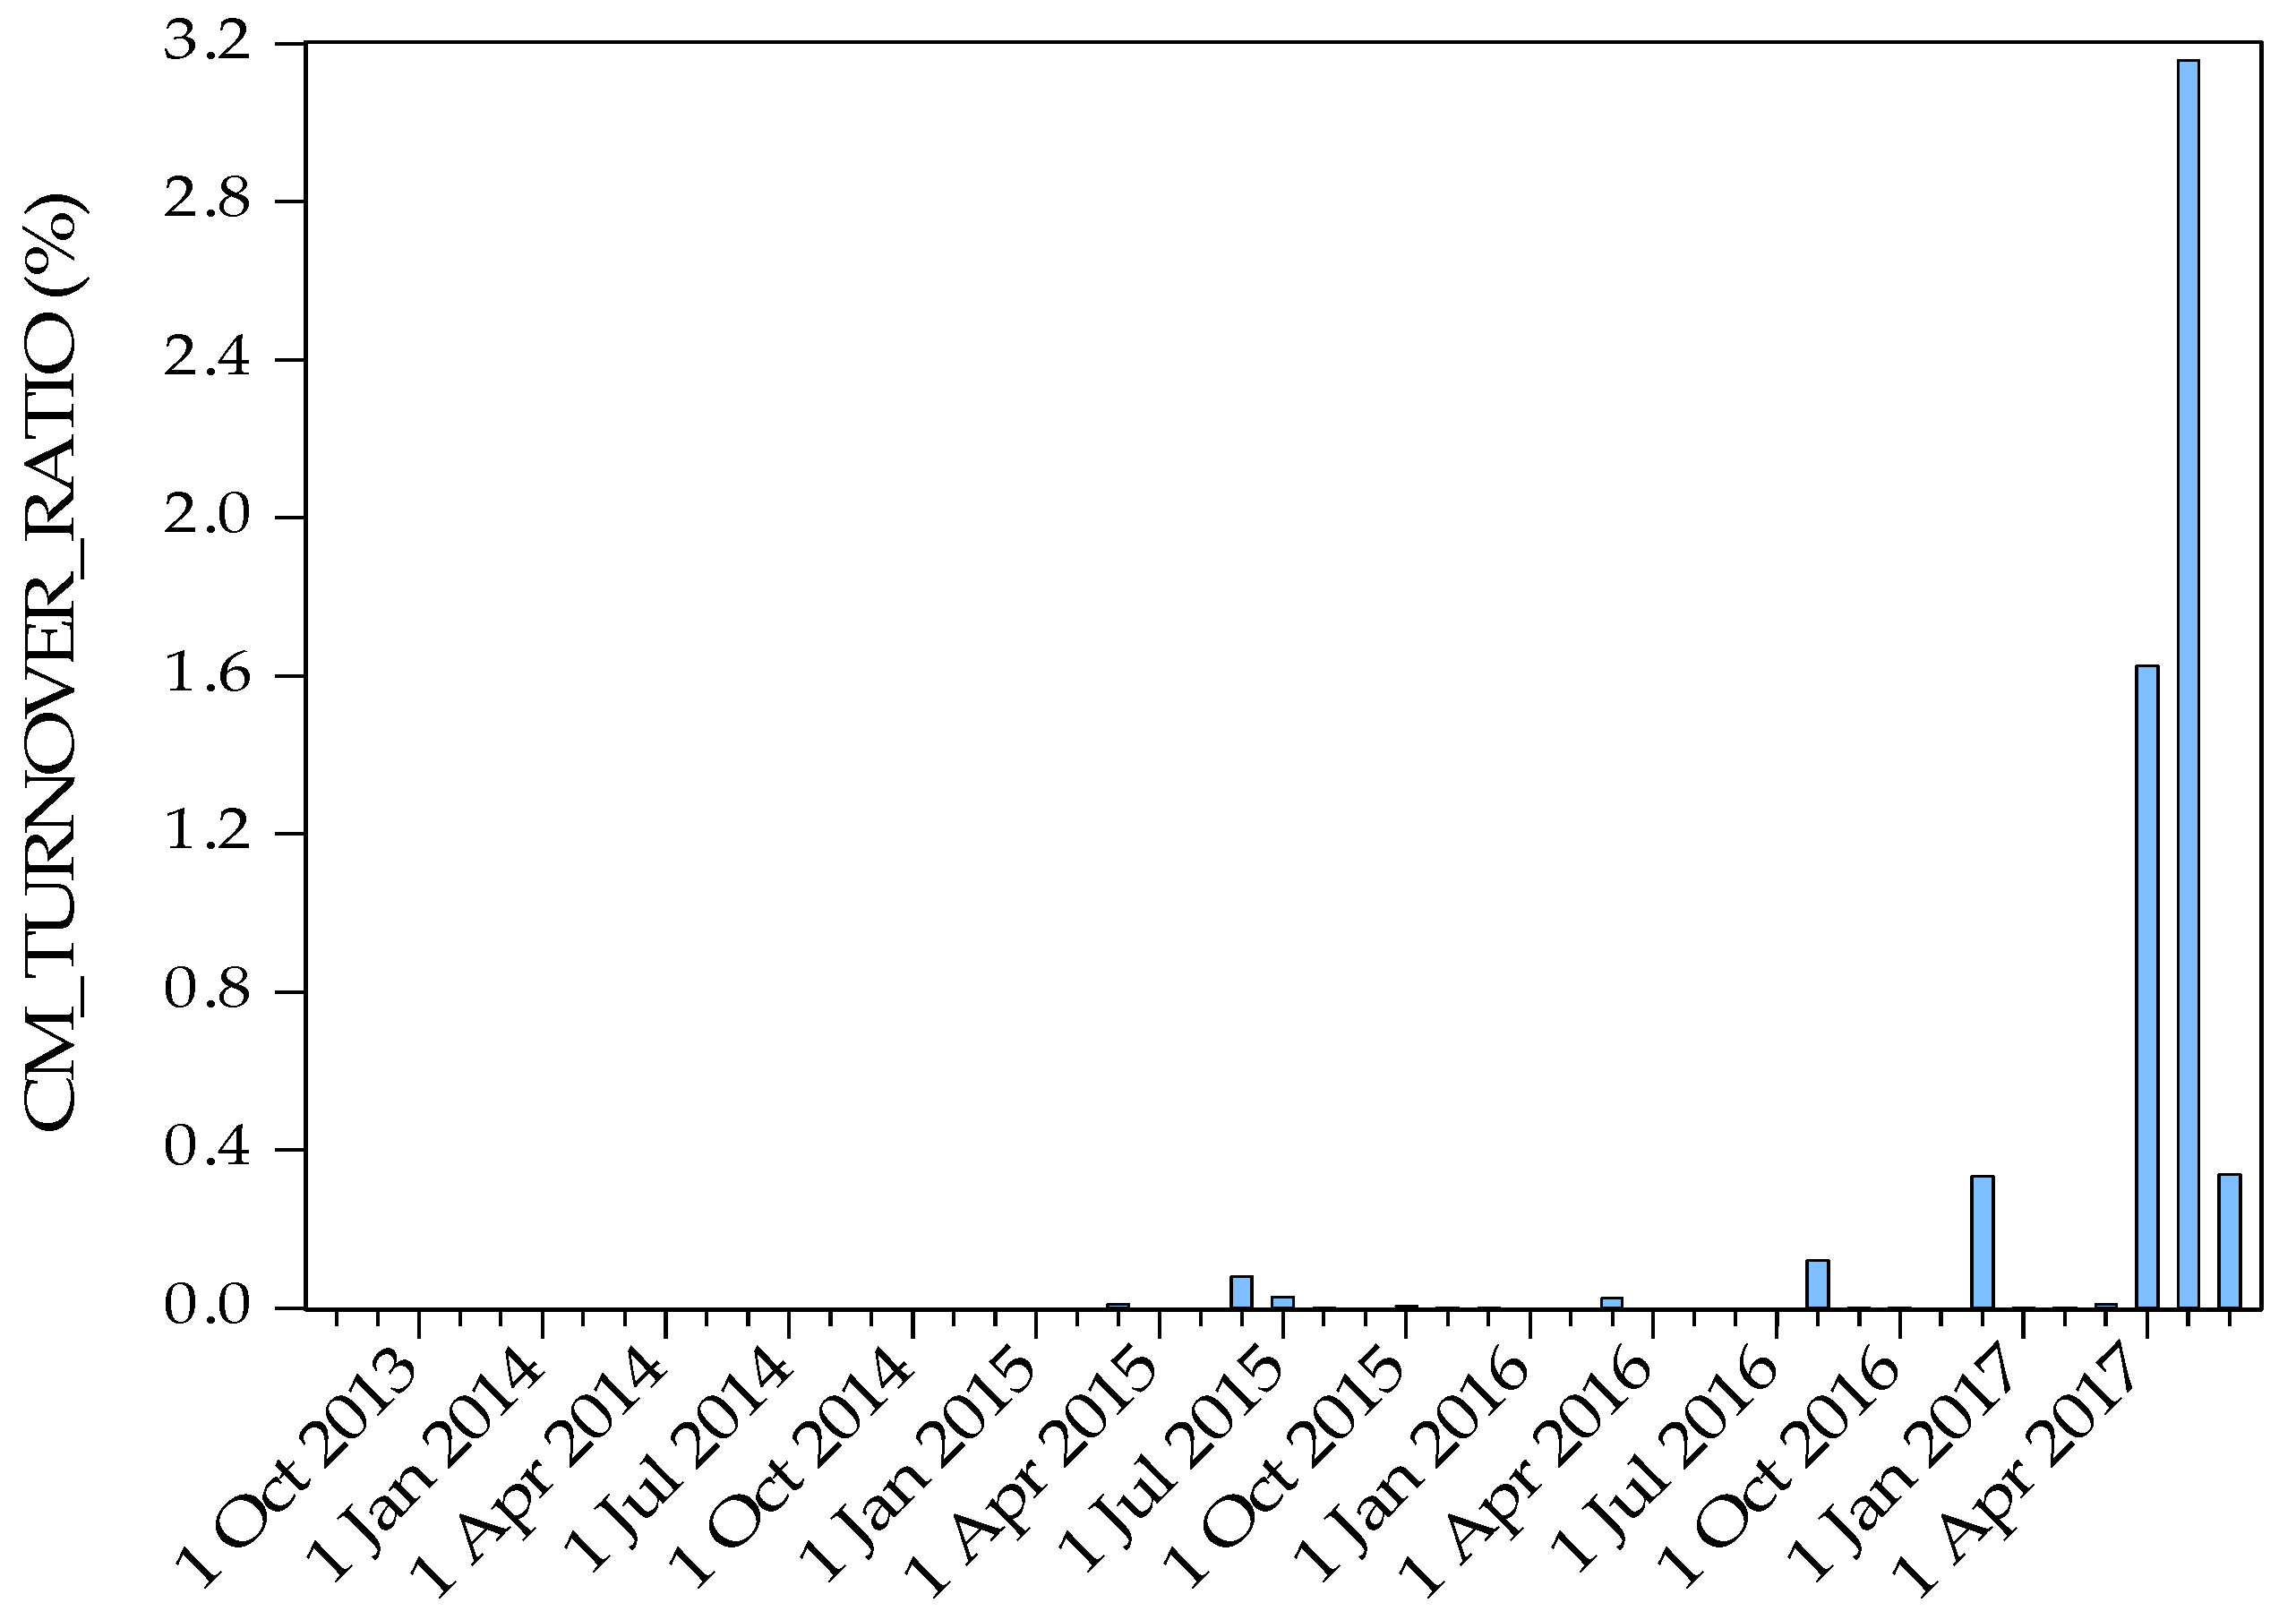
Figure 7.
Monthly turnover ratio of Tianjin.

Figure 8.
Monthly turnover ratio of Hubei.

Figure 9.
Monthly turnover ratio of Shenzhen.

Table 1.
Free carbon allowance amount and Covered enterprise number.
| 2013–2014 | 2014–2015 | 2015–2016 | 2016–2017 | 2017–2018 | ||
|---|---|---|---|---|---|---|
| Beijing | ALLOWANCE | 55 | 47 | 47 | 46 | unpublished |
| E_NO | 415 | 543 | 543 | 947 | ||
| Tianjin | ALLOWANCE | 100 | 160 | 160 | 160 | |
| E_NO | 114 | 112 | 109 | 109 | ||
| Shanghai | ALLOWANCE | 160 | 160 | 160 | 155 | |
| E_NO | 191 | 191 | 191 | 310 | ||
| Hubei | ALLOWANCE | - | 324 | 281 | 253 | |
| E_NO | - | 138 | 138 | 236 | ||
| Chongqing | ALLOWANCE | - | 125 | 105 | 96 | |
| E_NO | - | 242 | 254 | 254 | ||
| Guangdong | ALLOWANCE | 388 | 408 | 408 | 422 | 422 |
| E_NO | 242 | 193 | 189 | 244 | 246 | |
| Shenzhen | ALLOWANCE | 33 | 33 | 33 | 33 | unpublished |
| E_NO | 832 | 833 | 832 | 824 |
Table 2.
Descriptive statistics of baseline sample.
| Mean | Std. Dev. | Min. | Max. | Obs. | |
|---|---|---|---|---|---|
| P (RMB/tCO2) | 32.29 | 17.55 | 1.00 | 122.97 | 4011 |
| CPI (last month equals 100) | 101.94 | 0.75 | 99.84 | 103.80 | 4011 |
| IAV (100 million RMB) | 55.12 | 27.72 | 12.89 | 110.04 | 3860 |
| IAV_YOY (%) | 7.59 | 4.72 | −7.00 | 21.82 | 3622 |
| COAL_PRICE | 142.99 | 10.25 | 118.60 | 168.30 | 4011 |
| ELE_COAL_PRICE (RMB/ton) | 468.57 | 90.44 | 300.92 | 669.03 | 3857 |
| NG_PRICE (RMB/m3) | 3.77 | 0.59 | 2.86 | 4.54 | 4011 |
| ELEC_PRICE (RMB/MWh) | 459.84 | 90.44 | 351.40 | 658.00 | 4011 |
| CHINESE_DS (RMB/MWh) | 298.12 | 103.65 | 148.69 | 587.50 | 3857 |
| ALLOWANCE (million ton) | 173.10 | 136.63 | 33.00 | 422.00 | 4011 |
| E_NO (number) | 418 | 320 | 109 | 1100 | 4011 |
| AUCTION_PRICE (RMB/tCO2) | 30.72 | 12.93 | 9.88 | 60.00 | 2512 |
Notes: The sample is at all the seven pilot regions.
Table 3.
Summary of auction in seven pilots.
| Time | Average Price | |
|---|---|---|
| Beijing | No auction | |
| Tianjin | No auction | |
| Shanghai | 30 June 2014 | 48 RMB/tCO2 |
| 30 June 2017 | 38.77 RMB/tCO2 | |
| Hubei | 31 March 2014 | 20 RMB/tCO2 |
| Chongqing | No auction | |
| Guangdong | 16 December 2013 | 60 RMB/tCO2 |
| 6 January 2014 | 60 RMB/tCO2 | |
| 28 February 2014 | 60 RMB/tCO2 | |
| 3 April 2014 & 17 April 2014 & 5 May 2014 | 60 RMB/tCO2 | |
| 25 June 2014 | 60 RMB/tCO2 | |
| 26 September 2014 | 26 RMB/tCO2 | |
| 22 December 2014 | 30 RMB/tCO2 | |
| 27 March 2015 | 35 RMB/tCO2 | |
| 10 June 2015 | 40 RMB/tCO2 | |
| 21 September 2015 | 16.1 RMB/tCO2 | |
| 21 December 2015 | 15 RMB/tCO2 | |
| 29 March 2016 | 12.69 RMB/tCO2 | |
| 28 June 2016 | Auction closed | |
| 21 September 2016 | 9.88 RMB/tCO2 | |
| 4 January 2017 | 15 RMB/tCO2 | |
| 27 March 2017 | 16.5 RMB/tCO2 | |
| 5 June 2017 | Auction closed | |
| Shenzhen | 6 June 2014 | 35.43 RMB/tCO2 |
Note: Information is collected from policy documents and issued news.
Table 4.
Main results about alternative control variables on carbon price.
| Coefficient | t-Values | R2 | ||
|---|---|---|---|---|
| Economic variable | CPI | 0.2042 *** | (13.2064) | 0.0400 |
| IAV | −0.4388 *** | (−29.8800) | 0.1875 | |
| IAV_YOY | 0.1992 *** | (11.8996) | 0.0372 | |
| Energy variable | COAL_PRICE | 0.2109 *** | (13.6641) | 0.0445 |
| ELE_COAL_PRICE | 0.0692 *** | (5.7866) | 0.4986 | |
| NG_PRICE | 0.1305 *** | (8.3358) | 0.0170 | |
| ELEC_PRICE | 0.3395 *** | (22.8545) | 0.1152 | |
| CHINESE_DS | 0.2420 *** | (16.6604) | 0.0615 | |
| Climate condition variables | T_H | 0.0195 | (0.6005) | — |
| T_L | 0.2949 *** | (5.4257) | 0.0073 | |
| C-CETP’s characteristic variables | ALLOWANCE | −0.5360 *** | (−40.2058) | 0.2873 |
| E_NO | 0.5982 *** | (47.2654) | 0.3578 |
Notes: *** Significant at p < 0.01 level.
Table 5.
Main results on principal components.
| Principal Component | Original Variables | Cumulative | Coefficient | R2 on Carbon Price | |
|---|---|---|---|---|---|
| Category 1: Economic and industrial development level | F1: ECON1 | CPI, IAV, IAV_YOY | 38.0% | 0.1671 *** (9.92) | 0.03 |
| F2: ECON2 | 37.6% | −0.4955 *** (−33.16) | 0.23 | ||
| Category 2: Energy and power | F3: ENERGY1 | COAL_PRICE, ELE_COAL_PRICE, NG_PRICE, ELEC_PRICE, CHINESE_DS | 51.8% | 0.2186 *** (14.95) | 0.05 |
| F4: ENERGY2 | 37.2% | 0.0102 (0.68) | — | ||
| Category 3: Climate condition | F5: CLIMATE | T_L | 100% | 0.2949 *** (5.43) | 0.0073 |
| Category 4: C-CETP’s characteristic | F6: CHARACTERISTIC | ALLOWANCE, E_NO | 85.2% | −0.6142 *** (−49.29) | 0.38 |
Notes: T values are shown in brackets. *** Significant at p < 0.01 level.
Table 6.
Estimated effect of the carbon price caused by auction based on DID.
| (1) | (2) | (3) | (4) | (5) | |
|---|---|---|---|---|---|
| AUCTION × TIME | −0.7567 *** (−15.1592) | −0.8941 *** (−18.1354) | −0.8911 *** (−17.7894) | −0.8903 *** (−17.7635) | −0.7998 *** (−16.4333) |
| Observations | 4011 | 3622 | 3468 | 3468 | 3468 |
| R2 | 0.8130 | 0.8613 | 0.8392 | 0.8392 | 0.8510 |
| Time fixed effects | Y | Y | Y | Y | Y |
| Region fixed effects | Y | Y | Y | Y | Y |
| F2 | N | Y | Y | Y | Y |
| F3 | N | N | Y | Y | Y |
| F5 | N | N | N | Y | Y |
| F6 | N | N | N | N | Y |
Notes: Column (1) includes only time and region fixed effects without additional covariates, while column (2) adds economic characteristics, column (3) additionally includes energy characteristics, column (4) additionally includes climate characteristics and column (5) additionally includes C-CETP’s characteristics. T values are shown in brackets. *** Significant at p < 0.01 level.
Table 7.
Estimated effect of the carbon price caused by auction price.
| (1) | (2) | (3) | (4) | (5) | |
|---|---|---|---|---|---|
| AUCTION_PRICE | 0.3565 *** (19.9480) | 0.2725 *** (14.5789) | 0.2860 *** (16.1906) | 0.2838 *** (16.0522) | 0.2226 *** (11.2830) |
| Observations | 2512 | 2292 | 2292 | 2292 | 2292 |
| R2 | 0.7837 | 0.8180 | 0.8381 | 0.8386 | 0.8433 |
| Time fixed effects | Y | Y | Y | Y | Y |
| Region fixed effects | Y | Y | Y | Y | Y |
| F2 | N | Y | Y | Y | Y |
| F3 | N | N | Y | Y | Y |
| F5 | N | N | N | Y | Y |
| F6 | N | N | N | N | Y |
Notes: the same as Table 6.
Table 8.
Estimated effect of the carbon price caused by participant based on DID.
| (1) | (2) | (3) | (4) | (5) | |
|---|---|---|---|---|---|
| INV_ACC_IIT × TIME | 0.6739 *** (18.2847) | 0.4182 *** (10.8077) | 0.3526 *** (8.9237) | 0.3554 *** (8.9852) | 0.1047 *** (2.4416) |
| Observations | 4011 | 3622 | 3468 | 3468 | 3468 |
| R2 | 0.8188 | 0.8507 | 0.8249 | 0.8250 | 0.8358 |
| Time fixed effects | Y | Y | Y | Y | Y |
| Region fixed effects | Y | Y | Y | Y | Y |
| F2 | N | Y | Y | Y | Y |
| F3 | N | N | Y | Y | Y |
| F5 | N | N | N | Y | Y |
| F6 | N | N | N | N | Y |
Notes: the same as Table 6.
Table 9.
Estimated effect of the carbon price caused by carbon forward based on DID.
| (1) | (2) | (3) | (4) | (5) | |
|---|---|---|---|---|---|
| FORWARD × TIME | 0.4875 *** (12.7380) | 0.3314 *** (8.4487) | 0.3175 *** (7.0799) | 0.3184 *** (7.0991) | 0.1923 *** (4.3752) |
| Observations | 4011 | 3622 | 3468 | 3468 | 3468 |
| R2 | 0.8091 | 0.8482 | 0.8229 | 0.8230 | 0.8366 |
| Time fixed effects | Y | Y | Y | Y | Y |
| Region fixed effects | Y | Y | Y | Y | Y |
| F2 | N | Y | Y | Y | Y |
| F3 | N | N | Y | Y | Y |
| F5 | N | N | N | Y | Y |
| F6 | N | N | N | N | Y |
Notes: the same as Table 6.
Table 10.
Verification period summary.
| 2013–2014 | 2014–2015 | 2015–2016 | 2016–2017 | |
|---|---|---|---|---|
| Beijing | original provision: before 15 June 2014; actually: 4 July 2014 | original provision: 15 June 2015; actually: 30 June 2015 | 15–25 June 2016 | original provision: 15 June 2017; actually: 5 July 2017 |
| Tianjin | 10 June–10 July 2014 | before 10 July 2015 | Before 30 June 2016 | Before 30 June 2017 |
| Shanghai | 1–30 June 2014 | before 30 June 2015 | Before 30 June 2016 | Before 30 June 2017 |
| Hubei | — | Before 31 July 2015 | Before 25 July 2016 | original provision: 31 May 2017; actually: 31 July 2017 |
| Chongqing | — | Before 23 July 2015 | 17 October–18 November 2016 | 15 September–31 October 2017 |
| Guangdong | original provision: before 20 June 2014; actually: 15 July 2014 | original provision: before 23 June 2015; actually: 4 July 2015 | Before 20 June 2016 | Before 20 June 2017 |
| Shenzhen | Before 30 June 2014 | Before 30 June 2015 | Before 1 July 2016 | Before 30 June 2017 |
Notes: Data is collected from the policy documents by us.
Table 11.
Estimated effects of carbon price’s periodicity in the seven pilot regions.
| Beijing | Tianjin | Shanghai | Hubei | Chongqing | Guangdong | Shenzhen | |
|---|---|---|---|---|---|---|---|
| VER_PERIOD | 0.3413 *** (9.3071) | −0.3533 *** (−11.8419) | −0.1387 ** (−2.1180) | −0.1464 (−7.8612) | 2.1647 *** (3.0021) | 3.7516 *** (3.1222) | 7.0732(1.6610) |
| Observations | 487 | 385 | 417 | 651 | 134 | 580 | 814 |
| F2 | Y | Y | Y | Y | Y | Y | Y |
| F3 | Y | Y | Y | Y | Y | Y | Y |
| F5 | Y | Y | Y | Y | Y | Y | Y |
| F6 | Y | Y | Y | Y | Y | Y | Y |
Notes: T values are shown in brackets; ** Significant at p < 0.05 level, *** Significant at p < 0.01 level.
Table 12.
Heterogeneity in effect.
| Policy Variable | |||
|---|---|---|---|
| AUCTION | INV_ACC_IIT | FORWARD | |
| Energy-intensive industry concentrated pilots | −1.1705 *** | −1.3850 *** | −0.6481 *** |
| (0.0636) | (0.0622) | (0.0474) | |
| The third industry concentrated pilots | −1.5498 *** | 0.1071 | 0.7588 *** (0.1059) |
| (0.0450) | (0.0783) | ||
| High marketization degree pilots | −1.3390 *** | −0.4199 *** | 0.6248 *** (0.0873) |
| (0.0446) | (0.0532) | ||
| Low marketization degree pilots | −1.7066 ** | −1.7066 ** | −0.5651 ** |
| (0.8076) | (0.8076) | (0.2413) | |
Notes: Each cell reports the coefficient and standard errors in the parentheses from separate regressions for respective subsample. Only Hubei Province is tested for the policy of FORWARD, so the second and third cells in the last column do not have results. ** Significant at p < 0.05 level. *** Significant at p < 0.01 level.
Table 13.
Robustness checks.
| Specifications | AUCTION | INV_ACC_IIT | FORWARD |
|---|---|---|---|
| Eliminate outliers | −1.1920 *** | 0.4032 *** | 0.1408 *** |
| (0.0434) | (0.0417) | (0.0467) | |
| Only northern China | — | 0.2457 *** | — |
| (0.0480) | |||
| Only southern China | −1.3487 *** | 1.8333 *** | 0.2925 *** |
| (0.0428) | (0.0951) | (0.0714) |
Notes: Each cell reports the coefficient and standard errors in the parentheses. *** Significant at p < 0.01 level. These regressions consider the fixed effect.
© 2018 by the authors. Licensee MDPI, Basel, Switzerland. This article is an open access article distributed under the terms and conditions of the Creative Commons Attribution (CC BY) license (http://creativecommons.org/licenses/by/4.0/).
Share and Cite
MDPI and ACS Style
Yang, B.; Liu, C.; Gou, Z.; Man, J.; Su, Y. How Will Policies of China’s CO2 ETS Affect its Carbon Price: Evidence from Chinese Pilot Regions. Sustainability 2018, 10, 605. https://doi.org/10.3390/su10030605
AMA Style
Yang B, Liu C, Gou Z, Man J, Su Y. How Will Policies of China’s CO2 ETS Affect its Carbon Price: Evidence from Chinese Pilot Regions. Sustainability. 2018; 10(3):605. https://doi.org/10.3390/su10030605
Chicago/Turabian StyleYang, Baochen, Chuanze Liu, Zehao Gou, Jiacheng Man, and Yunpeng Su. 2018. "How Will Policies of China’s CO2 ETS Affect its Carbon Price: Evidence from Chinese Pilot Regions" Sustainability 10, no. 3: 605. https://doi.org/10.3390/su10030605
Note that from the first issue of 2016, this journal uses article numbers instead of page numbers. See further details here.