Analysis and Evaluation of the Largest 500 Family Firms’ Websites through PLS-SEM Technique


Department of Business and Sociology, University of Extremadura, Badajoz 06006, Spain
*
Author to whom correspondence should be addressed.
Sustainability 2018, 10(2), 557; https://doi.org/10.3390/su10020557
Submission received: 25 January 2018
/
Revised: 9 February 2018
/
Accepted: 21 February 2018
/
Published: 23 February 2018
Abstract
:As few studies relate the technical aspects of a corporate website to a firm’s turnover, this paper aims to examine how the quality of a corporate website influences social networks and the company’s turnover in large family firms. The moderating and mediating effect of social networks on the relationships between website quality and turnover are also tested. In addition, the paper performs a multigroup analysis to analyze the differences between family businesses with low and high family ownership concentration. The sample used in the study, the largest 500 family firms’ websites around the globe extracted from The Global Family Business Index compiled by the University of St. Gallen, were analyzed using partial least squares–structural equation modeling (PLS-SEM). The results indicate that both the direct and indirect effect of website quality on turnover and the moderating effect of social networks in the relationship between website quality and turnover were negative and significant. The multigroup analysis reveals some significant differences between both groups. The study contributes to the evaluation of website literature by exploring a new sector of application: family businesses. Moreover, the largest family firms should improve their presence in social networks to increase their sales.
1. Introduction
Organizations communicate with a range of audiences through a variety of channels. However, over the last two decades, the Internet has grown to be one of the basic pillars of such communication. The informative and participatory nature of the Internet has boosted company relationships with their environments, heralding the emergence of a new paradigm in which the user is actively involved in the generation of content: Web 2.0. In recent years, the development of information and communication technologies (ICTs) has been providing new means for customers to participate in co-creation experiences [1]. Nevertheless, despite the emergence and implementation of what is known as the social Web, the more traditional Web, far from receding in importance, has consolidated its position as the core of online company strategies. Therefore, assessing the effectiveness or quality of a website is important as a way to understand whether the company is providing the type and quality of information and interaction to satisfy website users [2]. However, identifying the effect of website quality on website users’ behavioral intentions, such as attitude towards using a website and purchase intention (PI), is crucial for informing managers about how website users experience the level of website quality offered by the companies [3].
With this in mind, companies must now strive to define the function and utility of the various tools that the web affords them. In this way, the majority of corporate communication processes, and sales where appropriate, are now centralized via the corporate website. Social network profiles and corporate blogs are focused on generating communities designed to enhance the overall online perception of the brand. Research indicates that people trust seemingly disinterested opinions from people outside their immediate social network, such as online reviews [4].
Additionally, access to the web currently takes place through an ever-expanding array of hardware platforms and software, both in terms of operating systems and browsers. Given this complexity, there is a need for measurement tools which enable us to assess the quality of a website according to given parameters. This need for assessment is much more evident on the Internet, where often the aim may be simply to find corporate information, perhaps as part of a communication process, a sales transaction, an order inquiry or a job application, among others. However, few studies have focused in assessing the quality of a website and its relationship with social networks, especially in a family business context, one of the most relevant kind of companies which act differently to nonfamily firms [5].
The importance of family firms in the economy of a country is an indisputable fact, even more so if we analyze the consequences of their business activities in the development of a society (e.g., [6,7]). Studies in different countries have shown that family businesses play a key role in terms of economic growth and employment generation [8]. It is estimated that these companies account for 85% of all companies worldwide, 65% of the GDP and employment in Europe, and 50% of the GDP of the US and 60% of its employment [9].
Due to its relevance, family businesses have been deeply researched in areas such as succession, entrepreneurship, management, governance, internationalization, family vs. non-family firms, etc. However, there are other fields that remain isolated and are given very little attention such as quality, marketing identity, corporate website, branding, communication strategies, social media, and so on [10]. In this context, we are going to fill the gap evaluating the quality of family businesses’ websites to shed some light on how these companies are adapting to current customers and to determine whether there are relationships between family firms’ website quality, social networks and the sales.
In addition, despite being the most prevalent type of business, family firms have received limited attention in the family involvement literature. Family involvement in ownership has been considered an important denominator for different aspects of strategic decision-making (e.g., [5,11,12,13]). Family owners have particular preferences, social interests, and objectives, as well as specific capabilities, and particular control rights over the firm’s assets [8,14]. All these may be deployed to influence decisions that shape the activities of a company [13].
In this line, comparative studies of family firms’ websites by distinguishing between companies with low and high family ownership are non-existent in the current literature. Companies with low family ownership concentration can be considered those whose ownership is less than 50 percent; on the contrary, companies with high family ownership own more than 50 percent [12,13]. The companies’ turnover and the quality of their websites, as well as their presence in social networks, can differ between family firms with low and high family ownership concentration. Therefore, based on the socioemotional wealth (SEW) theory, the current study aims to address these significant gaps in the literature by investigating and comparing between companies with low and high family ownership, in terms of the quality of their websites, as well as the effects of the quality of their websites on their presence in social networks and on their turnover. This would constitute an invaluable contribution to the business literature, especially to the family business literature. This study is particularly valuable given the fact that analysis is carried out in the largest 500 family firms around the globe.
Our study compares the direct effect of quality websites on companies’ turnover, the indirect effect of quality websites on companies’ turnover through social networks (i.e., the mediating role of social networks between e-quality and companies’ turnover), as well as the moderating effect of social networks between e-quality and companies’ turnover across family businesses’ websites with low and high family ownership. To the best of our knowledge, this is one of the first studies in family firm literature to compare the quality of their websites by distinguishing among low and high family ownership, thus making a unique theoretical contribution of this paper. Another contribution should focus on the causes of heterogeneity in family firms so as to better understand their behavior, especially family firm identity. Moreover, researchers have suggested that the mix of economic and noneconomic goals is a cause of heterogeneity, with the SEW theory also being an important theoretical contribution. This paper will review the family business literature from this SEW lens because it captures the essence of differentiating family business from all other firms. This allows us to explain many seemingly disparate findings under one umbrella, stressing that family firms are a distinct organizational form where noneconomic factors play a pivotal role in the managerial choices made by the firm.
Furthermore, this study uses partial least squares–structural equation modeling (PLS-SEM) [15], including a number of recently developed advanced analysis techniques, to assess both the direct and indirect relationships in the proposed model and to perform multigroup analysis (MGA) [16] for low and high family ownership comparisons. This study employs two nonparametric methods: Henseler’s MGA [17] and the permutation test [18] to perform MGA. Moreover, prior to employing these nonparametric methods, measurement invariance is assessed via the measurement invariance of composites (MICOM) approach [16], which is a more suitable approach for PLS-SEM as a composite-based analysis technique. As another contribution, this study is one of the first empirical studies in the Internet and Information Systems literature to apply these newly developed techniques. Therefore, the paper makes a methodological contribution through the use of such innovative techniques of analysis.
The remainder of this study is organized as follows. In the next section, we review the existing literature regarding websites, social network, and family firms. Following the literature review, we describe the research methodology, methods of analysis and present the results. Then, we undertake a discussion of our findings. Finally, we conclude by identifying the implications of the study’s findings and the limitations, and by suggesting the future research.
2. Theoretical Framework and Development of Hypothesis
According to our study, we can define a family firm as “one in which multiple members of the same family are involved as major owners or managers, either contemporaneously or over time. This allows for a number of variations: in the level of ownership and voting control, in the managerial roles played by family members, and in the family generation of key family members” [8]. Specifically, a family firm is an organization in which a family is involved in ownership, with the impact of this involvement on business and innovation activities occurring through a combination of social interaction, networks, knowledge sharing, family business corporate identity, values, dynamics, culture and heritage [19]. There is a consensus in the family business literature that a family can influence a firm in various ways [6,7]. For example, Astrachan, Klein and Smyrnios [6] suggest that a family can influence a business via the three dimensions of ownership, governance, and management. This study refers to the dimension of ownership to analyze it respective influence with regard to the quality of websites.
Family owners have particular preferences, social interests, and objectives, as well as specific capabilities, and particular control rights over the firm’s assets [8,14]. All these may be deployed to influence decisions that shape the activities of a company [13].
Socioemotional wealth theory is used as theoretical lenses to derive the hypotheses. The SEW model suggests that family firms are typically motivated by, and committed to, the preservation of their SEW, referring to nonfinancial aspects of family owners. In this sense, gains or losses in SEW represent the pivotal frame of reference that family-controlled firms use to make major strategic choices and policy decisions [20]. Economic performance is not the main concern of family firms and it is argued that their reference point is the preservation of socioemotional wealth [21,22,23]. The concept of socioemotional wealth refers to “the stock of affect-related value that a family derives from its controlling position in a particular firm” [24] (p. 259). SEW offers the potential to provide a better theoretical explanation of the relationship between family management and profitability [25].
The family ownership management–profitability relationship has been investigated with the help of a variety of theories, e.g., agency theory, stewardship theory, and the resource-based view [25]. These three dominant theoretical perspectives do not provide consistent theoretical predictions regarding the effect of family management on profitability, as they use divergent explanatory process and assumptions to assess the costs and benefits of family managements. We adopt the SEW perspective, which offers a possible explanation of the inconsistent predictions of other theoretical perspectives, such as agency, stewardship, and the resource-based view. Under the agency perspective, family management may reduce the agency costs. The stewardship perspective predicts that family firm create differential performance effects; and the resource-based view holds that a family management may be beneficial or detrimental.
Simply put, the SEW model suggests that family firms are typically motivated by, and committed to, the preservation of their SEW, referring to nonfinancial aspects or “affective endowments” of family owners [20]. This model was created as a general extension of behavioral agency theory, which integrates elements of prospect theory, behavioral theory of the firm, and agency theory.
There is compelling evidence of SEW’s importance in family-controlled organizations [22], such as a distinct family image in the community, the perpetuation of the family’s name, and a self-concept tied to the family and the business as an extension of the family.
2.1. Evaluation of Corporate Website Quality
The overall quality of a website can be considered from two perspectives: product quality and service quality. The reason for this is that, on the one hand, a website is simply a piece of software, while on the other hand, it offers a range of services to its users. In this vein, some authors (e.g., [26]) identify three approaches within the evaluation of electronic quality: product quality, service quality and technology acceptance.
With the aim of bringing this study to the business community, we have opted for a practical measurement instrument to apply. For this, the first group of studies was chosen, that is, we have considered the corporate websites from the perspective of a software product, since this approach allows for the rapid gathering of information on process and performance. Once this approach has been selected, the method of obtaining this measurement is defined.
2.1.1. Electronic Service Quality Evaluation Methods
There are two commonly recognized methods for the evaluation of electronic service quality: process-based methods and attribute-based methods [27]. In process-based methods, the website is assessed from the processes and events that occur during the interaction between the user and the website, i.e., by direct observation of user behavior on the website. In attribute-based methods, the website is evaluated based on the quality of the sum of the individual attributes in which it can be broken down. Among these methods, we can distinguish between those based on objective attributes (through the independent evaluation of the individual attributes involved in visiting and using a website), and those based on subjective attributes (the identification of a number of variables of perceived quality from the users’ point of view, in which their opinion is the key to evaluate the richness and quality of webpage content).
In this study, in order to standardize and simplify the measurement process, we have selected the method based on objective attributes. The reason is that one of the main objectives of the evaluation of the website quality is to measure, analyze and understand the degree of compliance of a set of features and attributes according to the established quality requirements for a given user profile and application domain.
2.1.2. Technical Characteristics of a Website
The technical characteristics of a website are those factors that must be taken into account in the design process. In practice, these include the message content, its ability to drive interactions between the website and their visitors, and the extent to which it provides rich sensory information [28]. Specifically, Cober, Brown, Keeping, and Levy [29,30] make a distinction between factors of content, form and functionality:
Content: The amount and type of useful content offered to users is a fundamental factor in corporate websites. As there are no space constraints, a greater quantity of information can be delivered to the different stakeholders and the general public. Various studies demonstrate that the amount and quality of information contained in commercial messages influence the assessment of consumer brand [31,32]. In this regard, previous research suggests that a better use of content on corporate website leads to a more positive attitude from the consumer [33].
Form: The form of communication on the Internet is one of its defining features. The design of the first websites was primarily based on text. However, technological advances, coupled with increased connection speeds, have led to a much wider variety of media being included. In short, the role of form and aesthetics in a website is often likened to the concept of intensity (vividness), and includes colour, images, sound and animation. These elements are used to deliver a more realistic sensory experience and refer to both the amplitude and the depth of the sensory information [34]. It has been demonstrated that information that is rich, interesting and colorful, positively affects consumer attitudes, and in turn, consumer behaviour [35]. In addition, further studies suggest that the design of a website, in particular the images, colours, videos and animations, influence the user’s perception of the information and its subsequent appeal [36]. Finally, it should be noted that, for some authors, the form and style of the message is correlated with a perception of credibility, i.e., the perception of the accuracy, adequacy and integrity of the information source (e.g., [37]).
Functionality: This includes the ability to interact and browse a website and use it to achieve a goal [30], the possibility of modifying the form and function of a website [34], and correctly processing information [38]. The most interactive sites are the most visited. The interactivity positively influences the subjective experience of a website [39,40]. Thus, the function of a website lies in its interactivity [34] and usability [41] converging, in the same way that designers must balance between the need to entertain and engage the user of a site with the need to accurately deliver and process the information contained therein [38]. Functionality can be defined according to a number of variables such as its degree of navigability [29], enjoyment [42] and effectiveness [43].
Furthermore, website quality does affect consumers’ perceptions of product quality. Specifically, website quality is an informational cue that can be extrinsic to the product and is most effective when two theoretical conditions are met: high product asymmetries of information and high signal credibility [44].
Based on these arguments, we suggest the following hypothesis:
Hypothesis 1 (H1).
The website quality is related to companies’ turnover.
As we mentioned before, the majority of corporate communication processes, and sales where appropriate, are now centralized via the corporate website. In addition, the corporative website should be the nerve center of the company’s global online communication strategy, so it should include the profiles of all social networks in which the company is present, for the adequate management of its communities. In fact, one of the great possibilities that Web 2.0 offers to the organization is to generate communities of users, through social networks; network effects and peer usage dramatically motivate user attitude and loyalty [45].
2.2. Social Networks
Networks are social structures composed of groups of people which are connected by one or more types of relationship, such as friendship, kinship, common interests or sharing of knowledge. To promote online strategies, we must create a group of people who are loyal to the company and to the content it disseminates, a community, a base of potential clients. Social networks allow companies to create a community so that they can interact with it, which will result in greater customer awareness and opinions to ensure their loyalty. In addition, it is an extra channel of qualified visits that will allow us to disseminate content, manage the organization’s online reputation, probe the market and sector in which the company develops its activity and improve the service and the degree of knowledge and brand recall. The strategy in social networks can be participative, through the creation of profiles and applications, or it can also be advertising, using these networks as the company’s media strategy [46].
Online businesses are provided with insights regarding customers’ behaviors, shopping experiences and expectations, and can develop successful business strategies. Customers have access to social knowledge and experiences in making more informed and accurate purchase decisions to better understand their online purchase purposes [47].
Consumers have started utilizing social networks increasingly to learn more about brands as well as visit retail websites; thus, it can be clearly stated that not incorporating social networks as a part of the marketing mix is not only poor customer service, but also a surefire way to lose consumers [48]. Additionally, information generated by social networks impact purchase intention is a positive manner [49].
Besides, in the context of family firms, they tend to rely more heavily on social networks during the recruitment process, and using social networks in the recruitment process reduces information asymmetries and ensures a better fit between the person and organizational values (which are a reflection of family values) [24].
The explosion of social networks has created an interactive and communicative global phenomenon that has enabled billions of users to connect to other individuals on Facebook and Twitter, but also with media sharing platforms such as Instagram and Pinterest. In the present study, we have analyzed the first type, the participatory strategy in the most relevant networks: Twitter, Facebook, LinkedIn, Instagram, Pinterest, YouTube, Flickr, Google-, Tumblr, Weibo and Xing. Therefore, we propose the following hypothesis:
Hypothesis 2 (H2).
The presence on social networks is related to companies’ turnover.
Relationship between Websites and Social Networks
Organizations are becoming increasingly aware that unstoppable communication from online communities is best done within their virtual spaces. Communities should be easily created based on special interest groups and users should be able to freely share their experience and knowledge within the community [45]. More and more other studies [50] are addressing the establishment of social networks of people with common interests.
In this way, the online presence of the company goes from being centralized in a single site to being built from the interaction between the corporate site and the company profiles in different social networks. On the website, the company will be presented, promoted and, in some cases, sell its products; in a blog, it will explain, generate knowledge and help the user in matters related to their sector; in social networks, the company will listen to users’ opinions, pay attention to and will talk to the customer.
Therefore, it is important to define the influence of the quality of the website on social networks and turnover. The following hypotheses are set up:
Hypothesis 3 (H3).
The website quality is related to the presence on social networks.
Hypothesis 4 (H4).
The presence on social networks mediates the effect of website quality on the company’s turnover.
Hypothesis 5 (H5).
The presence on social networks moderates the relationship between the website quality and the company’s turnover.
2.3. Family Ownership as a Moderating Role in the Multigroup Analysis
Traditionally, the focus of research has been largely about the distinctions between family and nonfamily firms [23]. However, there are also differences between family firms; they are not homogeneous organizations [51]. There is evidence that variations in the behavior and performance among family firms exists [23]. In fact, founders of family firms have different hierarchies of values divided into two dimensions: a business one and psychosocial one, where contradictory values can be found not only among founders but also inside each founder’s value hierarchy [52]. Furthermore, Melin and Nordqvist [53] identify different types of family firms based on ownership, business and family differences. Similarly, De Massis, Kotlar, Chua and Chrisman [5] discuss why family ownership may be used to explain family firms’ heterogeneity. Previous research demonstrates that the type of ownership of a company influences their goals, motivations, investment horizon, performance, diversification plans, return aspirations, uniformity of relationships, and so on (e.g., [8,12,13]).
Following a wide variety of family business studies, we can find differences among family firms using family ownership as the key indicator. For example, family firms with a higher percentage of family ownership are likely to benefit from internal relationships because of the unique organizational culture that these firms can create [12]. However, they are typically unwilling to cooperate with external partners, due to low levels of out-group trust and significant asymmetric information [54]. Schulze, Lubatkin, Dino and Buchholtz [55] also find that a high degree of family ownership can strengthen a family’s collective behaviour and reinforce the interdependence between family and nonfamily owners. A high degree of family ownership can deliver stronger collective cognition and can bond family owners together, to discuss developments and decisions affecting the family and the business [11,55]. This can support the long-lasting and stable nature of family firms, which may in turn prompt such firms to dedicate the resources necessary for innovation [56]. Salvato [57] argues that family ownership influences entrepreneurial activities, which promote entrepreneurial risk-taking [56]. The tendency of a family firm to innovate depends upon the percentage of ownership held by the family [13,54], which increases the propensity to bear the risk of investing in innovation [14]. In addition, family firms with a high concentration of family ownership might be expected to benefit more greatly from internal investment in R&D than family firms with low concentration of family ownership, due to a close alignment of interests between the owner and senior management, who are typically family members or the owner themselves [54]. Nevertheless, Chrisman and Patel [58] found that family firms invest less in R&D, and, when they do, these investments are subject to adjustments based on the performance and prior aspiration levels of the family firm. Thus, recent empirical findings point that family ownership negatively influences R&D investment; that is, it decreases the level of R&D intensity (e.g., [13,59]). Moreover, family firms with higher family involvement may pursue family-oriented goals and are willing to sacrifice economic performance in order to preserve family wealth [58], which can lead to severe conflicts with other shareholders or stakeholders. The shared goals of the owning family and the firm lead family business owners to identify more strongly with the firm as a social entity than do other types of owners, who primarily emphasize financial goals. As a result, family owners should feel a greater degree of organizational identification. They should be more concerned about the reputation of the firm and thus be more inclined than other owners to avoid reputation-damaging corporate actions [60]. Finally, Villalonga and Amit [7] suggest that ownership concentration should have a positive effect on company’s value because it alleviates the conflicts of interest between owners and managers. On the other hand, they argue that ownership concentration is the endogenous outcome of profit-maximizing decisions by current and potential shareholders, and thus it should have no effect on firm value. In spite of these two contradictory positions, these authors confirm in their study that family ownership creates value for all of the firm’s shareholders only when the founder is still active in the firm either as CEO or as Chairman with a hired CEO.
Based on these arguments, and considering that ownership generates differences among family firms, we suggest the following hypotheses:
Hypothesis 6 (H6).
There is a significant difference between the effect of the website quality on turnover in companies with low and high family ownership.
Hypothesis 7 (H7).
There is a significant difference between the effect of the presence of social network on turnover in companies with low and high family ownership.
Hypothesis 8 (H8).
There is a significant difference between the effect of the website quality on the presence of social network in companies with low and high family ownership.
Hypothesis 9 (H9).
There is a significant difference between the mediating effect of social network in companies with low and high family ownership.
Hypothesis 10 (H10).
There is a significant difference between the moderating effect of social network in companies with low and high family ownership.
3. Research Method
3.1. Data Collection Procedure
The sample used in the study has been extracted from the index The Global Family Business Index, which comprises the largest 500 family firms around the globe. It provides impressive evidence of the economic power and relevance of family firms in the world. The index is compiled by the Center for Family Business at the University of St. Gallen, Switzerland, in cooperation with EY’s Global Family Business Center of Excellence.
The authors of the index define a family business as follows. For a privately held firm, a firm is classified as a family firm in case a family controls more than 50% of the voting rights. For a publicly listed firm, a firm is classified as a family firm in case the family holds at least 32% of the voting rights. The 32% cut-off is motivated by the observation that in OECD countries on average 30% of the votes are sufficient to dominate the general assembly of a publicly listed company. This is because, on average, only roughly 60% of the votes are present in the general assembly. To be more conservative in their classification, they decided to use the 32% cut-off, which is also more conservative than most academic studies which often use a 25% or 20% cut-off. The assessments in this index are based on data for 2015. Companies for which no complete and reliable data for 2015 was available were skipped from the index.
In 2016, a study was carried out in which we analyzed the corporate websites of the largest 500 family businesses in the world included in the index. The websites of the companies that do not have complete and reliable data were omitted from the index. Once the websites were selected, a detailed work was carried out to identify the items that make up the measurement instrument regarding website quality. This was a complex task, due mainly to the large amount of features and attributes that can be involved in such quality requirements, and furthermore, in the relations between attributes, features and sub-features. We clearly defined which attributes within the websites are the most relevant for the analysis, without overlooking the practical implementation of the tool.
In short, this study examined the technical characteristics of corporate websites with a view to determining whether said features affect the overall quality of the user experience. These criteria have been taken from a comprehensive analysis of the corporate websites, and review of the literature in related areas, including the design of webpages [61], the quality of information on the web [62], and quality of the Portal Data [63], as well as other studies including the following [28,64,65,66].
3.2. Descriptive Analysis
Some summarizing facts about the firms on the global family business index are the following. Together, the family 500 firms generate 6.5 trillion USD sales, employ 21 million people and are 40.857 years old. The average sales volume is 13 billion USD, the average number of employees is 42.280 and the average firm age is 88 years. 44% of the firms are owned by the fourth generation or older. The oldest firm, Takenaka Corporation, has been around since 1610. 74% of all firms come from the US or Europe. 52% are publicly listed and 48% privately held. Retail and wholesale companies make up the largest share of the index with 18%, closely followed by diversified industrial products (17%) and consumer products (15%). It is also interesting to see that, within the top 10, there are four family-controlled automakers: Volkswagen, Exor (controlling Fiat Chrysler), Ford, and BMW. Apparently, family firms are prominent even in industries that are very capital intensive such as the automotive industry. In contrast, no family firm on the list is predominantly active in banking. Taken together, the index documents family firms’ ability to generate massive value, sometimes across long periods. Nevertheless, even more than that, the index is an evolving source of benchmarking, analysis, and insight about the heterogeneous and fascinating field of large family firms.
3.3. Measures
Most of the constructs were measured using dichotomous variables, assigning 1 to the existence of a given item and 0 when it does not exist. The constructs used are:
- -
- E-quality (E-Q): this was measured using the scale developed by Cober, Brown, Levy [64]. This construct has been modelled as a reflective second-order construct using three formative first-order dimensions: content (About us, Blog, Newsletter, Copyright, Legal disclaimer, FAQ/Help, News, Privacy policy, Trust mark/Trust seal, Terms of use); form (Animation, Color background, Pictures, Color text, Video), and function (Search, E-mail, Fax, Postal address, Telephone, Last update, Forums, Languages, Site map, Navigation menu, Register, RSS).
- -
- Social network: this was modelled as a formative first-order construct. This construct is formed by the following items [46]: Facebook, Flickr, Google+, Instagram, LinkedIn, Pinterest, Tumblr, Twitter, Weibo, YouTube.
- -
- Turnover (TO): to measure this construct, we used the company’s total net revenue [8].
- -
- Given that there are other factors that can affect the companies’ turnover, several control variables were included in the study: Family business age was measured as the difference between the year in which the questionnaire was conducted (2016) and the year in which the company was founded. Type of company was operationalized as a dummy variable: 0 = private company, 1 = public listed company. We used this variable because the firms can differ. For example, in emerging economies, with weaker legal and regulatory institutions to protect shareholders, there tends to be a higher proportion of private firms, than in countries with more developed institutional frameworks, in which public listed firms are more common [54].
3.4. Data Analysis Process
In order to estimate the model and perform the multigroup analysis (MGA), we have used partial least squares-structural equation modeling (PLS-SEM) [15] through the statistical software SmartPLS, version 3.2.6. (Ringle, Christian M., Wende, Sven, and Becker, Jan-Michael; Boenningstedt, Germany) SEM enables researchers to statistically examine a series of interrelated dependence relationships between theory-based latent variables and their indicator variables by measuring directly observable indicator variables [67,68]. Within SEM, the partial least squares (PLS) technique has been used. PLS path modeling can be understood as a full-fledged SEM method that can handle both factor models and composite models for construct measurement, estimate recursive and non-recursive structural models, and conduct tests of model fit [69]. We can justify the use of the PLS methodology in this work for several reasons [70], among others: it works best with complex models, when we try to analyze interrelations between a large set of factors and with manifest variables; it can be used for both explanatory and predictive research; and it is an appropriate nonparametric SEM technique for multigroup analysis (MGA) [16,71].
Using PLS entails a two-stage approach [15]. The first step requires the assessment of the measurement model, which allows the relationships between the observable variables and theoretical concepts to be specified. In the second step, the structural model is evaluated in order to test the extent to which the causal relationships specified by the proposed model are consistent with the available data. Following the assessment of the measurement and structural model, two different nonparametric methods was used to multigroup analysis (MGA), namely Henseler’s MGA [17] and the permutation test [18]. Moreover, prior to performing the multigroup analysis, measurement invariance was assessed using the measurement invariance of composites (MICOM) approach [16], recently developed for PLS-SEM.
4. Study Results
To evaluate the model using PLS-SEM and to compare the results of the estimated path coefficients between low and high family ownership companies, this study employs a three-stage approach to assess the measurement model, the structural model, and the multigroup analysis (MGA).
4.1. Assessment of Measurement Model
In this first stage, the measurement model of reflective construct (e-quality) is evaluated in terms of reliability and validity. This involves four steps: individual item reliability, construct reliability, convergent validity and discriminant validity [69]. In this respect, we would like to point out that the rest of constructs or latent variables (content, form, function, social network) are modeled with formative indicators. A latent variable with formative indicators implies that the construct is expressed as a function of the variables. The observed variables form, cause, or precede the construct. For this reason, traditional reliability and validity assessment have been argued as inappropriate and illogical [72]. Formatively specified constructs are evaluated differently from reflectively measured constructs. They are based on testing potential multicollinearity among items, as well as the analysis of weights. A high collinearity among indicators would produce unstable estimates and would make it difficult to separate the distinct effect of the individual manifest variables on the construct. Their evaluation involves examination of (1) the convergent validity, (2) indicator collinearity and (3) statistical significance and relevance of the indicator weights [15].
As the model does not have first-order reflective construct, we begin by assessing the formative indicators. The convergent validity is determined on the basis of the extent to which the construct correlates with a reflectively measured construct (or single-item) capturing the same concept [73]. As we only have formative measures for the construct of interest, we should directly go to step 2. Collinearity assessment involves computing each item’s variance inflation factor (VIF) by running a multiple regression of each indicator in the measurement model of the formatively measured construct on all the other items of the same construct. As a rule of thumb, VIF values above 5 are indicative of collinearity among the indicators [15]. The maximum VIF value for our formative indicators are well below this threshold (Table 1). The third stage is examining the statistical significance and relevance of the indicator weights. Weights provide information about how each formative indicator contributes to the respective composite construct [73]. We use the subsamples from bootstrapping to construct different types of confidence intervals. Recent research by Aguirre-Urreta and Rönkkö [74] shows that bias-corrected and accelerated (BCa) bootstrap confidence intervals perform very well in terms of coverage and balance. If a weight’s confidence interval includes zero, this provide evidence that the weight is not statistically significant, making the indicator a candidate for removal from the measurement model. However, before that, we should first consider its loading. Once we checked the significance of the weights and the loading, we observed the presence of non-significant formative indicators (Table 1) because of the high number of indicator in each formative construct. For this reason, we decided to keep them, as removing a formative indicator would imply eliminating of a part of the composite latent construct. Eliminating formative indicators from the model should be considered with caution and should generally be the exception, as the formative measurement theory requires that the measures fully capture the entire domain of a construct [15]. Therefore, deleting an indicator may have adverse consequences for the validity of the content of the measurement model [75].
To assess the reflective dimensions of the second-order construct (e-quality), we follow the four steps mentioned above. We begin by assessing the individual item reliability of the measurement model. Individual item reliability is considered adequate when the factor loading of an item on its respective construct is generally greater than 0.7. A loading lower than 0.4 indicates that an item should be considered for removal, and items with loading of 0.4–0.7 should be considered for removal if they increase the composite reliability (CR) and average variance extracted (AVE) [76]. Table 1 indicates that most of the loadings (λ) exceed this threshold, except one item (Form). However, we decided to retain it in order to support the content validity of the scale. Moreover, this value (0.7) should not be so rigid when scales are applied to different contexts [77]; in our case, the family business context.
The measures of construct reliability and convergent validity represent measures of internal consistency. Construct reliability enables testing whether the indicators truly measure the constructs. The results in Table 2 indicate that our reflective construct is reliable, as its composite reliability (CR) is greater than 0.7. Results between 0.70 and 0.95 represent “satisfactory to good” reliability levels [75]. To assess convergent validity, which measures the extent to which a construct converges on its indicators by explaining the items’ variance, we examine the average variance extracted (AVE) measure. An acceptable threshold for the AVE is 0.5 or higher [15]. Our construct exceeds this value (Table 2). Furthermore, because the CR and AVE exceed the threshold, we conclude that the removal of the indicator “Form” with loading 0.4–0.7 is unnecessary.
Finally, discriminant validity indicates the extent to which a construct is empirically distinct from other constructs in the model. To assess discriminant validity, we follow the Fornell–Larcker criterion, in which AVE should be greater than the variance shared between the construct and other constructs in the model. For adequate discriminant validity, the diagonal elements should be significantly greater than the off-diagonal elements in the corresponding rows and columns. This condition is satisfied for each reflective construct in relation to the rest of the variables (Table 2).
We also use a recent criterion to assess discriminant validity, the heterotrait–monotrait ratio of correlations (HTMT), which is an estimate of the factor correlation (more precisely, an upper boundary). To clearly discriminate between two factors, the HTMT should be significantly less than one [69]. Table 3 shows that all variables also achieve discriminant validity following the HTMT criterion.
The next stage involves assessing the structural model results to identify patters in the data relationships.
4.2. Assessment of Structural Model
In the second stage of the analysis, the structural model is assessed. The procedure consists of evaluating the collinearity; the algebraic sign, magnitude and statistical significance of the structural path coefficients; the R2 values (variance explained); the f2 effect size; the Q2 (predictive relevance) [72]; and the value of SRMR as an approximate model fit for PLS-SEM [69].
To check the collinearity, we examine the VIF values of the predictor constructs. All VIF values are below the conventional threshold of 5 (Table 4). Therefore, collinearity among the constructs is not a critical issue in the structural model.
Table 5 shows the results of structural model assessment and hypothesis testing using 5000 bootstrap resamples. Analyzing the path coefficients, four of the five hypothesized relationships are significant. However, all the hypotheses are significant when we applied percentile bootstrapping to generate a 95% confidence interval [69]. An interval that does not contain zero means that the structural path coefficient is significantly different from zero, at a confidence level of 95%, and therefore, the path coefficient is regarded as significant [74]. These results support Hypotheses 1–5. Regarding control variables included in our model, age shows negligible and non-significant path, but the result for type is significant.
This study also assesses the mediating role of social network between e-quality and turnover (Hypothesis 4). In other words, this study examines the indirect effect of e-quality on turnover through social network. An indirect effect is described as a variable that intervenes in the direct relationship between X and Y. The product of the coefficient approach using the bootstrapping resampling method has been used to examine the significance of the indirect effect [78]. The results support the significant mediating role of social network between e-quality and turnover (Table 5 and Table 6).
Hypothesis 5 on the moderating role of social networks in the path between e-quality and turnover is tested using the orthogonalizing approach. Such an approach ensures that the indicators of the interaction term do not share variance with any of the indicators of the predictor or moderator variable [79]. As in regression analysis, the predictor (E-Q) and the moderator variable (SN) are multiplied to obtain the interaction term. In Table 5, the results support H5. Moreover, the R2 for this interaction model is compared to the R2 for the baseline model, which excludes the interaction term. The difference in R2 indicates the overall effect size f2 for each interaction effect. The effect size f2 can be calculated as f2 = (R2 included − R2 excluded)/(1 − R2 included). The overall effect size achieves an f2 value of 0.179, which indicates a moderate moderating effect [80]. This finding implies additional support for the moderation role social network. Therefore, social network negatively moderates the link between E-Q and TO.
The R2 value of the endogenous constructs is calculated as being indicative of the model’s explanatory power [81]. The R2 values are 0.266 for turnover and 0.043 for social network. An R2 value of 0.2 is relatively high and acceptable by management research standards [81]. Therefore, only the R2 value of social network can be considered low. Regarding the effect sizes f2 for the structural model relationship, E-Q has a weak effect size of 0.115 and 0.045 on TO and SN. SN also has a weak effect size of 0.023 on TO. Blindfolding was used to evaluate the model with the cross-validated redundancy index (Q2) for the endogenous variables. Chin [18] suggested this measure to examine the predictive relevance of a theoretical/structural model. Q2 values greater than zero imply that the model has predictive relevance. The results confirm that the structural model has satisfactory predictive relevance for all the endogenous constructs. More precisely, turnover has 0.068 and social network 0.036 as Q2 values. Finally, we test the model fit through the standardized root mean square residual (SRMR) as the root mean square discrepancy between the correlations observed and the model-implied correlations [69]. This approach provides the exact fit of the composite factor model, thus constituting a confirmatory composite analysis. Our model achieves an SRMR for the composite factor model of 0.08. This value can be considered acceptable for PLS-SEM based on the usual cutoff of 0.08 [69].
4.3. Multigroup Analysis (MGA)
Once evaluating the measurement model and the structural model, two different non-parametric methods are used for the comparative analysis between companies with low and high family ownership: Henseler’s MGA [17] and the permutation test [18]. These techniques are considered the most conservative PLS-SEM techniques for the assessment of differences between path coefficients between two groups [71]. In addition, before carrying out this multigroup analysis, the measurement invariance is evaluated using MICOM, a new approach developed for PLS [16,81,82].
We are going to describe the process for analyzing the categorical variable “family ownership” (companies with low family ownership vs. companies with high family ownership) as a moderating variable in the model analysis. The basic idea is to divide the sample into two subsamples. To this end, the observations are categorized according to whether the family owns less than 50% of family business ownership or more than 50% of family business ownership. Next, the path coefficients are estimated for each subsample, and finally, the significant differences between the path coefficients are interpreted as moderating effects.
MICOM is a three-step process: (1) the configurational invariance assessment, (2) the establishment of compositional invariance assessment and (3) the assessment of equal means and variances. In accordance with the MICOM procedure, the partial measurement invariance of both groups (Table 7), which is a requirement for comparing and interpreting the MGA’s group-specific differences of PLS-SEM results [16].
Table 8 shows the results of the assessment of the structural model and MGA using both nonparametric methods: Henseler’s MGA [17] and the permutation test [18]. Henseler’s MGA directly compares group-specific bootstrap estimates from each bootstrap sample. According to this method, a p value of differences between path coefficients lower than 0.05 or higher than 0.95 indicates a 5% level of significant differences between specific path coefficients across two groups [17]. The permutation test also returns a p value. In this case, differences are only at the 5% level of significance if the p value is smaller than 0.05.
The results of multigroup analysis (MGA), using the two methods, reveal significant differences between companies with low and high family ownership with respect to the effect of E-Q on TO (H6) and the moderating role of social network between E-Q and TO (H10). The results show these significant differences using both Henseler’s MGA and the permutation test with a p-value higher than 0.95 and lower than 0.05, except for the moderating effect (H10) with a permutation test p value of 0.080 (p < 0.1). Moreover, the results indicate non-significant differences between the other path coefficients and relationships across both groups (H7, H8 and H9). Both methods of MGA analysis confirm the significance/non-significance of the results, providing a multi-method confirmation, thus increasing the credibility of our results [83,84].
5. Discussion
In this study, we have analyzed the relationships between e-quality, social networks and turnover and we have compared the results between family firms with high and low family ownership. Regarding the assessment of the structural model, the results indicated that both the direct effect of e-quality on turnover and indirect effect of e-quality on turnover as mediated by social networks were negative and significant (H1 and H4). Additionally, the moderating effect of social networks in the relationship between e-quality and turnover was also negative and significant (H5). The results are consistent with previous studies. In general, family firms may pursue family-oriented goals, willing to sacrifice economic performance in order to preserve family wealth, which can lead to severe conflicts with other shareholders or stakeholders, who primarily emphasize financial goals. As a result, family owners should feel a greater degree of organizational identification. They should be more concerned about the reputation of the firm and thus be more inclined than other owners to avoid reputation-damaging corporate actions (e.g., [13,58,60]). Moreover, in line with other studies not related to family business literature [26], the negative relationship between e-quality and turnover could be indicative that some organizations, mainly the largest ones (as in our case), still do not give due importance to their corporate websites.
Moreover, the relationship between social networks and turnover is positive and significant (H2). This implies that a stronger strategic presence in social networks improves the image and online reputation of the company, which results in a higher turnover.
Finally, the results also confirmed the negative and significant relationship between e-quality and social network (H3). A higher quality web could limit the use of social networks to the most relevant ones (such as Facebook and Twitter).
Regarding the multigroup analysis, MGA revealed significant differences between companies with low and high concentration of family ownership with respect to the relationship between e-quality and turnover and the moderating effect of social networks between e-quality and turnover (H6 and H10). The effect size of e-quality on turnover in companies with low family ownership was much more negative than the effect size of e-quality on turnover in companies with high family ownership. Therefore, the results highlight the importance of the quality of a corporate website. In the current study, family firms with a higher family ownership concentration are more aware of having a quality website to obtain more revenues, than companies with low family ownership. Although, as we said earlier, the relationship between e-quality and turnover is negative in the companies of our sample, in family firms with larger family ownership concentration, this relationship is less negative. In family firms with high family ownership, the shared goals of the family and the firm lead family business to identify more strongly with the firm as a social entity than do other types of owners, committing more with the company [60].
Table 8 shows the non-significant differences between the effect of social networks on turnover (H7) and e-quality on social networks (H8) in companies with low and high family ownership. Moreover, the indirect effect of e-quality on turnover through social networks, that is, the mediating effect (H9) is also non-significant. However, the results highlight that these relationships are significant in family firms with high family ownership, but non-significant in family firms with low family ownership (Figure 1).
The MGA findings demonstrated significant differences between the moderating effect of social networks in the relationship between e-quality and turnover in companies with low and high family ownership (H10). This effect was positive and non-significant in family firms with low family ownership, but negative and significant in family firms with high family ownership. Therefore, in family firms with high family ownership concentration, social networks negatively moderate the relationship between e-quality and turnover.
In this line, it is necessary to take into account the fact that the online presence of family firms, integrated by the corporate web site and social networks, should be used to communicate the orientation of corporate sustainability. This could help improve key aspects in online environments, such as online reputation, which in turn would boost their brand image and the loyalty of consumers, employees, and even owners or shareholders. In this context, responsible and sustainable management is crucial to generate a good reputation, which in turn increases customer loyalty and helps retain talent [85], and presence online in family businesses for communicate them. Therefore, these organizations should keep in mind the long-term social and environmental impact of all economically motivated behaviors of a family firm and communicate it through their virtual spaces.
6. Conclusions
6.1. Theoretical and Practical Implications
Our findings contribute to the literature in several ways. First, it is fitting that family business research has begun to introduce moderators and mediators and measure family involvement continuously rather than dichotomously to better explain the heterogeneous relationship between family involvement and both behavior and performance, thus making a unique theoretical contribution of this paper. Secondly, another contribution should focus on the causes of heterogeneity in family firms so as to better understand their behavior, especially family firm identity. Thirdly, the study refers to family firms’ non-financial goals, social interests, preferences and particular control rights, so we have focused our research under the SEW theory, being an important theoretical contribution. Regarding methodological contributions, this research contributes to the literature on PLS path modelling. We include a number of recently developed advances analysis techniques to assess the proposed model with their direct and indirect (mediating effect) relationship and moderating effect between website quality, social networks and turnover, and to compare the companies with low and high family ownership concentration through multigroup analysis. In the multigroup analysis, we assessed measurement invariance via the measurement invariance of composites approach; after that, we employed two parametric methods: Henseler’s MGA and the permutation test. This study is one of the first empirical studies in marketing context, specifically in the Internet and Information System literature, to apply these new techniques.
As PLS path modelling is a method base on approximation and designed for situations with a low theoretical base, researcher should be cautioned to interpret the results from PLS [71].
This study also has important practical implications. Firstly, it highlights the importance of a global strategy of participation in social networks, since it influences the company’s turnover. Family businesses should be aware of the great possibilities that a good presence in social networks can bring them. Within the new paradigm of Web 2.0, social networks are configured as basic tools for the management of valuable content, which organizations must provide to the different target communities and for the attraction of said users to the corporate website. In fact, an increasing amount of companies have started to build their own brand community based on social media to engage customers with the brand and with other customers [86] and family businesses should not be an exception.
Secondly, these results indicate that large family corporations get their sales through channels very different from their corporate website. They belong to structured businesses, or not dependent on individual consumers (often industrial) or are family offices or large investment companies, and therefore, the corporate website does not have a clear commercial objective and hence, companies with higher sales, pay less attention to the quality of their websites. This is not to say, however, that family firms sacrifice of ignore financial goals. The key point is that when family interests predominate, firms are more likely to bear the costs incurred in pursuing certain actions, policies, and strategies because they are driven by the belief that these costs are counter-balanced by noneconomic utilities other than financial gains [24]. However, this fact also has implications for owners and managers, since there is a great business opportunity to be differentiated from the rest of the world with special attention to e-commerce, corporate websites and social networks.
Thirdly, one implication of this study (in line with other, e.g., [87]) is that family firms may be just as rational as non-family firms when it comes to making risky business decisions. However, the criteria for judging whether the decision is risky varies by the two types of firms. For family firms, a key criterion, or at least one that has a greater priority, is whether their socioemotional endowment will be preserved.
6.2. Limitations and Future Research
Our study has a number of limitations that should be taken into account in future research. A limitation of this study is that the sample is composed of the largest 500 family firms around the globe from The Global Family Business Index. As a result, generalizations to the general population of family firms are difficult to make. Future investigations should be conducted in other samples to increase the external validity of the results; for example, in the context of SME family firms. Many family firms are small in size and privately held. It may very well be that family management shows an effect on small firms or privately held firms, where personal relationships are closer. Because we were using a large index dataset, the measures used in our study may not capture some important determinants. Future survey research may be conducted to test the impact of variables such as performance, generation in control, the presence of non-family CEOs, which may influence the quality of a corporate website. Another limitation is that we have only used family ownership as a moderating variable to perform the multigroup analysis. The study could be enriched by exploring the role of family involvement in management (e.g., proportion of family members in the TMT and presence of family CEO) and in firm governance (e.g., proportion of family members on the board of directors). These variables may play a different role in the proposed relationships. Finally, the impact of family ownership on website quality and social network, specifically the extent to which family control and involvement in management influence the ways in which family firms carry out their revenues, should also be better addressed by future research, as these issues could not be examined based on the data set we utilized. The challenge for future research is therefore to understand how family owners frame decisions with SEW as a reference point. Nevertheless, perhaps a more fundamental question is whether financial performance is the ultimate objective for family firms rather than more intangible qualities such as stable employment, harmony among kin, and long-term survival. This does not mean that financial performance is unworthy of study, but rather that SEW should be given an equal level of importance [24].
Acknowledgments
This research was funded by the Government of Extremadura-Spain (Consejería de Economía e Infraestructura) and FEDER aid. Moreover, the authors are grateful to the Editor and to the three anonymous reviewers for their valuable comments.
Author Contributions
In general, the authors contributed equally to this work.
Conflicts of Interest
The authors declare no conflict of interest.
References
- Blasco-Arcas, L.; Hernández-Ortega, B.; Jiménez-Martínez, J. The online purchase as a context for co-creating experiences. Drivers of and consequences for customer behavior. Internet Res. 2014, 24, 393–412. [Google Scholar] [CrossRef]
- Kim, S.; Stoel, L. Apparel retailers: Website quality dimensions and satisfaction. J. Retail. Consum. Serv. 2004, 11, 109–117. [Google Scholar] [CrossRef]
- Chang, K.; Chen, M.; Hsu, C.; Kuo, N. Integrating loss aversion into a technology acceptance model to assess the relationship between website quality and website user’s behavioural intentions. Total Qual. Manag. Bus. Excell. 2012, 23, 913–930. [Google Scholar] [CrossRef]
- Mukherjee, P.; Jansen, B.J. Conversing and searching: The causal relationship between social media and web search. Internet Res. 2017, 27, 1209–1226. [Google Scholar] [CrossRef]
- De Massis, A.; Kotlar, J.; Chua, J.H.; Chrisman, J.J. Ability and willingness as sufficiency conditions for family-oriented particularistic behavior: Implications for theory and empirical studies. J. Small Bus. Manag. 2014, 52, 344–364. [Google Scholar] [CrossRef] [Green Version]
- Astrachan, J.H.; Klein, S.B.; Smyrnios, K.X. The F-PEC scale of family influence: A proposal for solving the family business definition problem1. Fam. Bus. Rev. 2002, 15, 45–58. [Google Scholar] [CrossRef]
- Villalonga, B.; Amit, R. How do family ownership, control and management affect firm value? J. Financ. Econ. 2006, 80, 385–417. [Google Scholar] [CrossRef]
- Miller, D.; Le Breton-Miller, I.; Lester, R.H.; Cannella, A.A. Are family firms really superior performers? J. Corp. Financ. 2007, 13, 829–858. [Google Scholar] [CrossRef]
- Botero, I.C.; Cruz, C.; Massis, A.D.; Nordqvist, M. Family business research in the European context. Eur. J. Int. Manag. 2015, 9, 139–159. [Google Scholar] [CrossRef]
- Babin, B.J.; Astrachan, C.B.; Botero, I.C.; Hair, J.F.; Prgl, R.; Herrmann, J.; Laroche, M.; Sarstedt, M. From Family Identity to Family Firm Image and Reputation: Exploring Facets of the Perception of Family Influence in Branding, Marketing, and Other Messaging. J. Fam. Bus. Strategy 2017, 8, I–III. [Google Scholar] [CrossRef]
- Mustakallio, M.; Autio, E.; Zahra, S.A. Relational and contractual governance in family firms: Effects on strategic decision making. Fam. Bus. Rev. 2002, 15, 205–222. [Google Scholar] [CrossRef]
- Sánchez-Famoso, V.; Akhter, N.; Iturralde, T.; Chirico, F.; Maseda, A. Is non-family social capital also (or especially) important for family firm performance? Hum. Relat. 2015, 68, 1713–1743. [Google Scholar] [CrossRef]
- Matzler, K.; Veider, V.; Hautz, J.; Stadler, C. The impact of family ownership, management, and governance on innovation. J. Prod. Innov. Manag. 2015, 32, 319–333. [Google Scholar] [CrossRef]
- Sciascia, S.; Nordqvist, M.; Mazzola, P.; De Massis, A. Family Ownership and R&D Intensity in Small-and Medium-Sized Firms. J. Prod. Innov. Manag. 2015, 32, 349–360. [Google Scholar]
- Sarstedt, M.; Ringle, C.M.; Hair, J.F. Partial least squares structural equation modeling. In Handbook of Market Research; Springer: New York, NY, USA, 2017; pp. 1–40. [Google Scholar]
- Henseler, J.; Ringle, C.M.; Sarstedt, M. Testing measurement invariance of composites using partial least squares. Int. Market. Rev. 2016, 33, 405–431. [Google Scholar] [CrossRef]
- Henseler, J.; Ringle, C.M.; Sinkovics, R.R. The use of partial least squares path modeling in international marketing. Adv. Int. Market. 2009, 20, 277–319. [Google Scholar] [CrossRef]
- Chin, W.W.; Dibbern, J. An introduction to a permutation based procedure for multi-group PLS analysis: Results of tests of differences on simulated data and a cross cultural analysis of the sourcing of information system services between Germany and the USA. In Handbook of Partial Least Squares; Springer: New York, NY, USA, 2010; pp. 171–193. [Google Scholar]
- Chua, R.Y.; Morris, M.W.; Mor, S. Collaborating across cultures: Cultural metacognition and affect-based trust in creative collaboration. Organ. Behav. Hum. Decis. Process. 2012, 118, 116–131. [Google Scholar] [CrossRef]
- Berrone, P.; Cruz, C.; Gomez-Mejia, L.R. Socioemotional wealth in family firms: Theoretical dimensions, assessment approaches, and agenda for future research. Fam. Bus. Rev. 2012, 25, 258–279. [Google Scholar] [CrossRef]
- Gavana, G.; Gottardo, P.; Moisello, A.M. Sustainability reporting in family firms: A panel data analysis. Sustainability 2016, 9, 38. [Google Scholar] [CrossRef]
- Berrone, P.; Cruz, C.; Gomez-Mejia, L.R.; Larraza-Kintana, M. Socioemotional wealth and corporate responses to institutional pressures: Do family-controlled firms pollute less? Adm. Sci. Q. 2010, 55, 82–113. [Google Scholar] [CrossRef]
- Chua, J.H.; Chrisman, J.J.; Steier, L.P.; Rau, S.B. Sources of Heterogeneity in Family Firms: An Introduction. Entrep. Theory Pract. 2012, 36, 1103–1113. [Google Scholar] [CrossRef]
- Gómez-Mejía, L.R.; Cruz, C.; Berrone, P.; De Castro, J. The bind that ties: Socioemotional wealth preservation in family firms. Acad. Manag. Ann. 2011, 5, 653–707. [Google Scholar] [CrossRef]
- Sciascia, S.; Mazzola, P.; Kellermanns, F.W. Family management and profitability in private family-owned firms: Introducing generational stage and the socioemotional wealth perspective. J. Fam. Bus. Strategy 2014, 5, 131–137. [Google Scholar] [CrossRef]
- González-López, Ó.R.; Bañegil-Palacios, T.M.; Buenadicha-Mateos, M. Quantitative Web Quality Index: An objective approach to website quality assessment. Investig. Eur. Dir. Econ. Empresa 2013, 19, 16–30. [Google Scholar] [CrossRef]
- Totz, C.; Riemer, K.; Klein, S. Web-evaluation. In The E-Business Handbook; Lowry, P.B., Cherrington, J.O., Watson, R.R., Eds.; St. Lucie Press: St. Lucie County, FL, USA, 2001; Volume 1574443054, pp. 45–66. [Google Scholar] [CrossRef]
- Maurer, S.D.; Liu, Y. Developing effective e-recruiting websites: Insights for managers from marketers. Bus. Horiz. 2007, 50, 305–314. [Google Scholar] [CrossRef]
- Cober, R.T.; Brown, D.J.; Levy, P.E.; Cober, A.B.; Keeping, L.M. Organizational web sites: Web site content and style as determinants of organizational attraction. Int. J. Sel. Assess. 2003, 11, 158–169. [Google Scholar] [CrossRef]
- Cober, R.T.; Brown, D.J.; Keeping, L.M.; Levy, P.E. Recruitment on the Net: How do organizational Web site characteristics influence. J. Manag. 2004, 30, 623–646. [Google Scholar] [CrossRef]
- Keller, P.A.; Block, L.G. Vividness effects: A resource-matching perspective. J. Consum. Res. 1997, 24, 295–304. [Google Scholar] [CrossRef]
- Kivetz, R.; Simonson, I. The effects of incomplete information on consumer choice. J. Market. Res. 2000, 37, 427–448. [Google Scholar] [CrossRef]
- Venkatesh, V.; Davis, F.D. A model of the antecedents of perceived ease of use: Development and test. Decis. Sci. 1996, 27, 451–481. [Google Scholar] [CrossRef]
- Steuer, J. Defining virtual reality: Dimensions determining telepresence. J. Commun. 1992, 42, 73–93. [Google Scholar] [CrossRef]
- Coyle, J.R.; Thorson, E. The effects of progressive levels of interactivity and vividness in web marketing sites. J. Advert. 2001, 30, 65–77. [Google Scholar] [CrossRef]
- Coulter, K.S.; Punj, G. Influence of viewing context on the determinants of attitude toward the ad and the brand. J. Bus. Res. 1999, 45, 47–58. [Google Scholar] [CrossRef]
- Allen, D.G.; van Scotter, J.R.; Otondo, R.F. Recruitment communication media: Impact on prehire outcomes. Pers. Psychol. 2004, 57, 143–171. [Google Scholar] [CrossRef]
- Cober, R.T.; Brown, D.J.; Blumental, A.J.; Doverspike, D.; Levy, P. The quest for the qualified job surfer: It’s time the public sector catches the wave. Public Pers. Manag. 2000, 29, 479–496. [Google Scholar] [CrossRef]
- Liu, Y.; Shrum, L.J. What is interactivity and is it always such a good thing? Implications of definition, person, and situation for the influence of interactivity on advertising effectiveness. J. Advert. 2002, 31, 53–64. [Google Scholar] [CrossRef]
- McMillan, S.J.; Hwang, J. Measures of perceived interactivity: An exploration of the role of direction of communication, user control, and time in shaping perceptions of interactivity. J. Advert. 2002, 31, 29–42. [Google Scholar] [CrossRef]
- Nielsen, J. Designing Web Usability: The Practice of Simplicity; New Riders: Indianapolis, IN, USA, 1999. [Google Scholar] [CrossRef]
- Chen, Q.M.; Wells, W.D. Attitude toward the site. J. Advert. Res. 1999, 39, 27–37. [Google Scholar] [CrossRef]
- Williamson, I.O.; Lepak, D.P.; King, J. The effect of company recruitment web site orientation on individuals’ perceptions of organizational attractiveness. J. Vocat. Behav. 2003, 63, 242–263. [Google Scholar] [CrossRef]
- Wells, J.D.; Valacich, J.S.; Hess, T.J. What signal are you sending? How website quality influences perceptions of product quality and purchase intentions. MIS Q. 2011, 35, 373–396. [Google Scholar] [CrossRef]
- Constantinides, E.; Fountain, S.J. Web 2.0: Conceptual foundations and marketing issues. J. Dir. Data Digit. Market. Pract. 2008, 9, 231–244. [Google Scholar] [CrossRef]
- González-López, Ó.R. Ecommcerce 2.0; Anaya Multimedia: Madrid, Spain, 2014. [Google Scholar]
- Lee, S.; Lee, S.; Kim, B.G.; Kim, B.G. The impact of qualities of social network service on the continuance usage intention. Manag. Decis. 2017, 55, 701–729. [Google Scholar] [CrossRef]
- Pookulangara, S.; Koesler, K. Cultural influence on consumers’ usage of social networks and its’ impact on online purchase intentions. J. Retail. Consum. Serv. 2011, 18, 348. [Google Scholar] [CrossRef]
- Lim, H.; Dubinsky, A.J. Determinants of consumers’ purchase intention on the Internet: An application of theory of planned behavior. Psychol. Market. 2005, 22, 833. [Google Scholar] [CrossRef]
- Murugesan, S. Understanding Web 2.0; IT Professional: Hong Kong, China, 2007; Volume 9. [Google Scholar]
- Pittino, D.; Barroso-Martínez, A.; Chirico, F.; Sanguino-Galván, R. Psychological ownership, knowledge sharing and entrepreneurial orientation in family firms: The moderating role of governance heterogeneity. J. Bus. Res. 2018, 84, 312–326. [Google Scholar] [CrossRef]
- García-Álvarez, E.; López-Sintas, J. A taxonomy of founders based on values: The root of family business heterogeneity. Fam. Bus. Rev. 2001, 14, 209–230. [Google Scholar] [CrossRef]
- Melin, L.; Nordqvist, M. The reflexive dynamics of institutionalization: The case of the family business. Strategy Organ. 2007, 5, 321–333. [Google Scholar] [CrossRef]
- Deng, Z.; Hofman, P.S.; Newman, A. Ownership concentration and product innovation in Chinese private SMEs. Asia Pac. J. Manag. 2013, 30, 717–734. [Google Scholar] [CrossRef]
- Schulze, W.S.; Lubatkin, M.H.; Dino, R.N.; Buchholtz, A.K. Agency relationships in family firms: Theory and evidence. Organ. Sci. 2001, 12, 99–116. [Google Scholar] [CrossRef]
- Zahra, S.A. Entrepreneurial risk taking in family firms. Fam. Bus. Rev. 2005, 18, 23–40. [Google Scholar] [CrossRef]
- Salvato, C. Predictors of entrepreneurship in family firms. J. Priv. Equity 2004, 7, 68–76. [Google Scholar] [CrossRef]
- Chrisman, J.J.; Patel, P.C. Variations in R&D investments of family and nonfamily firms: Behavioral agency and myopic loss aversion perspectives. Acad. Manag. J. 2012, 55, 976–997. [Google Scholar]
- Anderson, R.C.; Duru, A.; Reeb, D.M. Investment policy in family controlled firms. J. Bank. Financ. 2012, 36, 1744–1758. [Google Scholar] [CrossRef]
- Block, J. Family management, family ownership, and downsizing: Evidence from S&P 500 firms. Fam. Bus. Rev. 2010, 23, 109–130. [Google Scholar]
- Zhang, P.; von Dran, G.M.; Blake, P.; Pipithsuksunt, V. Important design features in different web site domains: An empirical study of user perceptions. E-Serv. J. 2001, 1, 77–91. [Google Scholar] [CrossRef]
- Katerattanakul, P.; Siau, K. Information quality in internet commerce design. In Information and Database Quality; Piattini, M.G., Calero, C., Genero, M., Eds.; Kluwer Academic Publishers: Norwell, MA, USA, 2002; pp. 45–56. [Google Scholar] [CrossRef]
- Caro, A.; Calero, C.; Caballero, I.; Piattini, M.G. A proposal for a set of attributes relevant for Web portal data quality. Softw. Qual. J. 2008, 16, 513–542. [Google Scholar] [CrossRef]
- Cober, R.T.; Brown, D.J.; Levy, P.E. Form, content and function: An evaluative methodology for corporate employment Web sites. Hum. Resour. Manag. 2004, 43, 201–218. [Google Scholar] [CrossRef]
- Codina, L. Evaluación de recursos digitales en línea: Conceptos, indicadores y métodos. Revista Española de Documentación Científica 2000, 23, 9–44. [Google Scholar] [CrossRef]
- Purwati, Y.; Franksiska, R.; Paramita, E.L. Examining Virtual Recruiting Environment Features of Indonesia Corporate Web Site. Int. J. Bus. Manag. Invent. 2013, 2, 54–63. [Google Scholar]
- Astrachan, C.B.; Patel, V.K.; Wanzenried, G. A comparative study of CB-SEM and PLS-SEM for theory development in family firm research. J. Fam. Bus. Strategy 2014, 5, 116–128. [Google Scholar] [CrossRef]
- Sarstedt, M.; Hair, J.F.; Ringle, C.M.; Thiele, K.O.; Gudergan, S.P. Estimation issues with PLS and CBSEM: Where the bias lies! J. Bus. Res. 2016, 69, 3998–4010. [Google Scholar] [CrossRef]
- Henseler, J.; Hubona, G.; Ray, P.A. Using PLS path modeling in new technology research: Updated guidelines. Ind. Manag. Data Syst. 2016, 116, 2–20. [Google Scholar] [CrossRef]
- Richter, N.F.; Cepeda, G.; Roldán, J.L.; Ringle, C.M. European management research using partial least squares structural equation modeling (PLS-SEM). Eur. Manag. J. 2016, 34, 589–597. [Google Scholar] [CrossRef]
- Sarstedt, M.; Henseler, J.; Ringle, C.M. Multigroup analysis in partial least squares (pls) path modeling: Alternative methods and empirical results. In Measurement and Research Methods in International Marketing; Emerald Group Publishing Limited: Bingley, UK, 2011; pp. 195–218. [Google Scholar] [CrossRef]
- Roldán, J.L.; Sánchez-Franco, M.J. Variance-based structural equation modeling: Guidelines for using partial least squares in information systems research. In Research Methodologies, Innovations and Philosophies in Software Systems Engineering and Information Systems; Mora, M., Gelman, O., Steenkamp, A.L., Raisinghani, M., Eds.; IGI Global: Hershey, PA, USA, 2012; pp. 193–221. [Google Scholar] [CrossRef]
- Chin, W.W. The partial least squares approach to structural equation modeling. Mod. Methods Bus. Res. 1998, 295, 295–358. [Google Scholar]
- Aguirre-Urreta, M.I.; Rönkkö, M. Statistical inference with PLSc using bootstrap confidence intervals. MIS Q. 2018, forthcoming. [Google Scholar]
- Sarstedt, M.; Ringle, C.M.; Smith, D.; Reams, R.; Hair, J.F. Partial least squares structural equation modeling (PLS-SEM): A useful tool for family business researchers. J. Fam. Bus. Strategy 2014, 5, 105–115. [Google Scholar] [CrossRef]
- Hair, J.F.; Sarstedt, M.; Pieper, T.M.; Ringle, C.M. The use of partial least squares structural equation modeling in strategic management research: A review of past practices and recommendations for future applications. Long Range Plan. 2012, 45, 320–340. [Google Scholar] [CrossRef]
- Barclay, D.; Higgins, C.; Thompson, R. The partial least squares (PLS) approach to causal modeling: Personal computer adoption and use as an illustration. Technol. Stud. 1995, 2, 285–309. [Google Scholar]
- Nitzl, C.; Roldán, J.L.; Cepeda, G. Mediation analysis in partial least squares path modeling: Helping researchers discuss more sophisticated models. Ind. Manag. Data Syst. 2016, 116, 1849–1864. [Google Scholar] [CrossRef]
- Henseler, J.; Chin, W.W. A comparison of approaches for the analysis of interaction effects between latent variables using partial least squares path modeling. Struct. Equ. Model. 2010, 17, 82–109. [Google Scholar] [CrossRef]
- Chin, W.W.; Marcolin, B.L.; Newsted, P.R. A partial least squares latent variable modeling approach for measuring interaction effects: Results from a Monte Carlo simulation study and an electronic-mail emotion/adoption study. Inf. Syst. Res. 2003, 14, 189–217. [Google Scholar] [CrossRef]
- Hair, J.F., Jr.; Hult, G.T.M.; Ringle, C.; Sarstedt, M. A Primer on Partial Least Squares Structural Equation Modeling (PLS-SEM); Sage Publications: Thousand Oaks, CA, USA, 2016. [Google Scholar]
- Hair, J.F., Jr.; Sarstedt, M.; Ringle, C.M.; Gudergan, S.P. Advanced Issues in Partial Least Squares Structural Equation Modeling; Sage Publications: Thousand Oaks, CA, USA, 2017. [Google Scholar]
- Rasoolimanesh, S.M.; Roldán, J.L.; Jaafar, M.; Ramayah, T. Factors influencing residents’ perceptions toward tourism development: Differences across rural and urban world heritage sites. J. Travel Res. 2017, 56, 760–775. [Google Scholar] [CrossRef]
- Rasoolimanesh, S.M.; Ringle, C.M.; Jaafar, M.; Ramayah, T. Urban vs. rural destinations: Residents’ perceptions, community participation and support for tourism development. Tour. Manag. 2017, 60, 147–158. [Google Scholar] [CrossRef]
- Ramos-González, M.; Rubio-Andrés, M.; Sastre-Castillo, M. Á Building Corporate Reputation through Sustainable Entrepreneurship: The Mediating Effect of Ethical Behavior. Sustainability 2017, 9, 1663. [Google Scholar] [CrossRef]
- Okazaki, S.; Díaz-Martín, A.M.; Rozano, M.; Menéndez-Benito, H.D. Using Twitter to engage with customers: A data mining approach. Internet Res. 2015, 25, 416–434. [Google Scholar] [CrossRef]
- Gómez-Mejía, L.R.; Haynes, K.T.; Núñez-Nickel, M.; Jacobson, K.J.; Moyano-Fuentes, J. Socioemotional wealth and business risks in family-controlled firms: Evidence from Spanish olive oil mills. Adm. Sci. Q. 2007, 52, 106–137. [Google Scholar] [CrossRef]
Figure 1.
Results of assessment of model and multigroup analysis (low/high family ownership). *** p < 0.001; ** p < 0.01; * p < 0.05; † p < 0.1; n.s.: not significant.
Figure 1.
Results of assessment of model and multigroup analysis (low/high family ownership). *** p < 0.001; ** p < 0.01; * p < 0.05; † p < 0.1; n.s.: not significant.
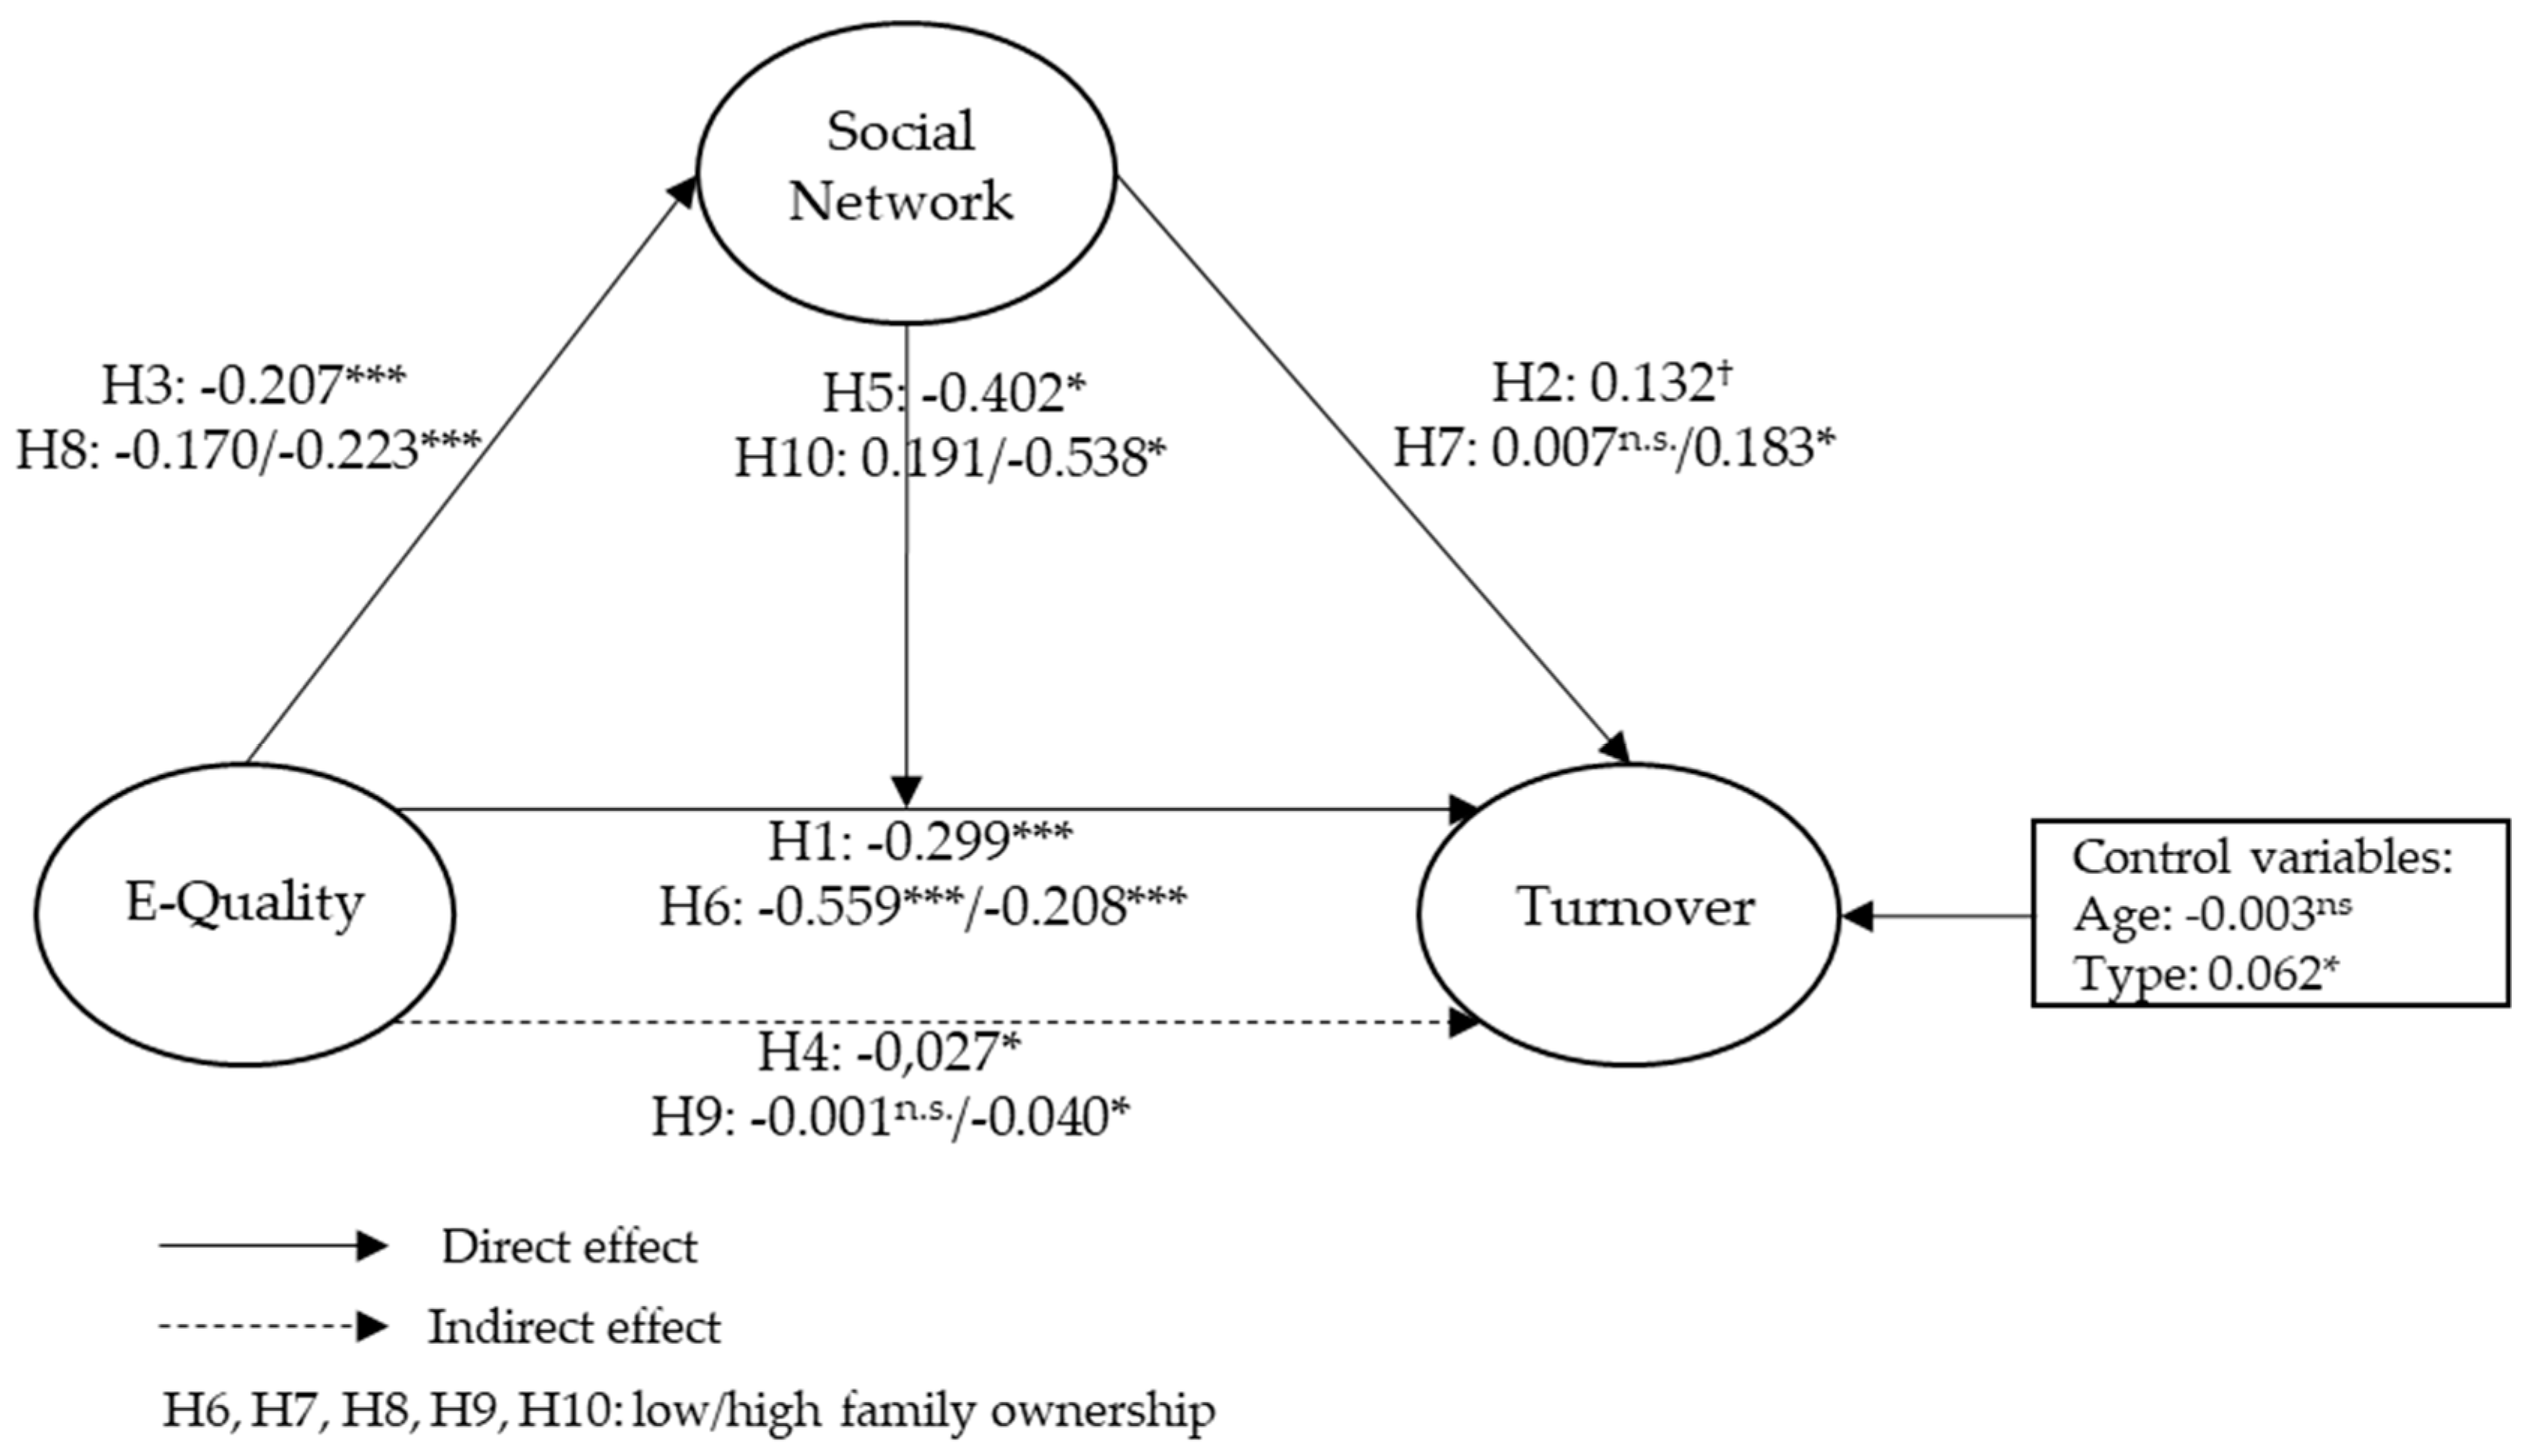

Table 1.
Assessment results of the measurement model.
| Confidence Intervals (Bias Corrected) | Confidence Intervals (Bias Corrected) | ||||||||
|---|---|---|---|---|---|---|---|---|---|
| Mean | Standard Desviation | Loading | 5.0% | 95.0% | Weight | 5.0% | 95.0% | VIF | |
| E-QUALITY (E-Q) (reflective second-order) | |||||||||
| Content (formative) | 0.700 | 0.531 | 1.089 | ||||||
| About us | 0.99 | 0.11 | 0.341 | −0.133 | 0.810 | 0.321 | −0.142 | 0.721 | 1.065 |
| Blog | 0.12 | 0.33 | −0.561 | −0.773 | −0.432 | −0.508 | −0.750 | −0.395 | 1.062 |
| Newsletter | 0.30 | 0.46 | 0.130 | −0.246 | 0.175 | 0.222 | 0.069 | 0.347 | 1.116 |
| Copyright | 0.92 | 0.28 | 0.441 | −0.249 | 0.737 | 0.495 | −0.176 | 0.717 | 1.099 |
| Legal disclaimer | 0.32 | 0.47 | 0.519 | 0.346 | 0.784 | 0.455 | 0.314 | 0.835 | 1.053 |
| FAQ/Help | 0.34 | 0.47 | −0.183 | −0.500 | −0.056 | −0.123 | −0.369 | −0.008 | 1.183 |
| News | 0.90 | 0.30 | 0.113 | −0.076 | 0.535 | −0.027 | −0.077 | 0.319 | 1.085 |
| Privacy policy | 0.78 | 0.41 | −0.068 | −0.496 | 0.117 | −0.023 | −0.325 | −0.008 | 1.616 |
| Trust mark/Trust seal | 0.04 | 0.19 | 0.106 | −0.077 | 0.176 | 0.166 | 0.038 | 0.211 | 1.028 |
| Terms of use | 0.63 | 0.48 | −0.244 | −0.609 | 0.008 | −0.343 | −0.487 | −0.116 | 1.588 |
| Form (formative) | 0.587 | 0.240 | 1.244 | ||||||
| Animation | 0.79 | 0.41 | 0.396 | −0.021 | 0.764 | 0.368 | −0.033 | 0.934 | 1.092 |
| Color background | 0.64 | 0.48 | 0.140 | 0.022 | 0.826 | 0.035 | −0.198 | 0.722 | 1.052 |
| Pictures | 0.99 | 0.09 | 0.657 | 0.281 | 0.995 | −0.173 | 0.143 | 0.495 | 4.019 |
| Color text | 0.99 | 0.09 | 0.803 | 0.200 | 0.993 | 0.934 | 0.398 | 0.728 | 3.975 |
| Video | 0.99 | 0.08 | −0.404 | −0.647 | 0.030 | −0.527 | −0.797 | −0.084 | 1.037 |
| Function (formative) | 0.812 | 0.601 | 1.320 | ||||||
| Search | 0.49 | 0.50 | −0.183 | −0.390 | −0.081 | −0.071 | −0.249 | −0.084 | 1.117 |
| 0.77 | 0.42 | 0.324 | 0.264 | 0.611 | 0.247 | 0.159 | 0.371 | 1.220 | |
| Fax | 0.50 | 0.50 | 0.397 | 0.435 | 0.715 | 0.263 | 0.254 | 0.417 | 1.459 |
| Postal address | 0.47 | 0.50 | 0.353 | −0.293 | 0.702 | 0.298 | −0.018 | 0.428 | 1.599 |
| Telephone | 0.75 | 0.43 | 0.062 | −0.299 | 0.610 | −0.337 | −0.115 | 0.166 | 1.480 |
| Last update | 0.85 | 0.35 | 0.091 | −0.043 | 0.269 | 0.014 | 0.017 | 0.144 | 1.027 |
| Forums | 0.03 | 0.18 | 0.016 | −0.128 | 0.042 | 0.061 | −0.018 | 0.050 | 1.017 |
| Languages | 0.01 | 0.08 | 0.007 | −0.156 | 0.261 | −0.060 | −0.221 | 0.166 | 1.044 |
| Site map | 0.53 | 0.50 | −0.356 | −0.488 | −0.222 | −0.316 | −0.418 | −0.224 | 1.073 |
| Navigation menu | 0.58 | 0.49 | 0.479 | 0.002 | 0.801 | 0.510 | 0.021 | 0.736 | 1.062 |
| Register | 0.99 | 0.08 | −0.003 | −0.442 | 0.052 | 0.109 | −0.190 | 0.172 | 1.097 |
| RSS | 0.54 | 0.50 | −0.616 | −0.693 | −0.435 | −0.584 | −0.623 | −0.390 | 1.052 |
| Social Network (SN) (formative) | 1.086 | ||||||||
| 0.51 | 0.50 | 0.123 | −0.232 | 0.346 | −0.225 | −0.768 | 0.045 | 2.437 | |
| Flickr | 0.39 | 0.49 | 0.371 | −0.010 | 0.851 | 0.412 | 0.030 | 0.851 | 1.089 |
| 0.02 | 0.14 | −0.027 | −0.184 | 0.210 | −0.312 | −0.577 | −0.091 | 1.332 | |
| 0.33 | 0.47 | 0.234 | −0.023 | 0.689 | −0.030 | −0.374 | 0.671 | 1.373 | |
| 0.48 | 0.50 | 0.449 | 0.308 | 0.643 | 0.597 | 0.498 | 0.859 | 1.343 | |
| 0.11 | 0.32 | 0.648 | 0.199 | 0.834 | 0.780 | 0.046 | 1.011 | 1.356 | |
| Tumblr | 0.16 | 0.37 | 0.141 | 0.003 | 0.622 | 0.002 | −0.171 | 0.283 | 1.094 |
| 0.23 | 0.42 | 0.203 | −0.097 | 0.419 | −0.064 | −0.455 | 0.272 | 2.523 | |
| 0.01 | 0.11 | −0.010 | −0.151 | 0.276 | −0.055 | −0.207 | 0.142 | 1.046 | |
| 0.01 | 0.11 | −0.212 | −0.450 | −0.143 | −0.294 | −0.515 | −0.171 | 1.066 | |
| Youtube | 0.09 | 0.29 | 0.359 | 0.201 | 0.623 | 0.139 | −0.169 | 0.448 | 1.680 |
| Turnover (TO) | 13.14 | 30.58 | 1.000 | 1.000 | 1.000 | 1.000 | 1.000 | 1.000 | 1.000 |
| Control variables | |||||||||
| Age | 83.46 | 50.75 | 1.000 | 1.000 | 1.000 | 1.000 | 1.000 | 1.000 | 1.022 |
| Type | 0.53 | 0.50 | 1.000 | 1.000 | 1.000 | 1.000 | 1.000 | 1.000 | 1.057 |
Table 2.
Construct reliability, convergent validity and discriminant validity (Fornell–Larcker criterion).
Table 2.
Construct reliability, convergent validity and discriminant validity (Fornell–Larcker criterion).
| CR | AVE | E-Q | SN | TO | AGE | TYPE | |
|---|---|---|---|---|---|---|---|
| E-Q | 0.745 | 0.532 | 0.677 | ||||
| SN | n.a. | n.a. | −0.223 | 1.000 | |||
| TO | n.a. | n.a. | −0.249 | 0.230 | 1.000 | ||
| AGE | n.a. | n.a. | −0.035 | 0.040 | −0.007 | 1.000 | |
| TYPE | n.a. | n.a. | −0.086 | 0.097 | 0.091 | −0.096 | 1.000 |
Note: The square root of AVE’s are shown diagonally in bold. CR: composite reliability; AVE: average variance extracted.
Table 3.
Discriminant validity (heterotrait–monotrait (HTMT) criterion).
| E-Q | SN | TO | AGE | TYPE | |
|---|---|---|---|---|---|
| E-Q | |||||
| SN | 0.247 | ||||
| TO | 0.292 | 0.230 | |||
| AGE | 0.069 | 0.040 | 0.007 | ||
| TYPE | 0.112 | 0.097 | 0.091 | 0.096 |
Table 4.
Inner variance inflation factor (VIF) values.
| E-Q | SN | TO | AGE | TYPE | |
|---|---|---|---|---|---|
| E-Q | 1.000 | 1.064 | |||
| SN | 1.055 | ||||
| TO | |||||
| AGE | 1.018 | ||||
| TYPE | 1.045 |
Table 5.
Assessment of structural model.
| Hypothesis/Relationships | Path Coefficient | Confidence Intervals (Bias Corrected) | Supported |
|---|---|---|---|
| H1: E-Q → TO | −0.299 *** (3.875) | (−0.429; −0.201) | Yes |
| H2: SN → TO | 0.132 † (1.918) | (0.005; 0.233) | Yes |
| H3: E-Q → SN | −0.207 *** (3.806) | (−0.290; −0.118) | Yes |
| H4: E-Q → SN → TO | −0.027 1 | (−0.061; −0.001) | Yes |
| H5: E-Q × SN → TO | −0.402 * (2.214) | (−0.667; −0.081) | Yes |
| Age | −0.003 ns (0.082) | (−0.056; 0.064) | |
| Type | 0.062 * (2.027) | (0.013; 0.108) |
*** p < 0.001; * p < 0.05; † p < 0.1; ns: not significant (based on t(4999), two-tailed test) 1 see Table 6.
Table 6.
Mediation effect.
| Effect | Path | Original Sample (O) | Sample Mean (M) | Bias | 95% Bias-Corrected Confidence Intervals | Sig. | Type of Mediation | VAF |
|---|---|---|---|---|---|---|---|---|
| Direct effect | c | −0.321 | −0.342 | −0.021 | (−0.435; −0.222) | |||
| Direct effect | c’ | −0.3 | −0.315 | 0.015 | (−0.445; −0.199) | Yes | ||
| Indirect effect | a × b | −0.027 | −0.026 | −0.002 | (−0.061; −0.001) | Yes | Complementary partial mediation | 0.082 |
Table 7.
Results of invariance measurement testing using permutation.
| Constructs | Configurational Invariance (Step 1) | Compositional Invariance (Step 2) | Partial Measurement Invariance | Equal Mean Assessment (Step 3a) | Equal Variance Assessment (Step 3b) | Full Measurement Invariance | |||
|---|---|---|---|---|---|---|---|---|---|
| Original Correlation | 5.0% | Original Differences | Confidence Interval | Original Differences | Confidence Interval | ||||
| E-Q | Yes | 0.922 | 0.834 | Yes | −0.351 | [−0.230; 0.197] | 0.273 | [−0.734; 0.785] | No/Yes |
| SN | Yes | 1.000 | 1.000 | Yes | 0.113 | [−0.206; 0.198] | −0.189 | [−0.547; 0.415] | Yes/Yes |
| SN moderator | Yes | 0.180 | 0.078 | Yes | −0.047 | [−0.194; 0.181] | −0.286 | [−0.889; 0.919] | Yes/Yes |
| TO | Yes | 1.000 | 1.000 | Yes | 0.273 | [−0.172; 0.262] | 0.439 | [−2.716; 2.257] | No/No |
| Age | Yes | 1.000 | 1.000 | Yes | −0.087 | [−0.201; 0.207] | 0.169 | [−0.564; 0.530] | Yes/Yes |
| Type | Yes | 1.000 | 1.000 | Yes | 1.121 | [−0.228; 0.222] | −1.918 | [−0.054; 0.006] | No/No |
Step 1: Normally, this is automatically established. Step 2: The original correlation is higher than 5% and the permutation p-value is higher than 0.05. Step 3: (a) Not all confidence intervals of latent variable score means include the original differences value, so there is not equal means. (b) Not all confidence intervals of latent variable score variances include the original differences value, so there are not equal variances.
Table 8.
Results of hypothesis testing.
| Low Family Ownership | High Family Ownership | |||||||
|---|---|---|---|---|---|---|---|---|
| Hypothesis/Relationships | Path Coefficient | CIs (Bias Corrected) | Path Coefficient | CIs (Bias Corrected) | Path Coefficient Differences | p-Value Henseler’s MGA | p-Value Permutation Test | Supported |
| H6: E-Q → TO | −0.559 *** | [−0.834; −0.253] | −0.208 *** | [−0.286; −0.139] | 0.351 | 0.989 ** | 0.001 *** | Yes/Yes |
| H7: SN → TO | 0.007 | [−0.150; 0.220] | 0.183 * | [−0.032; 0.289] | 0.176 | 0.914 | 0.265 | No/No |
| H8: E-Q → SN | −0.170 | [−0.439; −0.038] | −0.223 *** | [−0.298; −0.134] | 0.053 | 0.310 | 0.620 | No/No |
| H9: E-Q → SN → TO | −0.001 | [−0.076; 0.052] | −0.040 * | [−0.091; 0.004] | 0.040 | 0.116 | 0.395 | No/No |
| H10: E-Q × SN → TO | 0.191 | [−0.358; 0.463] | −0.538 * | [−0.768; −0.110] | 0.729 | 0.015 * | 0.080 * | Yes/Yes |
*** p < 0.001; ** p < 0.01; * p < 0.05.
© 2018 by the authors. Licensee MDPI, Basel, Switzerland. This article is an open access article distributed under the terms and conditions of the Creative Commons Attribution (CC BY) license (http://creativecommons.org/licenses/by/4.0/).
Share and Cite
MDPI and ACS Style
Barroso, A.; González-López, Ó.R.; Sanguino, R.; Buenadicha-Mateos, M. Analysis and Evaluation of the Largest 500 Family Firms’ Websites through PLS-SEM Technique. Sustainability 2018, 10, 557. https://doi.org/10.3390/su10020557
AMA Style
Barroso A, González-López ÓR, Sanguino R, Buenadicha-Mateos M. Analysis and Evaluation of the Largest 500 Family Firms’ Websites through PLS-SEM Technique. Sustainability. 2018; 10(2):557. https://doi.org/10.3390/su10020557
Chicago/Turabian StyleBarroso, Ascensión, Óscar R. González-López, Ramón Sanguino, and María Buenadicha-Mateos. 2018. "Analysis and Evaluation of the Largest 500 Family Firms’ Websites through PLS-SEM Technique" Sustainability 10, no. 2: 557. https://doi.org/10.3390/su10020557
Note that from the first issue of 2016, this journal uses article numbers instead of page numbers. See further details here.