Analyzing the Effects of Car Sharing Services on the Reduction of Greenhouse Gas (GHG) Emissions

1
Technology Management, Economics and Policy Program, College of Engineering, Seoul National University, 1 Gwanak-ro, Gwanak-gu, Seoul 08826, Korea
2
Graduate School of Engineering Practice, Seoul National University, 1 Gwanak-ro, Gwanak-gu, Seoul 08826, Korea
*
Author to whom correspondence should be addressed.
Sustainability 2018, 10(2), 539; https://doi.org/10.3390/su10020539
Submission received: 7 February 2018
/
Revised: 8 February 2018
/
Accepted: 9 February 2018
/
Published: 17 February 2018
Abstract
:This study examines the environmental impacts of roundtrip car sharing services by investigating transportation behavior. Car sharing should contribute to reduced greenhouse gas GHG emissions; however, such schemes include both positive and negative environmental effects, including: (1) reduced CO2e (carbon dioxide equivalent) from substituting private vehicle use for more fuel-efficient car sharing vehicles, (2) increased CO2e as car-less individuals switch from public transit to car sharing vehicles and (3) reduced CO2e due to fewer vehicles. This study examines the impacts of this modal shift on greenhouse gas (GHG) emissions using three types of models: a mixed logit model to analyze car sharing service preferences; a binary logit model to analyze whether individuals are willing to forgo vehicle ownership or planned purchases to use car sharing services; and a linear regression to determine how much private vehicle or public transportation use would be replaced by car sharing and the resulting effects on mobility. Total emissions from the current car sharing market equal 1,025,589.36 t CO2e/year. However, an increase in electric vehicle (EV) charging stations to 50% of the number of gasoline-fuel stations would increase the probability of electric car sharing vehicle use, thereby reducing emissions by 655,773 t CO2e. This study shows that forgoing vehicle purchases does not offset the increased GHG emissions caused by the shift from public transportation or private vehicle use to car sharing.
1. Introduction
Automobiles have long been considered to be a private means of transportation. However, with the introduction of car sharing services, cars can be rented on an “as needed” basis for as little as 10 min [1]. Car sharing also allows individuals to benefit from vehicle use without the fixed costs and responsibilities associated with ownership, because maintenance, repairs and insurance costs are included in the car sharing tariff [2]. Car sharing is evolving as a more flexible service, with one-way trips and delivery services. Roundtrip car sharing requires one to return to the designated station from which the car was rented. However, one-way car sharing allows one to return a car to a different station than the one from which it was rented [3]. This type of delivery service, which delivers the car sharing vehicle to the desired location, launched in 2017 [4]. The car sharing market has experienced rapid growth, because it provides a flexible, alternative mode of transportation. According to Navigant Research, the global car sharing market was valued at USD 1.1 billion in 2015 and is expected to grow to USD 6.5 billion by 2024 [5]. The car sharing market in South Korea is also growing rapidly, from KRW (US dollar equivalent as of January 2017 is USD 1 = KRW 1185 [6]. However, for ease of calculation, this study used USD 1 = KRW 1000.) 600 million (=USD 600,000) in 2011 to KRW 100 billion (=USD 100 million) in 2016 and it is expected to reach KRW 500 billion (=USD 500 million) by 2020 [7].
As a solution to the societal problems of air pollution and heavy traffic congestion, many countries, states and cities provide support for car sharing services. Washington State in the U.S. offers tax credits (up to USD 60/employee/year) to employers who use car sharing [8]. Furthermore, the District Department of Transportation exempted car sharing vehicles from paying to use metered spaces [9]. Thus, car sharing is an especially attractive transit option in congested cities. Seoul has suggested various policies to reduce the volume of private vehicle traffic and foster car sharing. In September 2012, the mayor declared Seoul to be a sharing city, initiating various policies to support Nanum-car, Seoul’s car sharing service. First, shared-vehicle providers were given a 50% discount for public parking lot spaces. Second, providers of electric vehicle (EV) sharing services were given subsidies towards the purchase of electric vehicles: KRW 15 million (=USD 15,000) from the city and KRW 15 million from the national government. Additionally, free installation was provided for normal-speed EV chargers. Third, a policy for integrated transfer discounts on the public transit system was implemented. Members using public transit for journeys of less than 30 min to reach a car sharing station receive an average discount of KRW 300–1000 (USD 0.3–1) per use [10].
Within the transportation sector, the sharing economy is emerging as a solution to urban problems of traffic congestion and excessive consumption. Such measures are gaining increasing attention and support, especially with increasing concern over environmental issues. However, as car sharing services can affect individual’s travel decisions, consideration should be given to behavioral changes resulting from this alternative mode of transportation. People who would otherwise have used public transport might instead choose to drive a car sharing vehicle. Such analyses should consider the individual’s travel activity and change in mode of transportation. This study examines the effects of car sharing services on greenhouse gas (GHG) emissions by considering changes in travel mode, mobility and decisions on vehicle ownership.
The remainder of this paper is organized as follows. Section 1 reviews the literature on car sharing. Section 2 outlines the data used in this study and presents the methodology used to analyze the demand for car sharing services and the resulting environmental effects. Section 3 discusses the environmental effects of car sharing on GHG emissions and Section 4 presents the conclusions and implications of this study.
Revealed preference (RP) methods are commonly used to examine the actual market share of a product. However, this approach has shortcomings when analyzing the demand for a newly revealed product, or when investigating unobserved consumer behavior. Thus, stated preference (SP) methods are commonly used to analyze unobserved behaviors, such as non-selection of a product or a preference for unreleased products. Specifically, discrete choice modeling (DCM), based on SP data, is widely used to analyze travel choice behavior and identify behavioral responses to chosen situations not revealed in the market. Koo et al. [11] used the mixed logit model to analyze consumer preferences for a new incentive program that used a reward-points card to promote green consumption. Hong et al. [12] evaluated government subsidy policies for a vehicle-to-grid system by examining consumer demand using a mixed logit model. Dissanayake and Morikawa [13] used both RP and SP data to model trip decision behavior and investigated how the preference for trip-sharing affects modal choice preferences. Catalano et al. [14] analyzed the shift in behavior in response to the introduction of carpooling and car sharing at a tourist site in Palermo, Italy, using multinomial and nested logit models. That study analyzed the potential demand for carpooling and car sharing in an area of congested traffic (the tour site area) through a scenario analysis involving imposed parking costs and limited traffic area for private vehicles. Similarly, many studies use SP data to analyze consumer preferences in newly launched products or services or to further estimate the effects of adopting such products or services.
Many researchers have analyzed the various positive and negative implications of car sharing, including social, economic and environmental effects [2,15,16,17]. These include reduced emissions [18], fewer private vehicles [19], reduction in travel distance [20] and increased mobility [21].
Katzev [16] examined various possible impacts of roundtrip car sharing, such as changes in car ownership and mobility. The findings showed that reduced car ownership did not correspond to a reduction in the number of miles of vehicle travel, which increased among non-car owners. Martin and Shaheen [22] conducted a before-and-after analysis among active users of eleven car sharing organizations during autumn 2008, examining the effects of roundtrip car sharing on public transit and non-motorized travel. The results showed slightly negative impacts on public transit use but the magnitude and direction of shifts varied between different car sharing organizations. The reduction in public transit use was approximately equivalent to the reduction in driving or vehicle ownership by other members after joining the car sharing scheme. A further study by Martin and Shaheen [17] estimated the impacts of roundtrip car sharing in North America on net GHG emissions as a result of changes in travel behavior. It included observed impacts (emission changes are physically observable and measurable) and unobserved impacts (such as going without vehicles that otherwise would have been driven). When considering modal shifts, the shift from public transport was not included in emission calculations, as public transport operates regardless of the presence of higher or lower passenger numbers. The results showed that the emissions reductions achieved by some households compensated for the small emissions increase in other households. Thus, the average net effect was −0.84 t GHG/year per household. In terms of limitations, these studies did not consider individual preferences for car sharing vehicles. Chen and Kockelman [15] examined the lifecycle impacts of car sharing adoption on energy use and GHG emissions in the U.S. The results show that current car sharing members reduced their average individual transportation energy use and GHG emissions by approximately 51%. Nijland et al. [23] estimated the change in mobility as a result of car sharing by examining changes in car ownership and use and considered each transport mode, including car, train, bus and bicycle. By evaluating two mobility effects, the study found an average reduction of 1600 car km per year compared to before car sharing, which corresponds to a reduction of approximately 250 kg of CO2 among car sharers.
Shaheen et al. [3] examined the operators’ perspectives on the benefits and limitations of one-way and roundtrip car sharing. The main reported benefit of one-way car sharing was service flexibility, while the primary limitation expressed was decreased certainty in reservation and parking availability. Firnkorn and Müller [18] analyzed the environmental effects of a one-way car sharing service called car2go in Ulm, Germany. The shift from public transport or private car use to car sharing vehicles was taken into consideration and resulted in an average reduction of −312 to −146 kg CO2/year for car sharers. Some studies have suggested more sustainable ways of operating car sharing. Martin and Shaheen [24] have examined the impacts of car sharing vehicles on car ownership, transportation modal shifts, vehicle miles traveled and greenhouse gas emissions in five North American cities. The results indicated that the average modal shift related to bus transportation that could be attributed to car sharing varied from −48% to +8%, depending on the cities and suggested that between 2% and 5% of car sharing users had sold vehicles they owned. Baptista et al. [25] studied the energy, environmental and mobility impacts of car sharing through empirical results for Lisbon, Portugal. The study demonstrated that employing hybrid vehicles and EVs could reduce CO2 emissions by approximately 35% and 65%, respectively.
Many studies discuss the effects of car sharing; however, results are inconsistent due to differences in methodologies and data collection. Existing literature suggests that behavioral changes in transport use due to car sharing differ according to individual circumstances. Thus, it is essential to take individual preferences and characteristics into account when estimating the total net effect of car sharing services. This study makes three distinct contributions to the literature. First, it accommodates individual characteristics and preference heterogeneity. Second, it suggests more environmentally compatible ways of operating car sharing services by examining the environmental effects in hypothetical market situations, including when EV infrastructure expands through car sharing services. Third, it analyzes the effects of car sharing on the willingness to own a vehicle if supplementary services, such as vehicle delivery or one-way drive, are introduced.
2. Materials and Methods
2.1. Data Description
An online survey was designed to investigate individual behavior related to transportation mode and preferences and intentions for using car sharing services. The first section collects data on respondents’ socio-demographic characteristics: gender, age, location, occupation, household and individual income level and number of family members. The second section contains questions regarding travel time and use of transportation modes, as well as their background knowledge and understanding of car sharing services. The third section includes a discrete choice experiment. The online survey was conducted by a professional survey company (Gallup Korea) in April 2017. The respondents consisted of 1022 adults aged 20–59 from urban areas of Korea. Purposive quota-sampling was used, based on respondents’ age, gender and geographical location, to ensure sample representativeness. Table 1 summarizes the demographic characteristics of survey respondents.
2.2. Survey Design
A discrete choice experiment was conducted to analyze consumer preferences for attributes that explain and affect the use of car sharing. Because car sharing services are only used by those holding a driving license, the choice experiment involved only 909 of the total 1022 respondents. After excluding missing data, 807 observations were used for the empirical study of car sharing services.
To design an appropriate choice experiment for car sharing services, it was necessary to identify the core attributes and assign levels accordingly. For this choice experiment, six attributes were identified as affecting modal choice for car sharing services: the availability of fueling and charging stations, fuel type, vehicle type, vehicle pickup and delivery service, one-way trip options and the cost of the car sharing service. The attributes and levels of car sharing services for the discrete choice experiment are shown in Table 2.
The choice experiments were designed using these six attributes and respondents were asked to choose their preferred alternative among hypothetical scenarios for car sharing services. Car sharing services have become more convenient to use with the introduction of delivery and pick-up services in South Korea. These options are considered in the discrete choice model, in order to take individual preferences surrounding these services into account. Subsequently, respondents were asked whether they would be willing to use the service. Those who responded that they were not willing to use any of the car sharing options were categorized under the “no-choice” option in the subsequent analysis, which assumes that they retain their existing transport behavior.
A total of 144 (=3 × 3 × 2 × 2 × 4) possible car sharing service options (excluding the attribute of fuel charging station supply rate) exist based on the combinations shown in Table 2. However, due to the difficulty associated with each respondent evaluating all 144 options, 16 orthogonal alternatives were selected, using a fractional factorial design, to assure the orthogonality of each attribute within and between alternatives. These were further divided into eight choice sets, comprising two randomly arranged alternatives. As the attribute of the fuel charging station can be confusing if the level differs for each choice, it was considered separately to the other attributes. Additionally, to increase the randomness of the experiment and also consider the fuel charging station supply rate, four different survey types were implemented, with different arrangements of the collective choices. Respondents were then randomly chosen to answer different survey types.
2.3. Methodology
As shown in Figure 1, data concerning the transportation mode used by each individual were collected first. This included car ownership, fuel efficiency, distance driven, duration of public transport use, etc. Second, changes in transport behavior were analyzed (such as disposing of an owned vehicle, forgoing the purchase of a vehicle, increasing or decreasing mobility and shifting to car sharing services). Section 4.1 introduces the empirical models used to examine individual behavioral changes resulting from the introduction of car sharing services. Lastly, the environmental effects of these behavioral changes were analyzed. Details about how these effects were calculated are discussed in Section 4.2.
2.3.1. Empirical Model
This study uses a discrete choice model to examine the effects of car sharing services and changes in consumer behavior. The selected mixed logit model [26,27] is widely used to analyze consumer preferences, allowing the consideration of individual heterogeneity by assuming that a set of preference parameters follows a continuous distribution, such as a normal distribution. The utility that respondent n chooses alternative i of the car sharing service can be written as Equation (1):
where type I exreme value distribution and .
A binary logit model was used to analyze the attributes of the car sharing services that are affected by relinquishing personal ownership of a vehicle. A binary model was necessary, because there were only two outcomes: disposal of the owned vehicle in favor of car sharing or not and forfeiting a vehicle purchase or not. The equation for the binary logit model is as follows:
where .
A linear regression model was used to analyze how the attributes of car sharing services, the social demographic characteristics of individuals and their attitudes towards the environment affected the extent to which they would substitute car sharing services for their previous mode of transportation or how much their total travel mileage changed due to car sharing use. Equation (3) indicates the likelihood of a car owner substituting their own car for use of a car sharing vehicle.
Similarly, the linear regression model was designed to examine the likelihood of an individual replacing public transport use with car sharing, as follows:
Lastly, the change in total mileage indicates how an individual would change their mobility as a result of adopting car sharing services. For some, travel distance might increase if car sharing vehicles were more convenient than public transport. Conversely, some individuals might reduce their mobility after adopting car sharing, for example, if they find it inconvenient making an advance reservation or collecting the vehicle from a car sharing station. These types of positive or negative changes in mobility as a result of adopting car sharing were examined using the linear regression model in Equation (5).
2.3.2. Framework for Analyzing GHG Emission Impacts
This study estimates and compares the effects of car sharing in various market situations. When analyzing the GHG emission impacts of car sharing services, it is important to understand changes in individual behavior regarding transportation mode due to introduction of a car sharing option. The introduction of car sharing services can introduce three possible transport behavior changes: (1) an individual with a private car replaces it with a car sharing vehicle, (2) an individual using public transit replaces it with a car sharing vehicle and (3) the desire for ownership of a vehicle changes, for example if a vehicle owner disposes of a vehicle or a prospective buyer abandons the planned purchase of a vehicle. These behavioral changes affect GHG emissions.
Figure 2 shows individual behavioral changes, because the effects of car sharing services (and the resulting GHG emissions) differ according to the car sharing vehicle chosen by the individual. Furthermore, an individual can have more than one effect. For example, a person who uses their own car and public transport may decide to dispose of their vehicle and use car sharing services. In that case, all three effects are taken into consideration. The first effect comes from the difference in fuel efficiency between the private vehicle and the car sharing vehicle. Car sharing vehicles may or may not have higher fuel efficiency compared to private vehicles. The change in GHG emissions was estimated by considering the extent to which an individual substitutes driving their own car for use of a car-sharing vehicle. For those who dispose of their own vehicle, 100% of private driving would be replaced by car sharing. This first effect is calculated using Equation (6). Table 3 provides detailed explanations of the variables used in the calculation.
The first effect is the shift from driving one’s own car to a car sharing vehicle, which can be defined as:
where i is the car sharing index; n is the individual index; CPni is the choice probability (%) of an individual n choosing a car sharing alternative i; CSVni is car sharing use (km) shifted from owned vehicle driving; CSEni is car sharing emissions (gCO2e/km); MCni is the mobility change (%); OCEi is owned car emissions (gCO2e/km); n1 is the number of car owners in the sample; and N1 is the number of car owners in the population.
The following variables were calculated as follows:
A second effect results from the change in GHG emissions resulting from the use of car sharing vehicles by a non-car-owning individual. These effects were calculated using Equations (7) and (8), which represent the effect of switching from bus or subway use, respectively.
For switching from bus use, the equation can be defined as:
where CSBni is car sharing use (km) shifted from bus use; BEn is bus emissions (gCO2e/km); n2 is the number of bus users who hold a driver’s license in the sample; and N2 is the number of bus users who hold a driver’s license in the population.
The following variables were calculated as follows:
For switching from subway use, the equation can be defined as follows:
where CSSni is car sharing use (km) shifted from subway use; SEi is subway emissions; n3 is the number of subway users who hold a driver’s license in the sample; and N3 is the number of subway users who hold a driver’s license in the population.
The following variables are calculated as follows:
The third effect relates to the reduction in emissions due to the reduced production of vehicles, based on life cycle assessment. With the change in desire to own a vehicle, environmental impacts are reduced, such as the amount of CO2e emitted during vehicle production. The third effect is calculated using Equation (9):
where CPDni is the choice probability of disposing of car ownership; EPC is emissions during car production; n4 is the number of individuals with changed car ownership in the sample; and N4 is the number of vehicles sold per day.
3. Results
3.1. Empirical Results
First, the heterogeneous preferences for car sharing use and vehicle type were estimated using the mixed logit model. The variables were effect-coded to consider the no-choice option, as suggested by Vermeulen et al. [38]. Second, the binary logit model was used to analyze whether individuals were willing to dispose of their vehicle or forgo vehicle purchases in order to use car sharing services. Third, linear regression models were used to understand the extent to which car sharing could replace private vehicle and public transport use and change mobility. The results are shown in Table 4.
The results of the mixed logit model indicate that the utility of a car in a car sharing market increases with an increasing number of fueling and charging stations. Fuel-type preference for car sharing vehicles follows the sequence: electric > gasoline or diesel > LPG. The SUV class is the preferred vehicle type, which seems to reflect the growing interest in SUVs in South Korea. Moreover, respondents expressed a preference for car sharing services that provide pick-up and delivery options and prefer the possibility of making one-way trips. Lower costs are preferred. The no-choice variable is used to compare whether an individual would prefer using car sharing vehicles or retaining their previous transport options. Thus, if the utility of the no-choice concept exceeds the sum of utilities across all other attributes, it is assumed that the individual would not use a car sharing vehicle.
In the binary logit analysis of the intention to dispose of a private vehicle or forgo the purchase of a vehicle, the most important car sharing attributes were station rate, fuel type and the cost of the car sharing service. For the binary logit model, the coefficients representing individual preferences did not show statistically significant variations. Thus, we used the binary logit model with fixed coefficients and considered preference heterogeneity using social demographic information (e.g. age, education level and individual income level) and attitudes towards the environment. The preferences for one-way options or delivery services did not significantly influence decisions to forfeit private vehicle ownership.
The linear regression analysis of individual characteristic variables showed that the one-way option increased mobility. Also, older individuals and those of lower educational background were less likely to adopt car sharing services. As with the results above, individuals practicing more eco-friendly behavior were more likely to choose higher mobility by switching to car sharing services. This result seems to be due to recognition that car sharing represents an environmentally friendly mode of transportation. Lastly, higher individual income positively influenced the change in mobility. These preferences for car sharing use and vehicle type were further considered when estimating the effect of car sharing on GHG emissions in the following section.
3.2. Estimating Car Sharing Impacts on GHG Emissions
The framework for estimating GHG emission impacts and descriptions of the variables used in the calculations, are shown in Section 4.2. The scenario analysis used in this study enabled comparison of the different GHG emission impacts associated with car sharing services for different market situations. To compare the results, a baseline scenario was set at the attribute levels, thereby creating a hypothetical scenario most similar to the current car sharing market (see Table 5).
For the baseline scenario, three car sharing types were used in the car sharing market, as described in Table 6. Given this scenario, total GHG emissions were calculated as 2809.83 tCO2e. This indicates that, with car sharing services, GHG emissions were 1,025,589.36 tCO2e per year (Table 6). This translates to four specific effects related to the introduction of car sharing services: Effect 1 (−5928.90 tCO2e), Effect 2-1 (7069.30 tCO2e), Effect 2-2 (4763.77 tCO2e) and Effect 3 (−3094.33 tCO2e), amounting to the total GHG emissions of 1,025,589.36 t CO2e per year. In South Korea, GHG emissions attributed to the road transport sector in 2014 were 85,440,000 tCO2e [39]. Thus, the introduction of car sharing services suggests a reduction of approximately 1.2% in total CO2 emissions from the road transport sector.
3.3. Effect of Increased EV Infrastructure on GHG Emissions
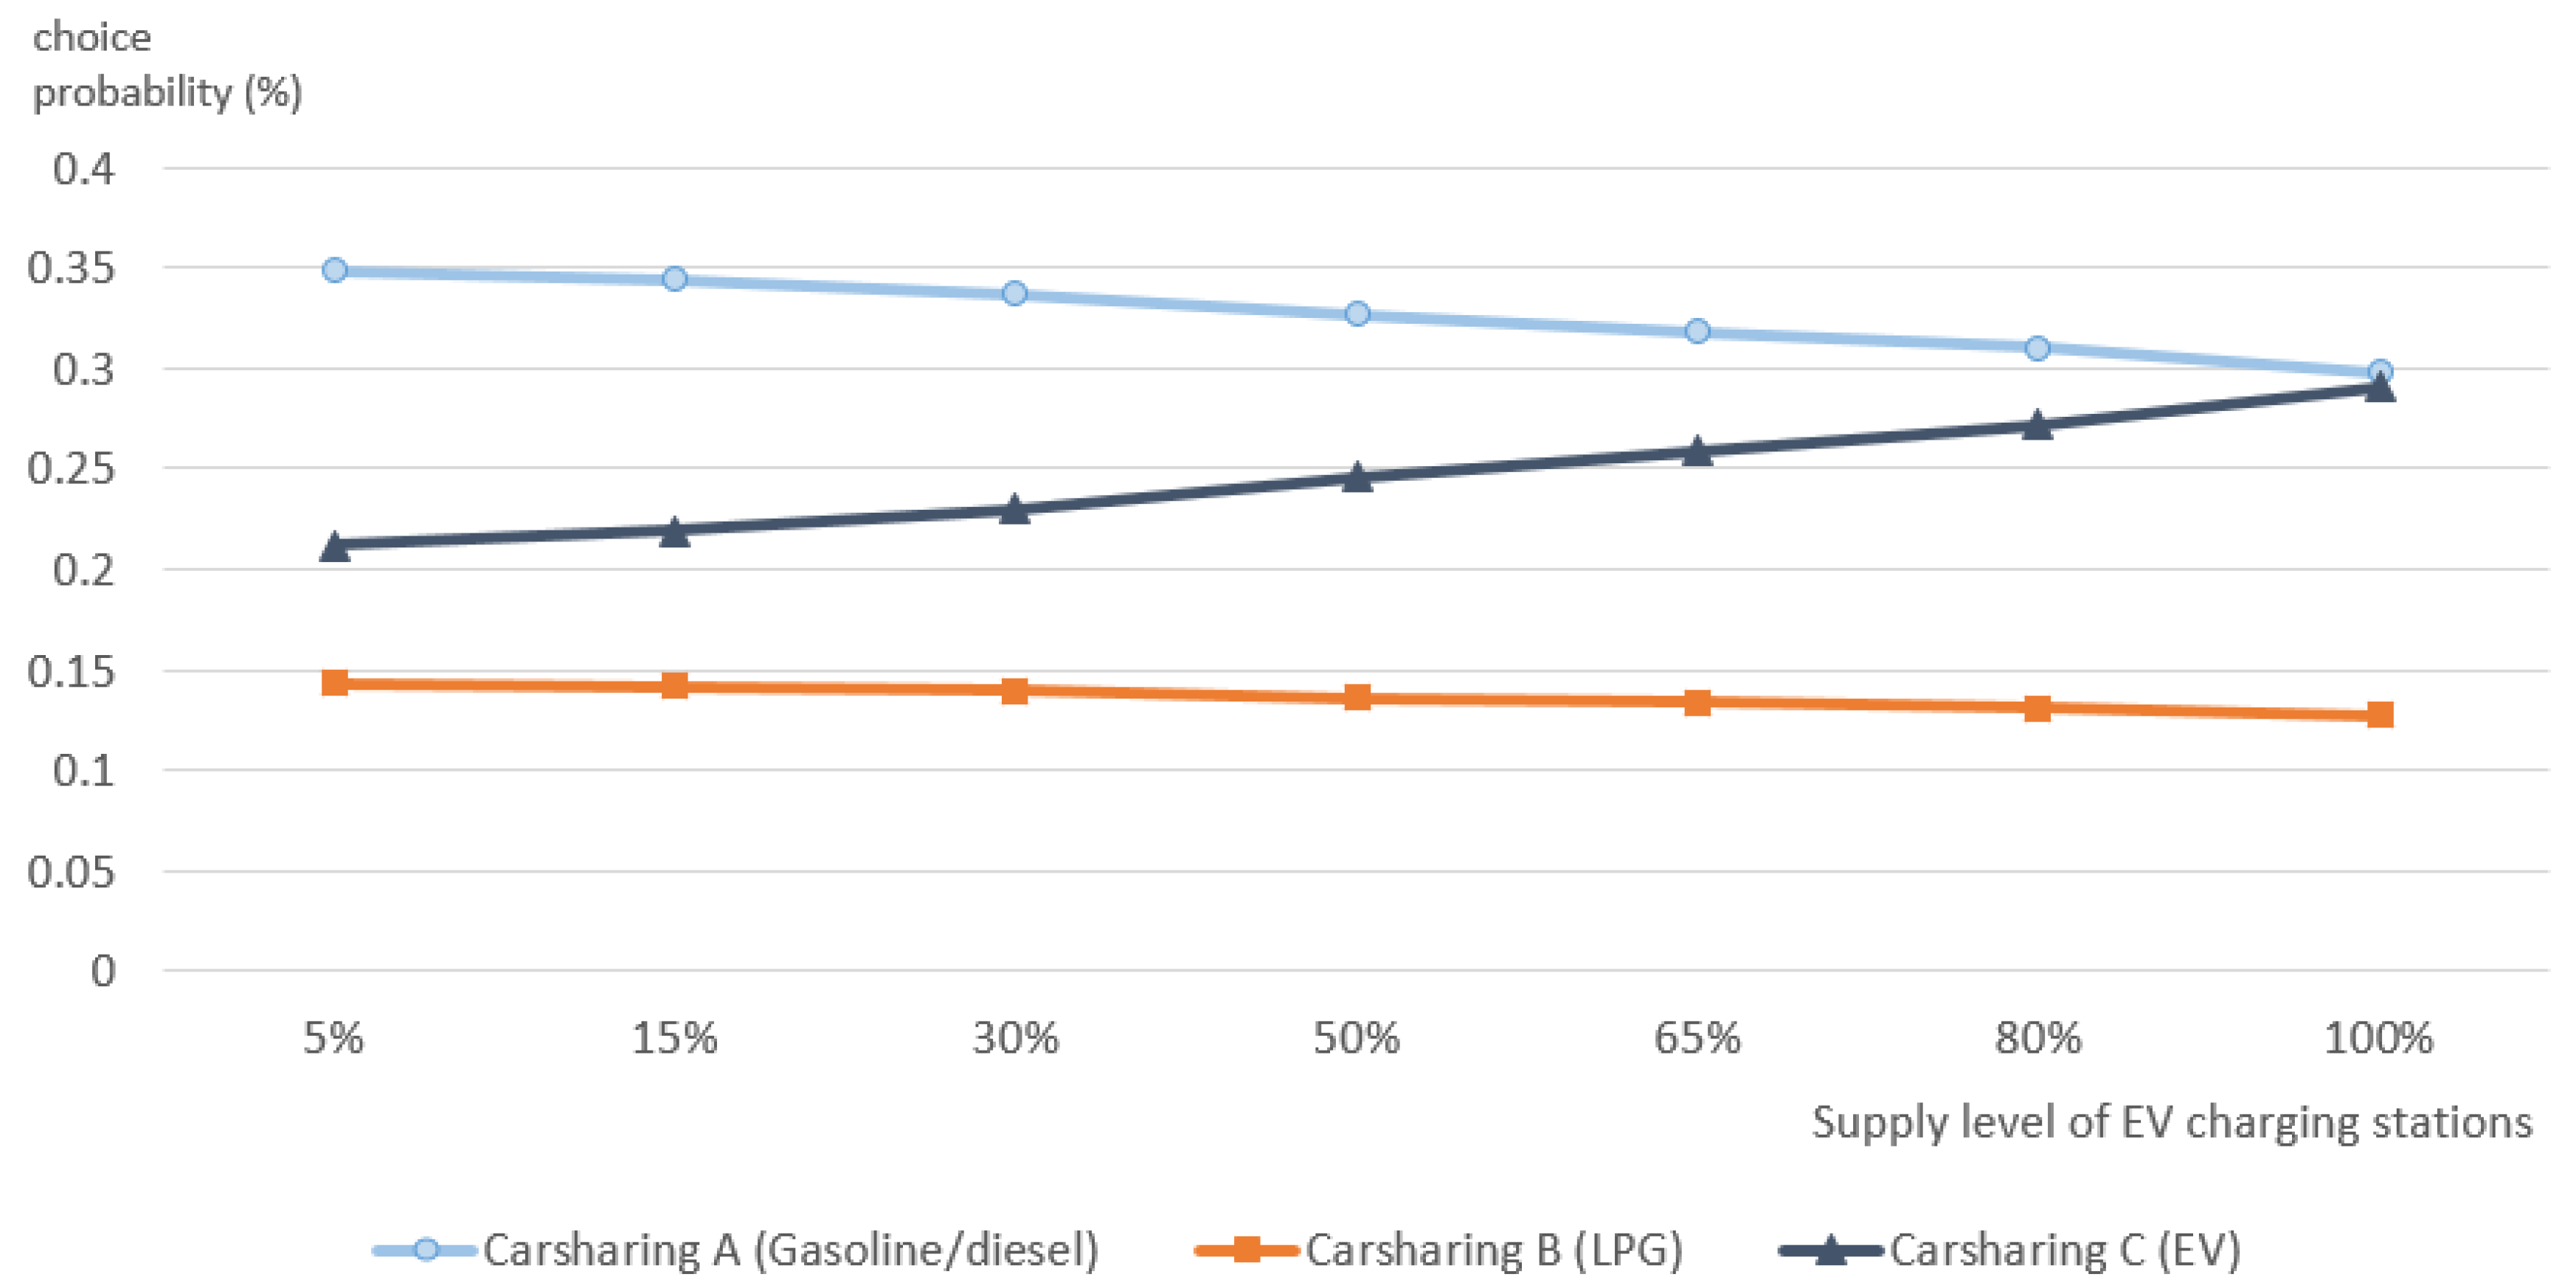
EVs have the advantage of fuel efficiency; however, current uptake of EVs is discouraged by the perceived inconvenience of battery recharging. Thus, when analyzing this scenario, the probability of each type of car sharing vehicle was examined, along with the change in GHG emissions with an increasing number of charging stations. Figure 3 describes the change in the probability of each type of car sharing vehicle as the supply of EV charging stations increases. Although the total number of car sharing users remained fairly constant, individuals who previously preferred to use gasoline, diesel, or LPG car sharing vehicles became more willing to use the EV type for car sharing.
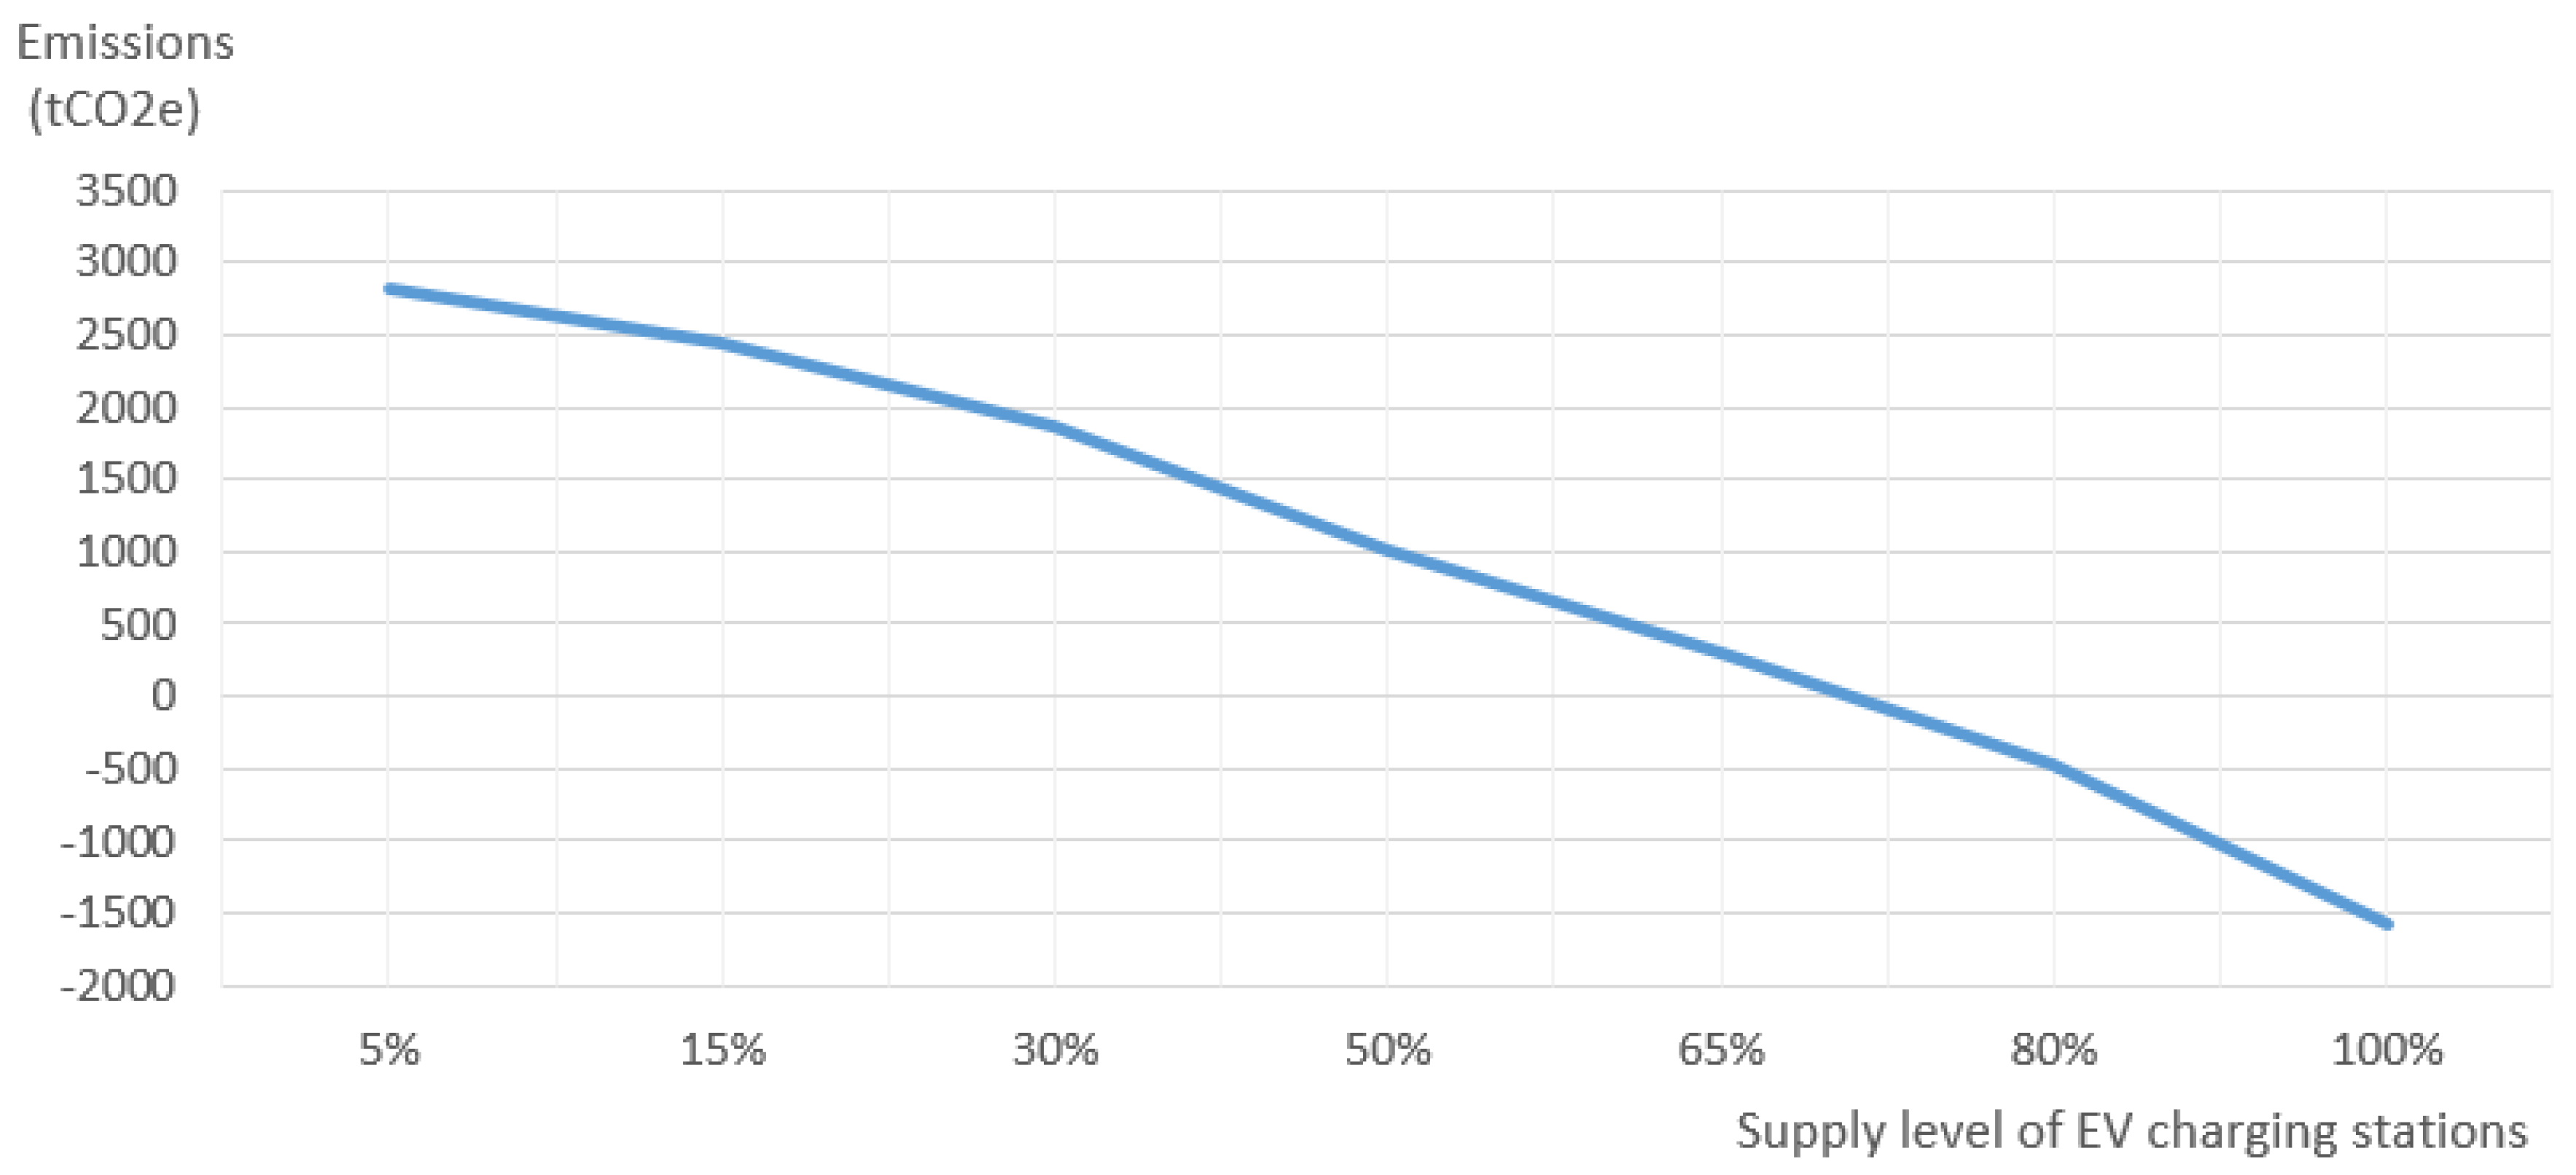
Figure 4 shows the reduction in total GHG emissions resulting from an increased probability of choosing EV car sharing. With an increase in EV infrastructure, more individuals were willing to drive electric car sharing vehicles. If the number of EV charging stations increased to approximately 50% that of gasoline stations, the probability of choosing electric car sharing vehicles increased. Thus, GHG emissions from vehicle use could be reduced to 1013.19 tCO2e/day. Compared to the baseline scenario, this represents an emissions reduction of 1796.64 tCO2e per day (i.e., 655,773.6 tCO2e per year). If the number of EV recharging stations increased to match that of gasoline stations, emissions would be reduced to 1579.20 tCO2e/day; comparing that amount with the baseline scenario, the emissions reduction is 4389.03 tCO2e per day (i.e., 1,601,995.95 tCO2e per year). With an expansion of EV recharging infrastructure, car sharing services deliver emissions reductions when the number of recharging stations reaches 71.1% of gasoline/diesel stations. In this case, the emissions associated with the change in behavior of individuals switching to car sharing would equal zero. These findings indicate positive environmental effects from car sharing services if accompanied by an increase in the number of EV charging stations and associated infrastructure.
When calculating the effect of car sharing services, to eliminate potential confusion, a value of 629.19 gCO2e/kWh was used for the electric-emission factor, rather than reporting minimum and maximum values (393.33 and 865.05 gCO2e/kWh). In reality, however, the emission factor varies depending on the mix of green power generation options in the country. Thus, it would be more accurate to report estimates of the impacts as in Table 6.
By analyzing individual behavioral changes in the transport modes used in relation to car sharing services, the GHG emissions were estimated under typical current and hypothetical car sharing market conditions. Car sharing services provide an innovative mode of urban transportation, allowing individuals to use a car without many of the fixed costs associated with operating a private vehicle. However, the results show that current approaches to operating car sharing services are not environmentally friendly. Therefore, it should be considered whether car sharing services are a truly sustainable innovation within the transport system. Although current car sharing services are not eco-friendly in terms of GHG emissions, due to the related travel demands, the results suggest more environmentally friendly operation could be promoted, for example, by encouraging individuals to use more energy-efficient vehicles. However, this can only be done by increasing the number of EV charging stations to the extent that more individuals choose EVs rather than gasoline-fueled vehicles.
Furthermore, additional service options, such as pick-up and delivery of car sharing vehicles or a one-way trip option, are expected to encourage individuals to forgo their current vehicle ownership or planned vehicle purchases. However, the results also indicate that the probability of forgoing car purchases would be unlikely to significantly affect private vehicle ownership. Although the probability of choosing car sharing vehicles increases, individuals are not typically willing to dispose of their vehicles or forgo a planned vehicle purchase.
4. Discussion and Conclusions
4.1. Concluding Remarks and Contributions
This study examines the GHG emission impacts resulting from shifts in transportation mode. Using a mixed logit model and a binary logit model, consumer preferences and the probability of choosing car sharing or forfeiting ownership when using car sharing services were analyzed. To estimate the environmental impacts, the modal shift proportion and reduction in vehicle ownership resulting from the introduction of car sharing services were considered. The potential changes in car ownership resulting from the introduction of various car sharing services were also estimated using a binary logit model. Furthermore, individual characteristic variables were included when estimating user preferences, replacement rate and changes in mobility associated with the adoption of car sharing services. Since car sharing services are evolving to include more flexible services, like one-way and delivery options, this study takes such aspects into consideration.
The results show that extra GHG emissions resulting from the shift from public transport or privately-owned vehicles to car sharing outweigh the GHG reduction due to unpurchased or unproduced vehicles. The findings therefore imply that car sharing may not be as environmentally friendly as expected in terms of GHG emissions. Many people mistakenly assume that all sharing activities are environmentally beneficial. However, it is important to understand the true environmental effects of car sharing to inform more effective policies towards a sustainable society and transportation system.
While previous studies [24] have estimated the owned vehicle forfeit rate at 2–5%, this study estimated the probability of forgoing an owned vehicle at 16% in relevant areas. This estimate includes both vehicle owners and those who had intentions to purchase a vehicle in the next three years who instead opted for car sharing options. These results parallel those of Katzev [16], who demonstrated that decreases in car ownership did not correspond to a reduction in the number of miles traveled, which actually increased among non-car owners. Furthermore, while previous literature considered how the social and environmental impacts of one-way and roundtrip car sharing differed [3], this study also incorporated the impact of one-way and delivery services on the likelihood of choosing car sharing in lieu of vehicle ownership. These additional services may lead to more negative environmental impacts as vehicle travel increases. Analysis of car sharing vehicle preferences indicate that additional services such as vehicle delivery and the option to make one-way trips would increase the use of car sharing. In other words, increased car sharing flexibility leads to more individuals using car sharing vehicles. Thus, the composition of car sharing vehicles is important. A larger proportion of EVs among car sharing fleets would result in more positive environmental effects. Various types of vehicles, including EVs and different car sizes are typically allocated as car sharing vehicles. Unlike privately owned vehicles, car sharing vehicles are allocated by the service providers, such that customers choose among a limited range of shared vehicles available from the providers. Therefore, to reduce the negative environmental impacts of car sharing, more efficient vehicles (e.g,. higher fuel efficiency or longer life cycles) could be allocated. To reduce emissions in the transport sector through car sharing services, it is important to create an environment in which many more people could choose EV car sharing vehicles. Furthermore, in order to maximize this effect, it is important to achieve a greener mix of electricity generation options.
In summary, the proliferation of conventional car sharing vehicles has not made a significant contribution to GHG reduction. However, if the electric vehicle infrastructure were expanded, this analysis shows that total GHG emissions could be reduced to zero, compared to the current car sharing market situation. Thus, rather than supporting car sharing per se, a proliferation of fuel-efficient EV car sharing vehicles is a more effective means of reducing GHG emissions through car sharing services.
4.2. Limitations and Future Research Topics
The limitations of this study include the fact that environmental impacts were only considered in terms of GHG emissions, excluding social and economic impacts, such as the individual benefits of gaining access to a vehicle without the need to own it. However, such topics are beyond the scope of the present study, which focuses on the environmental impacts of car sharing. As previously mentioned, there are numerous positive effects associated with other aspects of car sharing, such as increased individual mobility at a cheaper cost than through private vehicle ownership. Nevertheless, the three main factors associated with positive and negative environmental effects were analyzed and suggestions were made for how car sharing services might be operated in a more environmentally friendly manner.
In this study, changes of behavior related to the introduction of car sharing services were estimated, as well as subsequent changes in GHG emissions. However, two unique features of car sharing services were not taken into consideration for calculation of GHG emission impacts. First, car sharing vehicles will have a shorter lifetime, as they are shared by many people. Thus, vehicles are changed more frequently than is a private car, which makes it more feasible to update car sharing vehicles with the latest environmentally friendly technology, generating more positive environmental effects. Second, the car sharing vehicle service life can be extended. Unlike private cars, disposal of the vehicle is the responsibility of the car sharing operator. Thus, the vehicle can be used to its maximum product life until it is no longer technically feasible. For further studies, more specific characteristics of car sharing could be considered to enable a more accurate evaluation of environmental effects.
Acknowledgments
This work was supported by the Korea Ministry of Environment (MOE) as part of the “Climate Change Correspondence Program” (2014001300001). This study is based on an M.A. thesis titled, “Analysing the Effects of Car sharing Services on GHG Emission Reduction,” conducted at Seoul National University (2017).
Author Contributions
The main framework for the research was developed by Yoonmo Koo and Jiyeon Jung. Specifically, Yoonmo Koo constructed the theoretical part of the study, while Jiyeon Jung designed the survey for the data collection and conducted the empirical analysis.
Conflicts of Interest
The authors declare no conflict of interest.
References
- Lee, S. A review of carsharing research: With a focus on domestic thesis and research papers. Inst. Korean Reg. Stud. 2015, 62, 3–17. [Google Scholar]
- Litman, T. Evaluating carsharing benefits. Transp. Res. Rec. 2000, 1702, 31–35. [Google Scholar] [CrossRef]
- Shaheen, S.A.; Chan, N.D.; Micheaux, H. One-way carsharing’s evolution and operator perspectives from the Americas. Transportation 2015, 42, 519–536. [Google Scholar] [CrossRef]
- Kim, Y. Hyundai Capital Boosts Carsharing with ‘Delivery Car’. Available online: https://www.koreatimes.co.kr/www/tech/2017/12/694_241426.html (accessed on 28 January 2018).
- Navigant. Carsharing Membership and Vehicle Fleets, Personal Vehicle Reduction, and Revenue from Carsharing Services: Global Market Analysis and Forecasts. 2013. Available online: https://www.navigantresearch.com/research/carsharing-programs (accessed on 28 June 2017).
- Bank of Korea. Available online: www.bok.or.kr (accessed on 28 January 2017).
- Shon, J. KISTI Market Report. Continuous Increase in Interest and Market Size of Sharing Economy; Korea Institute of Science and Technology Information: Daejeon, Korea, 2017. [Google Scholar]
- Millard-Ball, A. Car-sharing: Where and how it succeeds. In Transportation Research Board; The National Academies Press: Washington, DC, USA, 2005. [Google Scholar]
- District Department of Transportation. On-Street Carsharing Program. Available online: https://ddot.dc.gov/page/street-carsharing-program (accessed on 28 January 2018).
- Seoul Solution. Seoul Solution Main Activity: Policy Sharing. Available online: https://seoulsolution.kr/content/shared-transport-carsharing-seoul-nanum-car?language=en (accessed on 22 November 2016).
- Koo, Y.; Lee, M.; Cho, Y. A point card system for public transport utilization in Korea. Transp. Res. D 2013, 22, 70–74. [Google Scholar] [CrossRef]
- Hong, J.; Koo, Y.; Jeong, G.; Lee, J. Ex-ante evaluation of profitability and government’s subsidy policy on vehicle-to-grid system. Energy Policy 2012, 42, 95–104. [Google Scholar] [CrossRef]
- Dissanayake, D.; Morikawa, T. Investigating household vehicle ownership, mode choice and trip sharing decisions using a combined revealed preference/stated preference Nested Logit model: Case study in Bangkok Metropolitan Region. J. Transp. Geogr. 2010, 18, 402–410. [Google Scholar] [CrossRef]
- Catalano, M.; Lo Casto, B.; Migliore, M. Carsharing demand estimation and urban transport demand modelling using stated preference techniques. Eur. Transp. 2008, 40, 33–50. [Google Scholar]
- Chen, T.D.; Kockelman, K.M. Carsharing’s life-cycle impacts on energy use and greenhouse gas emissions. Transp. Res. D 2016, 47, 276–284. [Google Scholar] [CrossRef]
- Katzev, R. Carsharing: A new approach to urban transportation problems. Anal. Soc. Issues Public Policy 2003, 3, 65–86. [Google Scholar] [CrossRef]
- Martin, E.W.; Shaheen, S.A. Greenhouse gas emission impacts of carsharing in North America. IEEE Trans. Intell. Transp. Syst. 2011, 12, 1074–1086. [Google Scholar] [CrossRef]
- Firnkorn, J.; Müller, M. What will be the environmental effects of new free-floating carsharing systems? The case of car2go in Ulm. Ecol. Econ. 2011, 70, 1519–1528. [Google Scholar] [CrossRef]
- Martin, E.; Shaheen, S.; Lidicker, J. Impact of carsharing on household vehicle holdings: Results from North American shared-use vehicle survey. J. Transp. Res. Board 2010, 2143, 150–158. [Google Scholar] [CrossRef]
- Shaheen, S.; Cohen, A.; Chung, M. North American carsharing: A ten-year retrospective. Transp. Res. Rec. 2009, 2110, 35–44. [Google Scholar] [CrossRef]
- Cervero, R. City CarShare: First-year travel demand impacts. Transp. Res. Rec. 2003, 1839, 159–166. [Google Scholar] [CrossRef]
- Martin, E.W.; Shaheen, S.A. The impact of carsharing on public transit and non-motorized travel: An exploration of North American carsharing survey data. Energies 2011, 4, 2094–2114. [Google Scholar] [CrossRef]
- Nijland, H.; van Meerkerk, J.; Hoen, A. Impact of Carsharing on Mobility and CO2 Emissions. PBL Netherlands Environmental Assessment Agency. PBL Publication Number 1842. 2015. Available online: http://www.pbl.nl/sites/default/files/cms/publicaties/PBL_2015_Note%20Impact%20of%20car%20sharing_1842.pdf (accessed on 28 June 2017).
- Martin, E.; Shaheen, S. Impacts of Car2Go on Vehicle Ownership, Modal Shift, Vehicle Miles Traveled, and Greenhouse Gas Emissions: An Analysis of Five North American Cities; Transportation Sustainability Research Center: Berkeley, CA, USA, 2016. [Google Scholar]
- Baptista, P.; Melo, S.; Rolim, C. Energy, environmental and mobility impacts of carsharing systems. Empirical results from Lisbon, Portugal. Procedia Soc. Behav. Sci. 2014, 111, 28–37. [Google Scholar] [CrossRef]
- McFadden, D.; Train, K. Mixed MNL models for discrete response. J. Appl. Econom. 2000, 15, 447–470. [Google Scholar] [CrossRef]
- Train, K.E. Discrete Choice Methods with Simulation; Cambridge University Press: Cambridge, MA, USA, 2009. [Google Scholar]
- Joint Research Center of the European Commission. Well-To-Wheels Report (Version 4a). JEC Well-To-Wheels Analysis of Future Automotive Fuels and Powertrains in the European Context; Joint Research Center of the European Commission: Brussels, Belgium, 2014. [Google Scholar]
- Edwards, R.; Mahieu, V.; Griesemann, J.C.; Larivé, J.F.; Rickeard, D.J. Well-To-Wheels Analysis of Future Automotive Fuels and Powertrains in the European Context; SAE Technical Paper No. 2004-01-1924; SAE: Warrendale, PA, USA, 2004. [Google Scholar]
- Woo, J.; Choi, H.; Ahn, J. Well-to-wheel analysis of greenhouse gas emissions for electric vehicles based on electricity generation mix: A global perspective. Transp. Res. D 2017, 51, 340–350. [Google Scholar] [CrossRef]
- Korea Energy Agency. Vehicle Energy Efficiency Labeling and Standard and Average Fuel Economy. Available online: http://www.energy.or.kr/renew_eng/energy/transport/vehicle.aspx (accessed on 1 November 2016).
- Socar. Available online: https://www.socar.kr/ (accessed on 12 January 2017).
- Greencar. Available online: https://www.greencar.kr (accessed on 12 January 2017).
- Ministry of Land, Infrastructure and Transport. Statistical Yearbook of MOLIT; Ministry of Land, Infrastructure and Transport: Sejong City, Korea, 2016.
- Park, J.; Ko, J. Comparing methods for apportioning transport CO2 emissions to sub-regional areas in Seoul. Seoul Inst. 2014, 15, 65–78. [Google Scholar]
- Korea Environmental Industry and Technology Institute. 2015 Carbon Footprint Certification Product Information. Available online: http://www.epd.or.kr/information/data.asp?bbs_code=6&mode=view&bbs_idx=1964&page=1&search_type=0&search_word=&bbs_class=%uC790%uB8CC%uC2E4 (accessed on 28 June 2017).
- Korea Energy Agency. Vehicle Fuel Economy and CO2 Emission: Data and Analysis; Korea Energy Agency: Yongin-si, Korea, 2016. [Google Scholar]
- Vermeulen, B.; Goos, P.; Vandebroek, M. Models and optimal designs for conjoint choice experiments including a no-choice option. Int. J. Res. Mark. 2008, 25, 94–103. [Google Scholar] [CrossRef]
- Korea Transport Emission Management Systems. Greenhouse Gas Emissions in Transportation Sector. Available online: https://www.kotems.or.kr/app/kotems/forward?pageUrl=/kotems/ptl/emission/nir/KotemsPtlEmissionNirEmissionYearLs&topmenu1=01&topmenu2=03&topmenu3=03 (accessed on 1 November 2016).
Figure 1.
Basic methodology used in this study.
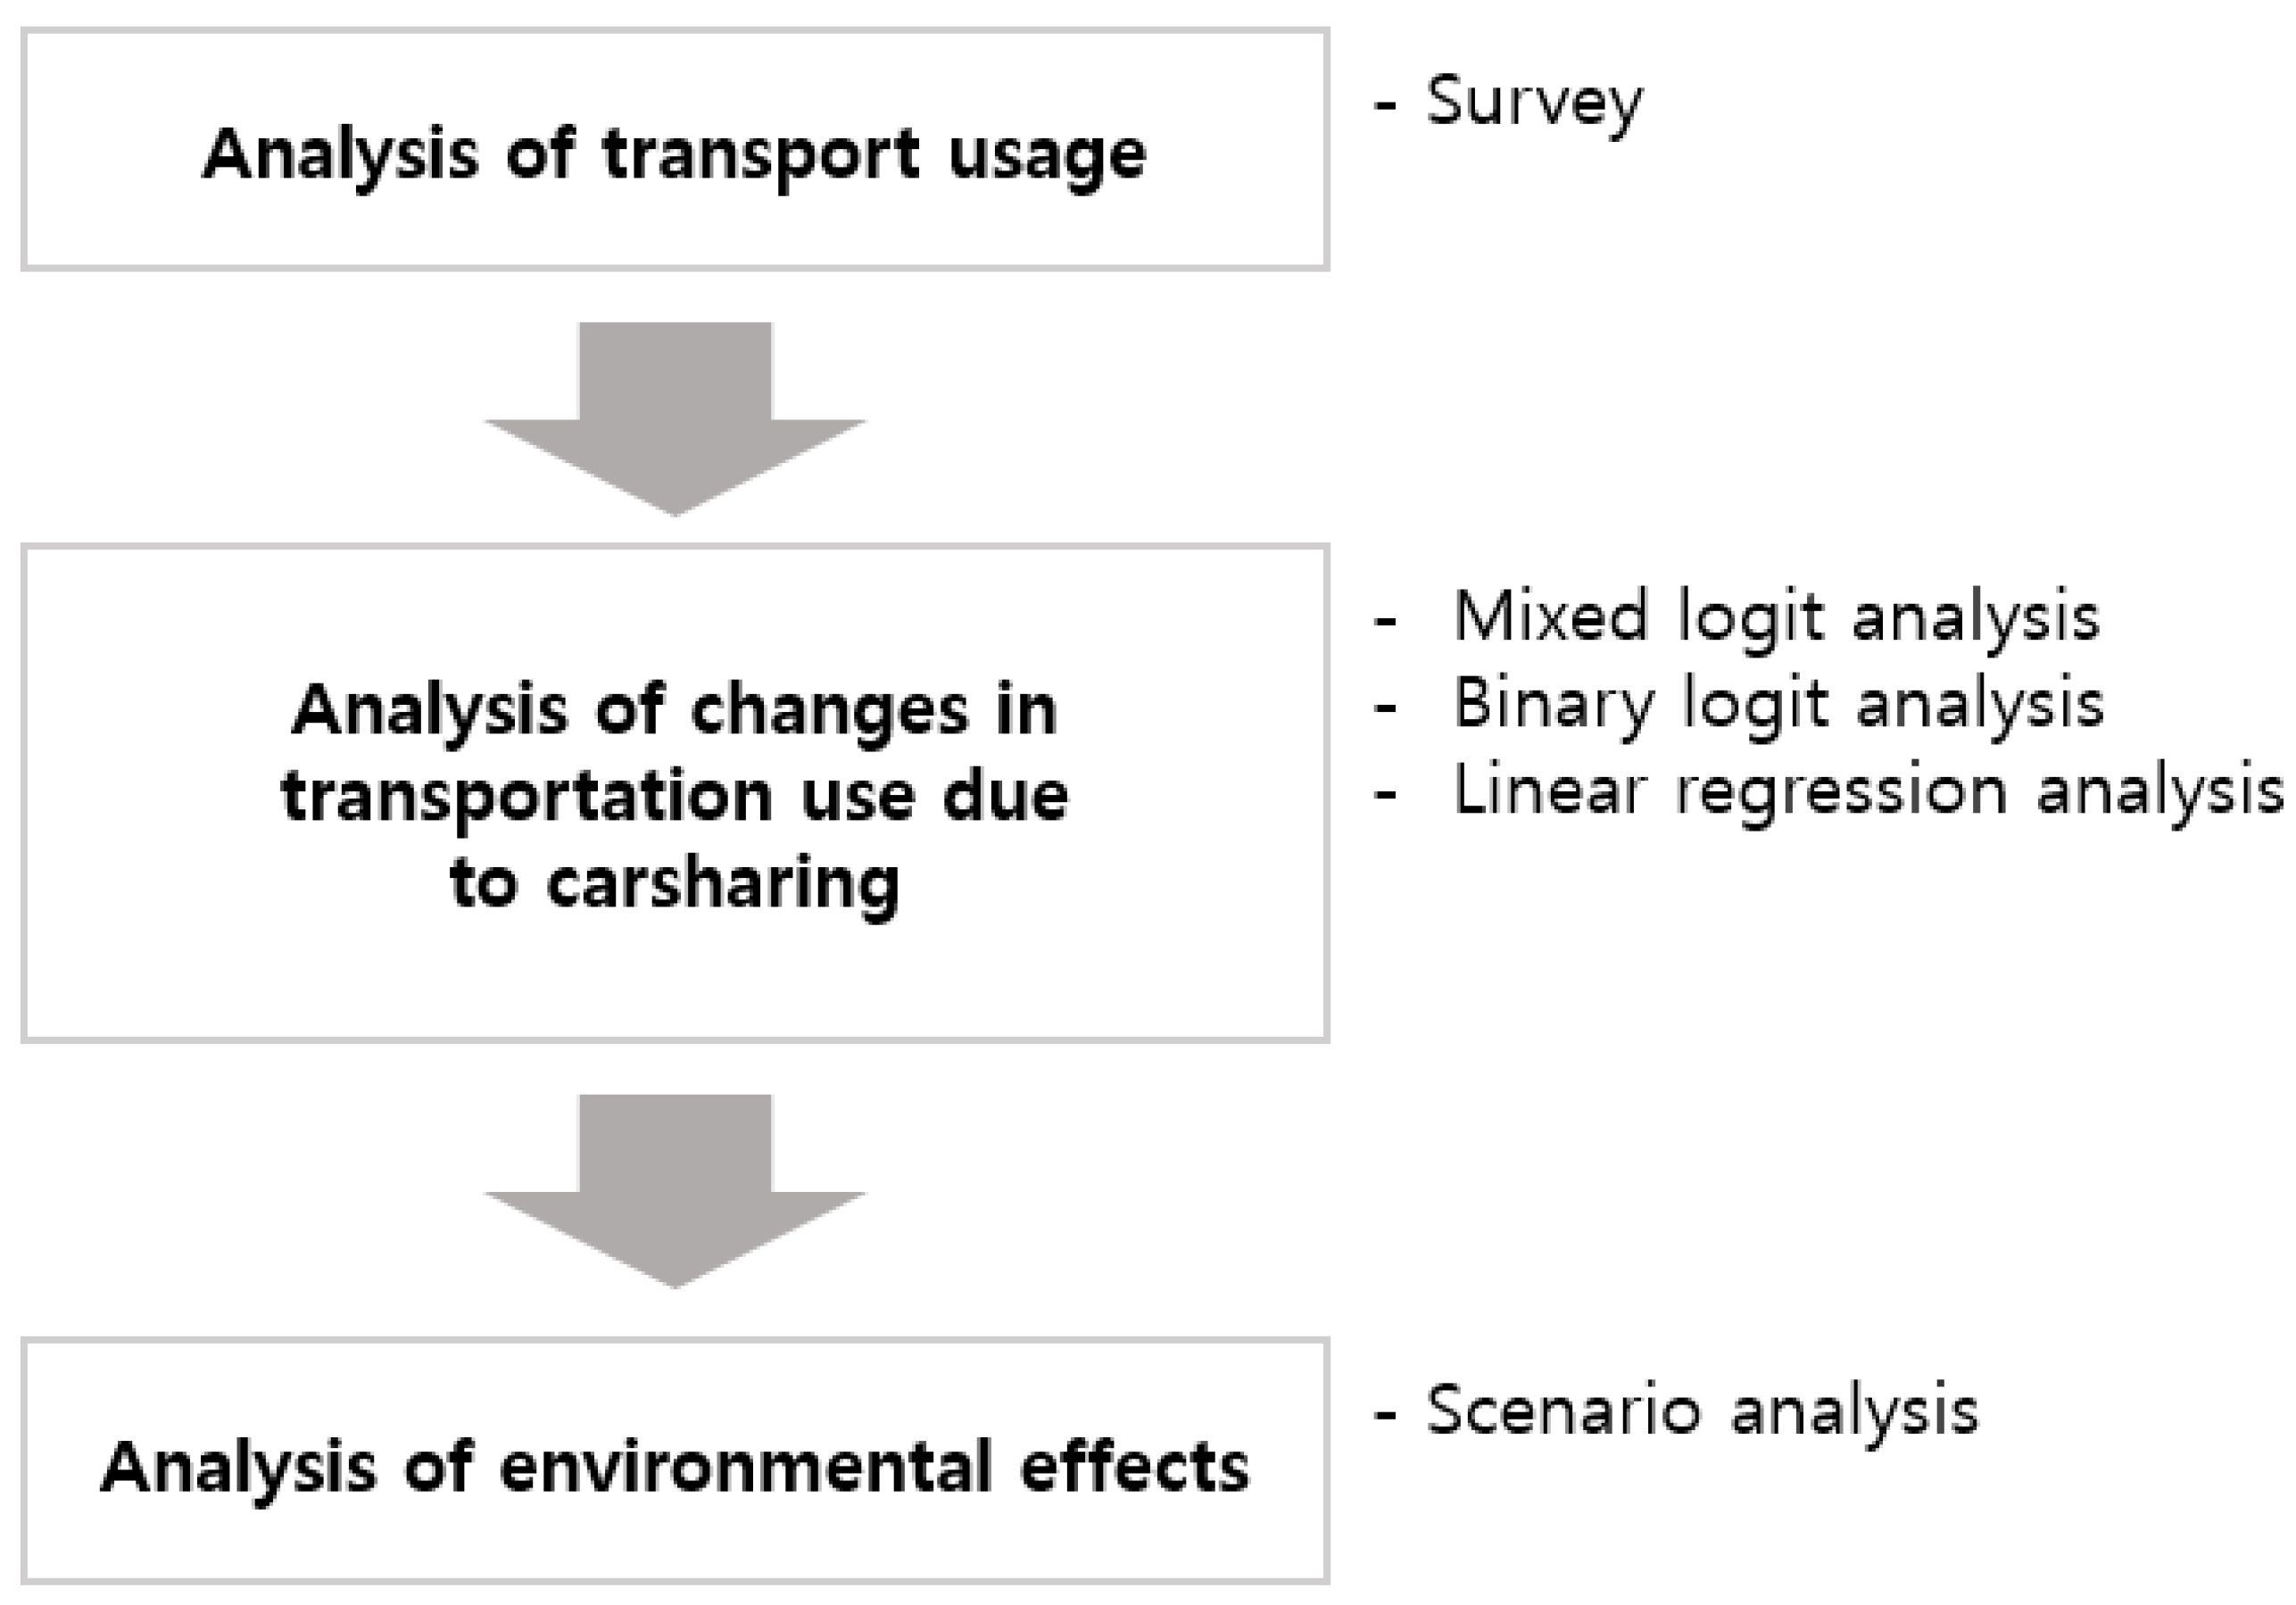
Figure 2.
Visualization of behavioral change impacts on GHG emissions following the introduction of car sharing.
Figure 2.
Visualization of behavioral change impacts on GHG emissions following the introduction of car sharing.
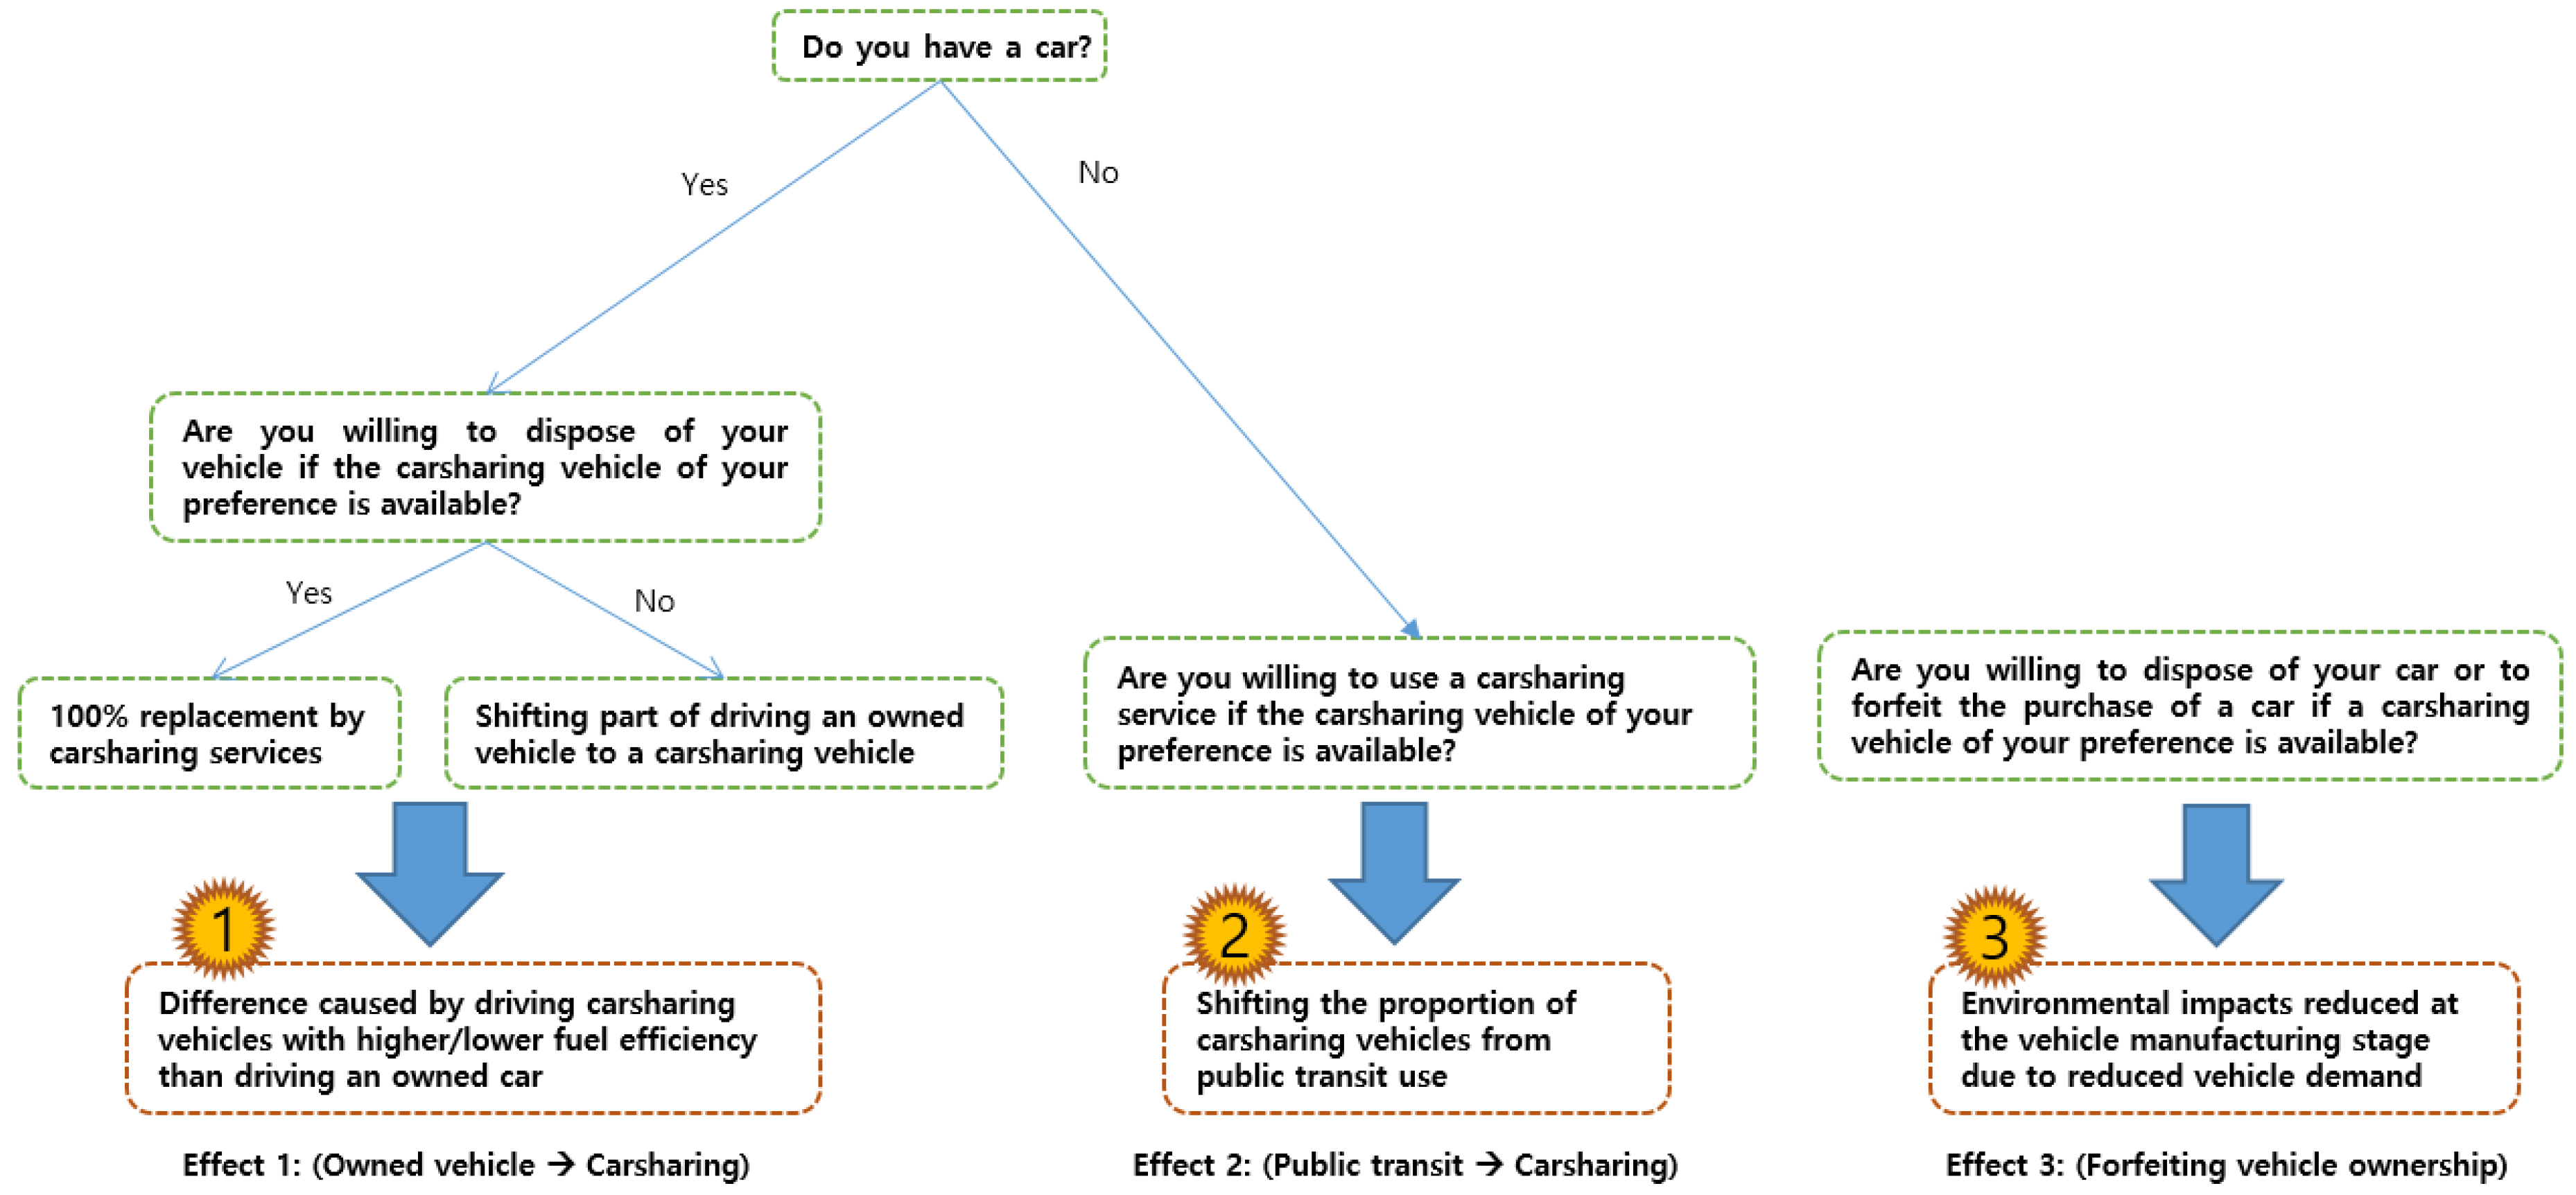
Figure 3.
Change in the probability of choosing car sharing with an increase in EV charging infrastructure (number of stations).
Figure 3.
Change in the probability of choosing car sharing with an increase in EV charging infrastructure (number of stations).

Figure 4.
Reduction in daily GHG emissions with an increase in EV charging locations.


Table 1.
Demographic characteristics of survey respondents.
| Demographic Variables | Category | Respondents | Percentage |
|---|---|---|---|
| Total | 1022 | 100.0% | |
| Gender | Male | 534 | 52.3% |
| Female | 488 | 47.7% | |
| Age | 20s | 225 | 22.0% |
| 30s | 337 | 33.0% | |
| 40s | 284 | 27.8% | |
| 50s | 176 | 17.2% | |
| Occupation | Self-employed | 72 | 7.0% |
| Blue-collar | 80 | 7.8% | |
| White-collar | 636 | 62.2% | |
| House-maker/Student/Jobless | 234 | 22.9% | |
| Monthly household income (USD 10) | <199 | 244 | 23.9% |
| 200–299 | 257 | 25.1% | |
| 300–399 | 146 | 14.3% | |
| 400–499 | 121 | 11.8% | |
| 500–699 | 93 | 9.1% | |
| >700 | 54 | 5.3% | |
| No income | 107 | 10.5% | |
| Number of family members | 1 | 98 | 9.6% |
| 2 | 127 | 12.4% | |
| 3 | 285 | 27.9% | |
| 4 | 402 | 39.3% | |
| >5 | 110 | 10.8% | |
| Education | Below secondary education | 110 | 10.8% |
| Undergraduate level | 775 | 75.8% | |
| Graduate level | 137 | 13.4% |
Table 2.
Attributes and levels of car sharing services for the discrete choice experiment.
| Attribute | Attribute Level | Description |
|---|---|---|
| Fuel type () | Gasoline or diesel | For EVs: can drive 200 km with one full charge and vehicle can be charged at the rental station. |
| LPG | ||
| Electricity | ||
| Fuel charging station supply rate () | 15% | Station supply rate refers to the availability of LPG fuel or EV charging stations (where the number and supply level of gasoline or diesel stations is 100%). |
| 50% | ||
| 80% | ||
| 100% | ||
| Vehicle type () | Economy, subcompact, or compact vehicle | e.g. Morning, Spark, Soul, Accent, Pride, Niro, Avante, K3, etc. |
| Mid-size or full-size vehicle | e.g. Sonata, K5, Grandeur, Genesis, K9, Chairman, etc. | |
| SUV (Sports utility vehicle) | e.g. Tucson, Spotage, Tivoli, SantaFe, Trax, Orlando, etc. | |
| Pickup & delivery Service () | Provided | If pickup and delivery services are provided, a car sharing vehicle will be delivered to the door. Otherwise, a car sharing vehicle can be collected at the nearest station, which is approximately 15-min walking distance. |
| Not provided | ||
| One-way drive () | Allowed | If one-way trips are allowed, the vehicle can be returned to a different station than the one from which it was rented. |
| Not allowed | ||
| Cost (USD/h) () | 5 | Refers to the total rental cost per hour (including fuel, rental duration and insurance). The price increases proportionally with additional rental duration. |
| 10 | ||
| 15 | ||
| 20 |
Table 3.
Description of variables used for estimating environmental impacts.
| Variable | Description | Source |
|---|---|---|
| Estimated variables used in calculation | ||
| Probability of choosing car sharing services and foregoing car ownership varies with car sharing attributes and individual characteristics. | Estimated value from conjoint experiment within the questionnaire survey | |
| , , | Car sharing use shifts from owned vehicles or public transit is calculated by multiplying travel distance and replacement rate. Replacement rate is based on car sharing attributes and individual characteristics. | |
| Mobility change indicates increased or decreased travel distances due to the convenience of car sharing services. This value varies with car sharing attributes and between individuals. | ||
| Fixed variables used in calculation | ||
| , | (car sharing emission factor) and (owned car emission factor) are calculated by dividing the emission factor (gCO2e/L) by the vehicle fuel efficiency (km/L or km/kWh). The emission factor varies depending on vehicle fuel [gasoline = 2778.2 gCO2e/L, diesel = 3241.3 gCO2e/L, LPG = 2942.6 gCO2e/L, electricity = 393.3–865.1 gCO2e/kWh]. | [28,29,30] |
| Fuel efficiency | The fuel efficiency of car sharing vehicles differs as follows: gasoline/diesel (13.7 km/L), LPG (9.6 km/L), EV (5.4 km/kWh). | [31,32,33] |
| Conversion factor | This converts travel time on public transit to travel distance [0.35 km/min]. | [34] |
| , | Bus emission factor [57.3 g per person·km] Subway emission factor [26.0 g per person·km] | [35] |
| Emissions from producing a car [4.6709 t CO2e per unit] | [36] | |
| Number of registered cars used to estimate the number of car owners [20,989,885 units] | [34] | |
| Number of daily bus users who have a driving license [9,620,591 people] | [34] | |
| Number of daily subway users who have a driving license [5,208,389 people] | [34] | |
| Number of vehicles sold per day in South Korea [4091 units] | [37] | |
Table 4.
Car sharing estimation results and empirical analysis.
| Variables | Mixed Logit Model 1 | Binary Logit Model 2 | Linear Regression Model | |||||||
|---|---|---|---|---|---|---|---|---|---|---|
| Mean (S.D.) | Std. Error | Estimate | Std. Error | Estimate | Std. Error | Estimate | Std. Error | Estimate | Std. Error | |
| Car sharing attribute variable | ||||||||||
| Fuel type 1: LPG | −0.281 *** (0.127) | 0.076 | 0.517 ** | 0.250 | 0.047 ** | 0.020 | 0.063 *** | 0.022 | - | - |
| Fuel type 2: Electricity | 0.132 *** (0.000 ***) | 0.035 | 0.347 ** | 0.144 | - | - | - | - | - | - |
| Station rate | 0.481 *** (0.000 ***) | 0.156 | 0.578 ** | 0.268 | 0.045 ** | 0.022 | 0.056 ** | 0.024 | - | - |
| Car type 1 (economy) | −0.181 *** (0.000 ***) | 0.037 | −0.109 | 0.108 | - | - | - | - | - | - |
| Car type 2 (mid-size) | −0.136 *** (0.855) | 0.041 | 0.006 | 0.117 | 0.033 *** | 0.012 | 0.037 *** | 0.013 | - | - |
| One-way trip option | 0.433 *** (0.000 ***) | 0.026 | −0.009 | 0.090 | 0.031 *** | 0.007 | 0.034 *** | 0.008 | 0.006 ** | 0.003 |
| Vehicle delivery | 0.350 *** (0.995) | 0.029 | 0.062 | 0.088 | - | - | - | - | - | - |
| Cost | −0.210 *** (0.000 ***) | 0.007 | −0.024 *** | 0.008 | −0.004 *** | 0.001 | −0.004 *** | 0.001 | −0.001 *** | 0.000 |
| No choice | −3.779 *** (0.000 ***) | 0.182 | - | - | - | - | - | - | - | - |
| Individual characteristic variables | ||||||||||
| Constant | - | - | −3.587 *** | 0.549 | 0.146 *** | 0.044 | 0.065 | 0.047 | 0.043 *** | 0.015 |
| Age | - | - | −0.004 | 0.005 | 0.001 | 0.000 | 0.000 | 0.000 | 0.000 ** | 0.000 |
| Education | - | - | 0.040 * | 0.023 | −0.007 *** | 0.002 | −0.002 | 0.002 | −0.002 *** | 0.001 |
| Eco-friendly | - | - | 0.377 *** | 0.053 | 0.026 *** | 0.004 | 0.029 *** | 0.005 | 0.008 *** | 0.002 |
| Individual income | - | - | 0.077 *** | 0.018 | 0.002 | 0.001 | 0.005 *** | 0.002 | 0.002 *** | 0.001 |
*, ** and *** indicate statistical significance of p < 0.1, p < 0.05 and p < 0.01, respectively. 1 Yi = 1 if ith alternative is chosen. 2 Yi = 1 if individual would forfeit car ownership when ith alternative is chosen.
Table 5.
Choice and forfeit probabilities in the baseline scenario.
| Choice Alternative | Car sharing Vehicle A | Car sharingVehicle B | Car sharingVehicle C | - | |
|---|---|---|---|---|---|
| Attributes | |||||
| Fuel charging station supply rate | 100% | 15% | 5% | No choice | |
| Fuel type | Gasoline or diesel | LPG | Electricity | ||
| Vehicle type | Mid-size or full-size vehicle | Mid-size or full-size vehicle | Mid-size or full-size vehicle | ||
| Pickup & delivery service | Not provided | Not provided | Not provided | ||
| One-way trip | Not allowed | Not allowed | Not allowed | ||
| Cost per hour (KRW) | 10,000 | 10,000 | 10,000 | ||
| Choice probability | 34.90% | 14.36% | 21.17% | - | |
| Forfeit probability | 16.20% | - | |||
Table 6.
GHG emissions under various car sharing market scenarios (tCO2e).
| Effects | Baseline Scenario | EV 50% Scenario | EV 100% Scenario | ||||||
|---|---|---|---|---|---|---|---|---|---|
| Min | Mean | Max | Min | Mean | Max | Min | Mean | Max | |
| Effect 1 (Shift from owned car) | −7001.73 | −5928.90 | −4856.08 | −8486.26 | −7058.19 | −5630.12 | −10,537.07 | −8617.48 | −6697.89 |
| Effect 2-1 (Shift from bus use) | 6460.21 | 7069.30 | 7678.39 | 6103.03 | 6770.51 | 7437.98 | 5629.43 | 6337.56 | 7045.70 |
| Effect 2-2 (Shift from subway use) | 4420.12 | 4763.77 | 5107.42 | 4224.74 | 4603.62 | 4982.50 | 3948.23 | 4353.00 | 4757.76 |
| Effect 3 (Vehicle disposal) | −3094.33 | −3094.33 | −3094.33 | −3302.74 | −3302.74 | −3302.74 | −3652.28 | −3652.28 | −3652.28 |
| Total Effect (daily) | 784.27 | 2809.83 | 4835.40 | −1461.24 | 1013.19 | 3487.63 | −4611.70 | −1579.20 | 1453.29 |
| Total Effect (yearly) | 286,257 | 1,025,589.36 | 1,764,921 | −533 352 | 369,815.97 | 1,272,984 | −1,683,269 | −576,408.46 | 530,452 |
© 2018 by the authors. Licensee MDPI, Basel, Switzerland. This article is an open access article distributed under the terms and conditions of the Creative Commons Attribution (CC BY) license (http://creativecommons.org/licenses/by/4.0/).
Share and Cite
MDPI and ACS Style
Jung, J.; Koo, Y. Analyzing the Effects of Car Sharing Services on the Reduction of Greenhouse Gas (GHG) Emissions. Sustainability 2018, 10, 539. https://doi.org/10.3390/su10020539
AMA Style
Jung J, Koo Y. Analyzing the Effects of Car Sharing Services on the Reduction of Greenhouse Gas (GHG) Emissions. Sustainability. 2018; 10(2):539. https://doi.org/10.3390/su10020539
Chicago/Turabian StyleJung, Jiyeon, and Yoonmo Koo. 2018. "Analyzing the Effects of Car Sharing Services on the Reduction of Greenhouse Gas (GHG) Emissions" Sustainability 10, no. 2: 539. https://doi.org/10.3390/su10020539
Note that from the first issue of 2016, this journal uses article numbers instead of page numbers. See further details here.