Article

Perceptions and Attitudes Toward Eco-Toilet Systems in Rural Areas: A Case Study in the Philippines

by
Jonathan Jared Ignacio
1,
Roy Alvin Malenab
1,
Carla Mae Pausta
1,
Arnel Beltran
1,
Lawrence Belo
1,
Renan Ma. Tanhueco
2,
Marlon Era
3,
Ramon Christian Eusebio
4,
Michael Angelo Promentilla
1 and
Aileen Orbecido
1,*
1
Chemical Engineering Department, Gokongwei College of Engineering, De La Salle University, 2401 Taft Avenue, Manila 1004, Philippines
2
Civil Engineering Department, Gokongwei College of Engineering, De La Salle University, 2401 Taft Avenue, Manila 1004, Philippines
3
Behavioral Sciences Department, College of Liberal Arts, De La Salle University, 2401 Taft Avenue, Manila 1004, Philippines
4
Department of Engineering Science, College of Engineering and Agro-Industrial Technology, University of the Philippines Los Baños, College Laguna 4031, Philippines
*
Author to whom correspondence should be addressed.
Sustainability 2018, 10(2), 521; https://doi.org/10.3390/su10020521
Submission received: 31 December 2017 / Revised: 11 February 2018 / Accepted: 12 February 2018 / Published: 15 February 2018

Abstract

:
Death due to diseases from poor sanitation is a serious global issue and it has become one of the priorities of the United Nations’ Sustainable Development Goals (i.e., SDG6). This SDG6 aims to provide adequate improved sanitation facilities to over 2.3 billion people around the world who have no or limited access to sanitation, wherein more than two-thirds of these un-served people live in rural areas. One of the strategies for addressing this global issue is through emerging sustainable sanitation technologies such as the Eco-Toilet System (ETS), which uses small amounts of water or is even waterless and recovers nutrients from human waste thereby promoting water-energy conservation, improved sanitation and supplement nutrients essential to plant growth. Social acceptance, however, remains a key barrier in deploying the ETS. A social perception study on the use of the ETS was conducted in a rural community in Mulanay, Philippines. The researchers analyzed the proposed combined technology acceptance model and theory of planned behavior (C-TAM-TPB) using multiple linear regression and the Mann-Whitney U-test to evaluate the perceptions and attitudes of a rural community towards the use of the ETS. The results showed that more than 50% of the respondents are aware of the nutrient value of human excreta and believe that it is usable as fertilizer; however, less than 25% prefer to utilize it for food production. Results also indicate that the behavior of the users is driven by their attitude (β = 0.420, p-value < 0.010). Moreover, the Mann-Whitney U-test results revealed that people who are knowledgeable of the nutrient value of human excreta and are willing to collect them have more positive attitude towards the ETS.

1. Introduction

Poor sanitation is a global problem that results in one of the world’s burden of diseases (i.e., diarrhea) which account for more than 846,000 deaths annually [1]. Although there is an increasing number of the global population who gained access to improved sanitation facilities in recent years, the challenge to provide access and better sanitation still remains for a greater share of 2.3 billion people, especially those located in the rural communities [2].
In the Philippines, the proportion of the rural population provided with sanitary toilets is consistently progressing [2,3]; however, the proper treatment of domestic wastewater remains a problem with most of the installed toilets connected to septic tanks. While treatment is known to be less efficient with septic systems, poor maintenance and improper operation add to the problem. Discharges of effluents to the environment, whether intended or not, have already created health risks from polluting components (e.g., pathogens such as Salmonella) carried by surface water flows, finding their way to the soil, surface water bodies and within aquifers [4]. These cases are evident from the rise of cases of waterborne infections and diseases after major flood events in the country. In most dwelling units connected to a community water system, water is often used as the medium to carry wastes from a toilet system to a connected septic tank [5]. While availability and access to freshwater and its affordability will likely favor water carriage systems, the water carriage approach remains difficult to communities, especially in rural areas, where availability of and access to water remains a big challenge. The demand of the growing Philippine rural population [6] on water for toilet flushing and anal cleansing will continue to compete with the available clean water supply for food and drinking in the future, thus there is already a need for a more sustainable water and sanitation management in the country [7].
One of the emerging paradigms that promotes sustainable water and sanitation management is called the source-separation sanitation system or coined as the Eco-Toilet System (ETS) [8]. The ETS does not necessarily require water to flush and transport the excreta to the septic tanks, and some configurations do not allow water and soap. Some types of eco-toilets are built with separate drop holes for the urine and feces to allow source-separation of excreta. Urine and feces are collected separately, stored and treated for pathogens including viruses to produce safe fertilizers [9]. Prior researches confirm that the ETS has the ability to close the loop of the material flow of the human excreta while preventing harmful discharges of effluents to the environment, conserving water consumption, and producing sanitized human excreta as fertilizers [8,9]. The technology acceptance of the ETS has appealed to many researchers because the development and implementation of the ETS still remain as a challenge [10] that would require attitudinal and behavioral changes [10,11], additional cost for the infrastructure [12], strong policy intervention, technical awareness, and sensitive environmental and hygiene initiatives [11,13,14]. Shifting from the conventional toilet culture to waterless sanitation practices may cause some constraints to new users in the Philippines since majority of the Filipinos are “washers” in terms of anal cleansing [5].
Perceptions and attitudes toward the ETS are recognized as important factors in addressing the different problems in sanitation. Shifting from a water-reliant system to a waterless and sustainable sanitation system involves numerous initiatives [10,11,12,13,14]. For example, previous researches [10,12] draw more attention on the technology evaluation and economic viability, but not much on the perception. Other than the evaluation of effectiveness of the new sanitation technologies, some studies explore more decision-making techniques in evaluating the end-user responses towards the sanitation technology in terms of willingness to adopt and reuse ecological sanitation products [15].
Although the principles of the ETS are not entirely novel, such sanitation system is perceived as a new environmental technology [16]. The ETS is not always socially accepted in some communities since “flush and discharge” type became the norm, like in the Philippines. Previous investigations have implemented diverse approaches to model and understand the social perceptions and attitudes towards acceptance of the ETS such as hypothesis testing [14], value-belief-norm theory [15], and theory of planned behavior (TPB) [17]. However, these approaches are only limited to the communities’ perspectives based on their available resources, social influences, skills, and opportunities and not on how they perceive the use of the technology. One of the widely used acceptance models to address this gap is the Technology Acceptance Model (TAM). TAM was initially used as an acceptance model for new information technology systems, and has been recently recognized as one of the most powerful tools of explaining the users’ behavioral intentions in using and accepting new technologies [18,19]. TAM was formulated to explain the users’ perception in adopting new technology, i.e., it may be influenced by different factors such as perceived usefulness and perceived ease of use of the technology, attitude, and behavioral intention [19].
This study aims to explain not only the technology use through TAM but also how the community thinks towards the ETS based on their perceived behavioral control (or facilitation conditions) and subjective norms, in which TPB is capable of explaining [20]. An integrated TAM and TPB to evaluate potential users’ perceptions and attitudes toward the ETS in rural areas is proposed. This methodology allows us to determine how technology adoption in particular to eco-toilet systems is affected by the perception on technology use, perceived behavioral control, and subjective norms. The integrated theory of TAM and TPB has already been explored to analyze projects that promote sustainable development such as green transportation [21] but not on sanitation.
This study also focuses on the behavioral intention as the measurement of social perception towards the use of the ETS in a rural community in the Philippines. The study area is situated in Mulanay, a rural municipality in Quezon Province, where the concept of the eco-toilet is recently introduced. Based on the 2014 statistics from the rapid community-based monitoring system (RCBMS) of Mulanay, about 46% of the total municipality population has no access to sanitary toilet facilities and 83% are at risk of unsafe water supply.
The rest of this paper is organized as follows. The next section gives a detailed description of the methodology. Section 3 discusses the results from a case study in Mulanay, Quezon. Finally, conclusions and recommendations for future work are given.

2. Methodology

2.1. Public Orientation to the ETS

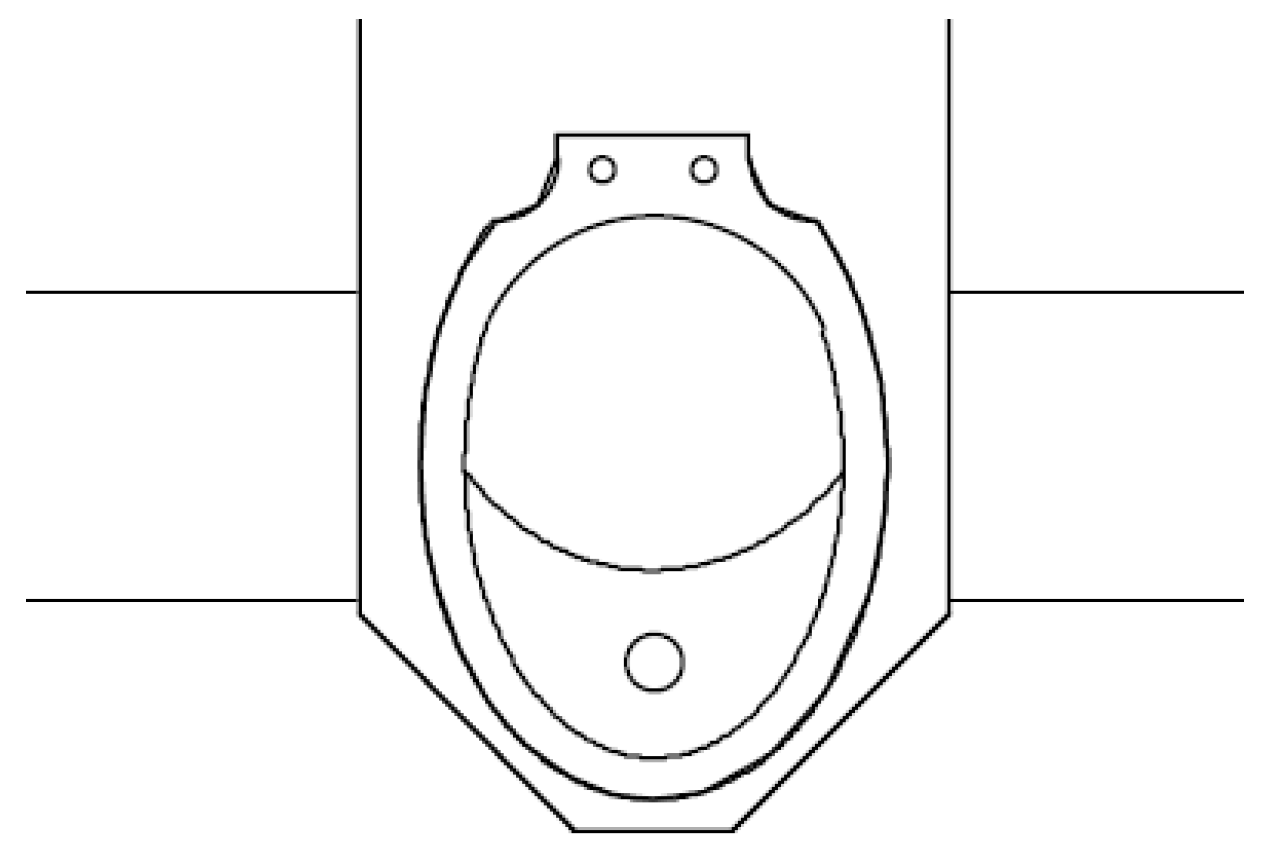
The eco-toilet system was introduced to the community through a consultation meeting with the stakeholders and project presentation in the pilot sites (e.g., in Mulanay). This was conducted to present the concept of the ETS project that will be initiated in the rural area, as well as to enhance the awareness thereof. The eco-toilet that was introduced to the community was a urine-diverting type. This type of ETS has the ability to safely collect and process excreta (urine and feces) with compost additives into liquid and soil conditioners through aerobic decomposition. The main components of the ETS are: (1) superstructure, (2) urine diverting toilet (as illustrated in Figure 1), (3) collection chamber, (4) collection tank for urine, and (5) compost mixer. The superstructure is the main building structure of the ETS facility. This serves as the shelter and provides the privacy for the users. The superstructure also holds the collection chamber. The urine-diverting toilet is designed to separate urine and feces that occurs at the commode. The urine diverter is connected to a collection tank located in the collection chamber, while the feces drop hole is centered beneath the compost mixer. Foul odors are prevented by tightly closing the urine collection tank and by frequently mixing the feces with locally available dehydrating materials such as rice hull. Further details are explained elsewhere [22,23]. The urine and compost products were processed onsite until they were ready and safe for agricultural use.
Finally, the public orientation was also executed to clarify the roles and responsibilities of the implementers and the adopters once the ETS units are already installed. Further, this activity was also facilitated to get the public’s opinion about the ETS.

2.2. Technology Acceptance Model

Technology Acceptance Model (TAM) was originally introduced by Davis in 1989 to understand and provide explanation on the decision factors of the users on accepting new information technology systems [20]. This model assumes that the technology adoption is directly affected by the users’ behavioral intention (BIU). BIU is a variable that predicts how the users intentionally engage in the adoption or actual use of a new technology (i.e., to adopt or not to adopt a new system). This decision factor is influenced by both perceived usefulness (PU) and attitude towards the use (ATU) of the new technology. PU refers to the belief of the users that using the new technology would improve the performance on a certain task. On the other hand, ATU pertains to the emotional judgment of the users on the idea of performing a certain behavior or task. The TAM also considers two major constructs that directly affect ATU. The first construct is the PU and the second is the perceived ease of use (PEU). The latter refers to the convenience and effortlessness of using the new technology. PEU also directly affects the PU of the new technology [24].

2.3. Theory of Planned Behavior

Theory of Planned Behavior (TPB) was initiated by Ajzen [20] to provide explanation on how behavioral intention (BIU) is influenced by the subjective norms (SN), perceived behavioral control (PBC), and ATU. SN is a measurement variable that describes how important individuals or groups favor or not favor the users’ usage of the new technology. In other words, the users’ decision towards usage of a technology or system depends on social influences. Another construct that is directly associated to the BIU is the PBC. The PBC refers to the resources (i.e., skills, experiences, money), and opportunities that enable the users to perform a behavior. The TPB assumes that sufficiency in the resources and opportunities would less hinder technology adoption and would increase the PBC of the users. ATU, in PBC, is similar to its definition in TAM [21].

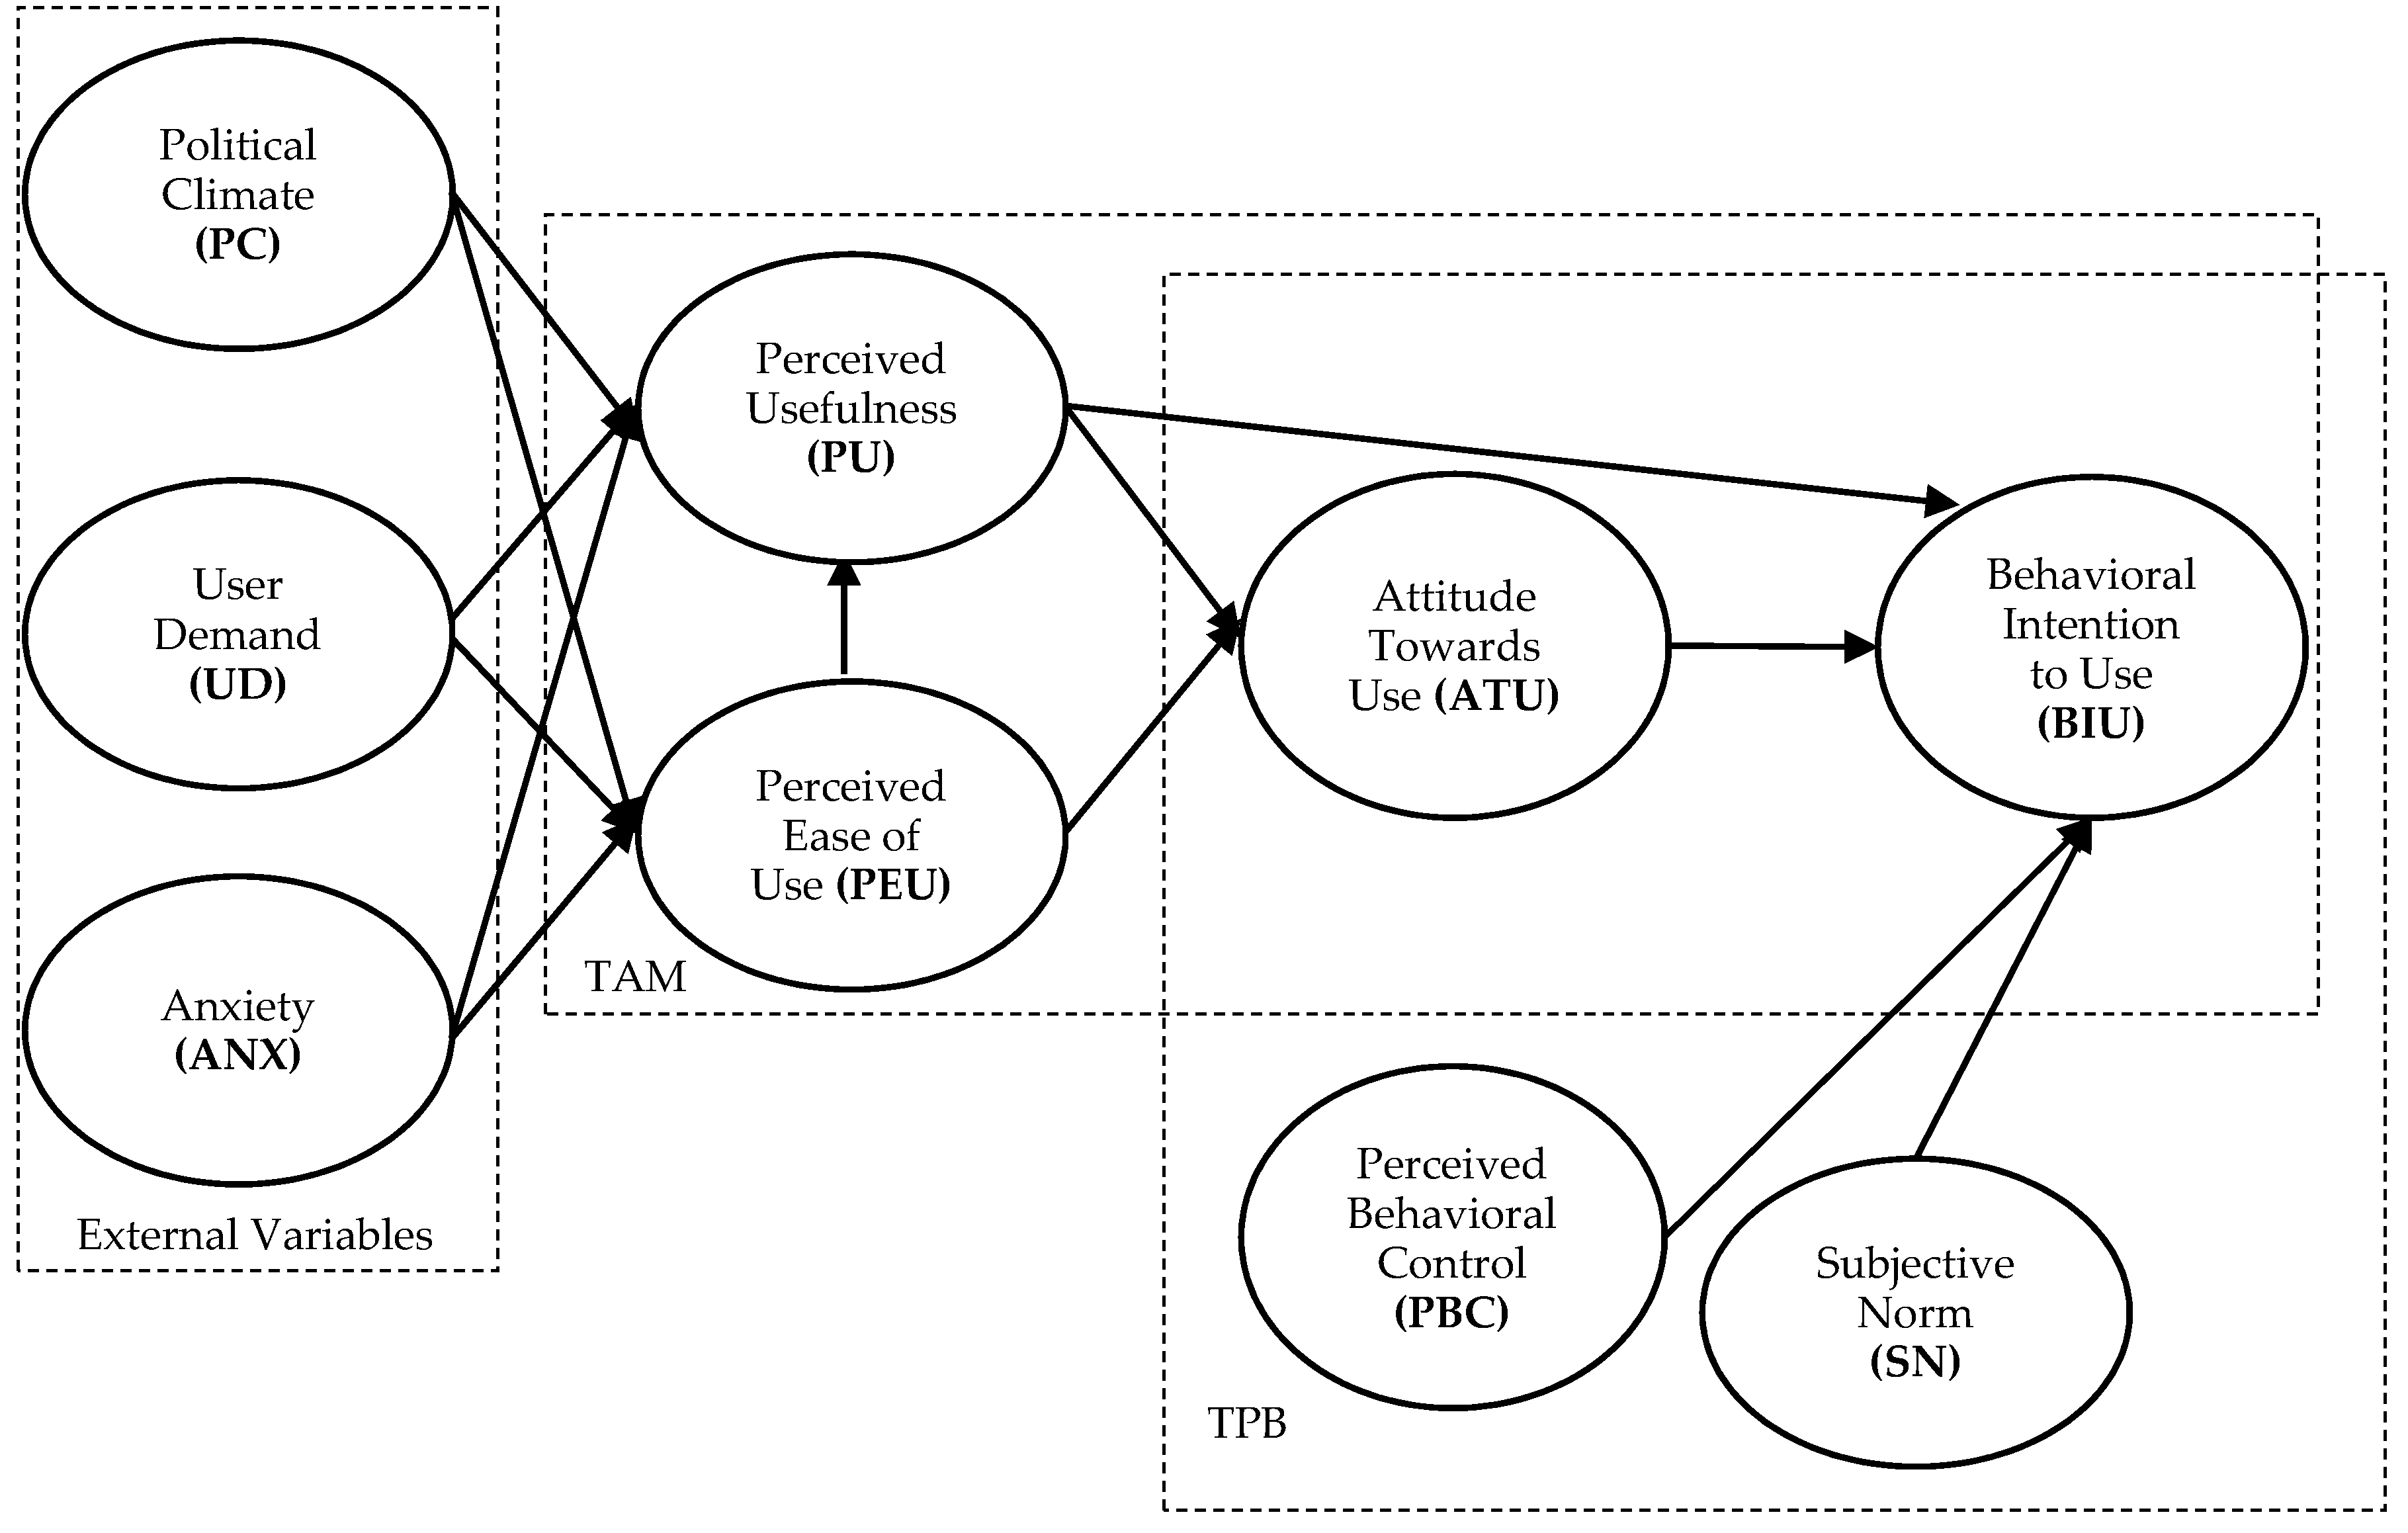
2.4. The Proposed Combined Technology Acceptance Model and Theory of Planned Behavior (C-TAM-TPB) Model and Research Hypotheses

TAM and TPB differ in several ways. Firstly, the assumption of TAM is that the perception on usefulness and ease of use of a new technology primarily determines the decision of a user to intentionally adopt or use a technology or system; while TPB assumes that decision to use or adopt a technology or system requires relevant references such as outcomes based on experiences of another individual or group, subjective preferences of other groups, and control variables (i.e., skills, resources, opportunities). Secondly, unlike TPB, TAM assumes that decision to use or adopt a new technology or system is not directly affected by any social influences. Lastly, the predictors of behavior in TAM may be affected by external variables (i.e., political climate (PC), user demand (UD), and anxiety (ANX)), while TPB treats the variables independently [21,25,26].
C-TAM-TPB was initially developed by Taylor and Todd [27] to bridge the gap between the TAM and TPB. Although TAM has the ability to predict the BIU of the users of a new technology, it misses out two important factors in elucidating BIU which are the SN and PBC. Both TAM and TPB have the same objective on anticipating the users’ BIU [21]. Combining the two models makes a more dynamic approach in explaining the BIU [25].
Based on the proposed C-TAM-TPB model, the constructs such as PU, ATU, SN, and PBC were hypothesized predictors of the users’ BIU of the ETS. Chen et al. [25] used a similar framework of C-TAM-TPB. However, in this paper, the PU and PEU were hypothesized to be affected by external variables (See Figure 2). Hence, the model included PC, UD, and ANX as external variables resulting to the following thirteen hypotheses (H):
Hypothesis 1 (H1).
PU directly affects the BIU of the user of the ETS;
Hypothesis 2 (H2).
ATU is directly associated to the BIU of the user of the ETS;
Hypothesis 3 (H3).
PBC directly affects the BIU of the user of the ETS;
Hypothesis 4 (H4).
SN is directly associated to the BIU of the user of the ETS.
Hypothesis 5 (H5).
PEU directly affects ATU of the ETS;
Hypothesis 6 (H6).
PU has a direct effect to ATU of the ETS;
Hypothesis 7 (H7).
PEU directly affects the PU of the ETS;
Hypothesis 8 (H8).
PC has a direct effect to the PU of the ETS;
Hypothesis 9 (H9).
UD is directly associated to the PU of the ETS;
Hypothesis 10 (H10).
ANX directly affects PU of the ETS;
Hypothesis 11 (H11).
The PC has a direct effect to the PEU of the ETS;
Hypothesis 12 (H12).
UD is directly associated to the PEU of the ETS;
Hypothesis 13 (H13).
ANX directly affects PEU of the ETS
The hypotheses were based on the path of the model as shown in Figure 2. The path of the research model indicates that PU and PEU were two precursors of the users’ attitude. The effects of the external variables were mediated by PU and PEU; PEU may also have direct association with PU. Furthermore, PU, ATU of ETS, PBC, and SN may also have a direct effect to the behavioral intention to use of the ETS. These hypotheses were investigated by conducting a structured survey and data processing. The details of process are discussed further in the succeeding sections of this paper.

2.5. Survey Instrument

The survey questionnaire consisted of four sections: (1) consent form and declaration if the respondent is illiterate (with approval from the Research Ethics Office of De La Salle University, Manila); (2) demographic profile of the respondents: gender, age, educational attainment, civil status, years of residency, and number of household members; (3) items investigating community’s perceptions and attitudes in using human excreta, with questions about the factors that would encourage and discourage users to install the ETS (see Table 1); and (4) adopted C-TAM-TPB questionnaire to evaluate the predictors of the behavioral intention of the rural community to use the ETS (see Table 2). Items listed in Table 2 were scored by the respondents on a five-point scale where 1 indicates strong disagreement, 2 for moderate disagreement, 3 for neutral/undecided, 4 for moderate agreement, and 5 for strong agreement. The questionnaire was also translated in Filipino language, the vernacular used in the community.

2.6. Study Area and Data Collection

The study was conducted in Mulanay, a municipality in the third District of Quezon Province (also known as Bondoc Peninsula). The area is located on the coordinates of 13°31′20′′ longitude and 122°24′15′′ latitude. The municipality is about 279-kilometer south-east of Metro Manila and 142 km away from its provincial capital, Lucena City. Mulanay is divided into 28 barangays. Out of 53,123 people from all the barangays of Mulanay [28], 46% do not have access to basic sanitary facilities.
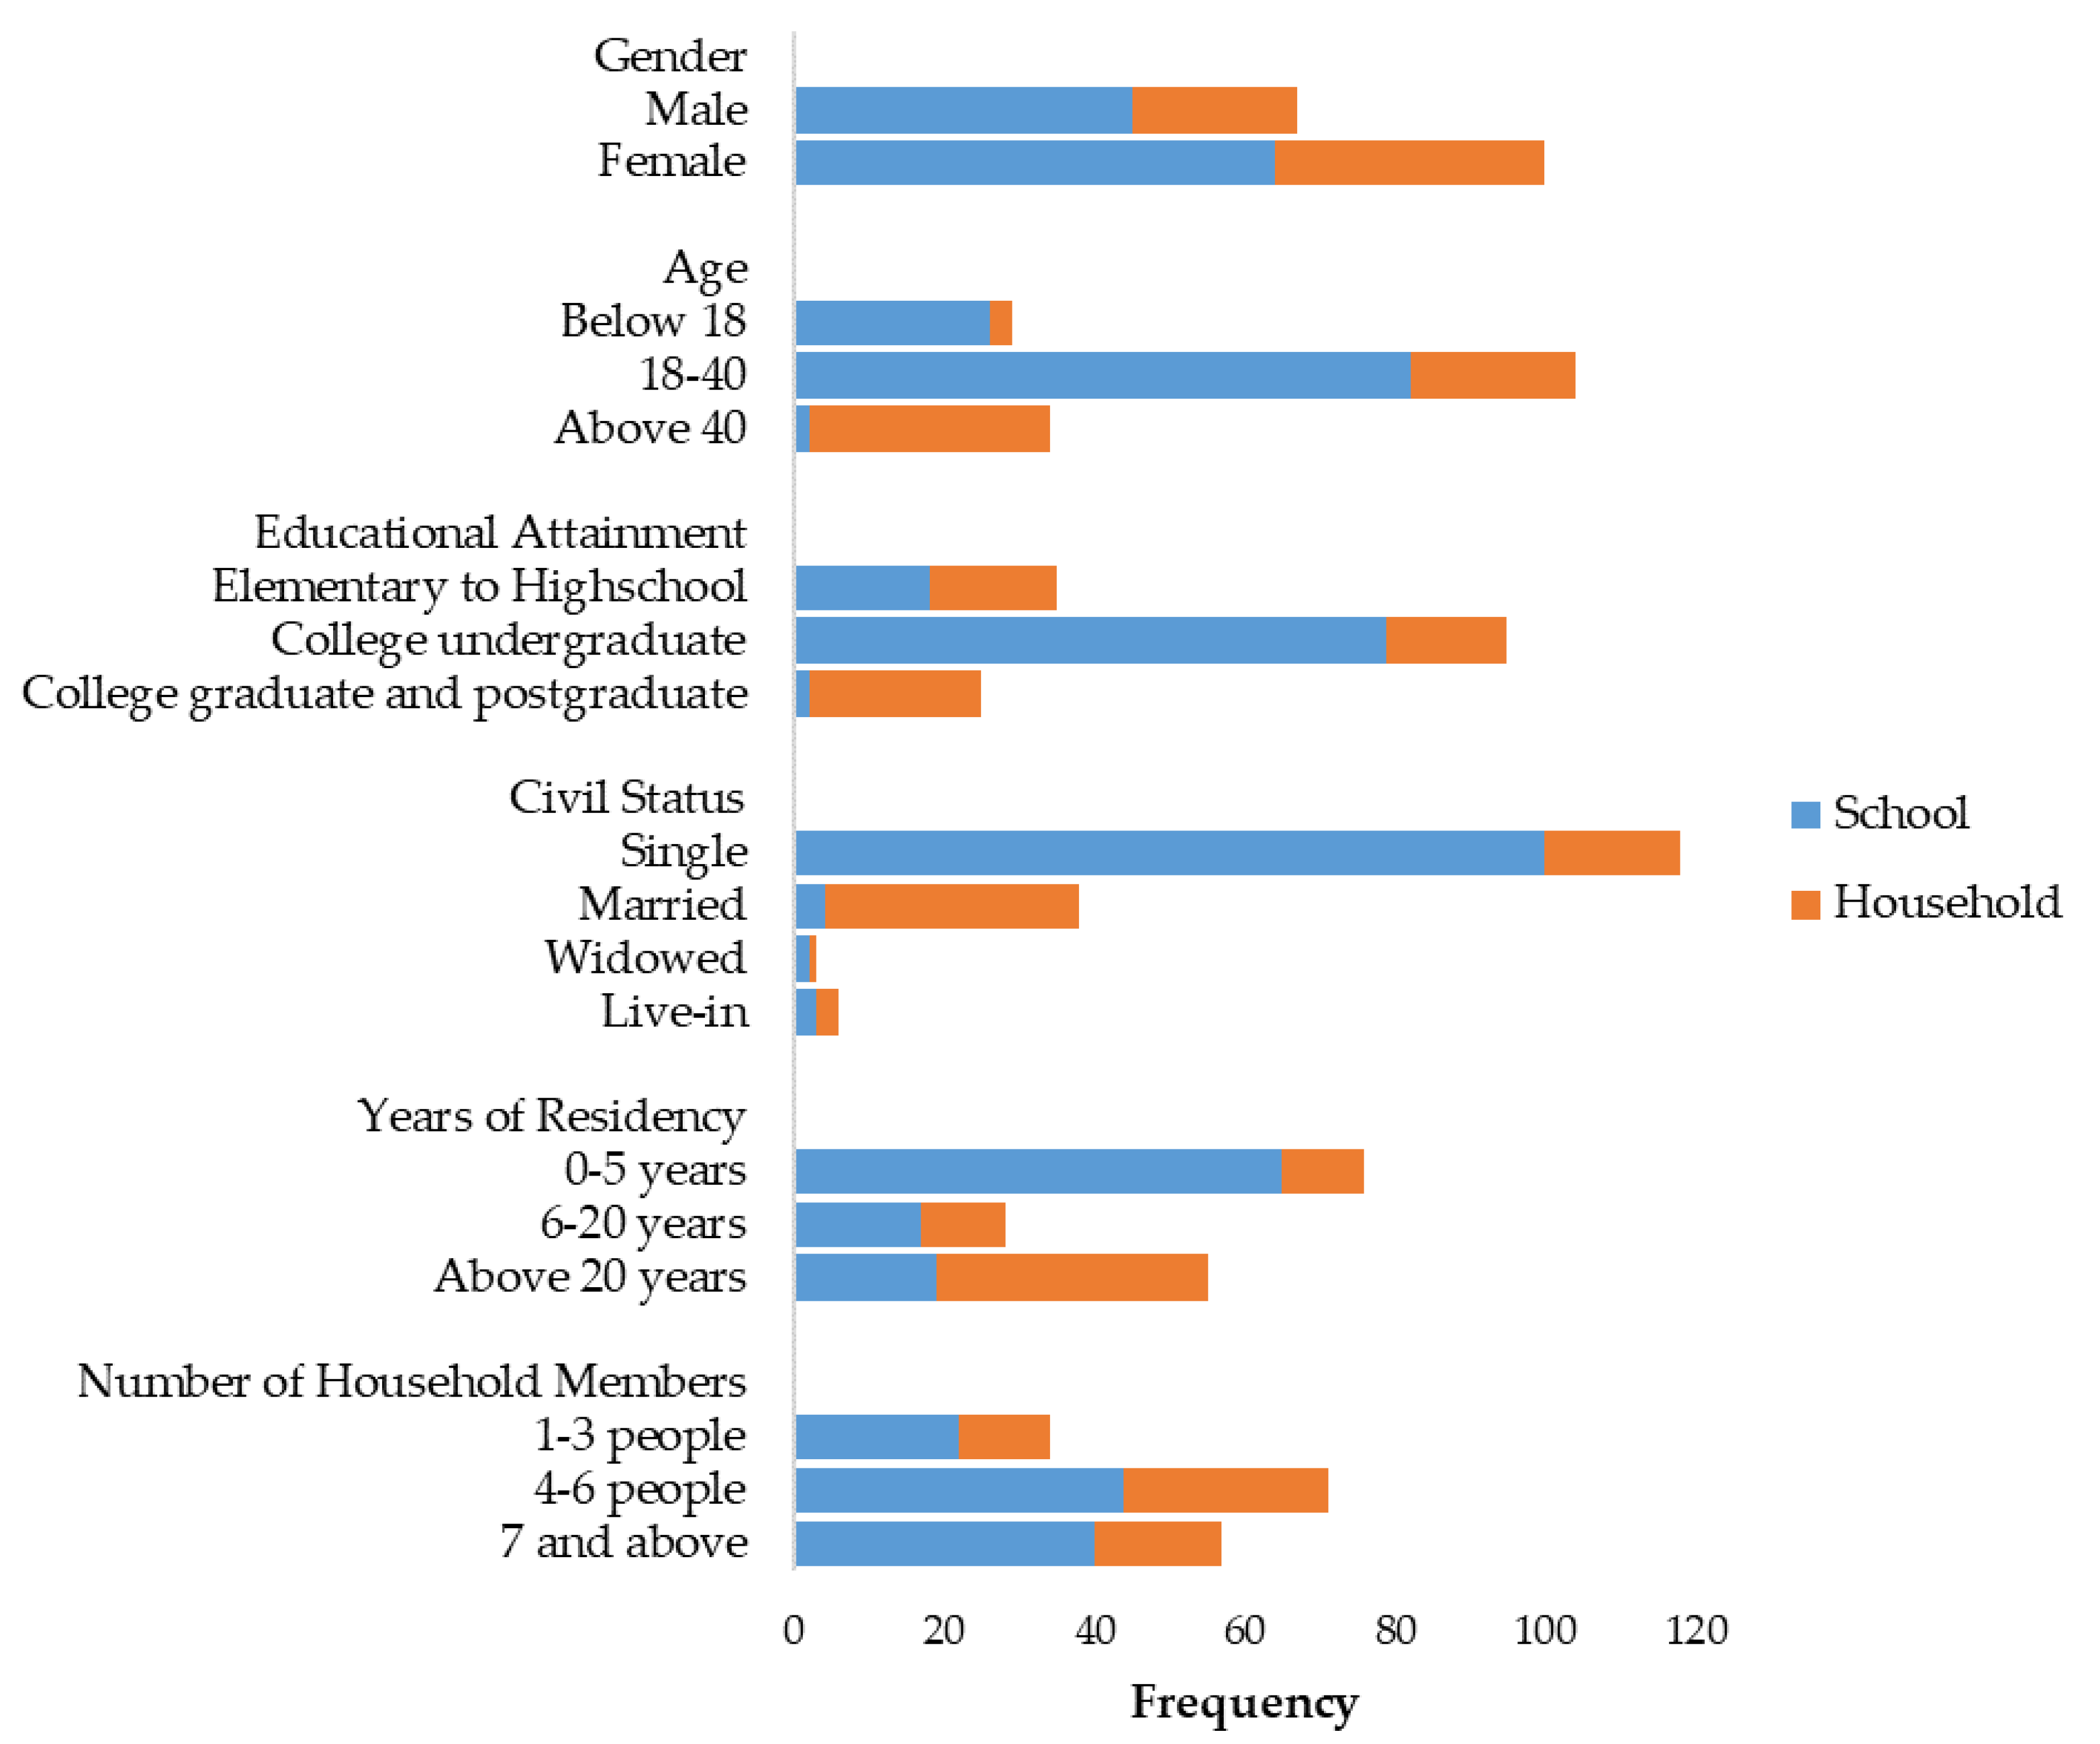
For this research, two community groups were identified: school and household community groups, representing the perception on public-shared and household-shared ETS, respectively. The respondents representing the household community (59 participants) included leaders or representatives from barangays of Mulanay, Local Government Unit (LGU) leaders, and household representatives from an ETS pilot site in a settlement village. On the other hand, the respondents representing the school community (137 participants) included students and faculty members from an ETS pilot site in an agricultural university. Two ETS units were deployed for each study community.

2.7. Data Analysis

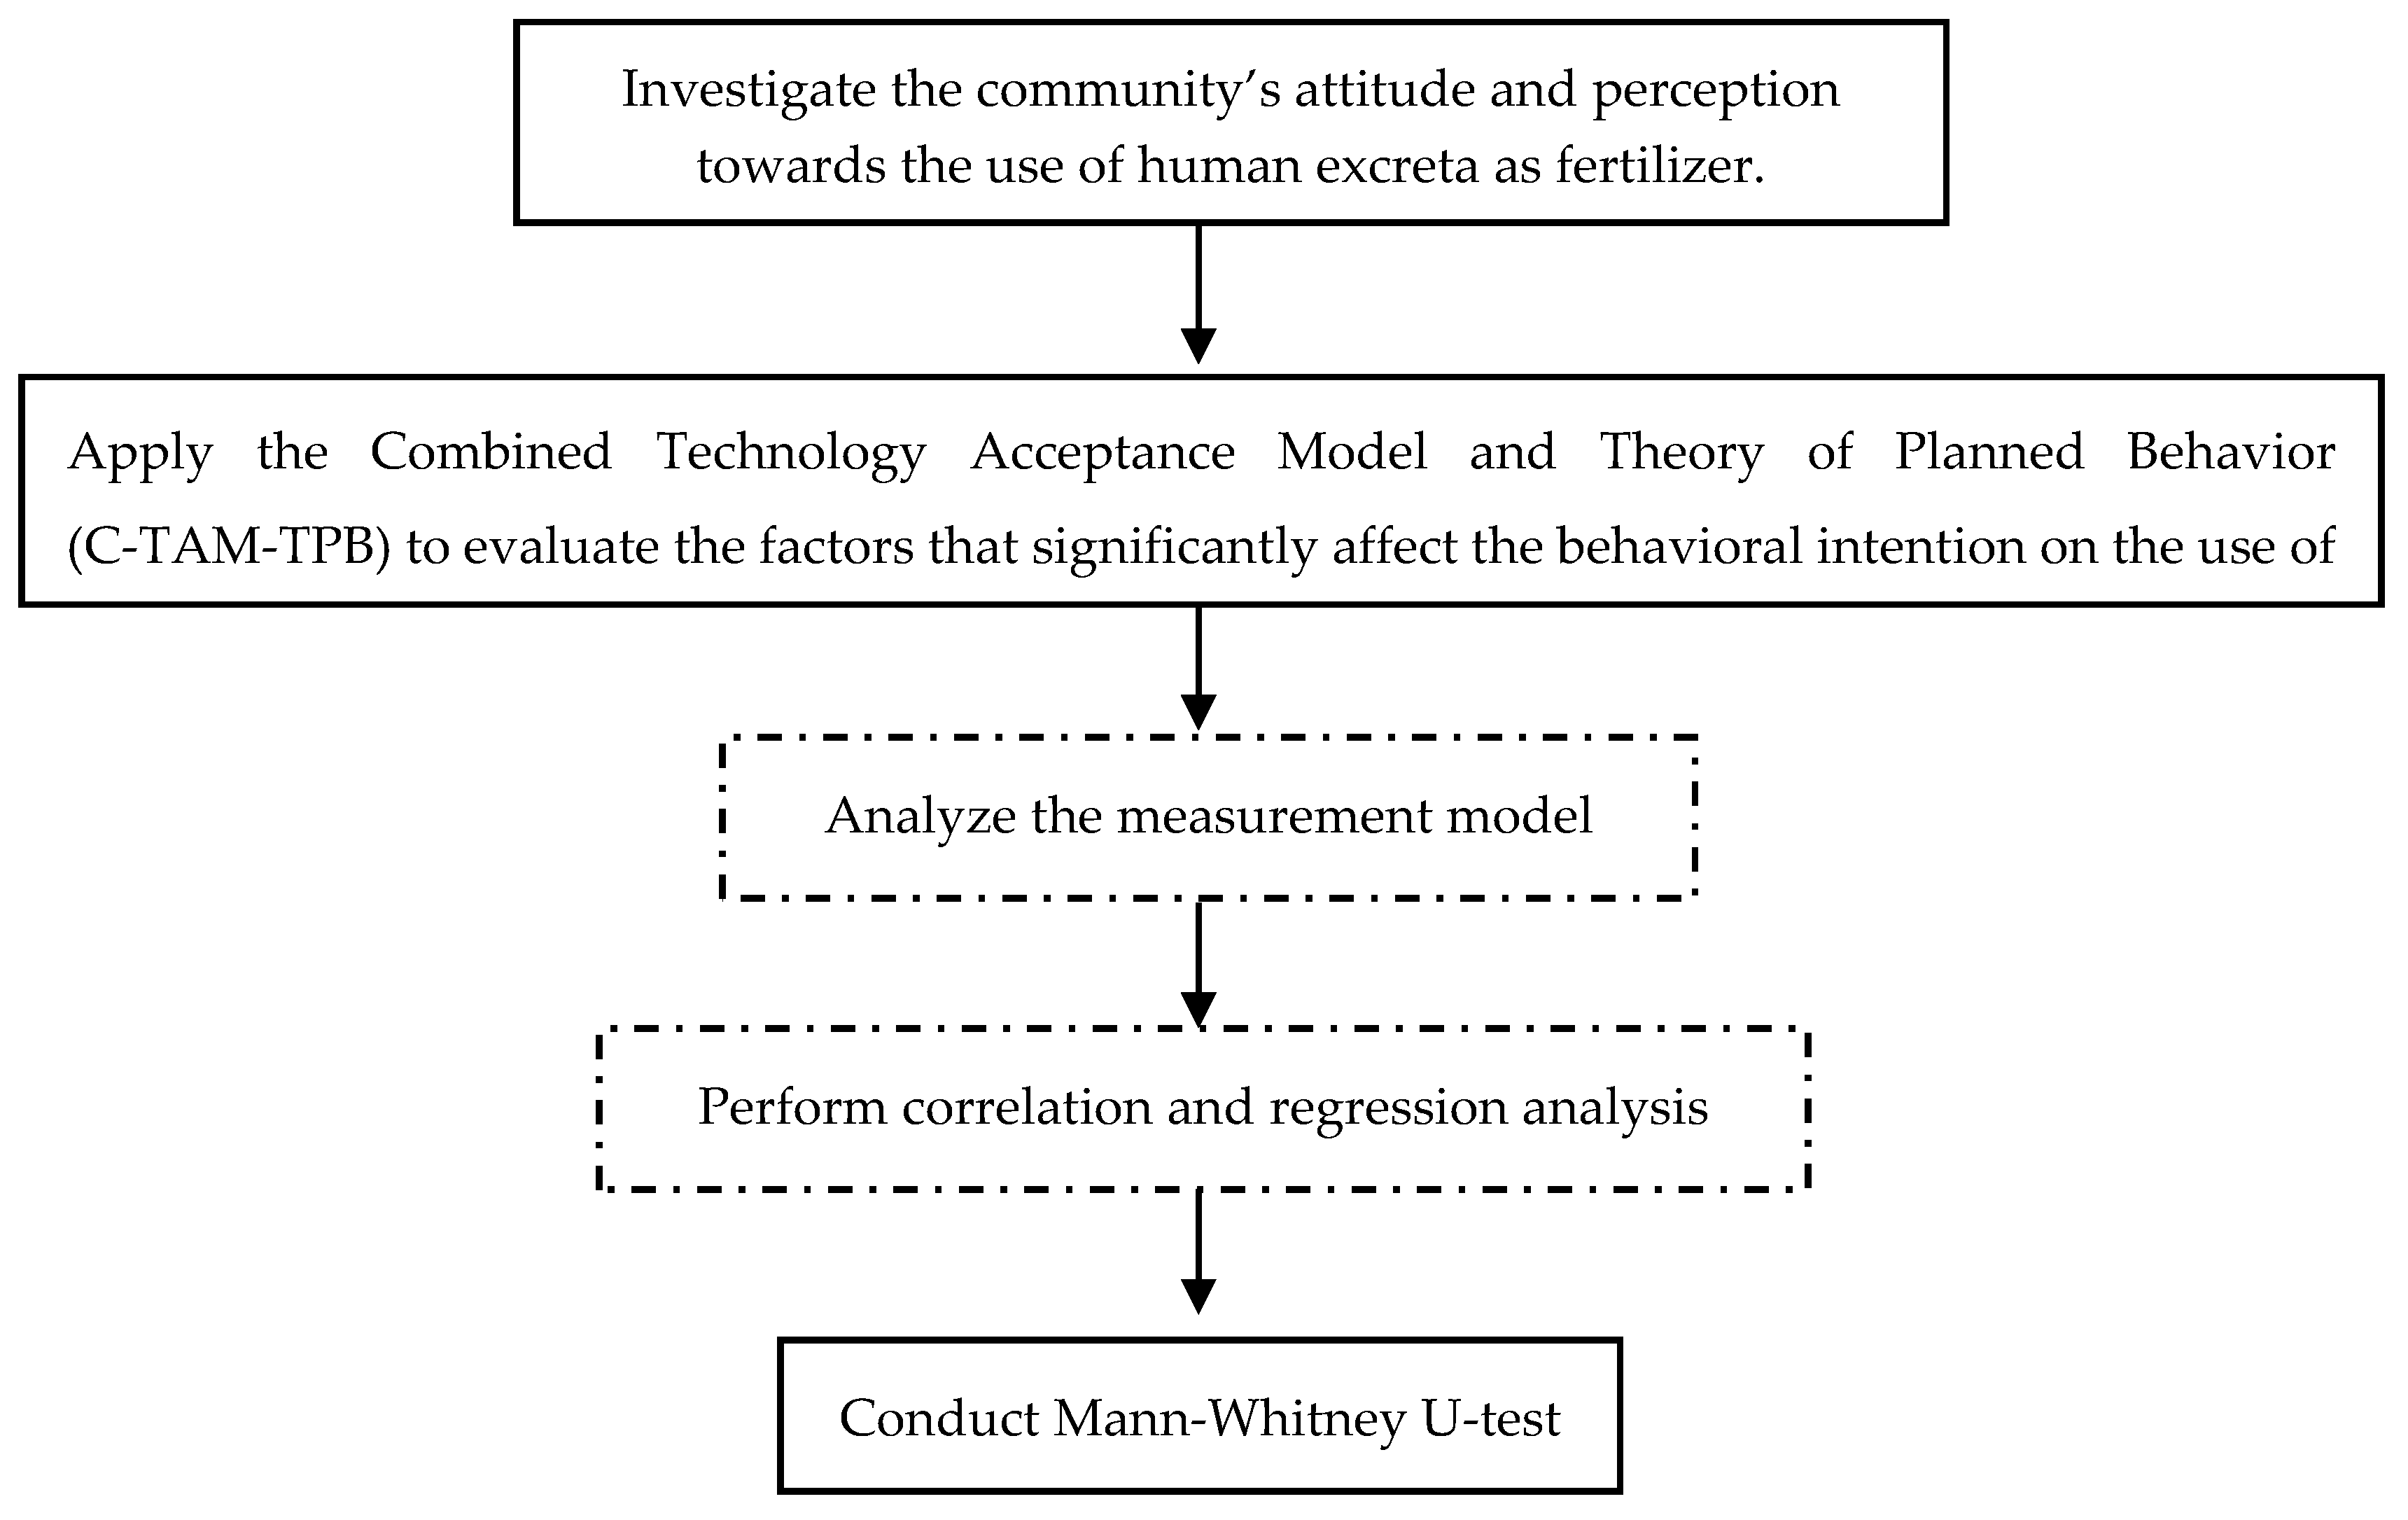
The data collected from the respondents were analyzed using Statistical Package for the Social Sciences (SPSS) ver. 16 (SPSS Inc., Chicago, IL, USA). The steps for data analysis were as follows (see Figure 3):
Step 1: Investigate the community’s attitude and perception towards the use of human excreta.
The attitude and perception of the Mulanay community towards the use of human excreta were examined using six (6) nominal questions about their awareness of the nutrient value of human excreta, perception of human excreta as safe or unsafe as fertilizer, preference of use of human excreta, and willingness to collect the urine and feces. Descriptive statistics were generated then correlations between nominal data sets were evaluated by Chi-square test.
Step 2: Apply the Combined Technology Acceptance Model and Theory of Planned Behavior (C-TAM-TPB) to evaluate the factors that significantly affect the behavioral intention to the use of the ETS.
Step 2a: Analyze the measurement item
The internal validity and reliability of measurement items of the constructs were analyzed by applying factor loading and Cronbach’s alpha reliability test [21]. Cronbach’s alpha is mathematically presented in Equation (1), where N is the total number of items, c ¯ is the average inter-item covariance of the items, and v ¯ is the average variance. All factors with insignificant factor loading and low Cronbach’s α < 0.50) were eliminated.
α = N · c ¯ v ¯ + ( N 1 ) · c ¯
Step 2b: Perform correlation and multiple linear regression analysis
Correlation and multiple linear regression analyses were carried out to elucidate the relationships of the constructs with each other. The correlation analysis was first performed before the regression analysis. In the correlation analysis, the direction and strength of the association of each hypothesized construct to the dependent variable were quantified. Correlation coefficients, denoted by “r,” ranged from +1.0 to −1.0. Values of r greater than 0 but less than +1.0 indicate positive linear association while values of r less than 0 but greater than −1.0 indicate negative linear association. On the other hand, r = 0 indicate no linear association with the dependent variable. In the multiple linear regression analysis, hypothesized predictors with significant correlation per dependent variable were investigated. Predictors with p-values higher than the threshold value of 0.05 were considered insignificant. Effects of significant predictors were assessed in terms of computed unstandardized (B) or standardized (β) coefficients. Coefficient of determination, R-squared was computed to quantify the explanatory power of the multiple linear model.
In this study, the C-TAM-TPB model has more than one dependent variable. Therefore, four multiple linear regression analyses were performed to model the following dependent variables: BIU, ATU, PU, and PEU; in terms of their corresponding hypothesized predictors as mathematically presented in Equations (2)–(5), where Bo is the intercept, BHi is the estimates of the unstandardized coefficients in connection to hypothesis Hi, and e is the random error:
B I U = B o , B I U + B H 1 P U + B H 2 A T U + B H 3 P B C + B H 4 S N + e B U I
A T U = B o , A T U + B H 5 P E U + B H 6 P U + e A T U
P U = B o , P U + B H 7 P E U + B H 8 P C + B H 9 U D + B H 10 A N X + e P U
P E U = B o , P E U + B H 11 P C + B H 12 U D + B H 13 A N X + e P E U
Step 3: Mann-Whitney U-Test
The Mann-Whitney U-test was performed to compare rank data between two groups (e.g., the difference of responses to constructs between people who are aware and unaware of the nutrient value of the human excreta).

3. Results and Discussions

3.1. Socio-Demographic Profile of the Respondents

The demographic characteristics of the respondents comprise of gender, age, educational attainment, civil status, years of residency, and number of household members. The demographic profile of the respondents is presented in Figure 4.
Of the 196 respondents who participated in the self-administered survey, only 169 (86.22%) of the returned questionnaires were considered valid for analysis based on the completeness of the information provided. From the valid responses, 59 (38%) were from the household community group and 110 (62%) were from the school community group. There were 100 (59%) female respondents: 64 from the school community group and 36 from the household community group.
The survey respondents mostly belong to the age group of 19–40 years old, college undergraduates, and single because a large proportion of the respondents came from the school community group.

3.2. Community’s Perception and Attitude Towards Using Human Excreta

Responses to the nominal questions on respondents’ awareness of the nutrient value of human excreta, perception of human excreta as safe or unsafe to be used as fertilizer, preference of use of human excreta, and willingness to collect the urine and feces were presented in Table 3. It is interesting to note that slightly more than half of the respondents are aware of the nutrient value of the human excreta (52.40%). Majority of the respondents think that human urine (55.70%) and feces (75.60%) can be converted into safe fertilizer; however, mostly do not agree that the human excreta should be used to fertilize the soil for edible crops (82.60% for urine; 77.70% for feces). Moreover, 57.70% of the respondents are not willing to collect urine and feces. Results of Chi-square test showed that the community’s perception and attitude towards using human excreta was not influenced by their community group type.
Similar report was observed by Mariwah and Drangert [29] in Ghana. Based on their findings, the community believes that the human excreta contain nutrients that can potentially fertilize the soil for the crops. However, the community shows very low willingness to use any of the human excreta as fertilizers for the crops they eat, neither will they buy food that are grown with human excreta fertilizers. Results revealed that respondents’ perception and attitude towards using human excreta is not influenced by their community group type.
Table 4 shows the main factors to be considered by all respondents for installing an ETS at their home/community. These are (1) opportunities for saving water (47%), (2) a shouldered cost of installation of an ETS (31%), and (3) the reuse of the nutrients from human excreta (22%). The results also show that no multiple responses were selected by the respondents. Water scarcity may be the probable reason why water conservation is the topmost priority of the Mulanay community. This is supported by the 2014 RCBMS data of Mulanay, wherein municipality is at risk of safe water supply and, thus, securing water supply is important. Hartley [30] reported a similar finding in United States. The public acceptance on Eco-Toilet is generally high when the water conservation is fronted as a primary benefit.
The data also showed that, though willingness to pay was not particularly measured, the respondents from Mulanay would relatively prefer water conservation over free installation of the ETS. It should also be noted that roughly less than 5% of their income was being used for water expenditure. Willingness to pay for an ETS is moderate although only very few were aware of the ETS, according to the Lamichhane and Babcock [14]. The willingness to install an ETS in their home was agreed by 80% of the respondents provided that the installation would guarantee no cost to the adopters [14]. Furthermore, introducing the concept of recovering nutrients from human excreta for food production remains a challenge. Thus, low prioritization of nutrient reuse is unsurprisingly expected. In a study conducted in the University of Florida, Ishii and Boyer [17] discovered that nutrient reuse is ranked as the least important benefit of the ETS. Low prioritization on nutrient reuse can also be explained by the low willingness to use human excreta fertilizers for edible crops and low willingness on the collection of human excreta, as previously presented in Table 3.
On the other hand, the respondents selected at least one factor that would discourage them to install an ETS in their home/community. The responses were presented in Table 5. Apparently, most respondents included inexperience to the new technology (n = 135) as a factor that would discourage them to adopt the ETS in their community. Perceived complexity (n = 27) and potential high cost (n = 33) of the ETS were the other factors that would discourage the respondents to install the ETS in their homes. Note that the total number of responses is more than 169 due to the multiple responses. For instance, out of 27 respondents who indicated complexity, 16 of these selected the option ‘complicated’ only, while the remaining 11 selected both ‘complicated’ and ‘expensive’.
Lack of awareness is an anticipated barrier of the technology transfer of an untested technology such as the ETS [8]. In the Philippines, there are not much well-known success stories of implementation of the ETS in rural areas or even in the urban area. People might misunderstand and not consider to adopt the ETS because the technology is not yet tested in the community. Davies-Colley [10] suggests that the ETS should be promoted through awareness programs to overcome the lack of trust of the community to this newly introduced technology.

3.3. Factor Loading and Cronbach’s Alpha Reliability Test

Before the correlation and regression analyses, factor loading analysis and Cronbach’s α reliability test were performed to assess the validity and internal consistency of the measurement items of each construct in the model, as found in Table 2. The result of the tests is shown in Table 6. This study followed the threshold value of 0.5 for factor loading which is set by Hair et al. [31]. Thus, an item pertaining to user demand, i.e., UD5 with factor loading of 0.424, was eliminated prior to the correlation and regression analyses. According to Hatcher [32], removing such item prior to the path analysis would eliminate its effect to the overall result. The threshold value, however, may vary on some studies. For instance, Jen et al. [33] suggested that all measurement items on each construct should reflect a reliability scale not lower than 0.60 to ensure that all items subjected to the next part of the analysis are stable. On the other hand, the Chen and Chen [34] adopted 0.35 as suggested by Nunnally [35].
Moreover, based on the Cronbach’s α reliability test, most of the constructs show strong reliability with α > 0.70. Although the α values of Perceived Behavioral Control and Behavioral Intention to Use are below 0.70, the two constructs are still considered reliable for testing (α > 0.50).

3.4. Correlation and Regression Analyses of the C-TAM-TPB Model

Correlation and regression analyses were conducted to elucidate the relationships of the constructs with each other. In this study, correlation and regression analyses were carried out in series based on the path illustrated in Figure 2. This is mainly because the C-TAM-TPB model involves not only one dependent variable. Aside from BIU, the model also treats Perceived Ease of Use, Perceived Usefulness, and Attitude Towards the Use as dependent variables. Thus, separate tests for each dependent variable are required to completely analyze the C-TAM-TPB.

3.4.1. Result of the Correlation Analysis

The correlation analysis was carried out to evaluate linear relationships between the paired constructs involved in each path. This method determined which of the hypothesized predictors were used in the multiple linear regression. The pairwise correlation coefficients of the construct pairs for this study were presented in Table 7. Evans [36] suggests the following guidelines for absolute value of r: (a) very weak if 0.00 < r ≤ 0.019, (b) weak if 0.20 < r ≤ 0.39, (c) moderate if 0.40 < r ≤ 0.59, (d) strong if 0.60 < r ≤ 0.79 and (e) very strong if 0.80 < r ≤ 1.0.
The results show that perception of the people of Mulanay to the usefulness and ease of use of the ETS is not influenced by their level of anxiety. This is indicated by perceived ease of use’ and perceived usefulness’ corresponding correlation coefficients of r = 0.026 and r = 0.020, respectively. Moreover, perceived behavioral control (r = 0.143) is not correlated with the behavioral intention to use. This means that the Mulanay community does not rely on their own available resources (i.e., money, space, knowledge, lifestyle) to potentially adopt the ETS. However, other studies reported that people are more hesitant towards the ETS when there is insufficient funding and provision of materials for construction of the ETS [13,37].
In summary, the following hypotheses stating anxiety influence ease of use and usefulness perception of respondents (H13 and H10) and perceived behavioral control directly affects the intention to use the ETS (H3) are not supported by the data. Thus, these path components were not used in the multiple linear regression step and the original linear models (Equations (2)–(5)) were modified accordingly.

3.4.2. Result of the Regression Analysis

The result of the regression analysis based on the modified model after correlation analysis is summarized in Table 8. A positive value of B or β indicates that the score of the dependent variable increases as the score of its paired independent variable increases. On the other hand, a negative value indicates inverse relationship between the two variables. Further, the B and β are only useful in explaining the effect of the independent variable to the dependent variable if statistically significant (p-value < 0.010). For the R-squared values greater than 0.67, 0.67 to 0.33, 0.33 to 0.19, and less than 0.19 are considered as a model that has substantial, moderate, weak and undesirable/unacceptable predictive power, respectively [38].

Behavioral Intention to Use

The correlation analysis rejected the influence of PBC to BIU. For this multiple linear regression analysis, only perceived usefulness, attitude towards use, and subjective norms were investigated as predictors of BIU. These predictors were capable of predicting about 16.9% of the variance of BIU. Results showed that PU (β = 0.035, p-value = 0.727) and SN (β = −0.021, p-value = 0.839) failed to be statistically significant predictors of BIU. The community believes that their intention to use the ETS is not directly influenced by the usefulness of the technology (H1) or by their normative beliefs (H4). The behavior of the rural community is directly influenced by their attitude (β = 0.420, p-value < 0.010). This implies that the community would have higher intention on using the ETS when the community’s attitude becomes more positive. Therefore, this model supports H2.
In the study of Van Gelder [39], the respondents believe that attitude of the people is a very important deciding factor in using ecological sanitation technologies. The community believed that keeping the right attitude in using the ETS would increase the human capacity and public awareness in solving the sanitation problem in the community.

Attitude Towards Use

As previously discussed, the ATU was concluded as a significant predictor of BIU. In this section, the predictors of ATU (PEU and PU) were investigated. The findings in this section support H5 and H6, which assume that PEU and PU directly affect ATU respectively. PEU (β = 0.323, p-value < 0.01) and PU (β = 0.417, p-value < 0.01) were able to explain the 46.4% of the variance (adjusted R2 = 0.464) in the ATU of the ETS. These predictors also have positive and significant relationship with ATU. This means that, when the respondents from Mulanay recognize that the ETS is becoming more adaptable and useful, their attitude becomes more positive towards using the ETS. The result is consistent with other a previous study that utilized C-TAM-TPB. Chen et al. [34] explained that the users can improve their attitude towards the use of the new technology without exerting too much effort while fulfilling their service needs.

Perceived Usefulness

The ETS is believed to enhance sanitation [9]. The PU is to what extent the users believe that the ETS would improve the sanitation. In the previous multiple linear regression models, PU was found to be a not significant determinant of BIU, however it showed indirect effect to BIU through the mediation of ATU. PU, in this model, is hypothetically influenced by PEU, UD and PC. The regression analysis revealed that PEU (β = 0.506, p-value < 0.010) and UD (β = 0.383, p-value < 0.010) were significant predictors of PU. The result of this path analysis supports the H9 and H7, which suggest that UD and PEU have direct effect to the PU of the ETS. The people of Mulanay would consider the ETS to be more useful when they feel that they are more in need of sanitation solutions. In addition, the community would be more convinced that the ETS is a useful tool in improving sanitation in Mulanay if the system is more convenient to use and easy to understand. The significant relationship between PEU and PU is validated by the study of Chen et al. [25] in predicting the adoption of an electronic toll collection system.

Perceived Ease of Use

Perceived ease of use signifies that the system is considered effortless to use and learn [25] by the community. The predictors of PEU (political climate and user demand) were able to elucidate the 31.8% of the variation of PEU. It was found out that, in this multiple linear regression model, that only UD (β = 0.365, p-value < 0.010) can significantly predict the PEU of the ETS. Thus, H12 is accepted. The community perceives that it would be easier for them to understand and use the ETS if their demand on sanitation solutions becomes higher.
The ETS is not just a sanitation technology that needs to be introduced to communities, it is also a new philosophy of water conservation, food production, and environmental protection [5]. Raising the awareness on the need for sanitation may create a trend on the behavior of the communities towards the adoption of a sanitation solution [40]. Beliefs on the ease of use and usefulness of the ETS are higher as the demand on sanitation becomes higher. Therefore, activities like campaigns to raise awareness on sanitation may be beneficial to create bigger demand on sustainable sanitation solutions.

3.5. Acceptability and Willingness to Use the ETS, and Awareness on Its Benefits

The Mann-Whitney U-test was conducted to examine if there are significant differences in perceptions between (1) those who are aware and unaware of the nutrient value of excreta, (2) those who think or do not think that urine can be a safe fertilizer, (3) those who think or do not think that feces can be a safe fertilizer, and (4) those who are and not willing to collect their urine and feces.
The results of the Mann-Whitney U-test (in Table 9) show that those respondents who are aware of the benefits of the human excreta have more positive attitude and higher behavioral intention to use the ETS. The test also shows that they are more affected by their subjective norms.
In the result shown in Table 10, the differences of the responses were not statistically different between those who believe and do not believe urine can be used as a safe fertilizer. However, the responses on UD questions were significantly different between those who believe and do not believe feces can be used as a safe fertilizer (Table 11). Those who believe that feces can be used as safe fertilizer have higher demands of sanitation solution. Roma et al. [41] believed that raising the awareness on nutrient value of human urine and feces would promote the acceptance of the ETS.
Table 12 shows the comparison of responses in terms respondents willingness to utilize human feces and urine as fertilizer. All constructs, except anxiety, were scored higher by the respondents who are in favor of human excreta as fertilizer. The results highlighted that respondents from Mulanay have generally positive attitude toward the ETS however they are not willing to participate in excreta collection. Furthermore, anxiety to the ETS is not influenced by willingness.
The explanation to the results depicted in Table 9, Table 10, Table 11 and Table 12 is related to the discussion in Section 3.2, which elucidated the community awareness on nutrient value and the unwillingness to use human excreta to fertilize the soil for edible crops.
Although the benefits of the ETS are mostly agreed by the people, shifting to ecological sanitation paradigm remains a long process. One of the major causes that slow the transition process is related to the management of the excreta. The taboo associated with the handling of human urine and feces most likely caused the unwillingness of the community to collect source separated excreta [42].

4. Conclusions

This work provides an elucidation on the factors that affect the perceptions and attitudes of the rural community towards the eco-toilet system (ETS) using Mulanay, Quezon as the study area in the Philippines. The combined Technology Acceptance Model—Theory of Planned Behavior (C-TAM-TPB) provides a useful tool in defining and explaining the significant predictors of community behavior towards adoption of new technology, particularly the eco-toilet. The findings reveal that attitude is the main driver of behavioral intention to use the ETS, which could be enhanced by promoting the ease of use and usefulness of the ETS. Creating demand on sanitation in rural areas also influences the perception of the users towards the use of technology. In addition, the ETS is most appealing to the people of Mulanay if the water conservation benefit will be guaranteed. Moreover, although the people believe that urine and feces can be converted to safe fertilizers, the collection of human excreta and nutrient reuse for food production are the least priorities in Mulanay.
Potential users of the ETS who are knowledgeable of the nutrient value of human excreta and are willing to collect them tend to have more positive attitudes toward the ETS. Such findings provide valuable insights to policy makers and researchers in achieving SDG 6 and promoting sustainable development of the ETS in villages or rural areas. This work thus serves as a baseline and impetus for future studies on sustainability of the ETS in the Philippines. Model validation and testing on other study areas in the Philippines will be investigated in future work.

Acknowledgments

This study is made possible with the generous support of the American people through the U.S. Agency for International Development (USAID) in partnership with RTI International through its Science, Technology, Research, and Innovation for Development (STRIDE) Program. One of the authors is also grateful for the support provided by De La Salle University through the CHED-Philippine Higher Education Research Network (PHERNet) Program on Sustainability Studies. The researchers would also like to extend their gratitude to the Local Government Unit of Mulanay and Polytechnic University of the Philippines (PUP) Mulanay Campus for taking part on this study.

Author Contributions

Jonathan Jared Ignacio, Arnel Beltran, Lawrence Belo, Renan Ma. Tanhueco, Marlon Era, Ramon Christian Eusebio, Michael Angelo Promentilla, Aileen Orbecido conceived the study; all authors reviewed, analyzed, and finalized the survey material for this study; Jonathan Jared Ignacio, Carla Mae Pausta, Lawrence Belo, Renan Ma. Tanhueco, Michael Angelo Promentilla, and Aileen Orbecido administered the data collection; Jonathan Jared Ignacio, Roy Alvin Malenab, Arnel Beltran, Marlon Era, Michael Angelo Promentilla, and Aileen Orbecido conducted the review and analysis of data; Jonathan Jared Ignacio, Roy Alvin Malenab, Michael Angelo Promentilla and Aileen Orbecido wrote the main narrative of this paper. Aileen Orbecido spearheaded the overall activities of the study; all authors have read and approved the manuscript, and in the decision to publish the results.

Conflicts of Interest

The authors declare no conflict of interest.

References

  1. United Nations. Progress towards the Sustainable Development Goals: Report of the Secretary-General. Available online: https://unstats.un.org/sdgs/files/report/2017/secretary-general-sdg-report-2017--EN.pdf (accessed on 14 February 2018).
  2. WHO/UNICEF. Progress on Drinking Water, Sanitation and Hygiene: 2017 Update and SDG Baselines; World Health Organization (WHO): Geneva, Switzerland, 2017. [Google Scholar]
  3. The World Bank. Economic Assessment of Sanitation Interventions in the Philippines a Six-Country Study Conducted in Lao PDR, the Philippines and Vietnam under the Economics of Sanitation Initiative (ESI); The World Bank: Washington, DC, USA, 2011. [Google Scholar]
  4. Asian Development Bank. Water Supply and Sanitation Sector Assessment, Strategy, Roadmap; Asian Development Bank: Mandaluyong, Philippines, 2013. [Google Scholar]
  5. WSP. Philippines Sanitation Sourcebook and Decision Aid; WSP: Jakarta, Indonesia, 2007; ISBN 9780874216561. [Google Scholar]
  6. Rural Population: Philippines. WHO/UNICEF Joint Monitoring Programme (JMP) for Water Supply and Sanitation. Available online: https://data.worldbank.org/indicator/SH.STA.ACSN.RU (accessed on 26 October 2017).
  7. Cantrell, B.L. An Evaluation of a Water, Sanitation, and Hygiene Program in Rural Communities Outside of Port-au Prince, Haiti. Master’s Thesis, Georgia State University, Atlanta, GA, USA, 2013. [Google Scholar]
  8. Anand, C.K.; Apul, D.S. Composting toilets as a sustainable alternative to urban sanitation—A review. Waste Manag. 2014, 34, 329–343. [Google Scholar] [CrossRef] [PubMed]
  9. Simha, P. Nutrient Recovery Systems for Human Urine—Ways to Realize Closed Loop Sanitation and Future Sustainable. Int. J. Sci. Res. 2013, 3, 1–6. Available online: http://www.ijsrp.org/research-paper-1013/ijsrp-p2205.pdf (accessed on 14 February 2018).
  10. Davies-Colley, C.; Smith, W. Implementing environmental technologies in development situations: The example of ecological toilets. Technol. Soc. 2012, 34, 1–8. [Google Scholar] [CrossRef]
  11. Lienert, J.; Larsen, T.A. Considering user attitude in early development of environmentally friendly technology: A case study of NoMix toilets. Environ. Sci. Technol. 2006, 40, 4838–4844. [Google Scholar] [CrossRef] [PubMed]
  12. Widomski, M.; Ladziak, E.; Lagod, G. Economic Aspects of Sustainable Sanitation in Rural Settlements. Archit. Civ. Eng. Environ. 2017, 3, 153–162. [Google Scholar]
  13. Uddin, S.M.N.; Muhandiki, V.S.; Sakai, A.; Al Mamun, A.; Hridi, S.M. Socio-cultural acceptance of appropriate technology: Identifying and prioritizing barriers for widespread use of the urine diversion toilets in rural Muslim communities of Bangladesh. Technol. Soc. 2014, 38, 32–39. [Google Scholar] [CrossRef]
  14. Lamichhane, K.M.; Babcock, R., Jr. Survey of attitudes and perceptions of urine-diverting toilets and human waste recycling in Hawaii. Sci. Total Environ. 2013, 443, 749–756. [Google Scholar] [CrossRef] [PubMed]
  15. Poortvliet, P.M.; Sanders, L.; Weijma, J.; De Vries, J.R. Acceptance of new sanitation: The role of end-users’ pro-environmental personal norms and risk and benefit perceptions. Water Res. 2018, 131, 90–99. [Google Scholar] [CrossRef] [PubMed]
  16. Wood, A.; Blackhurst, M.; Lawler, D. Social acceptance as a prerequisite for social sustainability. ASCE 2016. [Google Scholar] [CrossRef]
  17. Ishii, S.K.L.; Boyer, T.H. Student support and perceptions of urine source separation in a university community. Water Res. 2016, 100, 146–156. [Google Scholar] [CrossRef] [PubMed]
  18. Lai, P. The Literature Review of Technology Adoption Models and Theories for the Novelty Technology. J. Syst. Technol. Manag. 2017, 14, 21–38. [Google Scholar] [CrossRef]
  19. Davis, F.D. Perceived usefulness, perceived ease of use, and user acceptance of information technology. MIS Q. 1989, 13, 319–340. [Google Scholar] [CrossRef]
  20. Ajzen, I. The theory of planned behavior. Organ. Behav. Hum. Decis. Process. 1991, 50, 179–211. [Google Scholar] [CrossRef]
  21. Chen, S. Using the sustainable modified TAM and TPB to analyze the effects of perceived green value on loyalty to a public bike system. Transp. Res. Part A 2016, 88, 58–72. [Google Scholar] [CrossRef]
  22. Mnkeni, P.N.S.; Kutu, F.R.; Muchaonyerwa, P.; Austin, L.M. Evaluation of human urine as a source of nutrients for selected vegetables and maize under tunnel house conditions in the Eastern Cape, South Africa. Waste Manag. Res. 2008. [Google Scholar] [CrossRef] [PubMed]
  23. Holmer, R.; Factura, H., III; Miso, A.; Sol, G.; Santos, C., Jr.; Elorde, E.; Lee, S.; Montes, A.A. UDD toilets with reuse in allotment gardens Cagayan de Oro, Philippines—Case study of sustainable sanitation projects; Sustainable Sanitation Alliance (SuSanA): Cagayan de Oro, Philippines, 2009; Available online: http://www.susana.org/en/knowledge-hub/resources-and-publications/library/details/47 (accessed on 14 February 2018).
  24. Davis, F.D. A Technology Acceptance Model for Empirically Testing new End-User Information Systems: Theory and Results. Ph.D. Dissertation, Sloan School of Management, Massachusetts Institute of Technology, Cambridge, MA, USA, 1986. [Google Scholar]
  25. Chen, C.; Fan, Y.; Farn, C. Predicting electronic toll collection service adoption: An integration of the technology acceptance model and the theory of planned behavior. Transp. Res. Part C Emerg. Technol. 2007, 15, 300–311. [Google Scholar] [CrossRef]
  26. Mathieson, K. Predicting user intentions: Comparing the technology acceptance model with the theory of planned behavior. Inf. Syst. Res. 1991, 2, 173–191. [Google Scholar] [CrossRef]
  27. Taylor, S.; Todd, P. Assessing It usage: The role of prior experience. Manag. Inf. Syst. Q. 1995, 19, 561–570. [Google Scholar] [CrossRef]
  28. Philippine Statistics Authority. Highlights of the Philippine Population 2015 Census of Population. Available online: https://psa.gov.ph/content/highlights-philippine-population-2015-census-population (accessed on 14 February 2018).
  29. Mariwah, S.; Drangert, J. Community perceptions of human excreta as fertilizer in peri-urban agriculture in Ghana. Waste Manag. Res. 2015, 29, 815–822. [Google Scholar] [CrossRef]
  30. Hartley, T.W. Public perception and participation in water reuse. Desalination 2006, 187, 115–126. [Google Scholar] [CrossRef]
  31. Hair, J.F.; Tatham, R.L.; Anderson, R.E.; Black, W. Multivariate Data Analysis, 7th ed.; Pearson Prentice Hall: Upper Saddle River, NJ, USA, 2010. [Google Scholar]
  32. Hatcher, L. Step-by-Step Approach to Using the SAS System for Factor Analysis and Structural Equation Modeling; SAS Institute Inc.: Cary, NC, USA, 1994. [Google Scholar]
  33. Jen, W.; Lu, T.; Liu, P.-T. An Integrated Analysis of Technology Acceptance Behaviour Models: Comparison of Three Major Models. Int. J. 2009, 15, 89–121. [Google Scholar]
  34. Chen, H.; Chen, S.-C. The empirical study of automotive telematics acceptance in Taiwan: Comparing three Technology Acceptance Models Shih-Chih Chen. Int. J. Mob. Commun. 2009, 7, 50–65. [Google Scholar] [CrossRef]
  35. Nunnally, J. Psychometric Theory, 2nd ed.; McGraw-Hill: New York, NY, USA, 1978. [Google Scholar]
  36. Evans, J.D. Straightforward Statistics for the Behavioral Sciences; Brooks/Cole Publishing: Pacific Grove, CA, USA, 1996. [Google Scholar]
  37. Tsinda, A.; Abbott, P.; Pedley, S.; Charles, K.; Adogo, J.; Okurut, K.; Chenoweth, J. Challenges to achieving sustainable sanitation in informal settlements of Kigali, Rwanda. Int. J. Environ. Res. Public Health 2013, 10, 6939–6954. [Google Scholar] [CrossRef] [PubMed] [Green Version]
  38. Zeweld, W.; Van Huylenbroeck, G.; Tesfay, G.; Speelman, S. Smallholder farmers â€TM behavioural intentions towards sustainable agricultural practices. J. Environ. Manag. 2017, 187, 71–81. [Google Scholar] [CrossRef] [PubMed]
  39. Van Gelder, M. Implementing Ecological Sanitation—A Study on Capabilities and Capacities in India, University of Utrecht. Master’s Thesis, University of Utrecht, Utrecht, The Netherland, 2011. [Google Scholar]
  40. Waterkeyn, J.; Cairncross, S. Creating demand for sanitation and hygiene through Community Health Clubs: A cost-effective intervention in two districts in Zimbabwe. Soc. Sci. Med. 2005, 61, 1958–1970. [Google Scholar] [CrossRef] [PubMed]
  41. Roma, E.; Philp, K.; Buckley, C.; Xulu, S.; Scott, D. User perceptions of urine diversion dehydration toilets: Experiences from a cross-sectional study in eThekwini Municipality. Water SA 2013, 39, 305–312. [Google Scholar] [CrossRef]
  42. Feachem, R.G.; Bradley, D.J.; Garelick, H.; Mara, D.D. Sanitation and Disease: Health Aspects of Excreta and Wastewater Management; John Wiley & Sons: New York, NY, USA, 1983. [Google Scholar]
Figure 1. Urine-diverting toilet interface.
Sustainability 10 00521 g001
Figure 2. The proposed research framework.
Sustainability 10 00521 g002
Figure 3. Flowchart of data analysis.
Sustainability 10 00521 g003
Figure 4. Socio-demographic characteristics of respondents, by community group.
Sustainability 10 00521 g004
Table 1. Survey questions on perceptions and attitudes toward human excreta and factors that would encourage and discourage users to install the ETS.
QuestionsResponse
Are you aware that your feces and urine have nutrient value?Yes
No
Do you think urine can be used as a safe fertilizer?Yes
No
Do you think feces can be used as a safe fertilizer?Yes
No
Which type of plant do you prefer to use urine as fertilizer?Edible
Non-edible
Which type of plant do you prefer to use feces as fertilizer?Edible
Non-edible
Are you willing to collect your urine and feces?Yes
No
What factors would encourage you to install the ETS at your home?Free Installation
Conserve water Nutrient reuse Others
What factors would discourage you to install the ETS at your home?Technology not tested
Expensive Complicated
Others
Table 2. C-TAM-TPB Questionnaire.
ConstructsItemsStatements
Political climatePC1The community leaders will support the implementation, operation, and maintenance of the ETS.
PC2The local government will support the implementation, operation, and maintenance of the ETS.
PC3Solution to water quality problems is a priority of our community leaders or local government.
User demandUD1Using the system is necessary in my lifestyle.
UD2The ETS will motivate us to improve the health in the community.
UD3I understand that the ETS has economic benefits
UD4The ETS will help solve the water-borne disease problems in my community.
UD5We need more toilet in the community.
AnxietyANX1I hesitate to use the ETS for fear of making mistakes I cannot correct.
ANX2I am afraid I cannot operate and maintain the ETS well.
ANX3I am afraid that the ETS might be unsanitary.
ANX4I feel apprehensive and discomfort about using the ETS.
ANX5The ETS is somewhat intimidating to me.
Perceived ease of usePEU1My interaction with the ETS would be clear and understandable.
PEU2It is easy for me to learn and become skillful at using the ETS.
Perceived usefulnessPU1I would find the ETS useful and efficient in improving the sanitation for my community.
PU2Using the ETS will enable me to improve the sanitation in my community faster.
PU3Using the ETS would motivate me to improve the sanitation in my community.
Attitude towards use of the ETSATU1Using the ETS is a good idea.
ATU2The ETS makes my lifestyle more interesting.
ATU3I like to use the ETS.
Perceived behavioral controlPBC1I have the resource necessary to use the ETS. (money, space, etc.)
PBC2I have the knowledge necessary to use the ETS.
PBC3A specific person (or group) is available for assistance if there will be difficulties in using the ETS.
Subjective normSN1People who are important to me would think that using the ETS is good for me.
SN2People who influence my behavior would think that I should use the ETS.
SN3In general, my community has supported the use of the ETS
Behavioral intention to use the ETS BIU1 BIU2I plan to use the system in the next 12 months.
I have no plan to use the system in the next 12 months.
Table 3. Survey responses to general ETS questions.
QuestionsResponse% Frequencyp-Value (Chi-Square)
SchoolHouseholdsOverall
Are you aware that your feces and urine have nutrient value?Yes50.0056.9052.400.40
No50.0043.1047.60
Do you think urine can be used as a safe fertilizer?Yes50.9064.9055.700.08
No49.1035.1044.30
Do you think feces can be used as a safe fertilizer?Yes78.2070.7075.600.28
No21.8029.3024.40
Which type of plant do you prefer to use urine as fertilizer?Edible18.3015.5017.400.65
Non-edible81.7084.5082.60
Which type of plant do you prefer to use feces as fertilizer?Edible24.8017.5022.300.29
Non-edible75.2082.5077.70
Are you willing to collect your urine and feces?Yes40.9044.8042.300.62
No59.1055.2057.70
Table 4. Factors that would encourage users to install an ETS at their home/community.
FactorsActual Count
Free installation53
Conserve water79
Nutrient reuse37
Table 5. Factors that would discourage users to install an ETS at their home/community.
FactorsActual Count
Technology not tested110
Expensive13
Technology not tested and expensive9
Technology not tested, complicated, and expensive9
Complicated9
Technology not tested and complicated7
Complicated and expensive2
Table 6. Factor loading and Cronbach’s alpha of the measurement items and constructs.
ConstructsItemsFactor loadingCronbach alpha (α)
Political climatePC10.8730.846
PC20.923
PC30.831
User demandUD10.7850.765
UD20.819
UD30.846
UD40.771
UD50.424
AnxietyANX10.8430.874
ANX20.860
ANX30.873
ANX40.856
ANX50.640
Perceived ease of usePEU10.9460.883
PEU20.946
Perceived usefulnessPU10.8690.868
PU20.935
PU30.870
Attitude towards use of the ETSATU10.8420.805
ATU20.905
ATU30.813
Perceived behavioral controlPBC10.7560.593
PBC20.797
PBC30.676
Subjective normSN10.9230.915
SN20.947
SN30.905
Behavioral intention to use the ETS BIU1 BIU20.865 0.8650.662
Table 7. Correlations of the constructs.
ANXPCUDPEUPUATUPBCSN
PEU0.026 ns0.407 *0.568 *
PU0.020 ns0.381 *0.651 *0.711 *
ATU 0.620 *0.647 *
BIU 0.293 *0.429 *0.143 ns0.286 *
* Correlation is significant at the 0.05 level; ns Correlation is not significant (p-value > 0.05).
Table 8. Linear regression analysis.
Dependent VariablePredictorBB Std. Errorβp-valueAdj R2 (p-Value)
BIUConstant1.685 0.348 --0.169
PU0.0370.1070.0350.727(<0.010)
ATU0.4200.1030.4200.000
SN0.022 (-)0.1090.021 (-)0.839
ATUConstant0.8710.267--0.464
PEU0.3240.0810.3230.000(<0.010)
PU0.4440.0860.4170.000
PUConstant0.7350.248--0.590
PC0.033 (-)0.0570.035 (-)0.561(<0.010)
UD0.4220.0740.3830.000
PEU0.4780.0580.5060.000
PEUConstant1.1440.324--0.333
PC0.1350.0760.1330.080(<0.010)
UD0.5860.0880.5010.000
Table 9. The difference of responses to the constructs between people who are aware and unaware of the nutrient value of the human excreta.
Sustainability 10 00521 i001
Table 10. The difference of responses to the constructs between people who believe urine can be used as safe fertilizer.
Sustainability 10 00521 i002
Table 11. The difference of responses to the constructs between people who believed feces can be used as a safe fertilizer.
Sustainability 10 00521 i003
Table 12. The difference of responses to the constructs between the people who are willing to collect urine and feces.
Sustainability 10 00521 i004

