Article

Perceptions, Preferences, and Behavior Regarding Energy and Environmental Costs: The Case of Montreal Transport Users

Department of Civil Engineering and Applied Mechanics, McGill University, 817 Sherbrooke Street West, Montreal, QC H3A 0C3, Canada
*
Author to whom correspondence should be addressed.
Sustainability 2018, 10(2), 514; https://doi.org/10.3390/su10020514
Submission received: 28 December 2017 / Revised: 1 February 2018 / Accepted: 12 February 2018 / Published: 14 February 2018
(This article belongs to the Section Sustainable Transportation)

Abstract

:
Providing travel-related fuel and environmental information to transport users is becoming increasingly relevant. However, the impact of providing such information on users’ travel behavior is yet to be determined. This research examined the perceptions and preferences related to the fuel consumption costs, greenhouse gas (GHG) social costs, and health-related air pollution costs, and the influence such information could have on travel behavior. Examining the case of Montreal transport users, the authors conducted a survey in which the respondents were asked general and stated preference questions. The respondents were found to be unaware of the energy and environmental footprints of their travel. Approximately 85% of the respondents were not able to estimate GHG social costs and health-related air pollution costs across different modes. The respondents generally overestimated these costs and they interestingly reported higher environmental costs for public transport (metro) compared to cars. They also preferred to receive such information in monetary units, and they were more comfortable in receiving the information through mobile applications over other tools/means. The research also found that fuel and environmental information influence respondents’ travel decisions especially their route choices. Finally, the respondents would be willing to pay an average of 7 Canadian dollars/month in exchange for obtaining the information.

1. Introduction

The transportation sector in Canada is the second greatest source of greenhouse gases (GHGs), accounting for 24% of the national carbon dioxide (CO2) emissions [1]. The sector is also the leading source of criteria air pollutants, especially nitrogen oxides (NOx) and carbon monoxide (CO), contributing to 42% and 59% of total national emissions, respectively [2]. These emissions pose severe threats to the environment and social well-being. A study conducted in eight countries in Europe found that an increase of 4000 vehicle-km in daily road traffic within 100 m of a person’s residence increased his/her risk of lung cancer by 10% [3]. Crouse, et al. [4] found a cardiovascular mortality increase of 27% to 35% in Canadian adults for each 10-μg/m3 increase in ambient fine particulate matter concentrations (≤2.5 μm in diameter, PM2.5).
Despite the adverse health and environmental impacts of transportation, transport users continue making unsustainable travel decisions [5]. Various service-quality and behavioral factors could explain these decisions. The absence of sustainable transport alternatives and the lack of detailed travel cost information, especially the fuel and environmental costs, are two factors to name a few [6]. Public transport investments, as an alternative to private transport, generally require a variety of physical and monetary resources as well as strong political and public support. However, the lack of detailed travel cost information could be tackled by developing an advanced traveler general information system (ATGIS) that provides transport users with the fuel and environmental costs of their travel alternatives [7]. This travel information system costs less than many other transport policies, and it would not face political or public opposition as it only provides information [8]. A survey conducted for the United Kingdom’s Department for Transport found that transport users are still incapable of linking their personal transport activities to their respective impacts [9]. Other surveys conducted in the US, Canada, Mexico, Brazil, and Portugal [10] have also found that transport users do not understand their contributions to climate change. These findings support the idea of providing such a travel information system so that transport users could make informed travel decisions.
Several websites such as “CAA Driving Costs Calculator”, “Gasbuddy”, “Viamichelin”, “Fueleconomy”, and “routeRANK” (http://www.caa.ca/carcosts/; https://www.gasbuddy.com/TripCostCalculator; https://www.viamichelin.com/; https://www.fueleconomy.gov/trip/; https://www.routerank.com/en/) are indeed providing fuel and environmental information (such as fuel consumption and GHG emissions information) of travel options for user-specified vehicle makes and models [11]. However, the impact of such information on users’ travel decisions is yet to be determined [11].
Accordingly, animated by this research gap and by the increasing importance of informing people of their energy and environmental footprints, this research aims to examine the influence of offering such information on individuals’ travel decisions. For this purpose, the research team conducted a survey of residents of Montreal, Canada. Questions concerning perceptions of travel-related fuel and environmental costs were included in the survey to examine the level of awareness and the need for providing such information. The respondents also answered questions about their attitudes toward travel information systems and their preferred information and system design requirements. In addition, stated preference questions were asked to predict the influence of providing such information on people’s route and mode choices and their willingness to pay for such system.
The concept of providing transport users with travel information has long been examined. Many studies explored the influence of traffic information on transport users’ behavior, design preferences, and willingness to pay to receive the information. However, these studies were limited to the systems that provide conventional travel information such as travel time, navigation, and transit. Providing travel-related fuel and environmental information is yet to be examined and there is no study, to the best of the authors’ knowledge, that investigated the various aspects of providing such information all together.

1.1. Perception of Travel-Related Fuel and Environmental Costs

Rouhani and Gao [7] have found that transport users’ perceptions of their travel costs dictate the impact an ATGIS would have on system-wide travel time and fuel consumption. Hence, for the purpose of studying the feasibility of an ATGIS and its impacts on travel behavior, a comprehensive study should be conducted on users’ perception of the costs provided. Several papers studied people’s perception of some travel-related fuel and environmental information [12,13,14]. Turrentine and Kurani [12] tested US transport users’ knowledge of fuel expenditures through a survey and found that they generally do not have a sense of the amount paid over time or the costs incurred per trip. As for the perception of environmental costs, an online survey conducted in the greater Dublin area [13] asked respondents to provide their estimates of the CO2 emissions generated from a 10-km journey for different transport modes. The major findings of the study are that around 33% of the respondents were not able to answer such questions, and people overestimated the carbon emissions associated with buses, which may result in people disregarding this mode as a sustainable travel alternative [13]. In a similar study conducted in California, the respondents did not know the CO2 quantities they emitted [14]. With no proper knowledge, as seen in the literature, people would continue making unsustainable travel decisions [9,10].
This research extends the available literature by examining people’s perception of fuel consumption costs, health-related air pollution costs, and GHG social costs. Fuel consumption costs are the monetary measures of fuel consumed by cars, obtained by the multiplication of the fuel efficiency (liters of gasoline consumed per 100 km) with the gasoline price [15]. Air pollution damages human health and leads to a loss in productivity and social welfare [16]. These damages are given monetary measures and referred to as health-related air pollution costs. GHG social costs are monetary measures of the economic and social damages caused by climate change [17].

1.2. System Design Preferences

Travel information system design preferences include the type of information that transport users would like to have, and the way of receiving them. The ATGIS should provide the necessary information based upon end users’ information preferences and present them in a perceivable format (visual display, metrics, and so on) for them to have an influence on travel behavior [18]. In a case study conducted in Sydney, Australia, the users listed accident information as their major information requirement, followed by traffic conditions and alternative route information [19]. Another study conducted in 48 US states showed that the users value road and traffic information as the most important feature of travel information systems [20]. As for information metrics, Brazil, Caulfied, and Rieser-Schüssler [21] studied the effectiveness of different methods of presenting transport-related carbon emissions. They found that the users demanded receiving carbon emissions in simple numerical form (i.e., Kilograms) [21]. In terms of fuel consumption metrics, there is no study, to the best of the authors’ knowledge, that asked respondents about their preference.
While there is a handful of studies that explored users’ information preferences in a travel information system, there is no study that included fuel and environmental information as options to be provided. Hence, this study examines users’ demands of a travel information system which provides fuel and environmental information. The goal is to determine whether transport users would consider other important travel costs (other than travel time), would be willing to learn more about their travel footprints, and if so, what are the most preferred system design requirements from the perspective of its potential users.

1.3. Travel Information Systems’ Influence on Travel Behavior

Despite the significant contributions of transportation to climate change and air pollution problems [11], there is a worldwide paucity of studies exploring how the provision of fuel and environmental information influences transport users’ decisions [22]. Prior to reviewing such studies, we should note that travel time differs from fuel consumption and emissions costs. The fundamental reasons are that drivers do not perceive fuel consumption costs as out-of-pocket costs and emissions costs are not charged to users. Our focus in this paper is on fuel consumption and emissions costs.
Gaker, et al. [11] examined the extent to which travelers in California were willing to change their travel behavior to reduce CO2 emissions. They conducted three experiments on automobile ownership, the mode choice, and the route choice decisions. Using stated preference technique, they provided different hypothetical travel choice scenarios with varying CO2 levels. They found that the respondents were willing to change their transport behavior and bear an extra $0.33 (2011 United States Dollars (USD)) for every kilogram of CO2 alleviated [11]. In a similar study, Gaker, Zheng, and Walker [23] conducted a route choice experiment where they provided the respondents with trip-specific information of GHG emissions. The results showed that people were willing to change their routes and incur an extra $0.53 (2010 USD) in terms of travel time cost to reduce a kilogram of CO2 emitted [23]. Chatterton et al. [9] explored the influence of providing carbon emissions information on the people’s transport behavior in the UK. The study found that although transport users became more aware of the necessity to reduce carbon emissions, they were not willing to change their travel behavior. The major reason to resist a change in travel behavior was found to be the inability to perceive the direct effects of climate change [9]. In addition, climate change is geographically and temporally disconnected from its anthropogenic sources, which makes it difficult for people to associate their personal transport decisions with climate change and its consequences [9].
Rouhani and Zarei [24] investigated the effect of providing gasoline consumption information on travelers’ route choice behavior to determine if it is a viable alternative to congestion pricing. They found that providing such information can induce a change in the route choice behavior [24]. This change could save on the transportation system’s total travel time by up to 2.8% and decrease fuel consumption by up to 2% [24].
While the literature examine the changes in transport users’ behavior after receiving GHG or fuel consumption information, there is no study, to the best of the authors’ knowledge, which has measured the effects of providing the criteria air pollutant information (and their health-related costs) on travel decisions. Rouhani and Zarei [24] recognized this research gap when they recommended that transport users should be informed of other variable costs of their travel decisions, such as emissions costs. Thus, the authors explore the impact of providing such information in addition to GHG social costs and fuel consumption costs on users’ behavior in this research.

1.4. Willingness to Pay for the Information

Many researchers examined the willingness-to-pay concept for travel information systems [25,26]. Walker and Ben Akiva [25] found that people were willing to pay up to $0.5 per call or up to $5 per month (1996 USD) for a phone-based travel information system. Similarly, Marans and Yoakum [26] asked the respondents about their willingness-to-pay for information on incidents and alternative routes. A total of 50% of the respondents were willing to allocate a $10 per month fee for such a system, and 5% of the respondents were willing to pay up to $40 per month (1991 USD) [26]. Another study [27], conducted on the residents of the greater Boston area, found that 41% of the respondents were willing to pay a $2.5 monthly subscription fee, 27% of the respondents were willing to pay a $5 monthly fee, and 14% were willing to pay a $10 monthly fee (1997 USD) for an information system that would provide real-time traffic and transit information.
Politis et al. [28] investigated transport users’ willingness to pay for a real-time passenger information system in Thessaloniki, Greece. The system provides information on bus arrival and departure times, real-time location of buses, routes, bus fares, delays, and public transport transfers. The authors found that male respondents value the information provided at $0.14/trip (2010 USD) on average while female respondents were willing to pay more, or $0.17/trip (2010 USD) on average [28]. A study conducted in the Twin Cities, Minnesota [29] found that 35% of the respondents were willing to pay for travel time information, out of which 29% were willing to pay $1 to $5, and 6% were willing to pay $6 to $10 per trip (2008 USD). The average willingness to pay was $1.4/trip [29]. Another study conducted in the city of Rotterdam, the Netherlands [30] found that the respondents were willing to pay up to 25.5 cents/min (2006 USD) for calling a public transit information phone service that provides real time information, alternative route navigation, and information on how and where to buy tickets.
Although the mentioned studies did show that people value traffic information and are willing to pay to get reliable information, they only determined people’s willingness-to-pay for conventional travel information systems providing information on navigation, real-time traffic, and transit. However, as we intend to explore the effect of providing travel-related fuel and environmental information on users, we need to determine users’ willingness-to-pay for such information as there will be a cost to develop and operate the information system.

2. Materials and Methods

As part of a broad study aiming to develop an ATGIS, the authors conducted a survey to assess the influence, if any, that this tool would have on travelers’ behavior. The survey was administered both over the phone and through in-person interviews. Two hundred and thirty responses (from phone and in-person interviews) were obtained for the perceptions of fuel and environmental costs question, and one hundred and fifty responses for the system design preferences, information influence, and willingness-to-pay questions. As expected, in-person interviews had a much higher response rate (85%) compared to the phone survey (8%). Telephone respondents were selected randomly using the area codes of the greater Montreal area, while in-person interviews were conducted in distinct locations such as major parks, universities, and metro stations. The respondents were Montreal residents and at least 18 years old.
To assess people’s perception of travel-related costs, the respondents were first asked to provide monetary estimates of the fuel consumptions costs, GHG social costs, and health-related air pollution costs of their most frequent trips using all the available travel modes (car, metro, and bus) to undertake this trip. These estimates were then compared to the actual values, calculated for a car, the metro, and the bus in Montreal. This comparison revealed respondents’ knowledge/awareness about the costs of the available modes, which could influence the potential impact of ATGIS on travel behavior [7].
In addition, the respondents were asked about their weekly frequency of consulting several travel information tools (for instance, interactive maps on phones, or computers). The average weekly usage of these tools indicated the respondents’ preferred means of receiving travel information. Furthermore, a stated preference question sought to determine people’s information preference. The respondents were asked to rank the importance level of several travel information types (for instance, total private costs, fuel costs and so on) on a five-point Likert scale. The authors calculated the average of the ranks given for all information types to find the respondents’ preferred information. The respondents were further asked about their metric preferences for the travel-related fuel and environmental costs (for instance, liter/trip, or $/trip for fuel consumption costs, and grams/trip, or $/trip for emissions costs). The results of these questions provided invaluable insights into designing the travel information system.
Another stated preference question was asked to examine the most influential factors in transports users’ route and mode choices. The respondents gave a rank for several travel attributes (for instance, travel time, travel purpose, and so on), on a five-point Likert scale, based on the impact these travel attributes have on their route and mode choices. The authors computed the average ranks for every travel attribute to determine the most influential factors.
The respondents, who showed interest in using the ATGIS were later asked if they were willing to pay to obtain the information where they reported the maximum monthly subscription fees. All monetary values reported in this research are 2017 inflation-adjusted and are in Canadian dollars (CAD). Conversions to US dollars, using the 2017 average annual conversion rate, can be seen in parentheses.

3. Results and Discussion

This section reports the results of the perception of Montreal transport users with respect to their travel-related fuel and environmental costs and compares their estimates with actual estimates. Then, it discusses the ATGIS design preferences from the potential users’ perspective. Consequently, it examines the influence and importance of such information on users’ behavior. Table 1 provides a summary of the socio-demographic characteristics of the survey respondents.

3.1. Perception of Travel-Related Fuel and Environmental Costs

The survey included questions about the respondents’ perceived fuel and environmental costs of their most frequent trip and their preferred mode of transport. In terms of fuel consumption costs, 76% of the respondents who drove their cars for their most frequent trip were not able to estimate their fuel consumption costs. Similarly, significant shares of the sample (82%, 85%, and 88%) could not estimate the GHG social costs of using a car, the metro, or the bus, respectively. Estimating the health-related air pollution costs appears even more difficult, as 85%, 86%, and 88% of the respondents who used a car, the metro, or the bus, respectively, for their trips were not able to estimate these costs. These findings indicate that the respondents are generally unaware of their energy and environmental travel footprints, and that an information system is needed so that people can make informed decisions.
Car drivers who could provide estimates of these costs reported an average fuel cost of $0.54/km ($0.44 US/km). This figure was obtained by dividing their fuel cost estimates by the lengths of their most frequent trips (in kilometers). Then, the perceived cost was compared with the actual cost. An average passenger car, accounting for the existing vehicle make and models in Montreal, would consume gasoline at an average rate of 12.8 liters/100 km [31]. (Fuel consumption of all vehicle makes and models in Canada were obtained from reference [31]. Adding the vehicle registration mix (weights) in Montreal to the data, we were able to estimate the average fuel consumption of a representative vehicle in circulation in Montreal.) Knowing that the average price of one liter of regular gasoline in Montreal in 2017 was $1.16 ($0.94 US) [32], the actual average fuel cost was calculated as follows:
Fuel cost = 0.128 L/km × $1.16/L = $0.148/km ($0.12 US/km),
The respondents clearly overestimated the fuel cost ($0.54/km; $0.44 US/km) compared to the actual average of $0.148/km ($0.12 US/km). This result has an important policy implication. Other factors being equal, transport users in Montreal could increase their car use (especially for leisure purposes) if they were informed about real fuel costs, which are significantly lower than their perceived fuel costs. In this regard, an ATGIS could lead to higher travel demand, which in turn could increase traffic congestion and perform against the sustainable transportation goals of reducing congestion.
Calculating the average GHG social cost estimates for all three modes, indicated that the respondents provided the highest estimate for the metro ($0.42/km; $0.34 US/km), followed by passenger cars ($0.35/km; $0.28 US/km), and then the bus ($0.25/km; $0.20 US/km). Similarly, the respondents provided the highest estimate for the metro in terms of the health-related cost ($0.43/km; $0.35 US/km), followed by passenger cars ($0.31/km; $0.25 US/km), and then the bus ($0.26/km; $0.21 US/km). The respondents, surprisingly, provided higher estimates of GHG social costs and health-related costs for public transport (metro) compared to cars. This is similar to the results of a survey conducted in the greater Dublin area [13], where respondents gave higher estimates of GHG emissions to buses than to passenger cars. Although in the survey, respondents were clearly asked to provide per-passenger emissions, a possible explanation for this overestimation is that the respondents might have been confused about the vehicular emissions of the public transport modes as opposed to the per-passenger emissions.
A comparison between those estimates and the actual GHG costs is needed for a better understanding of users’ perceptions. The average passenger car, representing the vehicle age distribution of cars in Montreal, emits between 180 and 650 g of CO2 equivalent (CO2eq) per kilometer [33]. Environment and Climate Change Canada estimates the social cost of carbon (SCC) at $41/ton ($33 US/ton) [34]. Using an average car load factor of 1.6 [35], this would result in GHG social cost between $0.005/km ($0.004 US/km) and $0.02/km ($0.016 US/km). The Société de transport de Montréal, the public transport agency operating the buses and metro systems in Montreal, reports that each bus emits approximately 1600 g CO2eq/km while accommodating 40 passengers on average in the morning [33]. This results in 40 g CO2eq/km per passenger. Therefore, using Environment and Climate Change Canada’s SCC of $41/tonCO2eq ($33 US/ton), this would result in an average GHG cost of $0.002/km per passenger ($0.0016 US/km per passenger) (one tenth of personal cars). As for the metro, it is operated by hydroelectric sources and hence is reported to emit close to 0 g CO2eq/km per passenger [33] (we are only considering running and evaporative emissions, not a life cycle assessment of the energy sources), which results in near $0/km per passenger of GHG costs.
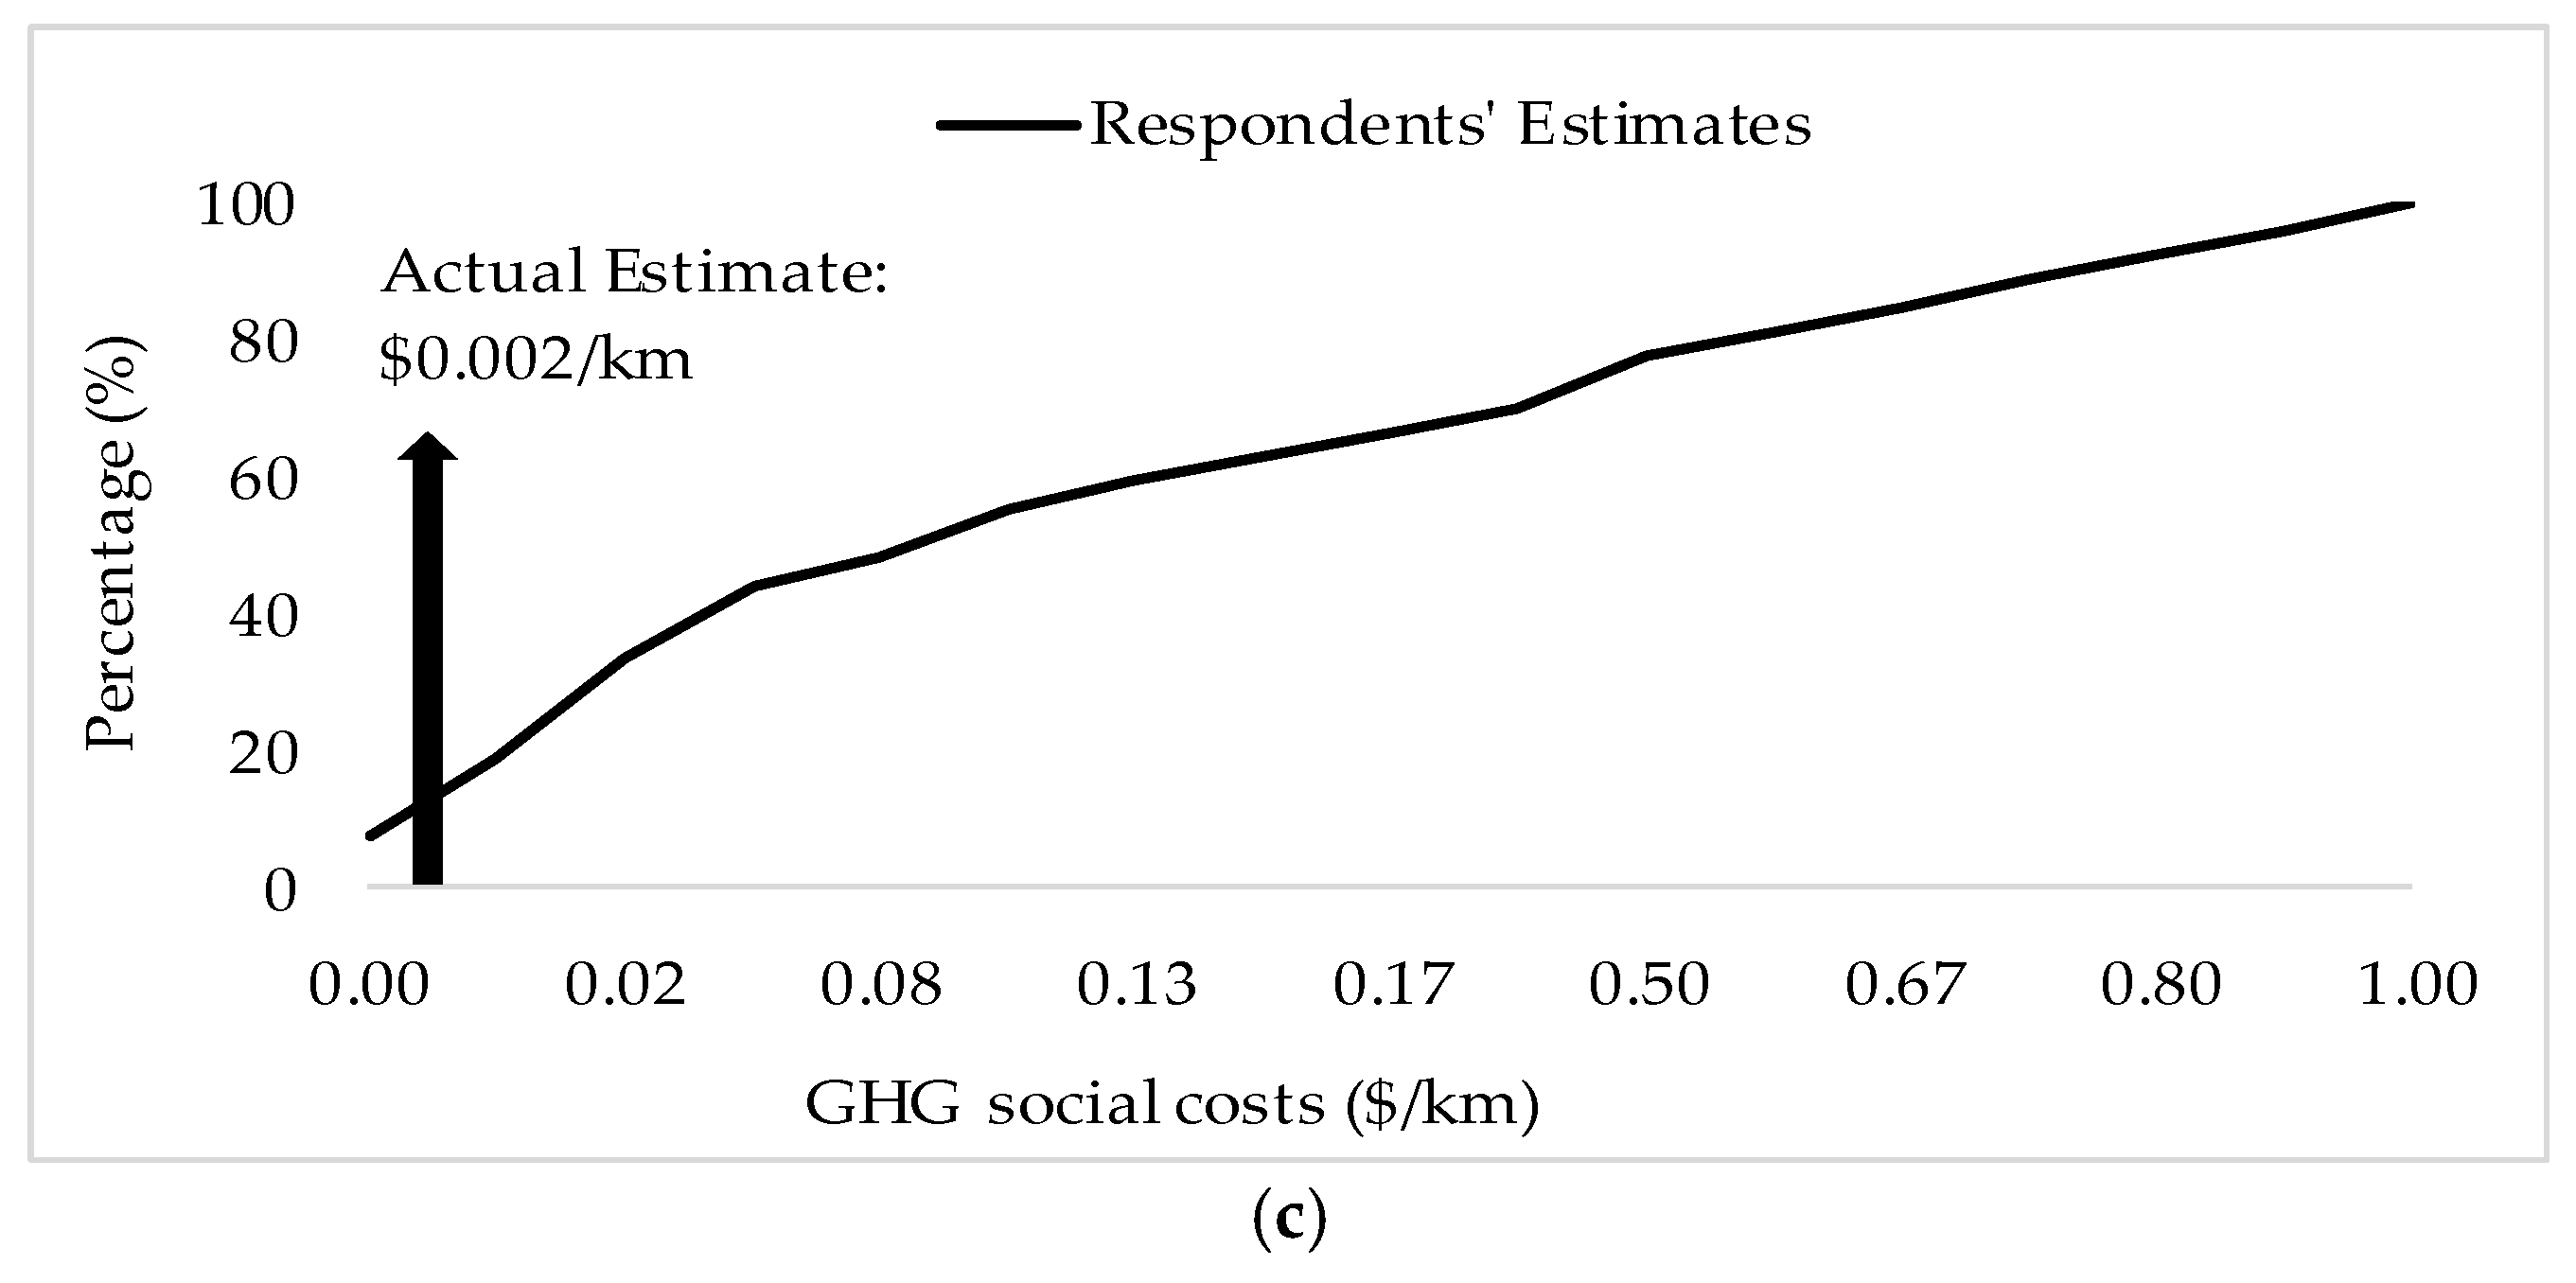
Figure 1a–c presents the distribution of respondents’ estimates of GHG social costs for all three modes and the respective actual estimates. Figure 1a shows that only 20% of the respondents accurately estimated the GHG social cost for passenger cars, 70% of the respondents overestimated this cost, and 10% underestimated it. Figure 1b shows that only 18% of the respondents estimated the GHG social costs for the metro accurately, and the remaining 82% overestimated it. Figure 1c shows that only 2% of the respondents estimated this cost for the bus accurately, 63% overestimated it and 35% underestimated it. In fact, respondents are not aware of their personal transport emissions when choosing among different modes, which potentially leads to higher shares for driving (with relatively lower perceived GHG costs). However, the actual data for Montreal shows that cars are the largest emitters, followed by the bus, and then the metro. Providing this information to transport users would correct their perceptions and could trigger a shift in demand toward more sustainable public transport modes.
As for actual estimates of health-related costs, Table 2 presents the emission rates of several criteria air pollutants for an average passenger car as per the Environmental Protection Agency (EPA) [36], and their associated health costs [37]. The actual health-related costs were obtained by multiplying the emission rate with the unit emission cost of each criteria pollutant. The total health cost due to driving passenger cars was found to be $0.011/km ($0.009 US/km). Although the respondents overestimated this cost, the health cost is still a substantial figure (around 10% of fuel costs). While no similar emissions factors of the bus and the metro are found in Montreal, the authors assume that these public transport modes would yield lower health costs than those of passenger cars, as estimated earlier for the GHG social costs. Hence, providing a system that would be able to accurately calculate these emissions costs might evoke more sustainable transport decisions.
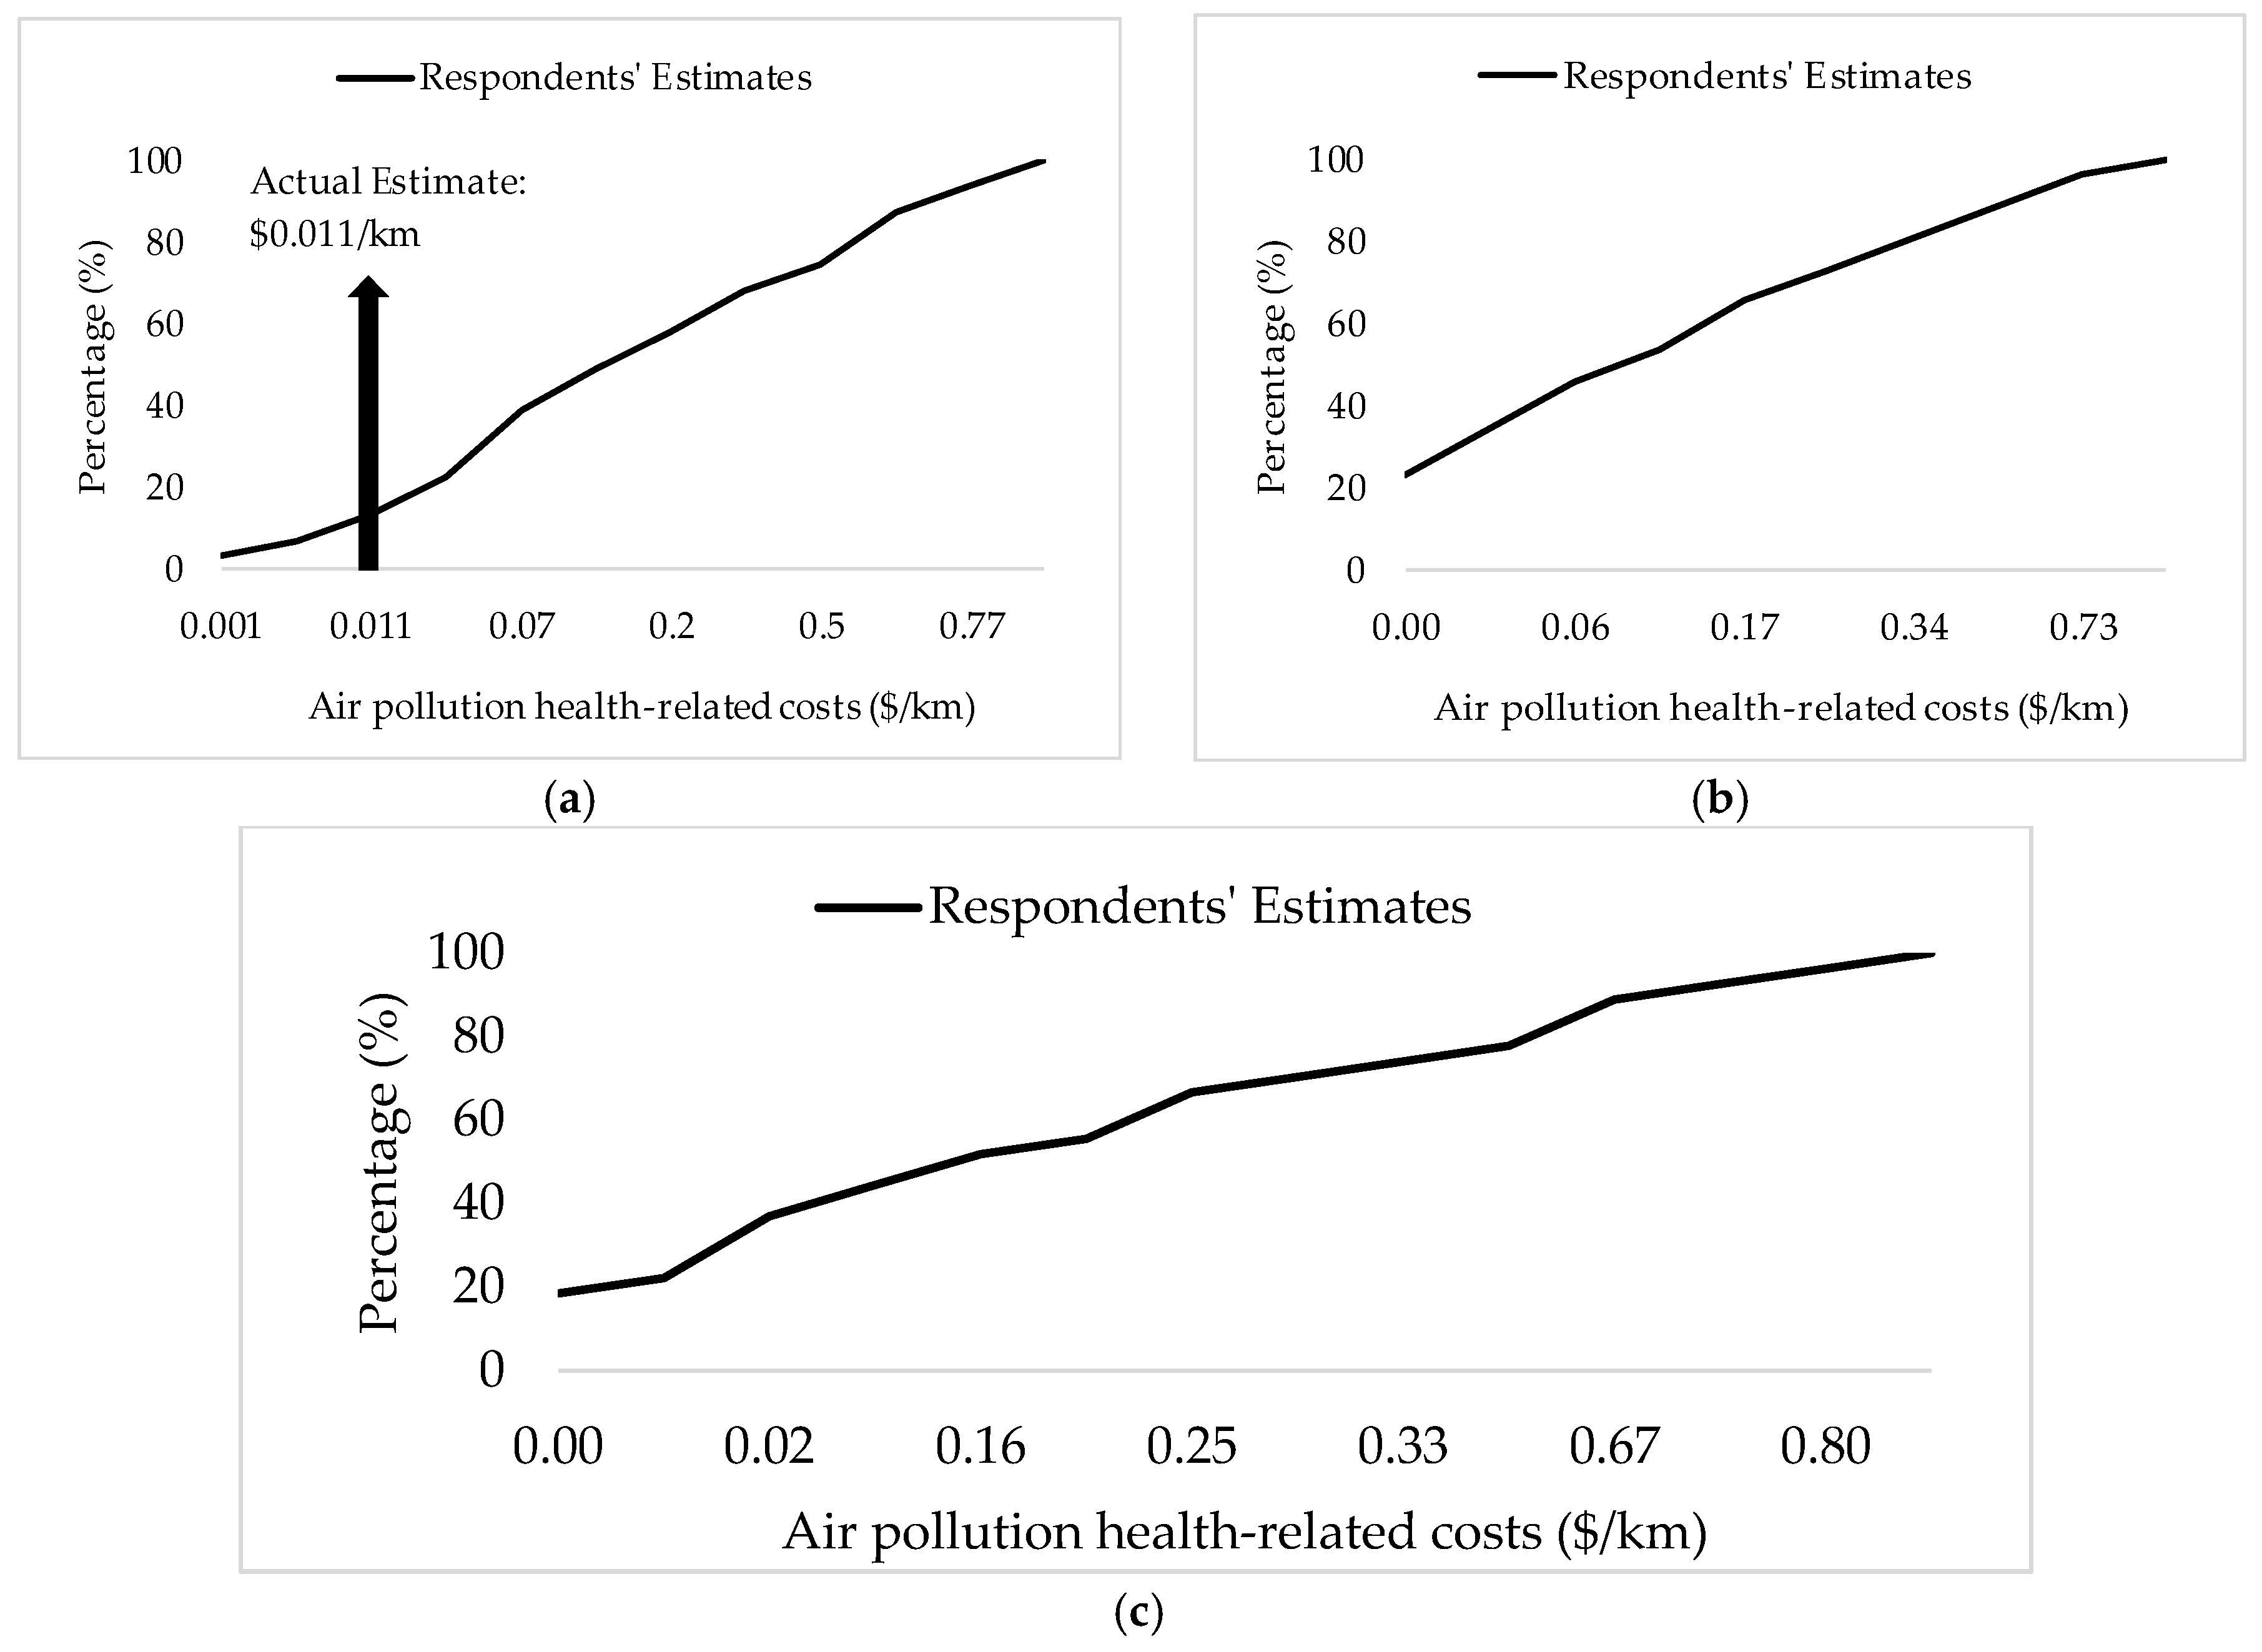
Figure 2a–c presents the distribution of respondents’ estimates of air pollution health-related costs for all three modes with the actual estimate of passenger cars. Figure 2a shows that only 3% of the respondents accurately estimated the GHG social cost for passenger cars, 87% of the respondents overestimated this cost, and 10% underestimated it. No actual estimates were calculated for Figure 2b,c, but we assume that the actual estimates for the metro and the bus (per passenger) should be lower than that for passenger cars ($0.011/km), similar to the GHG social cost estimated earlier. Hence, around 80% would have overestimated this cost for the metro and the bus.

3.2. System Design Preferences

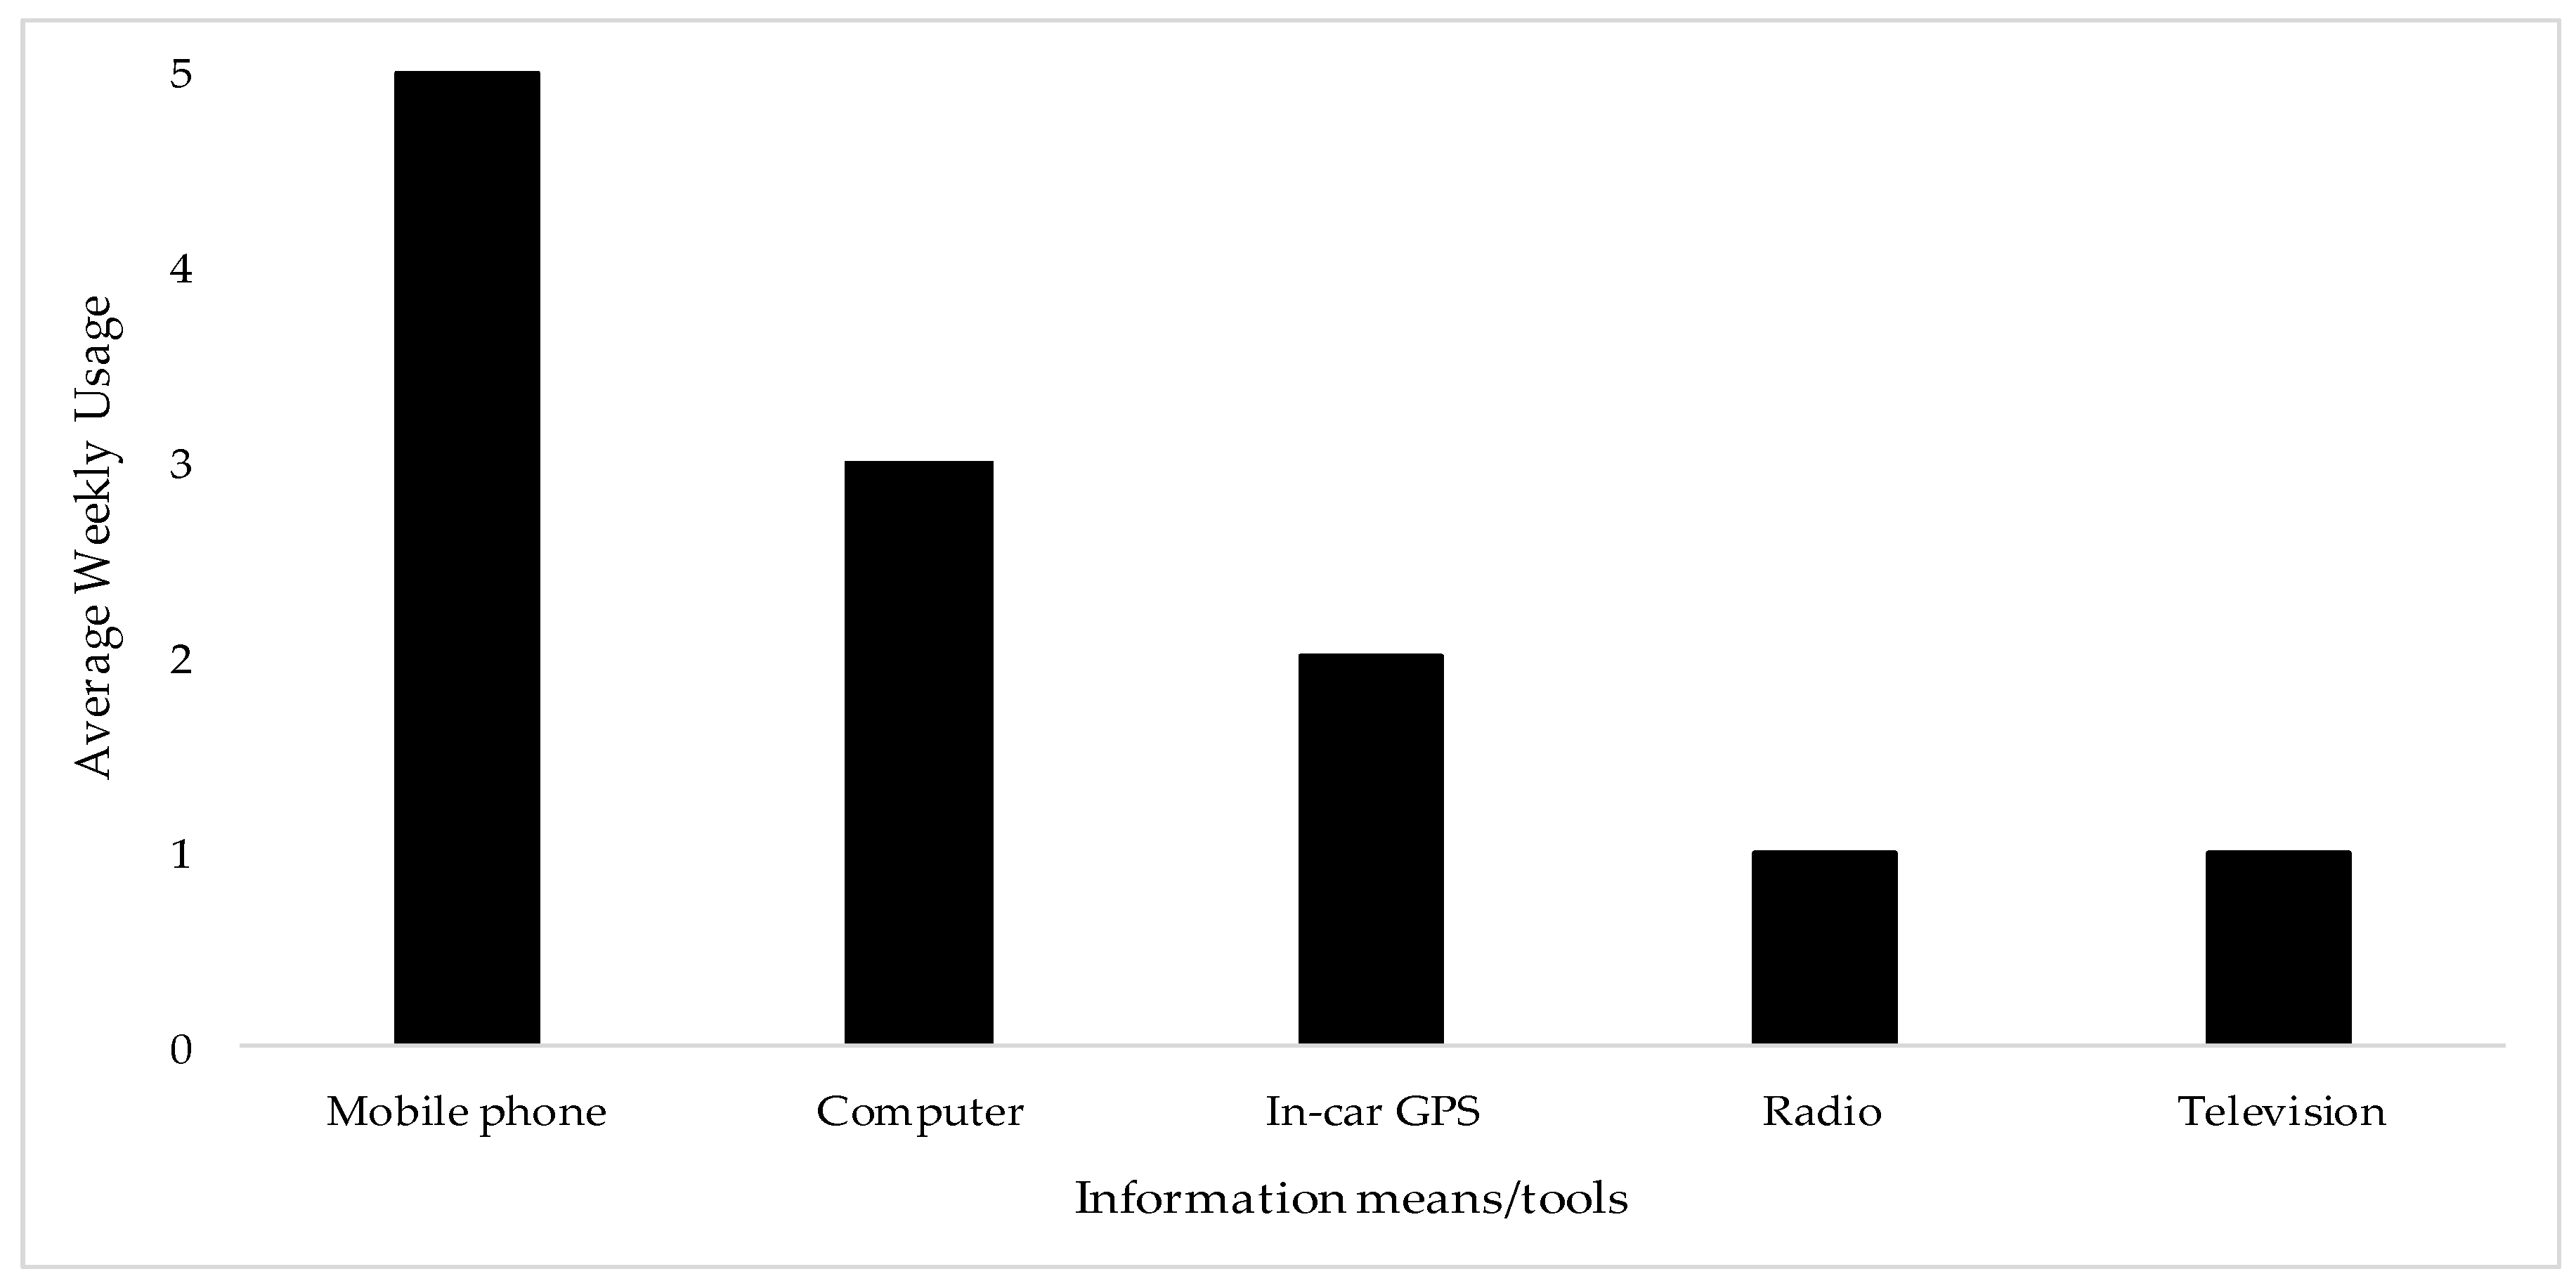
Figure 3 displays the respondents’ weekly usage of travel information through different tools. The respondents mainly rely on interactive maps on their mobile phones. This is followed by interactive maps on computers, and in-car GPS. This result is expected as travel information systems on mobile phones are easily accessible anywhere and anytime. In addition, it shows that a mobile application could be the most preferred/used tool to provide the fuel and environmental information. Okazaki and Hirose [38] assert this point when they examined the media choice when searching for travel information in Japan. They found that searches for travel information through mobile phones exceed that via computers and radios.
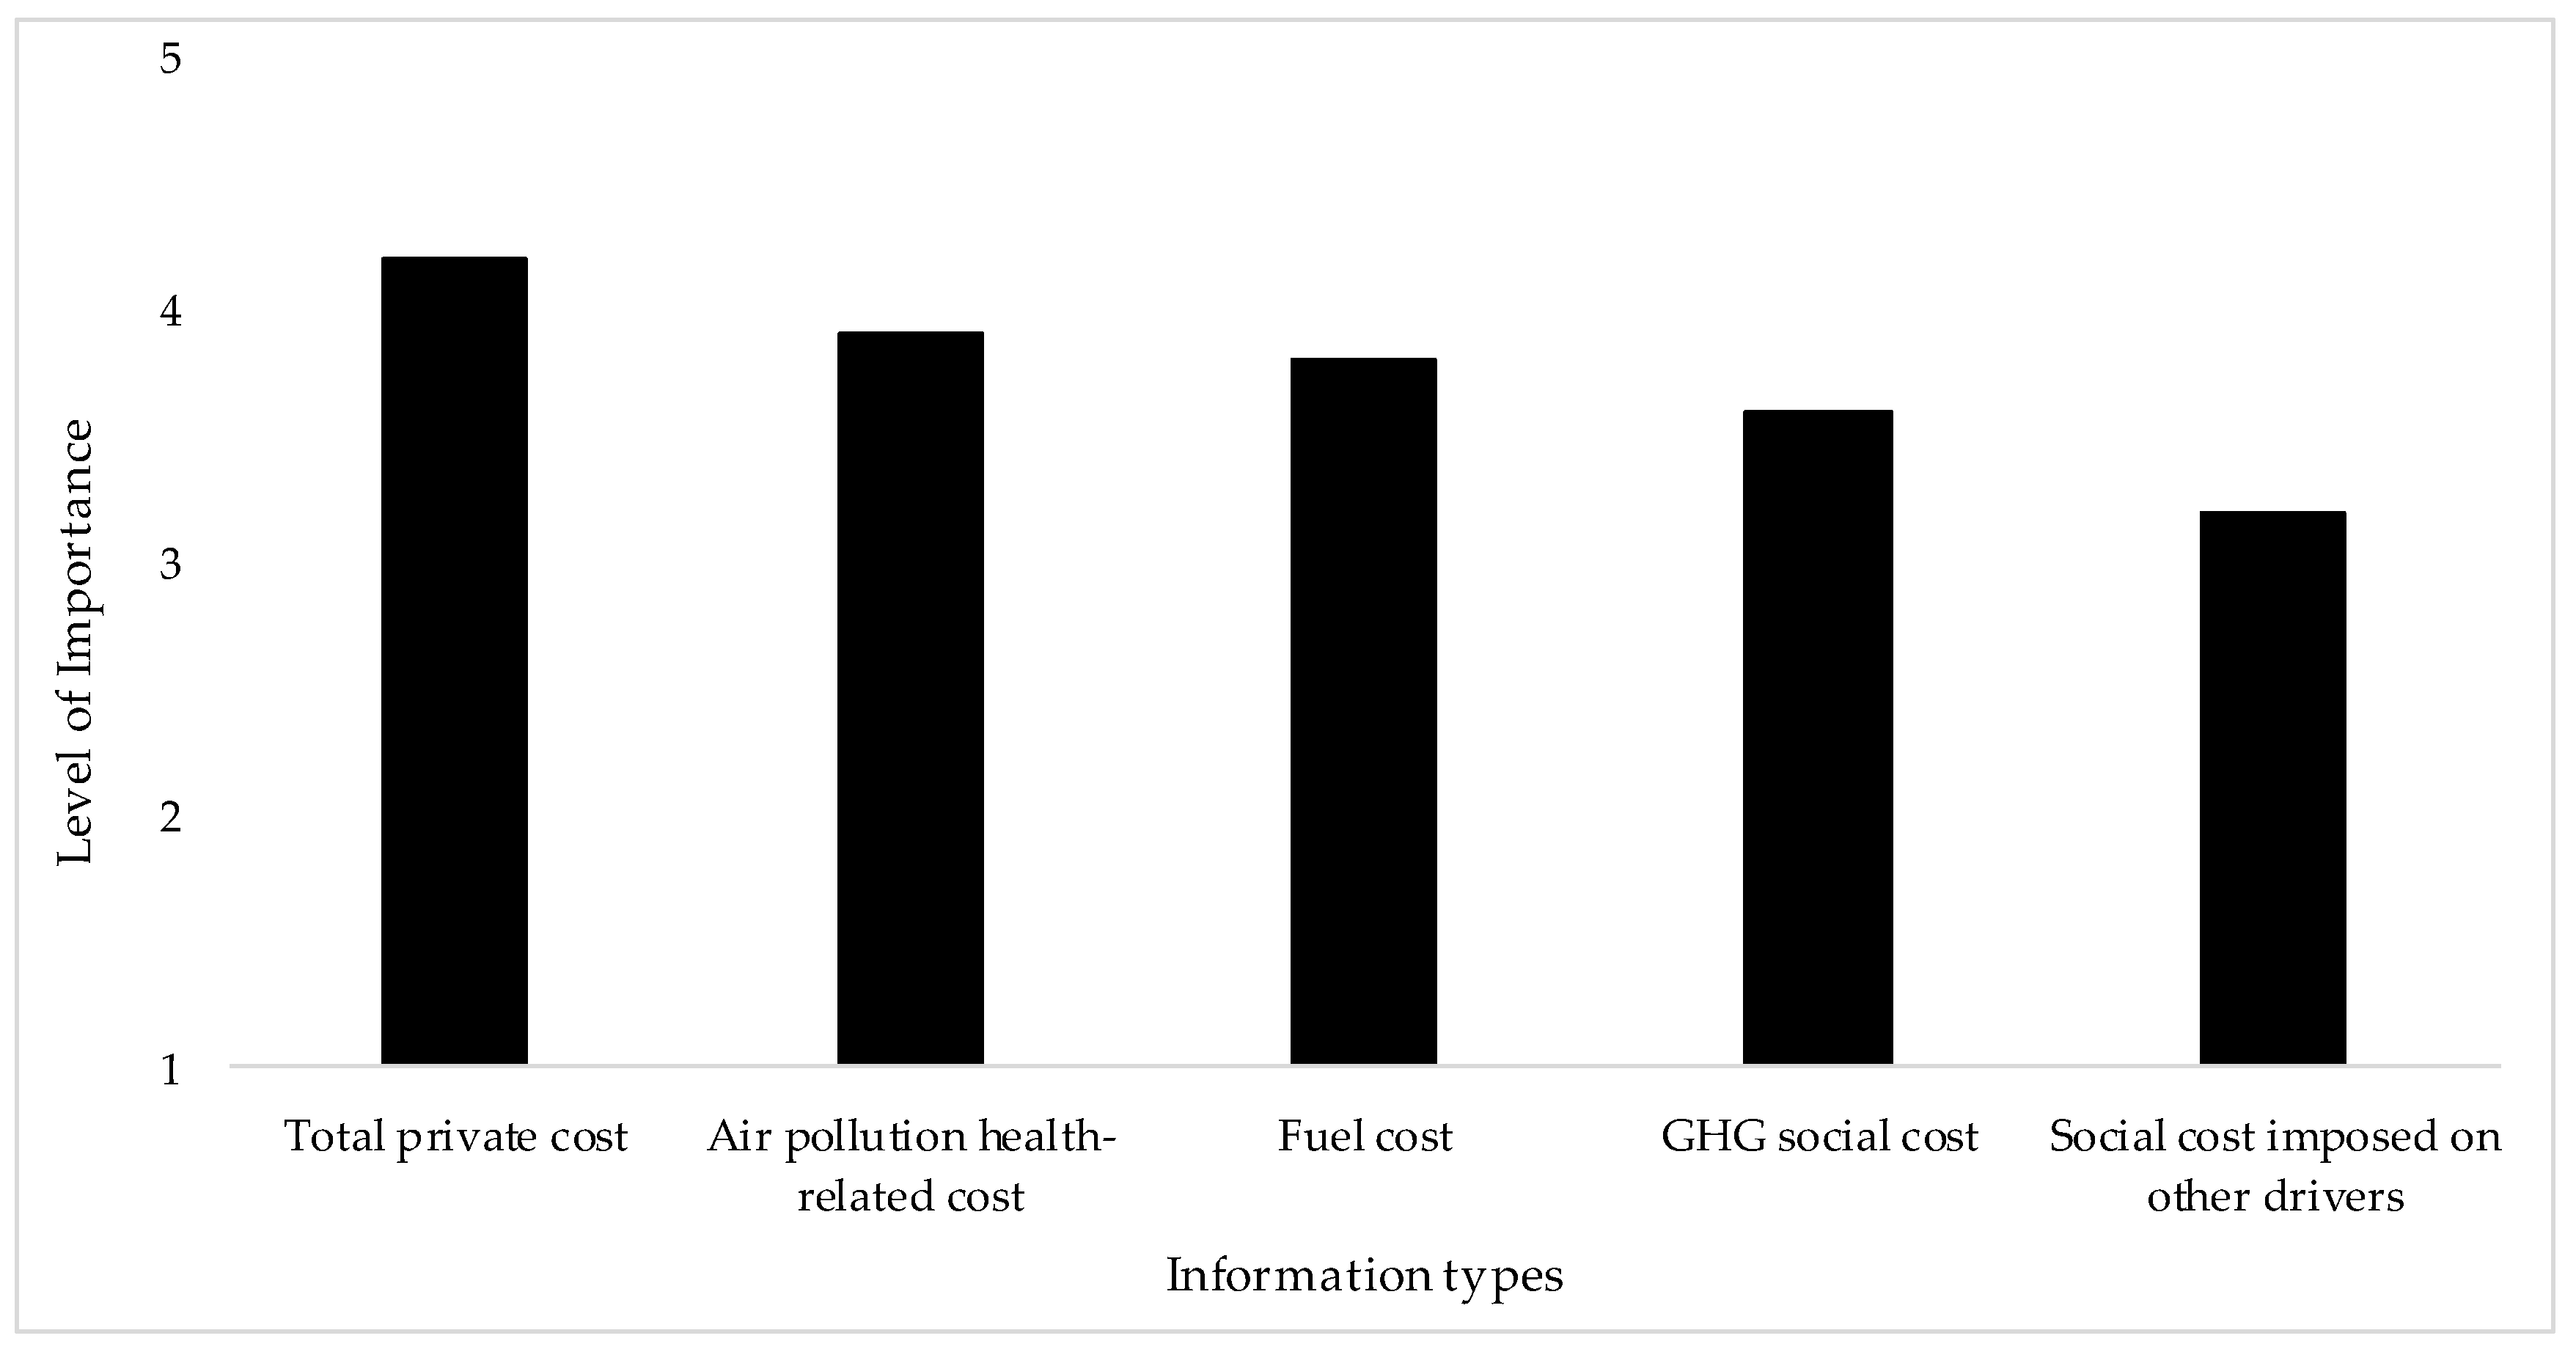
The survey also sought to determine the respondents’ preferred type of travel information. As shown in Figure 4, the respondents preferred to receive information about their total private travel costs (an average of 4.2 on a five-point Likert scale), including travel time costs, fuel costs, and emissions cost. This is followed by health-related air pollution costs with an average of 3.9 and then fuel costs with an average of 3.8. The respondents ranked health-related costs above fuel consumption information, which could be attributed to the direct linkage between the health costs of air pollution and their own benefits/costs. Therefore, the respondents would like to know these costs as they are directly related to their own well-being. However, since GHG social costs are imposed on the society not individuals, the transport users did not perceive them as their own costs. As a result, GHG costs were the least preferred information to the respondents.
Although the literature examines traveler’s travel information preferences, it does not touch on the fuel and environmental features that could be provided through a travel information system. The literature finds that data on travel time and delays, accidents and location, alternative routes and navigation are the most valuable for travelers [39,40,41].
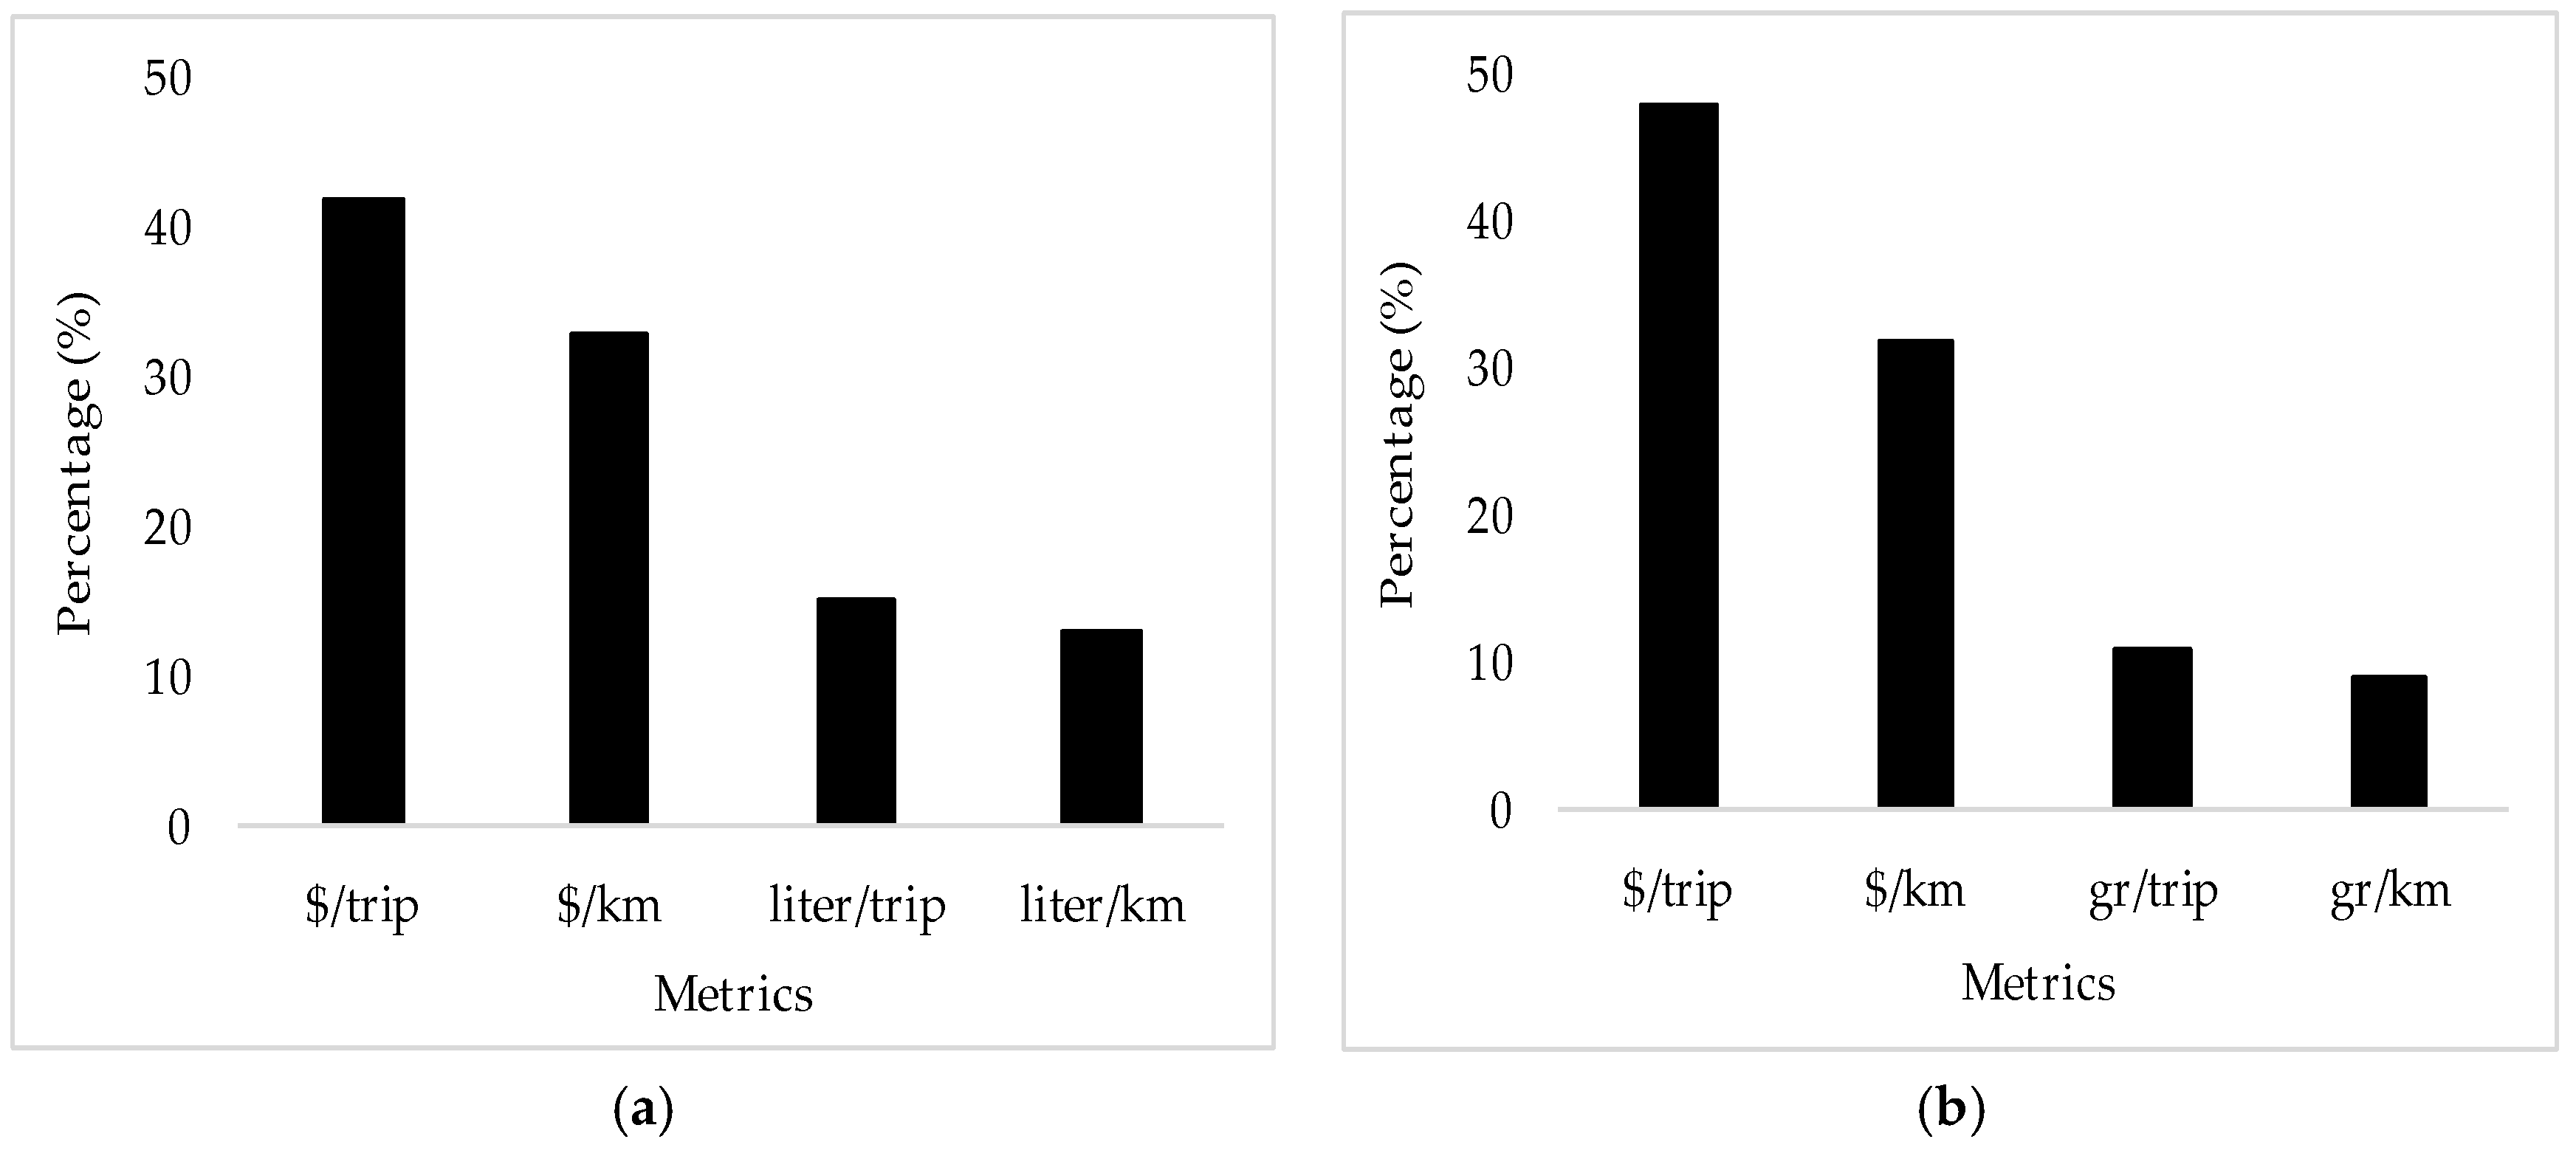
This research also examined the information metrics (units) to be provided to the users. Figure 5a shows that most of the respondents (42%) preferred having fuel consumption costs in $/trip, followed by $/km (33%). The respondents easily perceived such monetary units as they related them to the cost paid at gas stations.
Figure 5b shows that almost half of the respondents preferred receiving GHG social costs and health-related costs in $/trip. This is followed by $/km which was preferred by 32% of the respondents. In addition, 20% of the respondents wished to receive such costs in terms of grams of emissions/km. Similar to the fuel consumption metrics, the respondents preferred monetary metrics which were easy to perceive. They also chose per-trip metrics over per-km metrics as the per-trip metrics provides them with their final trip cost without the need to carry out any calculations. There are no studies to the best of our knowledge that asked travelers about their preferred travel-related fuel and environmental metrics. However, numerous studies [42,43,44] tend to monetize the health and environmental impacts of transportation to help transport analysts, decision makers, and transport users evaluate different aspects of their decisions.

3.3. Travel Information Systems’ Influence on Travel Behavior

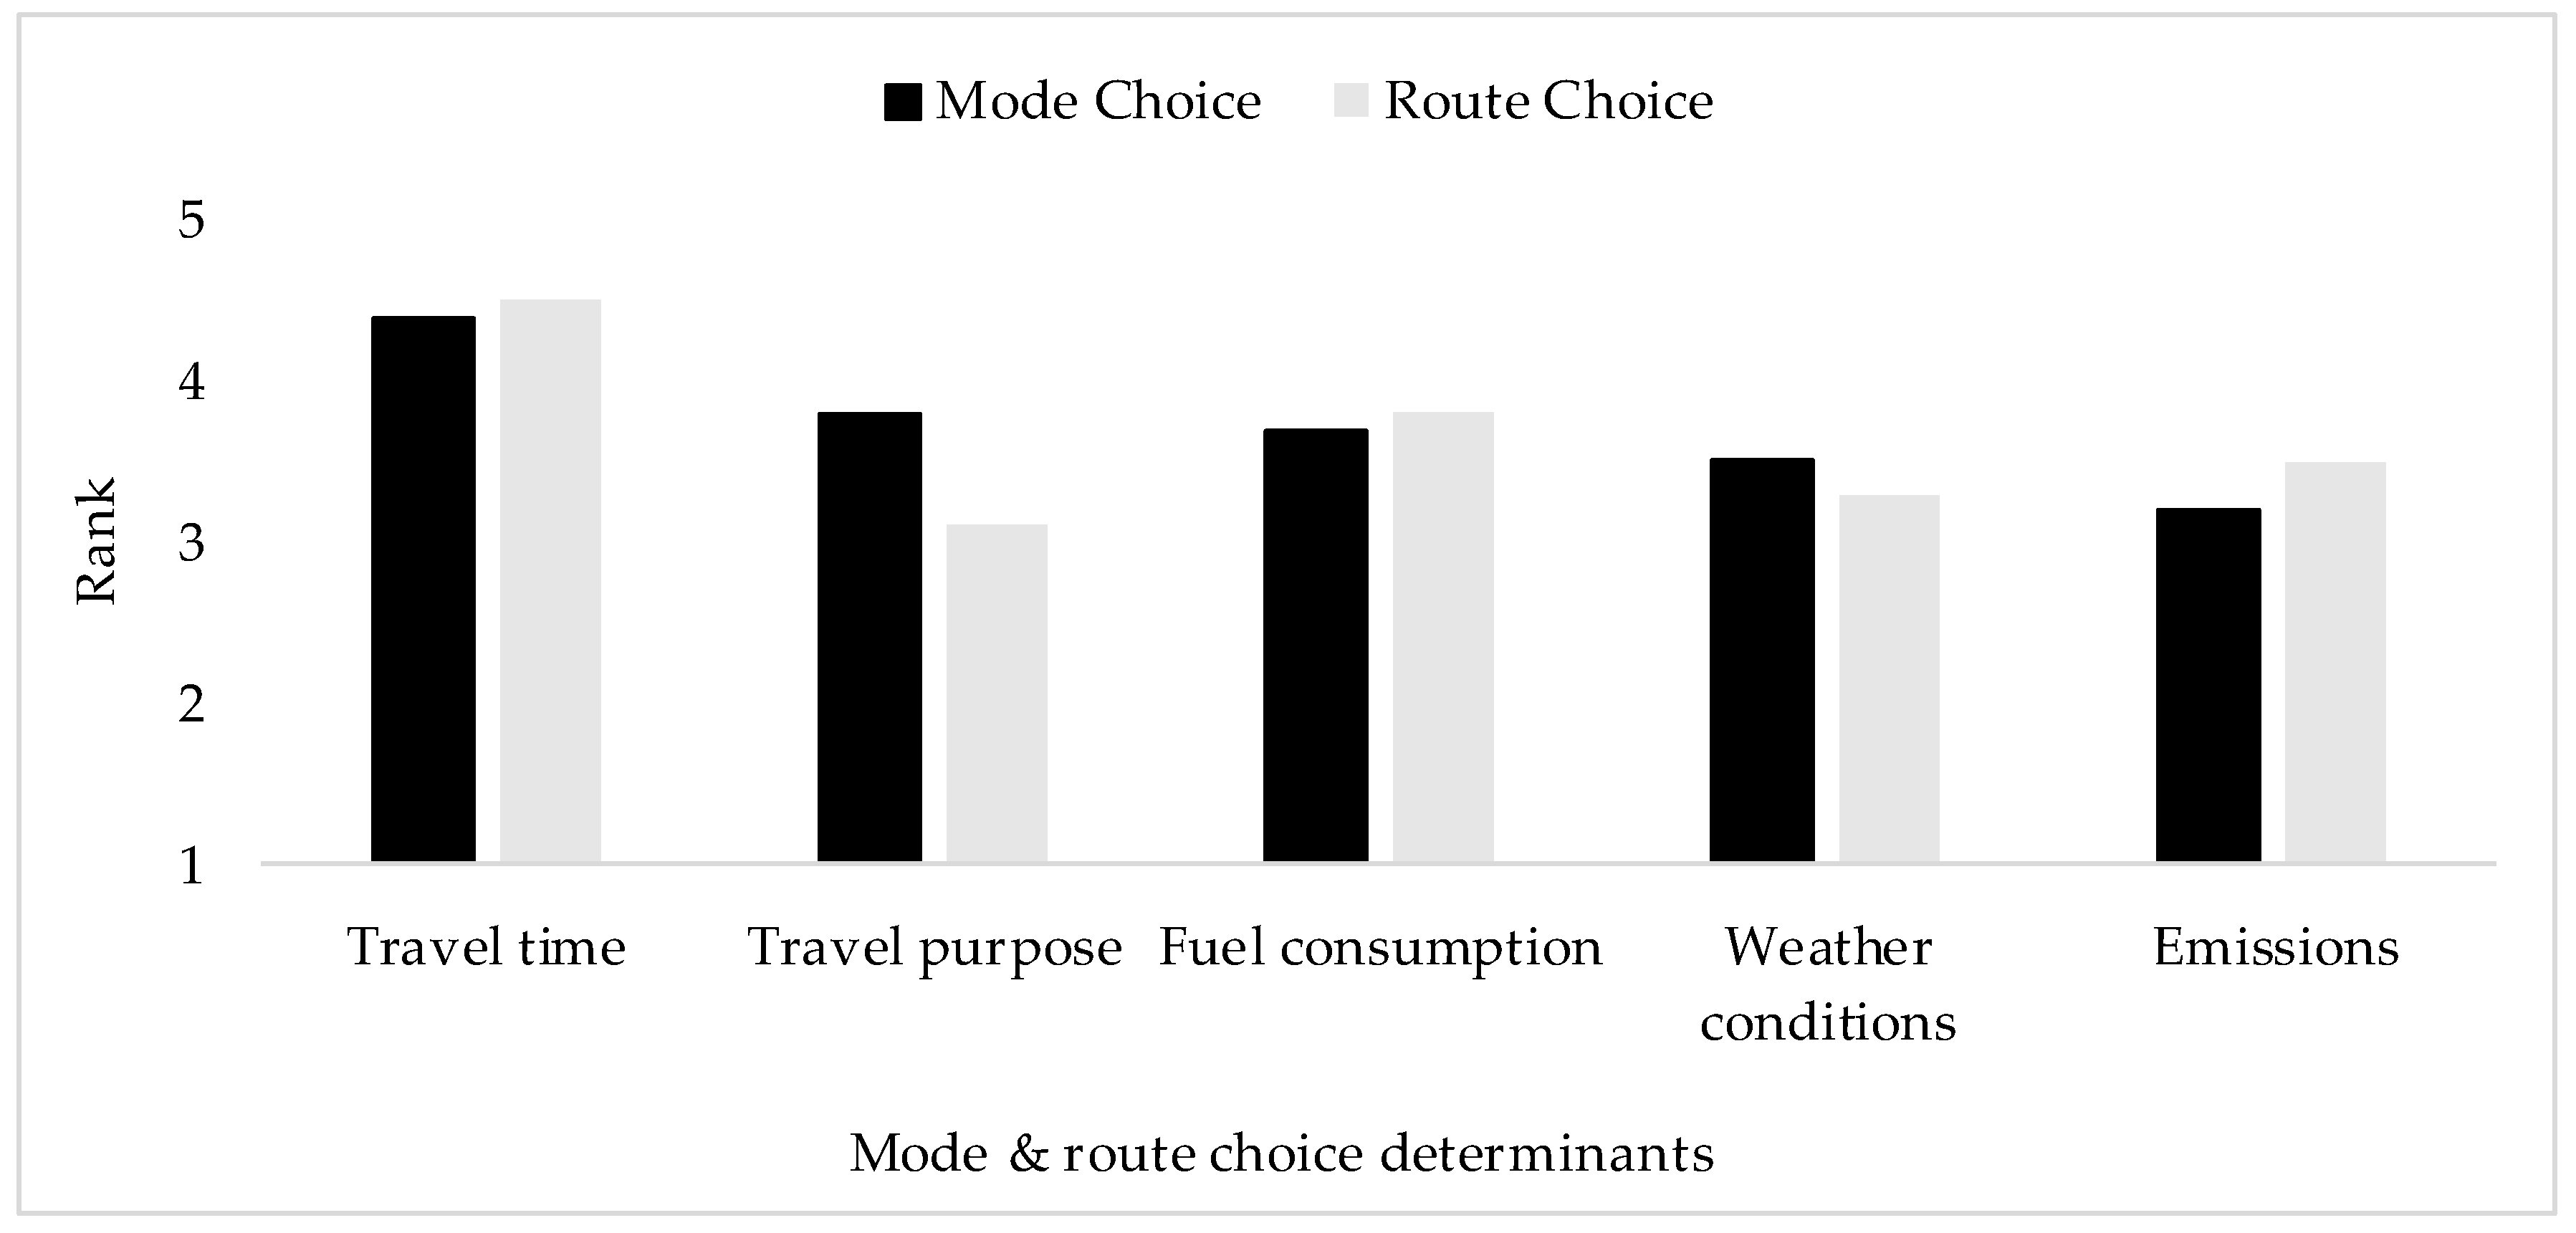
This survey also examined the travel choice behavior and how transport users would choose their routes and modes. Figure 6 shows the respondents’ average rank of the influence that different travel attributes would have on their route and mode choices. For both, as expected, travel time was the dominant attribute. This is supported by other studies that also found that travel time is the major attribute in route and mode choice [29,45]. For the mode choice, travel purpose was ranked second, followed by fuel consumption, weather conditions, and emissions information. For the route choice, fuel consumption came second, followed by emissions, weather conditions, and travel purpose information. Therefore, fuel consumption and emissions information considerably influence respondents’ travel decisions, especially for route choice, as these attributes were the second and the third most influential factors, respectively. This finding shows that the respondents would acknowledge such information and would consider them when taking their travel decisions. A possible explanation for the fuel and environmental information being more important for route choices rather than mode choices is that mode choices are usually affected by several factors such as car ownership, travel purpose, or convenience level and are less elastic than route choices [46]. There are no studies, to the best of our knowledge, that we can benchmark our results against, as the literature focuses only on the influence of travel information systems that provide travel time, alternative route, and incident information [22].

3.4. Willingness-to-Pay for the Information

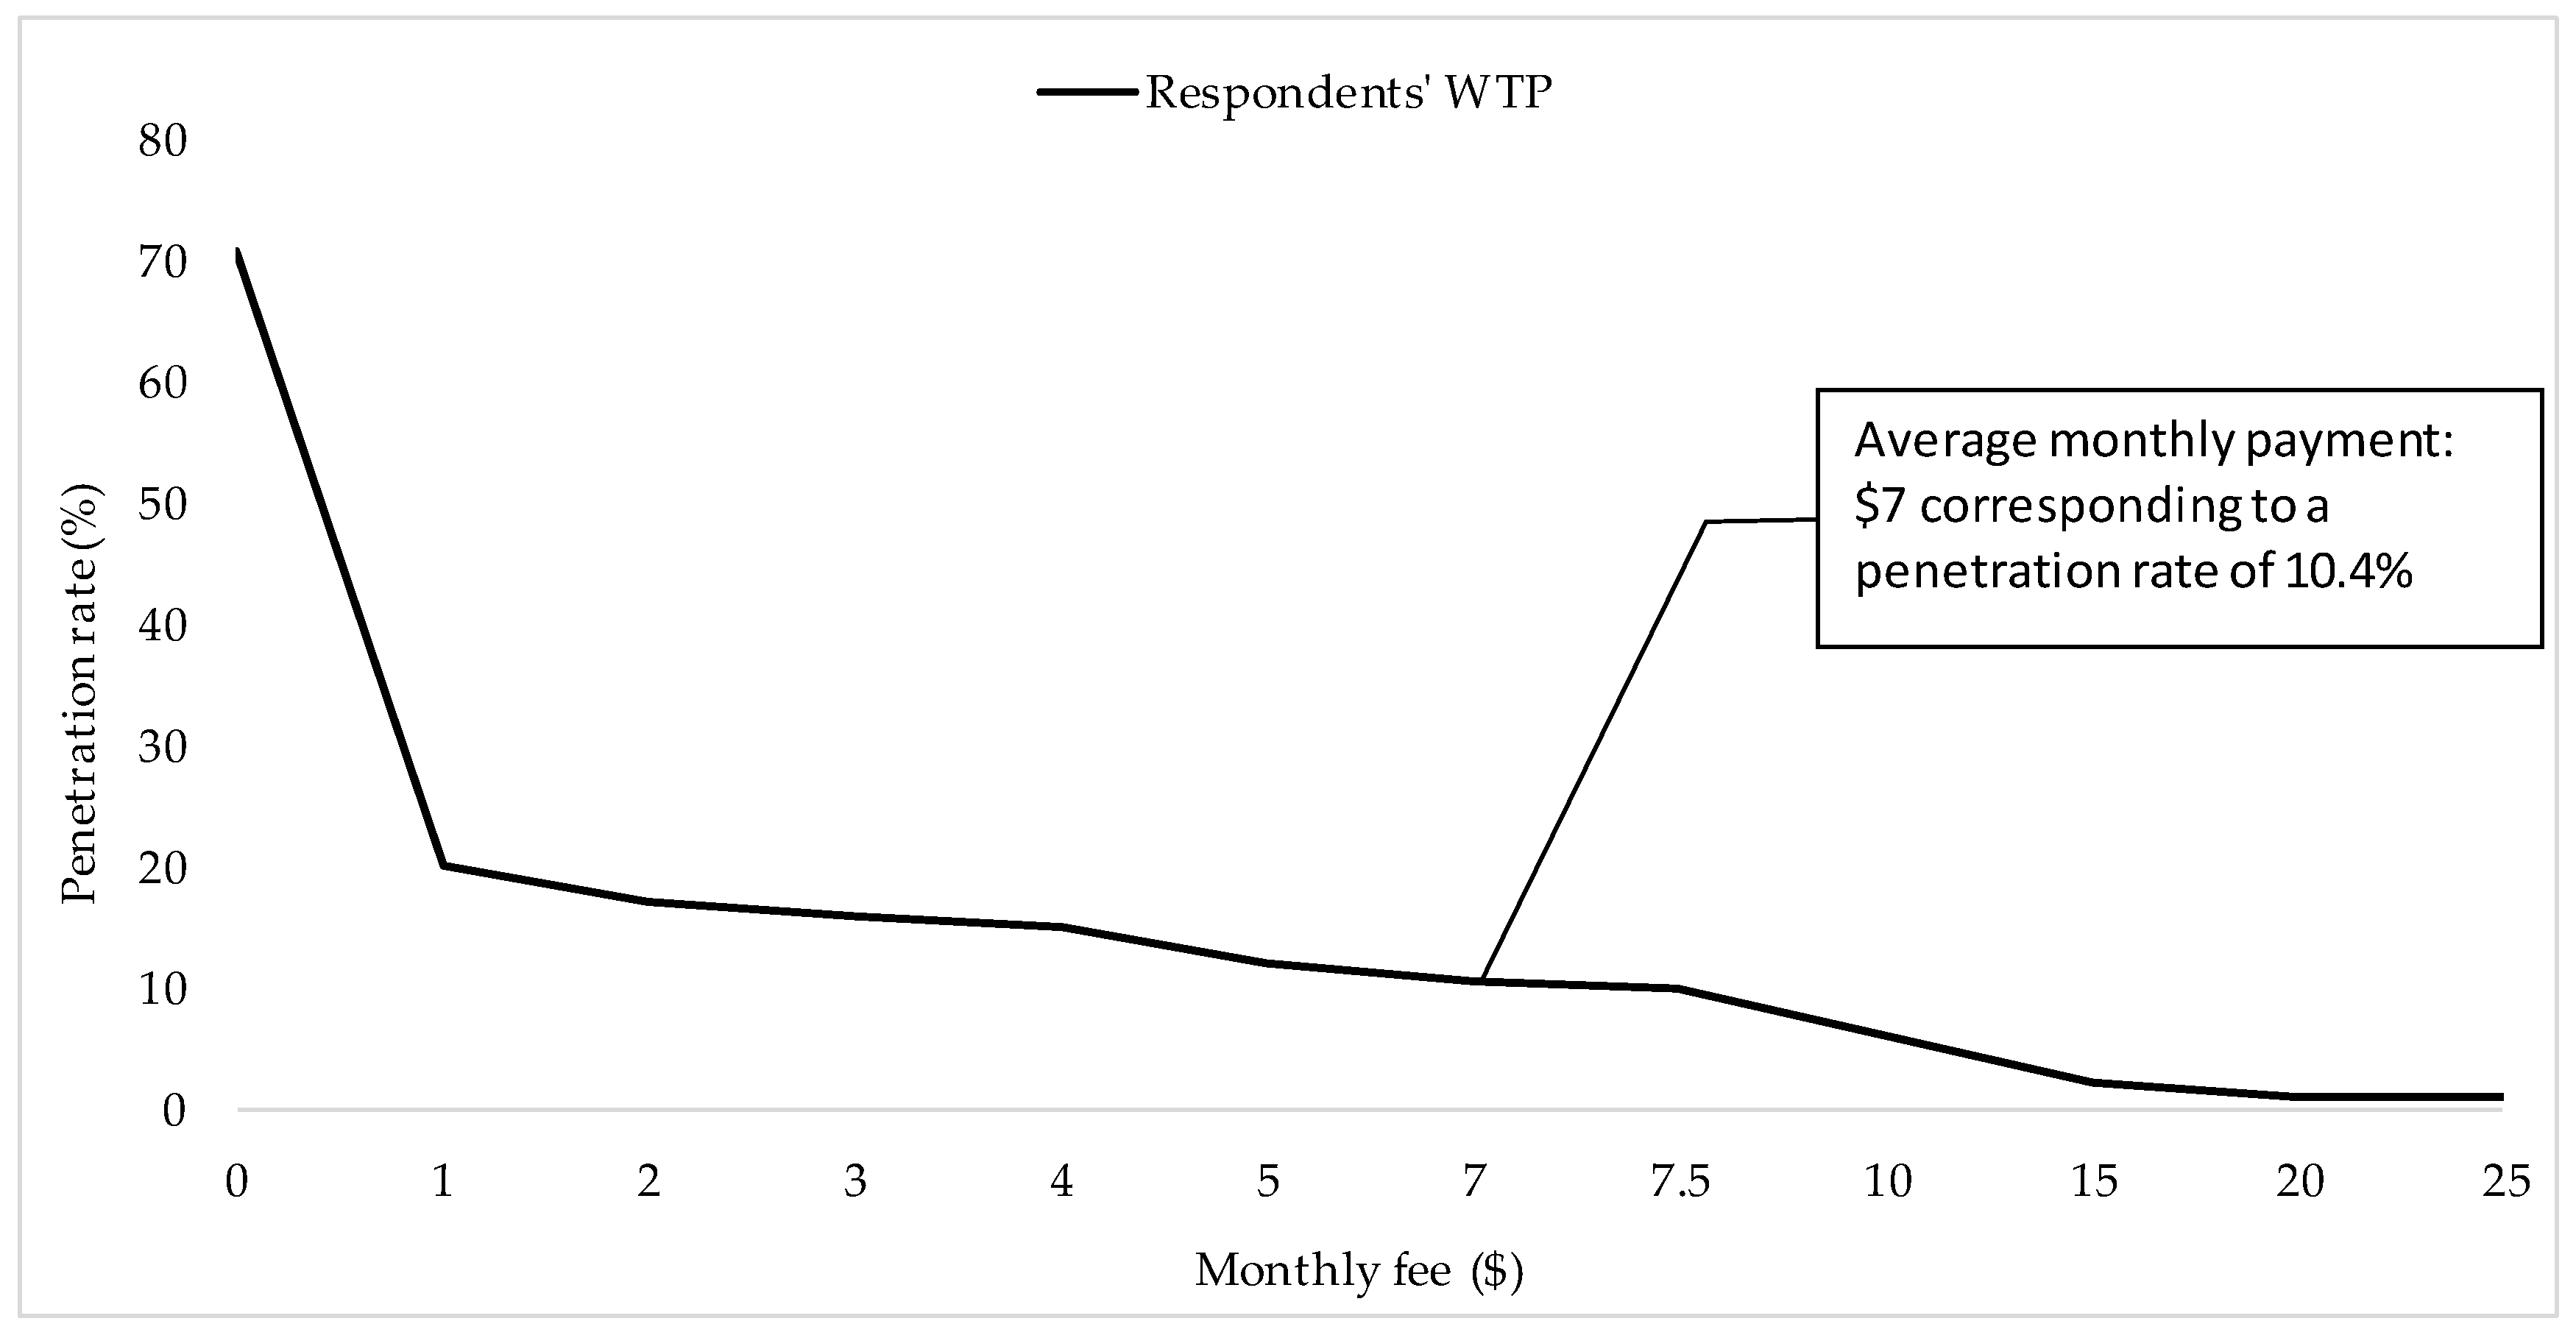
The final system design requirement that this study examined was the potential willingness-to-pay for such information. 71% of the respondents showed interest in using the ATGIS, out of which 30% were also willing to pay an average monthly payment of $7 ($5.7 US) in exchange for the travel information. This value is consistent with what previous studies found about the willingness-to-pay for travel time, navigation, and public transit information with estimated average values of $5 and $6 (in 1996 USD), and $10 (in 1997 USD) [24,25,36]. Using the willingness-to-pay responses, the authors calculated the ATGIS’s penetration rate for each amount reported by getting the percentage of the respondents out of the total sample that were willing to pay at least each monthly fee reported. Figure 7 presents this penetration rate as a function of the monthly fees to be charged.

3.5. Impacts of Socio-Demographic Characteristics on Results

In this section, we examine the relationships between perceptions/preferences of fuel/environmental costs and socio-demographic characteristics. Table 3, Table 4 and Table 5 provide the average, the median, the standard deviation, and the range for the 95% confidence interval for various socio-demographic groups. We consider gender (male or female), three income groups (<50 k CAD, 50 k CAD to 100 k CAD, and >100 k CAD), and three travel time groups (<20 min, 20–30 min, >30 min). Many interesting results can be observed in Table 3.
First, for both perceived GHG (Table 3) and perceived air pollution costs (Table 4), females generally provide higher estimates than males, especially for driving (car). For instance, the average perceived GHG costs are 0.36 CAD/km for females and 0.33 CAD/km for males, on average (Table 4). The difference between females and males is greater for the GHG costs than for air pollution costs; for females, the GHG costs seem to be more significant (relatively) than air pollution costs. We tested the hypothesis about the difference between female and male average estimates and found that females’ average estimates for both GHG and air pollution costs are higher than males’, with a confidence level of 70% (Hypothesis testing of the difference between two population means that are not normally distributed was conducted through the test statistic that is distributed as a Student t distribution with “n1 + n2” (n1 and n2 being the sample size of both populations) degrees of freedom and a specified degree of confidence.). As for income groups, higher income respondents generally perceive higher emission costs (Table 3 and Table 4). To confirm, we tested the difference between two sample means and found that the higher income respondents had a higher estimate than the lower income respondents, with a confidence level of 90%. This could be due to the fact that the rich might generally reveal a higher value of life (we should note that from the equity perspective, a higher value of life for the rich might not be justifiable) in their decisions, which can impact the health-related emissions costs that are calculated based on the value of life levels. Another interesting observation is that transport users generally provide higher air pollution health-related cost estimates (per km) for trips with a longer travel time trips, as shown in the last columns of Table 3 and Table 4. For example, the average perceived air pollution costs for driving are 0.19, 0.28, and 0.32 CAD/km for trip lengths of less than 20 min, between 20 and 30 min, and more than 30 min, respectively (Table 4). The hypothesis testing also suggests, with a 90% confidence level, that respondents with trips with a longer travel time have higher estimates than respondents with trips with a shorter travel time, on average. This fact could be due to the perception of travelers about these costs (higher emission rates are realized for longer trips) or because of the congestion associated with the trips with a longer travel time.
Table 5 shows the impacts of gender and income on the willingness to pay for the ATGIS (information) tool. Note that for the willingness to pay, we do not have the travel time length information as one socio-demographic characteristic. Our estimates and hypothesis testing show that, similar to the perceptions about emissions costs, females are willing to pay more for the tool (an average of 8.2 CAD per month) than males (an average of 5.5 CAD per month), with a confidence level of 95%. This is consistent with a study conducted in Greece [28]. In addition, the higher income respondents are willing to pay more for the information; the difference in the average estimates between higher income and lower income groups is significant at a 95% confidence level. Respondents are willing to pay an average of 4.8, 7.2, and 9.1 CAD per month for the low-, medium, and high-income groups, respectively. The average willingness-to-pay mentioned here (for both genders and all income groups) was obtained after excluding ATGIS users that would like to use the system free of charge. Table 5 presents the averages before and after the exclusion.

4. Conclusions

Sustainable travel behavior and choices are becoming increasingly vital to address growing climate change and air quality concerns. Informing transport users of their energy and environmental footprints is emerging as a potential means of promoting sustainable transportation. However, the impact of such information on travel behavior is yet to be determined. Therefore, this research primarily studied Montreal residents’ perception of fuel consumption costs, GHG social costs, and health-related air pollution costs. Then, it examined the influence of an ATGIS, a system which provides travel-related fuel and environmental information, on Montreal transport users and studied their system design preferences and willingness-to-pay.
This research found several interesting results. First, the respondents were predominantly unaware of or incapable of estimating their fuel consumption costs (over 75% on average), GHG social costs (over 85% on average), and health-related air pollution costs (over 85% on average). Furthermore, the respondents generally overestimated such costs for all travel modes and they provided higher fuel/environmental costs for public transport (metro) compared to car, remarkably opposite to reality. Such perceptions could make transport users overlook the metro as a more sustainable transport mode. Hence, providing fuel and environmental information could amend their perceptions and possibly trigger a shift in demand toward more sustainable public transport modes.
The analysis of system design preferences revealed that a mobile application is the most preferred/used tool for providing travel information. In terms of information preferences, the respondents preferred to receive health-related air pollution costs over fuel and GHG social costs. Exploring the appropriate information metrics, most respondents preferred to receive fuel and environmental information in monetary units as they are easy to perceive, and users do not need to make additional calculations.
Studying the route and mode choice behavior, this paper found that travel time is the major determinant/factor, as expected. However, fuel consumption and emissions information were also influential factors in choosing the travel mode/route. Specifically, the respondents were more willing to adjust their route choices after receiving such information.
The research also indicated that 71% of the respondents would use an ATGIS. Among these, 30% stated that they would be willing to pay an average monthly payment of $7 for the service. The penetration rate among respondents versus the monthly fees charged ranged from 71% if the service is free of charge to 1% at a cost of $25/month. This distribution could determine the appropriate monthly fees to be charged from the users to support the system.
Moreover, we examined the impacts of gender, income, and travel time on the estimates we discussed above. Generally, female respondents tended to perceive higher GHG and air pollution costs than males. Similarly, females were willing to pay more for the emissions (ATGIS) information, which is consistent with other studies [28]. We also found that higher income respondents generally perceived higher health-related air pollution costs, possibly because of their higher value of life perceptions, which is the basis for the health-related cost calculations. On the other hand, the perceived GHG costs do not depend on income, fundamentally. Another interesting finding is that respondents tended to estimate higher emissions costs for longer trips, which could be due to the perception of travelers (higher emissions rates are realized for longer trips) or because of the congestion associated with trips with a longer travel time.
This research is promising in terms of the impact of the fuel and environmental information on travel behavior. It would be beneficial to provincial governments and/or environmental agencies, as it indicates the feasibility of a low-cost transport management system that might save travel costs and induce sustainable travel decisions. The small sample size of the survey could affect the reliability of the responses and using stated preference questions probably does not portray the actual behavior of travelers. However, future research could analyze travelers’ decisions in actual travel/driving conditions (when using a mobile application, for instance) to validate the survey results. In addition, discrete choice questions could be used to set up route and mode choice models and evaluate (through statistical models) the impact that fuel and environmental information has on the travel behavior compared to that of travel time and cost.

Acknowledgments

The authors acknowledge the support by the Natural Sciences and Engineering Research Council of Canada (NSERC) under award number RGPIN-2016-06440.

Author Contributions

Nayer Daher, Farhana Yasmin, Ehsan Moradi, and Omid Rouhani designed the survey. Min Ru Wang conducted the survey. Nayer Daher and Min Ru Wang analyzed the data. Nayer Daher wrote the paper, and all the authors reviewed it.

Conflicts of Interest

The authors declare no conflict of interest.

References

  1. Environment and Climate Change Canada. Canadian Environmental Sustainability Indicators: Greenhouse Gas Emissions; Environment and Climate Change Canada: Ottawa, ON, Canada, 2017; p. 8. [Google Scholar]
  2. Environment and Climate Change Canada. Canadian Environmental Sustainability Indicators: Air Pollutant Emissions; Environment and Climate Change Canada: Ottawa, ON, Canada, 2016; pp. 7–22. [Google Scholar]
  3. Raaschou-Nielsen, O.; Andersen, Z.J.; Beelen, R.; Samoli, E.; Stafoggia, M.; Weinmayr, G.; Hoffmann, B.; Fischer, P.; Nieuwenhuijsen, M.J.; Brunekreef, B. Air pollution and lung cancer incidence in 17 European cohorts: Prospective analyses from the European study of cohorts for air pollution effects (escape). Lancet Oncol. 2013, 14, 813–822. [Google Scholar] [CrossRef]
  4. Crouse, D.L.; Peters, P.A.; van Donkelaar, A.; Goldberg, M.S.; Villeneuve, P.J.; Brion, O.; Khan, S.; Atari, D.O.; Jerrett, M.; Pope, C.A., III. Risk of Nonaccidental and cardiovascular mortality in relation to long-term exposure to low concentrations of fine particulate matter: A Canadian national-level cohort study. Environ. Health Perspect. 2012, 120, 708. [Google Scholar] [CrossRef] [PubMed]
  5. Prillwitz, J.; Barr, S. Moving towards sustainability? Mobility styles, attitudes and individual travel behaviour. J. Transp. Geogr. 2011, 19, 1590–1600. [Google Scholar] [CrossRef]
  6. Brazil, W.; Caulfield, B. Does green make a difference: The potential role of smartphone technology in transport behaviour. Transp. Res. Part C 2013, 37, 93–101. [Google Scholar] [CrossRef]
  7. Rouhani, O.M.; Gao, H.O. An advanced traveler general information system for Fresno, California. Transp. Res. Part A 2014, 67, 254–267. [Google Scholar] [CrossRef]
  8. Avgerou, C. Information systems in developing countries: A critical research review. J. Inf. Technol. 2008, 23, 133–146. [Google Scholar] [CrossRef]
  9. Chatterton, T.J.; Coulter, A.; Musselwhite, C.; Lyons, G.; Clegg, S. Understanding how transport choices are affected by the environment and health: Views expressed in a study on the use of carbon calculators. PUHE Public Health 2009, 123, e45–e49. [Google Scholar] [CrossRef] [PubMed]
  10. Lorenzoni, I.; Pidgeon, N.F. Public views on climate change: European and USA perspectives. Clim. Chang. 2006, 77, 73–95. [Google Scholar] [CrossRef]
  11. Gaker, D.; Vautin, D.; Vij, A.; Walker, J.L. The power and value of green in promoting sustainable transport behavior. Environ. Res. Lett. 2011, 6, 034010. [Google Scholar] [CrossRef]
  12. Turrentine, T.S.; Kurani, K.S. Car buyers and fuel economy? Energy Policy 2007, 35, 1213–1223. [Google Scholar] [CrossRef]
  13. Brazil, W.; Caulfield, B. Testing individuals’ ability to compare emissions from public transport and driving trips. J. Public Transp. 2014, 17. [Google Scholar] [CrossRef]
  14. Carrel, A.; Ekambaram, V.; Gaker, D.; Sengupta, R.; Walker, J.L. The Quantified Traveler: Changing Transport Behavior with Personalized Travel Data Feedback; University of California Transportation Center, University of California: Berkeley, CA, USA, 2012. [Google Scholar]
  15. Combes, P.-P.; Lafourcade, M. Transport costs: Measures, determinants, and regional policy implications for France. J. Econ. Geogr. 2005, 5, 319–349. [Google Scholar] [CrossRef]
  16. Air pollution: Human health costs—Canada.ca. 2013. Available online: https://www.canada.ca/en/environment-climate-change/services/air-pollution/quality-environment-economy/economic-issues/human-health-costs.html (accessed on 22 January 2018).
  17. The true cost of carbon pollution. 2017. Environmental Defense Fund. Available online: https://www.edf.org/true-cost-carbon-pollution (accessed on 22 January 2018).
  18. Mannering, F.; Kim, S.-G.; Ng, L.; Barfield, W. Travelers’ preferences for in-vehicle information systems: An exploratory analysis. Transp. Res. Part C 1995, 3, 339–351. [Google Scholar] [CrossRef]
  19. Kim, K.; Vandebona, U. User requirements and willingness to pay for traffic information systems: Case study of Sydney, Australia. Trans. Res. Rec. 1999, 1694, 42–47. [Google Scholar] [CrossRef]
  20. Ng, L.; Barfield, W.; Mannering, F. A survey-based methodology to determine information requirements for advanced traveler information systems. Transp. Res. Part C 1995, 3, 113–127. [Google Scholar] [CrossRef]
  21. Brazil, W.; Caulfield, B.; Rieser-Schüssler, N. Understanding carbon: Making emissions information relevant. Transp. Res. Part D 2013, 19, 28–33. [Google Scholar] [CrossRef]
  22. Avineri, E.; Waygood, O. Catch Carbon-Aware Travel Choice in the City, Region and World of Tomorrow; Behavioural Inception Report; European Commission: Brussels, Belgium, 2010. [Google Scholar]
  23. Gaker, D.; Zheng, Y.; Walker, J. Experimental economics in transportation: Focus on social influences and provision of information. Transp. Res. Rec. 2010, 2156, 47–55. [Google Scholar] [CrossRef]
  24. Rouhani, O.M.; Zarei, H. Fuel consumption information: An alternative for congestion pricing? Road Transp. Res. 2014, 23, 52–64. [Google Scholar]
  25. Walker, J.L.; Ben-Akiva, M.E. Consumer response to traveler information systems: Laboratory simulation of information searches using multimedia technology. J. Intell. Transp. Syst. 1996, 3, 1–20. [Google Scholar] [CrossRef]
  26. Marans, R.W.; Yoakam, C. Accessing the acceptability of IVHS: Some preliminary results. In Proceedings of the Vehicle Navigation and Information Systems Conference, Troy, MI, USA, 20–23 October 1991; pp. 657–668. [Google Scholar]
  27. Polydoropoulou, A.; Gopinath, D.; Ben-Akiva, M. Willingness to pay for advanced traveler information systems: Smartraveler case study. Transp. Res. Rec. 1997, 1588, 1–9. [Google Scholar] [CrossRef]
  28. Politis, I.; Papaioannou, P.; Basbas, S.; Dimitriadis, N. Evaluation of a bus passenger information system from the users’ point of view in the city of thessaloniki, Greece. Res. Transp. Econ. 2010, 29, 249–255. [Google Scholar] [CrossRef]
  29. Zhang, L.; Levinson, D. Determinants of route choice and value of traveler information: A field experiment. Transp. Res. Rec. 2008, 2086, 81–92. [Google Scholar] [CrossRef]
  30. Molin, E.J.; Timmermans, H.J. Traveler expectations and willingness-to-pay for web-enabled public transport information services. Transp. Res. Part C 2006, 14, 57–67. [Google Scholar] [CrossRef]
  31. Fuel Consumption Ratings—Open Government Portal. 2018. Open.canada.ca. Available online: http://open.canada.ca/data/en/dataset/98f1a129-f628-4ce4-b24d-6f16bf24dd64 (accessed on 22 January 2018).
  32. Average retail prices for gasoline and fuel oil, by urban center. 2017. Statcan.gc.ca. Available online: http://www5.statcan.gc.ca/cansim/a47 (accessed on 22 January 2018).
  33. Mathez, A.; Manaugh, K.; Chakour, V.; El-Geneidy, A.; Hatzopoulou, M. How can we alter our carbon footprint? Estimating GHG emissions based on travel survey information. Transportation 2013, 40, 131–149. [Google Scholar] [CrossRef]
  34. Environment and Climate Change Canada. Technical Update to Environment and Climate Change Canada’s Social Cost of Greenhouse Gas Estimates; Environment and Climate Change Canada: Ottawa, ON, Canada, 2016; p. 27. [Google Scholar]
  35. National Research Council (US); Committee on Climate Change; US Transportation; Division on Earth and Life Studies. Potential Impacts of Climate Change on US Transportation; Transportation Research Board: Washington, DC, USA, 2008; Volume 290. [Google Scholar]
  36. United States Environmental Protection Agency. Average Annual Emissions and Fuel Consumption for Gasoline-Fueled Passenger Cars and Light Trucks Emission Facts; United States Environmental Protection Agency, Office of Transportation and Air Quality: Ann Arbor, MI, USA, 2008; p. 6. [Google Scholar]
  37. Holland, M.; Pye, S.; Watkiss, P.; Droste-Franke, B.; Bickel, P. Damages per Tonne Emission of PM2.5, NH3, SO2, NOx and VOCs from each EU25 Member State (Excluding Cyprus) and Surrounding Seas; AEA Technology Environment: Harwell, UK, 2005. [Google Scholar]
  38. Okazaki, S.; Hirose, M. Does gender affect media choice in travel information search? On the use of mobile internet. Tour. Manag. 2009, 30, 794–804. [Google Scholar] [CrossRef]
  39. Green, P.; Serafin, C.; Williams, M.; Paelke, G. What Functions and Features Should Be in Driver Information Systems of the Year 2000. In Proceedings of the Vehicle Navigation and Information Systems Conference, Troy, MI, USA, 20–23 October 1991; pp. 483–498. [Google Scholar]
  40. Llaneras, R.E.; Lerner, N.D. The effects of atis on driver decision making. ITS Q. 2000, 8, 53–63. [Google Scholar]
  41. Wolinetz, L.; Khattak, A.; Yim, Y. Why will some individuals pay for travel information when it can be free? Analysis of a bay area traveler survey. Transp. Res. Rec. 2001, 1759, 9–18. [Google Scholar] [CrossRef]
  42. McCubbin, D.R.; Delucchi, M.A. The health costs of motor-vehicle-related air pollution. J. Transp. Econ. Policy 1999, 33, 253–286. [Google Scholar]
  43. Small, K.A.; Kazimi, C. On the costs of air pollution from motor vehicles. J. Transp. Econ. Policy 1995, 29, 7–32. [Google Scholar]
  44. Krupnick, A.J.; Rowe, R.D.; Lang, C.M. Transportation and air pollution: The environmental damages. In The Full Costs and Benefits of Transportation; Springer: Berlin, Germany, 1997; pp. 337–369. [Google Scholar]
  45. Limtanakool, N.; Dijst, M.; Schwanen, T. The influence of socioeconomic characteristics, land use and travel time considerations on mode choice for medium-and longer-distance trips. J. Transp. Geogr. 2006, 14, 327–341. [Google Scholar] [CrossRef]
  46. Paulley, N.; Balcombe, R.; Mackett, R.; Titheridge, H.; Preston, J.; Wardman, M.; Shires, J.; White, P. The demand for public transport: The effects of fares, quality of service, income and car ownership. Transp. Policy 2006, 13, 295–306. [Google Scholar] [CrossRef]
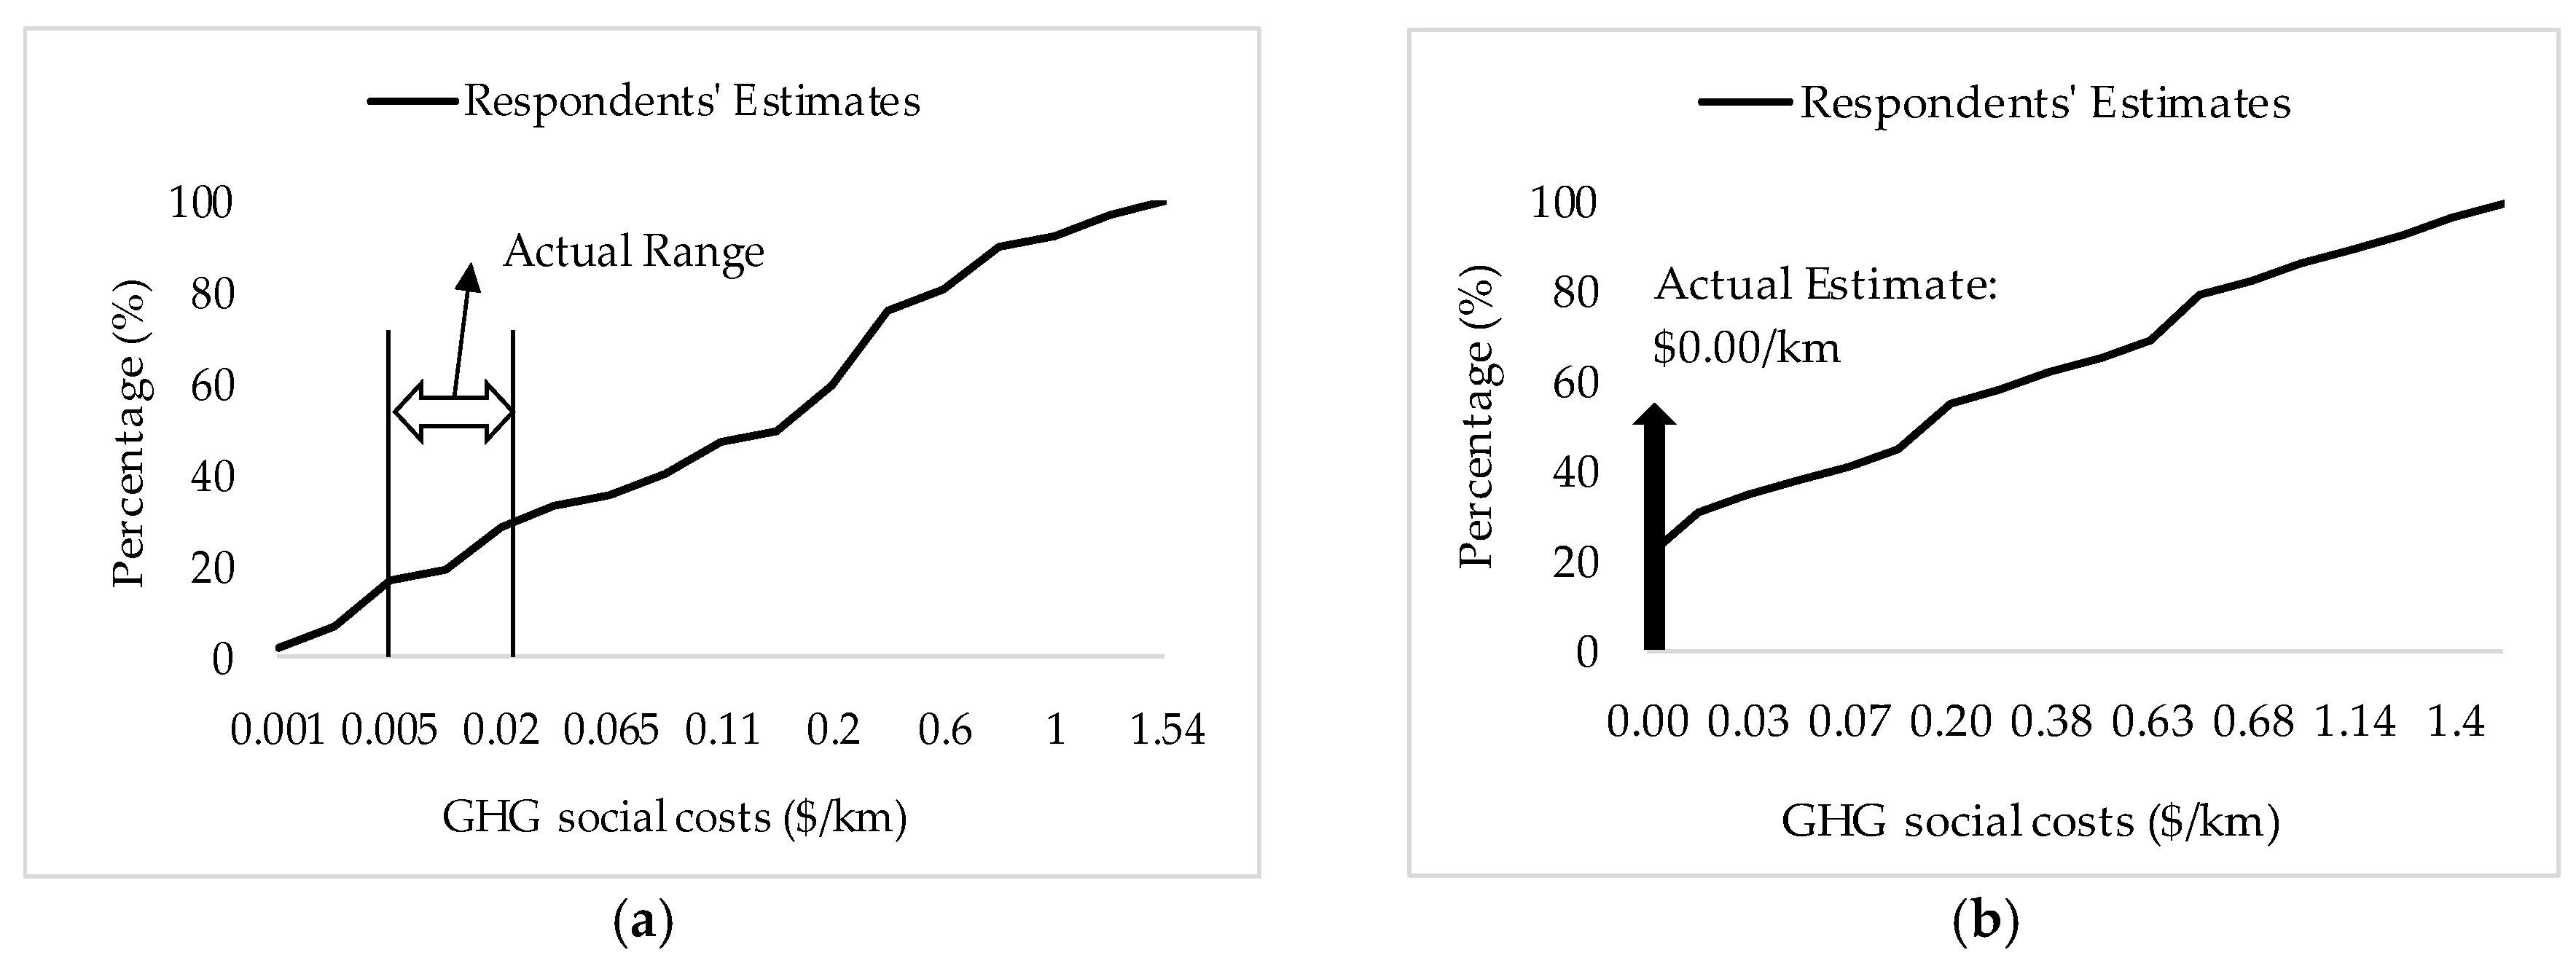
Figure 1. GHG social cost estimates for (a) passenger cars; (b) the metro; and (c) the bus.
Sustainability 10 00514 g001aSustainability 10 00514 g001b
Figure 2. Air pollution health-related costs estimates for (a) passenger cars; (b) the metro; and (c) the bus.
Sustainability 10 00514 g002
Figure 3. Weekly average use of different information means/tools.
Sustainability 10 00514 g003
Figure 4. Level of importance of different travel information types.
Sustainability 10 00514 g004
Figure 5. Preferred metrics for (a) fuel consumption information and (b) GHG and criteria air pollutants.
Sustainability 10 00514 g005
Figure 6. Ranking of the travel information’s influence on mode and route choice.
Sustainability 10 00514 g006
Figure 7. Penetration rate of ATGIS.
Sustainability 10 00514 g007
Table 1. Summary of socio-demographic characteristics.
Socio-Demographic CharacteristicsNumber of ResponsesSample Percentage General Population
After eliminating “Prefer not to disclose”369
GenderMale
Female
178
191
48%
52%
49%
51%
After eliminating “Prefer not to disclose”373
Age groups18–24
25–34
35–44
45–54
55 or more
121
114
78
34
26
32%
31%
21%
9%
7%
12%
20%
18%
16%
34%
After eliminating “Prefer not to disclose”316
Annual IncomeLess than $30,000
$30,000–$50,000
$50,000–$70,000
$70,000–$100,000
$100,000–$150,000
$150,000–$200,000
$200,000 or more
66
67
60
46
48
15
14
21%
21%
19%
15%
15%
5%
4%
47%
23%
13%
10%
4%
1%
1%
Table 2. Actual health-related costs for cars.
Criteria Air PollutantEmission Rate (g/km)Unit Emission Cost ($/g)Health-Related Cost ($/km)
CO7.70.00040.0031
NOx0.60.010.0060
PM2.50.0030.440.0013
PM100.0030.0440.0001
Total0.011
Note: Data for Emission rates was gathered from the EPA [36]. Data for unit emission costs is gathered from Holland et al. [37].
Table 3. Impacts of socio-demographic characteristics on the perceived GHG costs.
Perceived GHG Costs ($/km)
Socio-DemographicsGenderIncomeTravel Time
Travel ModesMaleFemale<$50,000$50,000 to $100,000>$100,000<20 min20 min–30 min>30 min
CarSample size 12320151414121514
Average0.330.360.310.360.330.30.340.48
Median0.240.310.260.330.300.250.230.42
Standard dev.0.1960.160.0590.0760.0760.1060.1190.134
95% CI 20.25–0.410.30–0.450.28–0.340.32–0.40.29–0.370.24–0.360.28–0.40.41–0.55
MetroSample size 12318151313131612
Average0.40.440.380.420.450.350.370.47
Median0.330.410.320.400.400.330.40.43
Standard dev.0.1710.1080.1190.0550.0920.0550.0410.053
95% CI 20.34–0.470.37–0.490.34–0.440.39–0.450.4–0.50.32–0.380.35–0.390.44–0.5
BusSample size 116181310991114
Average0.220.280.220.260.250.210.280.26
Median0.170.250.120.180.190.190.240.23
Standard dev.0.1840.2160.2390.1940.0310.0310.0670.076
95% CI 20.13–0.310.17–0.380.10–0.360.14–0.380.23–0.270.19–0.230.24–0.320.22–0.3
1 Approximately 85% of the total respondents were not able to estimate GHG social costs and did not report a value. 2 Confidence intervals were calculated using the empirical bootstrap resampling. The data sets were resampled 1000 times to get the 95% confidence intervals. For more information on the bootstrap technique, refer to https://ocw.mit.edu/courses/mathematics/18-05-introduction-to-probability-and-statistics-spring-2014/readings/MIT18_05S14_Reading24.pdf.
Table 4. Impacts of socio-demographic characteristics on the perceived air pollution health-related costs.
Perceived Air Pollution Health-Related Costs ($/km)
Socio-DemographicsGenderIncomeTravel Time
Travel ModesMaleFemale< $50,000$50,000 to $100,000> $100,000< 20 min20 min–30 min> 30 min
Sample size 12018121412131411
Average0.290.320.270.350.340.190.280.32
CarMedian0.20.180.220.260.30.210.270.26
Standard dev.0.1140.0860.1060.1720.0710.0370.0380.023
95% CI 20.24–0.340.28–0.360.21–0.330.26–0.440.3–0.380.17–0.210.26–0.30.23–0.41
Sample size 1 1717131110121210
Average0.410.450.40.430.40.320.410.47
MetroMedian0.350.370.340.370.410.210.390.4
Standard dev.0.1260.0840.0920.0680.0320.1060.0530.113
95% CI 20.35–0.470.41–0.490.35–0.450.39–0.470.43–0.470.26–0.380.38–0.440.4–0.54
Sample size 118161212991114
Average0.260.260.220.260.310.230.260.27
BusMedian0.230.250.230.220.270.210.240.26
Standard dev.0.1290.1020.0350.0880.1060.0460.0850.038
95% CI 20.2–0.320.21–0.310.2–0.240.21–0.310.25–0.370.2–0.260.23–0.310.25–0.29
1 Approximately 85% of the total respondents were not able to estimate air pollution health-related costs and did not report a value.2 Confidence intervals were calculated using the empirical bootstrap resampling. The data sets were resampled 1000 times to get the 95% confidence intervals.
Table 5. Impacts of socio-demographic characteristics on the willingness to pay for ATGIS.
Willingness to Pay for ATGIS ($/month)
Socio-Demographics GenderIncome
ATGIS Users MaleFemale< $50,000$50,000 to $100,000> $100,000
Including “$0” responsesSample size 15256493636
Average1.692.931.371.513.03
Excluding “$0” responsesSample size 11620141012
Average5.518.224.87.29.1
Median4.36.254.07.58
Standard dev.3.864.063.633.555.65
95% CI 23.6–7.46.4–102.9–6.75.0–9.45.6–12.6
1 71% of the total survey respondents would use the ATGIS, out of which 30% were also willing to pay a non-zero fee per month. The table presents the willingness to pay averages including the “$0” responses first, and then after excluding them. 2 Confidence Intervals were calculated using the empirical bootstrap resampling. The data sets were resampled 1000 times to get the 95% confidence intervals.