Relationships between Livelihood Risks and Livelihood Capitals: A Case Study in Shiyang River Basin, China


1
School of Economics and Management, Shaanxi University of Science & Technology, Xi’an 710021, China
2
College of Humanities, Arts and Social Sciences, Flinders University, GPO Box 2100, Adelaide, SA 5001, Australia
*
Author to whom correspondence should be addressed.
Sustainability 2018, 10(2), 509; https://doi.org/10.3390/su10020509
Submission received: 24 January 2018
/
Revised: 24 January 2018
/
Accepted: 12 February 2018
/
Published: 14 February 2018
(This article belongs to the Section Sustainable Urban and Rural Development)
Abstract
:Using information collected through semi-structured questionnaires in 483 households, this paper examines the relationships between livelihood risks and livelihood capitals amongst rural farming communities in China’s Shiyang River Basin. Based on an index system of livelihood risks (health, environmental, financial, social, information and connectivity risks) and livelihood capitals (human, physical and natural, financial and social capitals), relationships are measured and evaluated through a linear regression model. Results suggest that health risk and social risk have clear negative effects on livelihood capitals. This finding may support evidence-based policies intended to reduce health risk and social risk threats as well as underpinning improvements in rural farmers’ capacities to withstand livelihood risk and to enhance well-being.
1. Introduction
The issue of “livelihood risk” is prominent among rural households in developing countries and has been the subject of intensive conceptual and empirical research, especially since the last quarter of the 20th century amidst growing global attention to sustainable development [1,2,3,4,5,6]. Securing or maintaining a sustainable livelihood in the face of risks is highly dependent on access to various forms of livelihood capital. Available livelihood assets constitute a stock of capitals which can be stored, accumulated, exchanged at a community or household level [7,8] and put to work to prevent or reduce the impact of livelihood risks. To understand how people’s livelihood is affected by different types of risk and to formulate relevant policies that might help farmers cope with them, it is helpful to evaluate quantitatively the relationships between livelihood risk and livelihood capitals. This paper presents an analytical discussion of the relationships between livelihood risks on livelihood capitals in rural farming communities in Shiyang River Basin in China. The analysis is based on extensive fieldwork conducted by the lead author among 483 household heads in rural farming communities living in that region.
Livelihood risk can drastically alter a household’s portfolio of assets by either destroying them physically, or by dramatically reducing their value as a result, for example, of a prolonged collapse of asset markets. Risk implies serious household welfare outcomes [9] and so demands that greater effort be expended to investigate its relationships with livelihood capitals. Much of the existing literature on this topic has focused on the description of livelihood risk (including the definition, division, occurrence intensity and causes) (e.g., [10,11,12,13,14]) and livelihood capital (mainly including the definition, division, status evaluation and the relationship with livelihood strategies) (e.g., [15,16,17,18,19,20,21]). Only a few studies (e.g., [22,23]) have attempted to assess relationships between livelihood risk and livelihood capitals. It is crucial to understand how households are affected by, adapt to, and cope with livelihood risk. Just as importantly, it is essential to explore how people facing livelihood risk can be assisted in the most effective ways.
1.1. Livelihood Perspective
The livelihoods perspective starts with the deceptively simple exploration of how different people in different places live [24,25]. A variety of definitions of livelihood are offered in the literature, including, for example, the means of gaining a living or a combination of the resources used and the activities undertaken in order to live [26]. A livelihood comprises capabilities, capitals (stores, resources, claims and access), and activities required for a means of living, including food and income. A livelihood is considered sustainable if the individual or the household can: cope with and recover from stress and shocks; maintain or enhance capabilities and capitals and provide sustainable livelihood opportunities for the next generation; and contribute net benefits to other livelihoods at the local and global levels and in the short and long term [27]. International organisations such as the United Nations Development Programme (UNDP) and the UK’s Department for International Development (DFID) have made extensive use of a variety of sustainable livelihood analysis frameworks to address key issues and links between development and poverty.
1.2. Livelihood Capital
“Livelihood capitals” refer to the vital resource bases of communities and different categories of households [17]. There is some international scientific consensus that livelihood capital comprises five categories: human, natural, financial, physical and social capitals [15,16,17,18,19,20,21].
Generally, livelihoods approaches focus on the material value of household “capitals” rather than cognitive and social use values [28] and poverty is defined as a lack of “capitals” (a condition) rather than as an absence of “entitlements” (a relation) [28]. However, it is very important to recognize the contemporary livelihoods approach which defines livelihood as the combination of capabilities, resources, and activities required to sustain a living [1]. Israr and Khan (2010) have highlighted the impacts of livelihood capitals on poverty alleviation in rural areas of northern Pakistan [29]. Their study showed that the choice of livelihood options and the consequent level of family wellbeing were influenced heavily by the level of, and access to, various livelihood capitals. Similarly, Bebbington’s (1999) livelihood analysis has addressed the importance of people’s access to the five types of capital [15]. He argues that the combination and interchangeability of different types of livelihood capitals are essential to the shape of livelihood capability and the satisfaction of rural residents’ material and spiritual needs.
1.3. Livelihood Risk
A classical definition of livelihood risk relates to the chance of injury, damage or loss [13]. Giddens (1999) goes on to distinguish between external risks emanating from causes such as bad harvests, floods, plagues, and famines and manufactured risks which not only concern nature but also include other areas of life, such as marriage and the family, and which have recently been the subject of significant changes in developed countries as well as in other parts of the world [13]. Manufactured risks now present challenges of which humanity has very little historical experience. Giddens (1999) points to global warming as an example [13]. To this we might add the growing constellation of worldwide dilemmas around food and water security, waste disposal, ozone deterioration, and ocean acidification. To simplify the distinction between “external risk” and “manufactured risk”, Giddens states:
In all traditional cultures, one could say, and in industrial society right up to the threshold of the present day, human beings worried about the risks coming from external nature—from bad harvest, floods, plagues or famines. At a certain point, however—very recently in historical terms—we started worrying less about what nature can do to us, and more about what we have done to the nature. This marks the transition from predominance of external risk to that of manufactured risk [13].
According to a definition provided by United Nations International Strategy for Disaster Reduction (UNISDR) [6], risk is “the probability of harmful consequences, or expected losses (deaths, injuries, property, livelihoods, economic activity disrupted or environment damaged) resulting from interactions between natural or human induced hazards and vulnerable conditions. Beyond expressing a possibility of physical harm, it is essential to appreciate that risks are always created or exist within social systems”. The social context in which risks occur is significant to any analysis as perceptions and understandings of their causes and consequences vary from society to society [6].
1.4. Relationship between Livelihood Capital and Livelihood Risk
The interaction between livelihood capitals and livelihood risk is always complex. It is not just the level of capital, but also the mix of capitals that influences capacity to cope with livelihood risks. While the importance of financial and physical capitals may be obvious, human and social capitals have also emerged as important variables in livelihood risk management [30]. Education, skills, and information better equip households to deal with livelihood risk. Similarly, social cohesion, community networks, equitable gender relations, and participation in social organizations, all considered positive expressions of social capital, play important roles in responding to livelihood risk [12].
The commonly-used classification of livelihood capitals comprises five categories—human capital, physical capital, natural capital, financial capital and social capital—as outlined in Table 1. In our analysis, we considered a sixth category called information capital [31]. Information is such a critical component in people’s lives that it is now difficult to imagine sustainable livelihoods without referring to the role of information. Indeed, one of the core objectives of sustainable livelihoods approach is to improve (poor) people’s access to information [16]. Information provides strong leverage to secure access to other forms of capital [32,33]. Information as a livelihood capital is such a fundamental and vital livelihood asset/resource that it ought to be integrated into the sustainable livelihoods framework [31]. However, information capital is very difficult to evaluate practically at this stage and was, of necessity, excluded from consideration in this research. In a future study, we intend to make progress on its evaluation.
Our analysis aligns the five forms of livelihood capital with five categories of livelihood risk, namely “health”, “environmental”, “financial”, “social” and “information and connectivity” (see Table 1), which we describe more fully in Section 2.2. Given their characteristics, the risks associated with financial and physical capital are consolidated into the single category, financial risk.
As noted earlier, this study sheds light on the relationships between livelihood risks on livelihood capitals with a focus on rural farming communities in China’s Shiyang River Basin. This first part of the paper offers an introduction to livelihood capital, livelihood risk and their relationship. The second part of the paper describes the research sites and methodology applied in our study. Here, we develop two different index systems of livelihood risk and livelihood capitals. Section 3 highlights the effect of livelihood risk on livelihood capitals using a linear regression model. Conclusions are presented in Section 4.
2. Study Context and Methods
2.1. Study Context
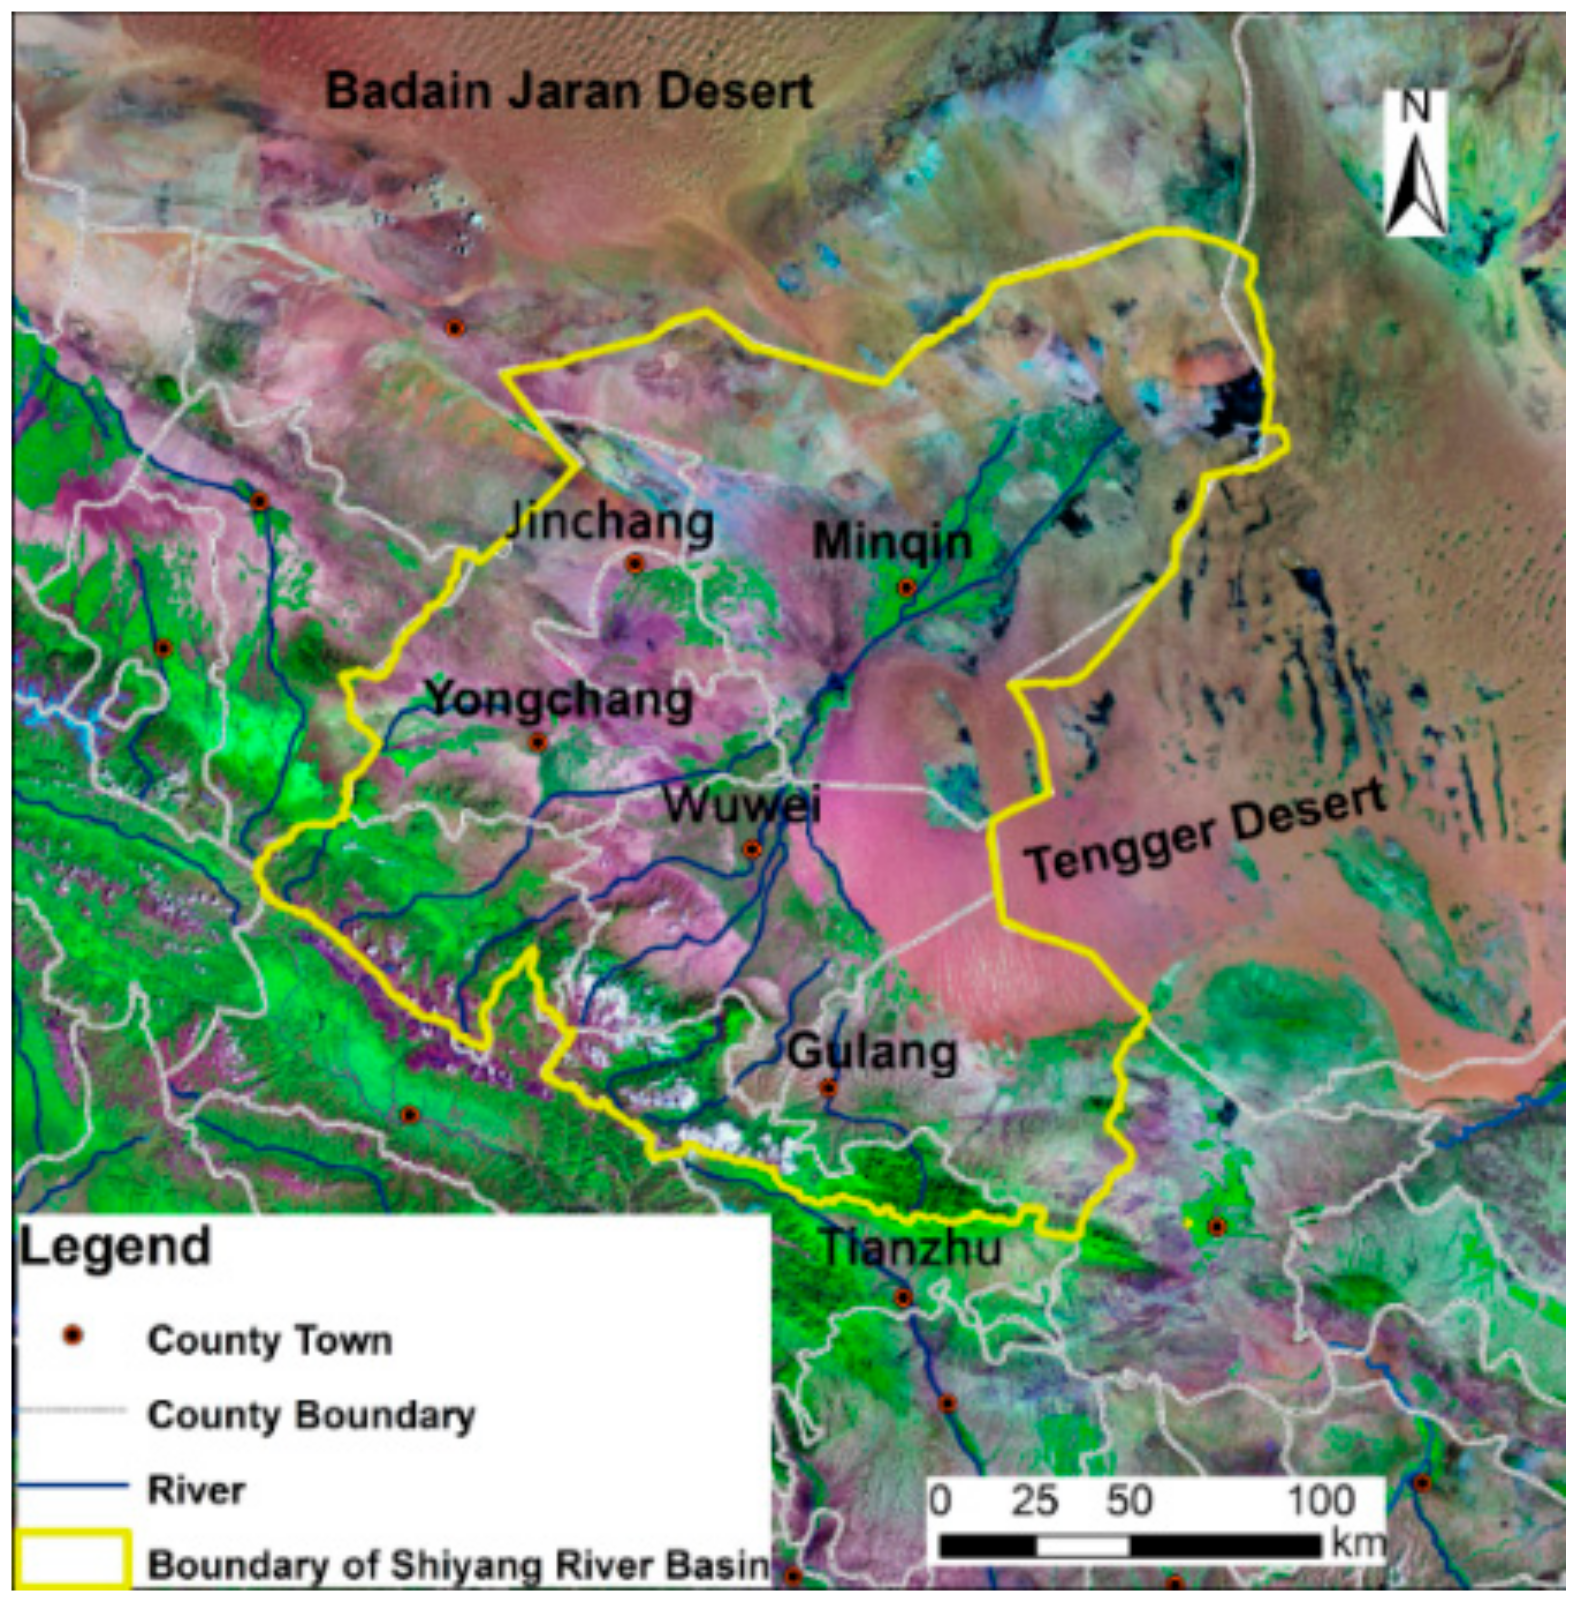
The Shiyang River Basin (Figure 1) is an arid inland river basin located in the eastern section of Hexi corridor, the western section of Wushao ridge, and the northern section of the Qilian Mountains. It has a total area of approximately 41,600 km2, and population of 2.358 million, yielding a population density (55 people per square kilometre) about 3.4 times greater than the average population density of the Hexi Corridor [34]. Plantations and aquaculture constitute the main types of farming in the Shiyang River Basin.
Local farmers mainly raise cattle, sheep and other livestock. The primary crops in this area include wheat, corn, rape, potatoes, other vegetables, and fruit. Correspondingly, the main pests and diseases include wheat midge, cotton bollworm, Rhopalosiphum maidis (otherwise known as the leaf aphid or corn aphid), potato blight, and cabbage caterpillar. Weeds, of course, are another problem. Like the rest of China there is no significant gender division of labour in the study area: women play the same role as men in agricultural production. However, the region faces challenges associated with access to education and health care, high labour turnover, and an ageing population. Given the area’s dense and growing population, there is also conflict between farmers’ livelihoods, economic development, and ecological protection. The Shiyang River Basin takes significance as a case study for work on livelihood risks and livelihood capitals as it has the greatest population density, the highest intensity of economic activities, the most severe ecological degradation, and the most strategic ecological position of any of China’s four inland river basins.
While the Shiyang River Basin offers a valuable exemplar of rural living conditions in China its worth as a case study is heightened further by the extreme fragility of its ecological environment. That fragility is intensified by severe water shortages. The conjunction of climate change and human activities mean there is now a serious local mismatch between water resource supply and demand. This has led to over-extraction of groundwater resources and heightened mineralization [35]. In the Qilian mountain area, in the upstream reaches of the Shiyang River, water conservation functions are weakened significantly as a result of mining, grazing, vegetation damage, and land reclamation. In the Shiyang River’s middle reaches, there is a serious imbalance between population and scarce water resources. In the river’s lower reaches, extensive groundwater pumping by local residents is leading to a series of environmental problems such as sandstorms and large-area surface vegetation die-offs as well as population outflows [36].
Farmland irrigation accounts for a large proportion of water utilization, especially in the river’s middle and lower reaches. In fact, water requirements to sustain human life and industry are significantly lower than those required for agriculture [37]. During the fieldwork for this research it was observed that the reasons for high agricultural water use from the river include inappropriate water-intensive crops; vast crop irrigation areas; increasingly scarce groundwater; and use of unsuitable irrigation methods. The high rate of population growth in the region is also compounding ecological destruction (http://www.gs.xinhuanet.com/shiyanghe/). Against a backdrop of broader natural vegetation destruction and desertification, the already delicate ecological environment has deteriorated sharply, presenting a serious threat to food supplies, water security, public health, natural resources and biodiversity. Given its exemplary position and ecological fragility, information on local livelihood activities in the Shiyang River Basin offers the potential to reveal useful coping mechanisms and strategies that may be applied more broadly and to a variety of risks.
2.2. Methodological Approach
To evaluate the relationship between livelihood risk on livelihood capital, we employ an index system of livelihood capital comprising five aspects (human, physical, natural, financial, and social capitals) and embracing twenty specific indicators (see Table 2). These are brought together through a sustainable livelihood framework with an “index system of livelihood risk”. This comprises five aspects (health, environmental, financial, social, and information and connectivity risk) made up of 26 specific indicators (see Table 3). These correspond to different types of livelihood capital (see Table 1) and are informed by Shiyang’s existing regional conditions. Every risk/capital variable is explored through questions in our survey of household heads. The entropy method is used to evaluate the relative weights of different livelihood risk/capital variables. Finally, we apply five multiple linear regression models to evaluate quantitatively the relationship between different livelihood risks and livelihood capital.
2.2.1. Description of Method
The aim of the fieldwork was to measure and analyse the relationship between farmers’ livelihood risks and livelihood capitals. To begin, information about local environment, economy and community conditions was collected from various relevant government departments at county-level and towns. These included the Bureau of Human Resources and Department of Social Affairs and the Office of Poverty Alleviation. This was followed by a large questionnaire survey conducted over the period June to August 2015 involving 483 farmer-heads of household in Jinchang City and Wuwei City (the latter including Minqin County, Gulang County, and Tianzhu County).
Households from across the Shiyang River Basin were selected through a stratified sampling approach intended to ensure that each individual was given equal opportunity to participate. Initially, 50% of the townships in each of the Basin’s different geographic sections (upstream, middle and the lower reaches) were selected for inclusion in the study and from these 1.5% of households in each township were sampled randomly.
The team conducting the survey consisted of ten groups each made up of five members. Investigators were familiar with the local area and some originated from there. All were given research training before the formal investigation commenced. The language used throughout the entire survey was Chinese (local dialect).
Investigators explained the questions and recorded responses. Questions were formulated on the basis of pre-survey interviews involving village cadres and some farmers and centred on exploration of livelihood capitals and risks. Of the 500 participants interviewed in our survey, 483 were completed, yielding a response rate of 96.6%. The geographical distribution of the participating households is shown below:
- Wuwei City: a total of 336 households (116 from Minqin County, 154 from Gulang County, and 66 from Tianzhu County); and
- Jinchang City (Yongchang County): 147 households.
Women accounted for 30% of the total participants, however our analysis found no specific gender differentials in livelihood risk.
2.2.2. Index System on Livelihood Capital
An indicators system for livelihood capital developed by the UK’s DFID (Department for International Development) has been utilized by a number of scholars in their research (for example see [38,39,40]). The final set of indicators considered for analysis in this research embraces the DFID framework as presented in Table 2. However, indicators for each type of capital have also been informed and selected with reference to the on-ground context of livelihood conditions in the Shiyang River Basin as described in relevant literature [34,35,36,37] and as observed by the investigating team.
With respect to human capital, in addition to the common indicator “age and education level”, we also include “health status” as an important gauge of livelihood development.
Capital variables were measured using a mixture of nominal and ordinal scales depending on the characteristics of the variable being considered. For example, in recognition of different village sizes, answer options to the question “How many people in your village do you trust?” ranged from “very few” to “almost all”. For the question, “Last year, did you borrow money from a bank or credit union?”, options were “yes” and “no”.
For physical capital, we have selected commonly used indicators, namely “household fixed assets” (number of permanent assets) and “housing quality”, together with “number of livestock”. “Agricultural acreage” is used as a marker of natural capital. As “agricultural acreage” is the only indicator for natural capital (compared with the diversity of indicators used to show other capitals), treating this capital separately in the analysis could result in a disproportionate estimation of its contribution to livelihood capital. For this reason, physical capital and natural capital variables have been combined. Some characteristics related to natural capital such as quality of soil, access to irrigation, topography, climate, ecosystem services, forests, and wildlife, might have been included in natural capital. However, not only are these very difficult to include as workable measures for natural capital, but they are also very similar for each of the farmers in our survey and unlikely to contribute to differences in farmers’ livelihood capitals.
For financial capital, two core indicators are income and savings. To these, we have added credit status variables intended to indicate borrowings and receipt of donations, gifts or aid. The variables employed to assess these were: “whether to loan from a bank in the last year”; “whether to loan from relatives in the last year”; “whether contributions or donations were received in the last year”; and “whether government subsidies were received in the last year”.
In the case of social capital, we selected indicators such as “whether any family member is a representative in the village council” and “whether to put forward objection against community decisions” as means of assessing farmers’ right of speech. Behaviour and perceptions related to farmers’ participation in community-led cooperative organizations are additional key components of livelihood development. Through the existence of community-led cooperative organizations and participation in their activities, farmers may have enhanced opportunities to gain access to outside information and to communicate with other people. Consequently, they can improve and strengthen their community relationships. Therefore, we include “is there any spontaneous/economic cooperative organization in your village” and “whether to join the spontaneous/economic cooperative organizations” to support this point. Such organizations, including water user, grower, and aquaculture associations, have been established spontaneously by farmers with a democratic management system to help enhance the overall welfare of the farmers (e.g., by improving water efficiency; promoting advanced planting techniques). Interestingly these institutions are valued and popularized by all levels of government.
In addition, the three indicators “channels to accept help when they encounter livelihood difficulties”; “the number of people who you can trust within your administrative village”; and “the number of people who you can trust outside your administrative village” are included to assess farmers’ social relationships.
2.2.3. Index System on Livelihood Risk
The types, degree, range and frequency of livelihood risk, and how they influence livelihood are analysed in this paper through an assessment system that explores risk for five different livelihood capitals as set out in Table 1. Based on the UNISDR definition of livelihood risk discussed earlier and Shiyang’s existing regional conditions discussed above (study context) we have identified a number of risk variables to describe the attributes of livelihood risk. The risk variables are elements in each of the five major categories set out in Table 3. Each risk variable comprises several indicators. The indicators have been devised here on the basis of a review of the literature on each major component (see, for example, [10,11,41,42,43,44]).
In acknowledgement of the considerable variation in household circumstances and physical context across the study area, risk variables were measured using ordinal scales predominantly, with respondents asked to indicate the extent to which they regard the severity of risk. For example, the environmental risk related to extreme weather was assessed using a 1–5 ordinal scale, with larger values indicating higher degree of severity. Similarly, losses related to improper selection of crop species were assessed on a scale ranging from tremendously large to very small.
2.2.4. The Calculation of Livelihood Capital and Livelihood Risk
To measure the contribution of different variables in the livelihood capital index system described in Table 2 and livelihood risk index system described in Table 3, a statistical weight for each capital factor and each risk factor was calculated using the entropy method. The entropy method for assessment has been studied and put into practice extensively in recent years [45,46,47]. Use of the entropy method in measuring statistical weights makes evaluation of capital factors and risk factors more reliable and reasonable than other available methods [48,49,50]. The method was first applied to the study of thermodynamics, before being introduced to information theory by Shannon (1948) [51]. Nowadays, it is used widely in other fields that include engineering, economics, and finance [52,53,54,55].
The entropy method is a way of determining variable weight objectively. When the value difference between different components on the indicator being evaluated is high, while the entropy [i.e., level of systemic disorganization] is small, it indicates that this component is more important and hence attracts greater weight. On the other hand, if the difference is smaller and the entropy is higher, the relative weight would be smaller [56]. For example, if in an equitable health care structure (i.e., low entropy), the health status differences between households is high, then health status may be regarded as an important component of health risk in our livelihood risk index. Components being evaluated attract a weight between 0 and 1, and the sum of all components cannot exceed 1.
The following steps were followed in measuring the weights and calculating the comprehensive index value of each risk factor or each capital factor in our study.
Step 1: Construction of an original evaluation matrix
Suppose there is a number, m, of risk factors (e.g., inadequate medical treatment and high medical expenses) in a specific risk category (e.g., health risk) or m, of capital factors (e.g., age and education) in a specific capital category (e.g., human capital), and n evaluating objects (i.e., households), then we can form an original indicators value matrix.
where “x” represents any risk factor or any capital factor.
By way of example, from Table 2, is health risk and it comprises six (i.e., m) risk factors for a total of 483 households (i.e., n). represents “resident health status” (the first of the six listed risk factors) of household number 1. Similarly, represents “unhealthy external environment” of household 1, etc. Thus, the first column in the equation above represents all of the risk factors in the Health Risk category for household 1.
Step 2: Standardization process
Normalizing this matrix to get Equation:
where is the data of the th evaluating object on the indicator .
Among these indicators, in which bigger—or greater—is generally understood to be better (e.g., income, education level), the normalizing equation is:
where smaller—or lesser—values are generally understood to be better (e.g., groundwater mineralization, crop pest prevalence), the normalizing equation is:
where , .
Thereby, forming normalized matrix R:
Step 3: The proportion of matrix F
For each , the proportion of the jth value in the ith indicator is:
If the value of each object is exactly identical at a certain evaluating indicator, the share of various evaluation object in the index are equal.
In that case, the proportion matrix F is:
Step 4: Calculating entropy matrix S
According to the formula:
Results matrix S:
With the number of indicators for number of evaluating objects, the entropy of ith indicator is defined as:
Step 5: Definition of the weight of entropy
The weight of entropy of ith indicator could be defined as:
In which, , .
Step 6: Definition of comprehensive index value
2.2.5. The Analysis of the Effect of Livelihood Risk on Livelihood Capital
To analyse effects of livelihood risk on livelihood capital, a multiple linear regression model is used in this study on the hypothesis that there exists a linear relationship between livelihood risks and livelihood capitals. Multiple regression analysis was conducted for each livelihood capital separately by taking livelihood risks as independent variables and different types of livelihood capitals as dependent variables. The reason for using this regression model is that it is simpler and more convenient when undertaking multivariate analysis [57]. Meanwhile, the degree of correlation among different variables and degree of fit can be measured accurately by this regression analysis [58]. The steps in multiple linear regression are explained below.
Step 1: Construction of a general model
If we denote the response variable by Y (e.g., one kind of livelihood capital) and the explanatory variables by X1, X2, …, Xk (e.g., different kinds of livelihood risk), then a general model relating these variables is:
Step 2: Brevity of a general model
For brevity, we usually drop the conditioning part and write E(Y). We direct our attention to an important class of linear models, which are linear in their parameters.
Step 3: Transform process
This restriction to linearity is not quite as restrictive as one might think. For example, many functions of several variables are approximately linear over sufficiently small regions, or they may be made linear by a suitable transformation. Using logarithms for the gravitational model, we get the straight line:
For the linear model, the could be functions of other variables , , etc. For example, , , and . We can also have , which leads to a polynomial model; the linearity refers to the parameters, not the variables. Note that “categorical” models can be included under our umbrella by using dummy (indicator) -variables. For example, suppose that we wish to compare the means of two populations, say,
Then, we can combine the data into the single model,
where when is a observation and when is a observation. Here, and , the difference being .
Step 4: Combination and establishment of model
We can extend this idea to the case of comparing m means using m − 1 dummy variables.
In a similar fashion, we can combine two straight lines,
Using a dummy variable which takes the value 0 if the observation is from the first line, and 1 otherwise, the combined model is,
Say, where , here , , and
3. Results and Discussion
3.1. Evaluation of Livelihood Risk
We have analysed every indicator weight and value for different variables. The results are shown in Table 4. We can see clearly that the calculated values differ significantly for each type of livelihood risk.
The statistical results shown in Table 4 accord with the lead author’s impressions of the field situation and also with official information derived from a Chinese Government website (see http://www.gs.xinhuanet.com/shiyanghe/). This Government website provides both qualitative and quantitative information on subjects including ecological environments, farmers’ livelihood and watershed management. During fieldwork, through their observations and conversations, the lead author and the team of investigators developed in-depth, informal knowledge of local conditions as well as the challenges to farmers’ livelihood capitals.
Based on the definition of each index, we calculated the statistical results of 30 variables related to five types of livelihood risk. The results illustrate that there is a significant difference in distribution for different types of livelihood risk. Moreover, there are significant differences in average index values for different sub-categories (variables) within each type of livelihood risk. Lack of income and financing difficulties are central problems for households seeking to sustain their livelihoods. Relatively limited social resources have become an obstacle to obtaining opportunities to cope with external environment. When facing livelihood risk, farmers find it difficult to get help from social associations, neighbours and friends.
3.2. Evaluation of livelihood capitals
We have analysed the indicator weight and capital value of different variables associated with livelihood capitals. The results are shown in Table 5. The values of estimated weights show a wide variation.
Based on the definition of each index, we calculated the statistical results of 20 variables related to five types of livelihood capitals. As shown in Table 5, there are obvious differences in average capital values for different variables within each type of livelihood capital as well as in the total values. The results illustrate that human capital is strongest (with an index value of 0.399) for farmers in the survey area. On the other hand, our results indicate the presence of very weak physical and natural capital (index value 0.116) along with weak social capital (index value 0.139). Interestingly, financial capital appears to be almost as strong as human capital (index value 0.391).
3.3. Effect of Livelihood Risk on Livelihood Capitals
The research evaluates the effect of livelihood risk on livelihood capitals by use of a multiple linear regression model that takes livelihood capitals as the dependent variable and indicators of five kinds of livelihood risk as independent variables. As stated earlier, the multiple regression analysis was conducted for each livelihood capital separately. Distance between residence of household and town centre is used as control variable, given that physical location affects the capital endowments of farmers.
Our results (Table 6) demonstrate that the associations between human capital and health risk, and environmental risk and financial risk are significant (with 1% confidence level for health and environmental risk and 10% confidence level for financial risk). However, the most interesting observation is the significant positive association among environmental risk, information and connectivity risk and human capital.
A possible explanation for this is that, to cope with a vulnerable or hazardous natural environment and limited information sources, local households are conscious to improve their human capital—especially related to health and education which account for a larger weight. To that end, farmers give heightened attention to family care, health investment, disease prevention and active treatment of disease. They tend to accept health care information willingly, engage in healthy lifestyles including letting children receive vaccinations, undergo early medical examinations to identify physical conditions, and seek medical advice from nearby clinics instead of self-medicating. They participate actively in the New Rural Co-operative Medical System (NRCMS), a rural medical insurance system promoted by the Chinese government. Through our fieldwork, we found that farmers who live in a vulnerable or hazardous natural environment strive to enhance their capital stock. They aspire to see their children equipped to leave the region, if they so desire, through their own efforts. By comparison with farmers in more equable natural environments, farmers in riskier natural environments tend to pay more attention to sending their children to school and encouraging academic success. Hence poorer areas with a hazardous environment and barren resources tend to be associated with higher college entrance examination scores.
Human capital decreases with increasing financial risk. In general, the greater the financial risk, the more difficult it is for farmers to sustain their livelihood effectively. Farmers with insufficient funds or few convenient channels through which to obtain funds, tend to be of relatively weaker health status and lower education level.
As shown in Table 6, a particularly close relationship exists between physical capital (with natural capital) with health risk as well as social risk. The result shows that the physical capital (with natural capital) decreases with growing health risk. The reason is likely to be that farmers with high health risks would not have sufficient ability to take compensatory advantage of natural and physical resources such as number of livestock and so therefore the relationship is negative.
A very interesting and unexpected finding is that physical capital (with natural capital) increases with increasing social risk. That is, it appears that farmers with weaker social resources and relationships seek to enhance their access to natural and physical capitals so as to mitigate against livelihood risks. Thus, more natural and physical resources are used as a stock of assets to cope with livelihood risk. For example, farmers in Shiyang River Basin usually develop natural and physical capitals (especially related to the number of livestock which accounts for larger variable weight) to cope with livelihood difficulties. Farmers with weaker social relationships tend to increase the number of livestock they have in case of need. When they encounter difficulties, and cannot secure help through social relationships, they tend to sell their livestock.
The distance between household and town centre is also negatively associated with physical capital (with natural capital). Households further from a town centre appear to have less physical capital (with natural capital) whereas farmers living near the centre have access to convenient transport conditions as well as good infrastructure which together contribute to higher value physical capital. Our results and field observations suggest this apparently paradoxical negative association between distance and physical capital is a by-product of the spatial distribution of local populations and other geographical disadvantages. Our research area is an inland river basin where the population is distributed mainly along the watercourse, with the periphery areas largely being desert areas. Thus, with distance from the river, populations and capital decline.
As Table 6 reveals, a particularly close relationship exists between financial capital and environmental and social risk. With regard to the relationship between livelihood risk and financial capital, financial capital is shown to increase with increasing environmental risk. As a result of their exposure to environmental risk, farmers in Shiyang River Basin tend to seek other work to earn more income, which results in increased total income. As precautionary measures against environmental risk, farmers seek to reduce costs and increase savings.
Financial capital decreases with increasing social risk. The increase of social risk is reflective of weaker social relationships and a lower employment ratio. When farmers are facing livelihood risks, it appears to be difficult for them to get help through their social relationships and to obtain jobs from the limited options available. Therefore, relatively higher social risk indicates that farmers do not have sufficient channels to obtain the greater income stream and this yields lower financial capital. This is interesting: farmers confronting increasing social risk seek to improve their physical and natural capital; yet, at the same time, their financial capital falls. That is, when facing social risk farmers tend to invest financial capital in ways intended to improve their physical and natural capital.
Distance of household from town centre is negatively associated with financial capital. The farther away from the town centre residents live, the lower their financial capital, whereas those farmers living close to the town centre have access to good market information as well as to better infrastructure, which together combine to contribute to higher financial capital.
There is also a close relationship between social risk and social capital, with social capital related negatively with increasing social risk. Higher levels of social risk reflect weaker social relationships. When they encounter difficulties, farmers’ friends and relatives appear to play only a small role in resolving matters. Moreover, there are few local collective social associations that can offer support and assistance. The number of people who farmers can trust and rely on is limited, and this leads to lower social capital values. There may be some cultural and social norms attached to such low community vitality, but exploration of that was beyond the scope of this study.
Household distance from the town centre is also negatively associated to social capital. Farmers living close to a town centre have better access to opportunities to join spontaneous/economic cooperative organizations (accounts for a larger weight in social capital) than their more remote counterparts.
Table 6 includes a summary of relationships between different livelihood risks and total livelihood capital. Total livelihood capital is measured by summing the values of human capital, physical and natural capital, financial capital, and social capital, and assumes the same weight for each. It is evident that health and social risks have statistically significant negative relationships with total livelihood capital, suggesting therefore that total livelihood capital declines with increases in health or social risk and vice versa. In-depth analysis of the influence of social risk on total livelihood capital yields some very interesting results. As noted earlier, social risk has a statistically significant “negative” relationship with financial and social capital, while there is no statistically significant relationship between social risk and human capital. Moreover, social risk has a statistically strong “positive” relationship with physical (combined with natural) capital. Hence, the statistically significant negative impact of social risk on total capital (which is a combination of human, physical/natural, financial and social capital with equal statistical weight to each capital) implies that, although increases in social risk are actually associated with improvements in farmers’ physical capital, concomitant declines in financial and social capital tend to overwhelm that benefit.
Household distance from the town centre is negatively associated with total livelihood capital. Farmers more distant from town have lower total livelihood capital. Farmers living close to town centres have access to convenient channels to obtain market information, better infrastructure conditions as well as the improved social relationships which contribute strongly to enhanced livelihood capital.
4. Conclusions
Accurate assessment of livelihood risk and livelihood capital, quantitative evaluation of livelihood risk’s influence on livelihood capital in some representative regions (such as ecologically vulnerable area, high incidence area, and extreme poverty zone) is important to understand the issue of “livelihood risk” and helpful to provide relevant policies enhancing risk-coping capabilities of farmers faced by different types of livelihood risk.
The term “livelihood risk” has been the subject of growing and intensive conceptual and empirical research over the past 40 years. This paper contributes to that body of work by setting out a detailed statistical analysis of various dimension of livelihood risk and, importantly, by considering their potential significance for livelihood capitals of local farmers in China’s Shiyang River Basin. Different types of livelihood risk can be identified as regular challenges faced by rural households in Shiyang River Basin, although the effect of those different types of livelihood risks on livelihood capitals varies. Our work contributes broadly to sustainable development and more specifically to livelihood scholarship by evaluating quantitatively the effect of livelihood risk on livelihood capitals through a valuable Chinese case study. Our analysis suggests that health risk and social risk may have significant negative implications for livelihood capital, while other livelihood risks do not appear to have statistically significant relationships to livelihood capitals.
To secure or maintain sustainable livelihoods and therefore contribute to achievement of a range of the United Nations’ sustainable development goals [59], it is important to not only focus on reducing the possible occurrence of livelihood risk, but also to improve capacities to resist livelihood risk. However, these capacities depend on the strength of livelihood capitals. To fortify and improve livelihood capitals local government could extend greater support to rural farmers. For example, to resist health risk, government could provide suitable medical treatment and services, improve ways of paying for medical care, and perhaps develop risk-sharing mechanisms which offer a combination of government, community, and market approaches. Innovative rural cooperative medical organizations and rural community clinics could provide farmers with new health care options. Government could reduce the prospects of social risk by developing information platforms to provide agricultural market information, and optimizing the social security system to include measures such as endowment insurance and coverage for medical costs. Moreover, specialized associations or cooperatives might be established to strengthen farmers’ social capital and extend their social networks. These offer the potential to help secure social networks for rural households. Government could also further strengthen initiatives already being undertaken to improve the quality of rural financial services, reduce credit constraints on farmers, and provide farmers with financial support. Commercial insurance companies might be encouraged to enter the rural market to promote and support development of formal risk-coping mechanisms. Because the study area’s natural capital endowments are poorer than those of other areas, local government could usefully take active control of measures and provide subsidies intended to minimize the negative effects of environmental disasters. If measures such as ecological compensation mechanisms, water rights trading, and industrial structures transformed to minimize desertification and salinization could be shown to be successful here in the ecologically vulnerable Shiyang River Basin, they seem likely to find useful application in other parts of China, particularly its fragile inland river basins.
Acknowledgments
This study was funded by the National Natural Science Foundation of China (No. 41401653).
Author Contributions
Fang Su designed the research, and collected and analysed the data. All three authors wrote the paper jointly, and read and approved the final manuscript.
Conflicts of Interest
The authors declare no conflict of interest.
References
- Moser, C. The Asset Vulnerability Framework: Reassessing Urban Poverty Reduction Strategies. World Dev. 1998, 26, 1–19. [Google Scholar] [CrossRef]
- Delor, F.; Hubert, M. Revisiting the concept of ‘vulnerability’. Soc. Sci. Med. 2000, 50, 1557–1570. [Google Scholar] [CrossRef]
- Slovic, P.; Weber, E.U. Perception of Risk Posed by Extreme Events. Risk Manag. Strateg. Uncertain World 2002, 1–21. [Google Scholar] [CrossRef]
- Brauch, H.G. Threats, Challenges, Vulnerabilities and Risks in Environmental and Human Security; UNU-EHS: Bonn, Germany, 2005; pp. 457–471. ISBN 3981020057. [Google Scholar]
- Knutsson, O. A Process-Oriented Sustainable Livelihoods Approach—A Tool for Increased Understanding of Vulnerability, Adaptation and Resilience. Mitig. Adapt. Strateg. Glob. Chang. 2006, 12, 365–372. [Google Scholar] [CrossRef]
- Shahbaz, B. Risk, Vulnerability and Sustainable Livelihoods: Insights from Northwest Pakistan; Sustainable Development Policy Institute: Islamabad, Pakistan, 2008. [Google Scholar]
- Rakodi, C. A capital asset framework for analysis household livelihood strategies: Implications for policy. Dev. Policy Rev. 1999, 17, 315–342. [Google Scholar] [CrossRef]
- Ellis, F. Rural Livelihoods and Diversity in Developing Countries; Oxford University Press: Oxford, UK, 2000; pp. 115–128. ISBN 9780198296966. [Google Scholar]
- Vosti, S.A.; Reardon, T. Sustainability, growth, and poverty alleviation: A policy and agroecological perspective. Can. J. Agric. Econ./Rev. Can. Dagroecon. 2010, 47, 199–200. [Google Scholar] [CrossRef]
- Sebstad, J.; Cohen, M. Microfinance, Risk Management, and Poverty; Synthesis Report. Draft; USAID (United States Agency for International): Washington, DC, USA, 2000; pp. 89–97.
- Stephen, D. Livelihood Insecurity and Social Protection: A Re-emerging Issue in Rural Development. Dev. Policy Rev. 2001, 19, 507–519. [Google Scholar] [CrossRef]
- Chen, C. The Farmers’ Risk and Vulnerability: An Analysis Framework and the Lessons in the Poverty-Stricken Area. Issues in Agricultural Economy. 2005, 8, 47–50. [Google Scholar] [CrossRef]
- Giddens, A. Runaway World; Profile Books: London, UK, 1999; pp. 45–57. ISBN 1861974299. [Google Scholar]
- Soltani, A.; Angelsen, A. Poverty, sustainability, and household livelihood strategies in Zagros, Iran. Ecol. Econ. 2012, 79, 60–70. [Google Scholar] [CrossRef]
- Bebbington, A. Capitals and Capabilities: A Framework for Analyzing Peasant Viability, Rural Livelihoods and Poverty. World Dev. 1999, 27, 2021–2044. [Google Scholar] [CrossRef]
- DFID (Department for International Development). Sustainable Livelihoods Guidance Sheets; DFID: London, UK, 1999. Available online: www.ennonline.net/dfidsustainableliving (accessed on 20 December 2015).
- FAO (Food and Agriculture Organization). Rapid Guide for Missions: Analyzing Local Institution sand Livelihoods; FAO: Rome, Italy, 2005; pp. 15–32. ISBN 9789251054291. [Google Scholar]
- Kristjanson, P.; Radeny, M. A Livelihood mapping and poverty correlates at a mesolevel in Kenya. Food Policy 2005, 30, 568–583. [Google Scholar] [CrossRef]
- De Sherbinin, A.; VanWey, L. Rural household demographics, livelihoods and the environment. Glob. Environ. Chang. 2008, 18, 38–53. [Google Scholar] [CrossRef] [PubMed]
- Ansoms, A.; McKay, A. A quantitative analysis of poverty and livelihood pro-files: The case of rural Rwanda. Food Policy 2010, 35, 584–598. [Google Scholar] [CrossRef]
- Erenstein, O.; Hellin, J. Poverty mapping based on livelihood assets: A meso-level application in the Indo-Gangetic Plains, India. Appl. Geogr. 2010, 30, 112–125. [Google Scholar] [CrossRef]
- Kareithi, J.N. Declining social capital and vulnerability to livelihood risks in Turkana district. Kenya 2010, 11, 33–46. [Google Scholar]
- Chi, W.F.; Xiu-Ying, X.U. Analysis on the Impact of Livelihood Capital to the Serious Illness Risk of Forest Farmer. Issues For. Econ. 2014, 34, 492–497. [Google Scholar] [CrossRef]
- Frankenberger, T.R.; Drinkwater, M.; Maxwell, D. Operationalizing household livelihood security; CARE International: Geneva, Switzerland, 2000; pp. 35–56. [Google Scholar]
- Krantz, L. The sustainable livelihood approach to poverty reduction: An Introduction. IEEE Trans. Ultrason. Ferroelectr. Freq. Control 2001, 49, 39–46. [Google Scholar]
- Chambers, R. Poverty and livelihoods: Whose reality counts? Environ. Urban. 1995, 7, 173–204. [Google Scholar] [CrossRef]
- Chambers, R. Sustainable Rural Livelihoods: Practical CONCEPTs for the 21st Century; IDS Discussion Paper; Institute of Development Studies: East Sussex, UK, 1992; pp. 1–33. ISBN 0903715589. [Google Scholar]
- Van Dijk, T. Livelihoods, capitals and livelihood trajectories: A more sociological conceptualization. Prog. Dev. Stud. 2011, 11, 101–117. [Google Scholar] [CrossRef]
- Israr, M.; Khan, H. Availability and access to capitals of rural households in northern Pakistan. Sarhad J. Agric. 2010, 26, 443–450. [Google Scholar]
- Zhao, X.Y. The farmers’ livelihood risk and their coping strategy in the downstream of Shiyang River: A case of Minqin Oasis. Geogr. Res. 2015, 34, 922–932. [Google Scholar] [CrossRef]
- Odero, K. Information Capital: 6th Asset of Sustainable Livelihood Framework. Discov. Innov. 2006, 18, 83–91. [Google Scholar] [CrossRef]
- Chapman, R.; Slaymaker, T. Livelihoods Approaches to Information and Communication in Support of Rural Poverty Elimination and Food Security; Research & Policy in Development Odi; Overseas Development Institute: London, UK, 2003; pp. 53–68. ISBN 0850036879. [Google Scholar]
- Mohapatra, B.; Suar, D. Technological Capital and Sustainable Livelihood—Does Technological Capital of Watershed Influence Sustainable Livelihood? Int. J. Rural Manag. 2008, 4, 213–236. [Google Scholar] [CrossRef]
- Zhang, Q. Impacts of Climate change on farmers’ livelihood capital in the Shiyang river basin of China. J. Desert Res. 2016, 36, 814–822. [Google Scholar] [CrossRef]
- Gao, J.F. Evaluation on ecological security in Shiyanghe river Valley, Gansu. For. Resour. Manag. 2009, 2, 65–69. [Google Scholar] [CrossRef]
- Ye, D.M. Coordinated development between agricultural economy and ecological environment in Shiyang River. Arid Land Geogr. 2013, 36, 76–83. [Google Scholar] [CrossRef]
- Jin, S.T. Discussion on Scientific Issues of Eco-compensation Standard in Shiyang River Basin. J. Nat. Resour. 2005, 2I9, 610–622. [Google Scholar] [CrossRef]
- Hendricks, R. Contribution towards the work of UNFF and to the international initiatives on criteria and indicators related to sustainable development. In Proceedings of the International Conference on Criteria and Indicators for Sustainable Forest Management: The Way Forward (CICI), Guatemala City, Guatemala, 3–7 February 2003. [Google Scholar]
- Mcdonalda, G.T.; Laneb, M.B. Converging global indicators for sustainable forest management. For. Policy Econ. 2004, 6, 63–70. [Google Scholar] [CrossRef]
- Don, W. Criteria and indicators for sustainable forest management: The road travelled and the way ahead. Ecol. Indic. 2008, 8, 115–122. [Google Scholar] [CrossRef]
- Zhang, Y.Y. On the source of the forward-security of farmers' livelihood based on the risk diagnose of their livelihood in coordinated urban and rural development: A case study of Longquan village. J. Southwest China Norm. Univ. 2013, 38, 112–120. [Google Scholar] [CrossRef]
- Vatsa, K.S. Risk, vulnerability, and asset-based approach to disaster risk management. Int. J. Sociol. Soc. Policy 2004, 24, 1–48. [Google Scholar] [CrossRef]
- Hahn, M.B.; Riederer, A.M. The Livelihood Vulnerability Index: A pragmatic approach to assessing risks from climate variability and change—A case study in Mozambique. Glob. Environ. Chang. 2009, 19, 74–88. [Google Scholar] [CrossRef]
- Xu, H.S. Livelihood capital, livelihood risk and livelihood strategies for farmers. Issues Agric. Econ. 2012, 10, 100–106. [Google Scholar] [CrossRef]
- Guo, C.Z. Study on the evaluating method of entropy coefficient for stock investment value. Nankai Econ. Stud. 2001, 5, 65–67. [Google Scholar] [CrossRef]
- Cheng, T.; Zhang, C.X. Application of fuzzy AHP based on entropy weight to site selection of solid sanitary landfill. Environ. Sanit. Eng. 2003, 12, 64–67. [Google Scholar]
- Tian, Q.H.; Du, Y.X. Study of performance evaluation for mechanical products based on entropy fuzzy comprehensive review. China Manuf. Inform. 2004, 33, 97–99. [Google Scholar]
- Zhao, D.Y.; Song, H. A method of ameliorative multi objective synthetic evaluation based on entropy weight and its application. J. Ordnance Eng. Coll. 2001, 13, 47–51. [Google Scholar]
- Fang, D.C.; Liu, G.L. The application of information entropy in investment decision. Value Eng. 2004, 2, 115–117. [Google Scholar] [CrossRef]
- Li, X.H.; Li, Y.M. Competitive situation analysis of regional logistics development based on AHP and entropy weight. J. Southeast Univ. 2004, 34, 398–401. [Google Scholar]
- Shannon, C.E. A mathematical theory of communications. Bell Syst. Techn. J. 1948, 27. [Google Scholar] [CrossRef]
- Tang, R.L.; Guo, C.Z. An optimization model with entropic coefficients for management in irrigation water resources. J. Hohai Univ. 2000, 28, 18–21. [Google Scholar]
- Lin, Y.D.; Men, B.H. Application of entropy coefficient method to evaluating on alimentative type of water. Northwest Water Resour. Water Eng. 2003, 13, 27–28. [Google Scholar]
- Zhou, M.H. The research about method of sustainable consumption system measure. Syst. Eng. Theory Pract. 2003, 12, 25–31. [Google Scholar]
- Xu, S.Q.; Hu, Z.G. Multi-objective decision analysis of diversion standards based on entropy. China Rural Water Hydropower 2004, 8, 45–47. [Google Scholar]
- Qiu, L.P. A Research on fuzzy composite appraisal of various biologic indexes. J. Harbin Univ. Civ. Eng. Archit. 2003, 33, 50–54. [Google Scholar]
- Kutner, M.H.; Nachtsheim, C. Applied Linear Regression Models; McGraw-Hill/Irwin: New York, NY, USA, 2004; pp. 56–69. ISBN 9780071115193. [Google Scholar]
- Montgomery, D.C.; Peck, E.A. Introduction to Linear Regression Analysis; John Wiley & Sons: Hoboken, NJ, USA, 1982; pp. 76–87. ISBN 0-471-05850-5. [Google Scholar]
- United Nations Sustainable Development Goals 2015. Available online: http://www.un.org/sustainable development/sustainable-development-goals/ (accessed on 1 February 2018).
Figure 1.
Location of the Shiyang River Basin, China. (Source: Landsat Image (ETM) Available at: https://www.usgs.gov/).
Figure 1.
Location of the Shiyang River Basin, China. (Source: Landsat Image (ETM) Available at: https://www.usgs.gov/).

Table 1.
Relationships between Livelihood Risk and Different Types of Livelihood Capitals.
| Types of Livelihood Capitals | Definition | Corresponding Livelihood Risks |
|---|---|---|
| Human Capital | Personal development ability, including education level, technical competence, and health status | Health Risk |
| Natural Capital | As the basis of human survival, environmental conditions in which farmers engaged in agricultural productive activities are including soil quality, shortage of water resources. | Environmental Risk |
| Financial Capital | The money which is used for purchasing productive materials or consumer goods, including personal credit. | Financial Risk |
| Physical Capital | Assets which are used in economic production process, such as some agricultural machinery. | |
| Social Capital | Social network which is formed by people who have common interest, generally it can be understood as trust, cooperation, participation in various associations. | Social Risk |
| Information Capital | Access to data information required for people to make decisions in pursuit of their livelihood objectives. | Information and Connectivity Risk |
Table 2.
Livelihood capital index system for farmers.
| Livelihood Capital | Variables |
|---|---|
| Human Capital | Age |
| Education level | |
| Health status | |
| Physical Capital and Natural Capital | Number of livestock |
| Number of permanent assets | |
| Housing quality | |
| Agricultural acreage | |
| Financial Capital | Total income in the last year |
| Total savings | |
| Whether to loan from a bank in the last year | |
| Whether to loan from relatives in the last year | |
| Whether contributions or donations were received in the last year | |
| Whether government subsidies were received in the last year | |
| Social Capital | Whether any family member is a representative in the village council |
| Whether to put forward objection against community decisions | |
| Is there any spontaneous/economic cooperative organization in your village | |
| Whether to join the spontaneous/economic cooperative organizations | |
| Channels to accept help when they encounter livelihood difficulties | |
| The number of people who you can trust within your administrative village | |
| The number of people who you can trust outside your administrative village |
Table 3.
Livelihood risk index system for farmers.
| Risk Categories | Risk Variables | Indicators of Risk Variables |
|---|---|---|
| Health Risk | Residents’ health status | Common diseases, genetic diseases, serious illness |
| Unhealthy external environment | Cattle plague, dysentery, industrial pollution | |
| Inadequate medical treatment | Exercise facilities, medical appliances, ratio which represents family members who need medical care | |
| Care for elderly people | Number of people required to provide care | |
| High medical expenses | Medical costs | |
| High educational expenses | Educational costs | |
| Environmental Risk | Extreme weather | Frost, rain, dust storm |
| Geological disasters | Landslides, mudslides, earthquake, Precipitation anomalies in irrigated agricultural area | |
| Crop pest prevalence | Impact of pests on daily life and production | |
| Desertification or Salinization | Soil erosion | |
| Groundwater quality mineralization | Mineralization | |
| Destruction of vegetation, deforestation | Destruction of vegetation | |
| Lack of water resources | Water resources scarcity | |
| Financial Risk | Agricultural product price stability | Fluctuating prices of farming goods |
| Fake agricultural products | Purchasing fake agricultural products (e.g., fake seeds or fertilizer) | |
| Input price rise | Degree of business lost due to lack of funds (e.g., price of fertilizer) | |
| Business strategy mistakes | Loss as a result of business strategy mistakes (e.g., losses due to poor crop species selection) | |
| Magnitude of local credit | Limited access to adequate loans | |
| Access to local credit | Difficulty securing credit financing | |
| Social Risk | Inadequate mutual association support | Absence of collective associations (e.g., growers’ associations) |
| Depth of social relations | Relationships with friends and neighbours | |
| Support from friends and family in difficult times | Ability of farmers to obtain help | |
| Employment opportunities for family members | Family members’ paid employment status | |
| Strength of social security | Condition of social security | |
| Information and Connectivity Risk | Appropriate infrastructure | Available agricultural infrastructure |
| Lack of agricultural information | Access to adequate agricultural information (e.g., seeds, fertilizers, animal breeding, feed, services, markets) |
Table 4.
Estimated livelihood risk variable weights and values.
| Livelihood Risk | Variables | Indicator Weight | Risk Value | Total Value | |
|---|---|---|---|---|---|
| Health Risk | Residents’ health status | 0.178 | 0.0185 | 0.1182 | |
| Unhealthy external environment | 0.289 | 0.0278 | |||
| Inadequate medical treatment | 0.170 | 0.0296 | |||
| Care for elderly people | 0.183 | 0.0381 | |||
| High medical expenses | 0.012 | 0.0003 | |||
| High educational expenses | 0.168 | 0.0040 | |||
| Environmental Risk | Extreme weather | 0.081 | 0.0031 | 0.1901 | |
| Geological disasters | 0.191 | 0.0001 | |||
| Crop pest prevalence | 0.144 | 0.0006 | |||
| Desertification or salinization | 0.152 | 0.0028 | |||
| Groundwater quality mineralization | 0.184 | 0.0051 | |||
| Lack of water resources | 0.141 | 0.0042 | |||
| Destruction of vegetation, deforestation | 0.107 | 0.0126 | |||
| Financial Risk | Agricultural product price stability | 0.266 | 0.0002 | 0.5023 | |
| Fake agricultural products | 0.317 | 0.0009 | |||
| Input price rise | 0.112 | 0.0006 | |||
| Business strategy mistakes | 0.256 | 0.0011 | |||
| Availability of local credit | 0.034 | 0.0004 | |||
| Access to local credit | 0.014 | 0.0026 | |||
| Social Risk | Absence of collective associations | 0.170 | 0.0002 | 0.3767 | |
| Relationships with neighbours and friends | 0.380 | 0.0004 | |||
| Support from friends and family in difficult times | 0.223 | 0.0002 | |||
| Employment status of family members | 0.115 | 0.0003 | |||
| Strength of social security | 0.113 | 0.0565 | |||
| Information and Connectivity Risk | Available infrastructure | 0.224 | 0.1123 | 0.2144 | |
| Access to adequate information about seeds, fertilizes | 0.084 | 0.0000 | |||
| Access to adequate information about animal breeding | 0.201 | 0.0001 | |||
| Access to adequate information about animal feed | 0.168 | 0.0000 | |||
| Access to adequate information about agricultural services | 0.179 | 0.0001 | |||
| Access to adequate information about agricultural markets | 0.144 | 0.0082 | |||
Table 5.
Estimated livelihood capital variable weights and values.
| Livelihood Capital | Variables | Indicator Weight | Capital Value | Total Value | |
|---|---|---|---|---|---|
| Human Capital | C1 | Age | 0.012 | 0.535 | 0.399 |
| Education level | 0.346 | 0.328 | |||
| Health status | 0.642 | 0.435 | |||
| Physical Capital and Natural Capital | C2 | The number of livestock | 0.581 | 0.128 | 0.116 |
| The number of household and farming goods (e.g., oven, tractor, television) | 0.036 | 0.443 | |||
| Housing quality | 0.084 | 0.144 | |||
| Agricultural acreage | 0.299 | 0.047 | |||
| Financial Capital | C3 | Total income in the last year | 0.001 | 0.026 | 0.391 |
| Total savings | 0.085 | 0.035 | |||
| Whether money was borrowed from a bank or credit union in the last year | 0.301 | 0.632 | |||
| Whether money was borrowed from relatives in the last year | 0.097 | 0.763 | |||
| Whether contributions or donations were received in the last year | 0.365 | 0.110 | |||
| Whether government subsidies were received in the last year | 0.151 | 0.631 | |||
| Social Capital | C4 | Whether or not to be a village representative in the family member | 0.250 | 0.189 | 0.139 |
| Whether or not to objection to community decisions | 0.070 | 0.446 | |||
| Is there any spontaneous/economic cooperative organization in your village | 0.296 | 0.040 | |||
| Whether to join the spontaneous/economic cooperative organizations | 0.300 | 0.028 | |||
| Channels to accept help when they encounter livelihood difficulties | 0.024 | 0.346 | |||
| People you feel you can trust within your administrative village | 0.034 | 0.570 | |||
| People you feel you can trust outside your administrative village | 0.027 | 0.468 | |||
Table 6.
Relationship between livelihood risk and livelihood capital.
| Livelihood Risk Category | Human Capital | |||||
|---|---|---|---|---|---|---|
| Health | −0.2594 *** | −0.1880 *** | ||||
| (−2.66) | (−2.61) | |||||
| Environmental | 0.3579 *** | 0.3395 *** | ||||
| (−5.04) | (−4.53) | |||||
| Financial | −0.0777 * | −0.0439 * | ||||
| (−1.82) | (−1.72) | |||||
| Social | 0.0976 | 0.1126 | ||||
| −1.07 | −1.27 | |||||
| Information and Connectivity Risk | 0.0918 ** | 0.1710 ** | ||||
| −1.98 | −2.5 | |||||
| Distance (Control Variable) | 0.0015 | 0.0084 | 0.006 | 0.005 | 0.0104 | 0.0054 |
| −0.04 | −0.24 | −0.17 | −0.14 | −0.29 | −0.16 | |
| Constant | 0.4822 *** | 0.5153 *** | 0.4878 *** | 0.4127 *** | 0.4265 *** | 0.4789 *** |
| −16.45 | −18.99 | −14.96 | −10.1 | −14.85 | −10.05 | |
| Physical capital | ||||||
| Health | −0.1523 *** | −0.1634 *** | ||||
| (−2.66) | (−2.63) | |||||
| Environmental | −0.0352 | −0.0146 | ||||
| (−1.06) | (−0.42) | |||||
| Financial | −0.008 | −0.0007 | ||||
| (−0.41) | (−0.04) | |||||
| Social | 0.0782 * | 0.0835 * | ||||
| −1.88 | −1.92 | |||||
| Information and Connectivity Risk | −0.0046 | 0.0221 | ||||
| (−0.15) | −0.69 | |||||
| Distance (Control Variable) | −0.0514 *** | −0.0477 *** | −0.0479 *** | −0.0499 *** | −0.0479 *** | −0.0531 *** |
| (−3.17) | (−2.94) | (−2.95) | (−3.07) | (−2.95) | (−3.28) | |
| Constant | 0.1884 *** | 0.1749 *** | 0.1723 *** | 0.1400 *** | 0.1693 *** | 0.1577 *** |
| −14.13 | −13.77 | −11.55 | −7.53 | −12.9 | −7.09 | |
| Financial capital | ||||||
| Health | −0.0362 | −0.0386 | ||||
| (−0.39) | (−0.38) | |||||
| Environmental | 0.0966 * | 0.1262 * | ||||
| −1.8 | −1.94 | |||||
| Financial | −0.0123 | −0.0218 | ||||
| (−0.39) | (−0.67) | |||||
| Social | −0.1974 *** | −0.2010 *** | ||||
| (−2.95) | (−3.01) | |||||
| Information and Connectivity Risk | −0.0645 | −0.0629 | ||||
| (−1.31) | (−1.22) | |||||
| Distance (Control Variable) | −0.0849 *** | −0.0843 *** | −0.0843 *** | −0.0788 *** | −0.0860 *** | −0.0823 *** |
| (−3.22) | (−3.22) | (−3.21) | (−3.02) | (−3.27) | (−3.14) | |
| Constant | 0.4466 *** | 0.4236 *** | 0.4482 *** | 0.5130 *** | 0.4569 *** | 0.5215 *** |
| −20.55 | −20.66 | −18.55 | −17.14 | −21.54 | −14.53 | |
| Social Capital | ||||||
| Health | 0.0432 | 0.0348 | ||||
| −0.59 | −0.44 | |||||
| Environmental | 0.022 | 0.0211 | ||||
| −0.52 | −0.47 | |||||
| Financial | −0.0011 | −0.0062 | ||||
| (−0.04) | (−0.24) | |||||
| Social | −0.1411 *** | −0.1444 *** | ||||
| (−2.67) | (−2.71) | |||||
| Information and Connectivity Risk | 0.0205 | 0.0171 | ||||
| −0.53 | −0.42 | |||||
| Distance (Control Variable) | −0.0677 *** | −0.0688 *** | −0.0687 *** | −0.0650 *** | −0.0681 *** | −0.0637 *** |
| (−3.25) | (−3.31) | (−3.31) | (−3.14) | (−3.27) | (−3.06) | |
| Constant | 0.1743 *** | 0.1759 *** | 0.1794 *** | 0.2309 *** | 0.1752 *** | 0.2227 *** |
| −10.15 | −10.82 | −9.39 | −9.75 | −10.44 | −7.79 | |
| Total livelihood capital | ||||||
| Health | −0.0814 *** | −0.0764 *** | ||||
| (−2.67) | (−2.71) | |||||
| Environmental | −0.0303 | −0.0121 | ||||
| (−0.95) | (−0.36) | |||||
| Financial | −0.0190 | −0.0172 | ||||
| (−1.01) | (−0.89) | |||||
| Social | −0.0804 ** | −0.0788 ** | ||||
| (−2.01) | (−1.97) | |||||
| Information and Connectivity Risk | 0.009 | 0.0209 | ||||
| −0.03 | −0.68 | |||||
| Distance (Control Variable) | −0.0675 *** | −0.0655 *** | −0.0660 *** | −0.0635 *** | −0.0656 *** | −0.0650 *** |
| (−4.32) | (−4.20) | (−4.23) | (−4.07) | (−4.19) | (−4.14) | |
| Constant | 0.3420 *** | 0.3370 *** | 0.3410 *** | 0.3603 *** | 0.3311 *** | 0.3760 *** |
| −26.54 | −27.59 | −23.78 | −20.16 | −26.22 | −17.49 | |
t statistics in parentheses * p < 0.1, ** p < 0.05, *** p < 0.01.
© 2018 by the authors. Licensee MDPI, Basel, Switzerland. This article is an open access article distributed under the terms and conditions of the Creative Commons Attribution (CC BY) license (http://creativecommons.org/licenses/by/4.0/).
Share and Cite
MDPI and ACS Style
SU, F.; SAIKIA, U.; HAY, I. Relationships between Livelihood Risks and Livelihood Capitals: A Case Study in Shiyang River Basin, China. Sustainability 2018, 10, 509. https://doi.org/10.3390/su10020509
AMA Style
SU F, SAIKIA U, HAY I. Relationships between Livelihood Risks and Livelihood Capitals: A Case Study in Shiyang River Basin, China. Sustainability. 2018; 10(2):509. https://doi.org/10.3390/su10020509
Chicago/Turabian StyleSU, Fang, Udoy SAIKIA, and Iain HAY. 2018. "Relationships between Livelihood Risks and Livelihood Capitals: A Case Study in Shiyang River Basin, China" Sustainability 10, no. 2: 509. https://doi.org/10.3390/su10020509
Note that from the first issue of 2016, this journal uses article numbers instead of page numbers. See further details here.