Identifying Factors Reinforcing Robotization: Interactive Forces of Employment, Working Hour and Wage

1
Department of Economics, Sungkyunkwan University, 25-2, Sungkyunkwan-ro, Jongno-gu, Seoul 03063, Korea
2
HRD Center, Sungkyunkwan University, 25-2, Sungkyunkwan-ro, Jongno-gu, Seoul 03063, Korea
*
Author to whom correspondence should be addressed.
Sustainability 2018, 10(2), 490; https://doi.org/10.3390/su10020490
Submission received: 3 January 2018
/
Revised: 9 February 2018
/
Accepted: 9 February 2018
/
Published: 12 February 2018
(This article belongs to the Special Issue The Impact of Technological Change on Employment, Skills and Earnings)
Abstract
:Unlike previous studies on robotization approaching the future based on the cutting-edge technologies and adopting a framework where robotization is considered as an exogenous variable, this study considers that robotization occurs endogenously and uses it as a dependent variable for an objective examination of the effect of robotization on the labor market. To this end, a robotization indicator is created based on the actual number of industrial robots currently deployed in workplaces, and a multiple regression analysis is performed using the robotization indicator and labor variables such as employment, working hours, and wage. The results using the multiple regression considering the triangular relationship of employment–working-hours–wages show that job destruction due to robotization is not too remarkable yet that use. Our results show the complementary relation between employment and robotization, but the substituting relation between working hour and robotization. The results also demonstrate the effects of union, the size of the company and the proportion of production workers and simple labor workers etc. These findings indicate that the degree of robotization may vary with many factors of the labor market. Limitations of this study and implications for future research are also discussed.
1. Introduction
One of the core technologies of the 4th Industrial Revolution, robotics are an essential and integral element of automation in most manufacturing sectors. These industries include the automotive industry and the ever-expanding field of semi-conductors. Between 2003 and 2010, the annual demand for industrial robots in manufacturing sectors increased from 81,000 units to 121,000 units, with a gradual, eventual, documented recorded growth rate of 6% worldwide. There then followed an accelerated increase until 2015, with an annual growth rate of 16% [1]. Amid such continuing rapid growth in the demand for industrial robots, however, concern is rising that robot-based innovation in industrial technology could result in widespread job loss despite the fact that robotic innovation would contribute to productivity enhancement. The 2016 World Economic Forum [2] also forecasts that the 4th Industrial Revolution will have a positive impact on the economy with improved productivity, while having a negative impact due to the increased unemployment worldwide. Frey and Osborne [3] imply that there is a possibility of job loss due to technological changes.
Studies on the relationship between the 4th Industrial Revolution and issues of employment and unemployment have, so far, approached the subject from the viewpoint of the substitution of technology for human endeavor. However, they fail to fully consider various economic and social factors that can enable labor-technology substitution. In many statistical analysis of potential labor-technology substitution, technological change is considered as an exogenous variable invoked to predict the number of jobs, or the types of job tasks, where human effort can be displaced by robots.
Certainly, a thorough examination is required about the extent of automation’s negative or positive effects in the labor market, and about how we should respond to those effects in the future. The attempt to predict the future based on current conditions and circumstances, or the attempt to come up with a long-term forecast largely based on worst-case scenarios may be inevitable at present. However, a gap certainly exists between the current circumstances and what we imagine to be the future circumstances. For instance, prediction of future outcomes focused on job loss may be overly dramatic if the changes in technology is discontinuous or technologies are less widely commercialized as shown in examples such as robots with AI or widespread robotization.
This study is a micro-level empirical analysis of the 4th Industrial Revolution and employment, and the following characteristics differentiate this study from previous studies. First, this study performs the first sophisticated empirical analysis of its kind using robotization indicator and labor variables such as employment, working hours and wages, instead of bundling various technologies into automation. This analysis, rather than using rhetoric on robotization, allows for an objective assessment of effect on robotization in the labor market at the current point. Korea is a country with rapidly spreading robotization, thus its robotization data tends to contain plenty of variations in variables which, in turn, prove invaluable for empirical analysis. According to the International Federation of Robotics (IFR) [1], Korea has the highest robot density in the world and records high level of automation that uses industrial robots. However, as indicated by the 2013 Organization for Economic Co-operation and Development (OECD) Employment Protection Legislation (EPL) [4], the Korean labor market is very rigid. Current circumstances in Korea (characterized by a notably high level of robotization and a rigid labor market) make widespread proliferation of industrial robotization highly likely in the future. The use of robotization indicator, which is created using the number of industrial robots currently deployed in workplaces, has the merit of identification of the direct relationship between employment and robotization even though it is currently difficult to find a dataset which can measure the level of robotization.
Second, whereas existing studies have examined the effect of labor variables such as employment on robotization within an analysis framework that views robotization to be exogenous, this study uses robotization as a dependent and integral variable which not an exogenous variable but an endogenously determined. This study attempts to identify and analyze those elements capable of facilitating or slowing the pace of robotization (when all other things are equal). For instance, labor unions may implement a dual strategy that might strategically obstruct managements’ robotization effort to safeguard the members’ employment stability, or advocates robotization of simple and manual tasks of non-regular workers for the company to have higher paying abilities. Failure to consider these variables and their potential effects can hinder our search for the actual relationships.
Third, this study considers the influence of working hour in combination, in addition to employment. Reduction of working hours may either lead to a decrease in employment by the scale effects, or result in the substitution effect of replacing labor with capital. By focusing on the interplay between employment, work hours and robotization, this study explores whether human workers and machines can successfully co-exist in the era of the technological change brought by robotization. Existing studies, due to their heavy focus on the relationship between robotization and employment, tend to overlook the hidden influences of omitted variables such as working hours, or explain the influence of employment variables with biases. This study aims to measure the net effects of employment and working hours, taking into account the relationship between employment and working hours.
Fourth, the decision about robotization hinges not only on technology but also on the associated costs and future profitability due to the job displacement, therefore, this study uses a labor cost variable in the analysis. In addition, simple regression analysis incorporating only employment without considering any other variables can inappropriately exaggerate the relationship between employment and robotization because the omitted variables degrade the accuracy of the final estimate. Therefore, we introduce a multiple regression analysis that takes into account the triangular relationship of employment–working-hours–wages and some other variables.
Section 2 surveys previous studies related robot and automation. Section 3 reviews the current status of robotization and the labor market in Korea. In Section 4, data and the method of analysis are introduced, the analysis results are explained. Section 5 concludes the study with a summary and policy implications.
2. Literature Review
The industry automation by robots is in a growing trend and there is an expectation that the robot-based technology would improve productivity. Nevertheless, there exists a concern that this innovation could result in a job loss. McKinsey Global Institute [5] predicts that robots and automation would make great contributions to productivity increase for firms and economy. However, an analysis of 800 occupations and 2000 tasks across 46 countries report that approximately 800 million individuals, which is about 60% of the workforce, would lose their jobs. Additionally, at least 400 million individuals, approximately 30% of workforce, will be seeking new employment by the year 2030. The 2016 World Economic Forum [2] also says that fifteen major developed nations including US, China, Japan, France, Germany would lose approximately 7.165 million jobs while creating a paltry 2.021 million new jobs during the period 2015 and 2020. The report also predicts that approximately 9% of current jobs will be lost to robots and other forms of automation by 2020. Goos, Manning, and Salomons [6] estimate a framework to explain job polarization using routine-biased technological change and offshoring. They concern that the employment structure by technological change has been polarizing with rising employment shares for high-paid professionals and managers as well as low-paid personal service workers and falling employment shares of manufacturing and routine office workers.
Frey and Osborne [3] estimate the probability of job loss due to technological changes with concrete figures. They use the O*NET’s 2010 data on 903 occupations and 2010 Employment and Wages data by the Bureau of Labor Statistics (BLS) in connection with the six-digit-data of Standard Occupational Classification System (SOC). They establish a dataset that can exhibit occupational characteristics of 702 jobs such as skills, employment, wages, and then conduct a survey seeking to determine whether those jobs can be automated, depending upon the job requirements. An analysis on the probability of computerization for each occupation in the next 10–20 years indicates that approximately 47% of the total US employment is at high risk, showing a computerization probability higher than 0.7. Approximately 19% of employment is at moderate risk of computerization where the probability is 0.3–0.7, while 33% is at low risk with the computerization probability less than 0.3. Their study not only statistically verifies the risk of labor-substitution due to automation, but also labor-substitution rates are high. Their study is considered to have sparked the interest in the relationship between automation and employment. A study conducted by Arntz, Gregory, and Zierahn [7] are similar to Frey and Osborne [3]’s study. The probability of automation is predicted using the Program for the International Assessment of Adult competencies (PIAAC) survey results of 21 OECD countries, and employing Frey and Osbourne [3]’s research method. The study estimates that only about 9% of jobs in OECD countries could be automated, strongly suggesting that Frey and Osbourne [3]’s results may be an overestimation. The two studies, however, are similar in that they both concern the probability of technology displacing labor.
Technological progress does not necessarily translate to labor-substitution. While it may be true that the number of jobs in occupations that can be automated may decline in the future, human labor can be redirected to other tasks that complement the work of the machines, or to tasks that are more complex and sophisticated in nature. In this way, automation may serve to create new jobs where humans can have competitive advantage over machines. Autor [8] says that the tasks in many current middle-skill jobs require at least years of education or training; therefore machines cannot perform many of the tasks currently. This study explains that many of the middle-skill workers have a comparative advantage in interpersonal interaction, flexibility, adaptability, and problem-solving. A review by Acemoglu and Restropo [9] studies the decline in employment driven by automation in a task-based framework. They hold the position that human labor has a comparative advantage over machines, although automation is an expansion of tasks by capital because humans are more capable of accomplishing sophisticated works.
The distribution of tasks is determined by the selection between capital and labor. Capital-friendly task distribution due to automation would reduce wages and national income, resulting in a decreased equilibrium wage in the end. Creation of new jobs increases total demand which in turn would contribute to economic growth. In general, a new technology could boost the productivity for firms, resulting in improved competitiveness of firms. The increase in labor productivity leads to higher wages and employment, which in turn raises labor income. Workers with higher income demand more goods and services, and again, this can increase the demand for labor [10,11]. McKinsey Global Institute [12] analyzes the correlation between automation and employment while taking into account various factors other than the probability of technology substitution. The analysis finds that 60% of occupations can potentially be automated in 2025–2052, while the technologies can actually be adopted for 50% of the occupations in 2035–2070. In other words, even if we could see technical automation potential in early stages, a substantial period of time would be required for the technologies to be adapted in workplaces due to accompanying economic costs. The report, in particular, forecasts that automation would boost productivity of Korea, considering that the workforce of the country is steadily aging.
Advanced technology has increased the economy’s productive capacity. In the 19th and 20th centuries, as automation eliminated jobs and occupations, firms identified new opportunities where labor could be redeployed, and workers learned the necessary new skills [13]. Piva and Vivarelli [14] estimate the relationship between employment and innovation investments including sales and wages as variables. They show the job-creating impact of innovation investments which links with sales and wages. Autor, Katz, and Krueger [15] analyze the effect of skill-biased technological change by computerization on the recent widening of the U. S. educational wage differentials. They explain that the industries using computers well have upgraded skill more rapidly, and the demand for college graduates has been higher in the skill-upgraded industries. Piva and Vivarelli [16] tested the role of skill endowment in increasing a firm’s research and development (R&D) investment. They found that both the demand-pull and technology-push effects are highly significant. This indicates that there is a positive relationship between the ex-ante available skills and R&D investment. It means that a successful strategy for improving firm’s manpower skills may be beneficial to the firm, especially its overall competitive performance.
We detect that existing studies on the effect of automation on the labor market tend to take a pessimistic view of the future based on macro-level analyses. The lack of empirical analysis using micro-level data resulted in one-dimensional and uniform research outcomes. Rather than being concerned about the present based on such research outcomes, we need to perform a more accurate and objective assessment of our current realities where technology is steadily advancing.
3. Current Status of Robotization and the Labor Market in Korea
3.1. Industrial Robotization in Korea
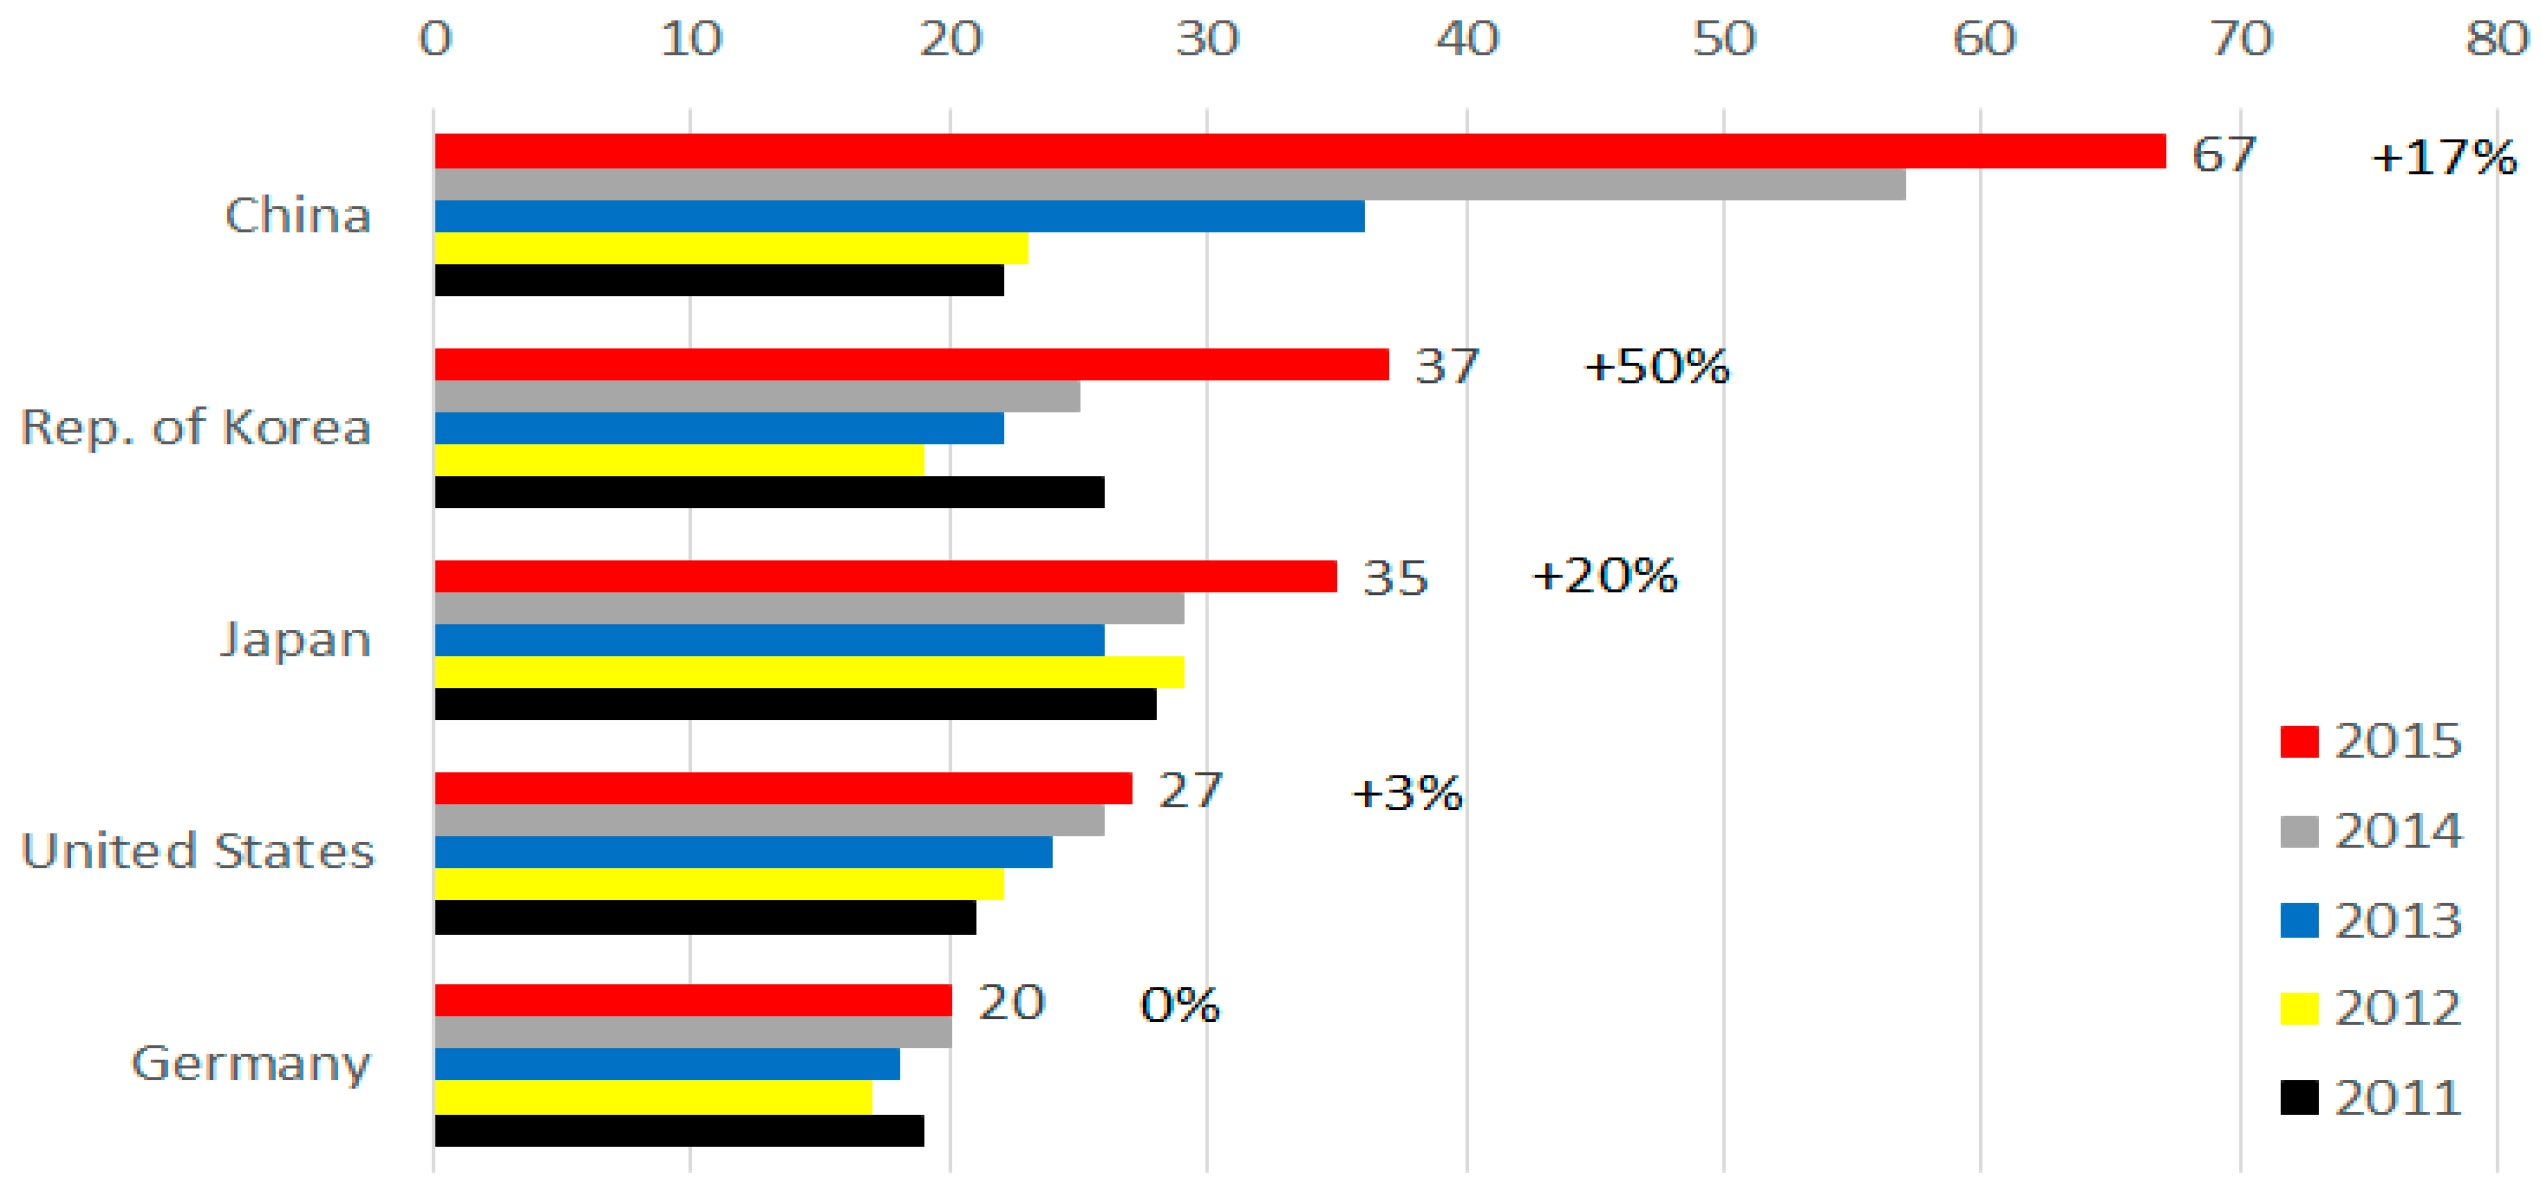
The International Federation of Robotics (IFR) [17] classifies all robots as either “industrial” robots and “service” robots. Industrial robots refer to multipurpose-machinery with more than three axes that are reprogrammable and automatically controllable. Typically, industrial robots are stationary or fixed-mounted on mobile equipment. While industrial robots are generally used in manufacturing industries, service robots are used in the fields other than manufacturing. Service robots, which may be fully or semi-automated, are designed to perform a variety of services for families and individuals. Utilization of these robots has been expanding to the military, construction and medical fields, as well. According to the IFR report [1], as Figure 1 shows, China, Korea, Japan, Germany and the US are the major markets for industrial robots and the combined demand of robots in the aforementioned five nations accounted for 56% of the global demand in 2015. With a total of 37,000 robots deployed across the nation in 2015, Korea recorded second highest robot demand in the world, following China. In fact, Korea’s demand in 2015 grew by 50% from 2014, showing higher growth than in the other four nations.
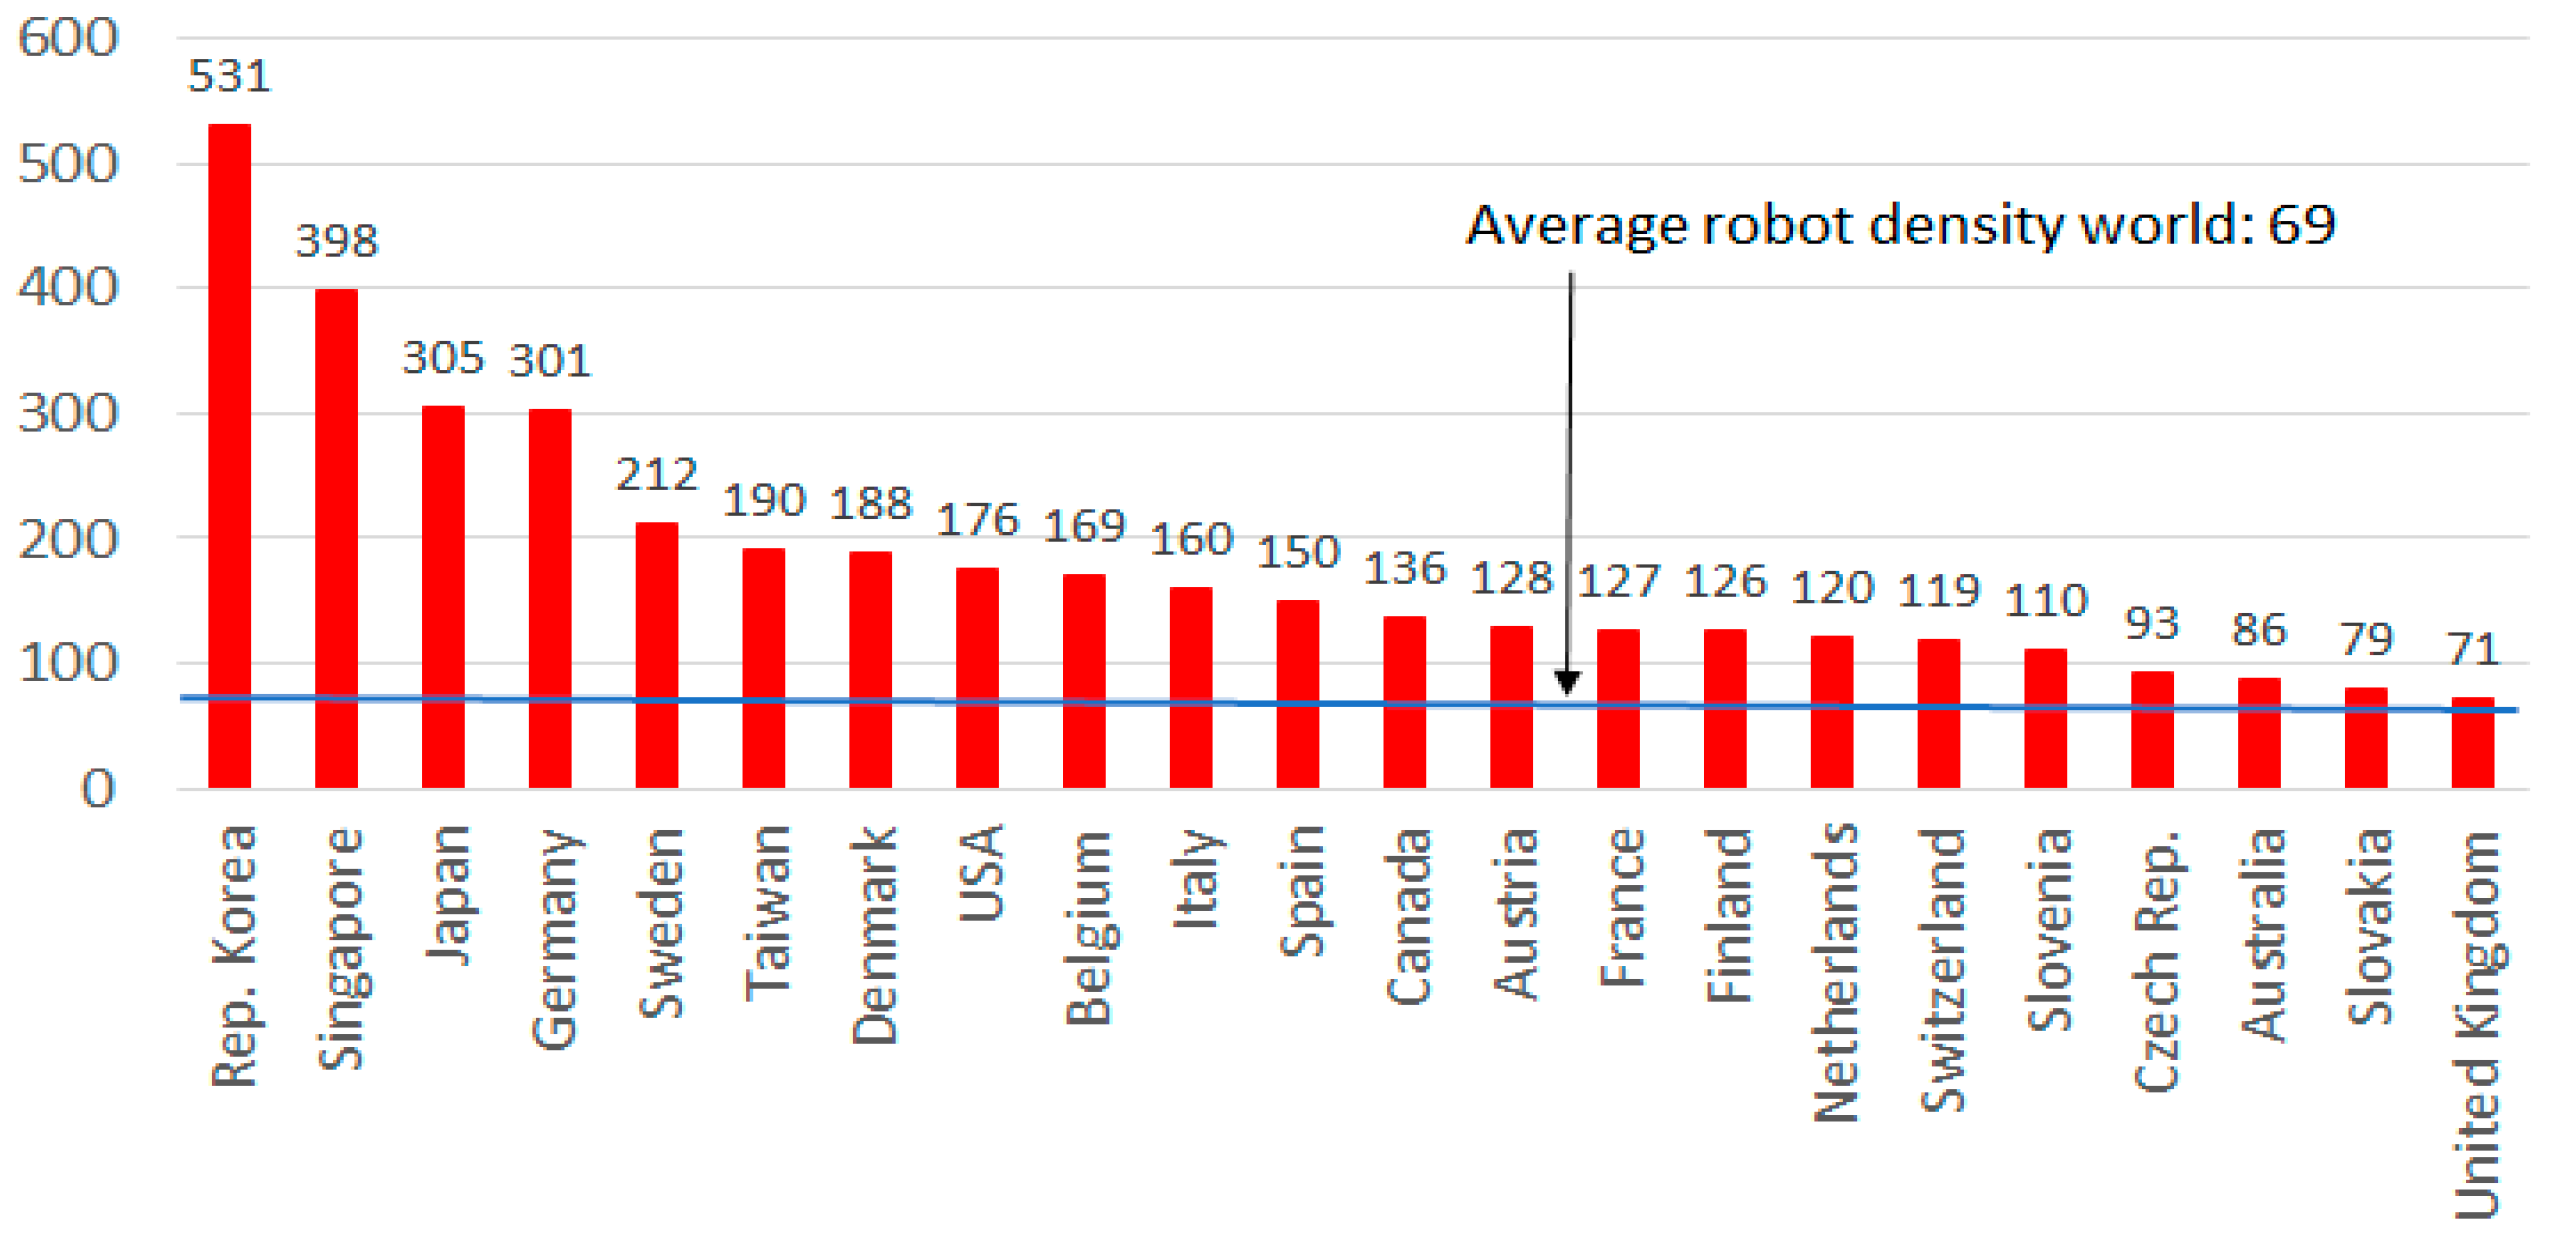
The IFR [1] measured and published the robot density in each country. Robot density, which is “defined as the number of industrial robots per 10,000 manufacturing employees”, is a core indicator, a benchmark, used to quantify the level of automation in the global market. According to the IFR [1], as Figure 2 shows, the reported average global robot density in 2015 is 69 industrial robots per 10,000 employees. Followed by Singapore (398 units), Japan (305 units), and Germany (301 units), Korea is a global leader in industrial robot automation, with a robot density exceeding the global average by more than sevenfold.
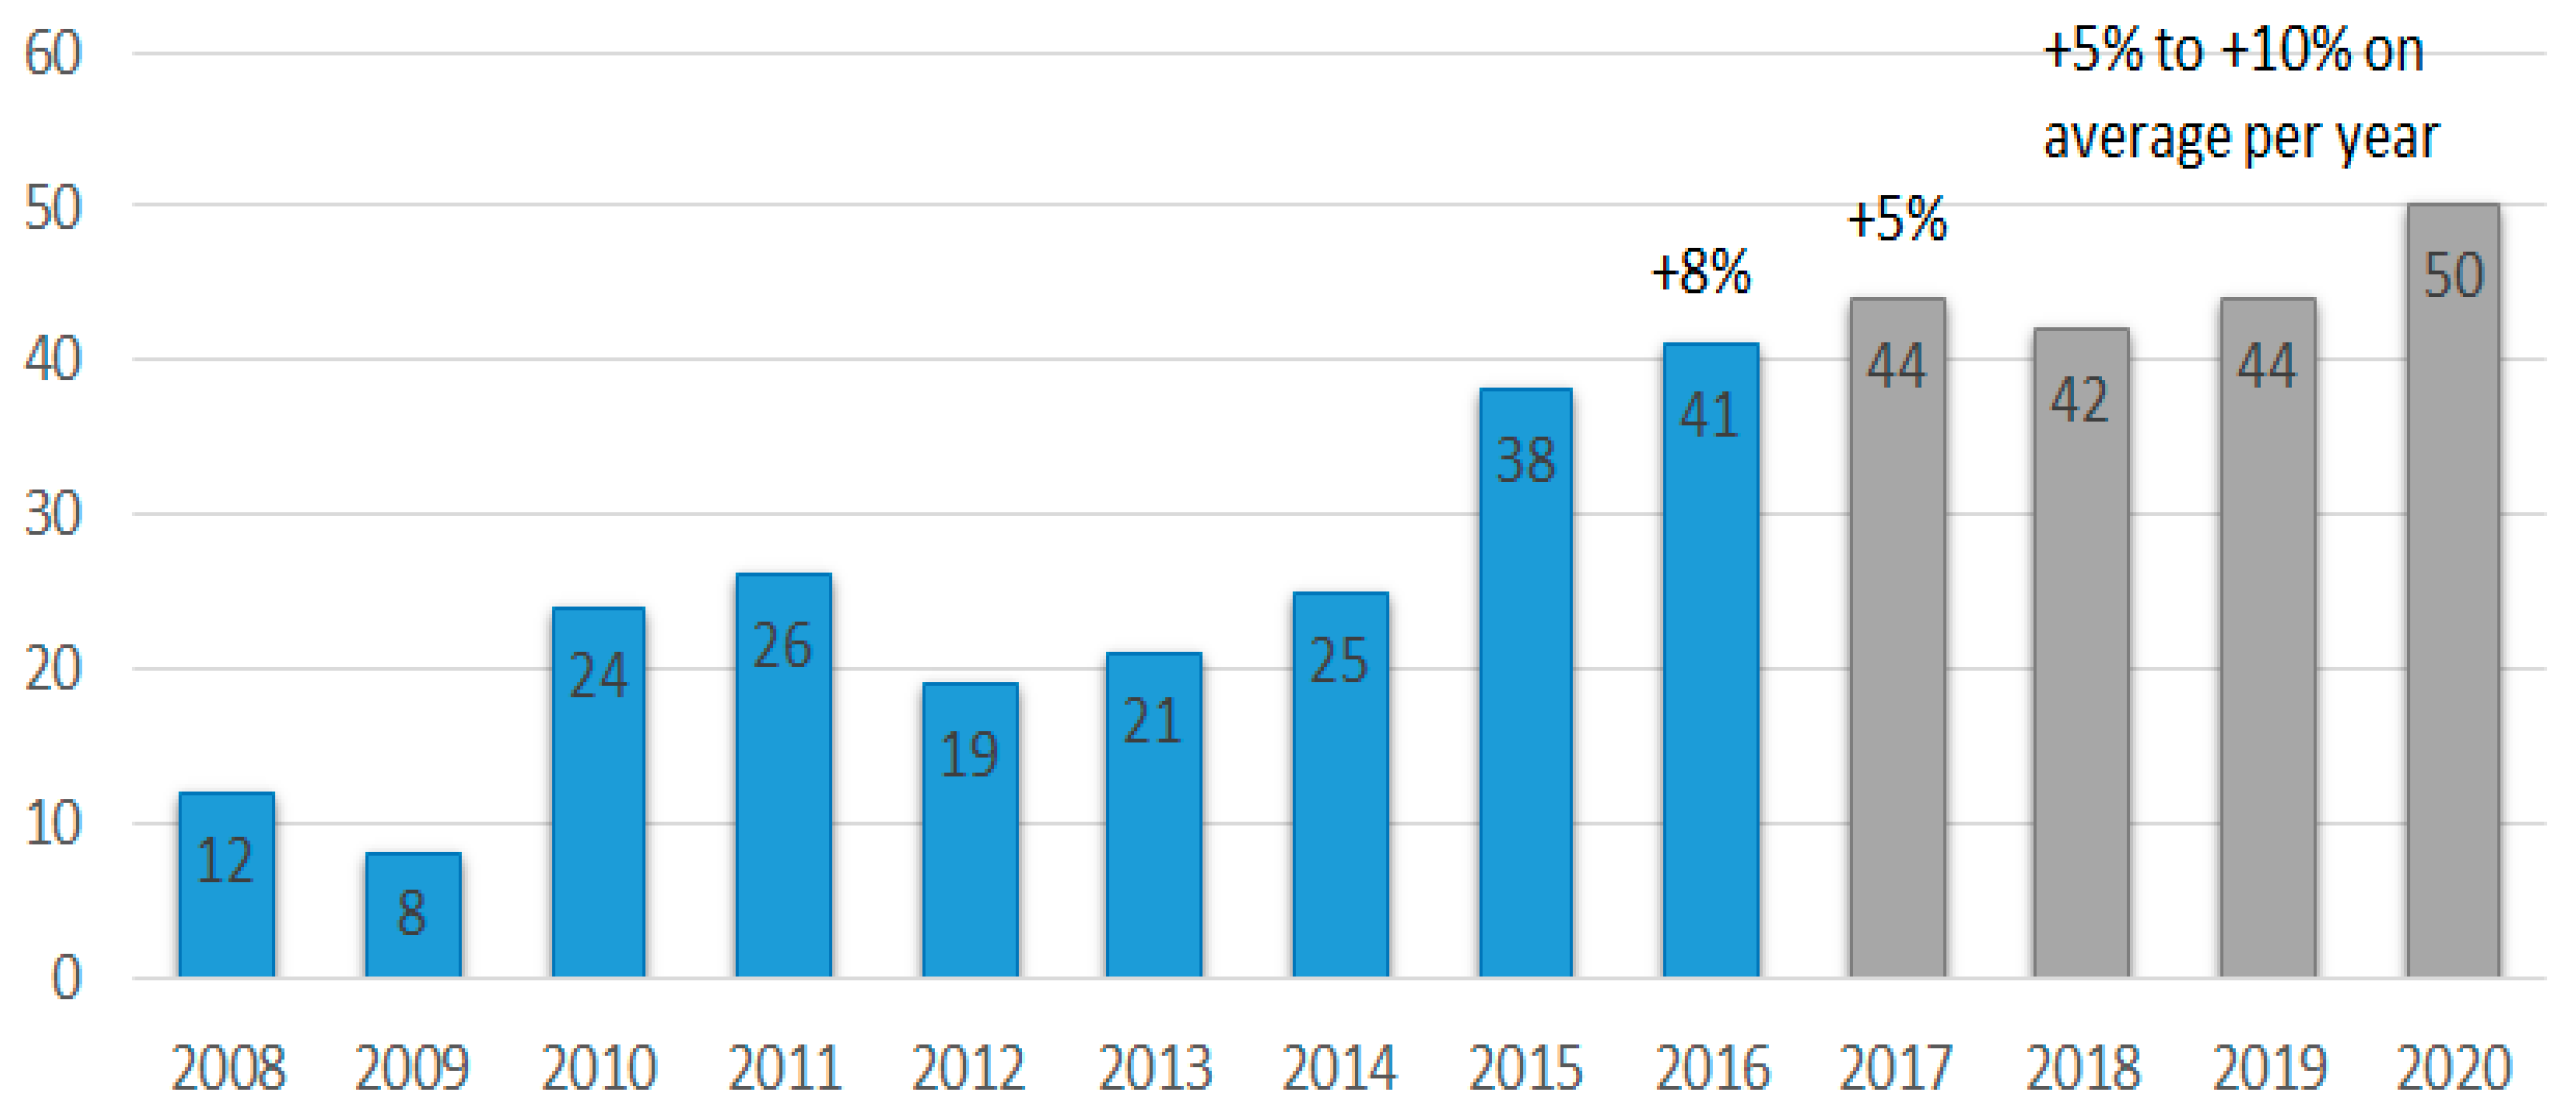
The demand for industrial robots in Korea has progressively increased with each passing year. The IFR [18] forecasts that the trend would continue beyond 2016. According to current information, as Figure 3 shows, the documented demand in 2016 was 41,000 units, representing an 8% increase over and above the previous year. For 2017, a 5% increase from 2016 is predicted. Between 2018 and 2020, an annual increase of 5–10% is forecasted. According to the IFR [18], Korea’s investment in industrial robotics increased in the electrical/electronics industry, with electronics accounting for 37.4%, and automobiles, 34.0% of the total. The report explains that the growth is centered on LCD, memory chip manufacturing and automobile manufacturing sectors, respectively.
Korea’s Work Environment Assessment Survey examines the current status of use of industrial robots in workplaces. Industrial robots are defined as either stationary or mobile machines that are reprogrammable and automatically controllable, and have manipulator that can operate three or more axes, which is identical to the IFR’s definition. Table 1 presents the number of industrial robots in each industry categorized according to Korea Standard Industrial Classification (KSIC). The data said to represent the actual number of robots was harvested from a Work Environment Assessment Survey conducted in 2009, and in 2014 [19]. In 2009, the number of industrial robots used in manufacturing sector was 23,813, which accounted for 99.99% of the total. In 2014, five years later, the figure expanded to 34,870 units, 11,057 units increase from 2009 (and which accounted for 99.85% of the total number of industrial robots). Within the manufacturing sector, automobile and trailer manufacturing industries had the largest number of industrial robots in both 2009 and 2014. The number of industrial robots in these industries accounted for 53.89% of the total in 2009, and 65.33% in 2014, which is 11.44% increase from 2009. Electronic parts manufacturing, computers, film, sound and communication system manufacturing industries accounted for the second largest number of industrial robots both in the years 2009 and 2014, both. Sectors which introduced, somewhat more recently, the use of robots (in 2014) include agriculture, forestry and fishing sectors, wholesale and retail trade vendors and other service industries. In 2014, 21 units (0.06%) were introduced across Agriculture, forestry and fishing sectors, 23 units (0.07%) across wholesale and retail trade sector, and nine units (0.03%) across other service activities sectors.
3.2. The Labor Market of Korea
According to Statistics Korea’s Economically Active Population Survey (EAPS) which was published in August 2016 [20], there were a total of 19.627 million wage workers in Korea. Of those employment, as Table 2 shows, 67.2% were regular employees and 32.8% worked in non-regular employ. Non-regular employees in Korea can subsequently be categorized as “contingent workers”, “atypical workers”, and “part-time workers”. Contingent workers include “fixed-term workers” who work for a fixed term as set by employment contract and “non-fixed-term workers” who may continue to work if their employment is extended or the employment contract renewed. Fixed-term workers and non-fixed-term workers account for 14.9% and 3.7% of all wage workers, respectively. Atypical workers include temporary agency workers, contract agency workers, special types of employment workers, home-based workers and on-call workers. The proportion of temporary agency workers to all wage workers is 1.0%, and those of contract agency workers, and special types of employment workers are 3.5% and 2.5%, respectively. Part-time workers are defined as part-time workers whose prescribed working hours are shorter than those of full-time workers. These part-time employment arrangements include both fixed-term contracts and non-fixed-term contracts. Part-time workers account for 12.6% of all wage earners. Wage workers are classified as “direct employees” and “indirect employees” depending on the specific conditions of their employment. Regular workers, fixed-term workers, non-fixed-term workers and part-time workers are grouped together as direct employees, while atypical workers are grouped together as indirect employees. Direct employees account for 88.7% of all wage workers, while indirect employees account for 11.3% of all wage workers.
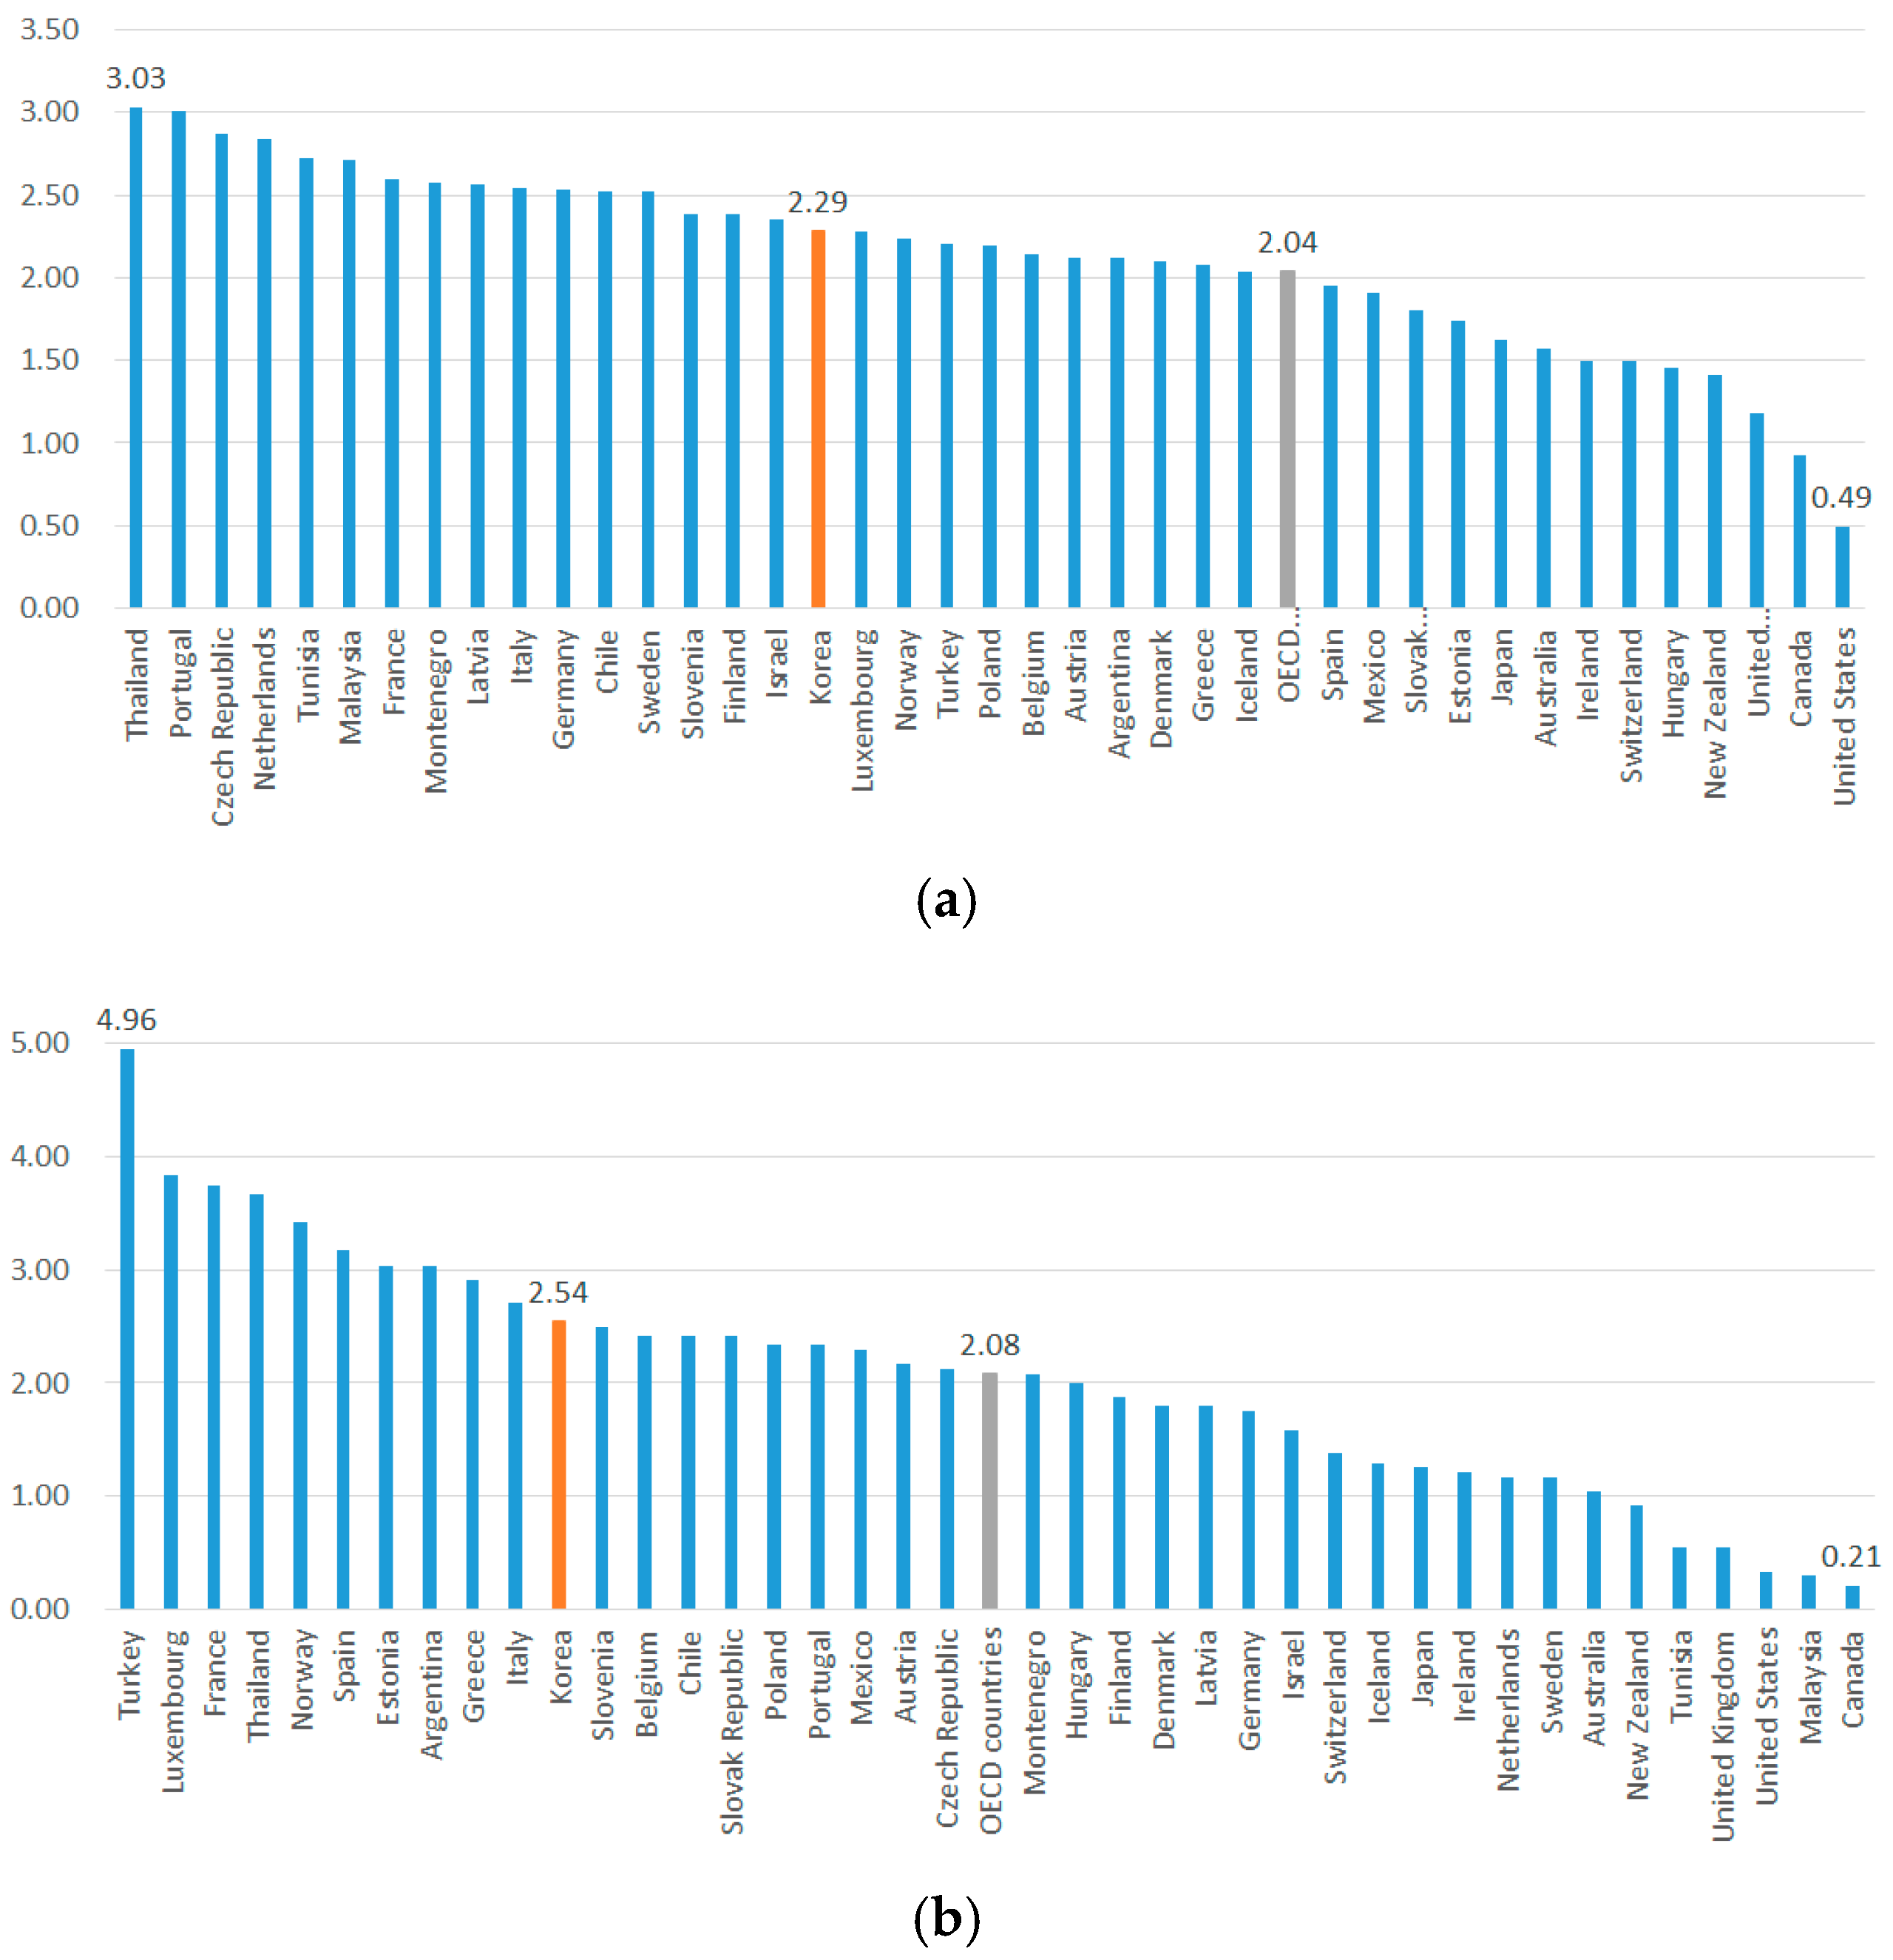
We compared the relative rigidity of employment contracts for regular and non-regular employees in Korea, with comparable employment contracts commonly in use in other industrialized countries. Figure 4 shows the international comparison of the OECD Employment Protection Legislation (EPL) [4]. A proportional relationship was suggested by the findings: The greater the EPL, the more rigid a country’s employment protection regulations, and vice versa. The EPL for Korea’s regular employment protection for restrictions on dismissal is 2.29, which is higher than the OECD average of 2.04; and the EPL for the regulations on the use of temporary employment is 2.54, which is higher than the OECD average of 2.08. These figures display, and may even emphasize, the relatively significant degree of inflexibility in the Korean labor market, whereby the (justified and even necessary) laying-off of regular employees cannot be easily accomplished, and non-regular employment is not utilized with any meaningful degree of flexibly. In the wake of the 1997 financial crisis (“the IMF”), Korean firms switched to a strategy aimed at reducing short-term costs, and adopted measures designed to minimize labor cost and restructure their workforce. After this change, temp-to-perm transition was strengthened, and a large number of temporary workers and daily workers started to be utilized to protect employment of regular workers [21].
Korea is known to have longer working hours than many other countries. Figure 5 illustrates the annual working hours of OECD members. In terms of the annual total working hours of employees in 2016, Korea (2069 h) ranks the third place following Mexico (2255 h) and Costa-Rica (2212 h). In fact, Korea’s working hours, which is 2069 h, is far longer than the OECD average of 1763 h.
In Table 3, we examined working hours and wages in Korea. According to Statistics Korea’s August 2016 EAPS data [20], the average weekly working hours of all wage workers in Korea is 40.9 h. When viewed by the type of employment, the weekly working hours of regular employees is 43.7 h, which is longer than the average of all wage workers, the weekly working hours of non-regular employees is 35.2 h, which is less than the average of all wage workers. A comparison of weekly working hours among various subtypes of non-regular employees finds that all of the subtypes other than home-based workers had longer weekly working hours than non-regular employees as a whole. Contract agency workers have an average of 43.5 weekly working hours, which is longer than that of the other subtypes of non-regular employees. There is no significant difference in weekly working hours between direct employees and indirect employees; the working hours of direct employees is 41.0 h and that of indirect employees is 40.0 h. As for the average monthly wage by employment types, all wage workers make 2.368 million KRW a month on average, and the regular employees make 2.795 million KRW. The average monthly wage of non-regular employees is 1.494 million KRW, which is 53.5% of what regular employees earn. Among full-time non-regular employees, special types of employees had the highest average monthly wage, which is 71.6% of what regular employees earn. In terms of employment relations, direct employees earn an average monthly wage of 2.469 million KRW, whereas indirect employees earn a far lesser amount, 1.571 million KRW.
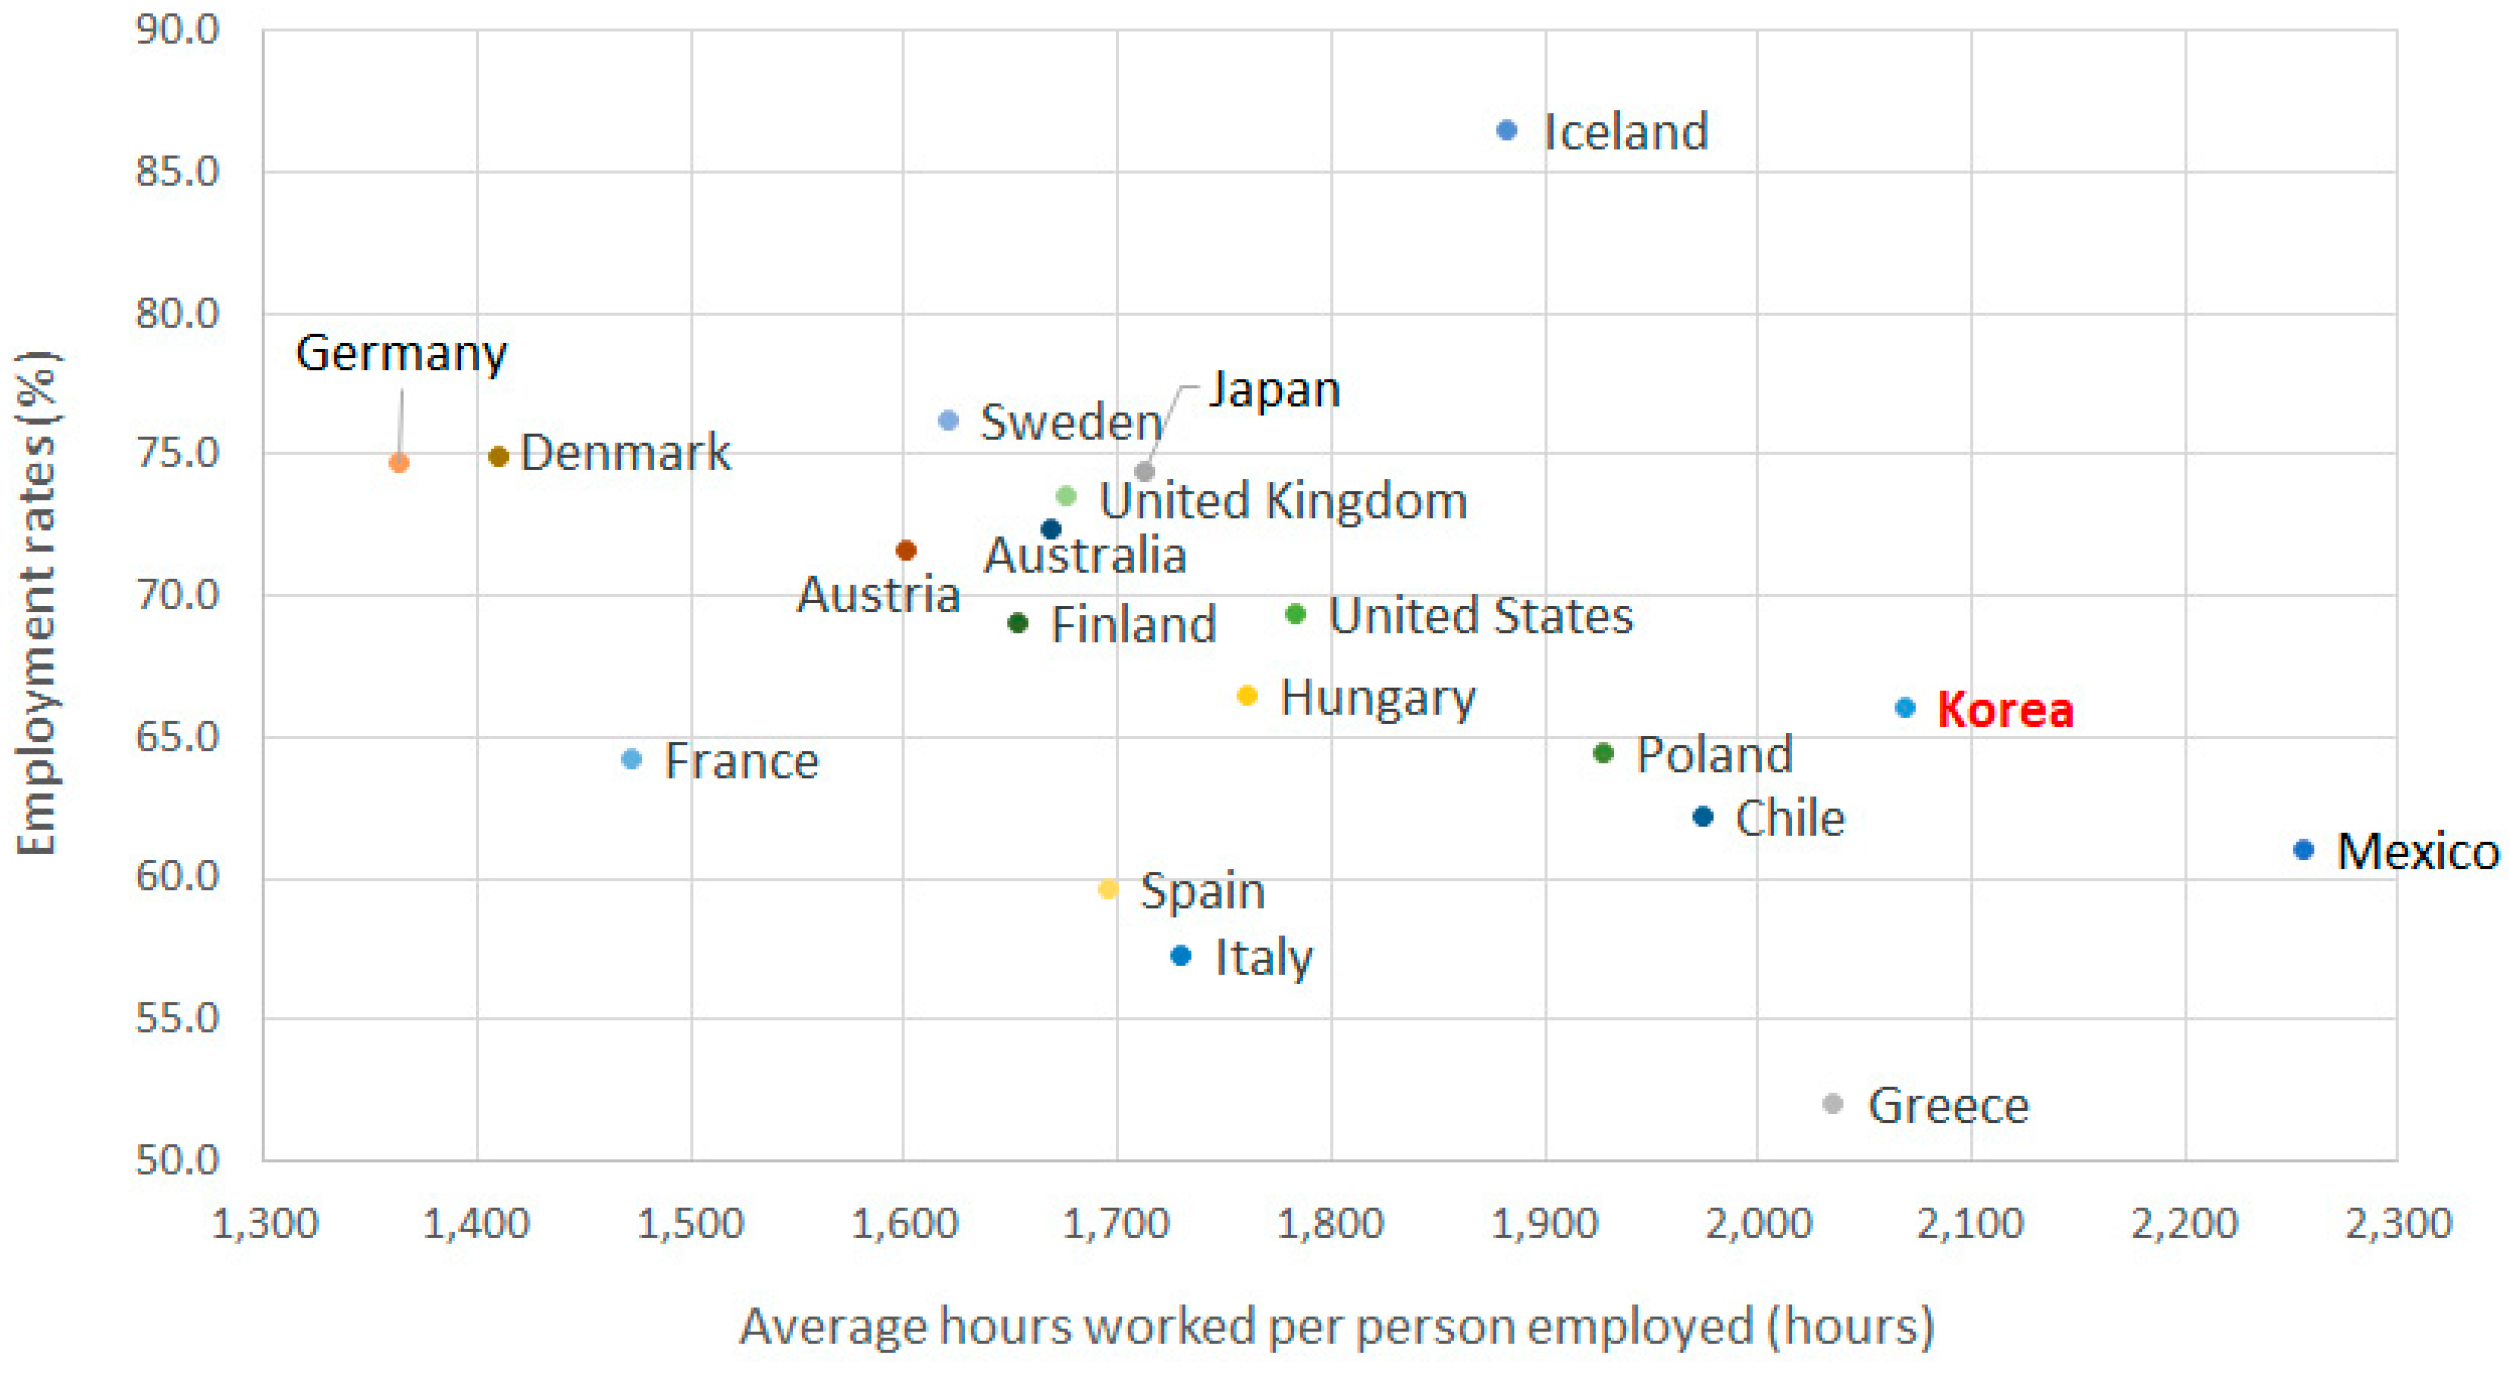
As the above Figure 5 shows, Korea ranks the highest level of actual working hours in the OECD countries, due to the excessive extended and holiday work. However, long working hours can be a major cause of decline in labor productivity and can be an obstacle to improving employment rates. The following Figure 6 shows the annual working hours and employment rates of the OECD countries. In the OECD, there are no countries with more than 1900 working hours and more than 70% of employment rates at the same time. Also we can see that the shorter the working hours, the higher the employment rates; and vice versa. Korea aims to reduce working time to 1800 h by 2022 by revising the Labor Standards Act and implementing policies to resolve the long time working issue.
We categorize companies as large corporations, small-and-medium enterprises, and small firms by size. We examine the distribution of workers by employment type and relations in Table 4. In terms of employment type, the largest share of regular employees (calculated to be approximately 54.5% total regular employees), tends to be found in small-and-medium enterprises; 29.6% of regular employees are employed by small firms and 16.0% of regular employees are employed by large corporations. The largest proportion of non-regular employees (which is 48.8% of the total non-regular employees) is found in small firms, followed by 46.1% employed by small-to-medium enterprises. It is noted that only 5.2% of all non-regular employees work for large corporations. Union membership rate is also examined in accordance with employment type and firm size. Among the regular employees in large corporations, 40.6% of them belong to labor unions. At the same time, the proportions of regular employees who are members of a union are about 17.0% and 2.6%, respectively, in small-to-medium enterprises, and small firms.
In Table 4, union membership rates of non-regular employees show a similar pattern: The non-regular employees in large corporations clock the higher union membership rate (8.9%), than do those work at small-to-medium enterprises, and small firms, even though the rate is lower than what is observed among their regularly employed counterparts. In terms of employment relations, small-to-medium enterprises have the largest share of direct employment (52.5%), followed by small firms and large corporations (of which the shares of direct employment are 33.6% and 13.9%, respectively). As for indirect employment, largest share of indirect employees (53.4% of total indirect employees), work at small firms. 45.5% and 1.1% of indirect employees work at small and medium enterprises and large corporations respectively. A comparison of union membership rates by employment relations and firm size show that 36.6% of direct employees of large corporations are union members. Only 6.8% of indirect employees of large corporations have union membership.
As should be self-evident from the above examinations of current status of robotization and the labor market in Korea, the demand for industrial robots and robot density is higher in Korea than any other industrialized country on earth. The automotive and semiconductor industries, in particular, are expected to drive up the national demand for industrial robots in coming years. In reality, however, Korean government strongly regulates laying-off regular employees and hiring non-regular employees, which renders its low labor market flexibility among the OECD countries. Currently, Korean workers work the third longest hours among those of any workers of OECD countries. Wages of non-regular employees are at the level of 54% of what regular employees are paid. Labor unions are organized mostly by the regular employees of large corporations, and they can exert pressure ultimately on the firms by which they are employed because of the rigid and uncompromising attitude. In other words, various regulations pertaining to labor demand actually serve promote and facilitate substitution of non-regular employees by mechanization, which in turn could speed-up the job replacement by new technologies. In addition, the labor market’s rigidity can significantly either accelerate or slow the pace of technological innovations. While this inflexibility can create a wage gap between employees, it can also create an innovation gap between large corporations and small-and-medium enterprises or small firms. Such innovation gaps (often) caused by smaller companies’ failure (or inability) to catch up or compete with the innovation earlier acquired by larger firms ultimately intensifies the polarization already present in the labor market. In the following section, the factors that might, and can, influence the labor market because of progressive robotization are examined with a focus on employment and working hours, while keeping the labor market’s conditions in mind.
4. Empirical Analysis
4.1. Data and Analysis Method
To analyze employment and robotization, two sets of data are used. One is the industrial robot data obtained from the Work Environment Assessment Survey. Industrial robots are defined as either stationary or mobile machines that are automatically controlled, reprogrammable, and have manipulator to operate three or more axes. Work Environment Assessment Survey, which is published by the Korea Occupational Safety and Health Agency [19], regularly assesses the safety risk factors in workplaces across Korea. The risk factors include handling of hazardous chemicals, installment and operation of machinery, equipment, tools, and etc. Collected data are used to create industrial health and safety policies and establish occupational disaster prevention plans. Since the first survey in 1993 and the second survey in 1999, the survey, which concerns all workplaces in the nation, has been conducted every five years. A complete enumeration method is used for manufacturing workplaces with five or more employees, whereas a sample survey method is used for manufacturing workplaces with fewer than five employees and for non-manufacturing workplaces. The 2014 survey population includes a total of 359,745 workplaces, located across the nation, that have workers’ industrial accident compensation insurance as of 1 January 2014. The target sample size is 150,000 workplaces, which is 41.7% of the survey population, of which 126,846 workplaces responded to the survey. The survey uses the 5-digit-Korea standard industrial classification (KSIC) to classify industries. The KSIC of Statistics Korea is a classification system that is based on the UNSD’s ISIC [22]. For this reason, the survey allows direct identification of the demand for robot in each industry. This study views robotization as an automation by the use of industrial robots, as an infrastructure that can lower human workers’ burden of repetitive tasks and excessive workload. This is different from a typical automated production process that is optimized for mass production, and performs programmed tasks only. In this sense, this study assumes that the number of industrial robots may be used as a reliable indicator of robotization in place of degree of robotization in each industry, therefore implementing the number of robots as a robotization indicator.
For the business level variables, employment type data were collected from the Survey on Labor Conditions by Employment Type published by the Ministry of Employment and Labor [23]. The survey target includes all industries defined in the KSIC with the exclusion of public administration and defense, activities of households as employers and activities of extraterritorial organizations and bodies. In terms of employment type, a survey of 32,000 sample firms that have one or more workers is conducted once a year. This survey is administered to both firms and individuals; therefore it has the capacity to identify employment type, occupations, working hours, wages and overtime payscale and/or union membership on both business and individual levels. For this study, the data are organized by the unit of business, and variables such as the number of total employees, the number of direct employees, total working hours, total wages, union membership rate, the proportion of production workers, the proportion of simple labor workers, firm size and industry classifications are created. The Survey on Labor Conditions by Employment Type provides only 1-digit-classifications, which is used to link the data with the above mentioned robotization indicator.
Existing studies on the core technologies of the 4th Industrial Revolution conclude that automation such as the use of robot and AI has a negative impact on human employment [3,7,24]. However, employment and robot-based technological advancement can have a negative or a positive relationship. If technological progress can boost productivity, productivity per unit capital can exceed labor productivity which can, in turn, result in labor-substitution [25]. This means that robotization and employment have a negative relationship. On the other hand, if technological progress improves firms’ competitiveness by lowering prices, demand for goods and services would increase which should lead to employment recovery or increase [10,11]. Technological advancement alone would not necessarily reduce the number of jobs, all of the time. It should be noted that the technological advancement and employment can have both negative and positive relationships.
In terms of the relationship between working hours and robotization, reduction of working hours primarily raise labor costs however, the overall effect of working hour reduction would vary depending upon the means and methods by which individual firms attempt to maintain an acceptable level of production output. If firms opt to push for overtime in an effort to sustain the existing productivity level, increased labor cost would result in greater fixed cost. Or, a business might choose to improve productivity by introducing robotization instead of increasing working hours. If the diminution of human working hours is gradual, automation can be gradually introduced as a response [26]. Currently, Korea is one of the top countries in terms of long work-hour-days and is trying to reduce working hours due to the national social needs for shorter days. During this transitional period in a general effort to reduce working hours and to employ systems for flexible working hours, firms could try to expand robotization to increase productivity.
The higher the labor cost, the more incentives firms have to automate and substitute labor with an alternative production element; and the firms apply automation to increasing productivity and recuperating the labor cost [27]. For this reason, chances are that firms would opt for robotization to maintain their cost competitiveness. A great number of Korean firms utilize a seniority-based wage system. This wage system is determined by length of employment therefore, companies are bound to face increasing labor costs as their employees’ period of employment increases. This institution of seniority-based wage rate encourages firms to switch to robotization [28]. On the other hand, robotization can be weak and relatively ineffective in tasks where robots cannot be replaced by experienced hands of by in firms that do work that requires human workers who have cutting-edge expertise and judgement. In fact, highly skilled workers demanding commensurate wages in non-manufacturing industries are still difficult to adequately replaced by robots [29,30].
Labor unions’ attitude towards robotization may be discussed from two perspectives. According to the insider-outsider theory, unions are expected to take a positive view on robotization. A labor union is an insider, and as an insider, it is likely to keep the membership small and elite and keep out the outsiders to protect the interests of the members within the members [31,32]. Firms of which labor unions have a strong negotiating power hire a substantial share of indirect employees (such as subcontracting). A labor union that views indirect employment as a buffer to support its members’ employment stability, or that prefers outsourcing dirty and dangerous jobs, may condone or even encourage indirect employment [33,34,35]. On the other hand, if a labor union opposes hiring of non-regular employees, the tendency for labor-substitution through robotization may be weakened as well. According to the theory of rights of collective bargaining, labor unions primary aim and objective is to improve their collective bargaining power and an increase in non-regular employment tends to undermine their collective bargaining power. In addition, non-regular employees can fill in for regular employees who belong to the union when the union decides to engage in a collective behavior such as a strike, which also can undermine the union’s effort. Therefore, the greater the union’s bargaining power, the smaller the number of non-regular employment, and vice versa [36,37]. Robotization, in this context, can be a substitute to non-regular employment; therefore the probability to introduce robotization would not be high if labor unions are opposed to hiring non-regular employees.
Robotization and the progress of automation technology are closely related to repetitive and simple tasks such as production-line works and simple labor [38]. Within the German manufacturing industry, 120,000 production jobs decrease due to substitution of automatized machine and it is expected that over 20,000 routine-intensive tasks in the production plan segment will also disappear [39]. In the US as well, concerns are rising that automation by AI and robotization could take over the simple tasks performed by low-skill and low-wage workers [40]. In this study, robotization is defined as automation by robots, and an infrastructure that can reduce the burden of repetitive tasks and excessive workload. This is different from characteristics of service robots used to perform tasks outside of manufacturing. Service robots are semi– or fully–automated machines that perform tasks for convenience of families and individuals. In this context, therefore, routine tasks in production-lines or simple manual tasks will be most directly related to the changing employment structure like robotization.
Large corporations have a competitive advantage over small and medium enterprises and small firms owing to the economy of scale. Such advantage proves to be even more beneficial in capital-intensive firms. In fact, robotization requires substantial capital investment and large corporations are clearly better able to access the sort of funding necessary for such an undertaking. Therefore, the opportunities and financial feasibility for robotization could be increased in larger companies that operate in capital-intensive industries where investment in facilities is vital.
Table 5 presents the basic statistics of the business level variables that are used in the analysis. The robotization indicator, which is the dependent variable, is computed by taking logarithm of the number of robots in 2014. The rate of increase in total employment was calculated by subtracting the number of total employees in 2009 from that in 2014, and dividing it with the number of total employees in 2009. Total employment is categorized as direct employment and indirect employment. Direct employment includes part-time, fixed-term, non-fixed term’s contingent and regular employees. Indirect employment includes special types of employment, home-based, temporary agency, contract agency, and on-call employees. As for the increase in direct employment, the difference between the 2014 and 2009 direct employment is obtained and divided by the 2009 direct employment. We use the growth rate of total employment and direct employment after eliminating the outliers. The outliers are unreliable because the standard deviation is above 30 before the rejection of the outliers, we doubt them. The existence of outliers can affect the stability and generalization of our model. To reject the outliers, we use a method devised by a statistician, John Tukey, and introduced by Hamilton [41]. This solution is used to define numerically what an outlier is and then specify the appropriate selection, i.e., find the inner fences. Thus, by this method, we find the lower and upper inner fences of the variable of interest, and remove the outliers which are the values outside the range between them.
In order to compute total working hours, actual monthly prescribed working hours and actual hours worked overtime in 2014 are combined and then averaged by each business. Then, logarithm is taken to the averages. The total wage is the sum of base pay, normal wage, other allowances and overtime pay of June 2014. Average of total wage of an individual worker is computed by business and logarithm is taken to the averages. For union membership rate, the ratio of employees belonging to a union to total number of employees is calculated by business. In order to compute the proportion of production workers and simple labor workers, we group them according to the Korean Standard Classification of Occupations (KSCO) 1-digit classification codes. We define the production workers as 7-Craft and related trades workers and 8-Plant, machine operators and assemblers; and we define the simple labor workers as 9-Elementary workers as the simple labor workers. The occupations included in 7-Craft and related trades workers are metal core makers, machinery equipment mechanics and fitters, electricians, construction, and mining-related workers. 8-Plant, machine operators and assemblers include chemical, metal, machine production, electrical and electronic driving related machine operating occupations. The simple labor workers include construction and mining, transport, production, cleaning and guard related elementary occupations. The KSCO is based on the International Standard Classification of Occupations (ISCO) adopted by the ILO [22]. Based on this categorization, the proportion of production workers to total employees is calculated for each business. For the proportion of simple labor workers, the share of workers whose job classifications pertain to simple labor is calculated. Company size is represented in dummy variables that consist of four categories: Companies with fewer than five employees; entities with five-29 employees; with 30–299 employees; and, with 300 or more employees. Industries are categorized into eighteen industries, which are ultimately divided by manufacturing industry and non-manufacturing industry.
In Table 6, we use the Pearson correlation coefficient to examine how strongly the variables are correlated. The Pearson Correlation Coefficient is a linear correlation coefficient that returns a value of between −1 and +1. The value of −1 means there is a strong negative correlation and +1 means that there is a strong positive correlation [41]. Pearson correlation coefficients are significant at the 0.05 level in general. The correlation coefficient is 0.537 between the logarithm of total wage and the logarithm of total working hours, which is the largest among all the coefficients. The coefficient between the proportion of the simple labor workers and the proportion of the production workers is −0.193, which is a negligible relationship.
An Ordinary Least Squares (OLS) is performed to analyze the effects of labor variables such as employment, working hours, and wages on robotization, which is a dependent variable. Regression analysis using OLS is useful in examining the average relationship between dependent and independent variables. Based on the variables mentioned above, details of the model are established as described below.
represents company, and represents the year 2014. The dependent variable, , is the robotization indicator, and is , represents the rate of total employment growth between 2009 and 2014. For Models (3) and (4), , which is the rate of direct employment growth instead of , is used. represents total working hours, while represents total wage. is union membership rate, the proportion of production workers, and the proportion of simple labor workers. is a four-category dummy variable representing company size. The firms that hire less than five employees were set as a reference variable, followed by small firms with 5–29 employees, medium-sized business with 30–299 employees, and large firms with 300 or more employees. represents the error term. This model allows identification of the effects of employment, working hours and wage on robotization. In addition, an interaction term of the manufacturing dummy variable and the rate of total employment growth and the rate of direct employment growth is added to the model. This is to investigate the respective effect of employment in manufacturing industry and non-manufacturing industry on robotization.
4.2. Results
Table 7 presents the results of the OLS regression. Models (1) and (2) use the rate of total employment growth as the employment variable, while Models (3) and (4) use the rate of direct employment growth. Both Models (2) and (4) include the interaction term of the employment variables and manufacturing dummy variable. Results of the analysis are as follows. The rate of total employment growth has a positive relationship with robotization. This circumstance may be viewed as the net effect of employment on robotization because the effects of working hours, wages, union membership rate, and company sizes were controlled. In addition to labor cost and the investment cost needed for robotization, firms considering robotization also have to take into account the cost associated with labor-substitution as well as the profitability after the substitution. Facility investment costs or sales figures are not considered in this study as relevant data are unavailable. Instead, this study controls for capacity of job creating parts by including total wage in the model. Therefore, the positive relationship between the rate of total employment growth and robotization indicates that robotization might have a complementary relationship with employment.
To examine total employment and direct employment by industry, the interaction term with the manufacturing dummy variable is incorporated. The rate of total employment growth and the interaction term for manufacturing industry have a positive relationship. The industrial robots currently used in manufacturing sectors typically perform repetitive and simple tasks. This study defines robotization as automation by industrial robots. Therefore, the positive sign of employment in the manufacturing industry indicates that processes which require repetitive and simple labor compared to other jobs can have a collaboration relation with robotization. In the Model (4), the interaction term which the rate of direct employment growth and the manufacturing industry shows a positive sign. Assuming that direct employment offers higher quality labor than would indirect employment, the positive sign of direct employment in manufacturing indicates that highly skilled labor and robotization can have a Possibility of complementary collaboration.
Working hours has a negative relationship with robotization. Korea, which ranks the third place from the top when it comes to the amount of working hours among OECD countries, is taking steps to shorten the long working hours. Firms would be motivated to increase productivity by deploying robots to substitute the overtime labor. Higher wages lead to more robotization. Wages often represent the financial capacity of firms, vis-à-vis the cost of labor. Therefore, if wages gets higher, firms would try to maintain their competitiveness through higher level of robotization.
There is a negative relationship between union membership rate and robotization; higher union membership leads to decreased robotization. Unions may take a hostile stance towards robotization because robotization could be perceived as undermining their organizational and collective clout and threaten the future employment of the membership. The proportions of production workers and simple laborers were positively related with robotization. This suggests that robotization could have a complementary relationship with human workforce in processes that require these types of work, the work that are mainly comprised of highly concentrated, repetitive and simple tasks. Robotization expands as company size grows; medium sized firms with 30–299 employees and large corporations with 300 or more employees deploy more robots in general. This could be attributed to the greater investment capacity among big companies, when compared to the financial resources available to small and medium-sized companies.
5. Discussion and Summary
The currently existing robotization research assumes a future and its explanations are largely focused on the current and cutting-edge technology cases. From the perspective that robotization destroys jobs, these studies perform simple regression analyses using robotization as an independent variable and employment as a dependent variable. In this way, the study documented herein and fully discussed below is thought to be analytically innovative compared to the previous studies for the following reasons: First, this study creates a robotization indicator based on the recent data regarding the use of industrial robots in Korea, links the indicator to micro-economic data about firms and individual workers, and performs multiple regression analysis. Second, this study aims to empirically examine the factors that determine the endogeneity of robotization. To this end, this study takes the perspective that robotization is an endogenous variable, not an exogenous variable (as previously presumed) and uses it as a dependent variable. In an attempt to control other factors, labor variables such as employment and union membership have been incorporated in the model. Third, in addition to employment and working hours, we analyze the effect of net employment and the required working hours while taking into account the relationship between employment and working hours. Fourth, labor cost variable is also incorporated as a variable because firms must consider fixed costs when they make investment decisions regarding robotization.
Results of the empirical analysis indicate that robotization increases as employment increased. The labor cost, which is employers’ employment capacity, was controlled and therefore can be considered as a net employment effect. This means, of course, that there exists the possibility of supplementing the additional increased human employment part with robotization. The employment increase in the manufacturing sector promotes robotization. Therefore, the big picture seems to indicate whether the human employment will increase or decrease may depend upon the employment, or manufacturing sector being served. There is need for different job capacities in manufacturing industries and non-manufacturing industries, respectively, and the amenability of the business to robotization depends upon the nature of the business. As noted above, robotization increases as working hours decrease. Korea, which has the third-longest working hours among the OECD countries, has been promoting social and policy changes in an effort to reduce the long working hours. Against this backdrop, firms would have incentives to push for robotization to compensate the overtime working hours that human workforce no longer want to spend. Increased labor cost leads to increased overall cost for firms, which fuels the increase in robotization. The labor unions also have a significant say in firms’ decision for robotization; higher union membership rate is associated with weak robotization. This can be interpreted as that unions tend to take a hostile attitude towards robotization in an effort to safeguard its members’ employment stability. On the other hand, as the proportion of production workers and simple labor workers grow, robotization increases. This suggests that, for processes requiring routine-intensive/simple manual tasks, robotization complements the human workforce, rendering a collaborative relationship between the two. Robotization also increases as company size grows. This can be interpreted as that probability of robotization is higher for larger companies because of their relative ease in procuring necessary funds required for robotization compared to small and medium sized firms.
The above results have three major implications. First, this study implies that, at least for now, the status of employment destructive related to robotization is not very pronounced. If anything, robotization has the potential to complement, to enhance, the human workforce. In other words, employment destruction expected to result from discontinuous technological progress does not seem to have arrived just yet at least not at the current level of robotization. A hike in labor cost or tighter government regulations can encourage firms to consider offshoring or outsourcing, which could be reduced the domestic manufacturing employment [42,43]. However, this study does not find a pronounced job-destroying associated with robotization at the current technological or demand level.
Second, it suggests that job creation policies through reduction of working hours may lead to work creation of robots. Reducing working hours at constant wage rates means that firms have to give overtime pay to workers and so this leads to an increase in labor costs. Therefore, a scale effect, which means the reduction of the production level by firms, would occur, and eventually the employment would decrease. In addition, a substitution effect may occur, in which a company replaces labor with capital due to a rise in labor costs [44]. If there exists a substitutive option, robots, the substitution effect of the reduction of working hours can offset the positive effect on employment and enlarge the overall substitution effect. In order for the reduction of working hours to lead to increasing productivity, the promotion of robotization can take up the employment part. Korea ranks the highest level among the OECD countries due to the excessive extended and holiday work. As the top-ranked country in robot density, Korea’s new government plans to create new jobs through reduction of working hours per week to 52 h by law. However, it is unclear whether it increases human jobs or drives robotization. Our empirical results provide implication for the latter.
Third, total wage per worker is calculated based on a seniority-based wage system, and the wage gap in Korea between employees of different seniority is one of the largest in the world. If the seniority of less than one year is considered as 100, the wage gap depending on seniority is 1.1–1.8 times in Europe, 2.5 times in Japan, and 2.8 times in Korea, which puts the country at the top [45]. The mean seniority between regular employees and non-regular employees in Korea has been on the rise and the labor market rigidity, as well as the steady increase in labor cost owing to the seniority-based pay system could negatively impact employment [46]. Therefore, results of our empirical analysis suggest that job destruction or creation would depend on various conditions of the labor market. Also, firms’ attitudes towards robotization also appear to influence their respective strategies regarding possible future use of robotization.
Appropriate policy support is necessary for the labor market to smoothly perform its function of effectively distributing workforce and capital-intensive production technologies. This study results would provide the basic information required to create the appropriate policies, such as a policy designed to reduce labor substitution in industry sectors where human labor is expected to substitute with robotization, or a policy designed to promote job creation in industry sectors where robotization contributes to more jobs. To create new and better job opportunities in industry sectors where labor-substitution is more prevalent, policies should be implemented to promote the development of technology which allows human workers and robots to co-exist in the workplace. To this end, information that can link industry to employment should be provided to corresponding industries. This study may be useful in policy discussions concerning a potential robot tax due to the increase in robotization. Although a robot tax may reduce tax burdens and even serve as the monetary source of universal basic income, taxing robots can also discourage firms’ technological investment effort. Because the theoretical framework of this study is one which considers not the changes in the number of robots deployed but the changes in employment and robots simultaneously, it may be suggested that the robotization that promotes job creation should be imposed a negative robot tax; that is, it should be subsidized.
This study might also represent a resource for firms trying to determine their stance on robotization, and for initiating and/or leading a discussion on its management. Even industries or business who might be currently experiencing a negative relationship with employment and robotization might benefit from seeking out a more employment-friendly application of robotization or its commercialization. In short, this study can provide basic management data needed to establish a production chain in which human and technology can coexist, such as an integrative partnership between employment-friendly business sectors and companies whose jobs are threatened, or in seeking outsourcing measures with partner companies. Furthermore, by identifying the operation process and task designs of the business sectors where humans and robots can coexist, basic data needed for benchmarking other parts may be provided. Finally, we hope that our study results will contribute to the shedding of the generally negative perception of robotization among workers, and to firms’ consideration for CSR (Corporate Social Responsibility) and marketing strategy for employment-friendly robotization in the future.
A limitation of this study is the fact that the industrial robot data and the micro level employment data used only represent the current picture. Therefore, in case that robotization spreads rapidly on a J-curve or discontinuous technology emerges, it may be assessed that this study assumed a conservative change pattern. Going forward, big panel data on robotization including more varied variables will allow us to provide valuable information, for the policy and management efforts mentioned above. We considered panel analysis using panel data at the beginning of this study. However, there were limitations in obtaining multiple data that combine robotization indicator and business data. So, it is very difficult to use the panel data set as the preset. Therefore, we expect that future research will be able to use panel data sets if data are constructed further.
Author Contributions
Joonmo Cho designed the research; Jinha Kim analyzed the data. Both authors wrote the paper, read, and approved the final manuscript.
Conflicts of Interest
The authors declare no conflict of interest.
References
- International Federation of Robotics. World Robotics 2016-Industrial Robots; International Federation of Robotics Report; International Federation of Robotics: Frankfurt, Germany, 2016. [Google Scholar]
- World Economic Forum. The Future of Jobs: Employment, Skills and Workforce Strategy for the Fourth Industrial Revolution; World Economic Forum: Geneva, Switzerland, 2016. [Google Scholar]
- Frey, C.B.; Osborne, M. The future of employment: How susceptible are jobs to computerization? Technol. Forecast. Soc. Chang. 2017, 114, 254–280. [Google Scholar] [CrossRef]
- OECD iLibrary. OECD Employment and Labour Market Statistics. 2016. Available online: http://www.oecd-ilibrary.org/employment/data/oecd-employment-and-labour-market-statistics_lfs-dataen (accessed on 1 December 2017).
- McKinsey Global Institute. Job Lost, Jobs Gained: Workforce Transitions in a Time of Automation; McKinsey & Company: New York, NY, USA, 2017. [Google Scholar]
- Goos, M.; Manning, A.; Salomons, A. Explaining job polarization: Routine-biased technological change and offshoring. Am. Econ. Rev. 2014, 104, 2509–2526. [Google Scholar] [CrossRef] [Green Version]
- Arntz, M.; Gregory, T.; Zierahn, U. The Risk of Automation for Jobs in OECD Countries: A Comparative Analysis; OECD Social, Employment, and Migration Working Papers; OECD: Paris, France, 2016; Volume 189. [Google Scholar]
- Autor, D.H. Why are there still so many jobs? The history and future of workplace automation. J. Econ. Perspect. 2015, 29, 3–30. [Google Scholar] [CrossRef]
- Acemoglu, D.; Restrepo, P. The Race between Machine and Man: Implications of Technology for Growth, Factor Shares and Employment; National Bureau of Economic Research: Cambridge, MA, USA, 2016. [Google Scholar]
- Acemoglu, D. Labor and capital augmenting technical change. J. Eur. Econ. Assoc. 2003, 1, 1–37. [Google Scholar] [CrossRef]
- Pissarides, C.A. Equilibrium Unemployment Theory; MIT Press: Cambridge, MA, USA, 2000. [Google Scholar]
- McKinsey Global Institute. A Future that Works: Automation, Employment and Productivity; McKinsey & Company: New York, NY, USA, 2017. [Google Scholar]
- Brynjolfsson, E.; McAfee, A. Race against the Machine: How the Digital Revolution Is Accelerating Innovation, Driving Productivity, and Irreversibly Transforming Employment and the Economy; Digital Frontier Press: Lexington, MA, USA, 2011. [Google Scholar]
- Piva, M.; Vivarelli, M. Technological change and employment: Some micro evidence from Italy. Appl. Econ. Lett. 2004, 11, 373–376. [Google Scholar] [CrossRef]
- Autor, D.H.; Katz, L.F.; Krueger, A.B. Computing inequality: Have computers changed the labor market? Q. J. Econ. 1998, 113, 1169–1213. [Google Scholar] [CrossRef]
- Piva, M.; Vivarelli, M. The role of skills as a major driver of corporate R&D. Int. J. Manpow. 2009, 30, 835–852. [Google Scholar]
- International Federation of Robotics. Available online: https://ifr.org (accessed on 17 October 2017).
- International Federation of Robotics. World Robotics 2017-Industrial Robots; International Federation of Robotics Report; International Federation of Robotics: Frankfurt, Germany, 2017. [Google Scholar]
- Korea Occupational Safety and Health Agency. Work Environment Assessment Survey, 2014. Available online: https://www.kosha.or.kr/content.do?menuId=10260 (accessed on 17 October 2017).
- Statistics Korea. Economically Active Population Survey, August 2016. Available online: https://mdis.kostat.go.kr/index.do (accessed on 17 October 2017).
- Cho, J.; Lee, J. Persistence of the gender gap and low employment of female workers in a stratified labor market: Evidence from South Korea. Sustainability 2015, 7, 12425–12451. [Google Scholar] [CrossRef]
- Statistics Korea. Korean Standard Statistical Classification: Industrial Classification and Classification of Occupations, 2016. Available online: https://kssc.kostat.go.kr:8443/ksscNew_web/ekssc/main/main.do (accessed on 17 October 2017).
- Ministry of Employment and Labor. Survey on Labor Conditions by Employment Type, 2014. Available online: http://laborstat.moel.go.kr/ (accessed on 17 October 2017).
- Brynjolfsson, E.; McAfee, A. The Second Machine Age: Work, progress, and Prosperity in a Time of Brilliant Technologies; WW Norton & Company: New York, NY, USA, 2014. [Google Scholar]
- Ehrenberg, R.G.; Smith, R.S. Modern Labor Economics: Theory and Public Policy; Routledge: Abingdon, UK, 2016. [Google Scholar]
- White, M. Working Hours: Assessing the Potential for Reduction; JSTOR: New York, NY, USA, 1987. [Google Scholar]
- Sharma, G. Competing or collaborating siblings? In Industrial and Trade Policies in India; University of Missouri: Columbia, MO, USA, 2008. [Google Scholar]
- Woo, K.; Cho, J. Transferring the cost of wage rigidity to subcontracting firms: The case of Korea. Sustainability 2016, 8, 845. [Google Scholar] [CrossRef]
- Goldin, C.; Katz, L.F. The origins of technology-skill complementarity. Q. J. Econ. 1998, 113, 693–732. [Google Scholar] [CrossRef]
- Gray, R. Taking technology to task: The skill content of technological change in early twentieth century united states. Explor. Econ. Hist. 2013, 50, 351–367. [Google Scholar] [CrossRef]
- Lindbeck, A.; Snower, D.J. Wage setting, unemployment, and insider-outsider relations. Am. Econ. Rev. 1986, 76, 235–239. [Google Scholar]
- Solow, R.M. Insiders and outsiders in wage determination. In Trade Unions, Wage Formation and Macroeconomic Stability; Springer: Berlin, Germany, 1986; pp. 269–286. [Google Scholar]
- Bentolila, S.; Dolado, J.J. Labour flexibility and wages: Lessons from Spain. Econ. Policy 1994, 9, 53–99. [Google Scholar] [CrossRef]
- Devicienti, F.; Naticchioni, P.; Ricci, A. Temporary employment, demand volatility, and unions: Firm-level evidence. ILR Rev. 2015, 71, 174–207. [Google Scholar] [CrossRef]
- Saint-Paul, G. Dual Labor Markets: A Macroeconomic Perspective; MIT Press: Cambridge, MA, USA, 1996. [Google Scholar]
- Golden, L. The expansion of temporary help employment in the US, 1982–1992: A test of alternative economic explanations. Appl. Econ. 1996, 28, 1127–1141. [Google Scholar] [CrossRef]
- Smith, V. New forms of work organization. Ann. Rev. Sociol. 1997, 23, 315–339. [Google Scholar] [CrossRef]
- Acemoglu, D.; Autor, D. Skills, tasks and technologies: Implications for employment and earnings. In Handbook of Labor Economics; Elsevier: Amsterdam, The Netherlands, 2011; Volume 4, pp. 1043–1171. [Google Scholar]
- Lorentz, M.; Rüsmann, M.; Strack, R.; Lueth, K.; Bolle, M. Man and Machine in Industry 4.0: How Will Technology Transform the Industrial Workforce through 2025? The Boston Consulting Group: Boston, MA, USA, 2015. [Google Scholar]
- Chui, M.; Manyika, J.; Miremadi, M. Four fundamentals of workplace automation. McKinsey Q. 2015, 29, 1–9. [Google Scholar]
- Hamilton, L.C. Statistics with Stata: Version 12; Cengage Learning: Boston, MA, USA, 2012. [Google Scholar]
- Geishecker, I.; Görg, H. Winners and losers: A micro-level analysis of international outsourcing and wages. Can. J. Econ. 2008, 41, 243–270. [Google Scholar] [CrossRef]
- Lankford, W.M.; Parsa, F. Outsourcing: a primer. Manag. Decis. 1999, 37, 310–316. [Google Scholar] [CrossRef]
- Hamermesh, D.S. Labor Demand and the Source of Adjustment Costs; National Bureau of Economic Research: Cambridge, MA, USA, 1993. [Google Scholar]
- Jeong, J.H.; Kim, J.H.; Kim, D.B.; Lee, I.J. The Aging Workforce and Pay-System Innovation; Korea Labor Institute Report; Korea Labor Institute: Geumnam-myeon, Korea, 2011. [Google Scholar]
- Cho, J.; Keum, J. Job instability in the Korean labour market: Estimating the effects of the 1997 financial crisis. Int. Labour Rev. 2004, 143, 373–392. [Google Scholar] [CrossRef]
Figure 1.
Annual industrial robot demand in major markets, 2011–2015 (unit: 1000 units); Note: Rep. of Korea increases 2015 partly due to additional companies reporting only in 2015; Source: International Federation of Robotics (IFR), World Robotics 2016 [1].
Figure 1.
Annual industrial robot demand in major markets, 2011–2015 (unit: 1000 units); Note: Rep. of Korea increases 2015 partly due to additional companies reporting only in 2015; Source: International Federation of Robotics (IFR), World Robotics 2016 [1].

Figure 2.
Robot density world by country, 2015 (units); Note: per 10,000 employees in the manufacturing industry 2015; Source: IFR, World Robotics 2016 [1].
Figure 2.
Robot density world by country, 2015 (units); Note: per 10,000 employees in the manufacturing industry 2015; Source: IFR, World Robotics 2016 [1].
Figure 3.
Annual industrial robot demand in Korea, 2008–2016 and 2017–2020 (unit: 1000 of units); Note: 2017–2020 data are estimations; Source: IFR, World Robotics 2017 [18].
Figure 3.
Annual industrial robot demand in Korea, 2008–2016 and 2017–2020 (unit: 1000 of units); Note: 2017–2020 data are estimations; Source: IFR, World Robotics 2017 [18].
Figure 4.
Employment protection legislation: regular and temporary employment, 2013: (a) Strictness of employment protection legislation for regular employment; (b) Strictness of employment protection legislation for temporary employment; Data source: OECD, Employment and Labour Market Statistics [4].
Figure 5.
Annual working hours of OECD countries, 2016; Notes: (1) Annual working hours Based on total employment; (2) 2015 data were used for Switzerland and Belgium; Data source: OECD, Employment and Labour Market Statistics [4].
Figure 5.
Annual working hours of OECD countries, 2016; Notes: (1) Annual working hours Based on total employment; (2) 2015 data were used for Switzerland and Belgium; Data source: OECD, Employment and Labour Market Statistics [4].
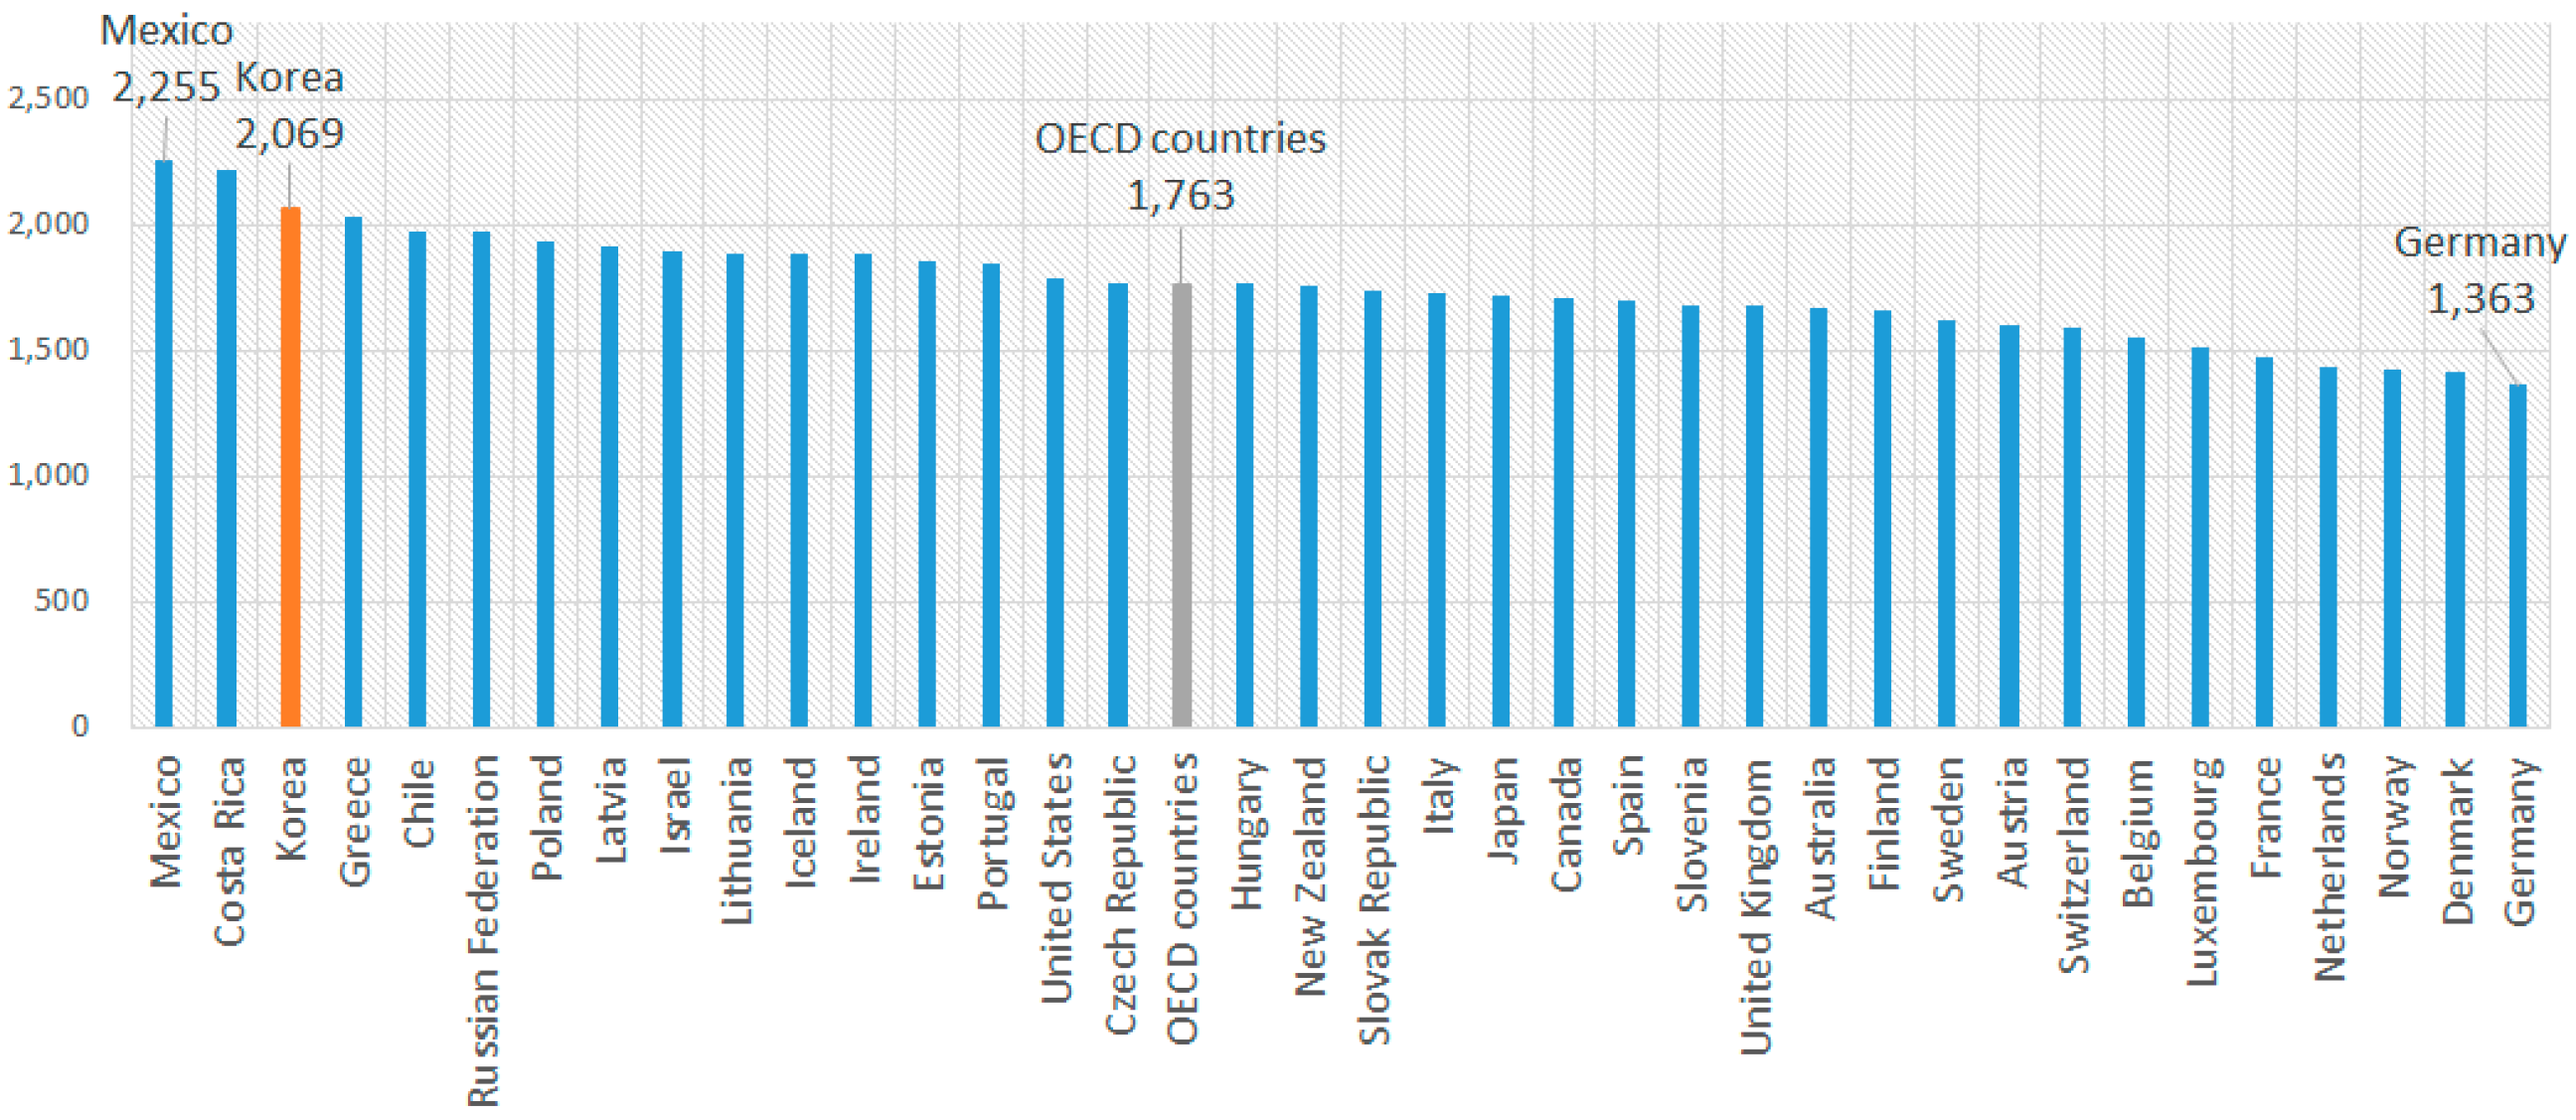
Figure 6.
Working hours and employment rates in the OECD countries, 2016; Notes: (1) Average hours worked per person employed is total annual working hours/average number of employees per year including full-time and part-time workers; (2) Japan is for workplaces with 5 or more permanent employees, and Hungary is for manufacturing workplaces with 5 or more employees; (3) Employment rates are the seasonal adjustment data and the ratio of the employed to the working-age population (aged 15–64); Data source: OECD, Employment and Labour Market Statistics [4].

Table 1.
The number and share of industrial robots by industry: Derived from the Work Environment Assessment Survey in 2009 and 2014.
Table 1.
The number and share of industrial robots by industry: Derived from the Work Environment Assessment Survey in 2009 and 2014.
| Industry | No. of Industrial Robots Installed | % of Industrial Robots Installed | ||||
|---|---|---|---|---|---|---|
| 2009 | 2014 | Increase/Decrease | 2009 | 2014 | Increase/Decrease | |
| Manufacturing | 23,813 | 34,870 | 11,057 | 99.99 | 99.91 | −0.08%p |
| 30-Automobile and trailer manufacturing 1 | 12,834 | 22,781 | 9947 | 53.89 | 65.33 | 11.44%p |
| 26-Electronic parts, computers, film, sound and communication system manufacturing 1 | 4778 | 4250 | −528 | 20.06 | 12.19 | −7.88%p |
| Other manufacturing | 6201 | 7839 | 1638 | 26.04 | 22.48 | −3.56%p |
| Non-manufacturing 2 | 3 | 32 | 29 | 0.01 | 0.09 | 0.08%p |
| Total | 23,816 | 34,902 | 11,086 | 100 | 100 | 0.00%p |
Notes: 1 Based on the 2-digit industry classifications in the KSIC; 2 Non-manufacturing industries include: A-Agriculture, forestry and fishing, B-Mining and quarrying, D-Electricity, gas, steam and air conditioning supply, E-Water supply; sewerage, waste management and remediation activities, F-Construction, G-Wholesale and retail trade; repair of motor vehicles and motorcycles, H-Transportation and storage, I-Accommodation and food service activities, J-Information and communication, K-Financial and insurance activities, L-Real estate activities, M-Professional, scientific and technical activities, N-Administrative and support service activities, P-Education, Q-Human health and social work activities, R-Arts, entertainment and recreation, S-Other service activities; Data source: Korea Occupational Safety and Health Agency, Work Environment Assessment Survey (2009, 2014) [19].
Table 2.
Size and share of employment by employment type and status (units: 10,000 workers, %).
| Wage Workers | 1962.7 | (100.0) | Direct Employment | Indirect Employment | |
|---|---|---|---|---|---|
| Non-regular employment | 644.4 | (32.8) | - | - | |
| Atypical | Temporary agency | 20.1 | (1.0) | - | 222.0 (11.3) |
| Contract agency | 69.6 | (3.5) | |||
| Special types | 49.4 | (2.5) | |||
| Home-based | 4.2 | (0.2) | |||
| On-call | 86.3 | (4.4) | |||
| Part-time employment | 248.3 | (12.6) | 1740.6 (88.7) | - | |
| Contingent employment | Fixed-term | 293.0 | (14.9) | ||
| Non-fixed-term | 72.7 | (3.7) | |||
| Regular employment | 1318.3 | (67.2) | |||
Notes: (1) Weighted value applied; (2) Non-fixed-term employment refers to contingent employment that is not on a fixed-term; (3) The definitions of detailed employment types within non-regular employment are not mutually exclusive and so overlap with each other, the sum of the detailed employment types and the total size of non-regular employment do not match; (4) The sizes of direct employment and indirect employment were calculated after excluding duplicates; Data source: Statistics Korea, Economically Active Population Survey (August 2016) [20].
Table 3.
Working hours and wages by employment type/status (units: hours, 10,000 KRW, %).
| Weekly Working Hours | Average Monthly Wage | Relative Wage Ratio (Regular emp. = 100) | ||
|---|---|---|---|---|
| Wage employment | 40.9 | 236.8 | - | |
| Regular employment | 43.7 | 279.5 | 100.0 | |
| Non-regular employment | 35.2 | 149.4 | 53.5 | |
| Contingent employment | Fixed-term | 36.9 | 165.6 | 59.3 |
| Non-fixed-term | 39.9 | 169.4 | 60.6 | |
| Atypical employment | Temporary agency | 39.1 | 174.5 | 62.4 |
| Contract agency | 43.5 | 146.1 | 52.3 | |
| Special types | 39.3 | 200.0 | 71.6 | |
| Home-based | 30.1 | 77.6 | 27.8 | |
| On-call | 37.7 | 137.5 | 49.2 | |
| Part-time employment | 20.8 | 74.1 | 26.5 | |
| Direct employment | 41.0 | 246.9 | - | |
| Indirect employment | 40.0 | 157.1 | - | |
Notes: (1) Weighted value applied; (2) Non-fixed-term employees are contingent workers who are not fixed-term; (3) Calculation of direct and indirect employment was performed after excluding duplicates in detailed employment types within non-regular employment; Data source: Statistics Korea, Economically Active Population Survey (August 2016) [20].
Table 4.
Distribution of workers by employment type/relations across three types of companies by size (unit: %).
Table 4.
Distribution of workers by employment type/relations across three types of companies by size (unit: %).
| Large Corporations (300 Employees or More) | Small and Medium Enterprises (10–299 Employees) | Small Firms (10 or Fewer Employees) | Total | |
|---|---|---|---|---|
| Regular employment | 16.0 | 54.5 | 29.6 | - |
| Non-regular employment | 5.2 | 46.1 | 48.8 | - |
| Union membership among regular employees | 40.6 | 17.0 | 2.6 | 16.5 |
| Union membership among non-regular employees | 8.9 | 4.0 | 0.5 | 2.6 |
| Direct employment | 13.9 | 52.5 | 33.6 | - |
| Indirect employment | 1.1 | 45.5 | 53.4 | - |
| Union membership among direct employees | 36.6 | 14.4 | 2.0 | 13.3 |
| Union membership among indirect employees | 6.8 | 1.8 | 0.4 | 1.1 |
Notes: (1) Weighted value applied; (2) Calculation of direct and indirect employment was performed after excluding duplicate detailed employment types within non-regular employment; Data source: Statistics Korea, Economically Active Population Survey (August 2016) [20].
Table 5.
Basic statistics of the variables.
| Variable | N | Means | S.D. | Min | Max |
|---|---|---|---|---|---|
| Log Robotization indicator | 8231 | 6.289 | 3.828 | 2.197 | 10.459 |
| Rate of growth: total employment | 8231 | 0.531 | 2.009 | −0.999 | 8.111 |
| Rate of growth: direct employment | 7788 | 0.373 | 1.802 | −1.000 | 7.000 |
| Log total working hours (month) | 8231 | 5.103 | 0.289 | 2.303 | 5.966 |
| Log total wage (month, 1000 KRW) | 8231 | 7.493 | 0.499 | 4.682 | 9.852 |
| Union membership rate | 8231 | 0.028 | 0.148 | 0.000 | 1.000 |
| Proportion of production workers | 8231 | 0.318 | 0.382 | 0.000 | 1.000 |
| Proportion of simple labor workers | 8231 | 0.100 | 0.238 | 0.000 | 1.000 |
| Company size: 1–4 | 8231 | 0.507 | 0.500 | 0 | 1 |
| Company size: 5–29 | 8231 | 0.393 | 0.488 | 0 | 1 |
| Company size: 30–299 | 8231 | 0.090 | 0.286 | 0 | 1 |
| Company size: 300+ | 8231 | 0.010 | 0.098 | 0 | 1 |
| Manufacturing industry (dummy) | 8231 | 0.545 | 0.498 | 0 | 1 |
Table 6.
Correlation among variables.
| (1) | (2) | (3) | (4) | (5) | (6) | (7) | (8) | (9) | (10) | (11) | |
|---|---|---|---|---|---|---|---|---|---|---|---|
| (1) Rate of growth: t-emp. | 1.000 | ||||||||||
| (2) Log total working hours | 0.070 * | 1.000 | |||||||||
| (3) Log total wage | 0.174 * | 0.537 * | 1.000 | ||||||||
| (4) Union membership rate | 0.104 * | 0.075 * | 0.195 * | 1.000 | |||||||
| (5) Proportion of produc. | 0.058 * | 0.094 * | 0.105 * | 0.143 * | 1.000 | ||||||
| (6) Proportion of simple | −0.005 | −0.056 * | −0.226 * | −0.028 * | −0.193 * | 1.000 | |||||
| (7) Company size: 1–4 | −0.421 * | −0.192 * | −0.377 * | −0.151 * | −0.071 * | 0.064 * | 1.000 | ||||
| (8) Company size: 5–29 | 0.241 * | 0.138 * | 0.264 * | 0.007 | 0.035 * | −0.057 * | −0.819 * | 1.000 | |||
| (9) Company size: 30–299 | 0.290 * | 0.092 * | 0.181 * | 0.216 * | 0.059 * | −0.009 | −0.320 * | −0.257 * | 1.000 | ||
| (10) Company size: 300+ | 0.113 * | 0.024 * | 0.082 * | 0.119 * | 0.020 * | −0.016 * | −0.085 * | −0.069 * | −0.027 * | 1.000 | |
| (11) Manufac. industry | 0.030 * | 0.076 * | 0.106 * | −0.044 * | 0.477 * | −0.067 * | −0.040 * | 0.018 * | 0.027 * | 0.041 * | 1.000 |
Note: * Correlation is significant at the 0.05 level.
Table 7.
The results of the Ordinary Least Squares (OLS) for the Multiple Regression Model.
| (1) | (2) | (3) | (4) | ||
|---|---|---|---|---|---|
| Total emp. | 0.014 | - | Direct emp. | 0.050 ** | - |
| (0.019) | - | (0.022) | - | ||
| Total emp. × Manufac. | - | 0.439 *** | Direct emp. × Manufac. | - | 0.431 *** |
| - | (0.024) | - | (0.028) | ||
| Log(Total working hrs) | −0.921 *** | −0.985 *** | Log(Total working hrs) | −0.846 *** | −0.946 *** |
| (0.138) | (0.135) | (0.141) | (0.139) | ||
| Log(Total wages) | 1.457 *** | 1.451 *** | Log(Total wages) | 1.419 *** | 1.428 *** |
| (0.088) | (0.086) | (0.090) | (0.088) | ||
| Union membership rate | −2.235 *** | −2.144 *** | Union membership rate | −2.322 *** | −2.215 *** |
| (0.239) | (0.234) | (0.249) | (0.245) | ||
| Proportion of production workers | 5.936 *** | 5.797 *** | Proportion of production workers | 5.942 *** | 5.852 *** |
| (0.091) | (0.090) | (0.093) | (0.092) | ||
| Proportion of simple laborers | 2.409 *** | 2.349 *** | Proportion of simple laborers | 2.353 *** | 2.342 *** |
| (0.149) | (0.146) | (0.151) | (0.148) | ||
| Company size: 5–29 | 0.022 | −0.254 *** | Company size: 5–29 | −0.034 | −0.246 *** |
| (0.081) | (0.077) | (0.083) | (0.079) | ||
| Company size: 30–299 | 0.490 *** | −0.106 | Company size: 30–299 | 0.357 ** | −0.083 |
| (0.139) | (0.132) | (0.145) | (0.138) | ||
| Company size: 300+ | 1.478 *** | 0.379 | Company size: 300+ | 1.168 *** | 0.344 |
| (0.363) | (0.356) | (0.378) | (0.372) | ||
| Constant | −2.063 *** | −1.605 ** | Constant | −2.144 *** | −1.631 ** |
| (0.668) | (0.656) | (0.682) | (0.672) | ||
| Num of obs. | 8231 | 8231 | Num of obs. | 7788 | 7788 |
| F-value | 522.80 | 579.54 | F-value | 499.37 | 575.21 |
| Adj R-squared | 0.363 | 0.388 | Adj R-squared | 0.366 | 0.384 |
Notes: (1) The dependent variable is log (Robotization indicator); (2) Reference group at company sizes is 1–4 employees; (3) Standard errors in parentheses *** < 0.01, ** < 0.05, * < 0.1; Data sources: Korea Occupational Safety and Health Agency, Work Environment Assessment Survey (2014) [19]; Ministry of Employment and Labor, Labor Conditions Survey by Employment Type (2009, 2014) [23].
© 2018 by the authors. Licensee MDPI, Basel, Switzerland. This article is an open access article distributed under the terms and conditions of the Creative Commons Attribution (CC BY) license (http://creativecommons.org/licenses/by/4.0/).
Share and Cite
MDPI and ACS Style
Cho, J.; Kim, J. Identifying Factors Reinforcing Robotization: Interactive Forces of Employment, Working Hour and Wage. Sustainability 2018, 10, 490. https://doi.org/10.3390/su10020490
AMA Style
Cho J, Kim J. Identifying Factors Reinforcing Robotization: Interactive Forces of Employment, Working Hour and Wage. Sustainability. 2018; 10(2):490. https://doi.org/10.3390/su10020490
Chicago/Turabian StyleCho, Joonmo, and Jinha Kim. 2018. "Identifying Factors Reinforcing Robotization: Interactive Forces of Employment, Working Hour and Wage" Sustainability 10, no. 2: 490. https://doi.org/10.3390/su10020490
Note that from the first issue of 2016, this journal uses article numbers instead of page numbers. See further details here.