Sustainability of Water Withdrawals in the Tiber River Basin (Central Italy)


1
Department of Civil and Environmental Engineering, University of Perugia, Borgo XX Giugno 74, 06121 Perugia, Italy
2
Civil Engineering Section, Niccolò Cusano University, Via Don Carlo Gnocchi 3, 00166 Roma, Italy
3
T4E, University of Perugia Spin-Off, Via Birago 18, 06124 Perugia, Italy
*
Author to whom correspondence should be addressed.
Sustainability 2018, 10(2), 485; https://doi.org/10.3390/su10020485
Submission received: 2 December 2017
/
Revised: 26 January 2018
/
Accepted: 7 February 2018
/
Published: 12 February 2018
(This article belongs to the Special Issue Sustainable River Basin Management)
Abstract
:Problems in the sustainable exploitation of water resources are mainly due to the spatial distribution of uses and are worsened by uncontrolled withdrawals by different activities. In this context, in order to evaluate and manage the available water resources, a decision support system has been developed to support the decision-making processes. This system was implemented on a web platform, in order to manage spatial data and to analyze information on water resources. The system also integrates a WEB-GIS engine for the elaboration and regionalization of data over the river network. The web architecture also makes these tools widely accessible and easily shareable by all stakeholders. The Web-based application was tested successfully in the Tiber River Basin (Central Italy) and focuses on the building of a hydrological database together with an evaluation model for surface water resources. The results provide synthetic information on the sustainability of water allocation scenarios, with particular regard to the feasibility of allowing new dissipative water withdrawal, such as dissipative water use in agricultural production for precision irrigation. The software technology of this project relies on open source code and can also be applied in other fields for the sustainable management of environmental resources.
1. Introduction
The increase in water demand from different uses, in many cases one competing against the other, seems to influence the very concept of the sustainable use of water resources [1]. There have been several papers in support of the positive aspects of the new technologies in water resources management. Choi et al. [2] presented a web-based spatial decision support systems (SDSS) framework in terms of system components and data, and Sridhar et al. [3] have deepened the use of the information technology for water resources management. All these papers are oriented to the web use as a new challenge in water resources management, in particular to synthesize access to data that are held in a myriad of independently agencies [4]. The need for a shared information between all the stakeholders, supported by hydroinformatics tools, has been presented by Hewett et al. [5], with particular attention to an integrated river basin management.
Very interesting applications are presented in different area of water resources management. For example, Salewicz amd Nakayama [6] presented Web-based decision support systems developed for a large international river, where the main goal is the conflict resolution in water resource management. The management of multipurpose water use issue between different stakeholders can be approached by means of decision support systems, for example in a system of reservoirs [7,8,9], or for managing surface water combined with groundwater [10]. In the field of decision support systems (DSS) related to groundwater management, Laraichi et al. [11] showed the importance of spatiotemporal data warehouse as effective solution for data integration from different sources, and it is also a possible support in the study process for groundwater remediation [12]. Other important experiences adopted decision support systems in surface water resources quality [13,14] and groundwater resources quality [15,16] management, and in agricultural water management practices [17,18,19]. Finally, Kumar et al. [20] presented an environmental decision support system, where the goal is that stakeholders can use the models without direct expert modeler’s involvement.
This paper presents a SDSS to deal with problems in water resources management, focusing on the natural integration of the evaluation and management steps of the available water resources. Particular attention is given to the widespread distribution of water withdrawals over the river network, which represents a factor of medium-high uncertainty in the global assessment of water resources availability [21].
Bonamente et al. [22] said that Italy, for example, is one of the most water-demanding country in Europe, but not much can be said about the sustainability of water use from a local perspective. The socio-economic data presented by the Italian Committee for Irrigation and Drainage [23], show that the size of the average farm is generally very small, particularly in Central, Southern and Insular regions, where there is a higher percentage of rural inhabitants. The management of irrigation water on these farms is generally autonomous, resulting in a large number of uncontrolled water withdrawals.
In the past this has produced situations of water scarcity at the basin scale, particularly for surface water. More recent legislation underlines the importance of the environmental aspects [24] and the need for an integrated approach that collectively encompasses the hydrological, socio-economic and governance components of freshwater systems [25,26,27,28]. This is a critical goal for all water-related stakeholders. The present study promotes the use of cooperative instruments among participants in the assessment and decision-making process in the water resources management field.
In this context, the most common problems in the approach to water resources management can be data scarcity, available data not well organized in databases, governance actions not planned at the basin scale, governance actions not easily shared among stakeholders, Decision Support System (DSS) outputs not made public, and DSS scenarios not sufficiently dynamic over a space/time scale.
Some of these problems could be easily solved with a governance plan and structural works, such as the expansion of monitoring networks, technological updating of the measuring stations, and new data collection methodologies. Data management could be solved with a set of tools providing better access to the data collected, so that information and knowledge can be widely shared, such as the interoperability of databases according to The Water Information System for Europe [29]. Finally, water governance often involves cooperation among different local institutions in the river basin district. However, it is sometimes very difficult to reach a common approach toward the sustainable management of the water resource and of complex environmental problems [30]. A Web-Based DSS may help all these actions, and bridge the gap between different local institutions and stakeholders in the river basin district [31].
The aim of this paper is to introduce the main aspects of the project called “Water Resources Management and Evaluation” (WRME), which offers an innovative and integrated solution to the issues previously mentioned. WRME is an online virtual desktop where researchers, administrators, and users can see or enter data, and update processing, depending on their skills. The ultimate goal is to verify the sustainability of the use and management of surface water resources. This result can easily be displayed on the river network, providing information on possible criticalities on surface water balance. Therefore, WRME can be an open development platform for researchers and technicians, with ease of consultation for administrators and users. These features distinguish this project from other similar WEB-GISs [cited at the top of this section and [32,33,34], where the hydrologic approach is developed, but is not compared with water withdrawals to identify a possible situation of imbalance and unsustainability. This work was carried out in WRME according to many aspects of the 2000/60/EC Directive [35], for example: to guarantee sustainable water usage by individuals and businesses and to analyze the features of each river basin, including the impact of human activity.
The next section describes the methodology, focusing on the architecture of the system, data collection and sharing, analysis and modeling processes. Then the methodology was applied to the case study of the Tiber River Basin, showing how it is possible to analyze data and plan a proactive approach to the problems. Remarks about the sustainability of water withdrawals and conclusions about goals and future developments of this project are presented in the last section.
2. Materials and Methods
The methodology adopted in the current study involves the integration of different activities and expertise: information technology structure with interoperability and the communicative evolution of the system (Section 2.1 and Section 2.2); hydrological data collection and modeling (Section 2.3 and Section 2.4); finally, a WEB-GIS support, particularly for evaluating the sustainability of water withdrawals (Section 2.5).
2.1. Information Technology Structure
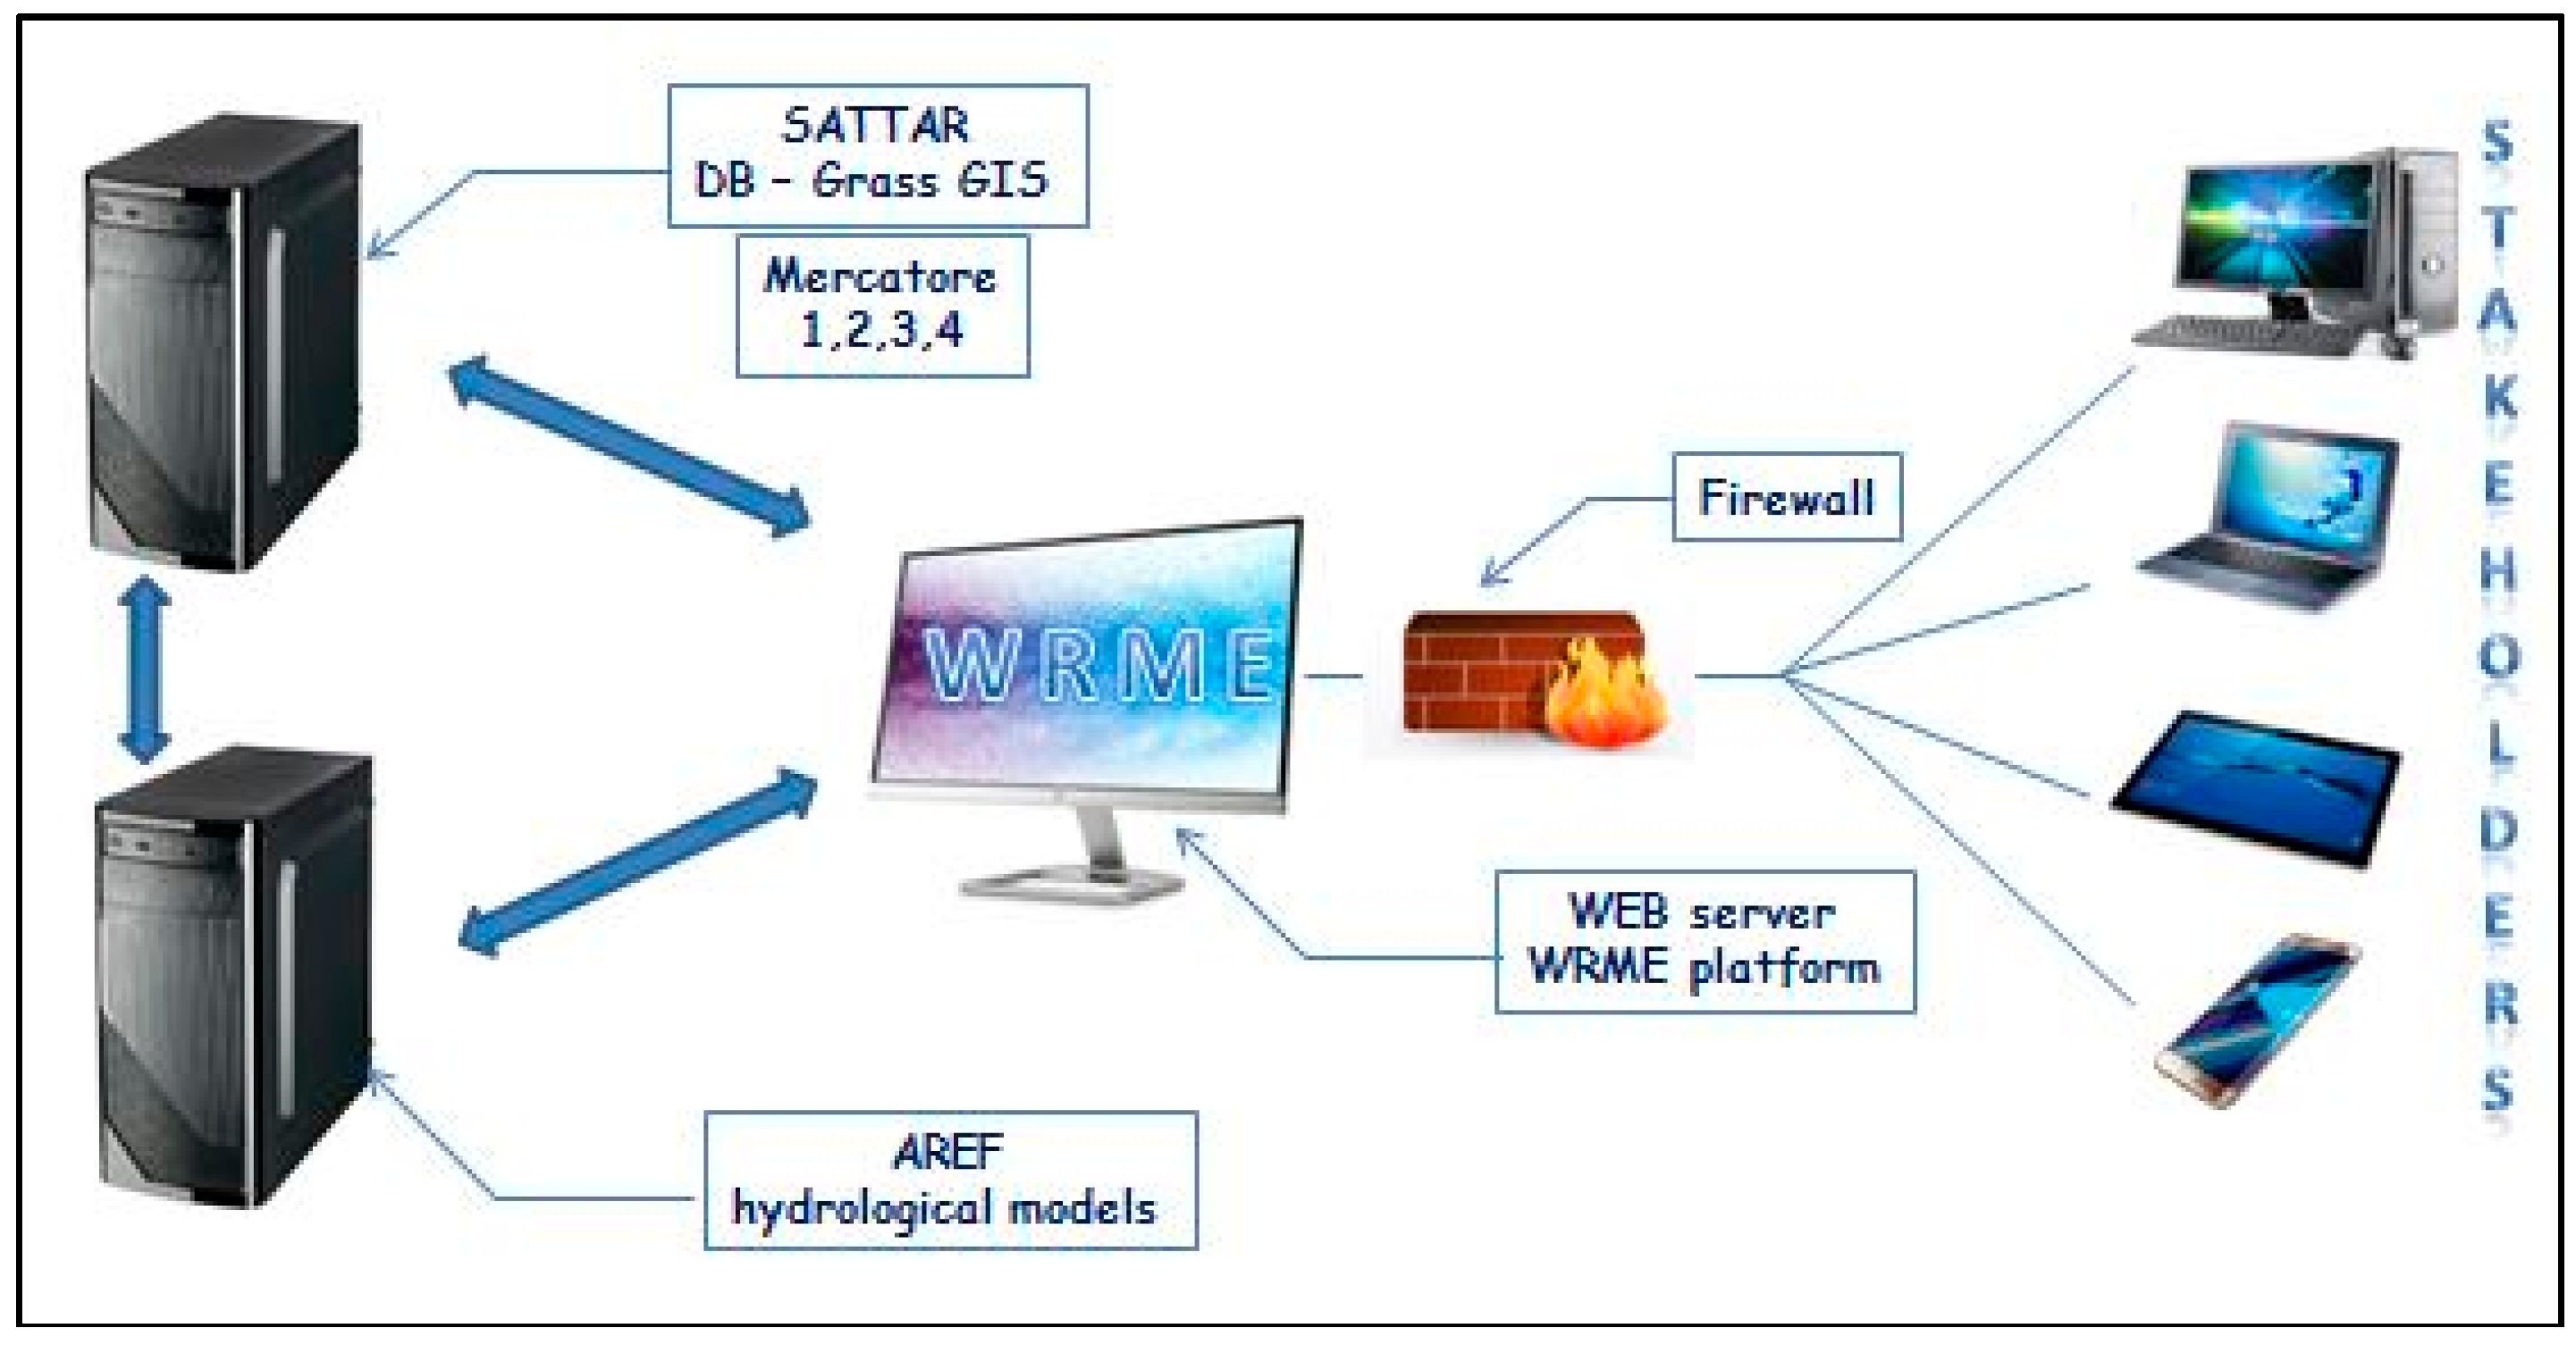
The structure of the WRME system was studied in order to integrate the features and capabilities of tools such as a database, a GIS engine and a series of models and algorithms for evaluating and managing water resources (Figure 1). All these functions are integrated in a web platform that not only displays, but is also an information and communication tool for the stakeholders. In terms of hardware structure, the system is based on cloud architecture where three virtual machines (namely Sattar, Aref, WEB Server) are entrusted with the services of GIS, cartographic and hydrological data elaborations and data storage. In particular Sattar itself hosts four other virtual machines, bridged together (namely Mercatore 1, 2, 3, 4), that run the Map Server so that heavy cartographic requests can be split on up to four parallel processes.
All these machines are linked one to another in a virtual network, where the hydrological data are stored on Sattar and are managed in a Postgres database. The hydrological modeling and subsequent management steps are assigned to a server named Aref. The operation of the system requires extensive interaction between the AREF and SATTAR servers, because the GIS running on SATTAR provides cartographic elaborations for the procedures installed on AREF. In this case the virtual network architecture provides high performances on data transfer and on reproducing all outputs, numerical and graphical, on screen.
2.2. Interoperability and Communicative Evolution of the System
Water resources management and the related decision-making process require a coordinated effort between the stakeholders, who represent different socio-economical groups, and government sections. The SDSS should facilitate interaction and communication among information systems of agencies in the basin. However, competing application programming platforms (i.e., Java, Visual Basic, FORTRAN, etc.), different operating systems (i.e., Window, Unix, Linux, etc.) and DSS (i.e., Oracle 9i, MS SQL Server, MySQL, etc.) make communication very difficult at times. Many technical and economic problems prevent standardization of the systems, so a possible solution is a centralized system that makes the databases and tools for decision making available at the basin level [36]. This also implies an agreement between all the stakeholders, both for updating the system and for the financial support.
The WRME project is oriented towards this goal. Hence, an open source software was adopted in compliance with standards defined by the Open Geospatial Consortium, granting compatibility with the most common instruments dealing with geospatial data [37,38,39]. A standardized interface that runs independent of the programming language and platform was used when developing integrated SDSS so that it can encourage widespread interoperability and rapid development [40].
Under this approach, the platform itself becomes a “discussion panel” for stakeholders, who can share in real time data, numerical evaluations, assessments and simulations, and, most importantly, the outcomes. To achieve this goal better, the web portal was developed in close synergy with the two main institutional entities that hold the data and are interested in the results: the Umbria Region and Tiber River Basin Authority. The feedback was very positive both in terms of data access service and in terms of processing and results. Further analysis will be possible through the dissemination of the web portal. The numbers of accesses to the web portal and the spontaneous collection of new hydrological data will be an index of the good communication of the system.
2.3. Data Collection and Sharing
The main premise of this project is that the data collected can be widely shared, according to the need for a web-based environment that hydrologists and stakeholders can use to share their data [41,42]. This feature is also extended to the modeling possibilities of the simulation engine, its parameter settings, and the results of the analysis, so that the decision-making process can be followed at all stages in a participatory approach, involving researchers, policy-makers, planners and users at all levels [43].
The first step is the creation of a shared database at the basin scale with user-friendly procedures for the continuous updating of data in order to avoid a progressive loss of interest in the system, in particular for water withdrawal data.
Keeping an up-to-date database is fundamental but two obstacles must be faced: on the one hand all the users of the system should be highly motivated to upload their latest data, while on the other, it is not so easy to implement uploading procedures that can fit all the different formats and archive structures used by the many users. For these reasons, the best procedure for users should easily identify the matches between their database fields and those in the WRME database by selecting the information to be transferred. This avoids automatic transfer of data that can be a source of numerous errors or complex post validation procedures, particularly for the water withdrawals database where some information fields need to be carefully evaluated (e.g., Qmax and Qavg, activation date and authorization date). This approach can be seen as trivial from an informatic point of view, but it is robust from a practical and application point of view.
So, in this project, it was decided to offer an effective update tool, which step-by-step, provides the possibility of setting a correspondence between the fields of two databases. In the case of data stored on spreadsheets or text files, ad hoc uploading procedures are required.
2.4. Data Analysis and Modeling Processes
The computational side of data analysis requires statistical evaluations, and in the hydraulic field there is a wide range of possibilities that can be enhanced by the WEB-GIS platform. In the WRME project, it was decided to focus on two particular aspects of water resources management, which are the basis for sustainability: the assessment of available water resources and the management of water withdrawals.
The main procedures implemented are aimed at defining some hydrological indices for the base flow value (BFI, Base Flow Index) [44] and low-flow discharges (Qn,m, minimum average flow of n consecutive days with return period of m years), to correctly assess the water resources (i.e., the available amount in a section of a network), either in order to issue/renew a water withdrawal or to study the status of the watercourse conditions. In order to complete the hydrological scenario, it is very useful to use flow duration curves (FDCs) for analyzing total flows.
Finally, a WEB-GIS tool was developed to analyze the water withdrawals at the basin or sub-basin scale. This is a very powerful instrument, the use of which can be extended to other spatial information sources, such as sewage plant output, small reservoirs and mini-hydro plants, all situations which are very interesting in a sustainable river basin management plan.
This data analysis and modeling process is innovative because all numerical methods and models used for calculating and estimating the indices are transferred and developed inside the web system offering shared access in real-time to all stakeholders. Many of these stakeholders would not be able to process these analyses independently, even if the necessary data were provided. The WRME portal, on the other hand, allows processing to be handled with extreme flexibility both in choosing input data and in evaluating the corresponding results.
2.4.1. BFI Calculation and Estimation
Separation of the base flow from the time series of total daily flow is often used to identify contributions from springs and groundwater [45]. In this context it is now clear that there is a close relationship between the geology of the basin, the base flow and low flow indices [46,47]. Hydrological drought duration is also determined by BFI, which reflects storage properties of the catchments [48].
In this study, to calculate the BFI value, the traditional technique by L’vovich [49] and then updated by Casadei [50] was implemented. This approach was preferred to other techniques, but it is necessary to adopt a homogeneous method in the whole study area, as shown by the good correlation between the BFI values calculated with different methods [51].
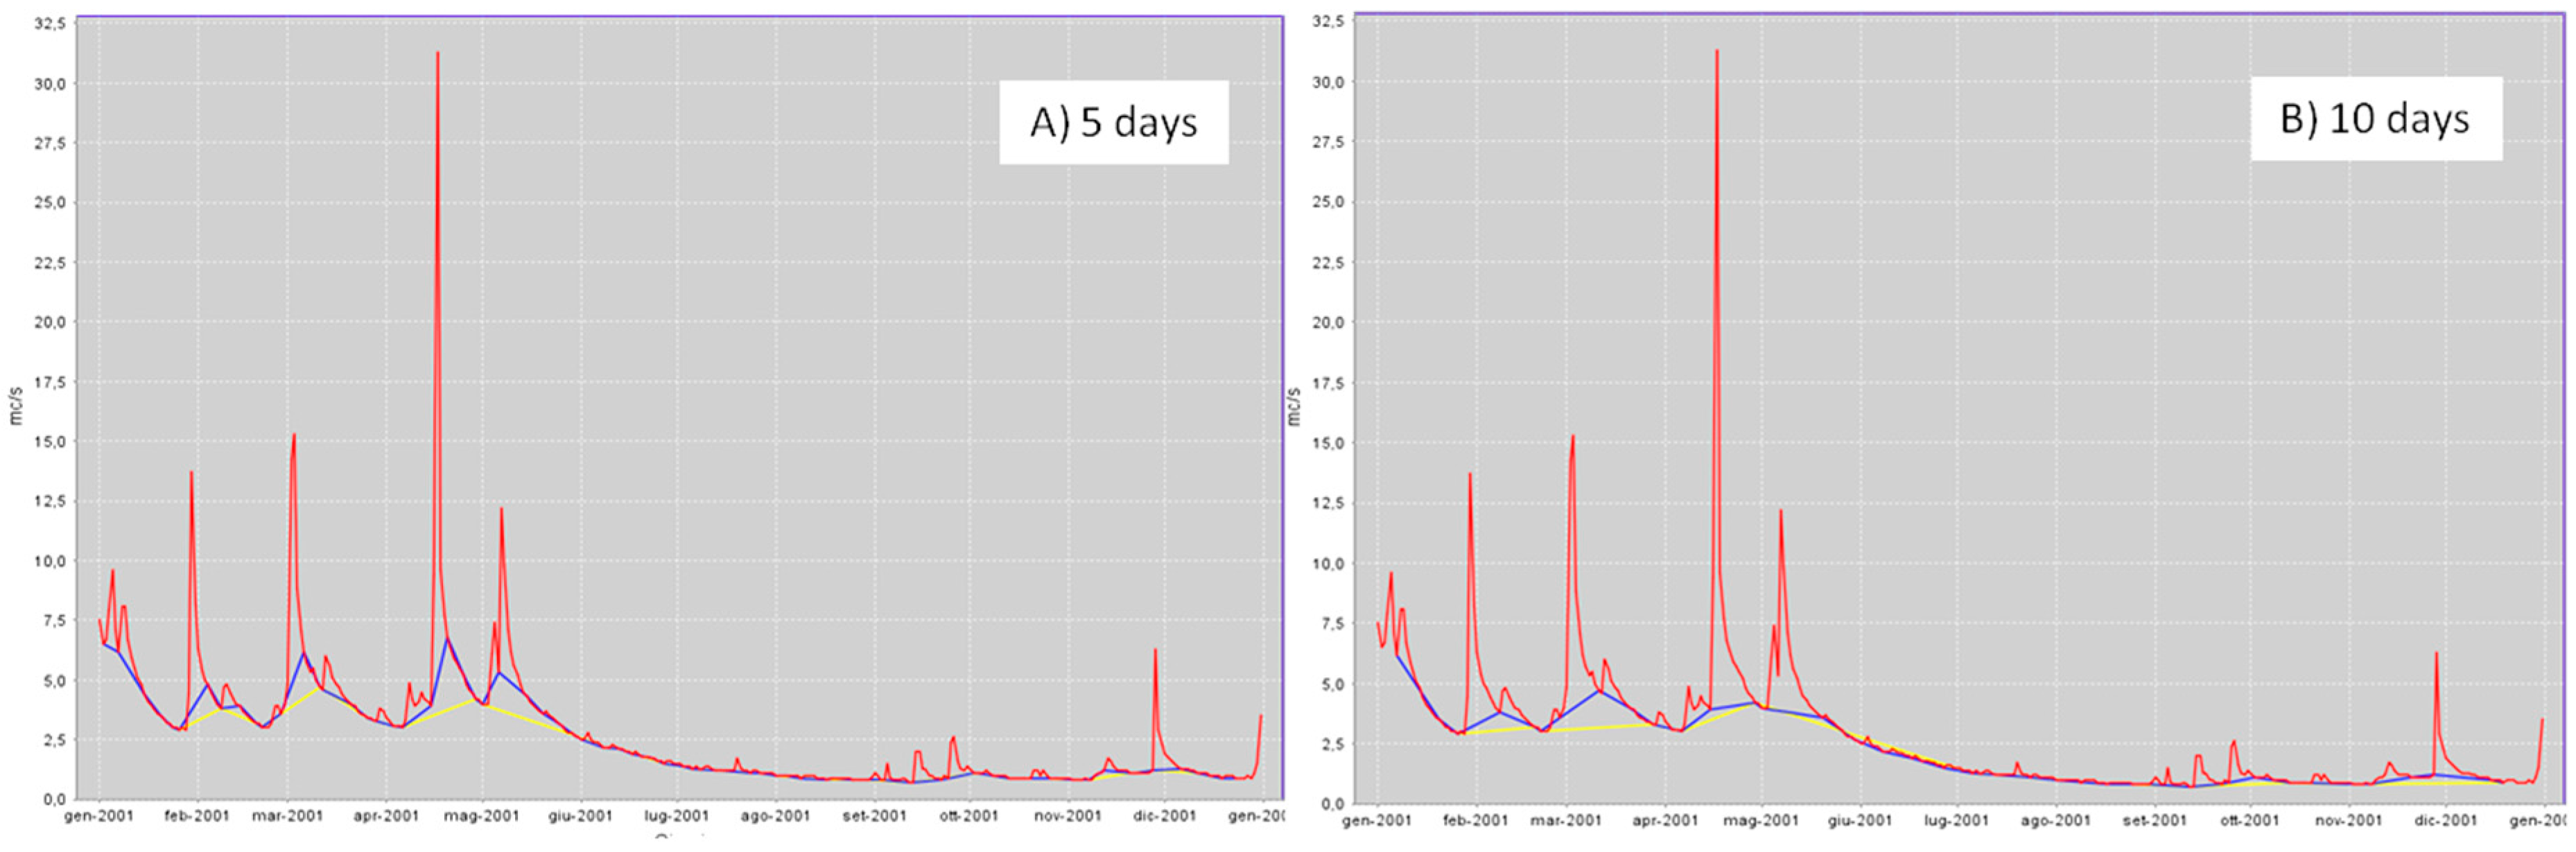
The L’vovich method is parameterized as a function of the number of days of the non-overlapping period in which the time series is divided, usually five days, but the software can assume values ranging from 3 to 10. By means of the website tool, it is possible to compare the effect of the increase in this parameter on the BFI value. The result is to flatten the base flow polyline, reduce the number of points taken into account and thus lower the accuracy in the calculation of BFI; in fact a polyline with few vertices is more likely to intersect with the initial hydrograph, resulting in a discrepancy in volume values, from a physical point of view (Figure 2).
With the same tool, it is also easy to compare the BFI values calculated on the entire time series of data or portions of it, in order to evaluate the effect of anthropic interventions in the hydrographic basin landscape, which influence the natural flow regime (land use variation, new reservoirs and water withdrawals).
However, the usefulness of this index is related to the possibility of finding relationships for evaluating the index starting from territorial parameters easily obtainable, thus extending the BFI value to all possible sections of the basin, even in the absence of monitoring stations. As mentioned, BFI is closely related to the nature of the hydrogeological formations in the basin. Indeed the occurrence of permeable formations in the basin is directly proportional to the index calculated on the basis of observed data.
The BFI of the basin is thus obtained using a weighted average method, compared to areas and BFI typical of single formations, assuming that every formation has a specific value of BFI with a sufficiently small range of variation:
where:
- BFIest,j = estimated BFI in the jth basin;
- Aj,i = superficial extension of the ith hydrogeological formation in the jth basin;
- BFIfrm,i = BFI associated to the ith hydrogeological formation;
- Atot,j = total basin area.
In Equation (1) the BFIfrm assumes a prime role. For its calculation, the study can be better conducted in the presence of a large number of gauging sections and upstream basins that are homogeneous in terms of geological features and that have a minor anthropic influence. These conditions are not always found on a river basin of large and medium size, however, experiments conducted in the main basins of Central Italy, the Tiber and Arno Rivers [44,52], have shown the feasibility of achieving good results in estimating the BFI, even with non-homogeneous data in terms of geology and human activity.
2.4.2. Qn,m Calculation and Estimation
Qn,m is a low flow index of the river, represented by the time series of annual minimum flow averaged over an interval of n consecutive days with a return time of m years. This is a method implemented by various US environmental protection agencies and research centers [53]. In Italy it was used for the first time in the Tiber River Basin with the value of Q7,10 [54,55].
According to Singh and Stall [56], this index is mainly influenced by the physiography and hydrology of the basin. However the dams existing along the network and withdrawals management, like other human factors, play an important role in Qn,m evaluation.
The estimate of Qn,m from a historical time series of daily flow is a numerical-statistical procedure that has a few sensitive passages. The first step is the calculation of the minimum average daily flow over n days for each year of the time series. From these values, the average and variance are calculated in order to evaluate the parameters of the Weibull–Gumbel distribution
where:
- ԑ = lower limit of the distribution;
- θ = scale parameter with the same size as the random variable x;
- λ = shape parameter, non-dimensional parameter.
In order to produce estimates of the distribution parameters a more sophisticated procedure was implemented [57,58], especially for estimating the parameter λ, from which the parameter ε also derives, essential for locating the minimum value of the distribution itself.
The final step is the choice of the return period m associated to our time series of a minimum of n days. In the WRME portal, the values of both parameters n and m can be freely chosen.
Also, for this index a regionalization process is studied. It is based on the regression equations between the calculated data and the hydrogeological parameters of the basin or sub-basin studied. In the case of Q7,10, from a methodological point of view, the regionalization process makes use of one or more relationships like the following:
where the constants are taken from the interpolation procedure conducted starting from the values of calculated Q7,10, possibly on natural and naturalized flow values (i.e., not influenced by human factors), and the methodological approach does not vary with the change of the characteristics of the index in terms of n and m. It should be noted that the polynomial estimate does not exceed in any case the third order (k = 3).
2.4.3. Flow Duration Curves
Daily streamflows are often represented by flow duration curves (FDCs) [59]. This approach has been widely applied to analyze changes in the intra-annual distribution of streamflow in many fields and applications, e.g., in order to identify the best water management practices, in particular in ungauged basins [60], to evaluate flow data quality control [61,62] and to design hydropower plants [63,64,65].
Therefore, a model that evaluates the available water in terms of duration curves was also implemented in the platform.
The use of FDC for assessing available water resources is focused on three main procedures:
- reconstruction of the natural flows time series;
- approximation of the duration curves with a three-parameter Log-Normal frequency distribution;
- regionalization of duration curves using characteristic parameters of the basin.
For each hydrometric station, the reconstruction of natural flows was achieved by combining, in chronological order, the flows measured at the station with the water withdrawals carried out upstream, by means of the following steps:
- -
- georeferencing of the gauging stations and of all water withdrawals within the hydrographic network upstream from the gauging station. In the case of a return section different from the withdrawal section, the position of the return with regard to the gauging station must also be verified;
- -
- checking the year of the flow data processing against the year of activation and expiration of the water withdrawal data, thus checking whether the withdrawal is currently taking place, or if it must be evaluated only in the period of activity;
- -
- checking the usage situation for the water withdrawals, expired or without an expiration date, considering active those in amnesty, inquiry and renewal conditions, or with specific indications for the single case;
- -
- checking the dissipative efficiency coefficient (E), which quantifies the consumption of water (1 = max, 0 = null);
- -
- application of the “law of use” attributed to each water withdrawal as a function of the characteristic use, when the withdrawal is not subject to monitoring.
The natural flows are thus determined by means of the equation
where:
- QN = natural flow;
- QM = observed flow;
- ΔV/Δt = daily reservoir variation, if there is a dam;
- QU = daily flow derived from the river or from the reservoir, if monitored;
- Qmax = maximum authorized flow, if withdrawal is not subject to monitoring;
- α = dimensionless coefficient that describes the daily variability of the flows withdrawn in an average year;
- E = dissipative efficiency.
If the water management rule provides an inflow in the basin, Equation (4) becomes:
The time series of the natural flows are used to construct the relative FDC. To compare the FDCs of different sized basins, the flow is expressed as a percentage in relation to the average flow of the time series (ADF, Average Daily Flow). These values can be regularized with a log-normal type probability distribution [66]; the result obtained is:
where:
- z = reduced variable, related to duration;
- a = “shape” parameter, functions of the moments of the first and second order;
- b = “height” parameter functions of the moments of the first and second order;
- qo = Qo/ADF = lower limit of the distribution.
The preceding expressions allow the entire duration curve in each gauging section of interest to be constructed and the FDC estimation in the ungauged sections to be studied.
Parameters a and b can be considered to be reasonably dependent on the hydrogeological characteristics of the basin. For example, in basins that are permeable, with important aquifer formations, the flows and relative duration curves are quite regular and high. Quite the opposite can be observed for impermeable basins, where flows are very irregular, as they are subject to the same variability of precipitation. Thus there is a significant correlation between the parameters a and b with the hydrogeological characteristics of the basin, which in turn can be represented by the Base Flow Index.
To complete the definition of a duration curve by means of a log-normal distribution, the lower limit of the distribution qo, or the absolute low flow, is also an important parameter. For significant perennial streams, it cannot be said that the minimum flow is absolutely zero, because this would lead to systematically underestimating the smallest flows. It is also clear that with the same values of AREA, qo is greatly influenced by the hydrogeological characteristics of the basin and therefore, for the aforesaid reasons, also by the BFI.
Lastly the ADF, in an area with uniform rainfall, can be assumed to be dependent on the AREA and on the BFI, in particular ADF/AREA = f(BFI).
In short, a good parameter (p) estimation of the log normal distribution is possible by means of the equation:
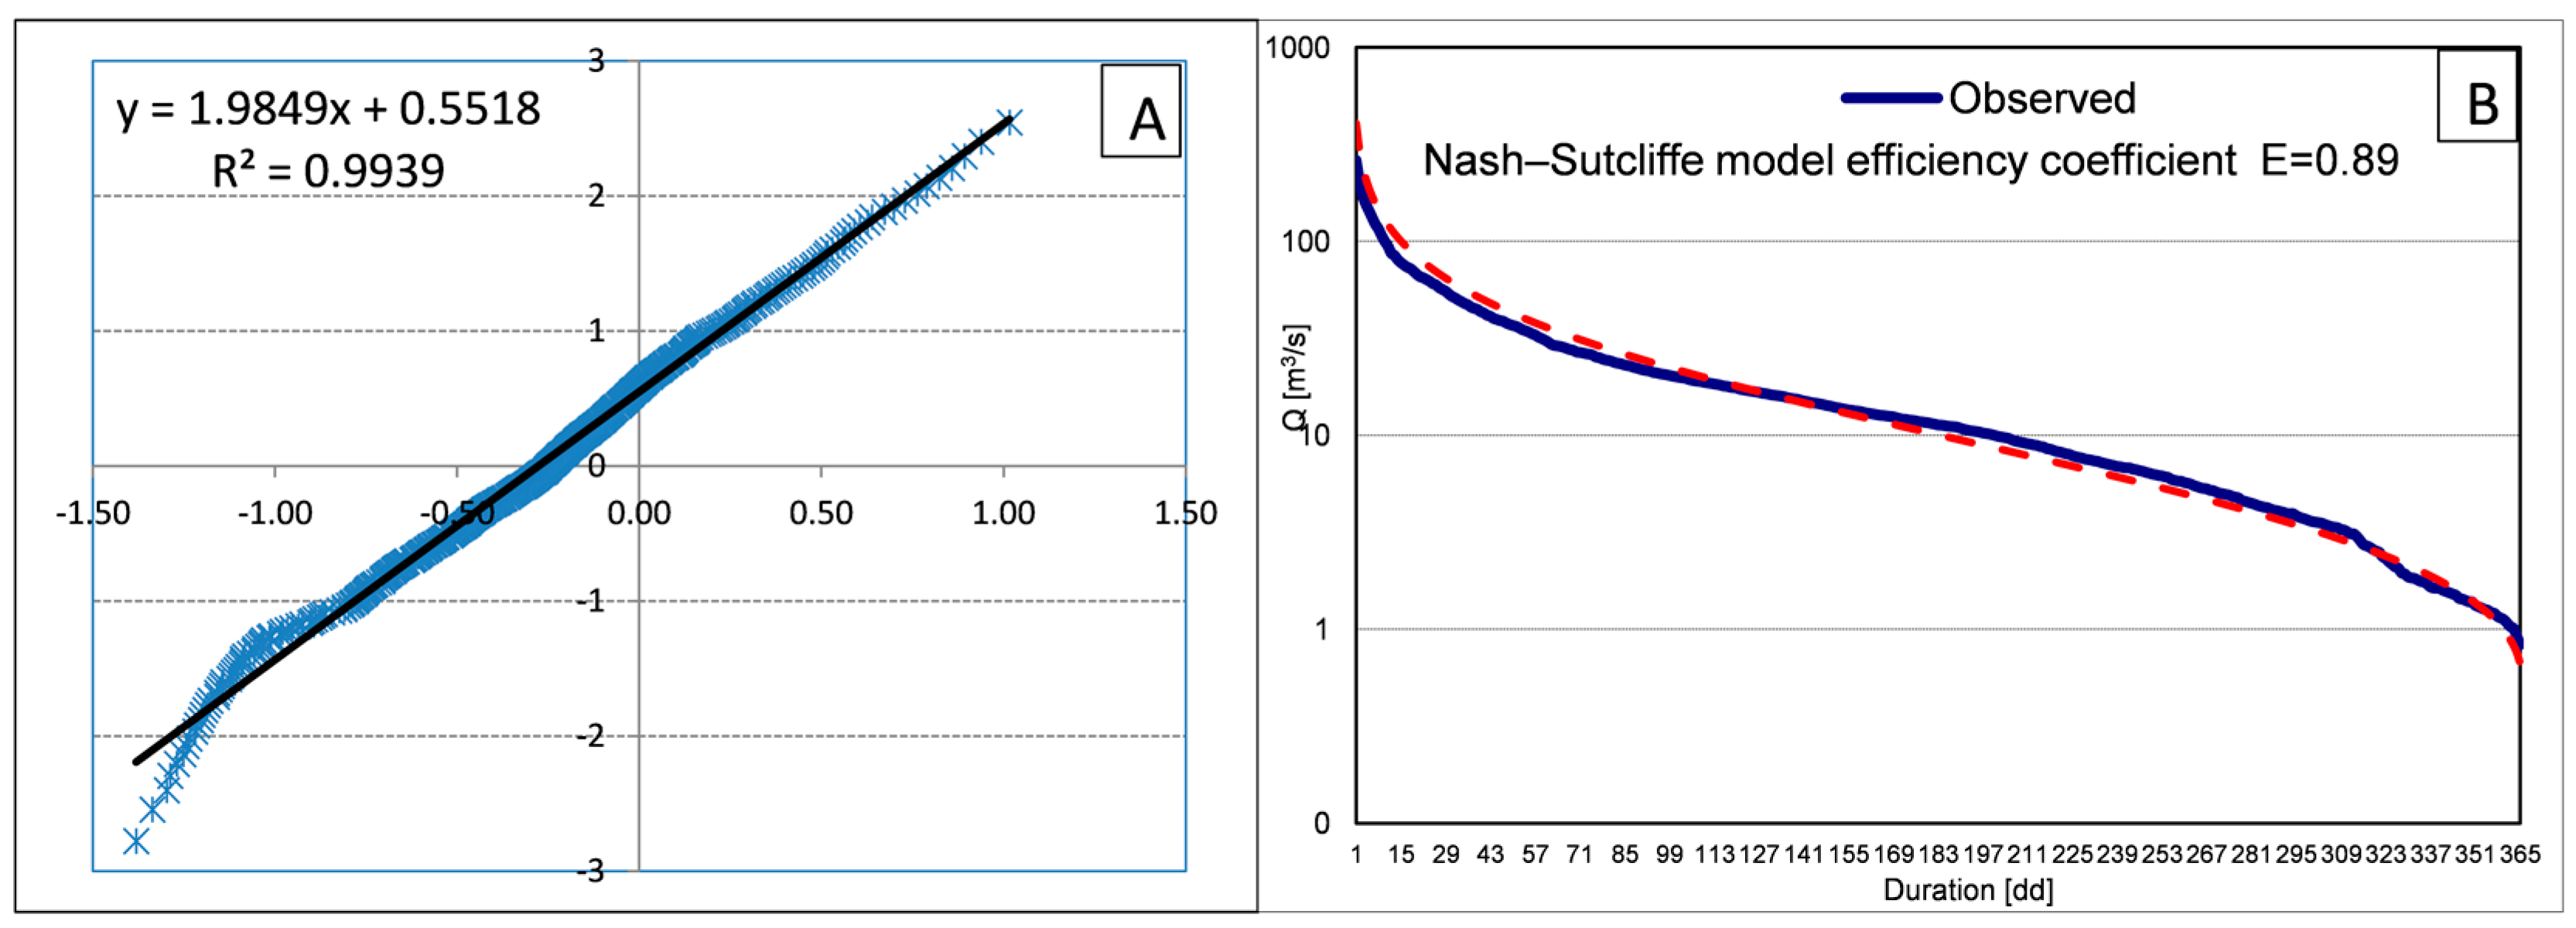
Once the various estimates of the parameters have been made explicit, it is possible to evaluate the entire duration curve in linearized form and annualized form, respectively (Figure 3).
The combination of these procedures makes it possible to estimate the superficial water resources available in the basin through a set of FDCs (natural, measurable and residual). This implies a thorough knowledge of the time series of the observed data, of the water withdrawals active in the basin and its geomorphology. This is possible thanks to the full integration between the hydrological database, the calculation engine and the GIS system. The main river network can be divided into sections for which it is possible to know all the relevant information that influences the availability of water, such as AREA and hydrogeological formations in the basin. With these data, through the regionalization procedure, the natural FDC for each section can be determined. However, this information cannot be considered enough for managing the resource at the level of the section concerned. In fact, the possibility of using the resource evaluated for dissipative uses, such as that of irrigation, is not only bound to the availability of water in the section concerned, but also to the fact that all the uses downstream must be provided with an amount of water that meets their demand according to the acquired rights. This appears obvious from an administrative and legal point of view, but it is also much more difficult to model with computational tools, especially when applied to complex river networks.
A possible solution to this problem is to overlay the hydrological and hydrogeological information that quantifies the available natural resources with the information about all the water withdrawal data. Once this last database is filled with the information about water withdrawals, it is possible to calculate the measurable duration curve starting from the natural one (obtained with a regionalization procedure), by subtracting all the water withdrawals of the upstream basins, so it is possible to calculate the duration curve of the residual flows taking into account all the existing water withdrawals of the downstream basins. The measurable FDC can be carried out by evaluating the yearly trend of water use, so that each of the uses can be expressed with a duration curve, which is subtracted from the natural duration curve of all the sections downstream [67]. For each evaluated duration, the residual FDC is the minimum of the flows with the same duration calculated on all the measurable FDCs of the downstream sections.
The results of this methodology can be obtained for each section of the hydraulic network. Moreover, the natural (Nat), measurable (Meas), and residual (Res) FDCs and the minimum instream flow (MIF) can be visualized with graphics and exported in a numerical table (see next section). This output provides an important description of the hydraulic regime for each river section and of the water withdrawals status in its upstream basin. Finally, it is possible to evaluate the water resource still available for dissipative uses by means of residual FDC.
2.5. WEB-GIS and Management of Withdrawals
Steven et al. [68] have highlighted that water withdrawals are predicted to increase by 50% in developing countries and by 18% in developed countries by 2025. This increased water demand will lead to a freshwater shortage of 40% by 2030, which can be increased by climate change impacts [69]. In this study, an extension of the database with the information about water withdrawals was designed, and some specific tools were developed for managing water withdrawals.
Water withdrawals data involve different uses, administrations and authorities and generally their databases are highly nonhomogeneous and incomplete. The solution to this problem requires a basin-scale approach through the creation of a unified database of water withdrawals. This database should also be shared via a WEB portal where each administration can access, modify, update old data and insert new data. A unified and up-to-date database of water withdrawals is critical because each user can then see all the upstream data of each river section in the basin of interest, regardless of the administrative boundaries for issuing water withdrawals. This goal is crucial for the Basin Authority, which needs to have an updated view of the situation of water withdrawals of the entire basin or in sub-basins subject to specific planning projects.
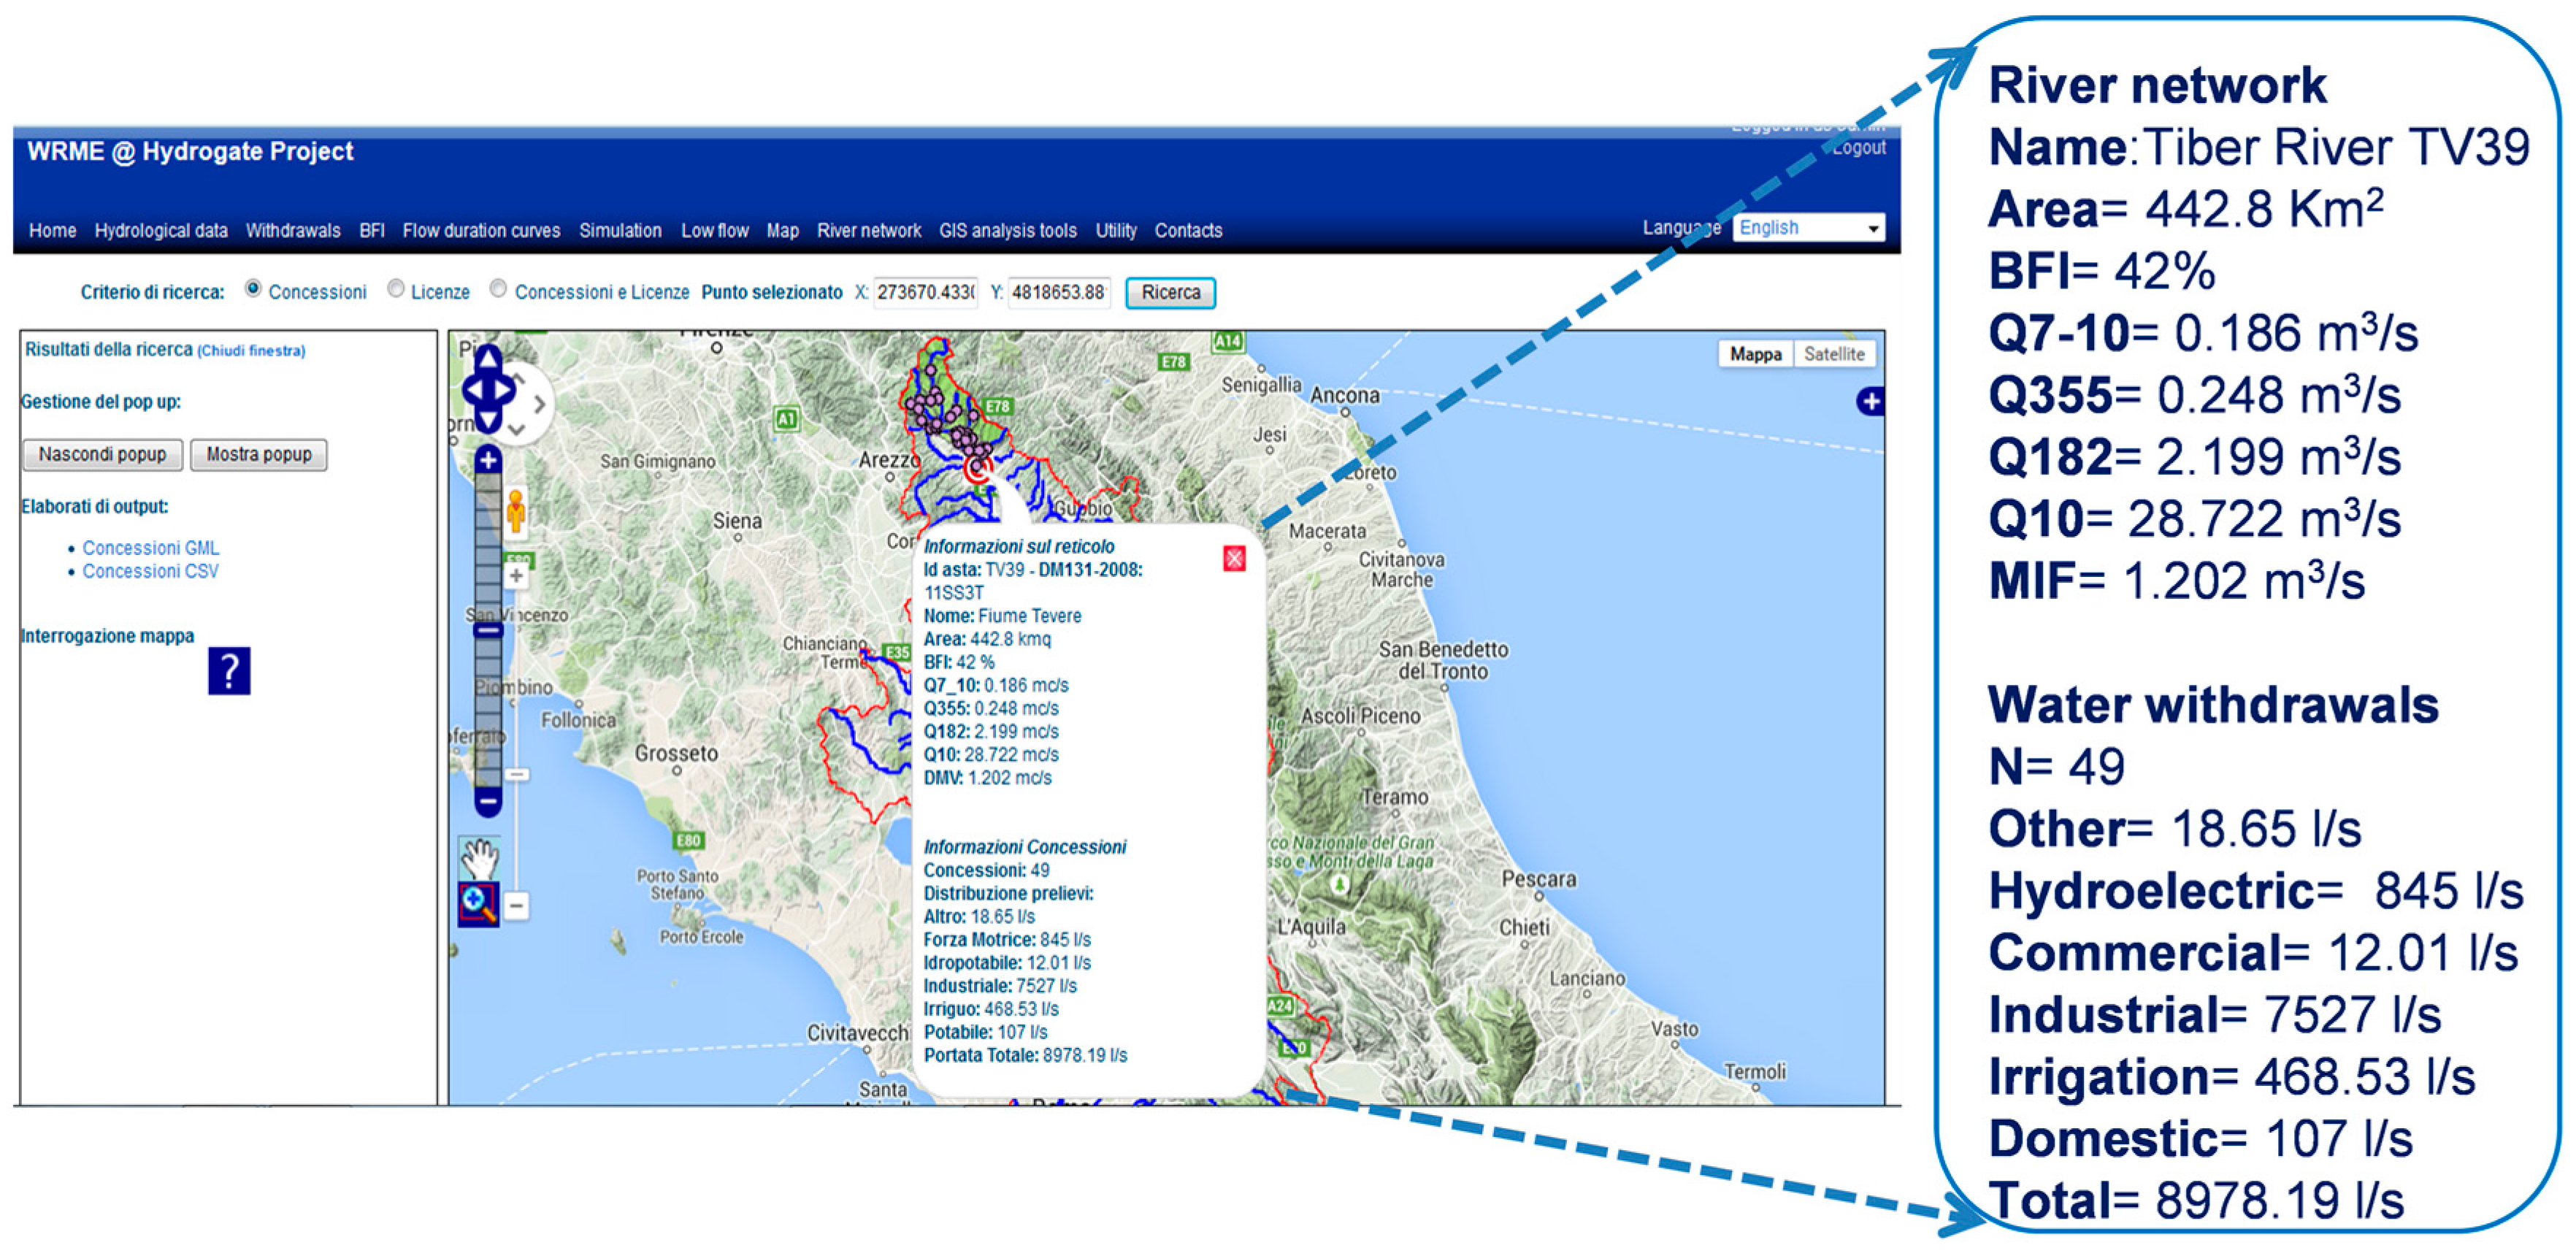
For this reason, the WRME system develops a significant section of the portal, making it possible for the database of water withdrawals to be analyzed by cartography. In this section the user can easily analyze the spatial distribution of georeferenced water withdrawals, even at the sub-basin scale. This result is very significant in the reconstruction of natural flows, as emphasized in the previous section.
A new tool has been developed in the system which makes it possible to compare the hydrogeological features and low flow indices of the sub-basins. This information, which is particularly important especially during drought periods, can be compared and evaluated in term of the sustainability of different water uses or different water efficiency in irrigation practices.
From a practical viewpoint, any change or new entry in water withdrawals must be assessed carefully, taking into account the existing withdrawals and hydrological situation of the basin concerned. For the definition of the condition of the river, hydrological indices (such as BFI, Q7,10, FDCs) were calculated from the hydrological database. For the existing water withdrawals, an analysis procedure was developed, which starting from the point selected directly by clicking on the map, finds the upstream basin and, by means of overlay procedures, identifies the water uses in the basin. In order to obtain a more detailed assessment, a search tool was developed so that water withdrawals can be retrieved on the basis of the type of use, the amount of water allowed, and the administrative status, and all these data can also be exported in a csv file.
The result of this methodology is the possibility of comparing the available water and the water required for different hydrological conditions, as shown in the next section.
3. Results and Discussion
The case study clearly shows the results of this project and highlights the main aspects to be discussed in order to co-develop the methodology. The process described in the previous paragraphs was applied to the Tiber River Basin located in central Italy, occupying an area of 17,462 km2 (Figure 4).
Throughout the basin the multipurpose use of the water resource and the need for correct evaluation and management policies is a very common issue, according to the aim and key points of the Directive 2000/60/EC of the European Parliament [35]. Moreover, the data from the water withdrawals database show that about 70 percent of all the freshwater withdrawals go towards irrigation use, with a peak of 80 percent in the Upper Tiber River Basin.
This aspect is highly relevant, not only from an administrative point of view, but also from a technical one, because irrigation use is concentrated in a four-month period (June–September), which is also a critical period for drought and hot weather; hence, there may be limitations on volume and time of day use.
In order to have a proactive approach in the management of the surface water resource during the drought period, a web site (http://hydrogate.unipg.it/wrme/) was designed, which is now in its beta version. In this portal all the methodologies described above are operative and accessible in a user-friendly version.
The hydrological database of the Tiber River Basin is now accessible online, with different levels of access according to the typology of user and the kind of information required. At the present time the database is made up of about 11,800 years of hydro-meteorological data and about 10,500 records regarding water withdrawals.
The data can be viewed in both numeric and graphic format and if needed, can be easily exported in various file formats. Different tools are available to calculate the BFI and Qn,m indices.
The BFI calculation tool allows the user to quickly and easily process very interesting values of this index. For example, the BFI calculation for the S. Lucia hydrometric station on the Tiber River can be elaborated for the entire time series (Figure 5), obtaining a BFI = 43.87. Selecting more and more recent time series, the BFI increases: 1949–2004 BFI = 45.76, 1970–2004 BFI = 49.64; 1995–2004 BFI = 56.36; 2000–2004 BFI = 61.47.
Increase in the index value is more evident with recent time series, demonstrating a clear influence on base flow due to anthropogenic causes, in this case the Montedoglio reservoir. In recent years, the base flow in this part of the river has been artificially increased by the water released from the dam, allowing the water course to have better quality and quantity, and supporting direct use (water withdrawals, especially irrigation) and indirect use (social activities and habitat) of the water resource. Such analysis is of utmost importance for the assessment and management of water resources in combination with climatic changes that increase the probability of drought periods.
It is also possible to generate maps of the indices at the basin scale such as those shown in Figure 6a, where the potential of the basin, in terms of hydrogeology, is clearly visualized. In fact, the map shows a very clear view of the basin, highlighting the Nera-Velino complex (in the east central) that has higher values primarily due to carbonate formations, inducing a very high BFI value (about 90%). Increase in the base flow is also clear along the main stream of the Tiber River, from north to south due to the progressive addition of some tributaries, in particular the Chiascio River, Nera River and Aniene River.
As for Q7,10 (Figure 6b) the situation is somewhat similar to that of BFI, but in this case, it should be kept in mind that this index weighs the extension of the upstream basin, while BFI is a percentage index, Q7,10 is expressed in m3/s. This explains the progressive increase in the value of the index on the main stream of the Tiber River from upstream to downstream.
The indices represented in Figure 6a,b are the result of the regionalization process in a “natural” basin scenario. The influence of withdrawals over the water resources may noticeably change the natural scenario, especially in large basins.
Therefore, it is very interesting to analyze this issue in terms of flow duration curves, by means of the natural, measurable and residual FDCs (see Section 2.4.3). The residual FDC makes it possible to evaluate the water resource still available for dissipative use. In Figure 7 the graph calculated for a section of the Upper Tiber River shows this result. It is possible to observe how the measurable curve decreases rapidly at the duration 350 days. This duration is highly correlated to the irrigation period, indicating the presence of excessive water withdrawals upstream. The residual duration curve falls to zero at an even lower duration value (275 days), thus highlighting a critical situation for new dissipative uses in this section according to the existing water withdrawals in the downstream basin.
Regarding this, it must be said that they indicate a possible imbalance between flows and water withdrawals already issued. Actually, there are measures to preserve the ecological status of the river and the threshold of minimum instream flow (MIF) is adopted. In a critical period, it is also possible to evaluate the temporary suspension of dissipative water uses.
In this regard, it is very clear that the system of water withdrawals must be reorganized in this area of the basin. The WEB-GIS of water withdrawals will be the main instrument to implement this reorganization, because for each sub-basin it is possible to highlight imbalances between water withdrawals and low flows.
Figure 8 shows an example of this analysis, where it is possible to point out the data of each use and identify unbalanced situation, so as to introduce a proactive correction in water resource management of the sub-basin.
The application of this methodology to the Upper Tiber River Basin shows that, during the last 30 years, this region has been stressed by severe water crisis. In the past, drought periods brought this issue directly to the attention of the public awareness, now it is possible to plan proactive approaches to the problems by an accurate data analysis.
4. Conclusions
During these last years the situation highlighted in the Tiber River Basin has been quite common among other Italian and even European river basins, especially in the Mediterranean area. The methodology described in this paper provides a practical approach to evaluate this problem of imbalance between water resources and demand. The web-based DSS approach is indeed effective and helpful in producing feasible and sustainable scenarios, for example to help the agricultural sector in water crisis periods.
The case study was very useful for validating both the methodology and the procedures. The open software tools can support water resource evaluation and management policies at the basin level, providing multiple datasets from several sources, all within a single user-friendly web portal. Hence, this project has been a unique opportunity to collect, cross reference and consolidate very important data, that is usually not made available or that is difficult to retrieve. The results of the evaluation of the available water resource highlight the importance of a sustainable approach to water management, especially when large multipurpose uses are present in the basin. In this case, a review of water withdrawals scenarios can be evaluated with the geoprocessing tool at every point of a river network.
Future developments are oriented towards improvement of hydrological database, with groundwater data, and evaluation of water quality. In fact, the fulfillment of the “good ecological status” objectives set by the Water Framework Directive, with a deadline of 2027, will be an additional difficult task for water managers. The implementation of the Water Framework Directive is also based on information and consultation when river basin management plans are established. WRME can be an open access platform to promote this activity, to develop the exchange of information and to share problems and solutions.
For this reason, WRME offers an innovative solution to the issues mentioned, however, future developments cannot only be limited to academic efforts concerning techno-scientific investigations. They will need the participation of institutions and of all the stakeholders taking part in the testing process of this methodology. This means that water management requires a holistic approach, through the integration of several components and subcomponents due to the interrelationship and interactions in water demand and availability. Only a real and complete sharing of the decision support tools and systems, such as that described here, amongst all participants in the managing process will lead to further development in the study. This could produce relevant and appropriate outcomes for the implementation of sustainable policy in water resources management.
Acknowledgments
We would like to thank the Umbria Region and the Tiber River Basin Authority for their technical support, and the data they provided.
Author Contributions
This research presented here was carried out in collaboration between all authors. Stefano Casadei coordinated the research group and contributed in designing, developing and testing all the models. Michele Bellezza and Arnaldo Pierleoni developed the WRME Decision Support System. All authors discussed the structure and comment on the manuscript at all stages.
Conflicts of Interest
The authors declare no conflict of interest.
References
- Akhbari, M.; Grigg, N.S. A Framework for an Agent-Based Model to Manage Water Resources Conflicts. Water Resour. Manag. 2013, 27, 4039–4052. [Google Scholar] [CrossRef]
- Choi, J.Y.; Engel, B.A.; Farnsworth, R.L. Web-based GIS and spatial decision support system for watershed management. J. Hydroinform. 2005, 7, 165–174. [Google Scholar]
- Sridhar, P.S.V.S.; Jowhar, T.N.; Garg, A.B.; Kedareswarudu, U. A Framework of Information Technology for Water Resources Management. Int. J. Comput. Appl. 2011, 30, 21–25. [Google Scholar] [CrossRef]
- Dangermond, J.; Maidment, D. Integrating water resources information using GIS and the WEB. In Proceedings of the American Water Resource Association Spring Specialty Conference, Orlando, FL, USA, 29–31 March 2010; pp. 1–10. [Google Scholar]
- Hewett, C.J.M.; Doyle, A.; Quinn, P.F. Towards a hydroinformatics framework to aid decision making for catchment management. J. Hydroinform. 2010, 12, 119–139. [Google Scholar] [CrossRef]
- Salewicz, K.A.; Nakayama, M. Development of a web-based decision support system (DSS) for managing large international rivers. Glob. Environ. Chang. 2004, 14, 25–37. [Google Scholar] [CrossRef]
- Pierleoni, A.; Bellezza, M.; Casadei, S.; Manciola, P. Multipurpose water use in a system of reservoirs. IAHS Publ. 2007, 315, 107–116. [Google Scholar]
- Casadei, S.; Pierleoni, A.; Bellezza, M. Integrated water resources management in a lake system: A case study in central Italy. Water 2016, 8, 570. [Google Scholar] [CrossRef]
- Chen, W.; He, B.; Ma, J.; Wang, C. A WebGIS-based flood control management system for small reservoirs: A case study in the lower reaches of the Yangtze River. J. Hydroinform. 2017, 19, 299–314. [Google Scholar] [CrossRef]
- Huo, A.D.; Dang, J.; Songe, J.X.; Chen, X.H.; Mao, H.R. Simulation modeling for water governance in basins based on surface water and groundwater. Agric. Water Manag. 2016, 174, 22–29. [Google Scholar] [CrossRef]
- Laraichi, S.; Hammani, A.; Bouignane, A. Data integration as the key to building a decision support system for groundwater management: Case of Saiss aquifers, Morocco. Groundw. Sustain. Dev. 2016, 2–3, 7–15. [Google Scholar] [CrossRef]
- Lu, H.; Ren, L.; Chen, Y.; Tian, P.; Liu, J. A cloud model based multi-attribute decision making approach for selection and evaluation of groundwater management schemes. J. Hydrol. 2017, 555, 881–893. [Google Scholar] [CrossRef]
- Manos, B.; Bournaris, T.; Silleos, N.; Antonopoulos, V.; Papathanasiou, J. A decision support system approach for rivers monitoring and sustainable management. Environ. Monit. Assess. 2004, 96, 85–98. [Google Scholar] [CrossRef] [PubMed]
- Torretta, V. The Sustainable Use of Water Resources: A Technical Support for Planning. A Case Study. Sustainability 2014, 6, 8128–8148. [Google Scholar] [CrossRef] [Green Version]
- Chien, N.P.; Lautz, L.K. Discriminant analysis as a decision-making tool for geochemically fingerprinting sources of groundwater salinity. Sci. Total Environ. 2018, 618, 379–387. [Google Scholar] [CrossRef] [PubMed]
- Lautz, L.K.; Hoke, G.D.; Lu, Z.; Siegel, D.I.; Christian, K.; Kessler, J.D.; Teale, N.G. Using discriminant analysis to determine sources of salinity in shallow groundwater prior to hydraulic fracturing. Environ. Sci. Technol. 2014, 48, 9061–9069. [Google Scholar] [CrossRef] [PubMed]
- Manos, B.; Ciani, A.; Bournaris, T.; Vassiliadou, I.; Papathanasiou, J. A taxonomy survey of decision support systems in agriculture. Agric. Econ. Rev. 2004, 5, 80–94. [Google Scholar]
- Manos, B.; Papathanasiou, J.; Bournaris, T.; Voudouris, K. A DSS for Sustainable Development and Environmental Protection of Agricultural Regions. Environ. Monit. Assess. 2010, 164, 43–52. [Google Scholar] [CrossRef] [PubMed]
- Bournaris, T.; Papathanasiou, J.; Manos, B.; Kazakis, N.; Voudouris, K. Support of irrigation water use and eco-friendly decision process in agricultural production planning. Oper. Res. 2015, 15, 289–306. [Google Scholar] [CrossRef]
- Kumar, S.; Godrej, A.N.; Grizzard, T.J. A web-based environmental decision support system for legacy models. J. Hydroinform. 2015, 17, 874–890. [Google Scholar] [CrossRef]
- Alcamo, J.; Henrichs, T.; Rösch, T. World Water in 2025—Global Modeling and Scenario Analysis for the World Commission on Water for the 21st Century; Report A0002; Center for Environmental Systems Research, University of Kassel: Kassel, Germany, 2000; pp. 1–47. [Google Scholar]
- Bonamente, E.; Rinaldi, S.; Nicolini, A.; Cotana, F. NationalWater Footprint: Toward a Comprehensive Approach for the Evaluation of the Sustainability of Water Use in Italy. Sustainability 2015, 7, 2086–2112. [Google Scholar] [CrossRef]
- Ital-ICID. Land Reclamation, Irrigation and Flood Protection in Italy over the Centuries; Italian Committee for Irrigation and Drainage: Rome, Italy, 2006; Volume 1, pp. 1–80. [Google Scholar]
- Gutiérrez-Martín, C.; Borrego-Marín, M.M.; Berbel, J. The Economic Analysis of Water Use in the Water Framework Directive Based on the System of Environmental-Economic Accounting for Water: A Case Study of the Guadalquivir River Basin. Water 2017, 9, 180. [Google Scholar] [CrossRef]
- European Commission (EC). A Blueprint to Safeguard Europe’s Water Resources; Publications Office of European Union: Luxembourg, 2013; ISBN 978-92-79-30543-6. [Google Scholar]
- Ruiu, M.L.; Maurizi, S.; Sassu, S.; Seddaiu, G.; Zuin, O.; Blackmore, C.; Roggero, P.P. Re-Staging La Rasgioni: Lessons Learned from Transforming a Traditional Form of Conflict Resolution to Engage Stakeholders in Agricultural Water Governance. Water 2017, 9, 297. [Google Scholar] [CrossRef]
- Graversgaard, M.; Jacobsen, B.H.; Kjeldsen, C.; Dalgaard, T. Stakeholder Engagement and Knowledge Co-Creation in Water Planning: Can Public Participation Increase Cost-Effectiveness? Water 2017, 9, 191. [Google Scholar] [CrossRef]
- Pereira, L.S. Water, Agriculture and Food: Challenges and Issues. Water Resour. Manag. 2017, 31, 2985–2999. [Google Scholar] [CrossRef]
- WISE. Water Information System for Europe. Available online: http://water.europa.eu/ (accessed on 17 August 2017).
- Kirschke, S.; Newig, J. Addressing Complexity in Environmental Management and Governance. Sustainability 2017, 9, 983. [Google Scholar] [CrossRef]
- Buytaert, W.; Baez, S.; Bustamante, M.; Dewulf, A. Web-Based Environmental Simulation: Bridging the Gap between Scientific Modeling and Decision-Making. Environ. Sci. Technol. 2012, 46, 1971–1976. [Google Scholar] [CrossRef] [PubMed]
- Comair, G.F.; McKinney, D.C.; Maidment, D.R.; Espinoza, G.; Sangiredy, H.; Fayad, A.; Salas, F.R. Hydrology of the Jordan River Basin: A GIS-Based System to Better Guide Water Resources Management and Decision Making. Water Resour. Manag. 2014, 28, 933–946. [Google Scholar] [CrossRef]
- Zhang, D.; Chen, X.; Yao, H. Development of a Prototype Web-Based Decision Support System for Watershed Management. Water 2015, 7, 780–793. [Google Scholar] [CrossRef]
- Simonovic, S.P. Bringing Future Climatic Change into Water Resources Management Practice Today. Water Resour. Manag. 2017, 31, 2933–2950. [Google Scholar] [CrossRef]
- European Commission (EC). Directive 2000/60/EC of the European Parliament and of the Council of 23 October 2000, Establishing a Framework for Community Action in the Field of Water Policy; EC: Brussels, Belgium, 2000. [Google Scholar]
- Stefanovic, N.; Radojevic, I.; Ostojic, A.; Comic, L.; Topuzovic, M. Composite Web Information System for Management of Water Resources. Water Resour. Manag. 2015, 29, 2285–2301. [Google Scholar] [CrossRef]
- Delipetrev, B.; Jonoski, A.; Solomatine, D.P. Development of a web application for water resources based on open source software. Comput. Geosci. 2014, 62, 35–42. [Google Scholar] [CrossRef]
- Swain, N.R. Tethys Platform: A Development and Hosting Platform for Water Resources Web Apps. Ph.D. Thesis, Department of Civil and Environmental Engineering, Brigham Young University, Provo, UT, USA, June 2015. [Google Scholar]
- Swain, N.R.; Christensen, S.D.; Snow, A.D.; Dolder, H.; Espinoza-Davalos, G.; Goharian, E.; Jones, N.L.; Nelson, E.J.; Ames, D.P.; Burian, S.J. A new open source platform for lowering the barrier for environmental web app development. Environ. Model. Softw. 2016, 85, 11–26. [Google Scholar] [CrossRef]
- Harvey, H.; Dawei, H. The relevance of Open Source to hydroinformatics. J. Hydroinform. 2002, 4, 219–234. [Google Scholar]
- Sadler, J.M. Hydrologic Data Sharing Using Open Source Software and Low-Cost Electronics. Master’s Thesis, Department of Civil and Environmental Engineering, Brigham Young University, Provo, UT, USA, March 2015. [Google Scholar]
- Sadler, J.M.; Ames, D.P.; Livingston, S.J. Extending HydroShare to enable hydrologic time series data as social media. J. Hydroinform. 2016, 18, 198–209. [Google Scholar] [CrossRef]
- Harmancioglu, N.B. Overview of Water Policy Developments: Pre- and Post-2015 Development Agenda. Water Resour. Manag. 2017, 31, 3001–3021. [Google Scholar] [CrossRef]
- Manciola, P.; Casadei, S. Low flow index and hydrogeological characteristics. In Proceedings of the National Conference in Hydraulic Engineering—ASCE, Nashville, TN, USA, 29 July–2 August 1991. [Google Scholar]
- Miller, M.P.; Buto, S.G.; Susong, D.D.; Rumsey, C. The importance of base flow in sustaining surface water flow in the Upper Colorado River Basin. Water Resour. Res. 2016, 52, 3547–3562. [Google Scholar] [CrossRef]
- Longobardi, A.; Villani, P. Baseflow index regionalization analysis in a mediterranean area and data scarcity context: Role of the catchment permeability index. J. Hydrol. 2008, 355, 63–75. [Google Scholar] [CrossRef]
- Bloomfield, J.P.; Allen, D.J.; Griffiths, K.J. Examining geological controls on baseflow index (BFI) using regression analysis: An illustration from the Thames Basin UK. J. Hydrol. 2009, 373, 164–176. [Google Scholar] [CrossRef] [Green Version]
- Van Loon, A.F.; Laaha, G. Hydrological drought severity explained by climate and catchment characteristics. J. Hydrol. 2015, 526, 3–14. [Google Scholar] [CrossRef]
- L’vovich, M.I. Hydrologic budget of continents and estimate of the balance of global fresh water resources. Sov. Hydrol. 1972, 4, 349–360. [Google Scholar]
- Casadei, S. Base flow index analysis of some hydrographic basins in Central Italy. Idrotecnica 1995, 3, 177–191. (In Italian) [Google Scholar]
- Eckhardt, K. A comparison of baseflow indices, which were calculated with seven different baseflow separation methods. J. Hydrol. 2008, 352, 168–173. [Google Scholar] [CrossRef]
- Ubertini, L. Hydrological Modeling for the Integrated Water Resources Management and Habitat Protection in the Arno River Basin; Report of Autorità di Bacino Arno; Autorità di Bacino Arno: Firenze, Italy, 2004; pp. 1–43. (In Italian) [Google Scholar]
- Pyrce, R.S. Hydrological Low Flow Indices and Their Uses; Report No. 04; Watershed Science Centre: Peterborough, ON, USA, 2004; pp. 1–33. [Google Scholar]
- Ubertini, L.; Manciola, P.; Casadei, S. On the possible application of the parameter Q7,10 for conservation of aquatic life in the Tiber Basin. In Proceedings of the IASTED International Conference Modelling and Simulation, Pittsburgh, PA, USA, 2–4 May 1994; pp. 250–253. [Google Scholar]
- Ubertini, L.; Manciola, P.; Casadei, S. Evaluation of the minimum instream flow of the Tiber River Basin. Environ. Monit. Assess. 1996, 41, 125–136. [Google Scholar] [CrossRef] [PubMed]
- Singh, K.P.; Stall, J.B. Hydrology of 7-Day 10-Yr Low Flows. J. Hydraul. Div. 1974, 100, 1753–1771. [Google Scholar]
- Manciola, P.; Pierleoni, A.; Bellezza, M.; Casadei, S. Weibull distribution parameters computation in low flow phenomena. In Proceedings of the International Conference on Environmental Modelling and Simulation—IASTED, St. Thomas, VI, USA, 22–24 November 2004; pp. 192–196. [Google Scholar]
- Weaver, J.C. Low-Flow Characteristics and Flow-Duration Statistics for Selected USGS Continuous-Record Streamgaging Stations in North Carolina through 2012—U.S. Geological Survey Scientific Investigations Report 2015–5001; U.S. Geological Survey: Reston, VA, USA, 2012; pp. 1–89.
- Blum, A.G.; Archfield, S.A.; Vogel, R.M. On the probability distribution of daily streamflow in the United States. Hydrol. Earth Syst. Sci. 2017, 21, 3093–3103. [Google Scholar] [CrossRef]
- Waseem, M.; Shin, J.; Kim, W. Comparing Spatial Interpolation Scheme for Constructing a Flow Duration Curve in an Ungauged Basin. Water Resour. Manag. 2015, 29, 2249–2265. [Google Scholar] [CrossRef]
- Morrison, A.M.; Bonta, J.V. Development of Duration-Curve Based Methods for Quantifying Variability and Change in Watershed Hydrology and Water Quality; United States Environmental Protection Agency, Land Remediation and Pollution Control Division: Cincinnati, OH, USA, 2008; pp. 1–48.
- Franchini, M.; Ventaglio, E.; Bonoli, A. A Procedure for Evaluating the Compatibility of Surface Water Resources with Environmental and Human Requirements. Water Resour. Manag. 2011, 25, 3613–3634. [Google Scholar] [CrossRef]
- Liucci, L.; Valigi, D.; Casadei, S. A new application of Flow Duration Curve (FDC) in designing run-of-river power plants. Water Resour. Manag. 2014, 28, 881–895. [Google Scholar] [CrossRef]
- Casadei, S.; Liucci, L.; Valigi, D. Hydrological Uncertainty and Hydropower: New Methods to Optimize the Performance of the Plant. Energy Procedia 2014, 59, 263–269. [Google Scholar] [CrossRef]
- Atieh, M.; Gharabaghi, B.; Rudra, R. Entropy-based neural networks model for flow duration curves at ungauged sites. J. Hydrol. 2015, 529, 1007–1020. [Google Scholar] [CrossRef]
- Bellezza, M.; Casadei, S.; Manciola, P.; Pierleoni, A. Mathematical model for multipurpose water resource management. In Proceedings of the European Regional Conference ICID-CIID ERWG, Pavia, Italy, 2–7 September 2007. [Google Scholar]
- Manciola, P.; Casadei, S. Criteria for the evaluation of the rate water use in a river basin. IAHS Publ. 1995, 231, 169–179. [Google Scholar]
- Steven, H.A.; Koop, A.; van Leeuwen, C.J. Assessment of the Sustainability of Water Resources Management: A Critical Review of the City Blueprint Approach. Water Resour. Manag. 2015, 29, 5649–5670. [Google Scholar] [CrossRef]
- Mittal, N.; Bhave, A.G.; Mishra, A.; Singh, R. Impact of Human Intervention and Climate Change on Natural Flow Regime. Water Resour. Manag. 2016, 30, 685–699. [Google Scholar] [CrossRef] [Green Version]
Figure 1.
Schematic diagram of the web-based Spatial Decision Support System structure.

Figure 2.
Base Flow Index (BFI) analysis. Red line initial hydrograph, blue polyline 5 (A) or 10 (B) days of non-overlapping period, yellow BFI polyline.
Figure 2.
Base Flow Index (BFI) analysis. Red line initial hydrograph, blue polyline 5 (A) or 10 (B) days of non-overlapping period, yellow BFI polyline.

Figure 3.
Tiber River—Ponte Felcino. (A) linear form z = alog(q − qo) + b; (B) annual flow duration curves (FDC).
Figure 3.
Tiber River—Ponte Felcino. (A) linear form z = alog(q − qo) + b; (B) annual flow duration curves (FDC).

Figure 4.
The Tiber River Basin and the main river network.
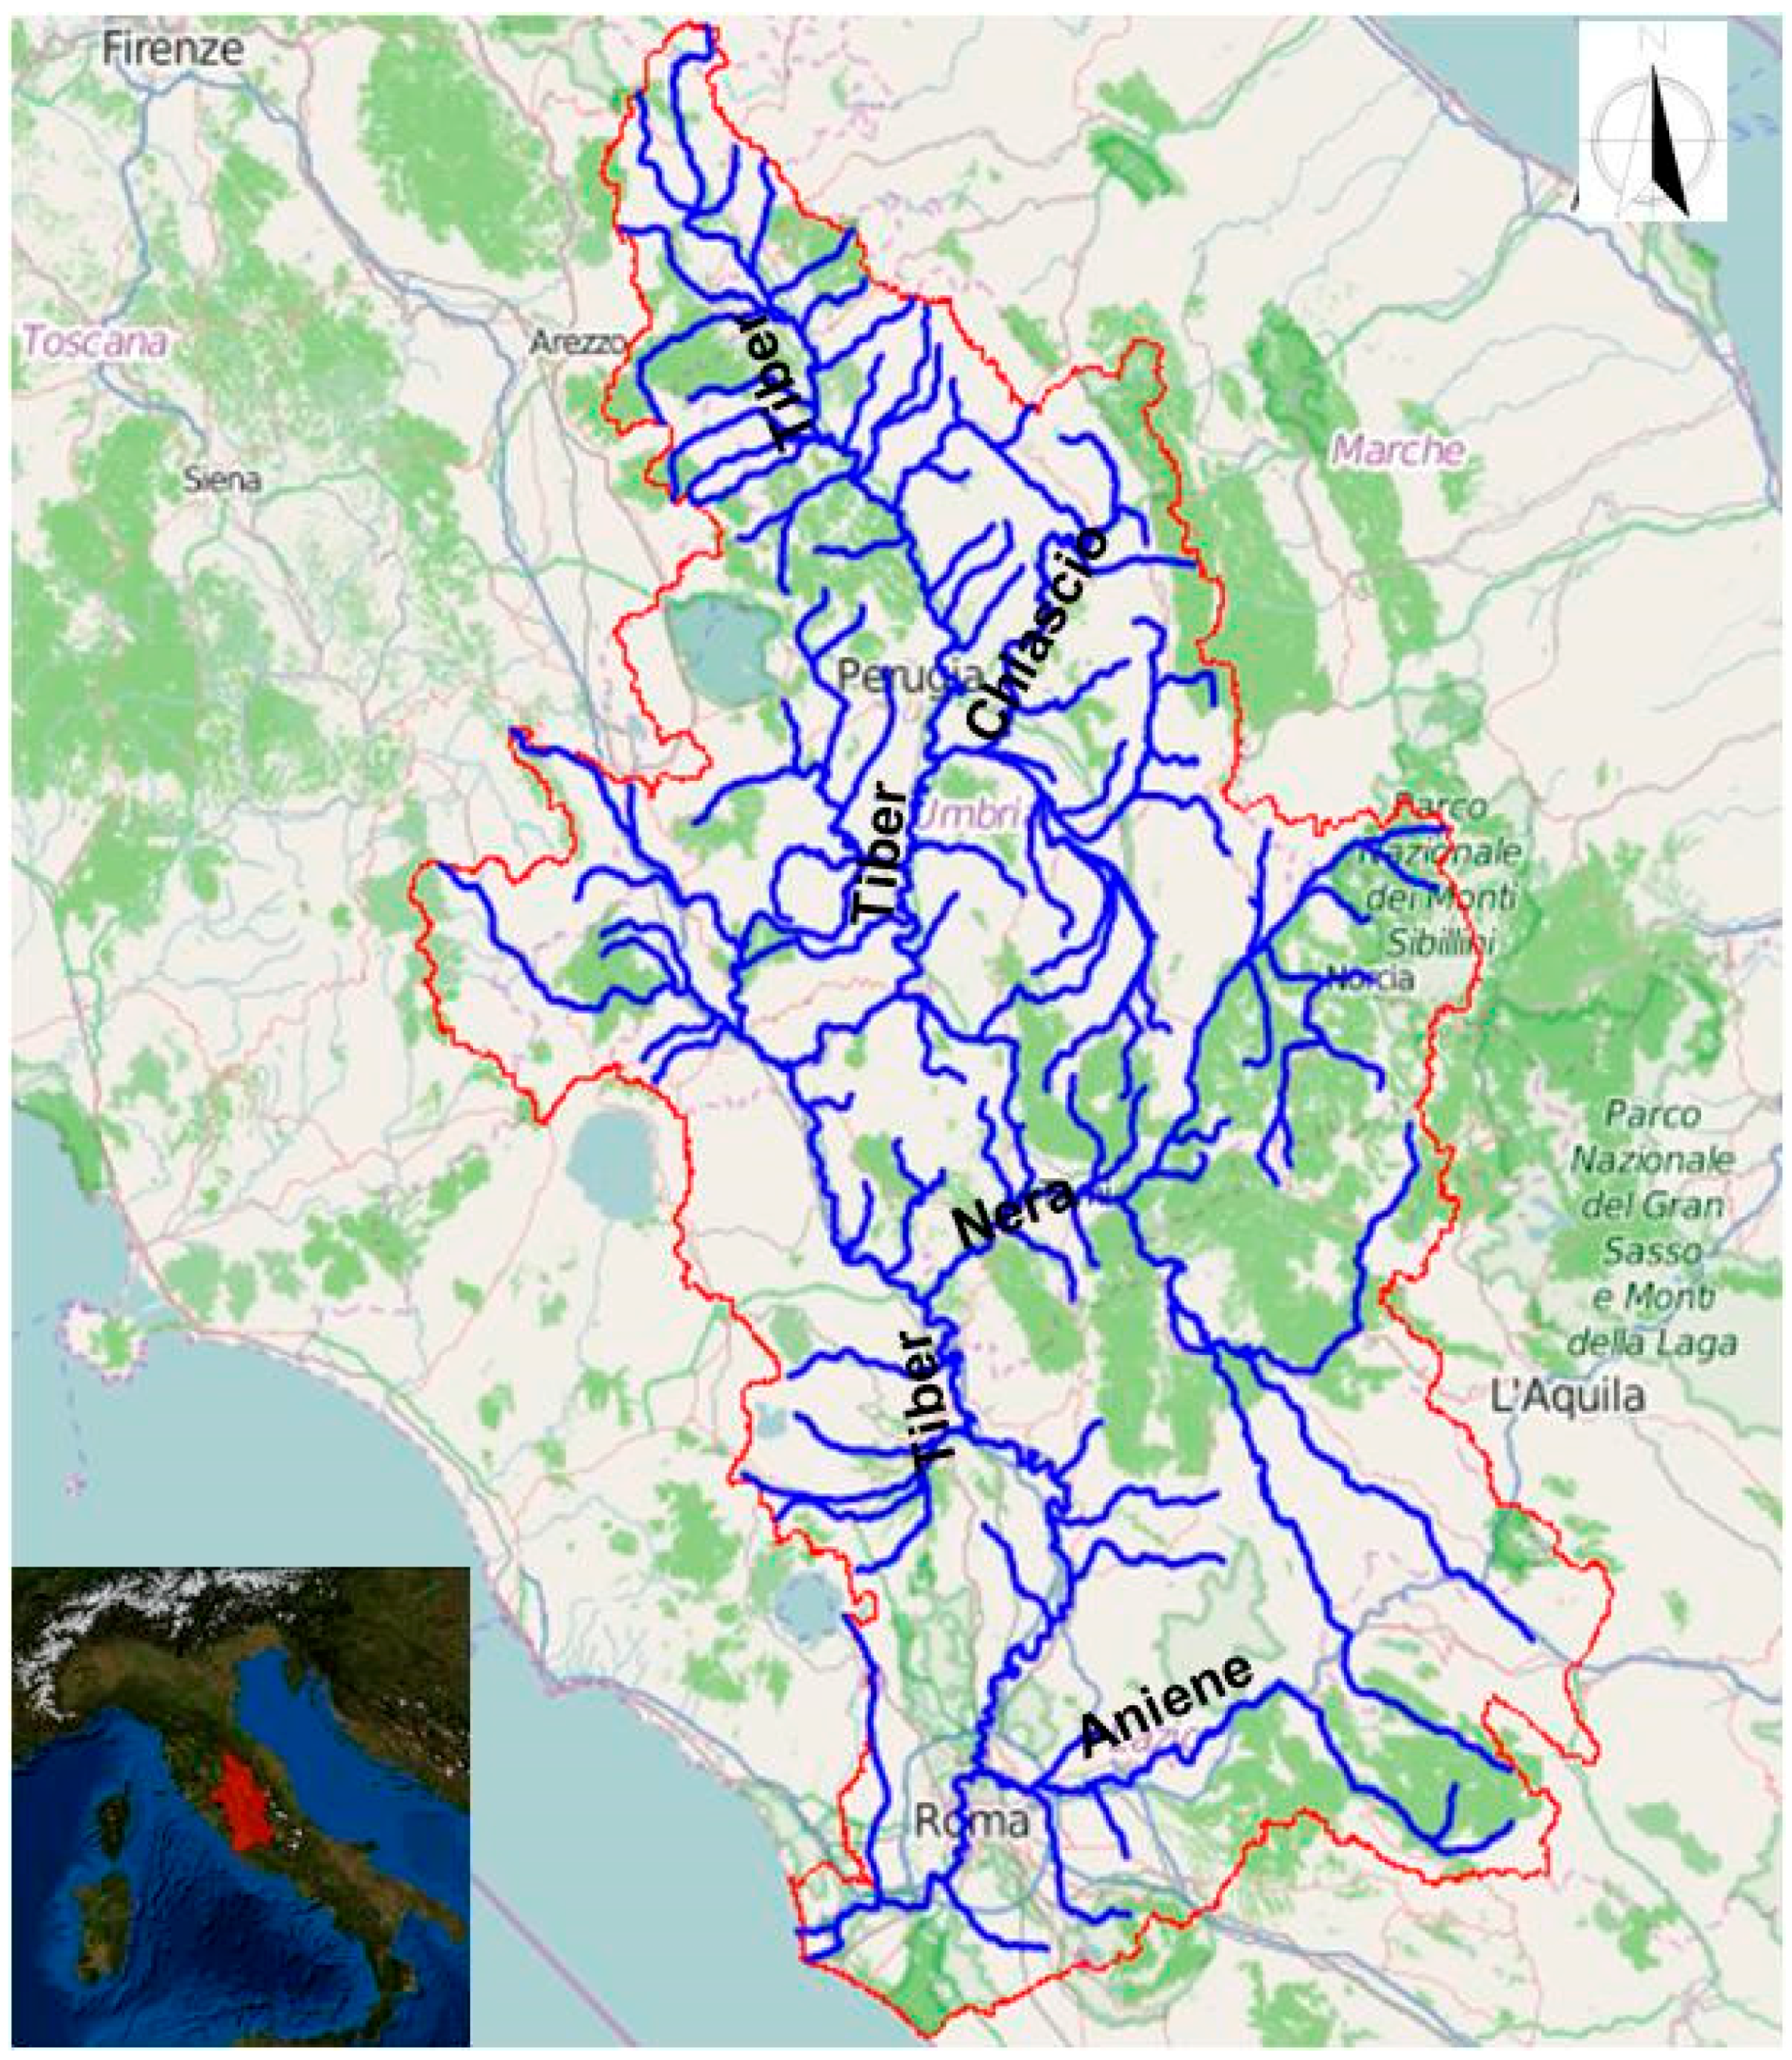
Figure 5.
Tiber River, S. Lucia station, BFI calculation across all the time series, BFI = 43.87 (image from WRME web site).
Figure 5.
Tiber River, S. Lucia station, BFI calculation across all the time series, BFI = 43.87 (image from WRME web site).
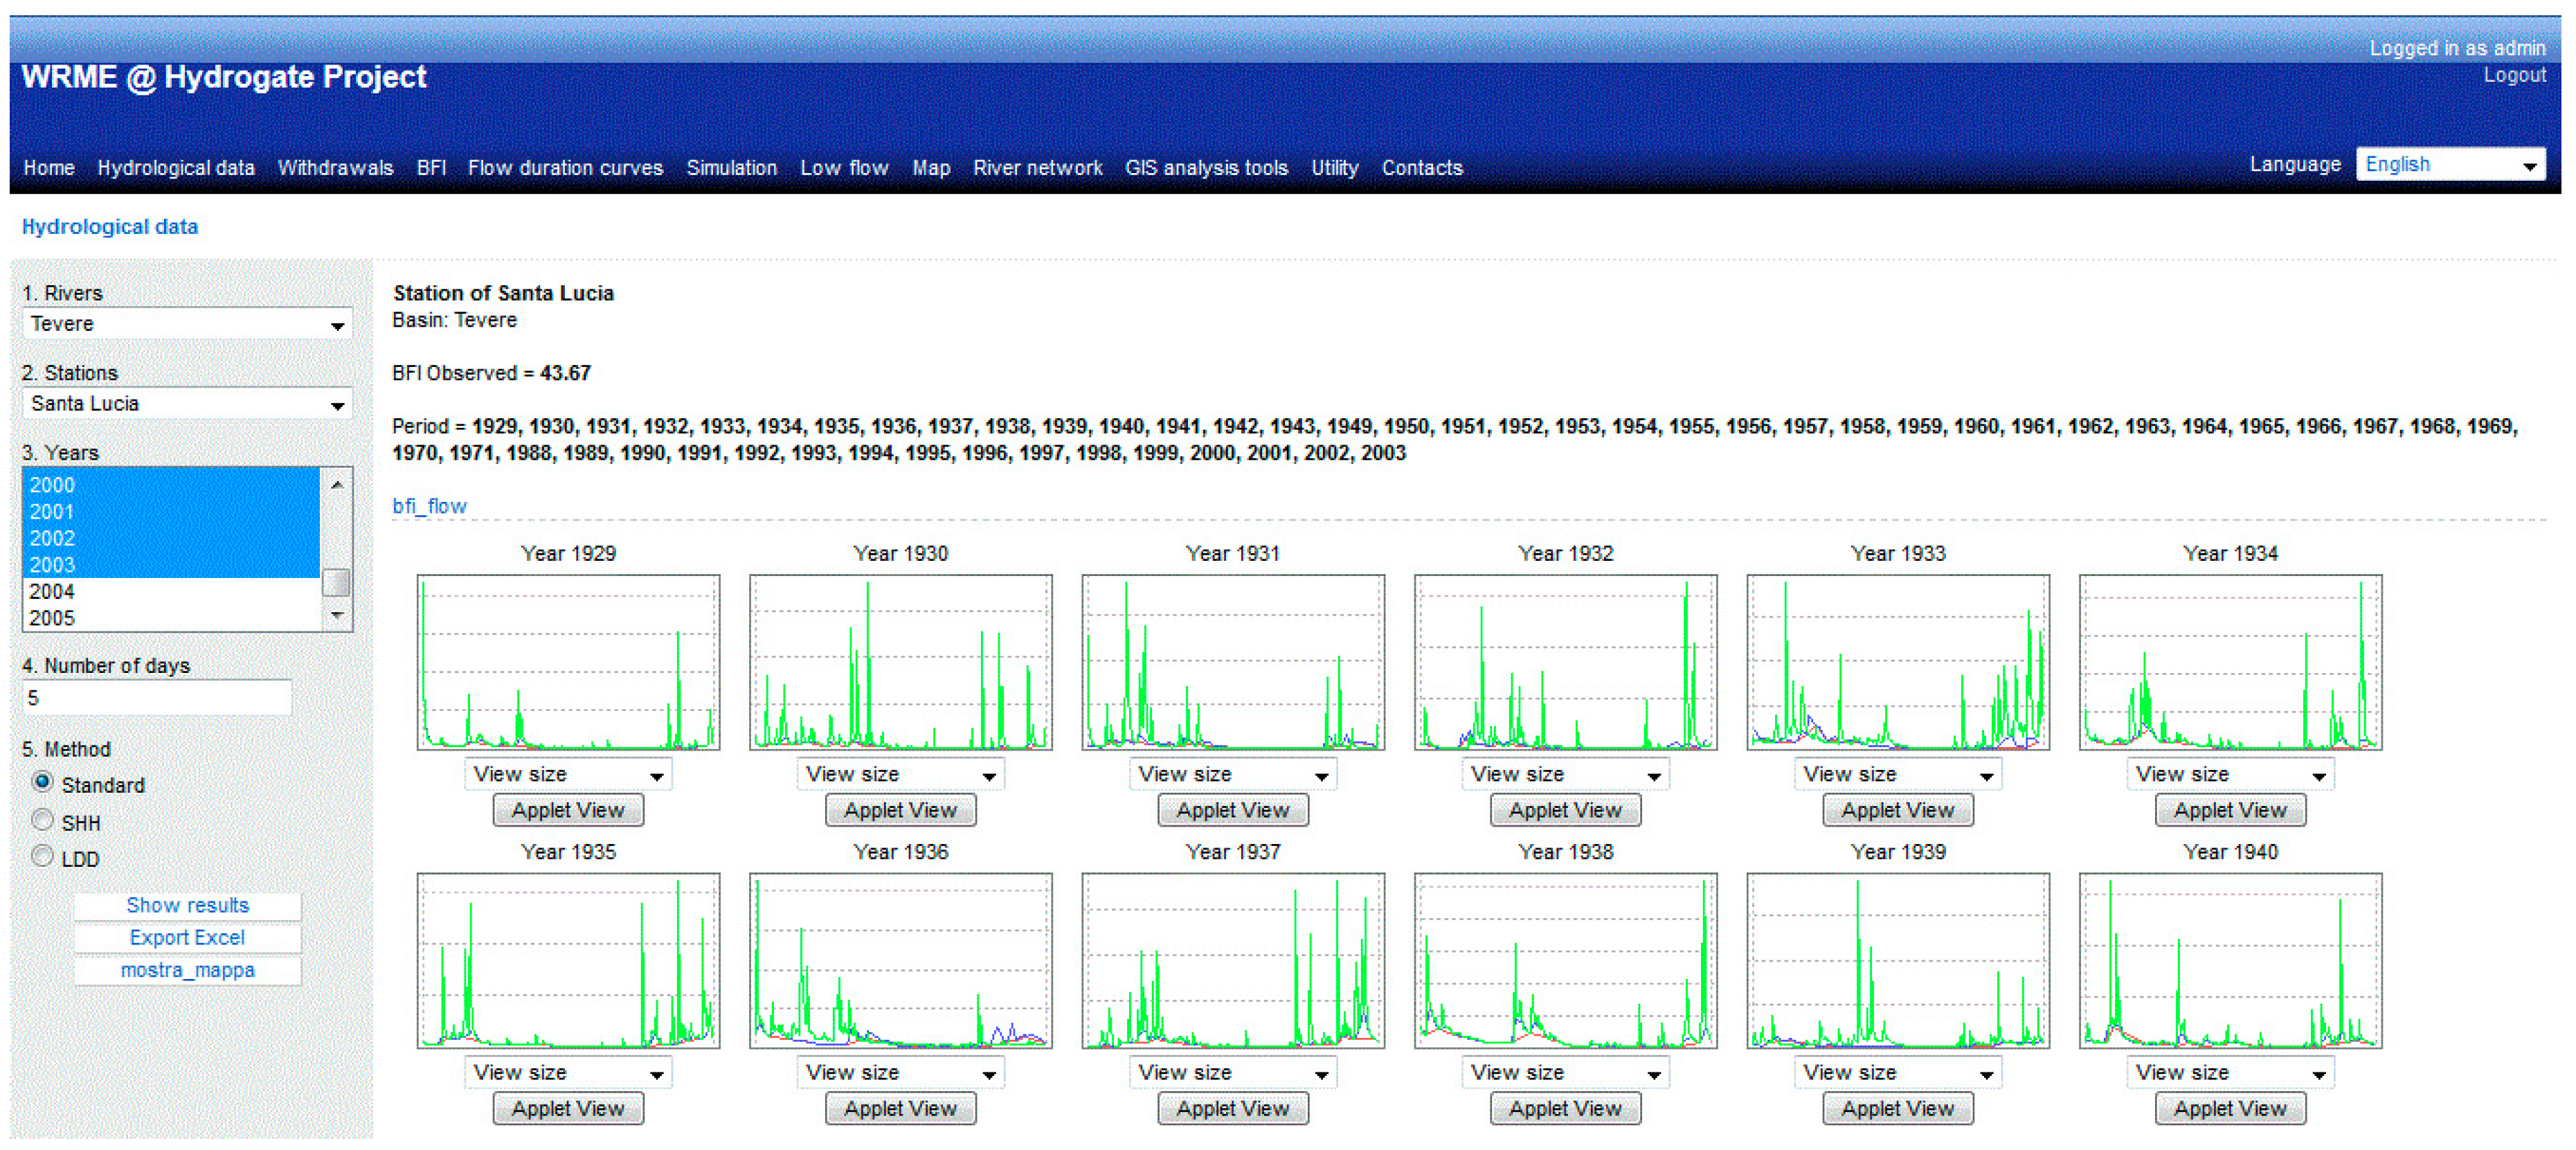
Figure 6.
BFI (A) and Q7,10 (B) variability maps in the Tiber River Basin.

Figure 7.
Example of applet view for natural, measurable and residual FDCs.

Figure 8.
Graphic output of the geoprocessing tool that compares the water withdrawals and low flow indices in a selected basin or sub-basin.
Figure 8.
Graphic output of the geoprocessing tool that compares the water withdrawals and low flow indices in a selected basin or sub-basin.

© 2018 by the authors. Licensee MDPI, Basel, Switzerland. This article is an open access article distributed under the terms and conditions of the Creative Commons Attribution (CC BY) license (http://creativecommons.org/licenses/by/4.0/).
Share and Cite
MDPI and ACS Style
Casadei, S.; Pierleoni, A.; Bellezza, M. Sustainability of Water Withdrawals in the Tiber River Basin (Central Italy). Sustainability 2018, 10, 485. https://doi.org/10.3390/su10020485
AMA Style
Casadei S, Pierleoni A, Bellezza M. Sustainability of Water Withdrawals in the Tiber River Basin (Central Italy). Sustainability. 2018; 10(2):485. https://doi.org/10.3390/su10020485
Chicago/Turabian StyleCasadei, Stefano, Arnaldo Pierleoni, and Michele Bellezza. 2018. "Sustainability of Water Withdrawals in the Tiber River Basin (Central Italy)" Sustainability 10, no. 2: 485. https://doi.org/10.3390/su10020485
Note that from the first issue of 2016, this journal uses article numbers instead of page numbers. See further details here.