Spatiotemporal Change Patterns of Coastlines in Zhejiang Province, China, Over the Last Twenty-Five Years


 ,
,
Abstract
:1. Introduction
2. Data and Methods
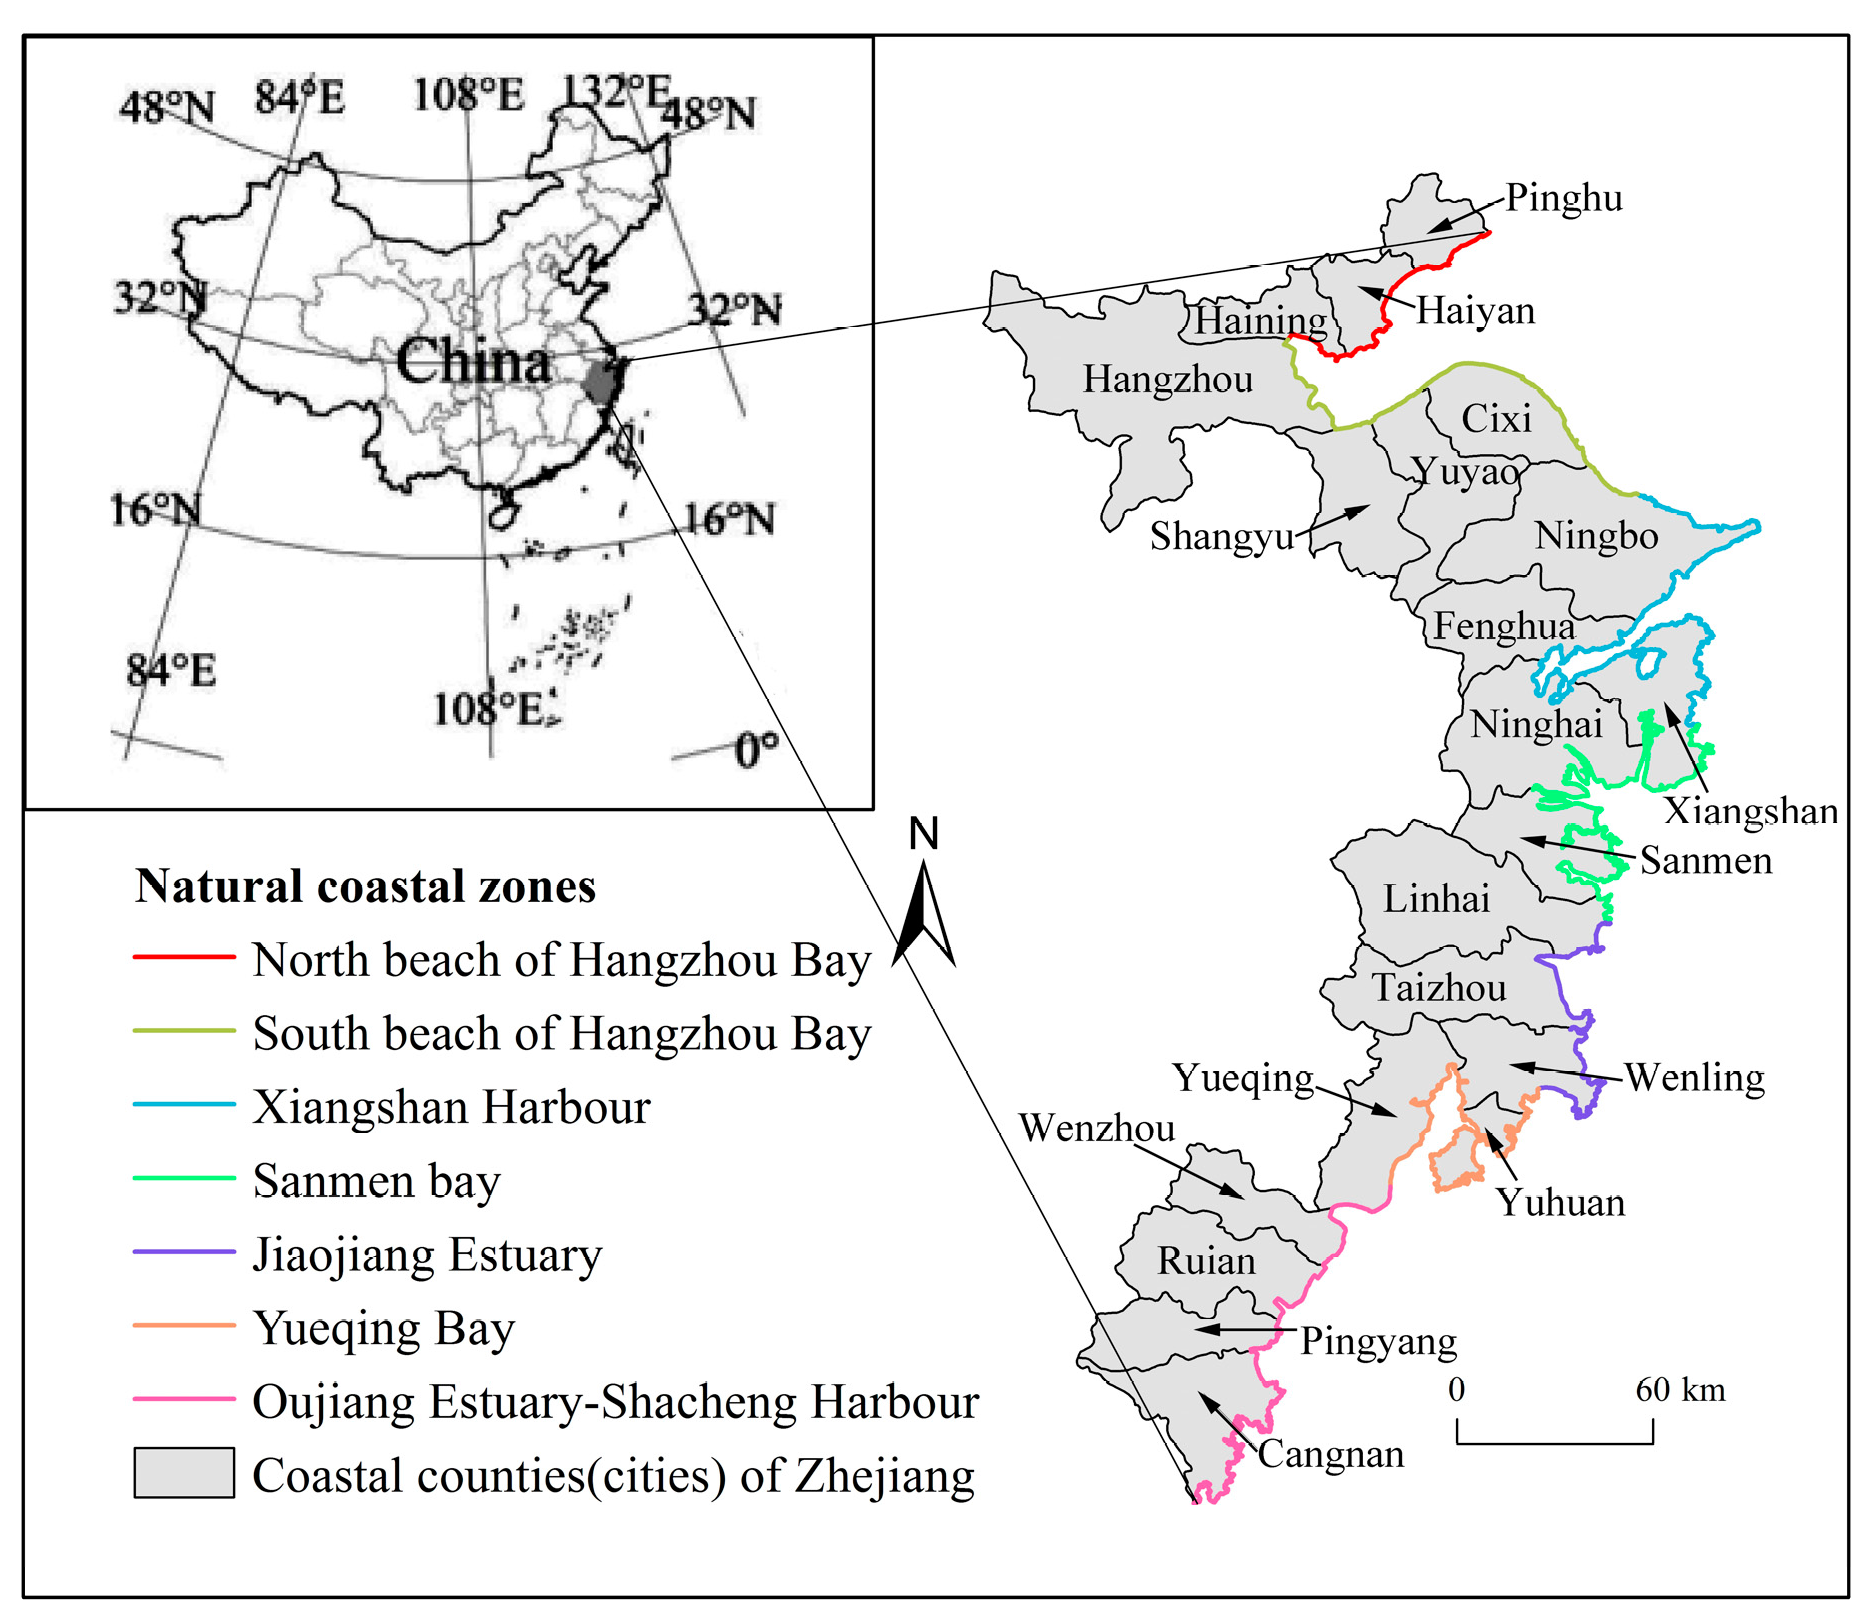
2.1. Study Area
2.2. Data Sets and Processing
2.3. Intensity of Coastline Change
2.4. Fractal Dimension of Coastline
2.5. Subjectivity of Coastline Utilization
2.6. Integrated Coastline Utilization Index
3. Results and Analysis
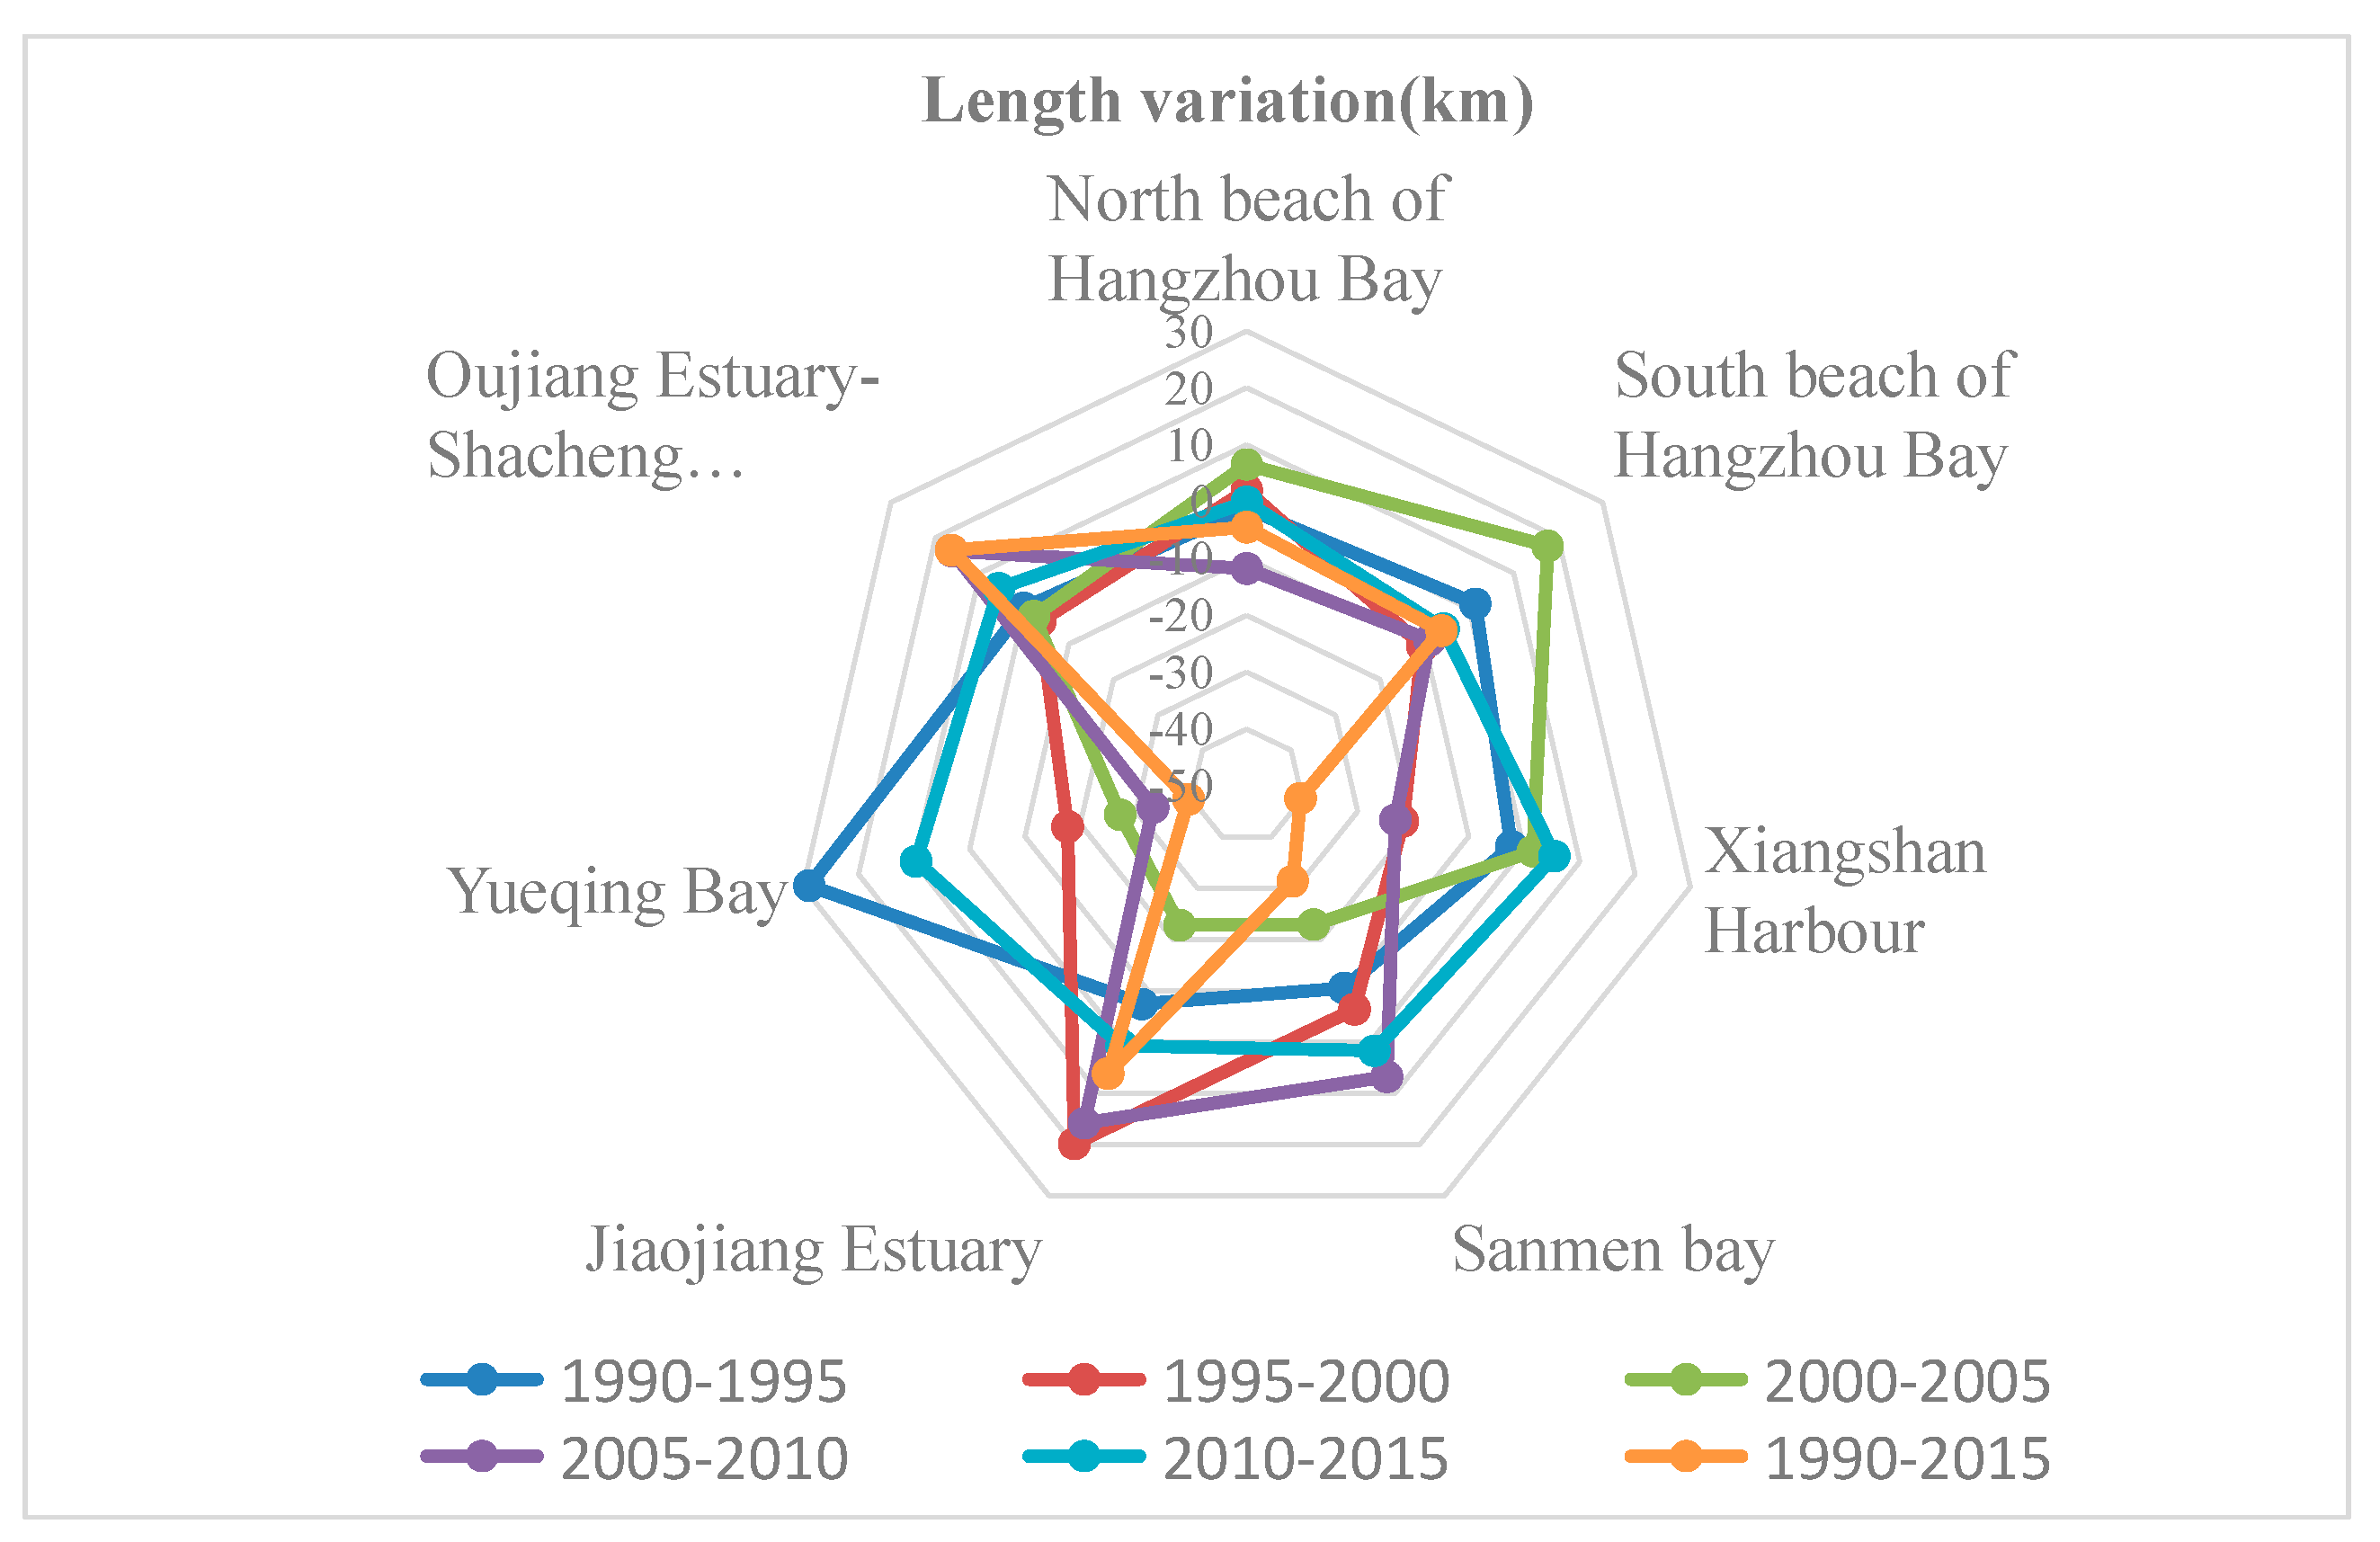
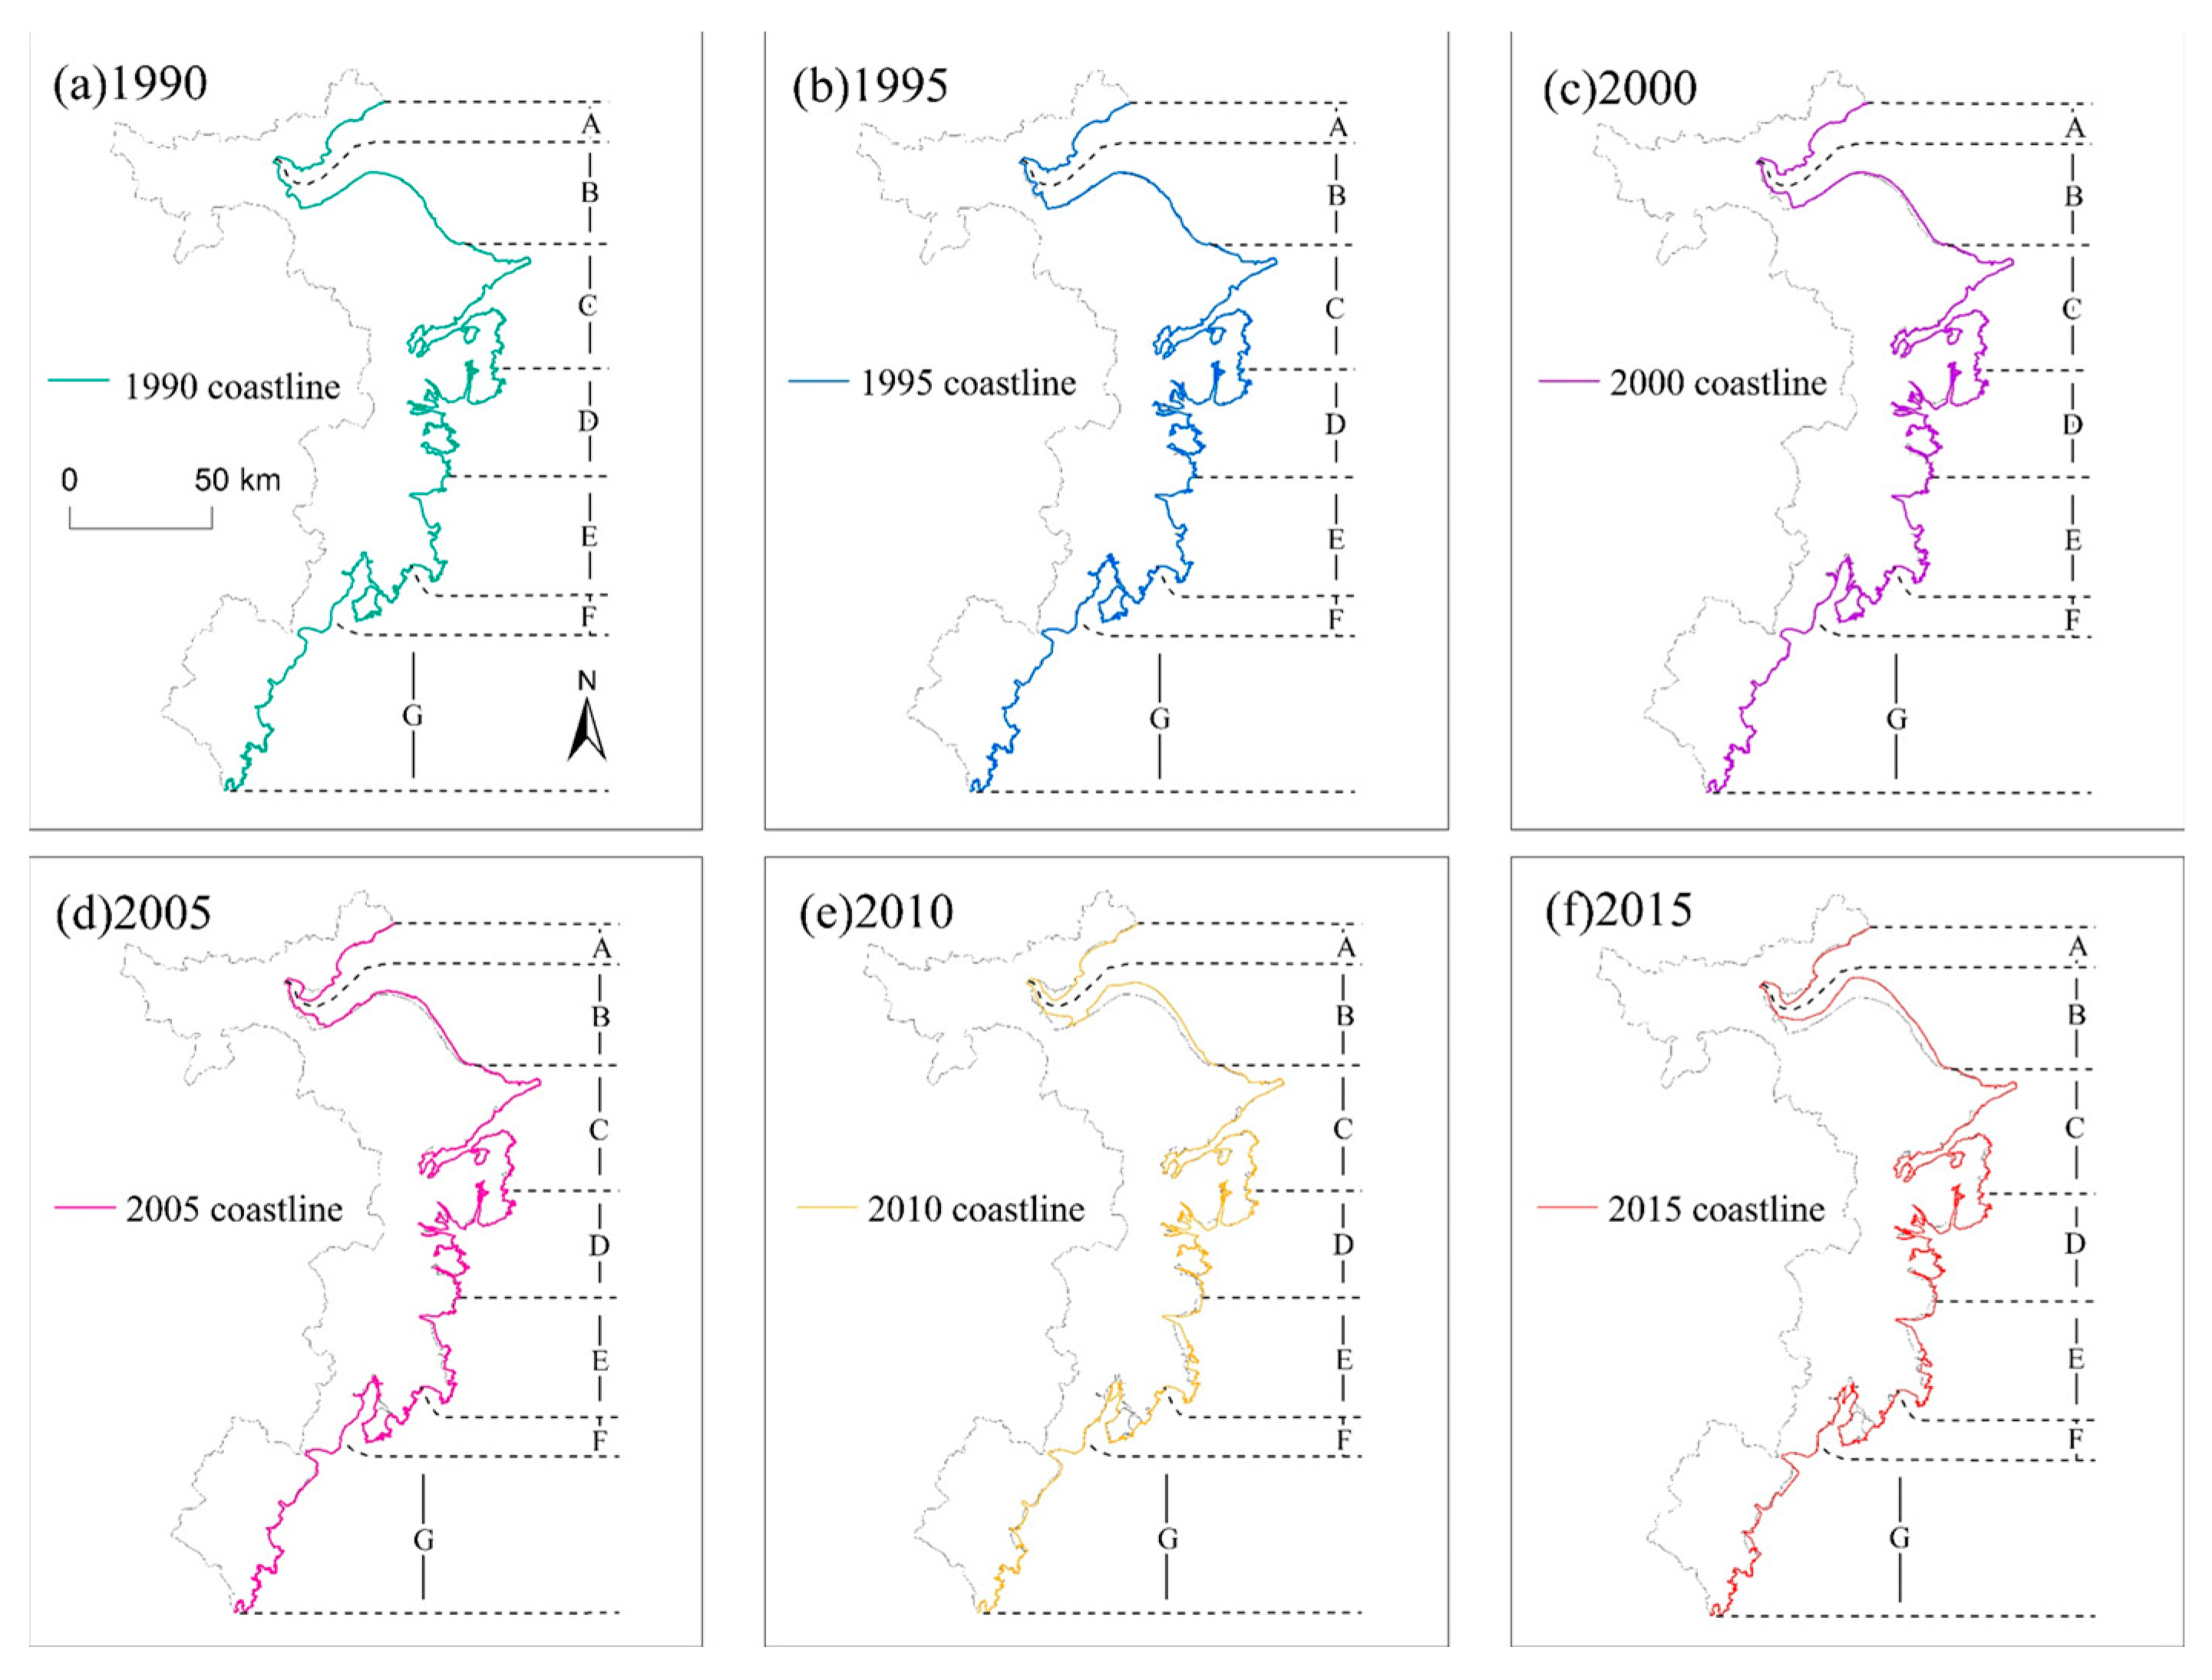
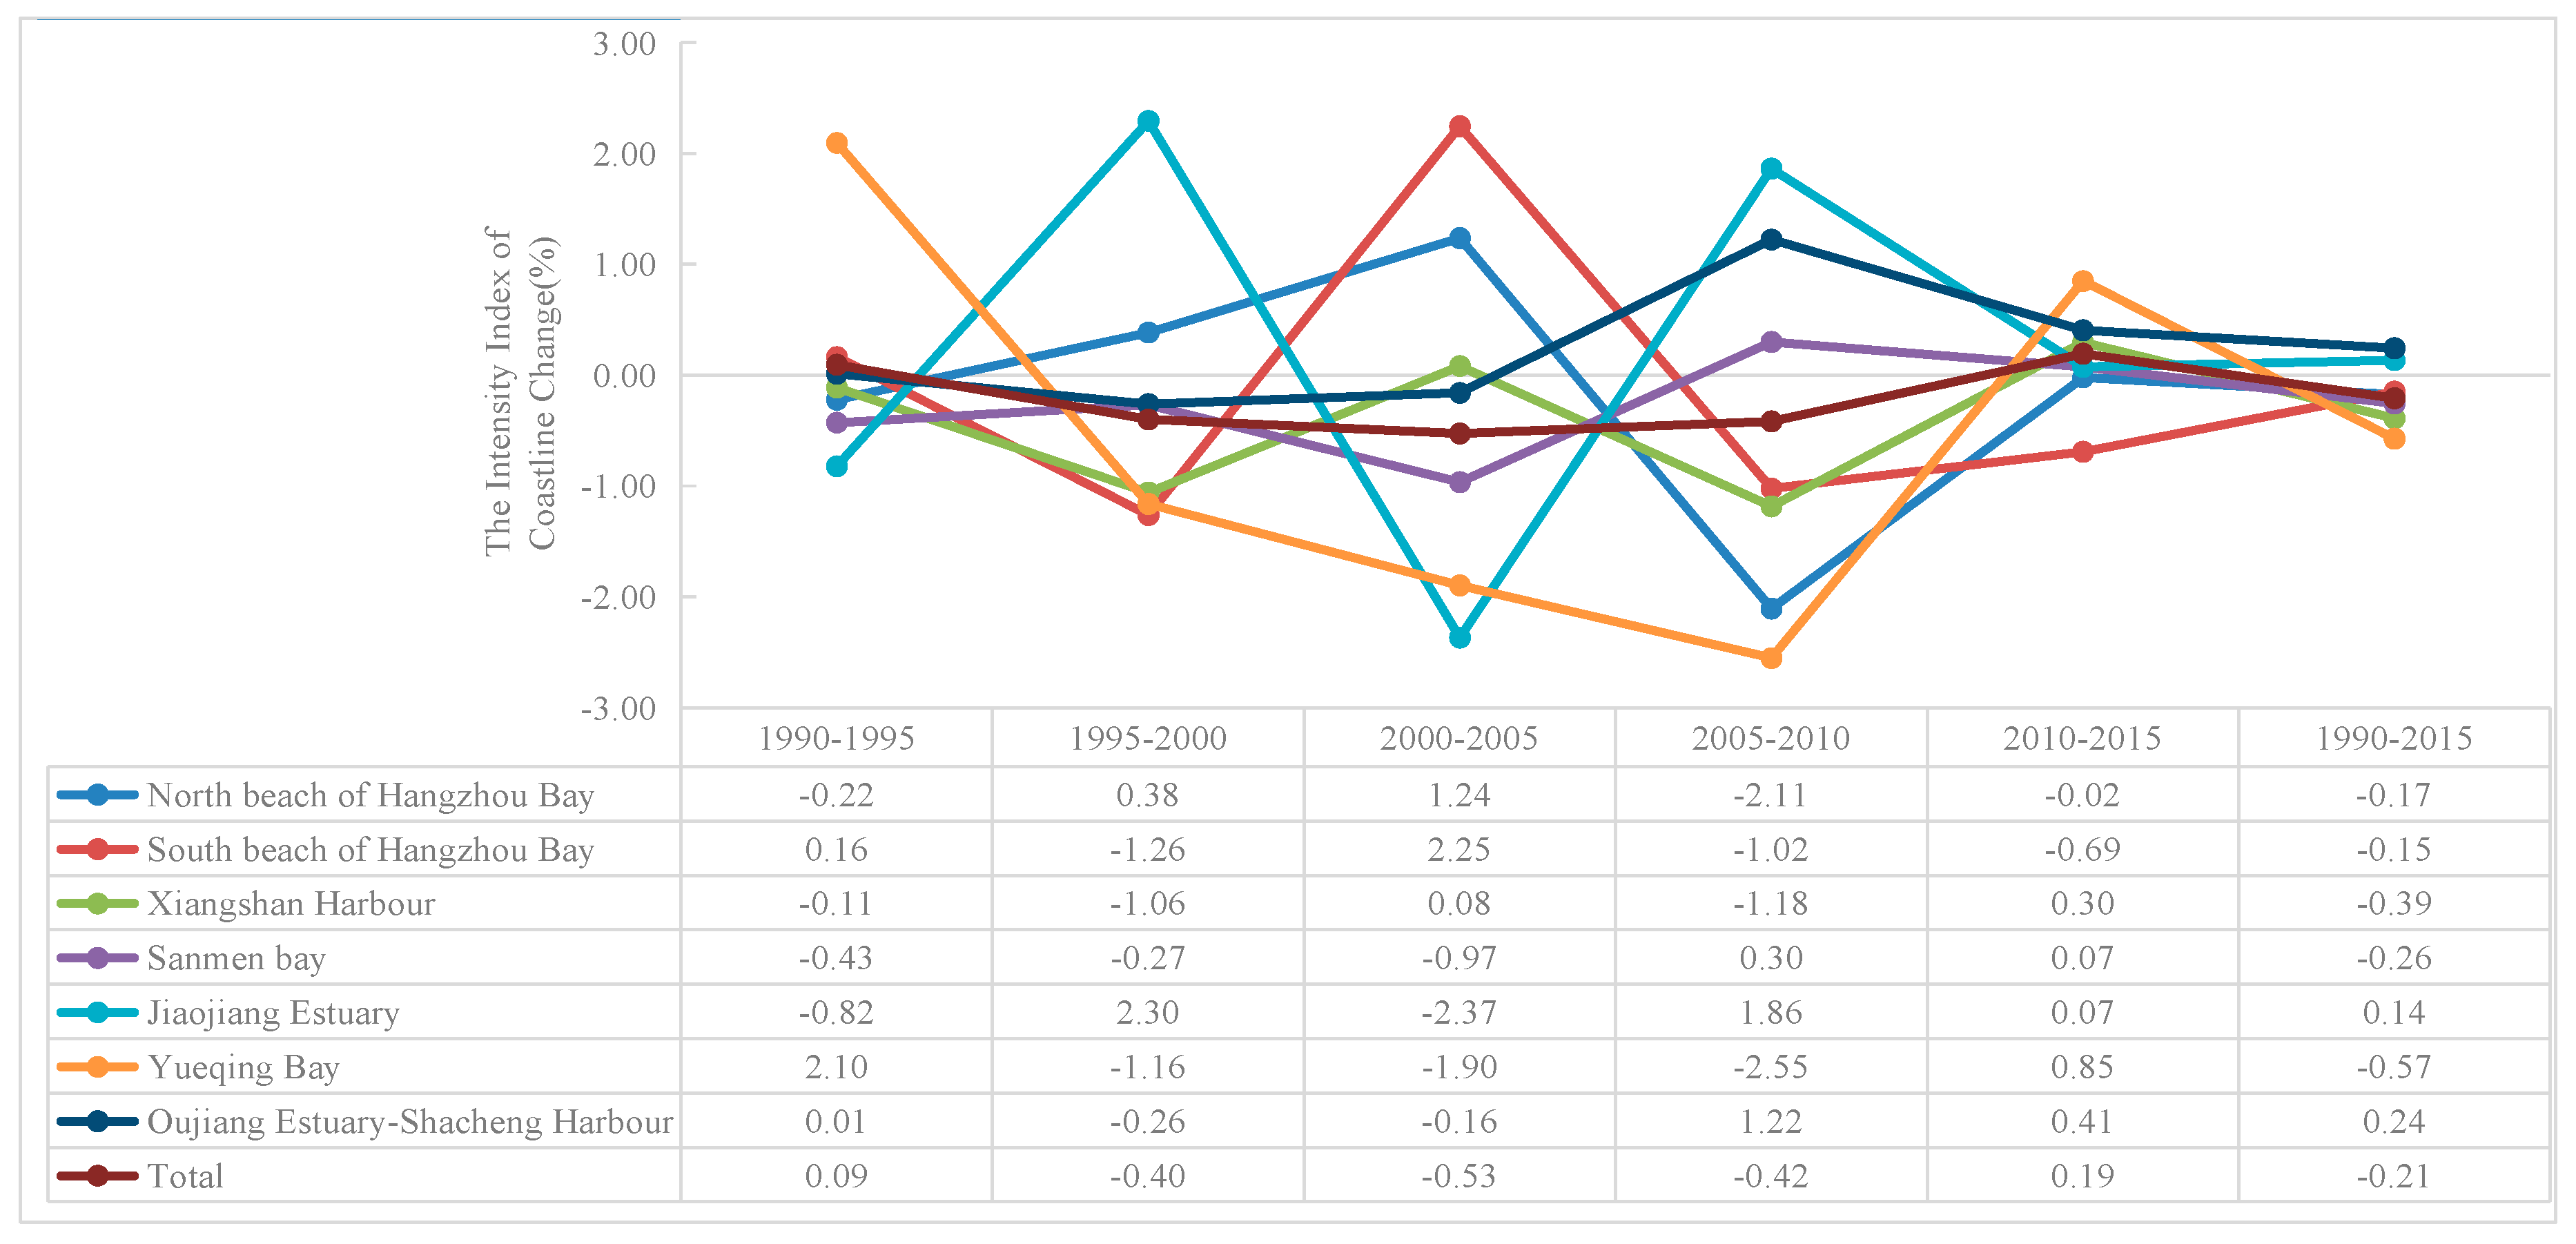
3.1. Coastline Changes and Their Intensity
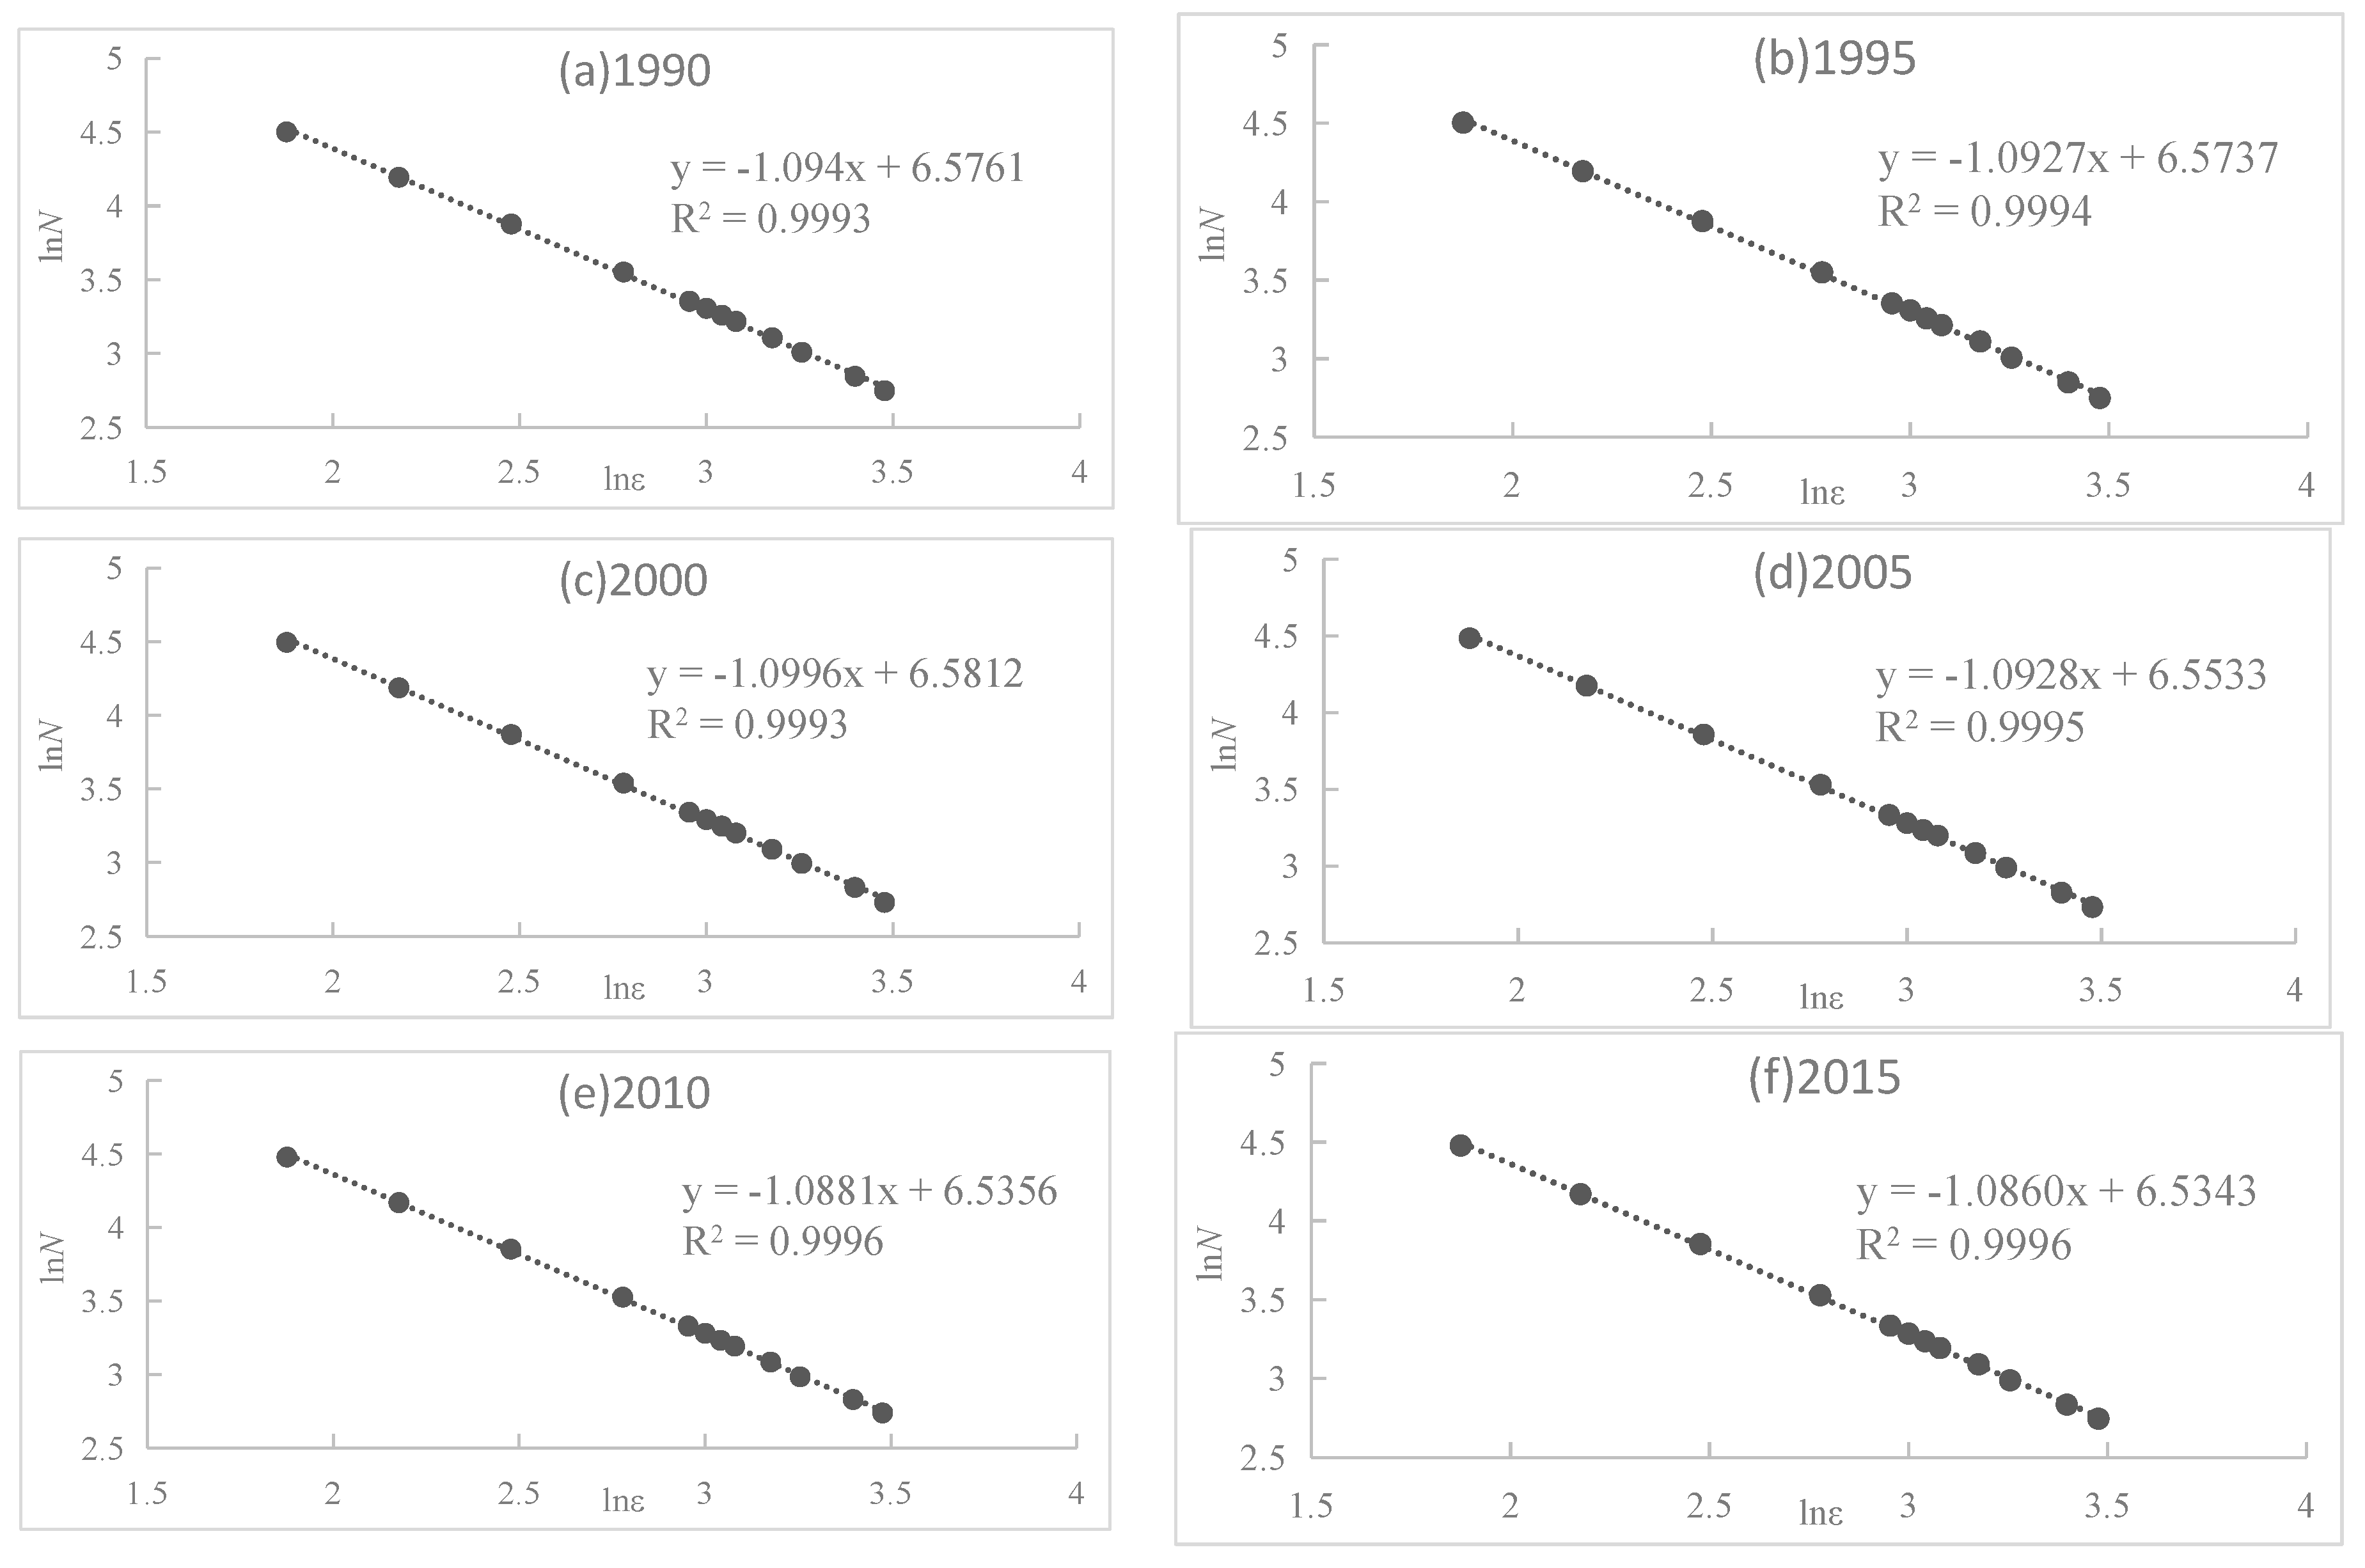
3.2. Fractal Dimension of the Coastline
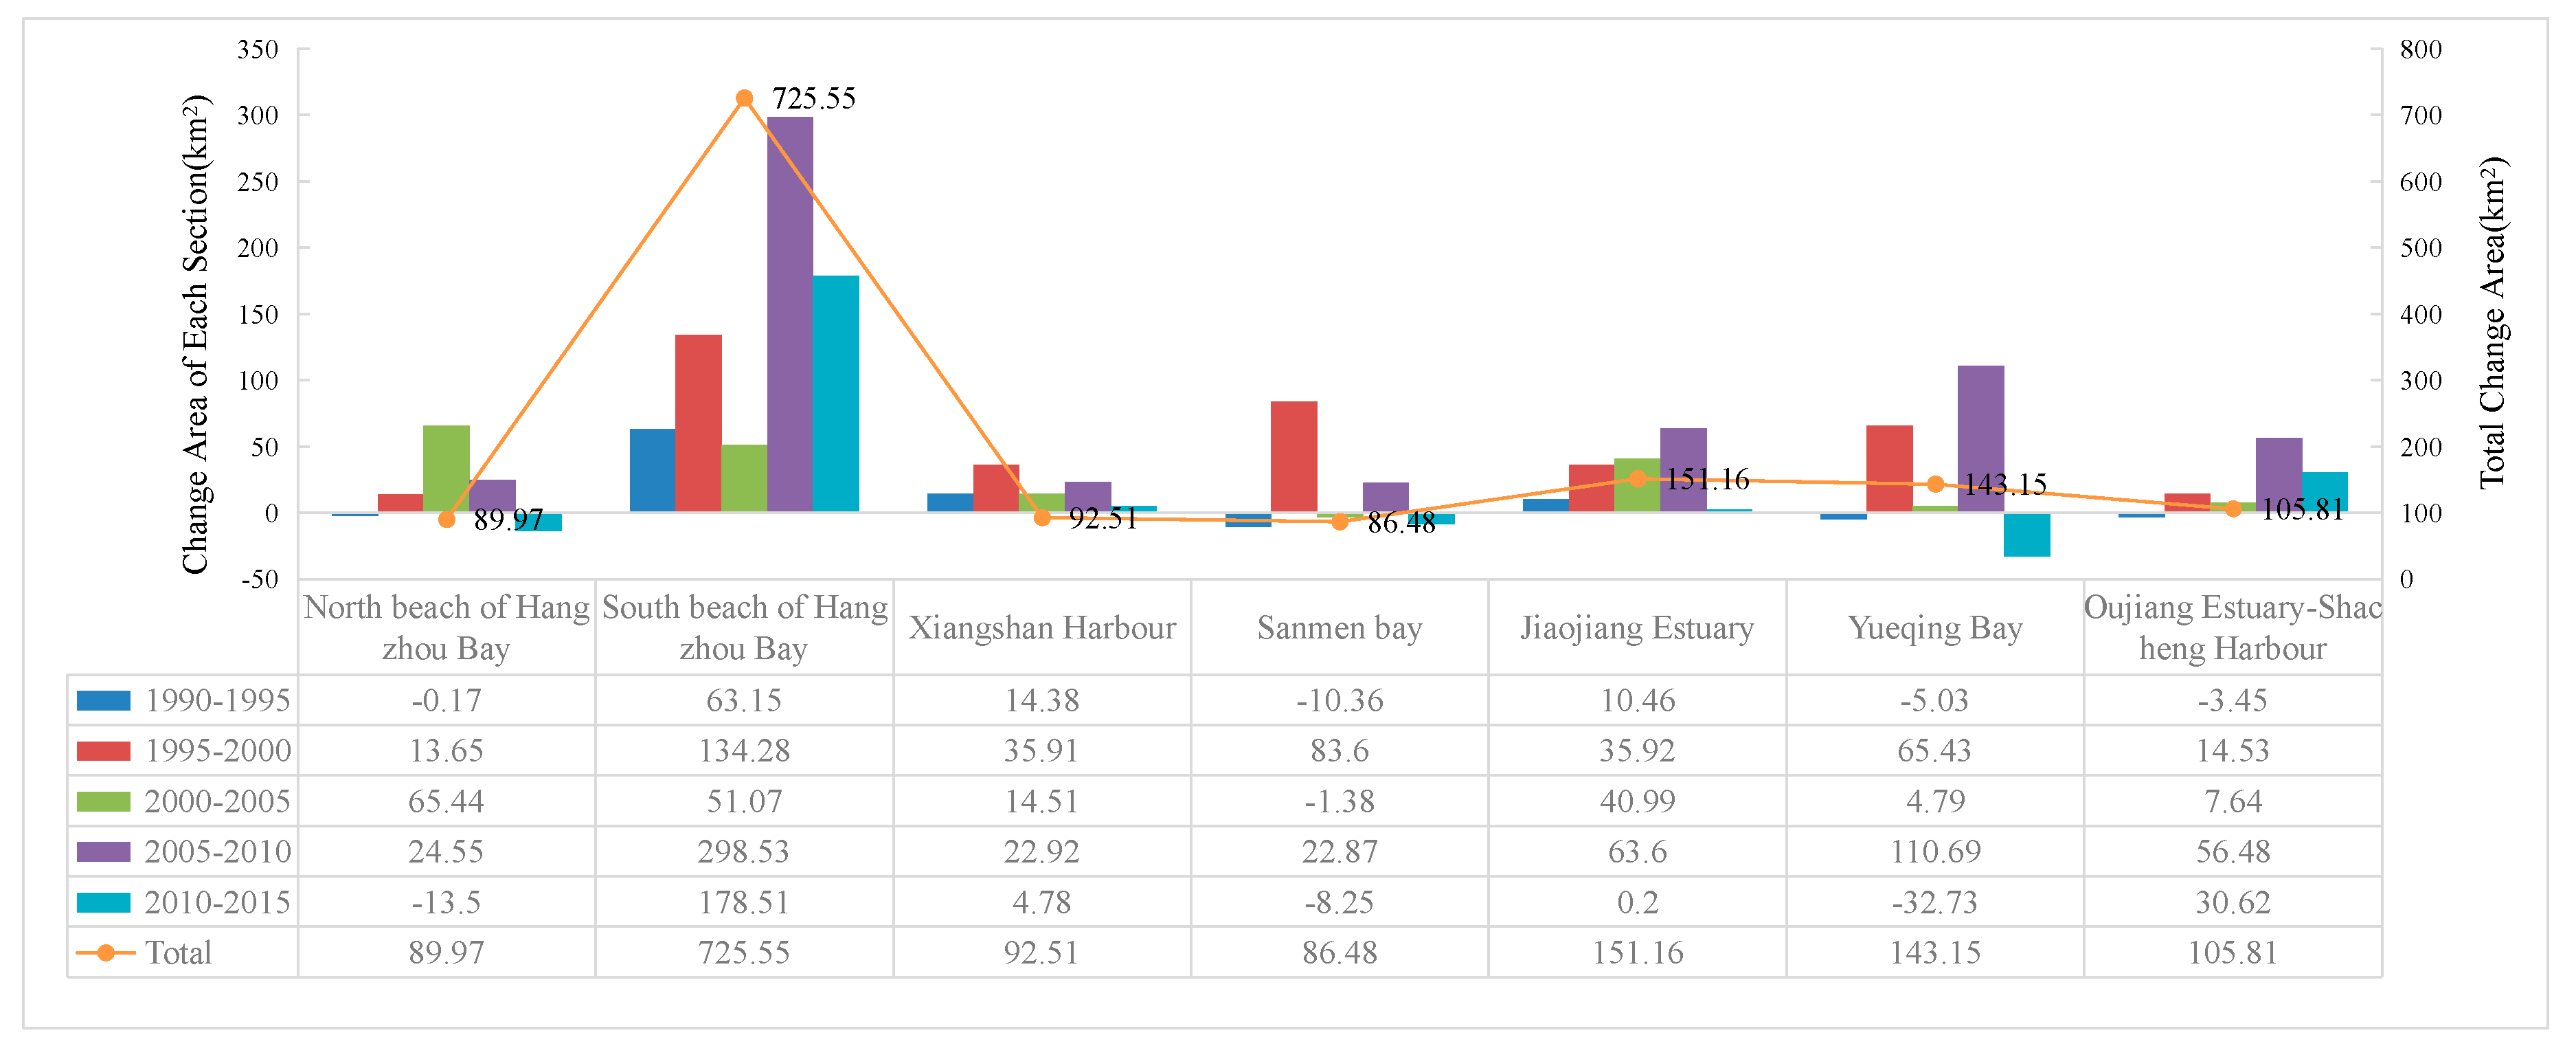
3.3. Sea–Land Pattern Changes
3.4. Coastline Artificialization Index Analysis
3.5. Evaluation of Subjectivity of Coastline Utilization
4. Discussion
5. Conclusions
- (1)
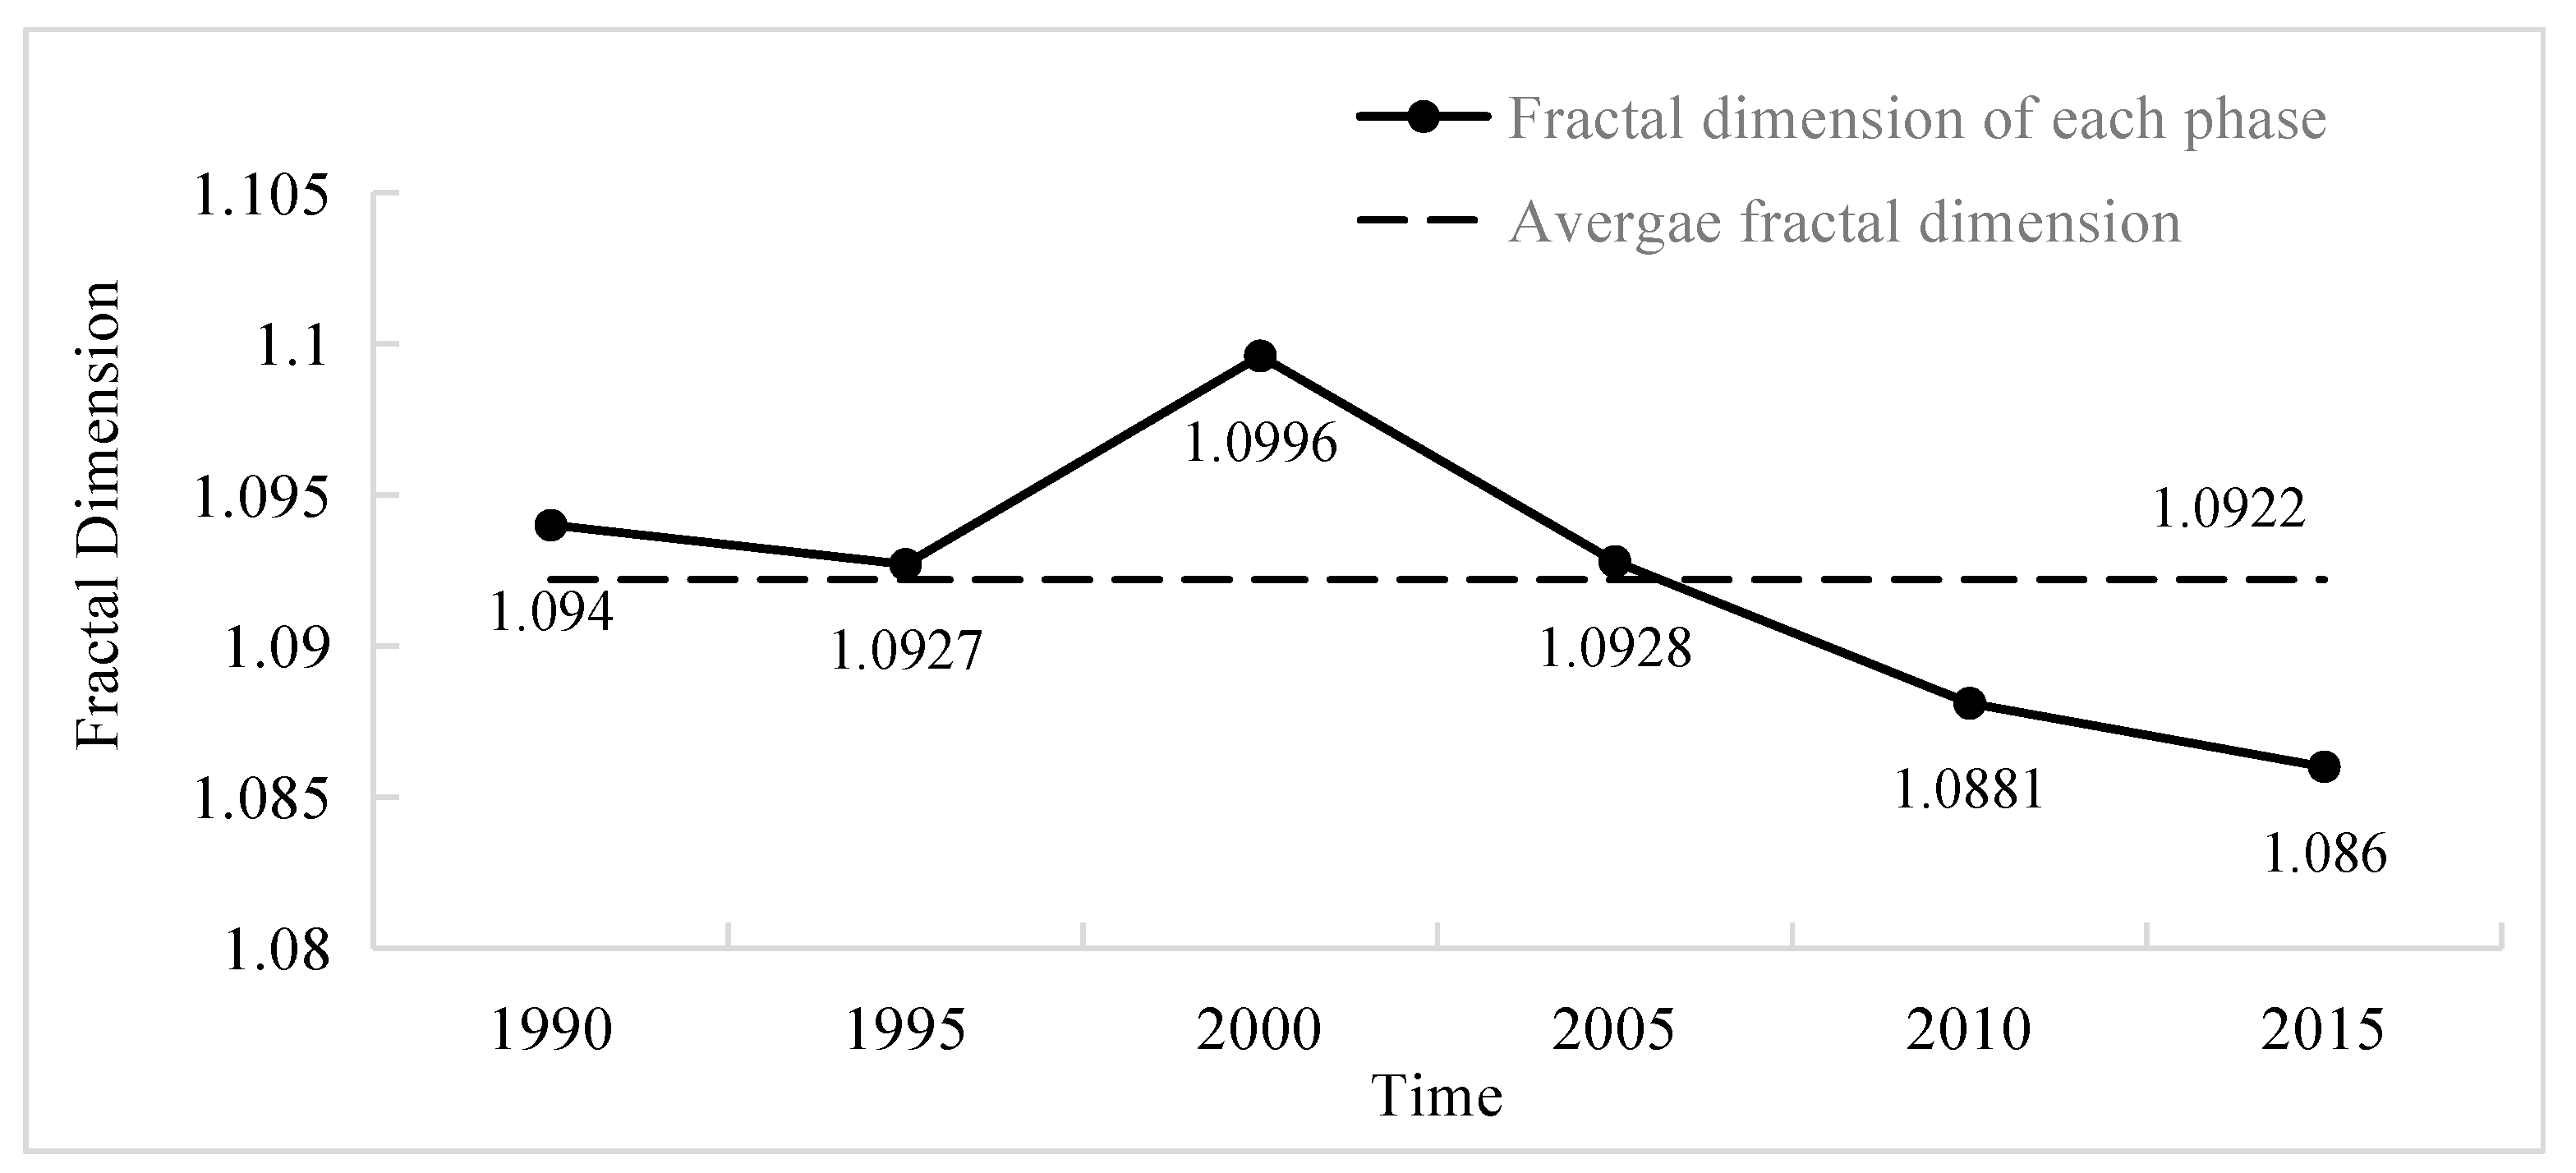
- The coastline in Zhejiang Province showed distinct spatiotemporal changes since 1990. The total coastline length decreased continuously. Unlike the global coastline recession, positions of the coastline in Zhejiang Province moved seaward at a dramatic rate, which were caused by many intensive sea reclamation projects. The overall coastline changed slightly, and the intensity of change was only −0.21%. The coastlines were zigzagged and had complex structures, due to the mountainous and hilly topography. The average fractal dimension of mainland coastline in Zhejiang Province during the last 25 years was 1.0922. It was relatively stable before 2000, but decreased continuously later on. This was caused by the increasing human activities that decreased coastline curvature and complexity. The fractal dimension of the coastline in 2015 decreased to 1.086, which directly reflected the high intensity of the coastline artificialization in Zhejiang Province.
- (2)
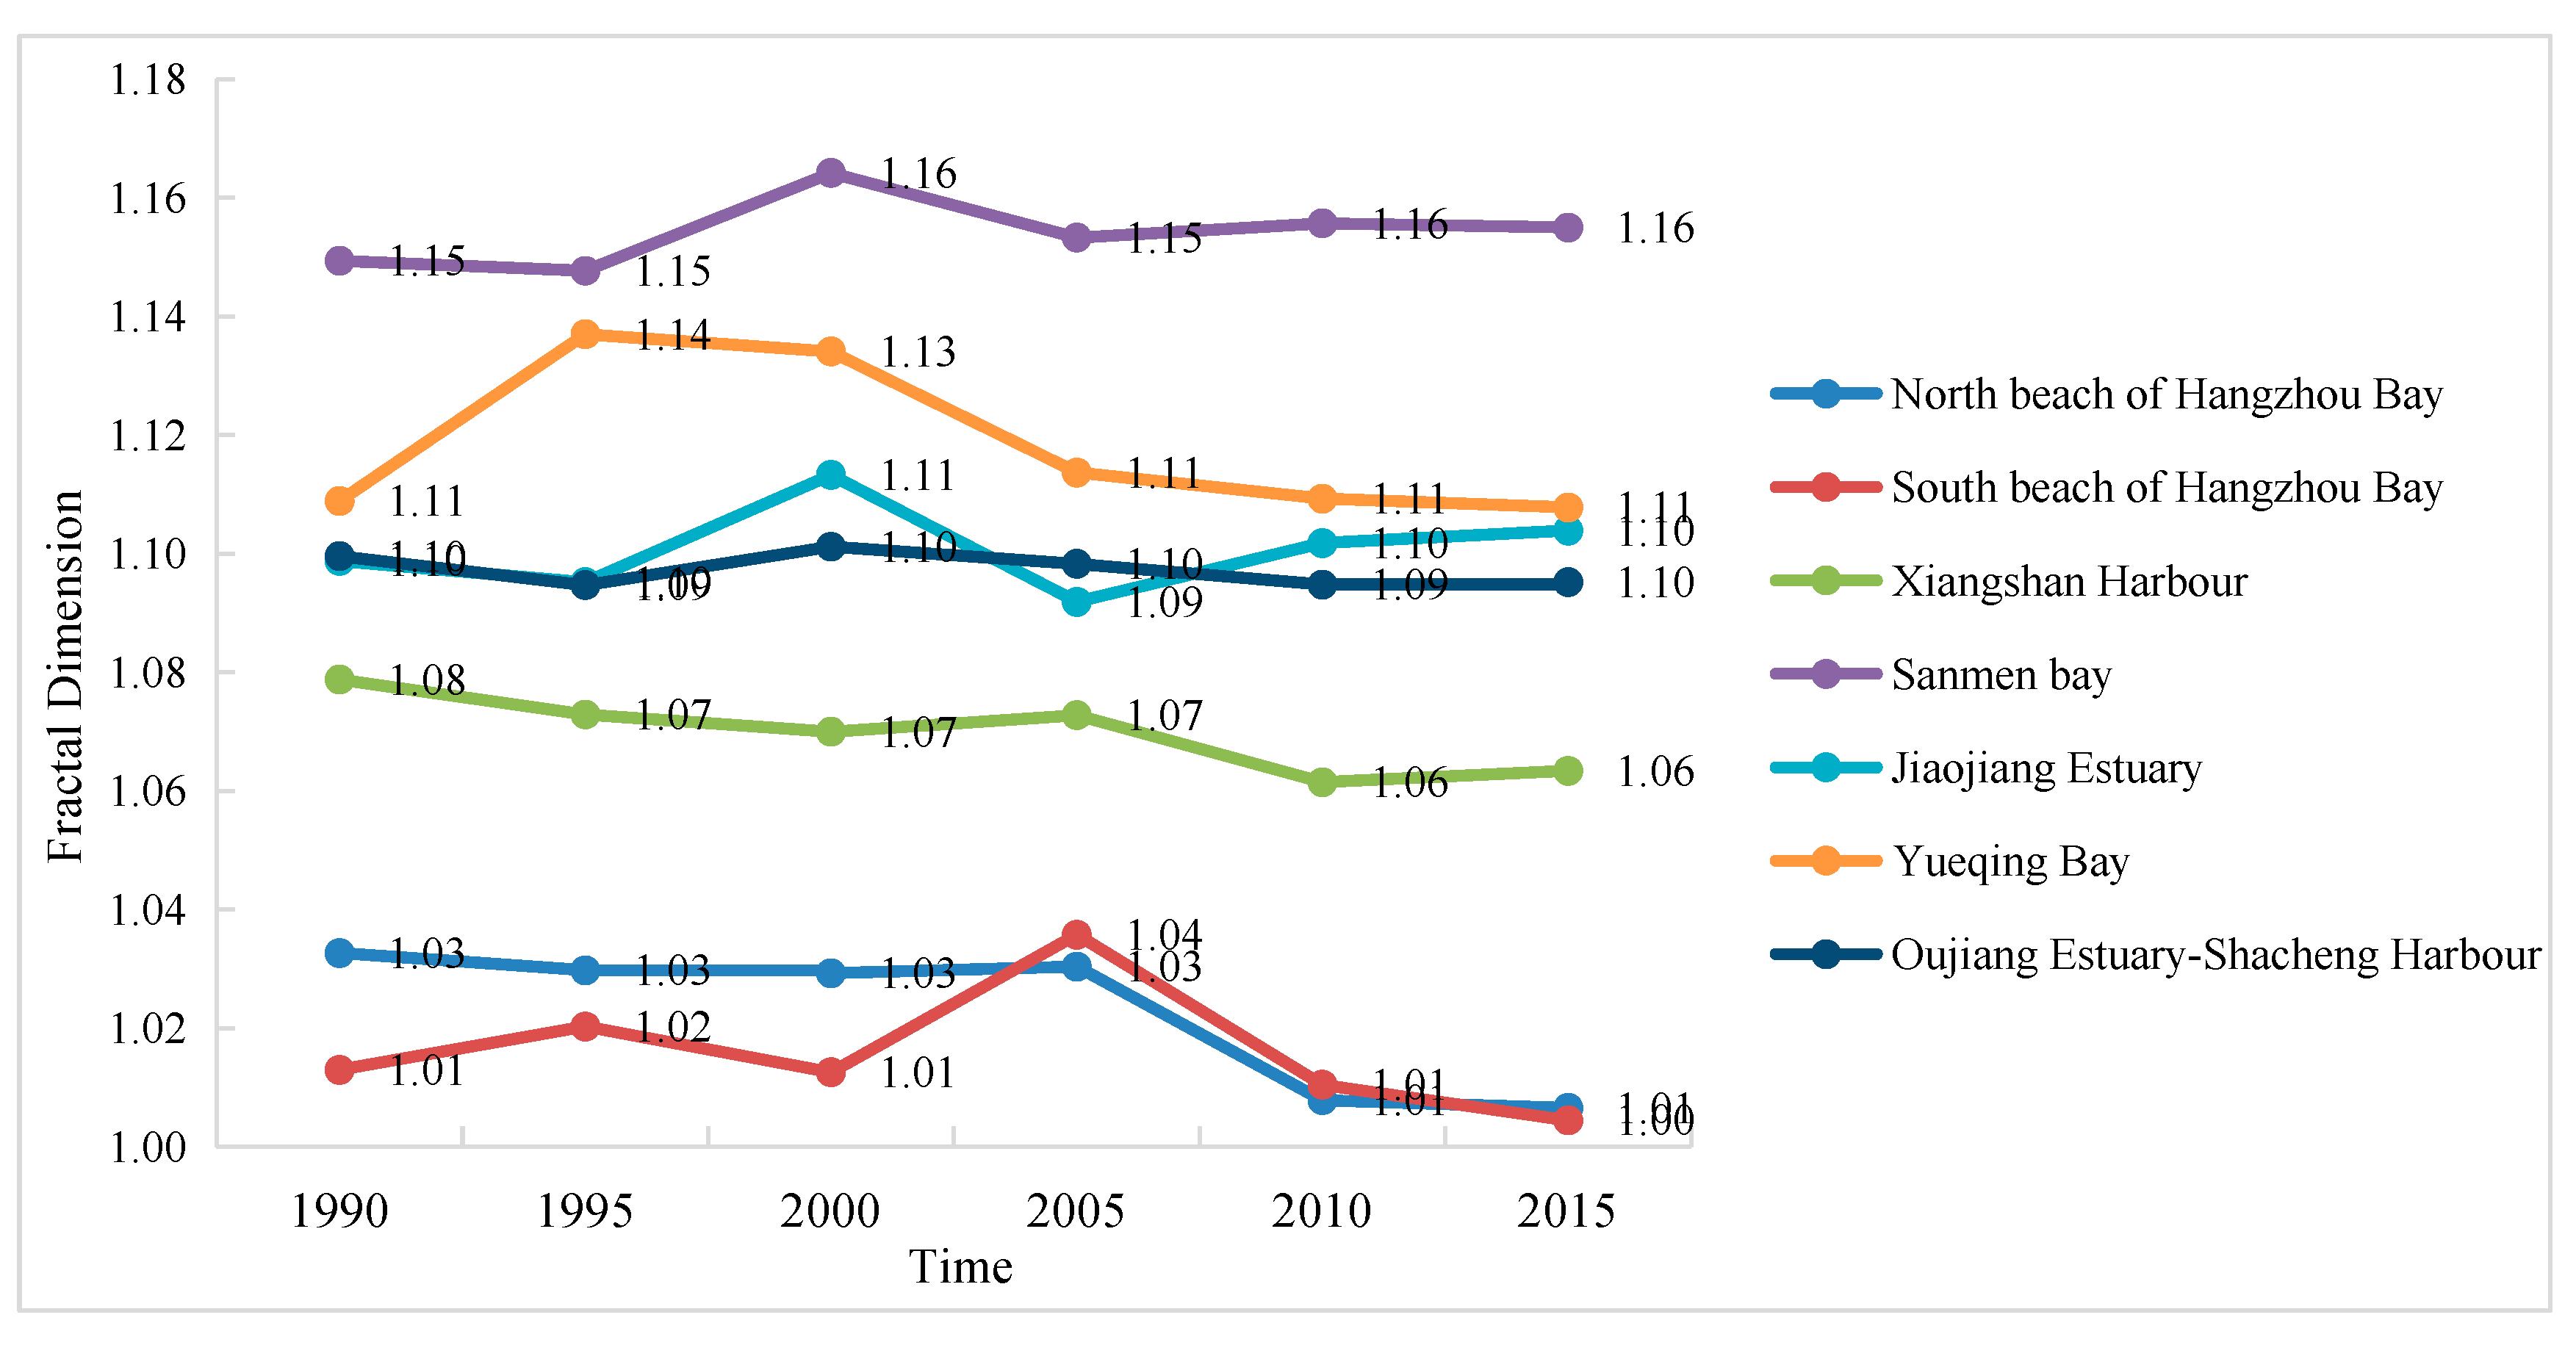
- The fractal dimensions of the coastlines in North Beach and South Beach in Hangzhou Bay, as well as Xiangshan Harbor, were generally lower than the overall fractal dimension of the entire coastline in Zhejiang Province throughout the study period. Sanmen Bay presented the highest fractal dimension which was maintained over 1.14 from 1990 to 2015. The fractal dimensions of the coastlines in Jiaojiang Estuary, Yueqing Bay, and Oujiang Estuary-Shacheng Harbour were slightly higher than the average value, and they fluctuated gently.
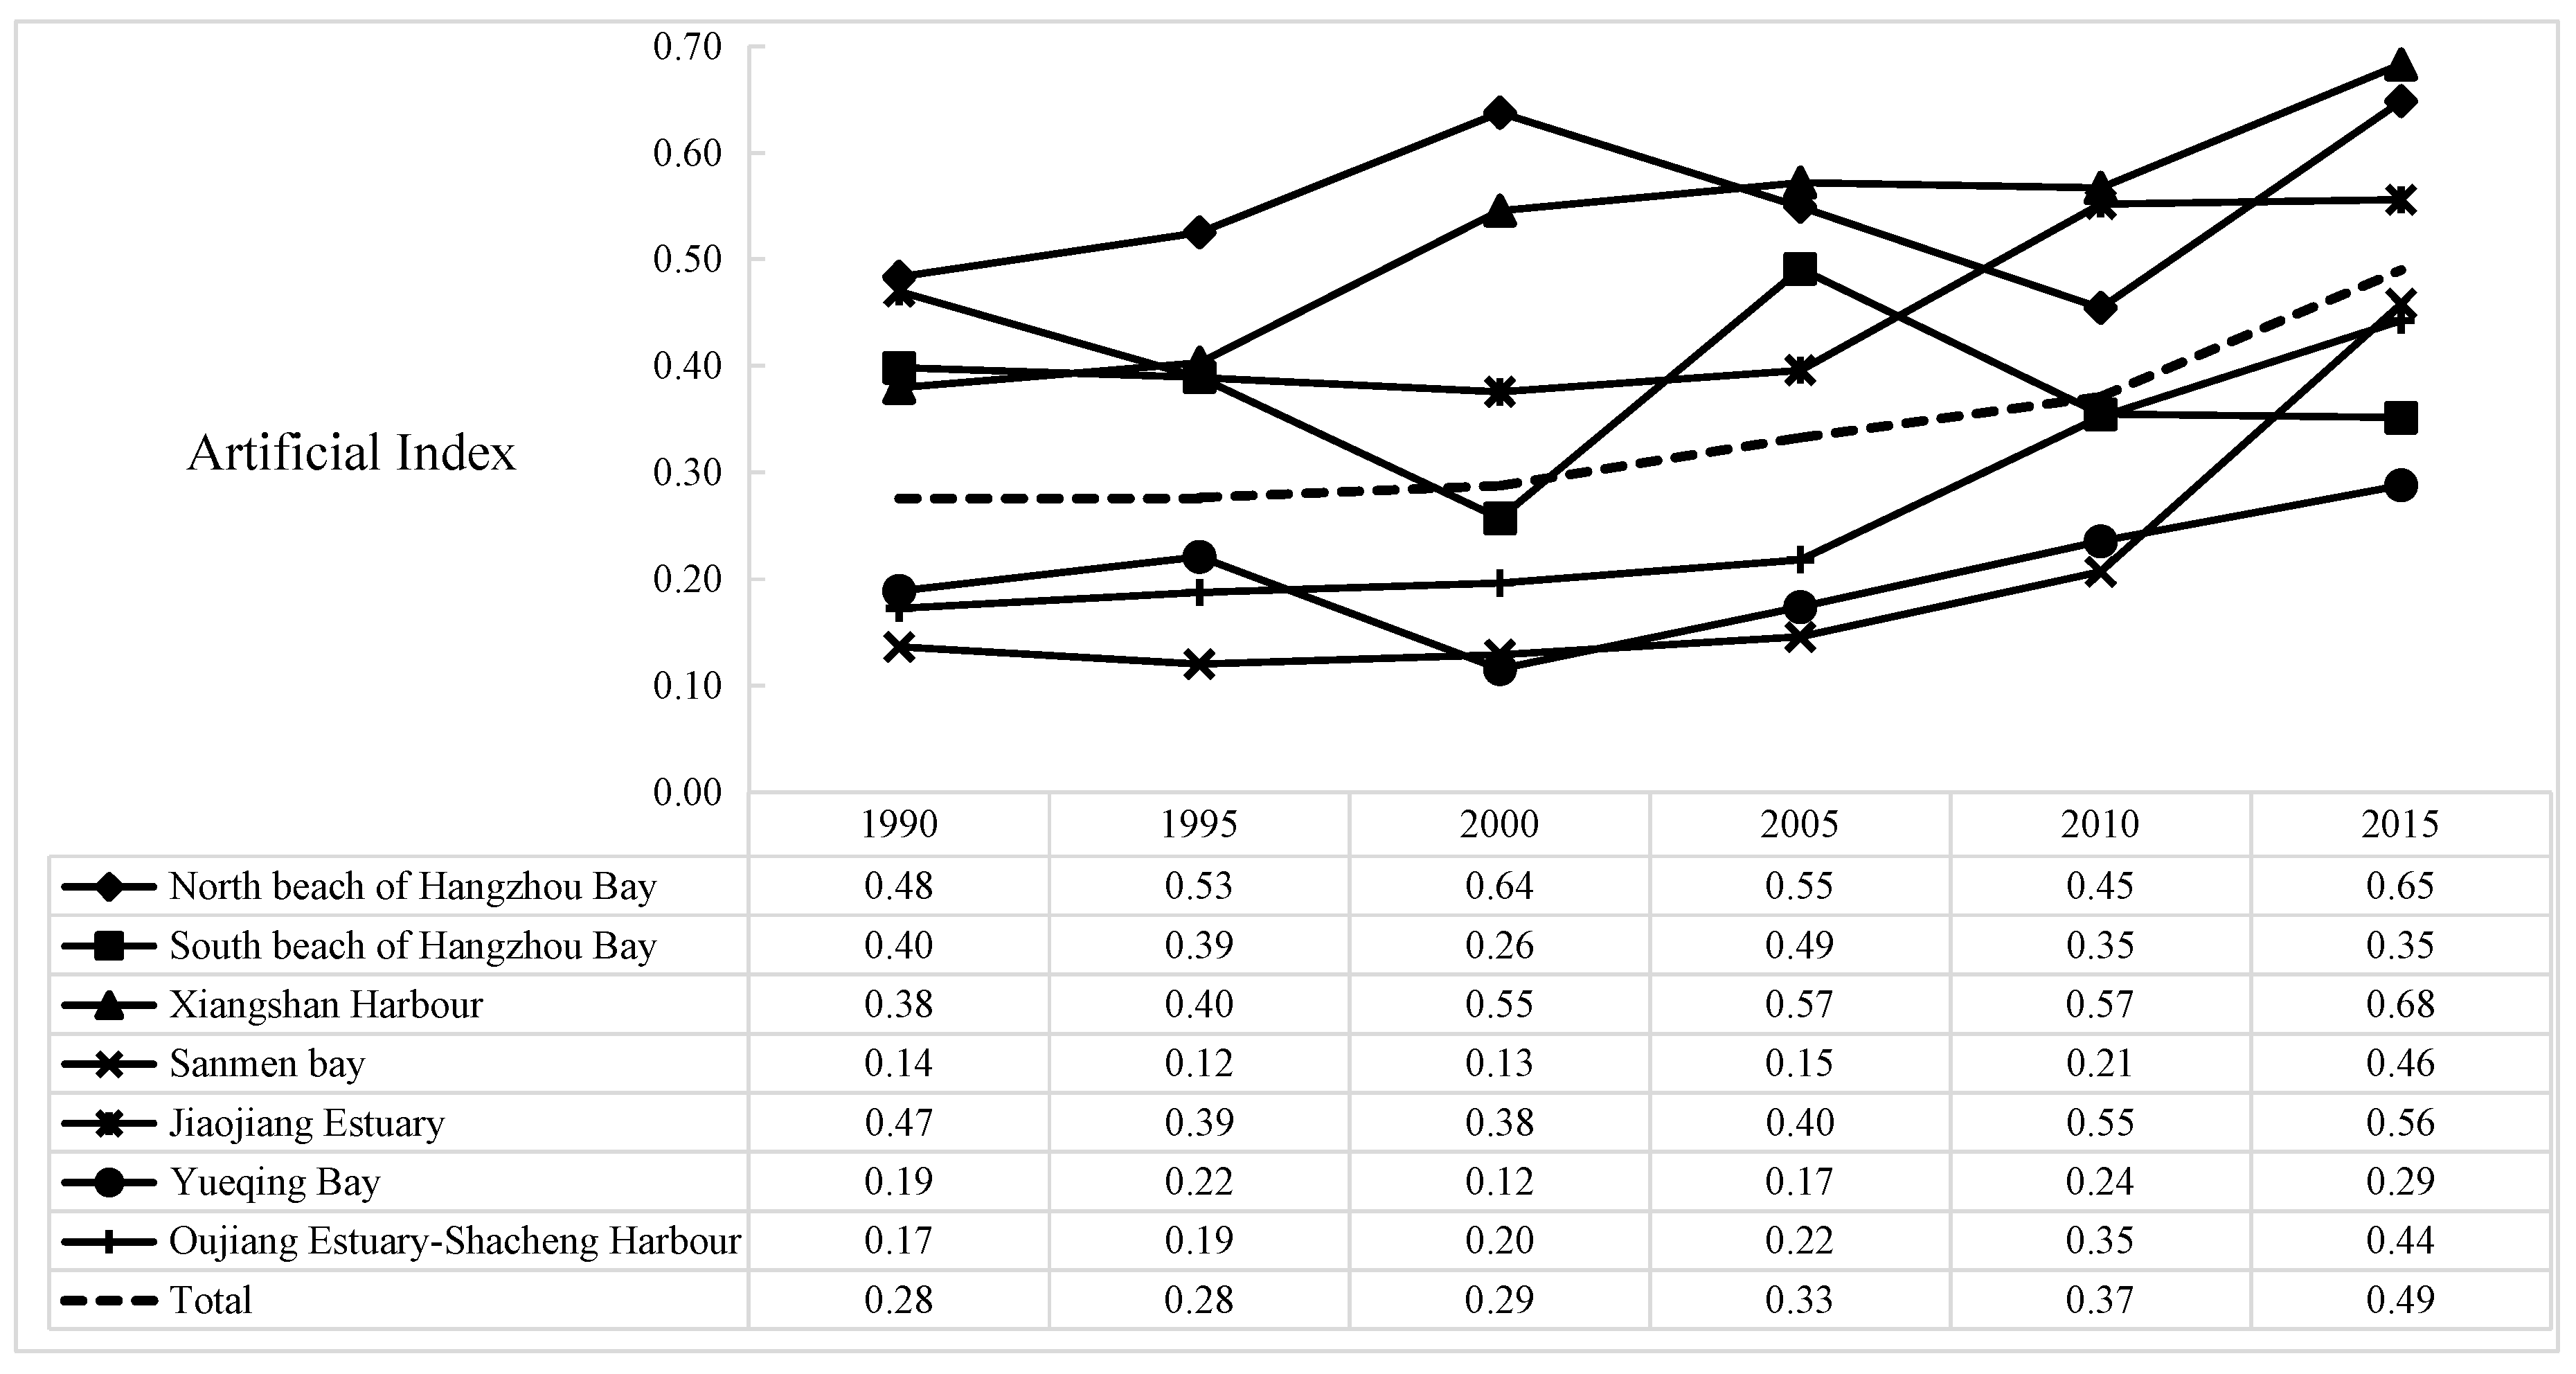
- (3)
- The artificialization index of coastline in Zhejiang Province increased continuously during the study period. The major artificial activity was developing bedrock coastline in the harbour areas. In sludge coastal zones, the artificialization index decreased slightly, due to the excessive sedimentation compared to sea reclamation intensity. In particular, North Beach in Hangzhou Bay, Xiangshan Harbour, and Jiaojiang Estuary showed the highest artificialization index, followed by South Beach in Hangzhou Bay and Jiaojiang Estuary-Shacheng Harbour (0.37 and 0.46, respectively). Sanmen Bay and Yueqing Bay achieved the lowest artificialization index.
- (4)
- There was a single principal coastline utilization type in South Beach in Hangzhou Bay, Sanmen Bay, and Oujiang Estuary-Shacheng Harbor. The Xiangshan Harbour maintained a binary coastline structure composed of bedrock coastlines and aquaculture coastlines. The coastline utilization structure in Jiaojiang Estuary evolved from a binary structure to a ternary structure, then back to binary structure again. The coastline utilization structure in North Beach in Hangzhou Bay evolved from the ternary structure to a single structure, and then back to the ternary structure again. The coastline utilization structure in Yueqing Bay also evolved from the binary structure to a single structure, then back to the binary structure again.
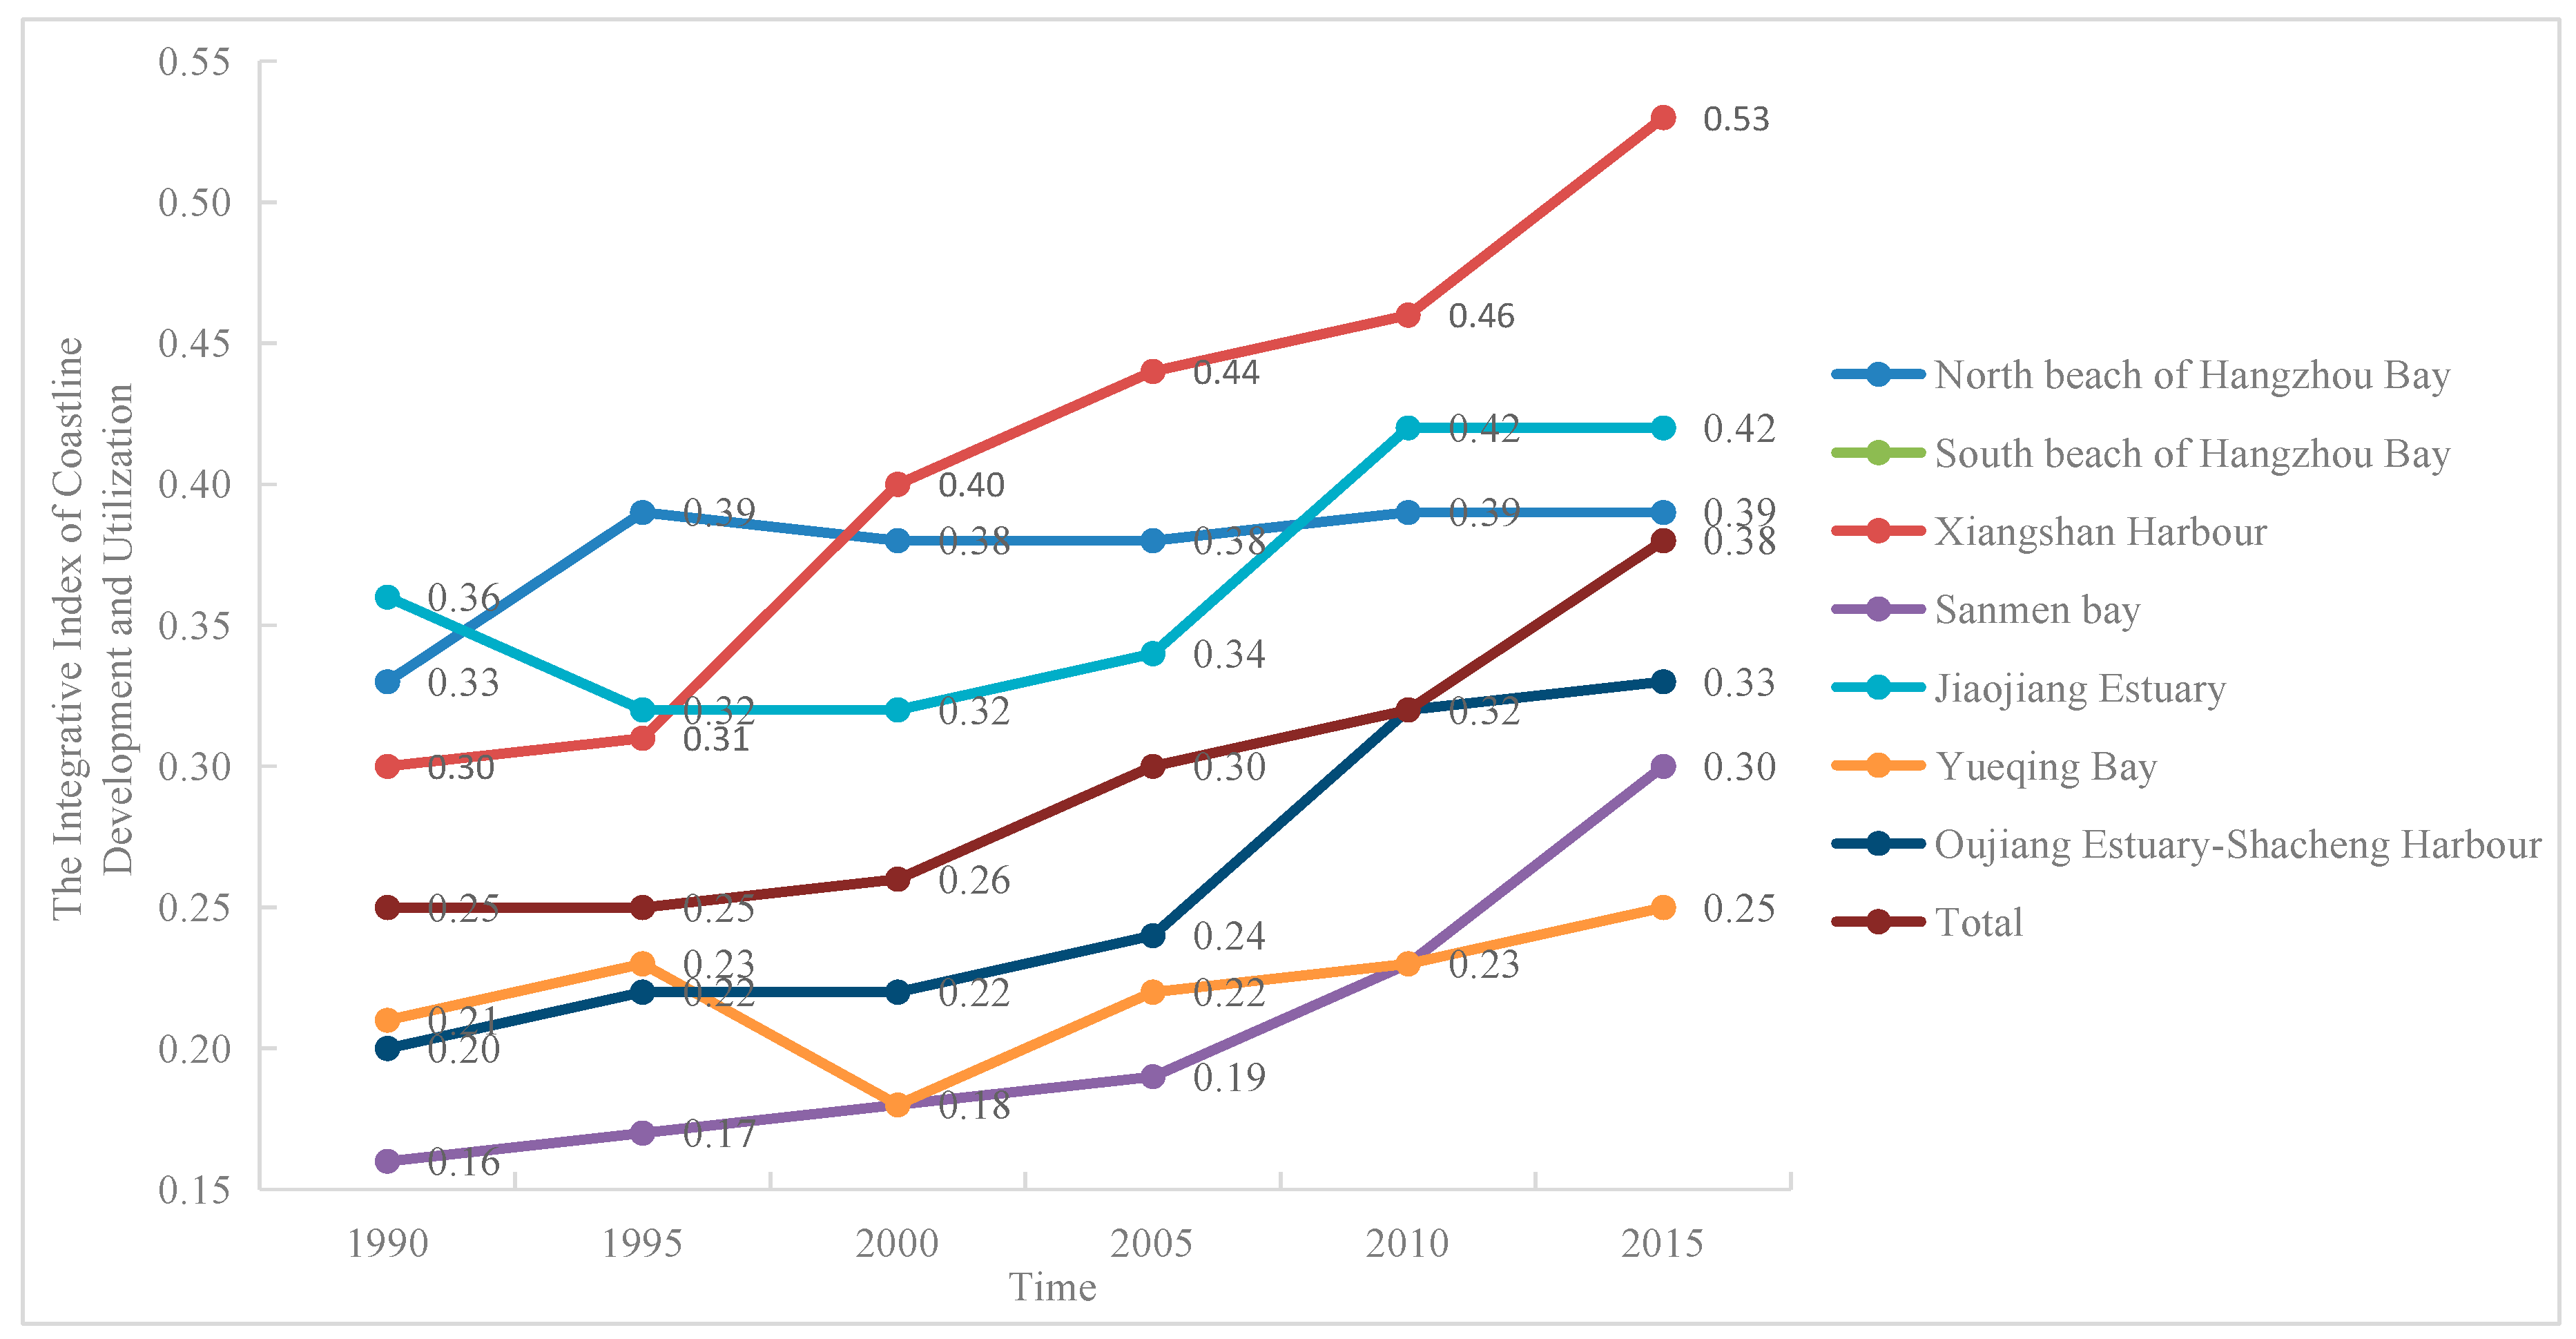
- (5)
- The integrated coastline utilization index in Zhejiang Province kept increasing during the study period, indicating the continuous intensive influences of human activities on coastlines. The Xiangshan Harbor achieved the highest integrated coastline utilization index compared to the rest of the coastline sections in Zhejiang Province, and reached 0.53 in 2015, which was mainly caused by marine industries. The integrated coastline utilization indices of Jiaojiang Estuary and North Beach in Hangzhou Bay, which were 0.42 and 0.39, respectively, in 2015, were higher than the average value in Zhejiang Province. These three coastline sections were evaluated as the high-intensity development sections. The integrated coastline utilization index of South Beach in Hangzhou Bay fluctuated violently, which was a response to the integrative effects of sedimentation and sea reclamation. The remaining three coastline sections were viewed as the low-intensity development sections, due to the low integrated coastline utilization indices.
Acknowledgments
Author Contributions
Conflicts of Interest
References
- Mujabar, P.S.; Chandrasekar, N. Shoreline change analysis along the coast between Kanyakumari and Tuticorin of India using remote sensing and GIS. Arab. J. Geosci. 2013, 6, 647–664. [Google Scholar] [CrossRef]
- Primavera, J.H. Overcoming the impacts of aquaculture on the coastal zone. Ocean Coast. Manag. 2006, 49, 531–545. [Google Scholar] [CrossRef]
- Xu, J.; Zhang, Z.; Zhao, X.; Wen, Q.; Zuo, L.; Wang, X.; Yi, L. Spatial-temporal analysis of coastline changes in northern China from 2000 to 2012. Acta Geogr. Sin. 2013, 68, 651–660. [Google Scholar]
- Li, X.; Zhang, L.; Ji, C.; Liu, H.; Huang, Q. Spatiotemporal changes of Jiangsu coastline: A remote sensing and GIS approach. Geogr. Res. 2014, 33, 414–426. [Google Scholar]
- Zhang, X.; Wang, W.; Yan, C.; Yan, W.; Dai, Y.; Xu, P.; Zhu, C. Historical Coastline Spatio-temporal Evolution Analysis in Jiangsu Coastal Area during the Past 1000 Years. Sci. Geogr. Sin. 2014, 34, 344–351. [Google Scholar]
- Ma, J.; Liu, D.; Chen, Y. Random prefractal dimension and length uncertainty of the continental coastline of China. Geogr. Res. 2015, 34, 319–327. [Google Scholar]
- Gao, Y.; Su, F.; Zhou, C.; Yang, X.; Sum, X.; Zhang, D. Scale Effects of China Mainland Coastline Based on Fractal Theory. Acta Geogr. Sin. 2011, 66, 331–339. [Google Scholar]
- Romine, B.M.; Fletcher, C.H. A summary of historical shoreline changes on beaches of Kauai, Oahu, and Maui, Hawaii. J. Coast. Res. 2013, 29, 605–614. [Google Scholar] [CrossRef]
- Stanica, A.; Dan, S.; Ungureanu, V.G. Coastal changes at the Sulina mouth of the Danube River as a result of human activities. Mar. Pollut. Bull. 2007, 55, 555–563. [Google Scholar] [CrossRef] [PubMed]
- Morton, R.A.; Clifton, H.E.; Buster, N.A.; Peterson, R.L.; Gelfenbaum, G. Forcing of large-scale cycles of coastal change at the entrance to Willapa Bay. Wash. Mar. Geol. 2007, 246, 24–41. [Google Scholar] [CrossRef]
- Hou, X.; Hou, W.; Wu, T. Shape changes of major gulfs along the mainland of China since the early 1940s. Acta Geogr. Sin. 2016, 71, 118–129. [Google Scholar]
- Ryu, J.H.; Choi, J.K.; Lee, Y.K. Potential of remote sensing in management of tidal flats: A case study of thematic mapping in the Korean tidal flats. Ocean Coast. Manag. 2014, 102, 458–470. [Google Scholar] [CrossRef]
- Sun, C.; Li, M. Spatial-Temporal Change of Coastline in Liaoning Province and Its Driving Factor Analysis. Geogr. Geo-Inf. Sci. 2010, 26, 63–67. [Google Scholar]
- Yao, X.; Gao, Y.; Du, Y.; Ji, M. Spatial and Temporal Changes of Hainan Coastline in the Past 30 Years Based on RS. J. Nat. Resour. 2013, 28, 114–125. [Google Scholar]
- Zhang, Z.; Zhang, Y.; Shen, Z. Port Recognition in High Resolution Remote Sensing Images Based on Feature Spectrum. Acta Electron. Sin. 2010, 38, 2184–2188. [Google Scholar]
- Zhu, C.; Zhang, X.; Luo, J.; Li, W.; Yang, J. Automatic extraction of coastline by remote sensing technology based on SVM and auto-selection of training samples. Remote Sens. Land Resour. 2013, 25, 69–74. [Google Scholar]
- Li, Y.; Wang, Y.; Peng, J.; Wu, J.; Lv, X. Research on dynamic changes of coastline in Shenzhen city based on Landsat image. Resour. Sci. 2009, 31, 875–883. [Google Scholar]
- Guo, Q.; Pu, R.; Li, J.; Cheng, J. A weighted normalized difference water index for water extraction using Landsat imagery. Int. J. Remote Sens. 2017, 38, 5430–5445. [Google Scholar] [CrossRef]
- Cooper, M.J.P.; Beevers, M.D.; Oppenheimer, M. The potential impacts of sea level rise on the coastal region of New Jersey, USA. Clim. Chang. 2008, 90, 475–492. [Google Scholar] [CrossRef]
- Solomon, S.M. Spatial and temporal variability of shoreline change in the Beaufort-Mackenzie region, Northwest Territories, Canada. Geo-Mar. Lett. 2005, 25, 127–137. [Google Scholar] [CrossRef]
- Aiello, A.; Canora, F.; Pasquariello, G.; Spilotro, G. Shoreline variations and coastal dynamics: A space–time data analysis of the Jonian littoral, Italy. Estuar. Coast. Shelf Sci. 2013, 129, 124–135. [Google Scholar] [CrossRef]
- Hapke, C.J.; Reid, D.; Richmond, B. Rates and trends of coastal change in California and the regional behavior of the beach and cliff system. J. Coast. Res. 2009, 25, 603–615. [Google Scholar] [CrossRef]
- Schupp, C.A.; Mcninch, J.E.; List, J.H. Nearshore shore-oblique bars, gravel outcrops, and their correlation to shoreline change. Mar. Geol. 2006, 233, 63–79. [Google Scholar] [CrossRef]
- Stockdon, H.F.; Sallenger, A.H., Jr.; Holman, R.A.; Peter, A.H. A simple model for the spatially-variable coastal response to hurricanes. Mar. Geol. 2007, 238, 1–20. [Google Scholar] [CrossRef]
- Guo, Q.; Pu, R.; Zhang, B.; Gao, L. A comparative study of coastline changes at Tampa Bay and Xiangshan Harbor during the last 30 years. In Proceedings of the 2016 IEEE International Geoscience and Remote Sensing Symposium (IGARSS), Beijing, China, 10–15 July2016; pp. 5185–5188. [Google Scholar]
- Xu, L. Research on the Coastal Types and Landscape Evolution of Zhejiang Province under the Influence of the Shoreline Development. Master’s Thesis, Ningbo University, Ningbo, China, 2015. [Google Scholar]
- Liu, H.; Jezek, K.C. Automated extraction of coastline from satellite imagery by integrating Canny edge detection and locally adaptive thresholding methods. Int. J. Remote Sens. 2004, 25, 937–958. [Google Scholar] [CrossRef]
- Chen, Q. Zhejiang Geographically Brief Chronicles; Hangzhou Zhejiang People’s Publishing House: Hangzhou, China, 1985. [Google Scholar]
- Exelis. Exelis Visual Information Solutions; ENVI Image Window Views Help, ENVI5.2; Exelis Inc.: Herndon, VA, USA, 2017. [Google Scholar]
- Sun, W.; Ma, Y.; Zhang, J.; Liu, S.; Ren, G. Study of Remote Sensing Interpretation Keys and Extraction Technique of Different types of Shoreline. Bull. Surv. Mapp. 2011, 3, 41–44. [Google Scholar]
- Shen, J.; Zhai, J.; Guo, H. Study on coastline extraction technology. Hydrogr. Surv. Charting 2009, 29, 74–77. [Google Scholar]
- Carr, J.R.; Benzer, W.B. On the practice of estimating fractal dimension. Math. Geol. 1991, 23, 945–958. [Google Scholar] [CrossRef]
- Singh, H.K.; Gupta, P.D. Quantification analysis of chaotic fractal dimensions. Int. J. Eng. Comput. Sci. 2013, 2, 1192–1199. [Google Scholar]
- Mandelbrot, B.B. Stochastic models for the earth’s relief, the shape and the fractal dimension of the coastlines, and the number-area rule for islands. Proc. Natl. Acad. Sci. USA 1975, 72, 3825–3828. [Google Scholar] [CrossRef] [PubMed]
- Zhu, X.; Cai, Y. Study on Fractal Dimension of Chinese Coastline and Its Character. Adv. Mar. Sci. 2004, 22, 156–162. [Google Scholar]
- Zhu, X.; Zha, Y.; Lu, J. On Dynamic Change of Fractal Dimensions of Temporal Series and Fractal Simulation of Coastline-A Case Study of Jiangsu Coastline. Mar. Sci. Bull. 2002, 21, 37–43. [Google Scholar]
- Xiao, D. Landscape Ecology: Theory, Methods and Applications; China Forestry Publishing House: Beijing, China, 1991. [Google Scholar]
- Kuleli, T. Quantitative analysis of shoreline changes at the Mediterranean Coast in Turkey. Environ. Monit. Assess. 2010, 167, 387–397. [Google Scholar] [CrossRef] [PubMed]
- Li, W.; Yu, Q. Overview of reclamation history, present situation and management policy in China. China Territ. Today 2013, 12, 36–38. [Google Scholar]


| Grid Length, ε (m) | Scale Denominator, Q |
|---|---|
| 75 | 250,000 |
| 150 | 500,000 |
| 300 | 1,000,000 |
| 600 | 2,000,000 |
| 900 | 3,000,000 |
| 1000 | Not available |
| 1100 | 3,500,000 |
| 1200 | 4,000,000 |
| 1500 | 5,000,000 |
| 1800 | 6,000,000 |
| 2500 | Not available |
| 3000 | 10,000,000 |
| Subjectivity of Coastline Utilization | Requirement |
|---|---|
| Single principal | A certain type li > 0.45 |
| Binary, ternary principal | Each type li < 0.45, but two or more types li > 0.2 |
| Multivariant principal | Each type li < 0.45, but only one li > 0.2 |
| Non principal | Each type li < 0.2 |
| Coastline Type | Natural Coastline | Urban and Industrial Coastline | Protective Coastline | Harbour Coastline | Hquatic Cultivation Coastline |
|---|---|---|---|---|---|
| Factor | 0.1 | 1 | 0.2 | 0.8 | 0.6 |
| Length (km) | ||||||
|---|---|---|---|---|---|---|
| 1990 | 1995 | 2000 | 2005 | 2010 | 2015 | |
| North Beach of Hangzhou Bay | 104.48 | 103.33 | 105.31 | 111.83 | 100.06 | 99.96 |
| South Beach of Hangzhou Bay | 166.12 | 167.48 | 156.91 | 174.54 | 165.62 | 159.89 |
| XiangshanHarbour | 414.88 | 412.57 | 390.71 | 392.33 | 369.11 | 374.58 |
| SanmenBay | 491.81 | 481.28 | 474.87 | 451.93 | 458.71 | 460.41 |
| Jiaojiang Estuary | 180.40 | 172.98 | 192.83 | 170.00 | 185.84 | 186.53 |
| Yueqing Bay | 275.55 | 304.43 | 286.74 | 259.54 | 226.42 | 236.04 |
| Oujiang Estuary-Shacheng Harbour | 271.22 | 271.40 | 267.87 | 265.73 | 281.99 | 287.71 |
| Total | 1904.45 | 1913.45 | 1875.24 | 1825.89 | 1787.74 | 1805.11 |
| Scale Denominator, Q | Grid Length, ε (m) | The Number of Grids for Cover Coastlines, N(ε) | |||||
|---|---|---|---|---|---|---|---|
| 1990 | 1995 | 2000 | 2005 | 2010 | 2015 | ||
| 250,000 | 75 | 31,767 | 31,895 | 31,290 | 30,509 | 29,974 | 30,180 |
| 500,000 | 150 | 15,624 | 15,674 | 15,389 | 14,941 | 14,713 | 14,823 |
| 1,000,000 | 300 | 7542 | 7530 | 7423 | 7207 | 7106 | 7155 |
| 2,000,000 | 600 | 3568 | 3552 | 3474 | 3394 | 3344 | 3376 |
| 3,000,000 | 900 | 2258 | 2256 | 2201 | 2154 | 2128 | 2162 |
| Not available | 1000 | 2022 | 2037 | 1962 | 1907 | 1899 | 1927 |
| 3,500,000 | 1100 | 1814 | 1810 | 1771 | 1722 | 1704 | 1725 |
| 4,000,000 | 1200 | 1647 | 1639 | 1592 | 1583 | 1554 | 1561 |
| 5,000,000 | 1500 | 1278 | 1290 | 1234 | 1217 | 1213 | 1229 |
| 6,000,000 | 1800 | 1018 | 1017 | 989 | 979 | 961 | 973 |
| Not available | 2500 | 699 | 708 | 681 | 673 | 673 | 682 |
| 10,000,000 | 3000 | 559 | 563 | 539 | 542 | 547 | 555 |
| 1990 | 2000 | 2010 | 2015 | |||||||||
|---|---|---|---|---|---|---|---|---|---|---|---|---|
| Shoreline Structure | Principal Types | Subjectivity | Shoreline Structure | Principal Types | Subjectivity | Shoreline Structure | Principal Types | Subjectivity | Shoreline Structure | Principal Types | Subjectivity | |
| North beach of Hangzhou Bay | ternary | aquatic cultivation | 0.38 | binary | aquatic cultivation | 0.43 | single | sludge | 0.48 | ternary | urban and industrial | 0.33 |
| sludge | 0.25 | sludge | 0.23 | sludge | 0.28 | |||||||
| bedrock | 0.24 | aquatic cultivation | 0.22 | |||||||||
| South beach of Hangzhou Bay | single | sludge | 0.57 | single | sludge | 0.72 | single | sludge | 0.63 | single | sludge | 0.62 |
| Xiangshan Harbour | binary | bedrock | 0.42 | binary | aquatic cultivation | 0.29 | binary | bedrock | 0.24 | binary | bedrock | 0.29 |
| aquatic cultivation | 0.3 | bedrock | 0.26 | aquatic cultivation | 0.23 | aquatic cultivation | 0.22 | |||||
| Sanmen bay | single | sludge | 0.51 | single | sludge | 0.57 | single | sludge | 0.53 | single | sludge | 0.5 |
| Jiaojiang Estuary | binary | aquatic cultivation | 0.41 | ternary | bedrock | 0.35 | binary | bedrock | 0.39 | binary | bedrock | 0.39 |
| bedrock | 0.36 | sludge | 0.27 | aquatic cultivation | 0.28 | aquatic cultivation | 0.27 | |||||
| aquatic cultivation | 0.21 | |||||||||||
| Yueqing Bay | binary | bedrock | 0.41 | single | sludge | 0.54 | binary | sludge | 0.41 | binary | sludge | 0.37 |
| sludge | 0.4 | bedrock | 0.35 | bedrock | 0.34 | |||||||
| Oujiang Estuary-Shacheng Harbour | single | bedrock | 0.56 | single | bedrock | 0.51 | single | bedrock | 0.47 | single | bedrock | 0.46 |
© 2018 by the authors. Licensee MDPI, Basel, Switzerland. This article is an open access article distributed under the terms and conditions of the Creative Commons Attribution (CC BY) license (http://creativecommons.org/licenses/by/4.0/).
Share and Cite
Li, J.; Ye, M.; Pu, R.; Liu, Y.; Guo, Q.; Feng, B.; Huang, R.; He, G. Spatiotemporal Change Patterns of Coastlines in Zhejiang Province, China, Over the Last Twenty-Five Years. Sustainability 2018, 10, 477. https://doi.org/10.3390/su10020477
Li J, Ye M, Pu R, Liu Y, Guo Q, Feng B, Huang R, He G. Spatiotemporal Change Patterns of Coastlines in Zhejiang Province, China, Over the Last Twenty-Five Years. Sustainability. 2018; 10(2):477. https://doi.org/10.3390/su10020477
Chicago/Turabian StyleLi, Jialin, Mengyao Ye, Ruiliang Pu, Yongchao Liu, Qiandong Guo, Baixiang Feng, Ripeng Huang, and Gaili He. 2018. "Spatiotemporal Change Patterns of Coastlines in Zhejiang Province, China, Over the Last Twenty-Five Years" Sustainability 10, no. 2: 477. https://doi.org/10.3390/su10020477