Voice-Controlled and Wireless Solid Set Canopy Delivery (VCW-SSCD) System for Mist-Cooling


1
Department of Physics and Engineering, California State University, 9001 Stockdale Highway, Bakersfield, CA 93311, USA
2
Department of Agricultural and Biological Engineering, University of Florida, Southwest Florida Research and Education Center, 2685 FL-29, Immokalee, FL 34142, USA
3
Department of Computer and Electrical Engineering and Computer Science, California State University, 9001 Stockdale Highway, Bakersfield, CA 93311, USA
4
Department of Plant Sciences, University of California, Wickson Hall, CA 95616, USA
*
Author to whom correspondence should be addressed.
Sustainability 2018, 10(2), 421; https://doi.org/10.3390/su10020421
Submission received: 22 January 2018
/
Revised: 30 January 2018
/
Accepted: 2 February 2018
/
Published: 6 February 2018
(This article belongs to the Special Issue Information and Communications Technologies (ICT) for Sustainability)
Abstract
:California growers in the San Joaquin Valley believe that climate change will affect the pistachio yield dramatically. As the central valley fog disappears, insufficient dormant chill accumulation results in poor flowering synchrony, flower quality, and fruit set in this dioecious species. We have developed a novel, user-friendly, and low-cost Voice-Controlled Wireless Solid Set Canopy Delivery (VCW-SSCD) system to increase bud chill accumulation with evaporative cooling on sunny (winter) days. This system includes: (i) an automated solid-state canopy delivery (SSCD) system; (ii) a wireless weather-, crop-related data acquisition system; (iii) a Voice-Controlled (VC) system using Amazon Alexa; (iv) a mobile application to visualize the collected data and wirelessly control the SSCD system; and (v) a smart control system. The proposed system was deployed and evaluated in a commercial pistachio orchard in Bakersfield, CA. The system worked well with no reported errors. Results demonstrated the system’s ability to cool bud temperatures in a low relative humidity climate. At an ambient temperature of 10–20 °C, bud temperatures were lowered 5–10 °C.
1. Introduction
Global climate change has increased global temperatures 1.1 °C since the 19th century, accelerating sharply during the last 35 years as CO2 gas released into the atmosphere has increased [1,2]. This increase in global temperatures has affected agricultural crops around the world both positively and negatively. Higher temperatures and increased CO2 have enhanced the size and range [3,4] in some crops. Others have been impacted negatively by increased CO2 levels and temperatures, which have decreased stomatal conductance and canopy cover [5,6]. California temperatures have increased by 1.7 °C in the last century [7]. Cal-Adapt (produced by State of California’s scientific and research community) projects a 2.7 °C to 4.3 °C increase in annual temperatures for California [7]. An increase of days over 38 °C from 38 days a year to 43 days a year is predicted for Kern County, California, specifically [7]. Kern County has begun experiencing higher than average winter temperatures and is predicted to undergo an average increase of 1.8 °C to 4.5 °C annually [7].
California produced 98.5% of the nation’s pistachios, valued at $1.9 billion, in 2017 [8]. Kern County, in the southern San Joaquin Valley, produced 44% of California’s pistachios in 2017. From 2015 to 2016, a sustained drought and warm winter temperatures precipitated a 47% drop in California pistachio production [8]. This had a devastating effect on Kern County’s rural economy. California’s pistachio growers believe climate change will increasingly affect pistachio dormant chill accumulation and yield, making pistachio production unsustainable in California’s southern San Joaquin Valley [9,10].
Over the past three decades, global warming has decreased California pistachio yields. Due to sustained droughts, the central valley fogs which produce evaporative cooling and block daily sun exposure have decreased sharply. The sustained sunlight warms the buds and decreases chill accumulation. If the accumulated chill is insufficient to meet the chill requirement for dormancy release and bud break, the result is abnormal flowers, poor bloom synchrony, high rates of blanks, and lowered yields. Pistachios need 58–66 chill portions (7.2 °C) to properly bloom and pollinate. In 2013–2016, the southern San Joaquin Valley had unusually warm temperatures with little rain and fog that did not provide the minimum chilling requirements and male trees to bloom and release pollen in synchrony with the female trees, resulting in lowered yields.
To counter this warming trend, California scientists have experimented with chemical treatments to enhance chill, and bred varieties that require less chilling hours. Inert kaolin clay compounds, (Surround), to reflect sunlight, sleeping oil applications that enhance chill accumulation by an unknown mechanism, and shading are among the treatments recently investigated in pistachios. Breeding new varieties to adapt to climate change is a long-term solution. The utilization of wind machines is a very costly solution [11]. Another potential treatment, evaporative cooling, has been used to delay bloom in deciduous fruit [12,13,14]. However, even when effective in delaying bloom, the proposed system had three main drawbacks: (1) the system used large amounts of water; (2) the probability of disease was increased; and (3) fruit set was decreased. Hence, there is an immediate need for new technologies or strategies to reduce climate-related risks for specialty crop producers [15,16].
An artificial mist system [17,18,19,20,21,22,23] that uses evaporative cooling to chill the buds and enhance dormancy has not been investigated in pistachios. Theoretically, misting with a Solid Set Canopy Delivery System (SSCD) could modify the microclimate and increase chilling through evaporative cooling [16,18]. An SSCD system combined with wireless data (weather and crop related data) acquisition and smart control systems could provide an environmentally friendly solution to enhance chill. It can maximize the evaporative cooling effect of the water, while minimizing the volume [24,25]. Additionally, an SSCD system connected to cloud-based software can provide flexibility, and improve accessibility and real-time visual monitoring of the application [26,27,28]. In this paper, we introduce an environmentally friendly and high-performance method to cool buds on sunny days to enhance chill accumulation. We have developed, deployed, and evaluated a novel Voice-Controlled Wireless SSCD (VCW-SSCD) system in a commercial pistachio orchard in Bakersfield, CA. Hopefully, this system will assist California growers by enhancing the chilling accumulation and ensure sustainable pistachio production in the southern San Joaquin Valley.
2. Materials and Methods
The proposed Voice-Controlled and Wireless Solid Set Canopy Delivery (VCW-SSCD) system includes:
- (1)
- A Solid Set Canopy Delivery (SSCD) system to apply mist and cool down the bud temperature on sunny winter days to enhance chilling.
- (2)
- A Wireless Sensor Network (WSN) and a Weather Station (WS) to collect weather- and crop-related data from the field (several zones).
- (3)
- A Voice-Controlled (VC) system using Amazon Alexa (Amazon Echo) and a server (raspberry pi microcontroller).
- (4)
- A mobile (cellphone) application (Android app) to visualize the collected data and wirelessly control the SSCD system.
- (5)
- A Smart Control (SC) system to collect the data from the WSN, receive commands (wirelessly) from the VC, and (wirelessly) control the SSCD system. The SC system communicates with the mobile app also.
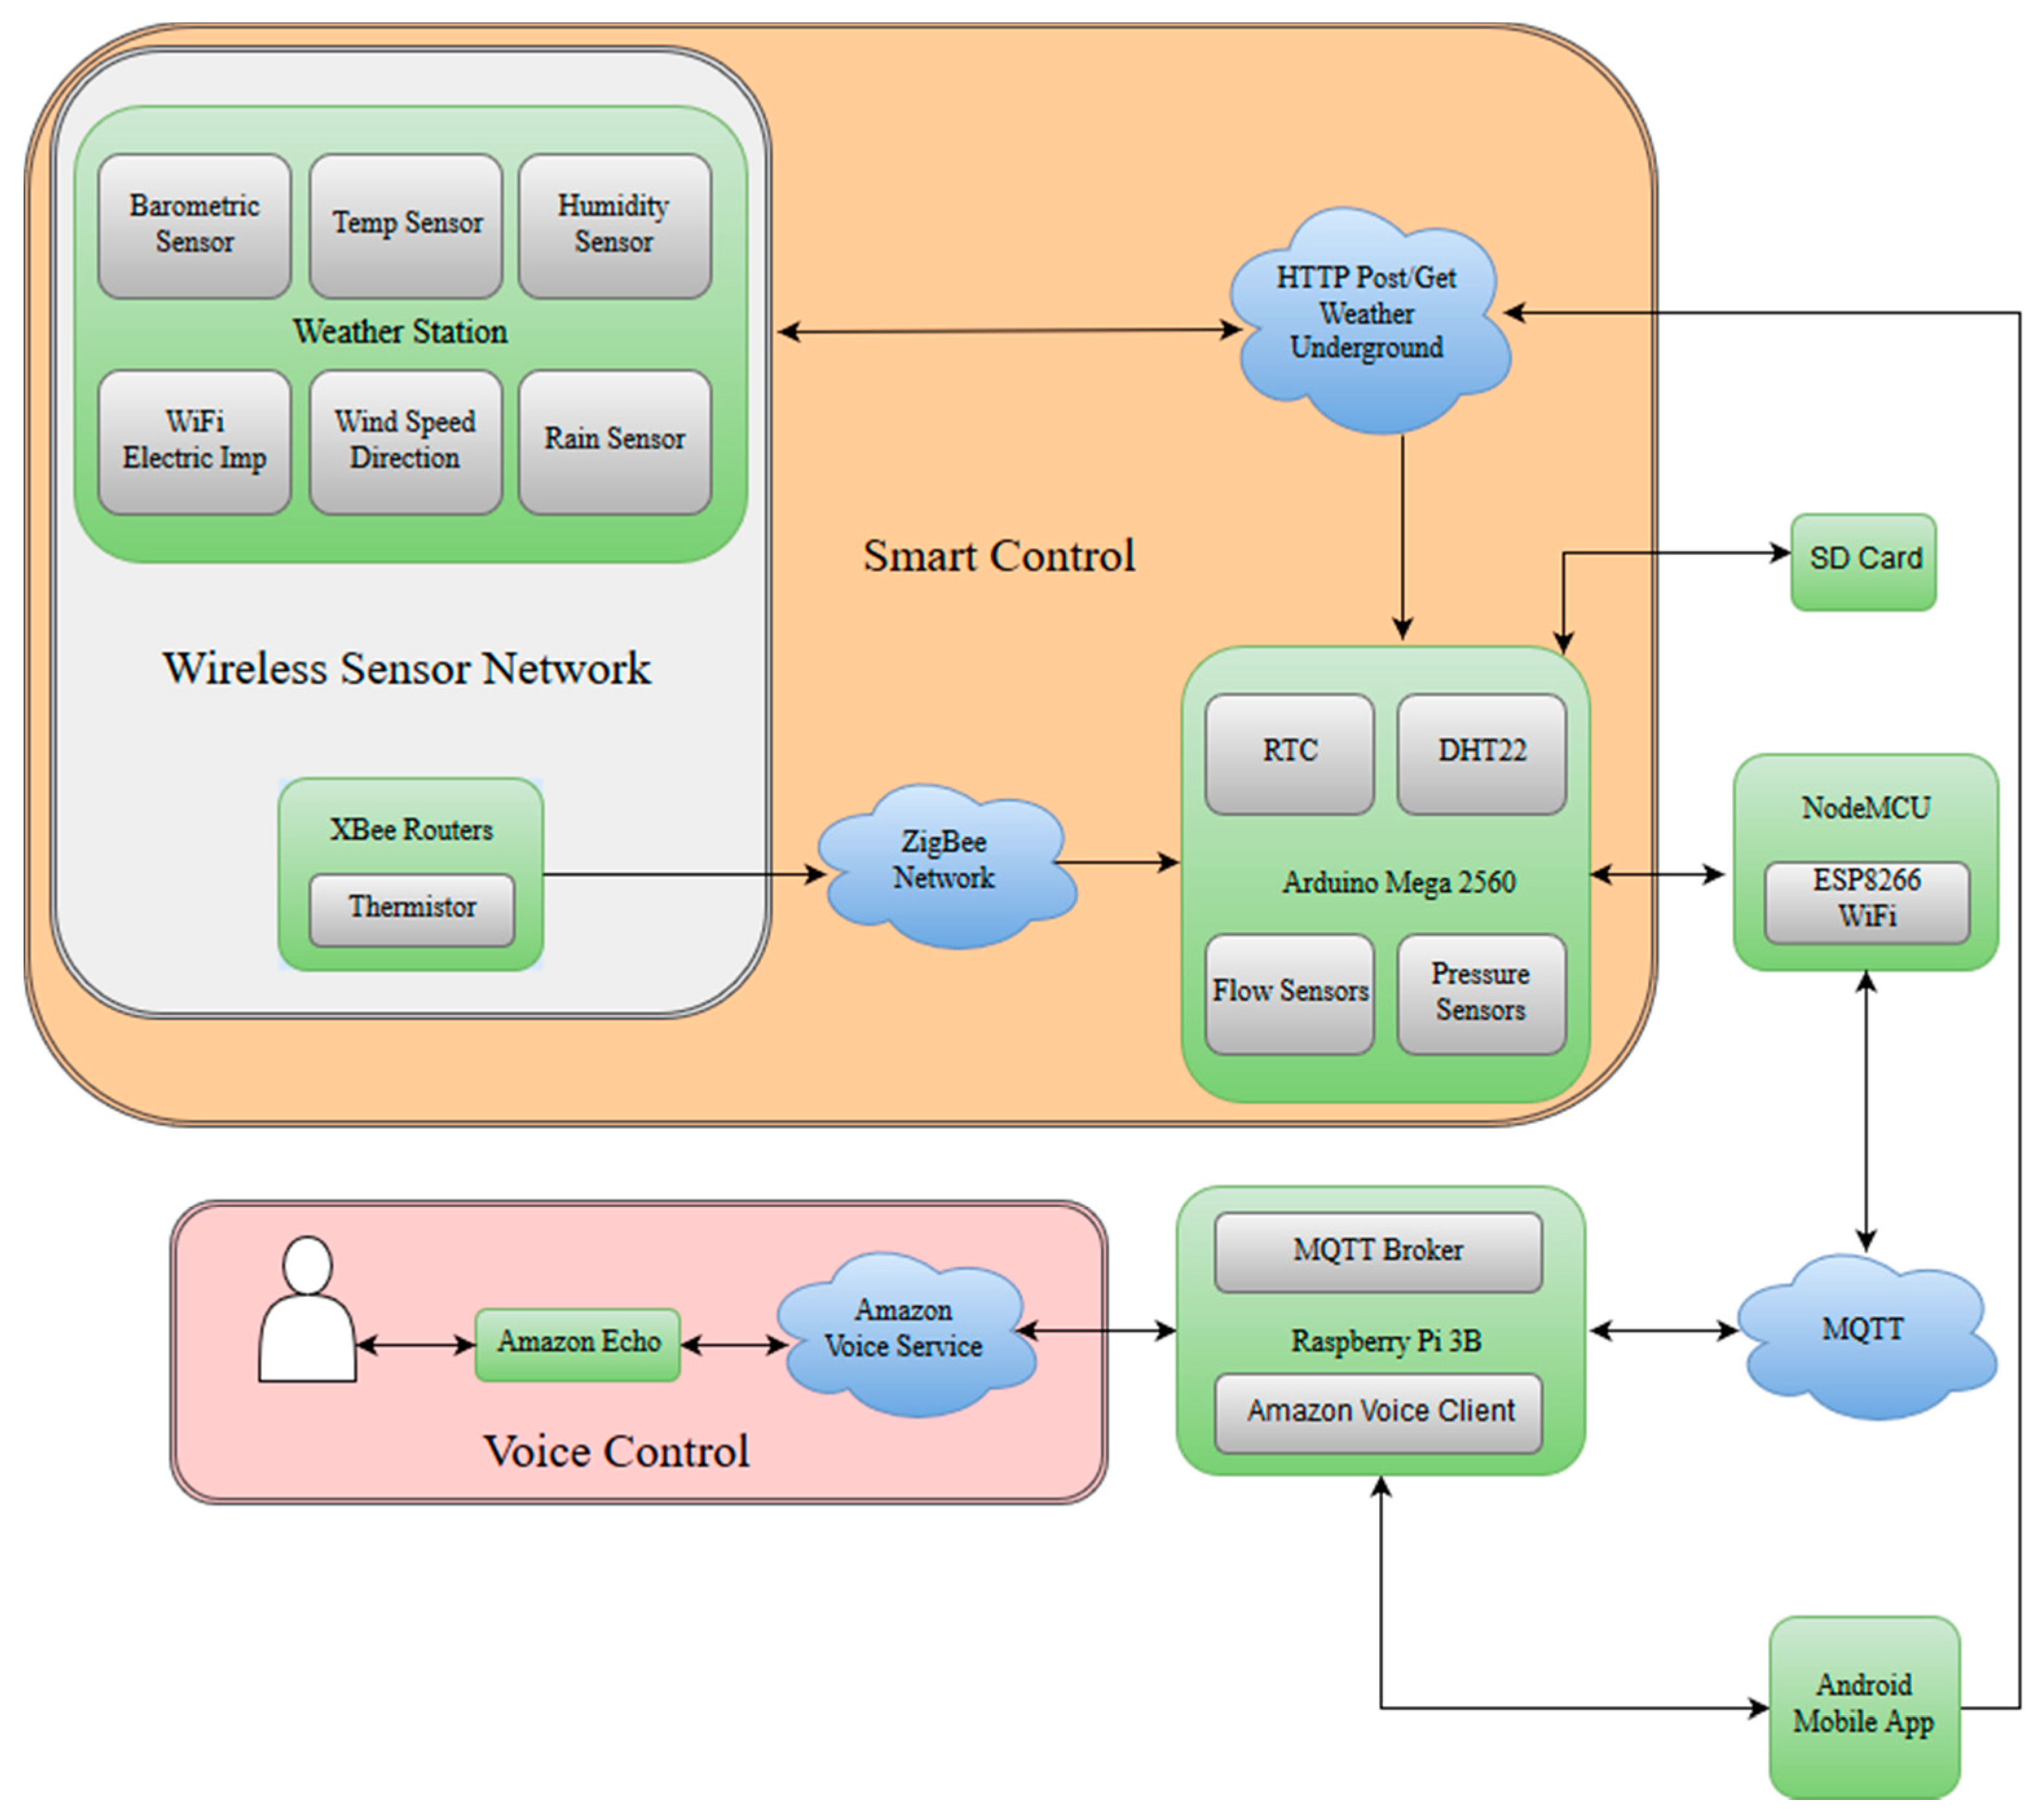
Figure 1 presents the architecture of the proposed VCW-SSCD system. The SC system (Arduino mega microcontroller) collects data from the WSN and the WS, receives voice commands from the VC system, communicates with the mobile app, and wirelessly controls the SSCD.
2.1. Solid Set Canopy Delivery (SSCD) System
2.2. Wireless Sensor Network (WSN) and a Weather Station (WS)
Wireless communication was established with a Digimesh Xbee S2C operating under a Zigbee protocol. The WSN includes:
- Wireless communication through XBee S2C (Xbee RF Modules, Internation Inc., Minnetonka, MN, USA, 2012) that can transmit 1200 m with an open line of sight; the distance will be reduced with objects obstructing the signal. The XBee is power efficient with transmitting requiring 45 mA, receiving requiring 31 mA, and sleep requiring 1 A. The XBee routers are setup in mesh networking mode extending the network further from the XBee coordinator in the master control unit. Based on [29,30], the tree canopy significantly influences the radio path losses of the WSN; the developed models in [29,30] can be used to estimate the distance between nodes in a WSN in an orchard. This is very critical to scale-up the proposed system.
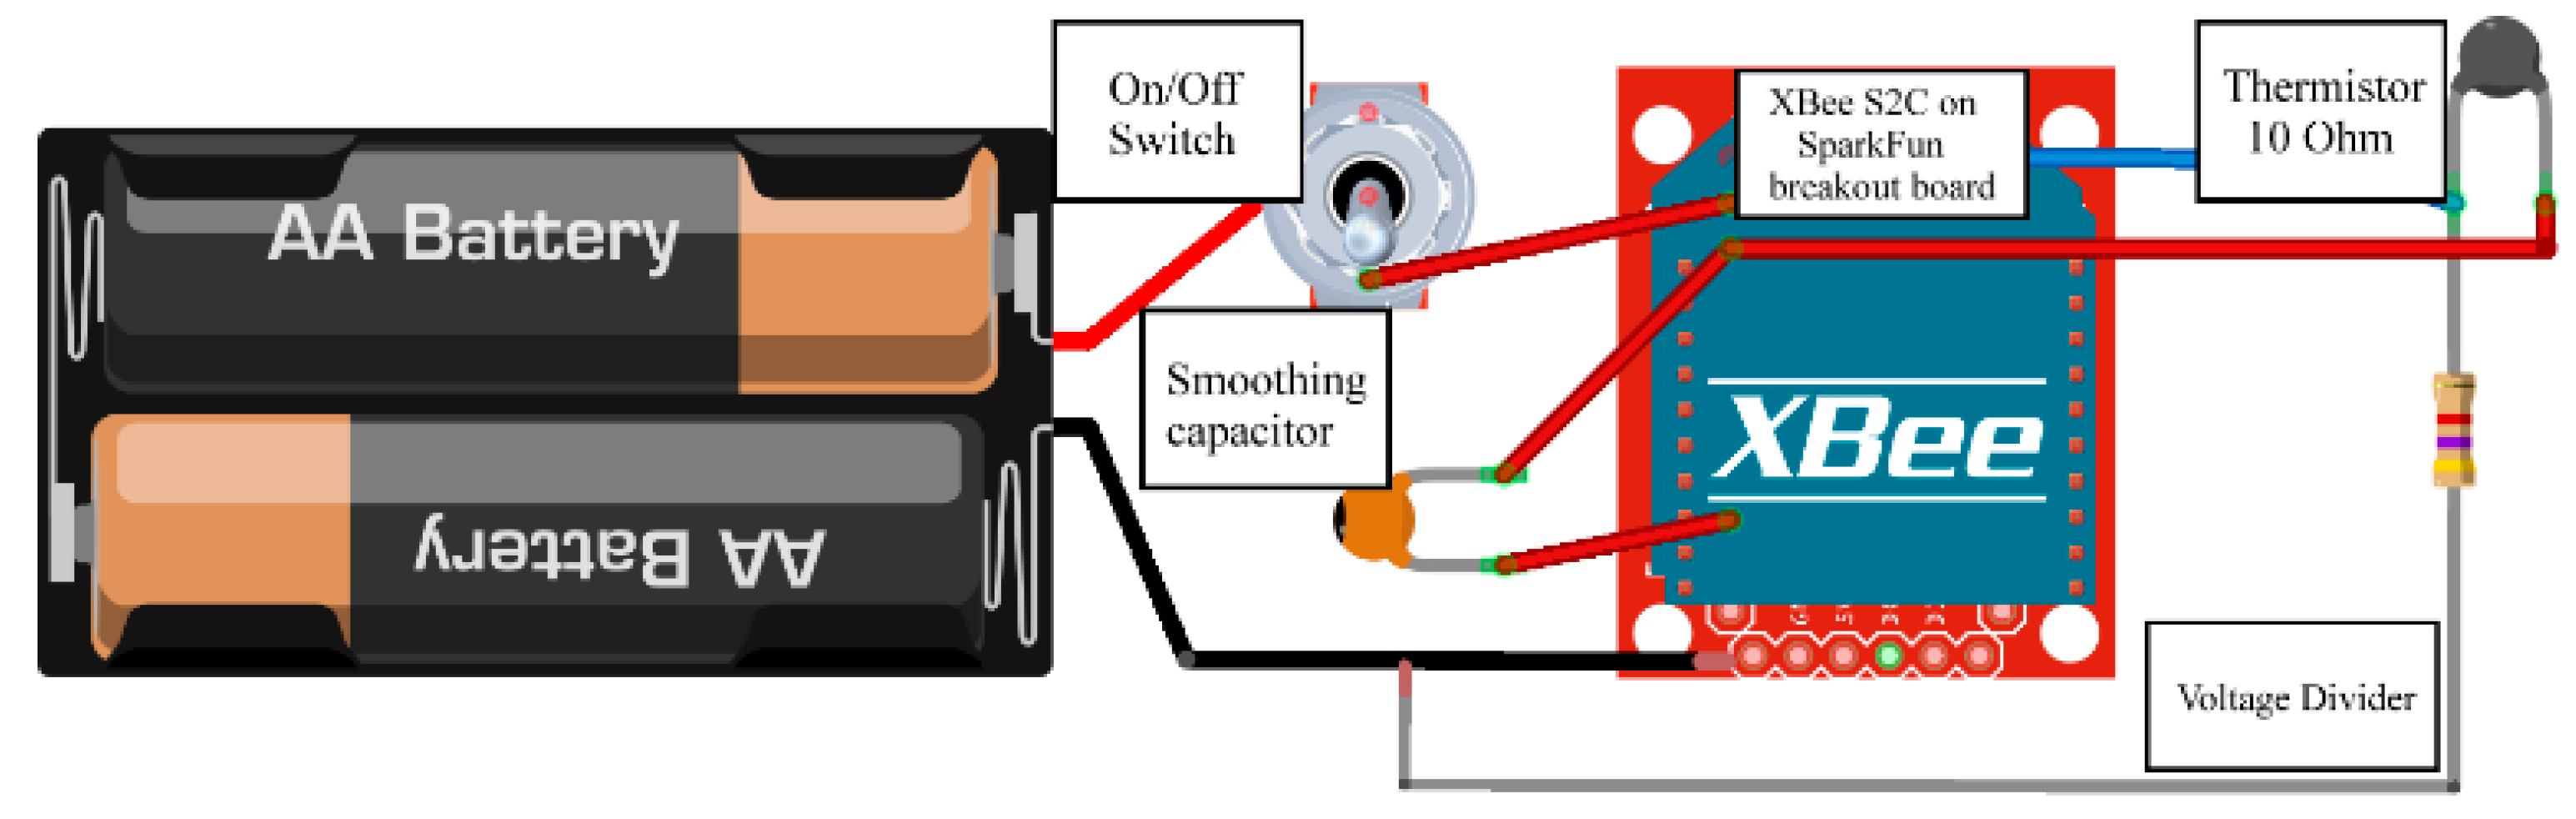
- A thermistor (temperature sensor) that utilizes the XBee’s onboard analog-to-digital converter to convert the analog voltage read into a digital signal to be sent over ZigBee IEEE 802.15.4 protocol. The thermistor being utilized is a negative temperature coefficient; it operates by decreasing the resistance as the temperature increases and vice versa. The XBee modulation cannot read resistance change of the thermistor, hence a voltage divider was necessary to change the resistance into a voltage. The max voltage read on XBee S2C’s analog ports is 1.2 V, thus a voltage divider is employed to lower the voltage at higher temperatures. The XBee S2C ADC is 10-bit providing a sampling resolution of 0–1023, which allows accurate temperature values to be transmitted. The voltage divider slightly lowers the resolution of temperature data as thermistors are nonlinear. The conversion of thermistors resistance to Kelvin (°K) is done using the simplified parameter Steinhart-Hart (Equation (1)). T is the absolute temperature in °K (it is supplied by the manufacture of the thermistor) and R0 is the resistance at the T0 set by the manufacture. Each thermistor manufacture will supply a thermistor in a tolerance range with coefficients needed for calibration. The thermistors used have a tolerance of 1%, the beta coefficient is 3950, a resistance of 10 k at 25 °C, and an operating range of −55 °C to 125 °C.
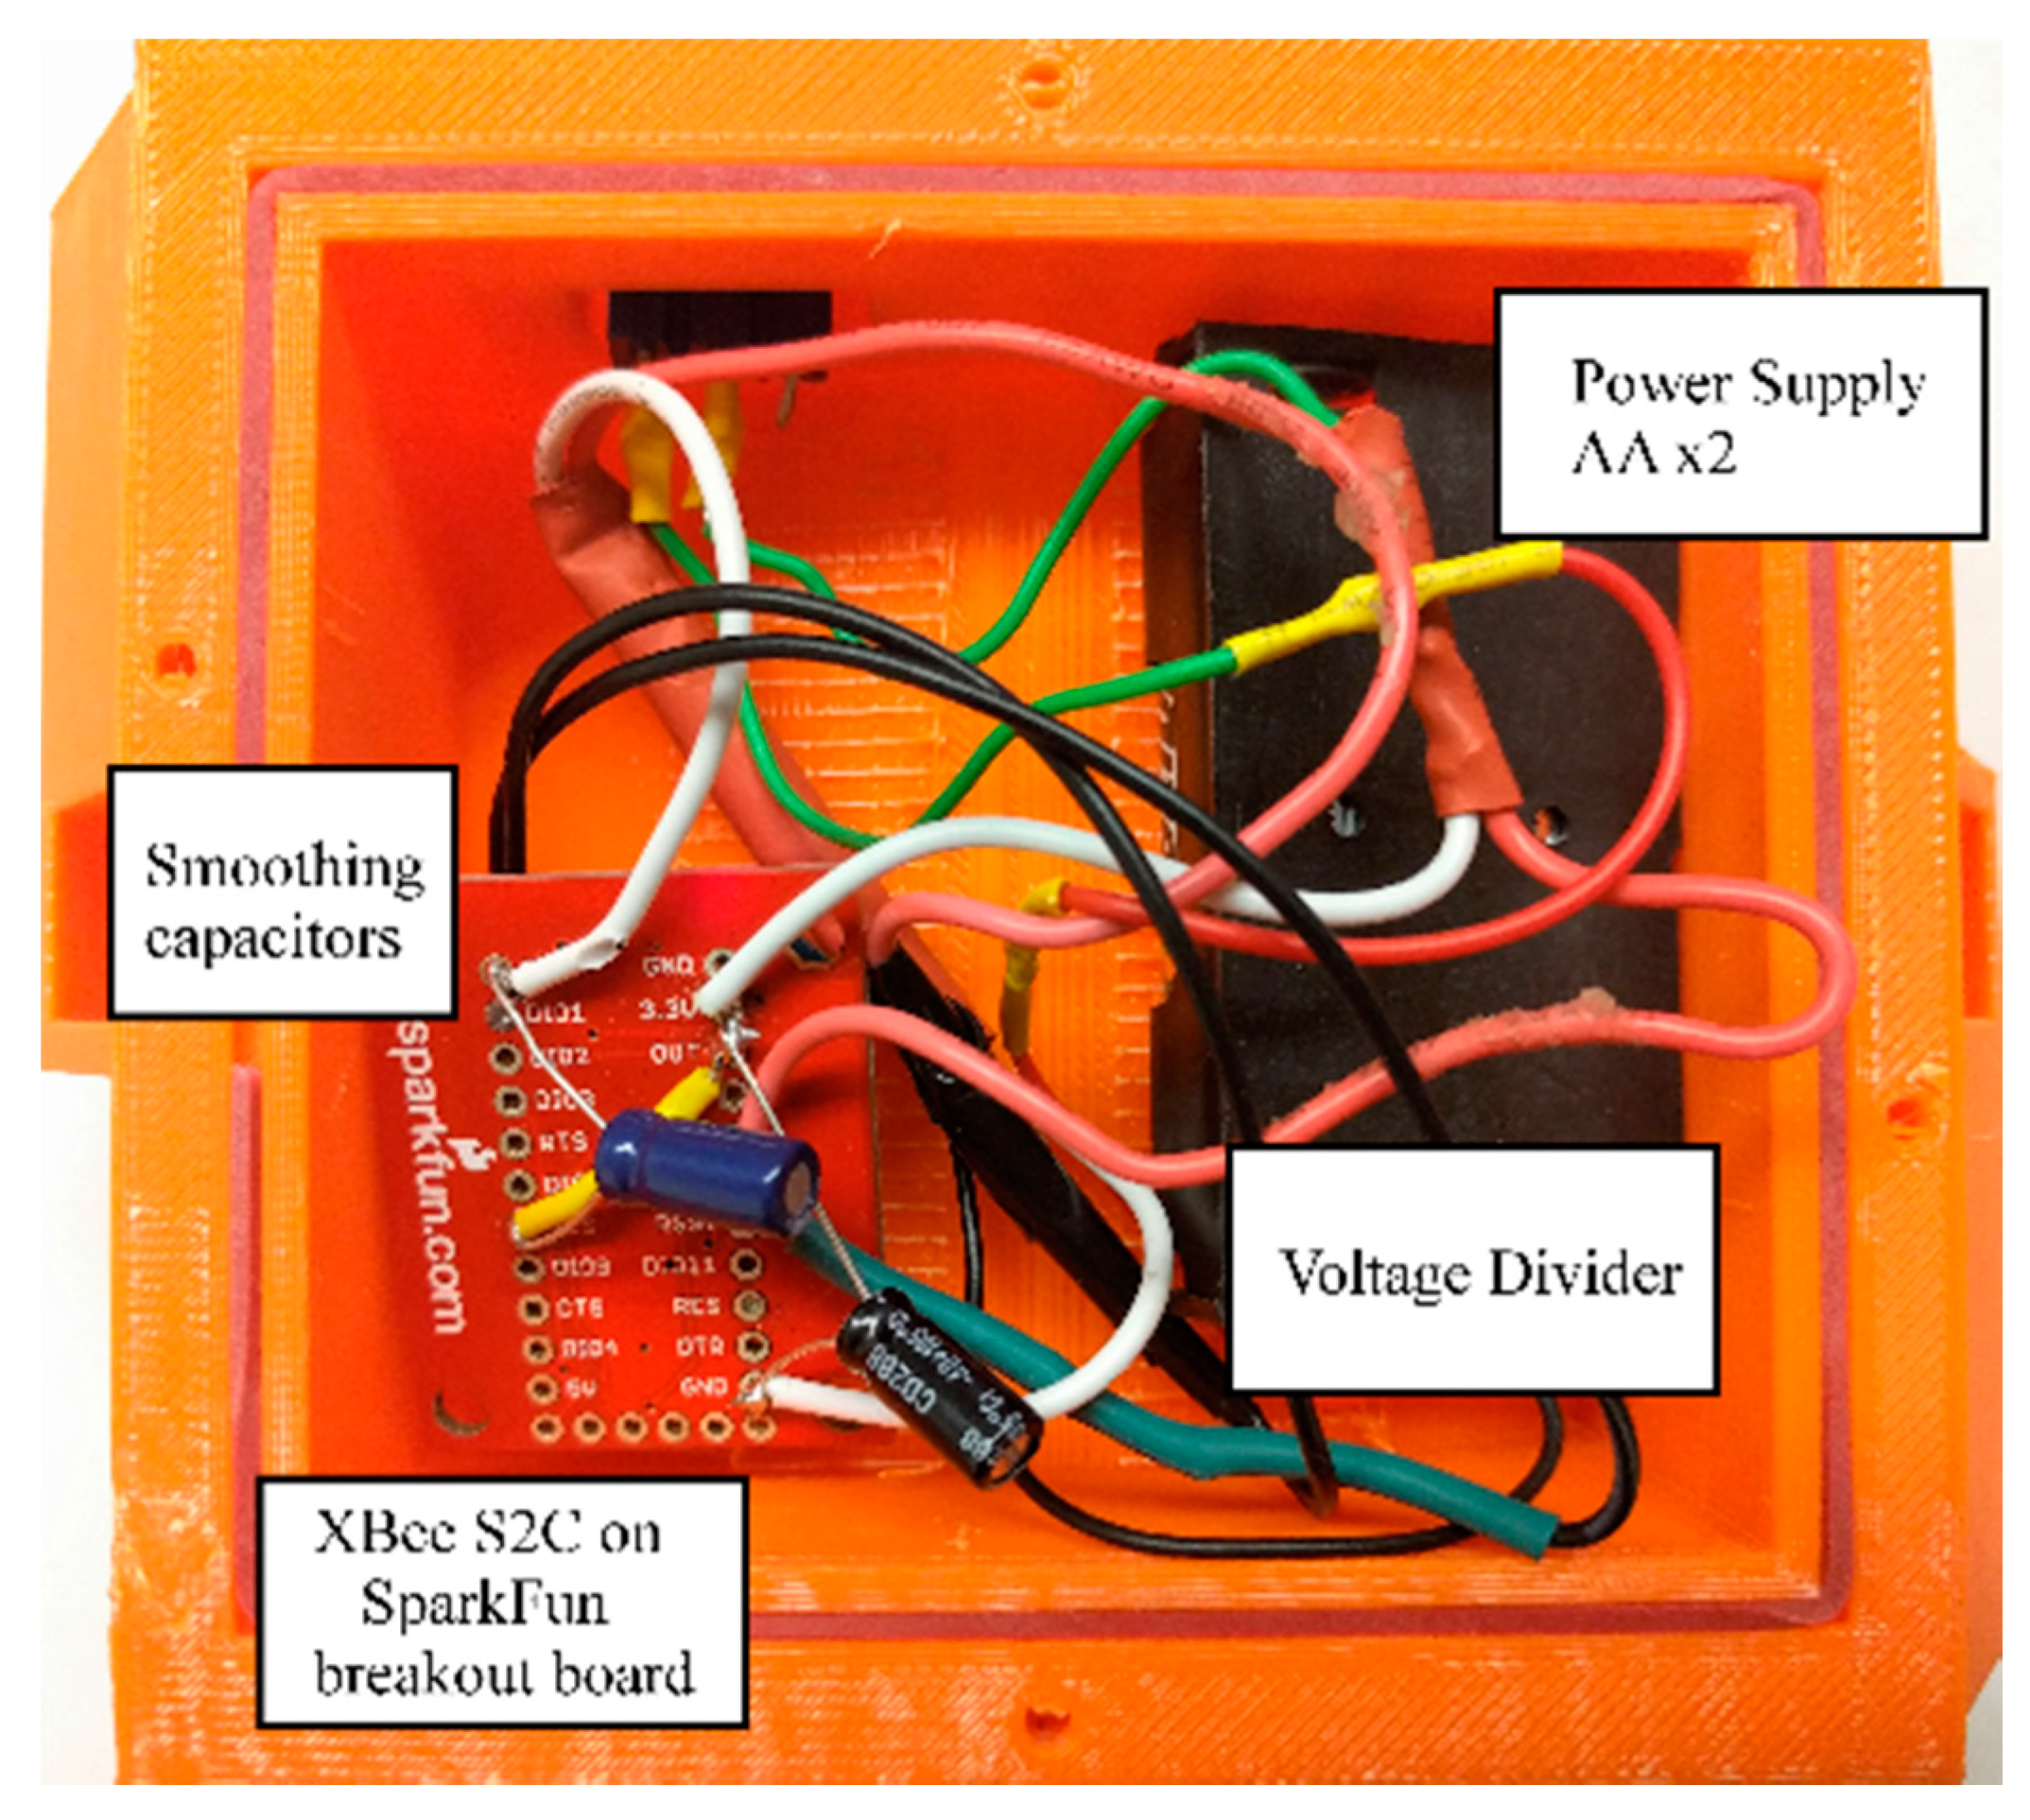
The sensors are powered by two AA batteries providing 2300 mAh at 2.4 V. The VIN signal is also connected to the VREF on the XBee sensor giving a correct voltage read as the batteries lose charge. To reduce noise, a 1 F ceramic capacitor is connected to the VREF and DIO0 port as recommended by [31]. Figure 4 presents the temperature transmitter inside a (3D-printed) plastic enclosure and Figure 5 presents the temperature transmitter diagram.
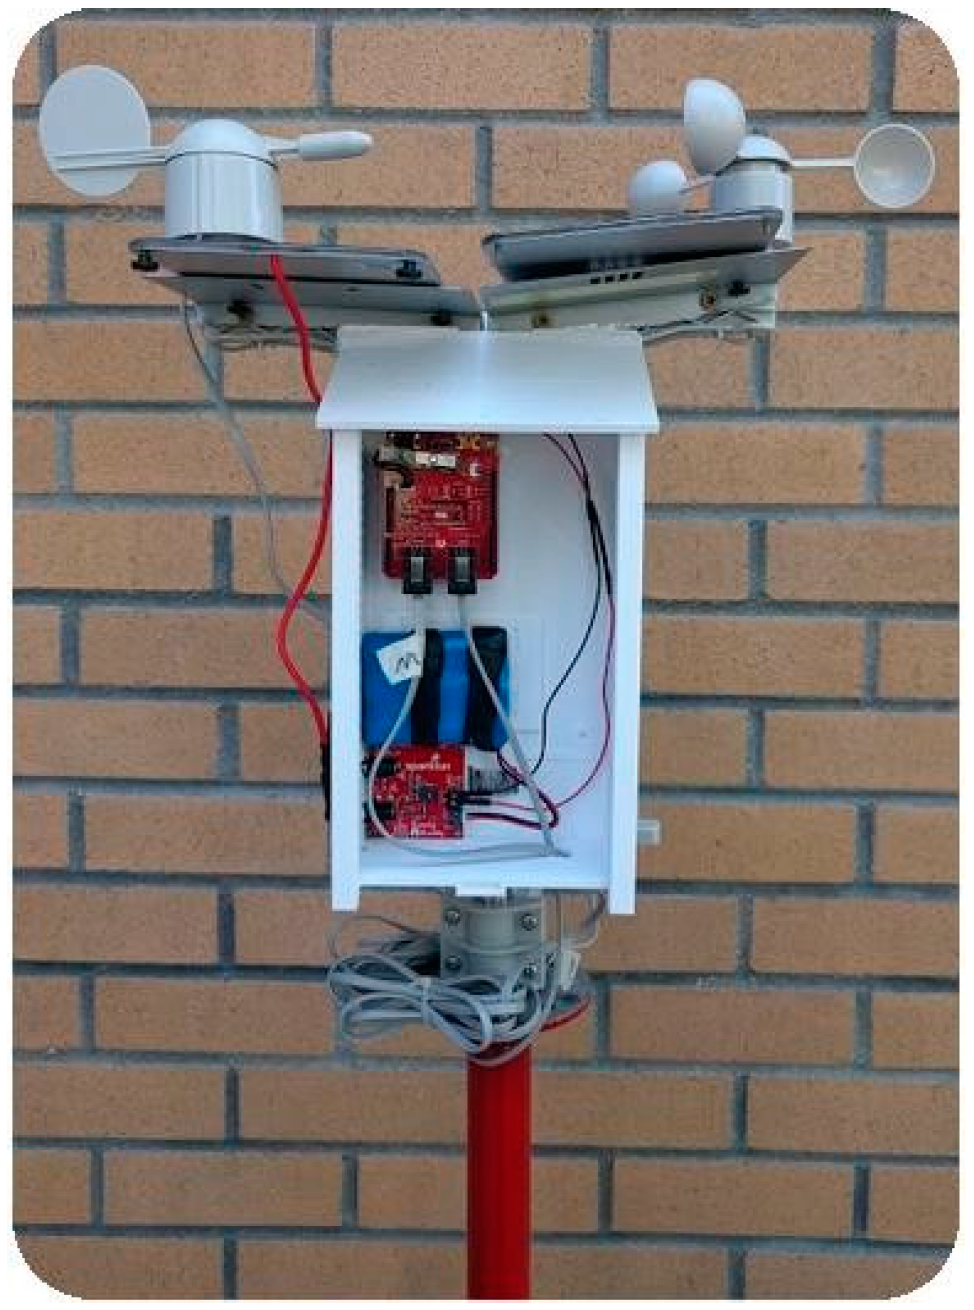
The Weather Station (WS, Figure 6) is a kit from SparkFun Electronics. It includes several sensors: (i) air temperature and humidity; (ii) light level-solar radiation; (iii) rain fall; (iv) instantaneous wind speed and direction. The collected data are exported as a CSV file onto the server (Raspberry Pi microcontroller) and uploaded to a Weather Underground web-software. The data from the weather station are able to be retrieved by the Android App.
2.3. Voice-Controlled (VC) System
An Amazon Echo device is utilized for the development of the VC system. The Amazon Echo (Amazon Alexa) communicates with a remote web server (indoor), developed using a Raspberry Pi 3B microcomputer. The Raspberry Pi 3B runs a modified version of Debian, a Linux distribution called Raspbian, which is customized for the Pi’s hardware. The Raspberry Pi is a remote server away from the orchard/field that hosts a Mosquitto (MQTT) broker. The MQTT is a lightweight messaging protocol optimized for Internet of Things (IoT) networking. The NodeMCU sends and receives MQTT messages over Wi-Fi that are relayed to the SC system, which then executes the commands. Internet of Things (IoT) involves inter-networking of everyday physical objects together to gather information and receive data, allowing remote control and monitoring activities. IoT allows interconnected devices to modify operating settings based on outside factors. This modification of preprogrammed system parameters makes the devices “smart”. The proposed system is an example of IoT in agriculture [32,33]. With the VC system, the user can easily access data from the WSN and control the SC system, remotely from his office/house (indoor application).
The server (Raspberry Pi) connects to the Amazon Voice Service to allow Amazon Echo’s devices to voice control the SC (Figure 1). The data from the WSN and WS are transmitted wirelessly (through the SC) to the server (Raspberry Pi) and stored in a comma separated values (CSV), which can be pushed to the Android mobile application (present data in real-time graphs and tables).
2.4. Mobile Application (Android App)
The Android application was developed using the Google’s Firebase API and the PubNub web-software. Using Google’s Firebase API, we integrate several features into the mobile application, such as user authentication, database, and cloud functions. Google’s Firebase API utilizes a cloud-hosted database. The data is stored as JSON format and synchronized in real-time to every connected client. Any time data changes, any connected device receives that update within milliseconds. We use MQ Telemetry Transport (MQTT), a lightweight network protocol, to transfer data between devices (e.g., WSN and server).
The Android application was developed to retrieve the collected data from our server (Raspberry Pi 3; data from the WS and WSN), visualize them and display all the information in graphical format (using the androidplot software), and provide real-time data to the users. It can also control the SSCD system remotely (turn on/off the water valves). The Android application includes a user friendly graphical interface (Figure 7); JSON parsing (in Android Studio) was used to retrieve data from the Weather Underground web-software and our server. The mobile application is module-based, allowing users to access real-time data, control water valves, and perform analysis. The user is able to view reports from certain periods of time; hourly, daily, weekly, monthly, and yearly.
2.5. Smart Control (SC) System
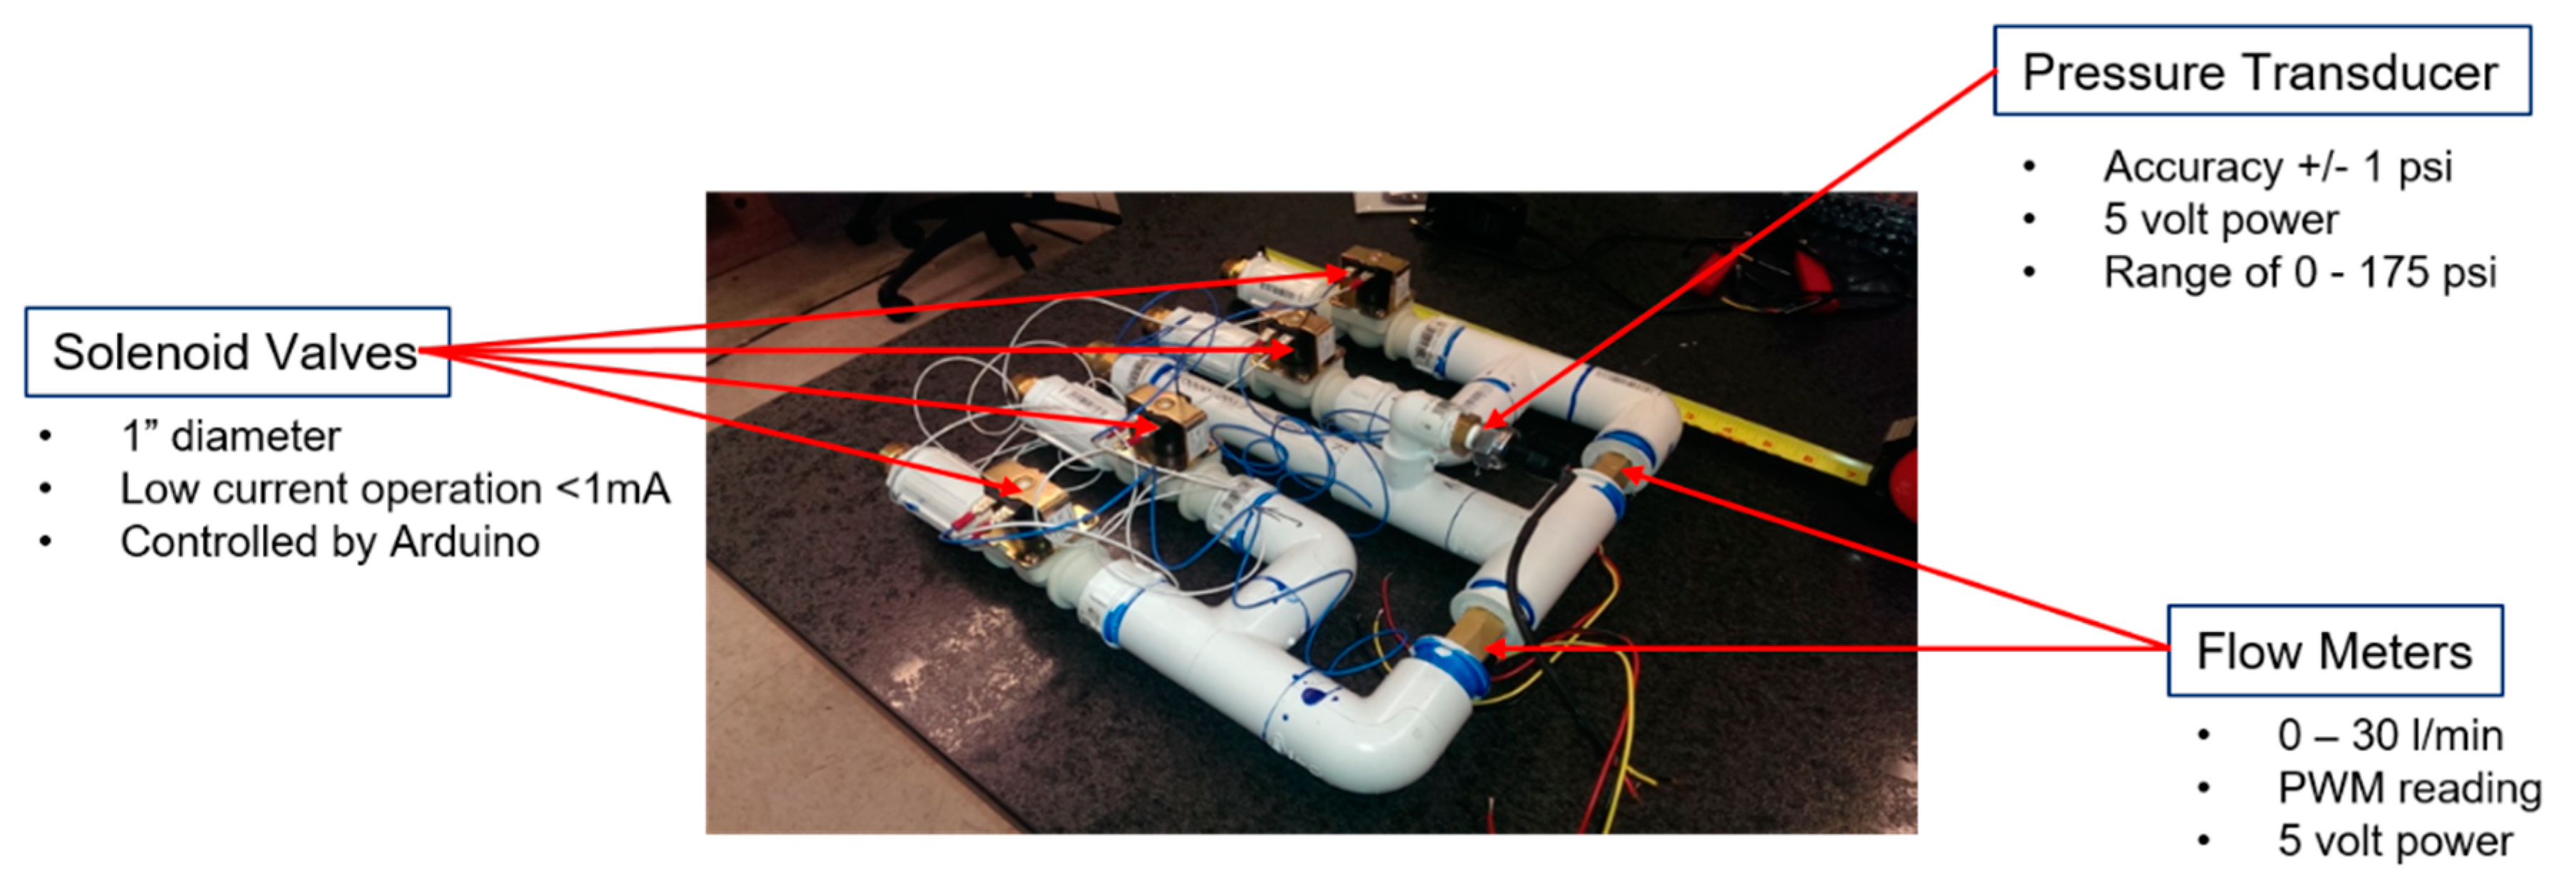
The Smart Control unit contains: (i) an Arduino Mega 2560 microcontroller; (ii) a NodeMCU ESP8266 Wi-Fi; (iii) a DHT22 temperature/humidity sensor; (iv) a XBee coordinator; (v) a real-time clock; (vi) an SD memory card; (vii) two pressure sensors; (viii) four flow meters; and (ix) an eight-channel relay block in a weather proof box (Figure 8, Figure 9 and Figure 10).
The Arduino Mega provides adequate capability to perform the necessary control and data measurements that were required. It is based on C/C++ programming language. The 5 V supply, which the Arduino provides, was not high enough to operate the 12 V solenoid valves to allow flow to each zone. Hence, the controller was equipped with a 5 to 12 V step-up relay. The relay system is shown in Figure 9. The SC system controls eight different zones (Figure 11). Each zone contains four trees and houses a specific nozzle type with different spray patterns, flowrates, etc. The eight-channel relay block module is independently connected to each respective zone solenoid valve. The principal of control is on/off.
3. Experimental Design
3.1. Farm Test Site
The evaluation of the proposed system was performed on a two-acre pistachio orchard located in the west region of Bakersfield, California. Water was supplied to the orchard from the city at a pressure of 345 kPa. Figure 11 shows the layout of the farm test site. Each zone consists of four pistachio trees and each tree has a nozzle over it. Each zone is controlled by a solenoid valve. The nozzles are suspended 7.62 m in the air to allow for trimming and harvesting equipment to operate around each tree. The average tree height is approximately 4.5 m. Currently, each zone contains four identical nozzles and each of the eight zones have different types of nozzle types. With a total of 32 pistachio trees under evaluation, the orchard stretches approximately 115 m. Temperature monitoring was managed in each zone by eight wireless transmitters (WSN) that communicate to the SC system.
3.2. Experimental Setup
The main scope of this project was to develop and evaluate a novel VCW-SSCD system; the evaluation of the SSCD system (e.g., performance of different types of nozzles, system configuration etc.) to deliver mist-cooling to increase winter chill for dormancy and bud break is beyond the scope of this paper.
In Experiment 1 (18 July 2017 and 19 July 2017), we evaluated the performance of the overall VCW-SSCD system (e.g., wireless communication, voice-controlled system).
Experiment 2 was conducted to initially evaluate if the evaporative effect of the misting could effectively drop the (winter) temperature around the buds or trees, relative to the ambient temperature measured in the orchard.
Trials were performed using half-hour flow intervals. The trials were conducted on 25 February 2017, and were setup in Zone 1. A “flow event” (valve on) was scheduled to occur once per hour (flow for half hour, and then off for half hour). This allowed thermal equilibrium to stabilize between zone temperature and ambient temperature before each succeeding flow event would occur. Six temperature sensors were placed strategically throughout the zone. The temperature decrease was measured during each event.
Analysis was performed on each flow event to show how the ambient temperature affects the magnitude of the temperature decrease. The trials were placed into automated control and were left to run for 24 h per day. The algorithm was set to trigger an event if the ambient temperature was above a certain threshold. Once active, the timer would allow the zone to flow for half an hour, and shut off for half an hour. The system would repeat itself indefinitely only if the initial condition of ambient temperature was satisfied. Based on this time of year, temperatures through the night would drop below 10 °C. With a set point value of 10 °C, the data system would go to rest during the night.
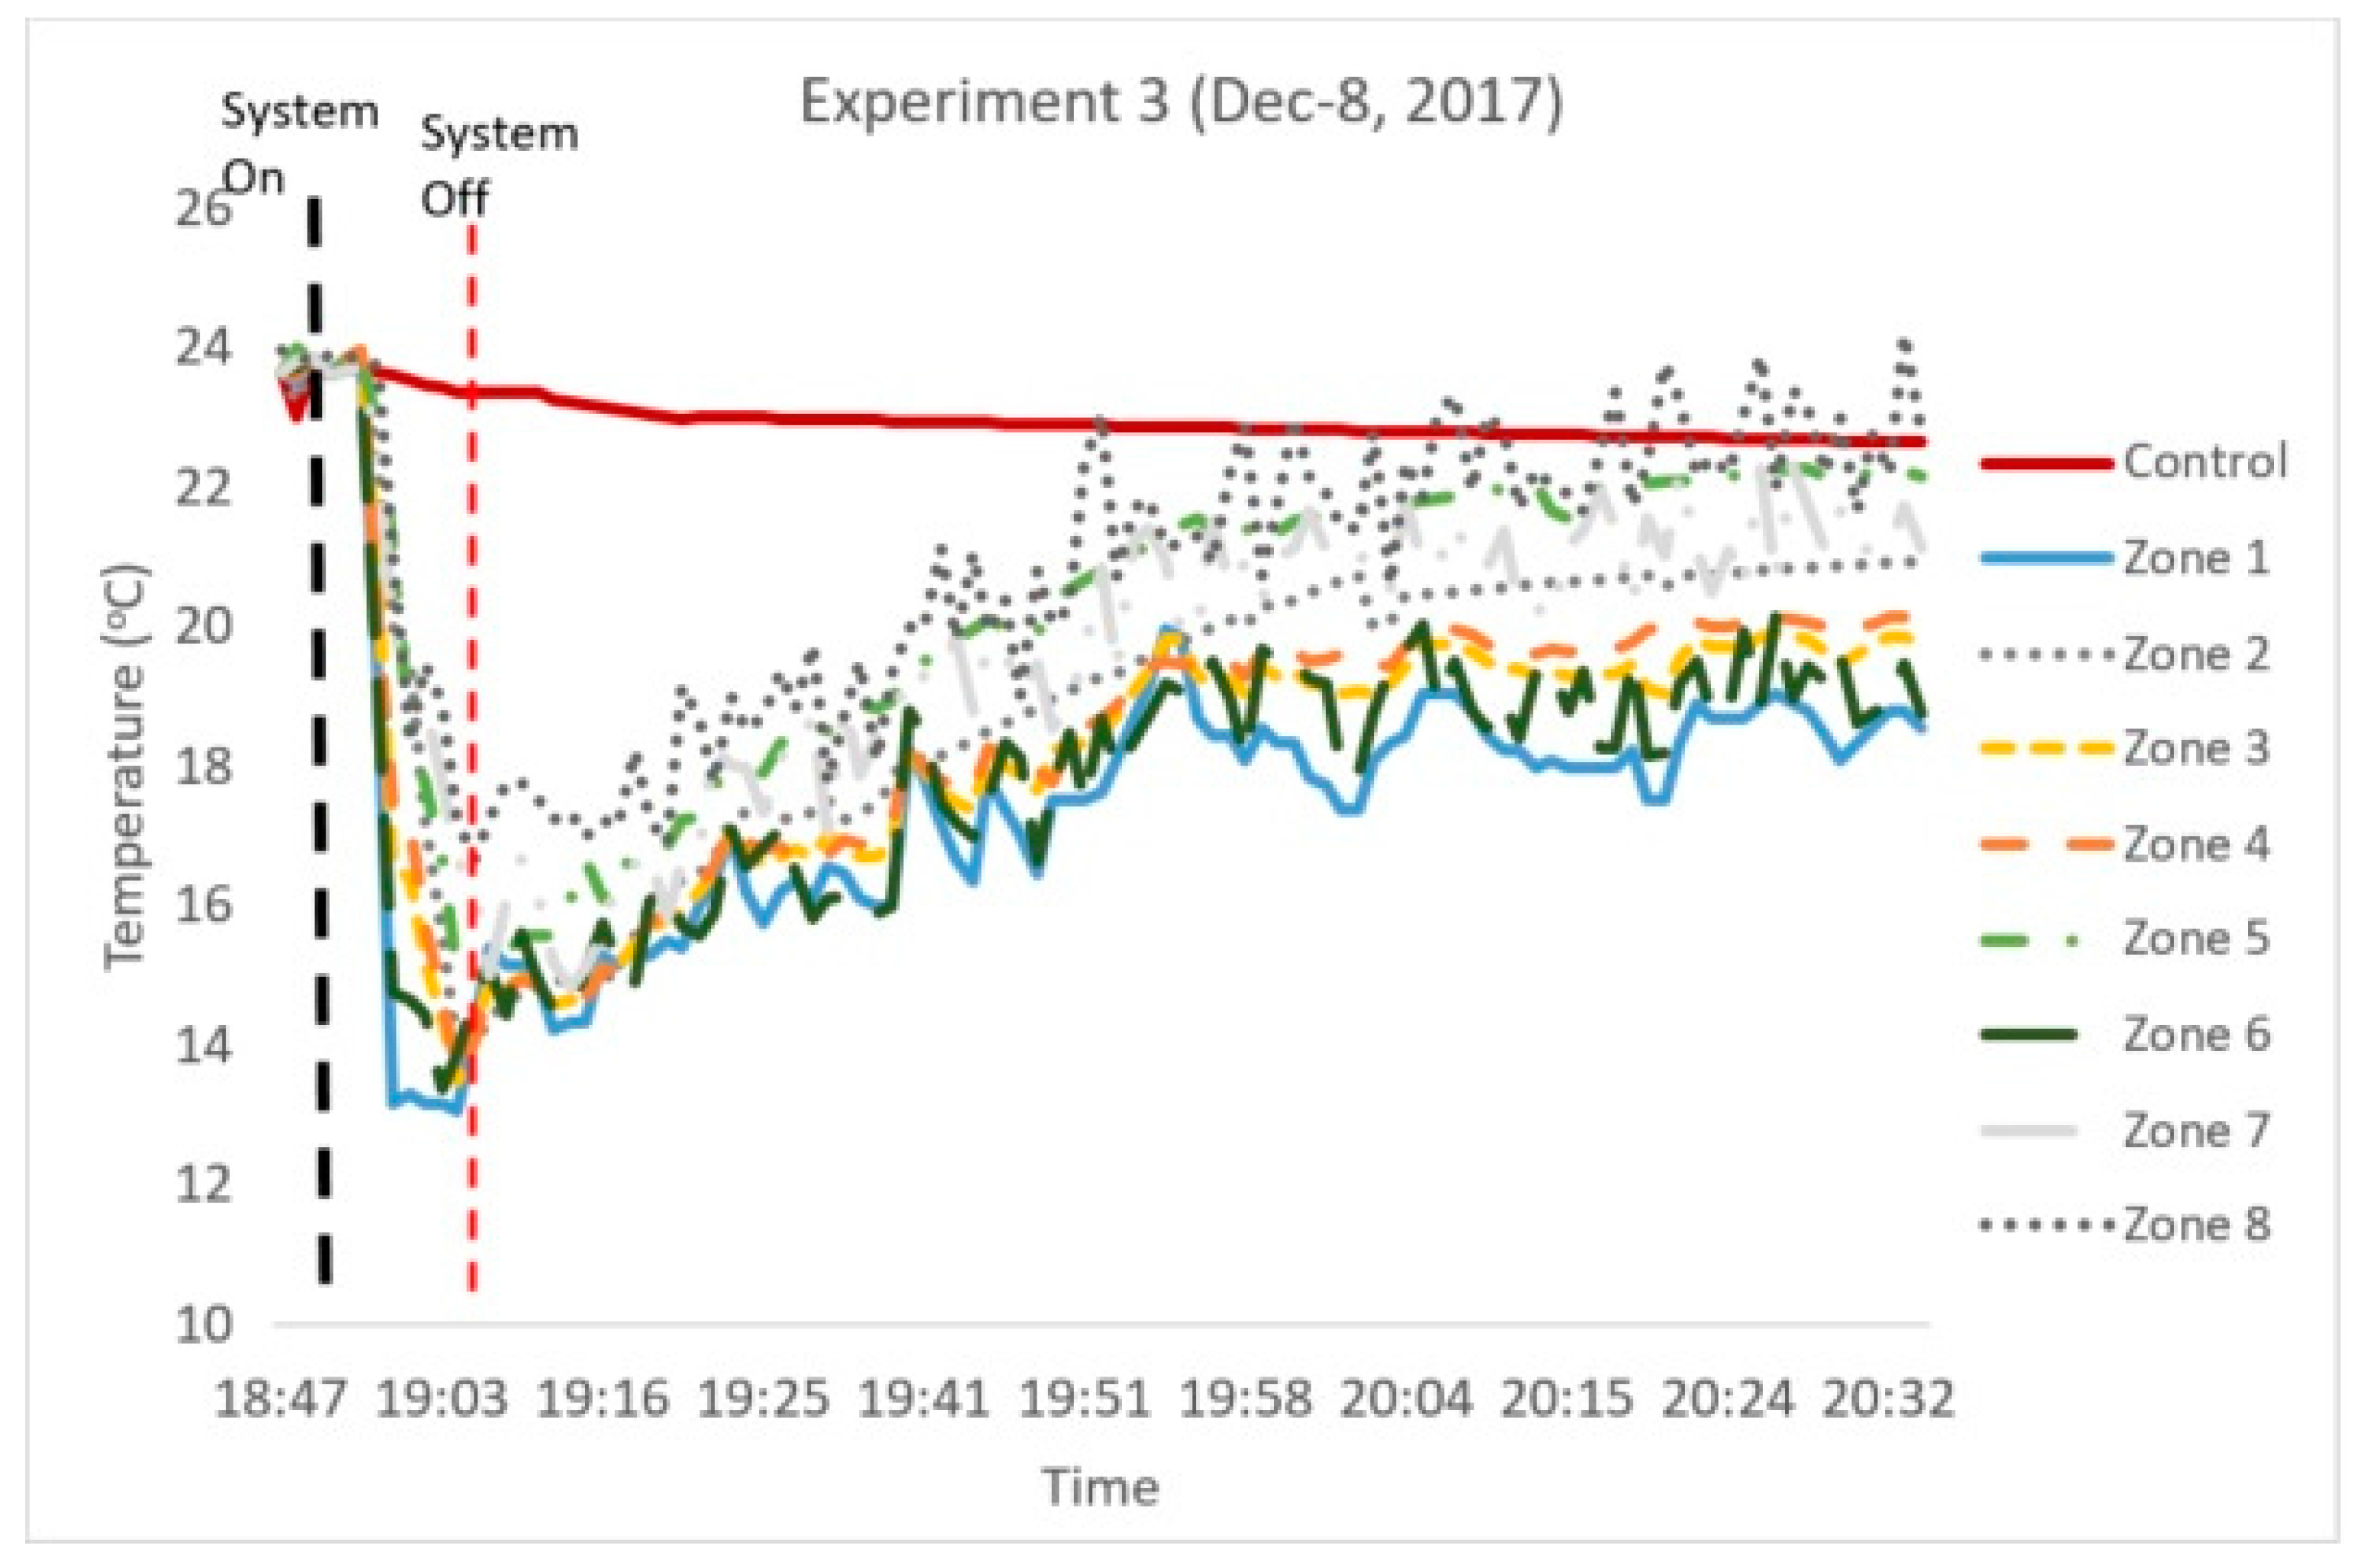
Experiment 3 was conducted to evaluate the performance of each zone in a hot winter day (8 December 2017). The system was turned on for 15 min, when the ambient temperature was about 24 °C, and the temperature was recorded in each zone during and after the “event”.
4. Results and Discussion
4.1. Experiment 1
In this experiment, the overall performance of the VCW-SSCD system was evaluated. First, we evaluated the VC system; we remotely operated the SC system and each zone (valve), using Amazon Echo. For example, we asked Amazon Alexa to control (open/close) each zone of the SSCD system. The system worked well without reported errors. The VC system relies on the performance of the WiFi network; a slow WiFi network could significantly affect the performance of the overall system (e.g., create connectivity and timing issues). Additionally, using the Android app, we remotely operated the SC system and each zone (open/close valves of the SSCD) without any issues. Figure 12 presents the collected data during these trials. During the trial on 18 July 2017 (Figure 12a), the maximum temperature drop was 5.3 °C, and on 18 July 2017 (Figure 12b), the maximum temperature drop was 4.7 °C. From Figure 12, it is clear that the temperature drop begins immediately after misting starts and the lowest temperatures are achieved in 15–20 min. Once misting has stopped, the temperature increase to baseline happens within 15–20 min.
4.2. Experiment 2
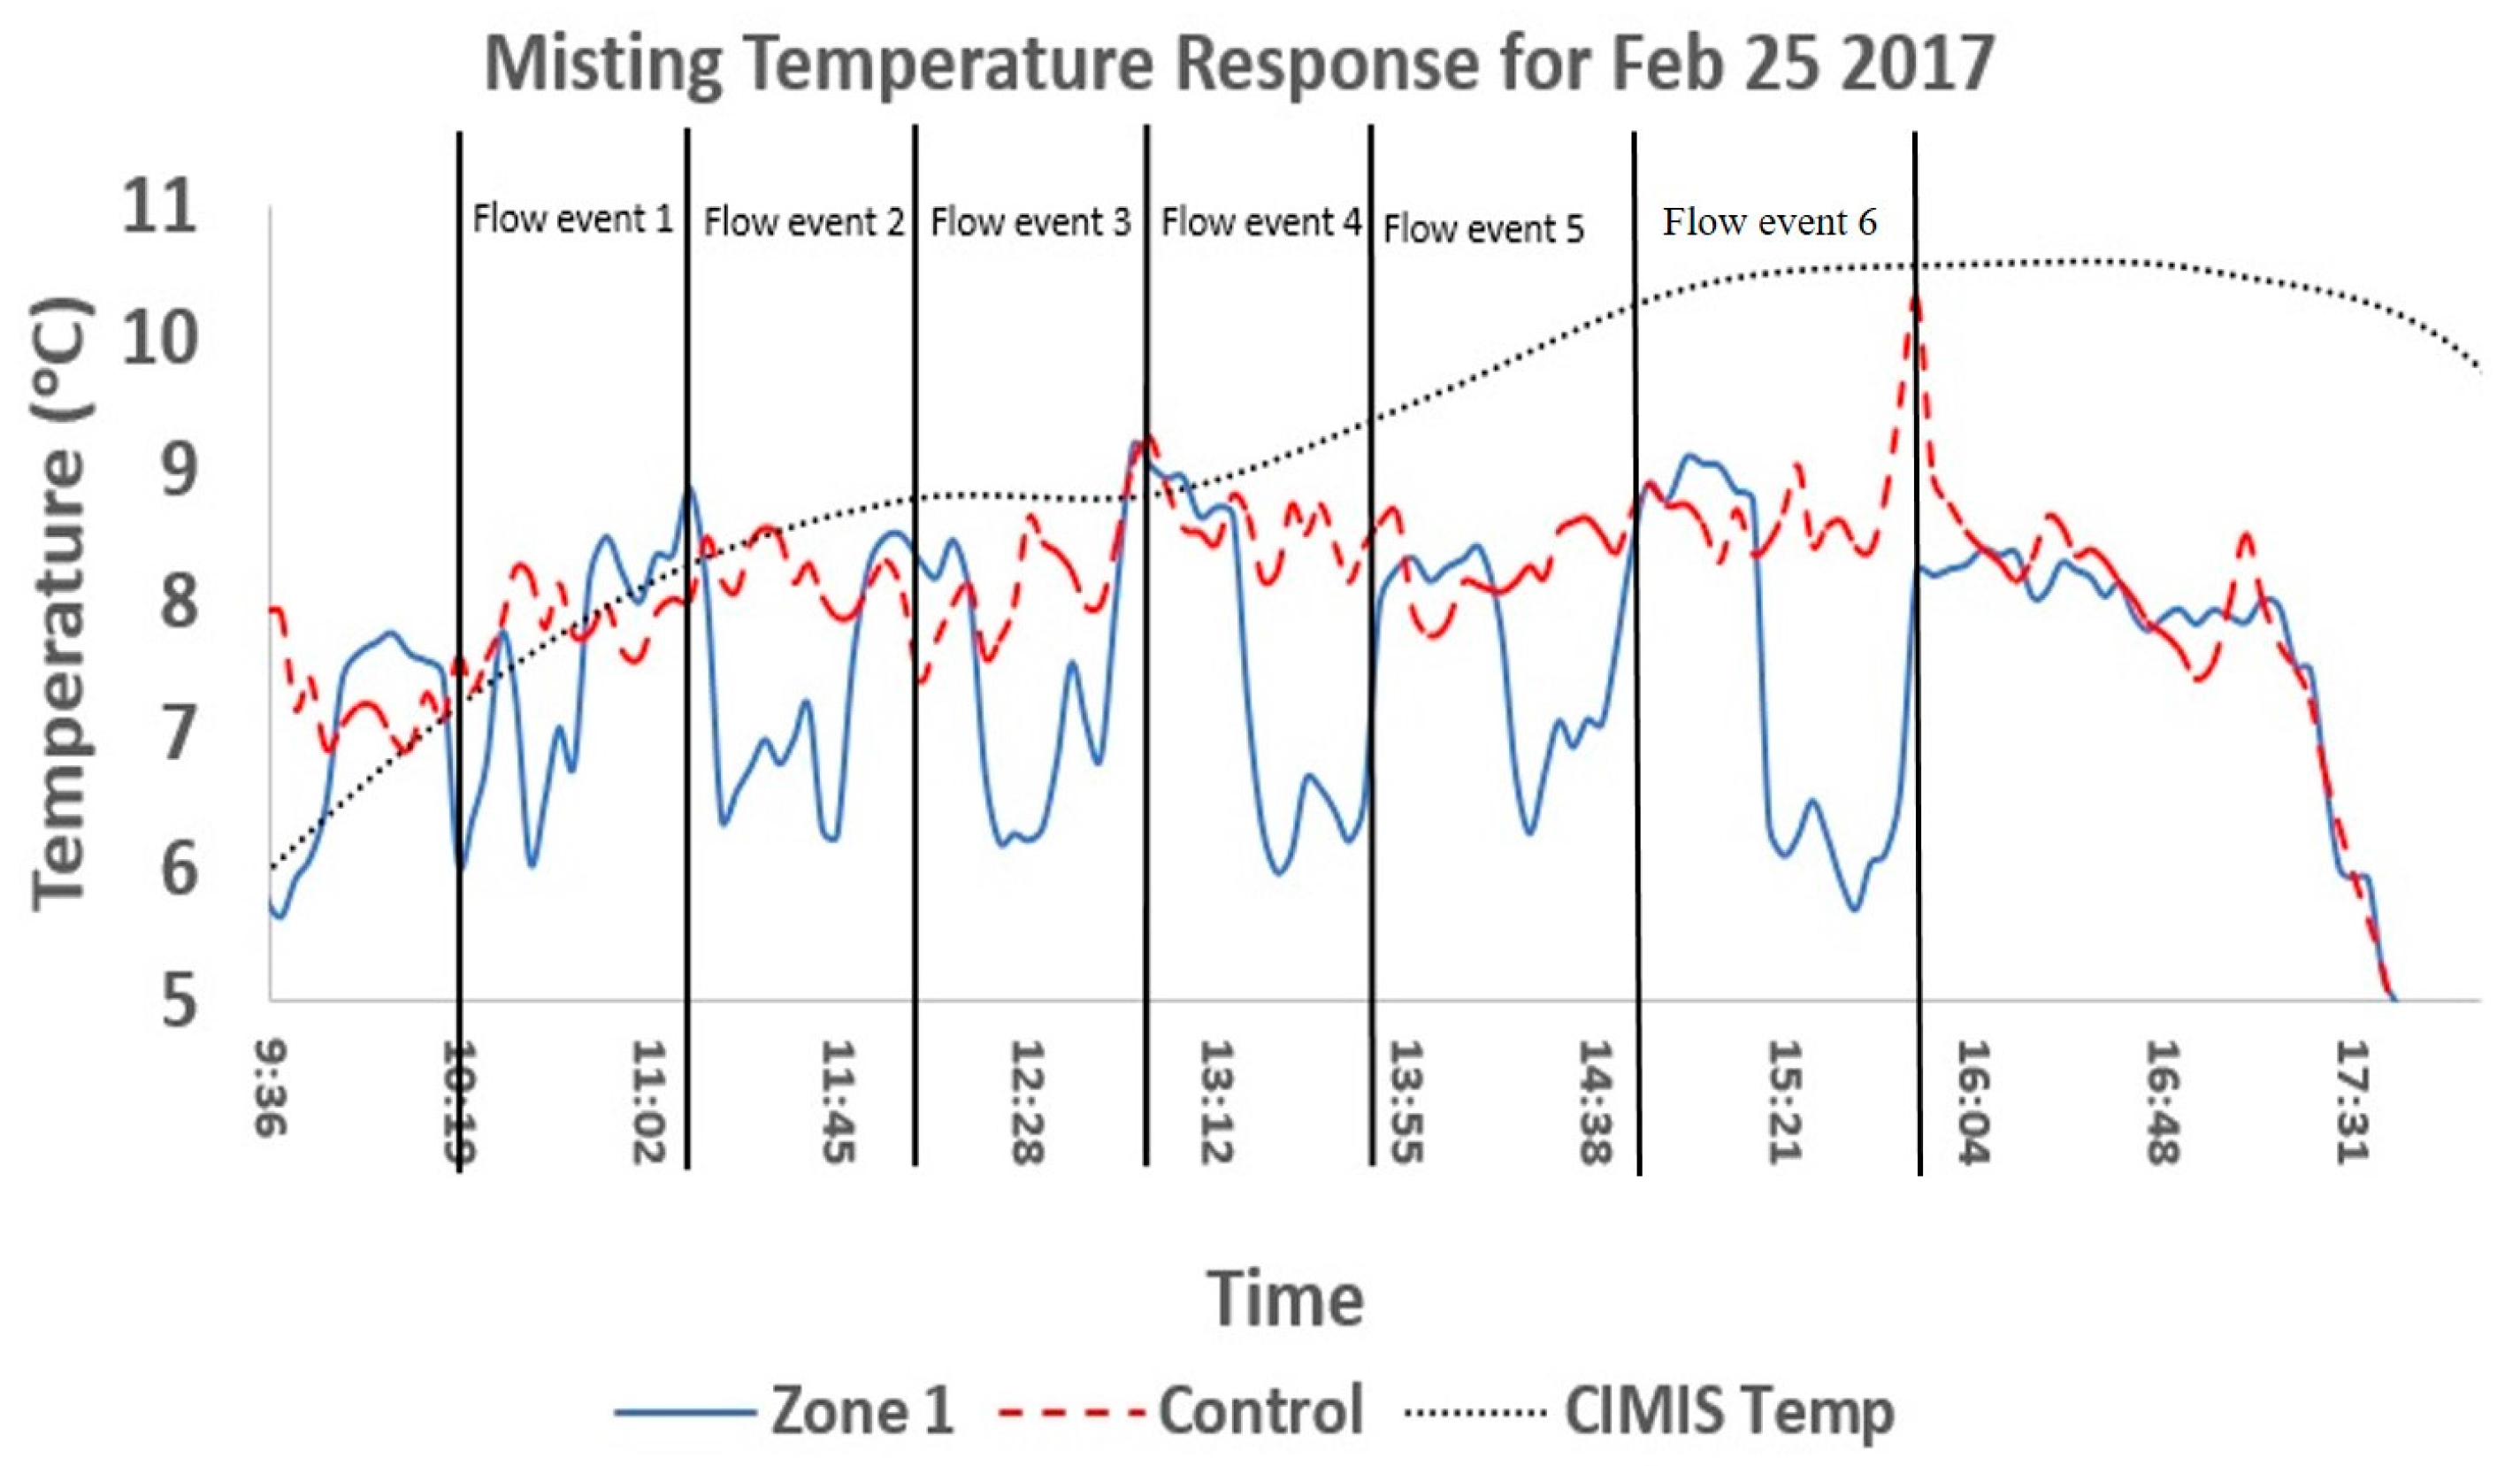
The experiment began at 9:30 a.m. The average ambient temperature was 10 °C for the day. During the peak temperature, each flow event showed an average temperature decrease of about 2.8 or 3.3 °C. The black curve displayed in Figure 13 and Figure 14 shows the CIMIS (California Irrigation Management Information System) ambient temperature value (from a local CIMIS weather station), while the blue curve displays the localized ambient temperature. The red curve shows the zone temperature and the temperature decreasing shortly after the beginning of each flow event.
The CIMIS weather station is located in Shafter, California, approximately 20 km from the location of the pistachio orchard. The proven data system was used as a cross reference to support the localized measured temperatures. Based on the geographical difference, there was a slight discrepancy between CIMIS values and the localized temperature read, but the variance was consistent and normally within 2.8 °C.
Figure 14 presents the results from the “flow event 4”; mainly to indicate when the temperature begins to decrease. The effect is essentially immediate. The flow event occurred for 30 min, but the temperature in the zone began to rise slightly after about 10 min. The first black vertical line indicates when the valve opened and the second black vertical line indicates when the valve closed. The maximum temperature decrease in this flow event was about 3.3 °C.
The flow for Zone 1 was 2.1 L/min, and the average pressure readings were approximately 345 kPa, contributing to a lower flow value than anticipated. The average total water consumed per flow event was 60 L.
4.3. Experiment 3
The experiment was conducted on a hot winter day (8 December, 2017; 6:40 p.m.). Figure 15 presents the temperature drop from each zone. The maximum temperature decrease was recorded in zone 1, with a value of about 11 °C. The flow event occurred for 15 min; the temperature in the zone begins to rise slightly after about 10 min. In zones 1, 3, 4, and 6, the temperature remains about 5 °C lower that the “control” temperature even after 30 min.
5. Conclusions
The goal of this paper was to introduce a novel Voice-Controlled and Wireless Solid Set Canopy Delivery (VCW-SSCD) system to deliver mist-cooling; not to evaluate the effectiveness of the misting system configurations; different types of nozzles, system configuration etc. The overall system worked well and no errors were reported. Each component of the system (e.g., VC, mobile app, WS, SC, SSCD) was evaluated in several experiments. One of the objectives was to develop a low-cost and user-friendly system that can be easily used by any user (e.g., grower, agronomist, farm manager, scientist, etc.). A user can operate the SSCD using the voice-controlled (VC) system giving voice commands (e.g., “open valve one”; “close all valves”) or using the mobile app. Additionally, users can access the collected data, in real-time, from the WS (e.g., air temperature and humidity, wind speed etc.), WSN (zone temperature and humidity), and SC (e.g., flow and pressure measurements) using the mobile app (in a form of figure and/or table).
Initial experiments show that, overall, the misting is effective. Even at lower temperatures of 9 °C, temperature drops of 3 °C are achievable. This value increased as the ambient temperature increased. For a climate with Bakersfield CA’s low relative humidity, the low saturation provides a catalyst for the evaporative effect to take place. Experiment 2 that was conducted in zone 8 demonstrated very promising results, as the temperature dropped nearly 8.3 °C at an ambient temperature of 20 °C. Figure 12 and Figure 15 also display a more than 10 °C drop in temperature with an ambient temperature of approximately 25 °C. Experiment 3 presents the results, of each zone, from a hot winter day with a temperature drop of about 11 °C.
Sensor placement is also an entailing process and is highly affected by wind and direction. If the mist being sprayed from the nozzle cannot make it to the tree bud, then cooling cannot occur. A high wire installation may not be feasible in windy areas, and it would be recommended to place the nozzle closer to the tree [24,25]. Additionally, node failure is a very common problem in WSN. The ability of a network to react to node failures is a design concern. Choosing a more robust wireless topology and algorithms will enhance the fault tolerance of the network. The current network topology used in the proposed system has a star configuration due to its simplicity of implementation. We plan to upgrade this configuration to a cluster type one to avoid communication bottleneck issues and improve the overall energy efficiency of the system. Furthermore, in order to deploy the proposed system in the real world, the scalability of the system must be investigated. Scalability can be defined as the ability of a network to adapt to an increase in the network size. The number of nodes in a WSN can range from a few nodes to a few thousand nodes. The new node should be able to dynamically join the network without the need to reset the entire network. Since the designed project will be used for farming, this is a critical design factor that should be taken into account.
6. Future Research
In future research, we plan to evaluate the proposed system and hypothesis: “A mist applied at intervals designed to produce maximum evaporative cooling duration during sunny hours will prevent the decrease of chill accumulation”, during the season 2017–2018.
We will measure/evaluate in the field:
- The duration of misting (hours/treatment) at different temperatures.
- The intervals between applications to conserve water (hours/days); and determine when evaporative cooling ceases at different temperatures.
- Droplet size for maximum evaporative cooling duration.
- Amount of water applied (volume, ha-cm) per application.
- Volume of mist and energy consumption per treatment and per tree.
- Flower quality evaluation (bloom synchrony, pollen and ovule viabilities).
- Postharvest fruit quality data (tree yields, nuts grading by processing factory).
- Investigate potential salinity and toxicity problems (water, soil, and plant analysis).
Acknowledgments
The author would like to thank Lu Zhang and Rod Stiefvater for their help and assistance during the system development and field operation. This material is based upon work that is supported by the California Pistachio Research Board and the National Institute of Food and Agriculture, U.S. Department of Agriculture under award numbers 2016-38422-25544 and 2016-67032-25008.
Author Contributions
Y.A. and L.F. conceived and designed the experiments; J.K. performed the experiments; Y.A. and J.K. analyzed the data; Y.A., L.F., and R.A. contributed reagents/materials/analysis tools; Y.A. and J.K. wrote the paper.
Conflicts of Interest
The authors declare no conflict of interest.
References
- Mall, R.K.; Gupta, A.; Sonkar, G. Effect of climate change on agricultural crops. In Current Developments in Biotechnology and Bioengineering: Crop Modification, Nutrition, and Food Production; Elsevier Science: Amsterdam, The Netherlands, 2016; p. 23. [Google Scholar]
- Otto-Bliesner, B.L.; Brady, E.C.; Fasullo, J.; Jahn, A.; Landrum, L.; Stevenson, S.; Rosenbloom, N.; Mai, A.; Strand, G. Climate variability and change since 850 CE: An ensemble approach with the community earth system model. Bull. Am. Meteorol. Soc. 2016, 97, 735–754. [Google Scholar] [CrossRef]
- Drake, B.L.; Hanson, D.T.; Lowrey, T.K.; Sharp, Z.D. The carbon fertilization effect over a century of anthropogenic CO2 emissions: Higher intracellular CO2 and more drought resistance among invasive and native grass species contrasts with increased water use efficiency for woody plants in the US Southwest. Glob. Chang. Boil. 2017, 23, 782–792. [Google Scholar] [CrossRef] [PubMed]
- Donohue, R.J.; Roderick, M.L.; McVicar, T.R.; Farquhar, G.D. Impact of CO2 fertilization on maximum foliage cover across the globe’s warm, arid environments. Geophys. Res. Lett. 2013, 40, 3031–3035. [Google Scholar] [CrossRef]
- Ainsworth, E.A.; Rogers, A. The response of photosynthesis and stomatal conductance to rising [CO2]: Mechanisms and environmental interactions. Plant Cell Environ. 2007, 30, 258–270. [Google Scholar] [CrossRef] [PubMed]
- Flexas, J.; Carriquí, M.; Coopman, R.E.; Gago, J.; Galmés, J.; Martorell, S.; Morales, F.; Diaz-Espejo, A. Stomatal and mesophyll conductances to CO2 in different plant groups: Underrated factors for predicting leaf photosynthesis responses to climate change? Plant Sci. 2014, 226, 41–48. [Google Scholar] [CrossRef] [PubMed]
- Cal-Adapt: Exploring California’s Climate Change Research. Available online: http://cal-adapt.org (accessed on 18 December 2017).
- California Department of Food and Agriculture. Available online: https://www.cdfa.ca.gov (accessed on 18 December 2017).
- Cox, J. High Rate of Pistachio ‘Blanks’ Worries Local Nut Growers. Available online: http://www.bakersfield.com/news/business/high-rate-of-pistachio-blanks-worries-local-nut-growers/articlen e711c5cb-8532-565e-bc9f-1f3b6807cdaa.html (accessed on 18 December 2017).
- Stiefvater, R. Pistachio grower. Personal communication, 2016. [Google Scholar]
- Ghaemi, A.A.; Rafiee, M.R.; Sepaskhah, A.R. Tree-Temperature Monitoring for Frost Protection of Orchards in Semi-Arid Regions Using Sprinkler Irrigation. Agric. Sci. China 2009, 8, 98–107. [Google Scholar] [CrossRef]
- Hewitt, E.W.; Young, K. Water sprinkling to delay bloom in fruit trees. N. Z. J. Agric. Res. 1980, 23, 37–41. [Google Scholar] [CrossRef]
- Andersen, J.L.; Seeley, B.L. Bloom delay in deciduous fruits. Hortic. Rev. 1993, 15, 97–144. [Google Scholar]
- Tsipouridis, C.; Thomidis, T.; Xatzicharisis, I. Effect of sprinkler irrigation system on air temperatures and use of chemicals to protect cherry and peach trees from early spring frost. Anim. Prod. Sci. 2006, 46, 697–700. [Google Scholar] [CrossRef]
- Playan, E.; Salvador, R.; Faci, J.M.; Zapata, N.; Martinez-Cob, A.; Sanchez, I. Day and night wind drift and evaporation losses in sprinkler solid-sets and moving laterals. Agric. Water Manag. 2005, 76, 39–159. [Google Scholar] [CrossRef] [Green Version]
- Rijal, I.; Flore, J.; Andresen, J. Mist-cooling to delay bloom and prevent frost damage-old idea new technology. In Proceedings of the ASABE 1st Climate Change Symposium: Adaptation and Mitigation Conference Proceedings, Chicago, IL, USA, 3–5 May 2015; American Society of Agricultural and Biological Engineers: St. Joseph, MI, USA; p. 1. [Google Scholar]
- Wolfe, J.W.; Lombard, P.B.; Tabor, M. The effectiveness of a mist versus a low pressure sprinkler system for bloom delay. Trans. ASAE 1976, 19, 510–513. [Google Scholar] [CrossRef]
- Cheng, W.L.; Zhang, W.W.; Chen, H.; Hu, L. Spray cooling and flash evaporation cooling: The current development and application. Renew. Sustain. Energy Rev. 2016, 55, 614–628. [Google Scholar] [CrossRef]
- Baille, M.; Baille, A.; Delmon, D. Microclimate and transpiration of greenhouse rose crops. Agric. For. Meteorol. 1994, 71, 83–97. [Google Scholar] [CrossRef]
- Zapata, N.; Playan, E.; Martinez-Cob, A.; Sanchez, I.; Faci, J.M.; Lecina, S. From on-farm solid-set sprinkler irrigation design to collective irrigation network design in windy areas. Agric. Water Manag. 2007, 87, 187–199. [Google Scholar] [CrossRef]
- Katsoulas, N.; Baille, A.; Kittas, C. Effect of misting on transpiration and conductances of a greenhouse rose canopy. Agric. For. Meteorol. 2001, 106, 233–247. [Google Scholar] [CrossRef]
- Agnello, A.; Landers, A.J. Current progress in the development of a fixed spray pesticide application system for high-density apple plantings. N. Y. Fruit Q. 2006, 14, 22–26. [Google Scholar]
- Lang, G.A. Growing Sweet Cherries under Plastic Covers and Tunnels: Physiological Aspects and Practical Considerations. Proc. Int. Cherry Symp. 2009, 1020, 303–312. [Google Scholar] [CrossRef]
- Sharda, A.; Karkee, M.; Zhang, Q. Fluid dynamics of a solid set canopy spray delivery system for orchard applications. In Proceedings of the American Society of Agricultural and Biological Engineering, Kansas City, MO, USA, 21–24 July 2013. Paper Number 131620688. [Google Scholar]
- Sharda, A.; Karkee, M.; Zhang, Q.; Ewlanow, I.; Adameit, U.; Brunner, J. Effect of emitter type and mounting configuration on spray coverage for solid set canopy delivery system. Comput. Electron. Agric. 2015, 112, 184–192. [Google Scholar] [CrossRef]
- Ampatzidis, Y.; Tan, L.; Haley, R.; Whiting, M.D. Cloud-based harvest management information system for hand-harvested specialty crops. Comput. Electron. Agric. 2016, 122, 161–167. [Google Scholar] [CrossRef]
- Ampatzidis, Y.; Bellis, L.D.; Luvisi, A. iPathology: Robotic applications and management of plants and plant diseases. Sustainability 2017, 9, 1010. [Google Scholar] [CrossRef]
- Luvisi, A.; Ampatzidis, Y.; Bellis, L.D. Plant pathology and information technology: Opportunity and uncertainty in pest management. Sustainability 2016, 8, 831. [Google Scholar] [CrossRef]
- Vougioukas, S.; Anastassiu, H.T.; Regen, C.; Zude, M. Influence of foliage on radio path losses (PLs) for wireless sensor network (WSN) planning in orchards. Biosyst. Eng. 2013, 114, 454–465. [Google Scholar] [CrossRef]
- Anastassiu, H.T.; Vougioukas, S.; Fronimos, T.; Regen, C.; Petrou, L.; Zude, M.; Kathner, J. A Computational Model for Path Loss in Wireless Sensor Networks in Orchard Environments. Sensors 2014, 14, 5118–5135. [Google Scholar] [CrossRef] [PubMed]
- Foster, J. XBee Cookbook; Clark Science Center: Northampton, MA, USA, 2011. [Google Scholar]
- Trudeau, D.; Ward, J.; Zhang, L.; Ferguson, L.; Ampatzidis, Y. Automated solid state canopy delivery (SSCD) system to deliver mist-cooling to increase winter chill for dormancy and bud break. In Proceedings of the ASABE 2017 Annual International Meeting, Spokane, WA, USA, 16–19 July 2017. [Google Scholar]
- Cruz, A.; Luvisi, A.; Bellis, L.D.; Ampatzidis, Y. X-FIDO: An Effective Application for Detecting Olive Quick Decline Syndrome with Deep Learning and Data Fusion. Front. Plant Sci. 2017, 8, 1741. [Google Scholar] [CrossRef] [PubMed]
Figure 1.
System Block Diagram. The Smart Control (SC) system (Arduino mega microcontroller) collects data from the Wireless Sensor Network (WSN) and the weather station, receives voice commands from the Voice-Controlled (VC) system, communicates with the mobile app, and wirelessly controls the SSCD.

Figure 2.
Mounting emitter configuration of the pilot SSCD system.
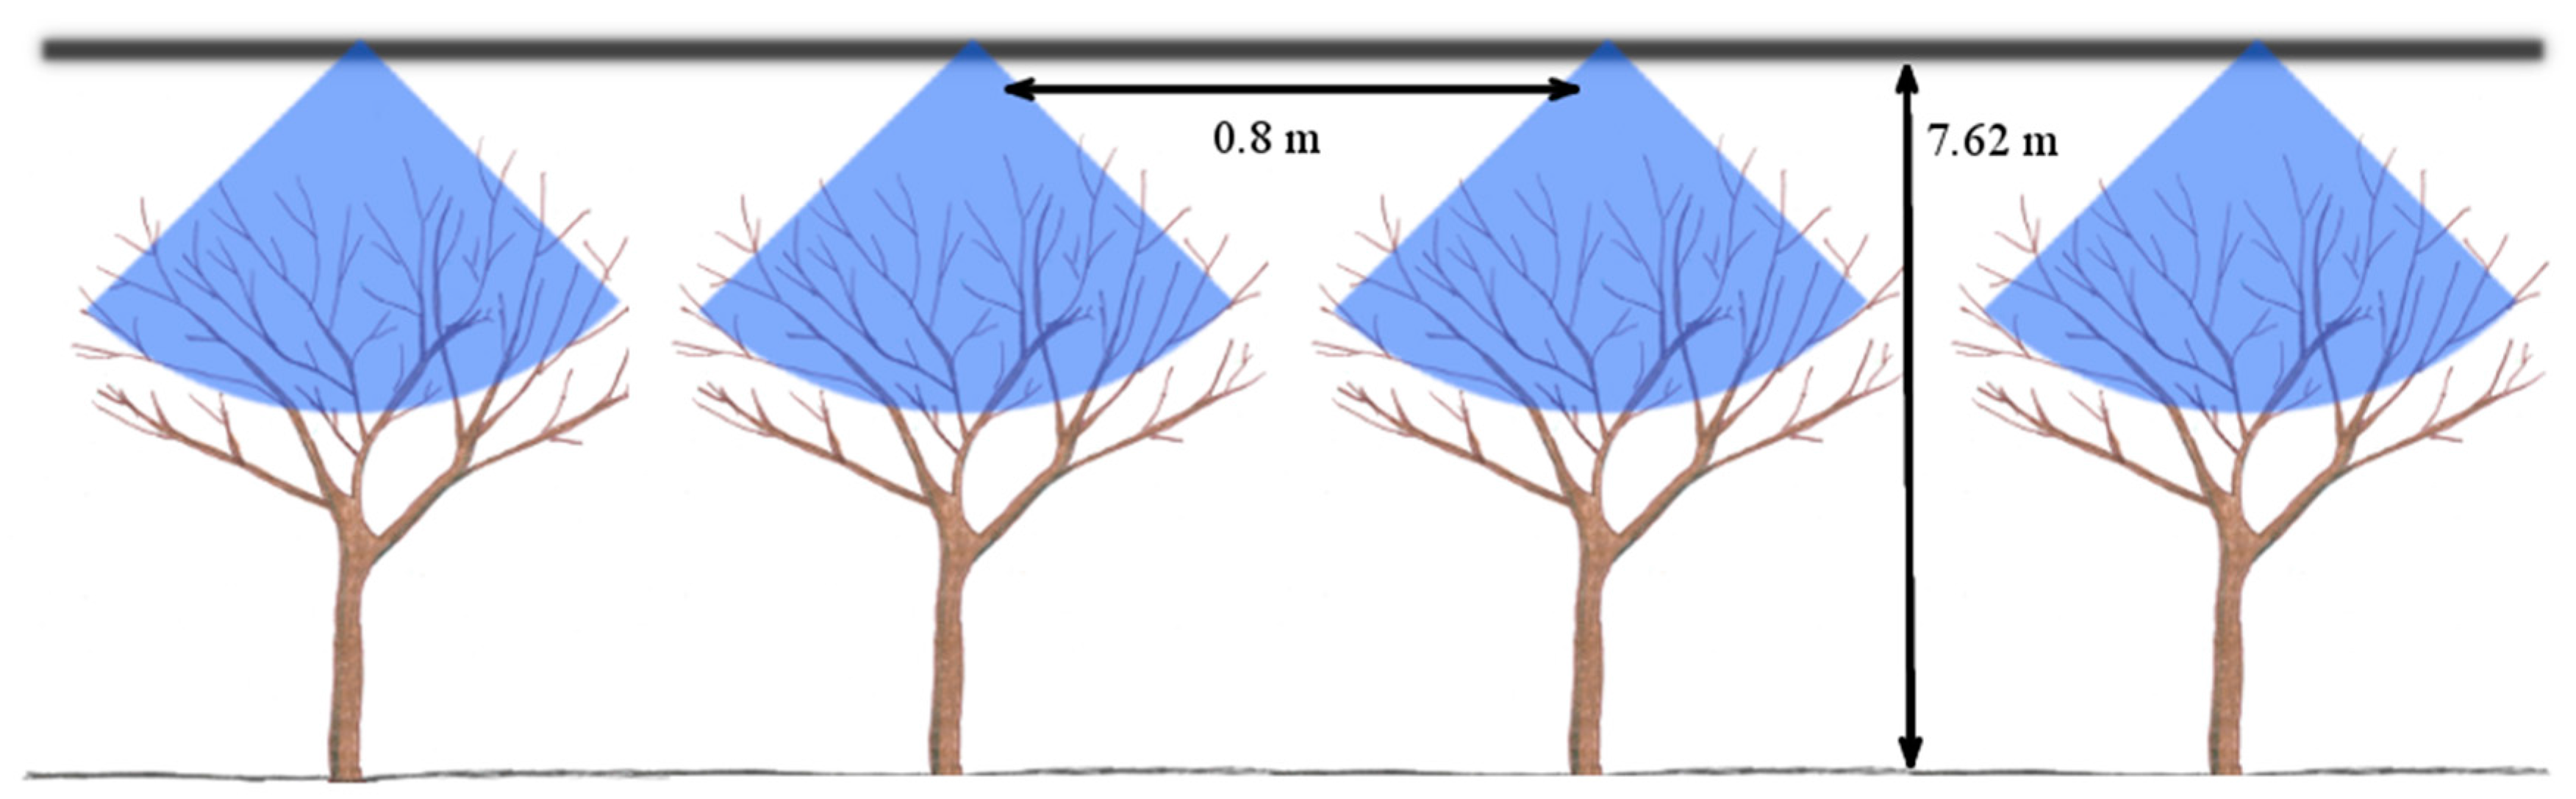
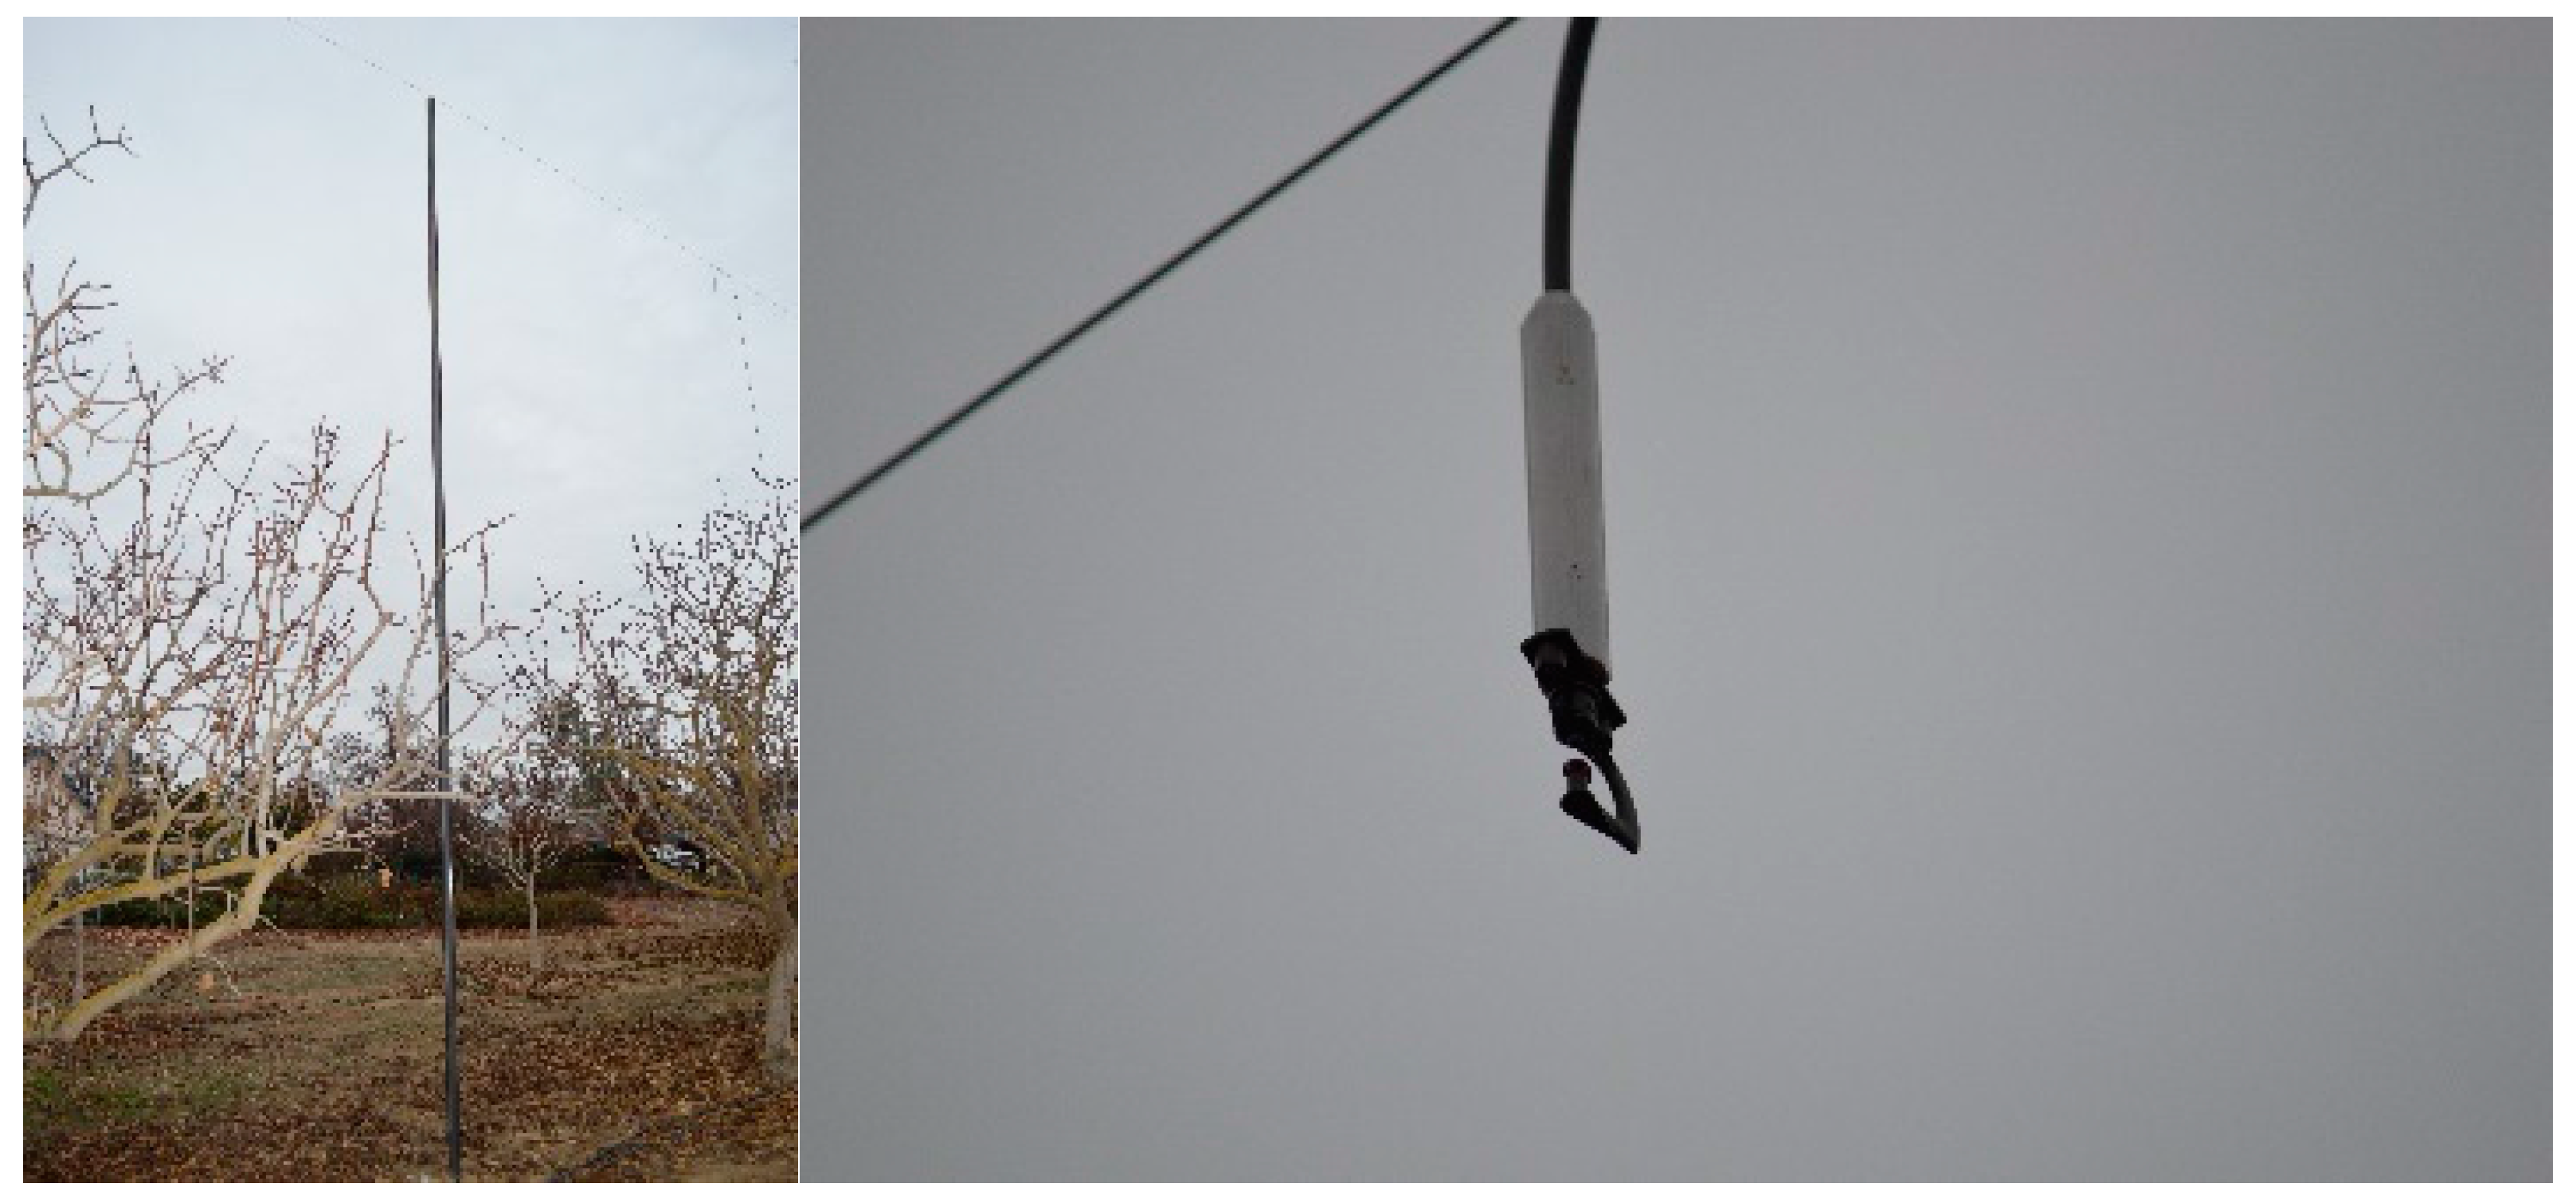
Figure 3.
Highwire nozzle arrangement above canopy.

Figure 4.
Temperature transmitter and XBee S2C (WSN).

Figure 5.
Temperature transmitter and XBee S2C Diagram.

Figure 6.
Weather Station (WS).

Figure 7.
Screenshot of the mobile app: weather station data.

Figure 8.
Solenoid valves, pressure transducer, and flow meter of the Smart Control (SC) System.

Figure 9.
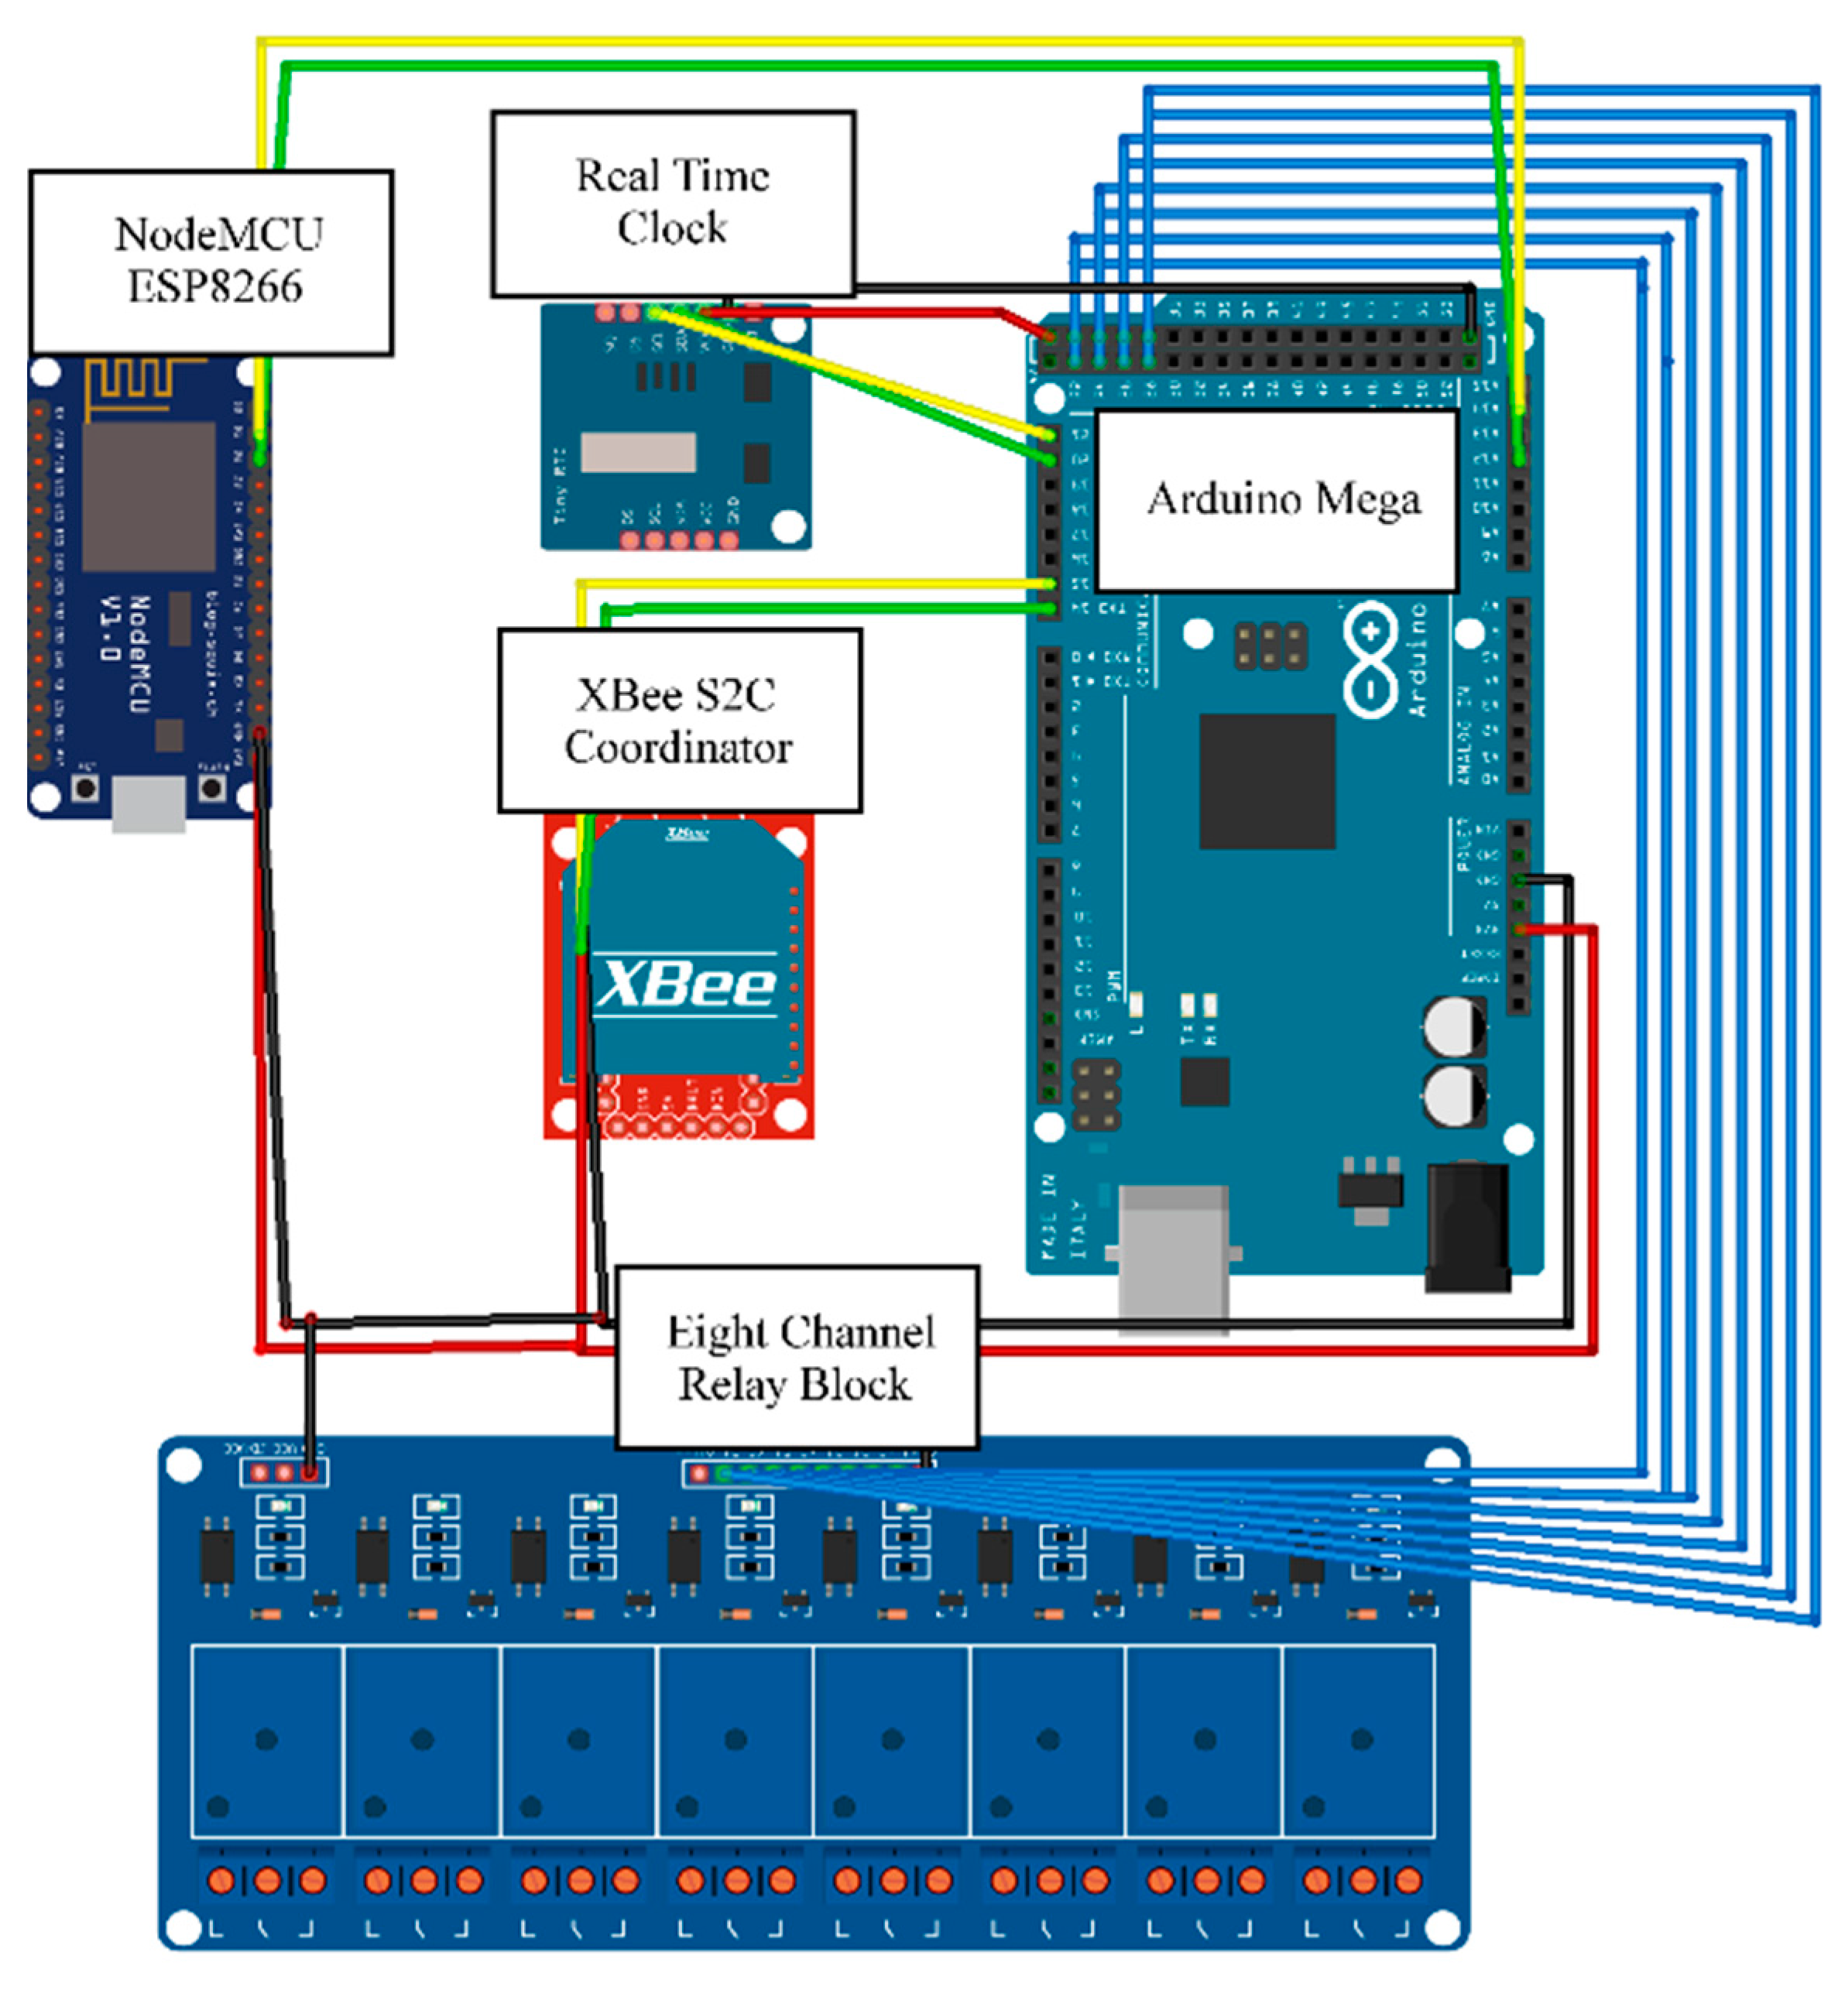
The Smart Control (SC) System includes an Arduino Mega 2560 microcontroller, a node MCU Wifi module, a XBee S2C, a real-time clock, eight-channel relay block, solenoid valves, flow meters, and pressure sensor.
Figure 9.
The Smart Control (SC) System includes an Arduino Mega 2560 microcontroller, a node MCU Wifi module, a XBee S2C, a real-time clock, eight-channel relay block, solenoid valves, flow meters, and pressure sensor.
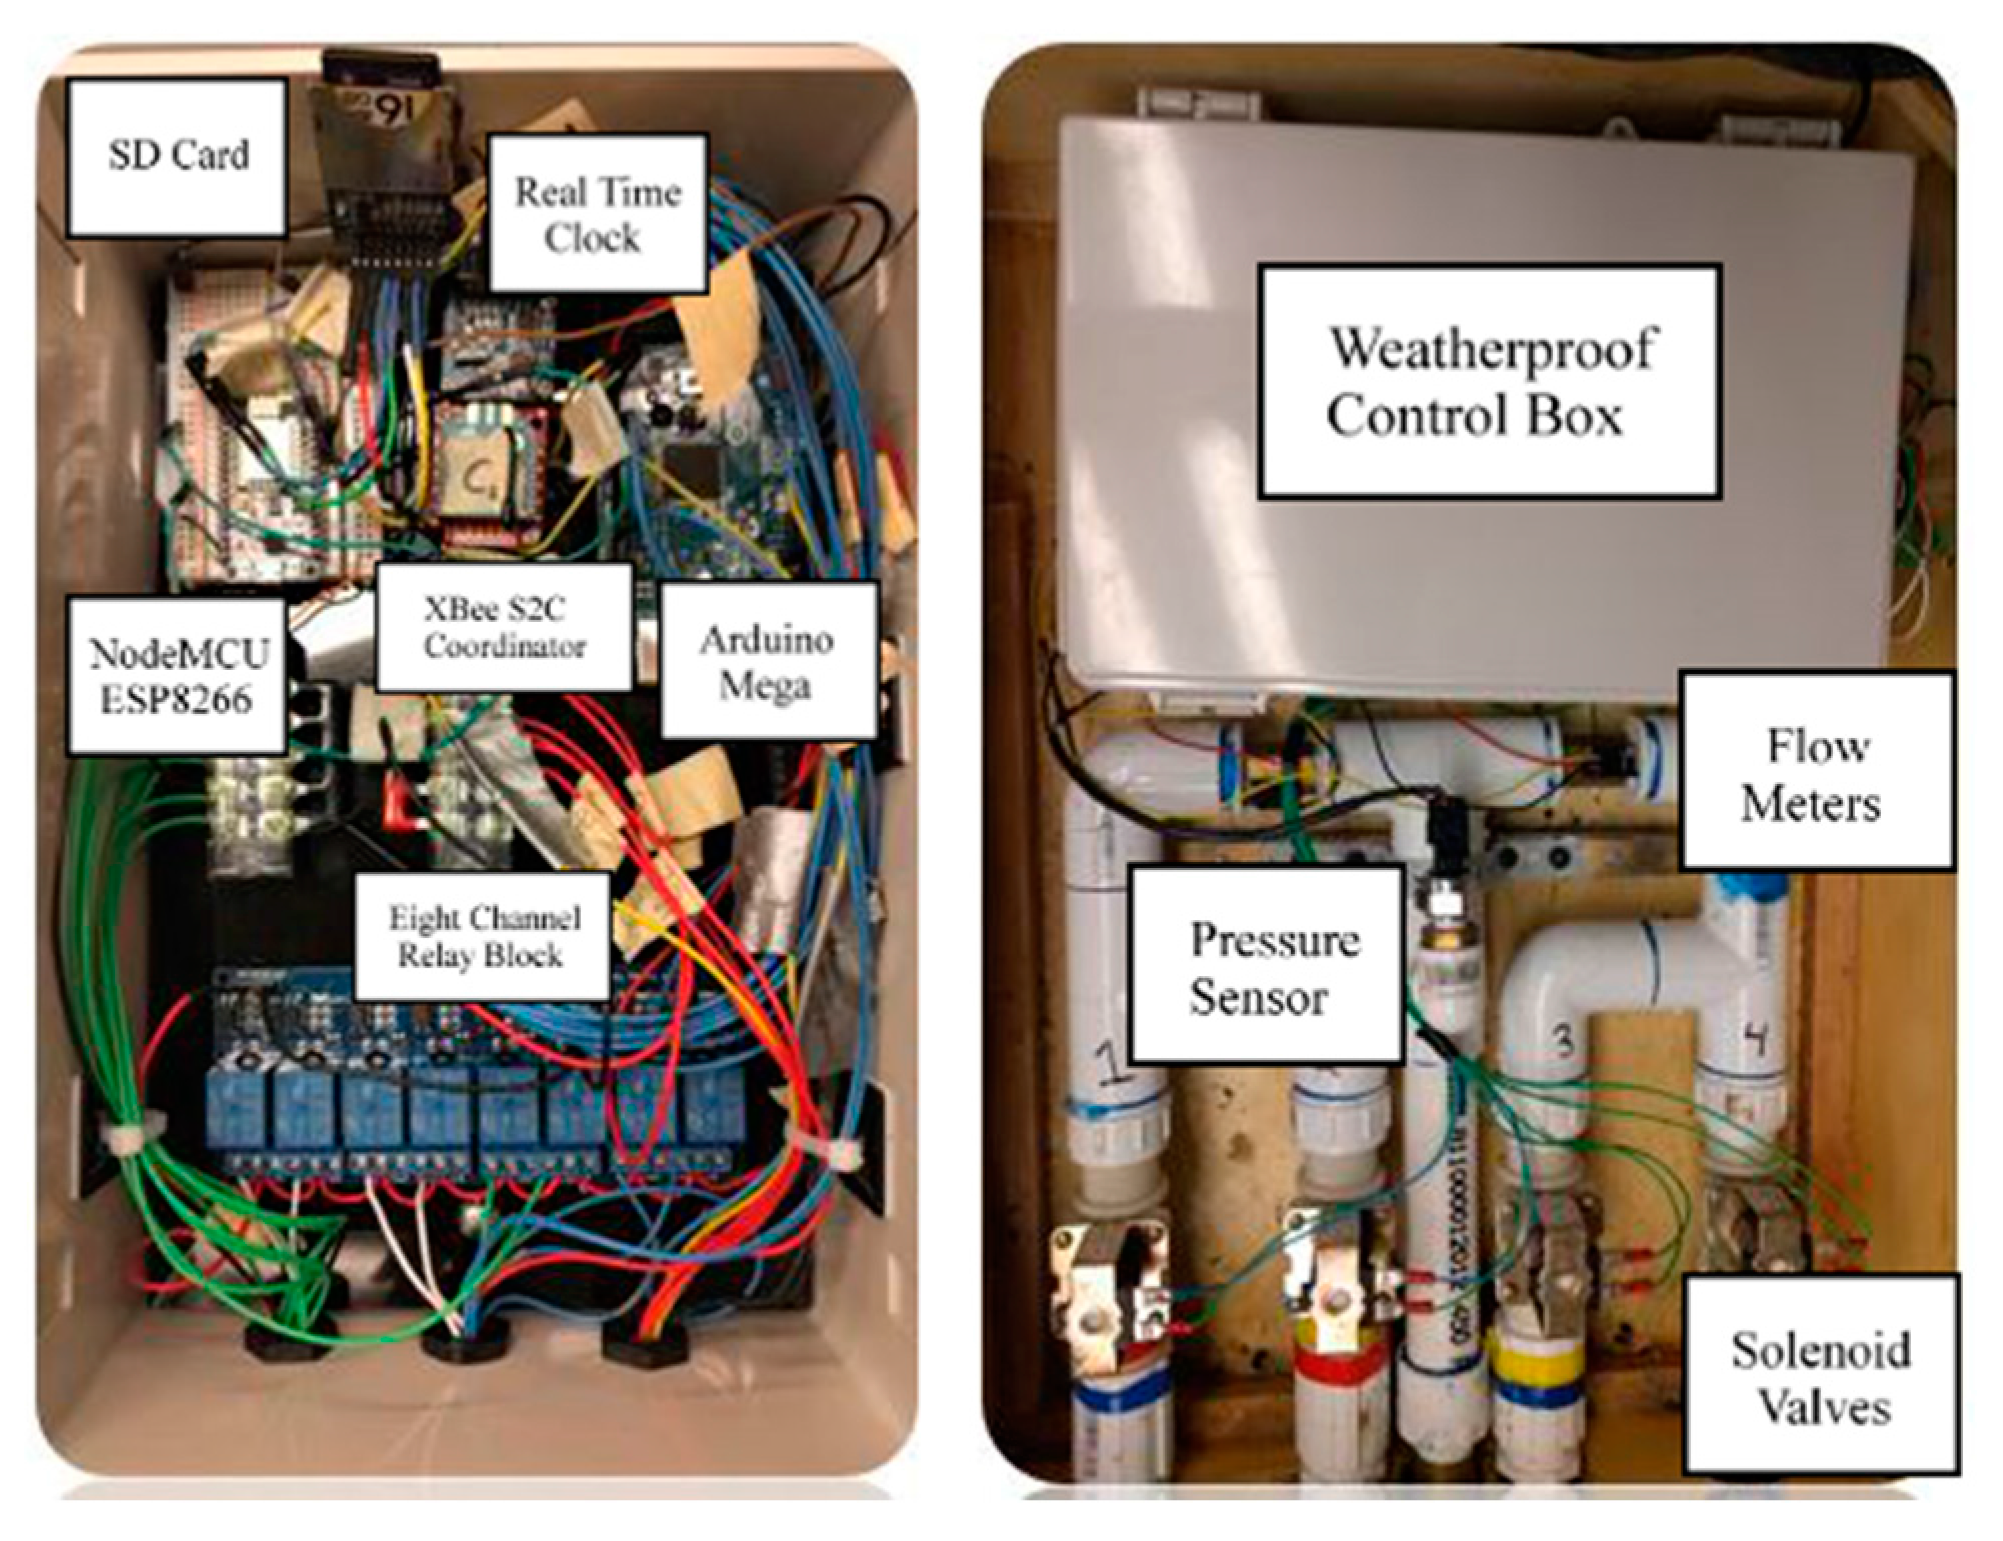
Figure 10.
The Smart Control (SC) System Diagram.

Figure 11.
Aerial image of pistachio orchard with designated zones.
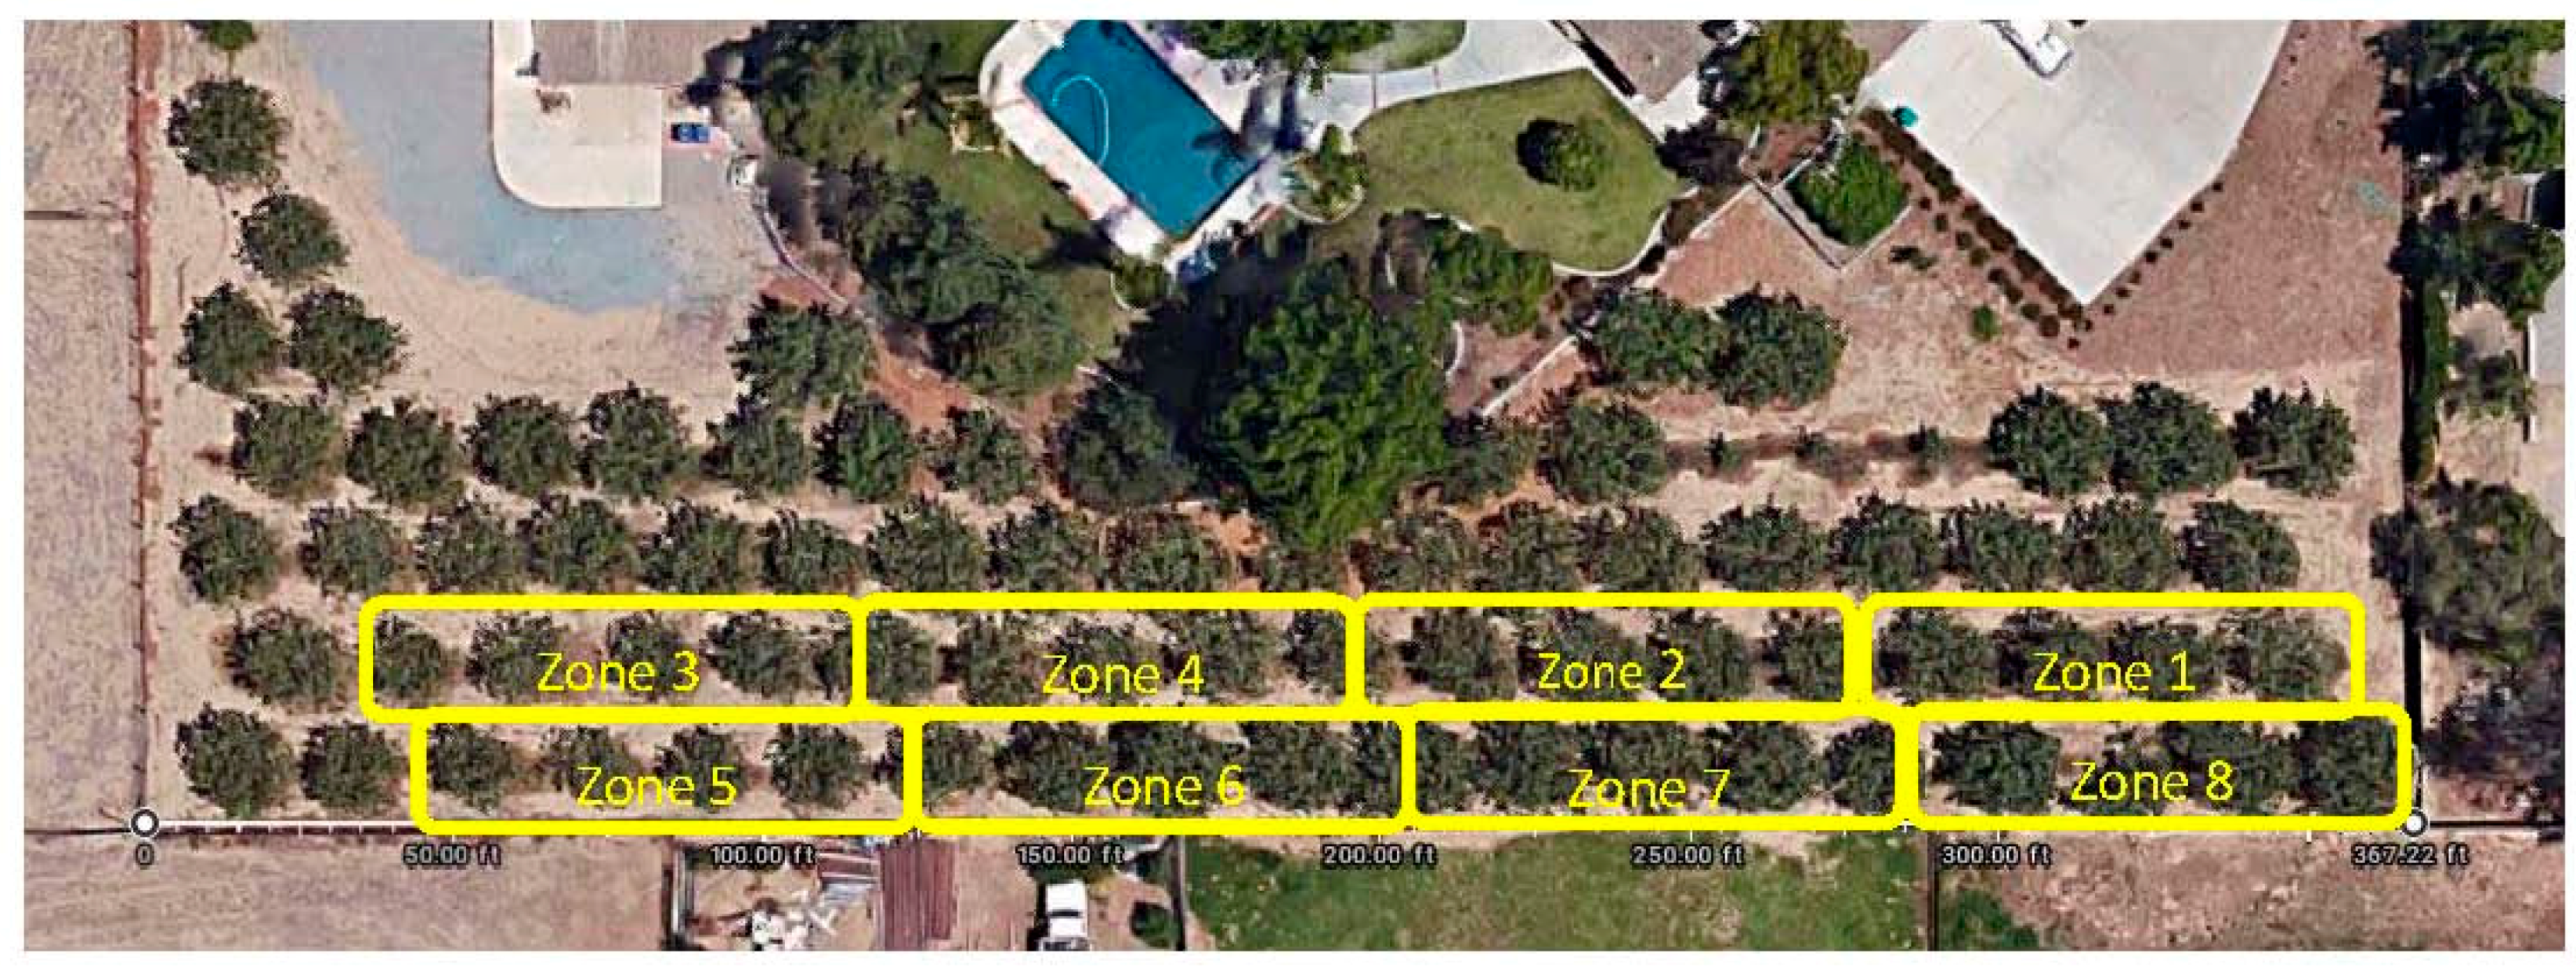
Figure 12.
Trials on (a) 18 July 2017; (b) 19 July 2017. The red line presents the air ambient temperature (°C) of the control zone (no misting); the blue line presents the temperature in Zone 1. The vertical black lines present the “start” (valve 1 on) and “stop” (valve 1 off) events.
Figure 12.
Trials on (a) 18 July 2017; (b) 19 July 2017. The red line presents the air ambient temperature (°C) of the control zone (no misting); the blue line presents the temperature in Zone 1. The vertical black lines present the “start” (valve 1 on) and “stop” (valve 1 off) events.
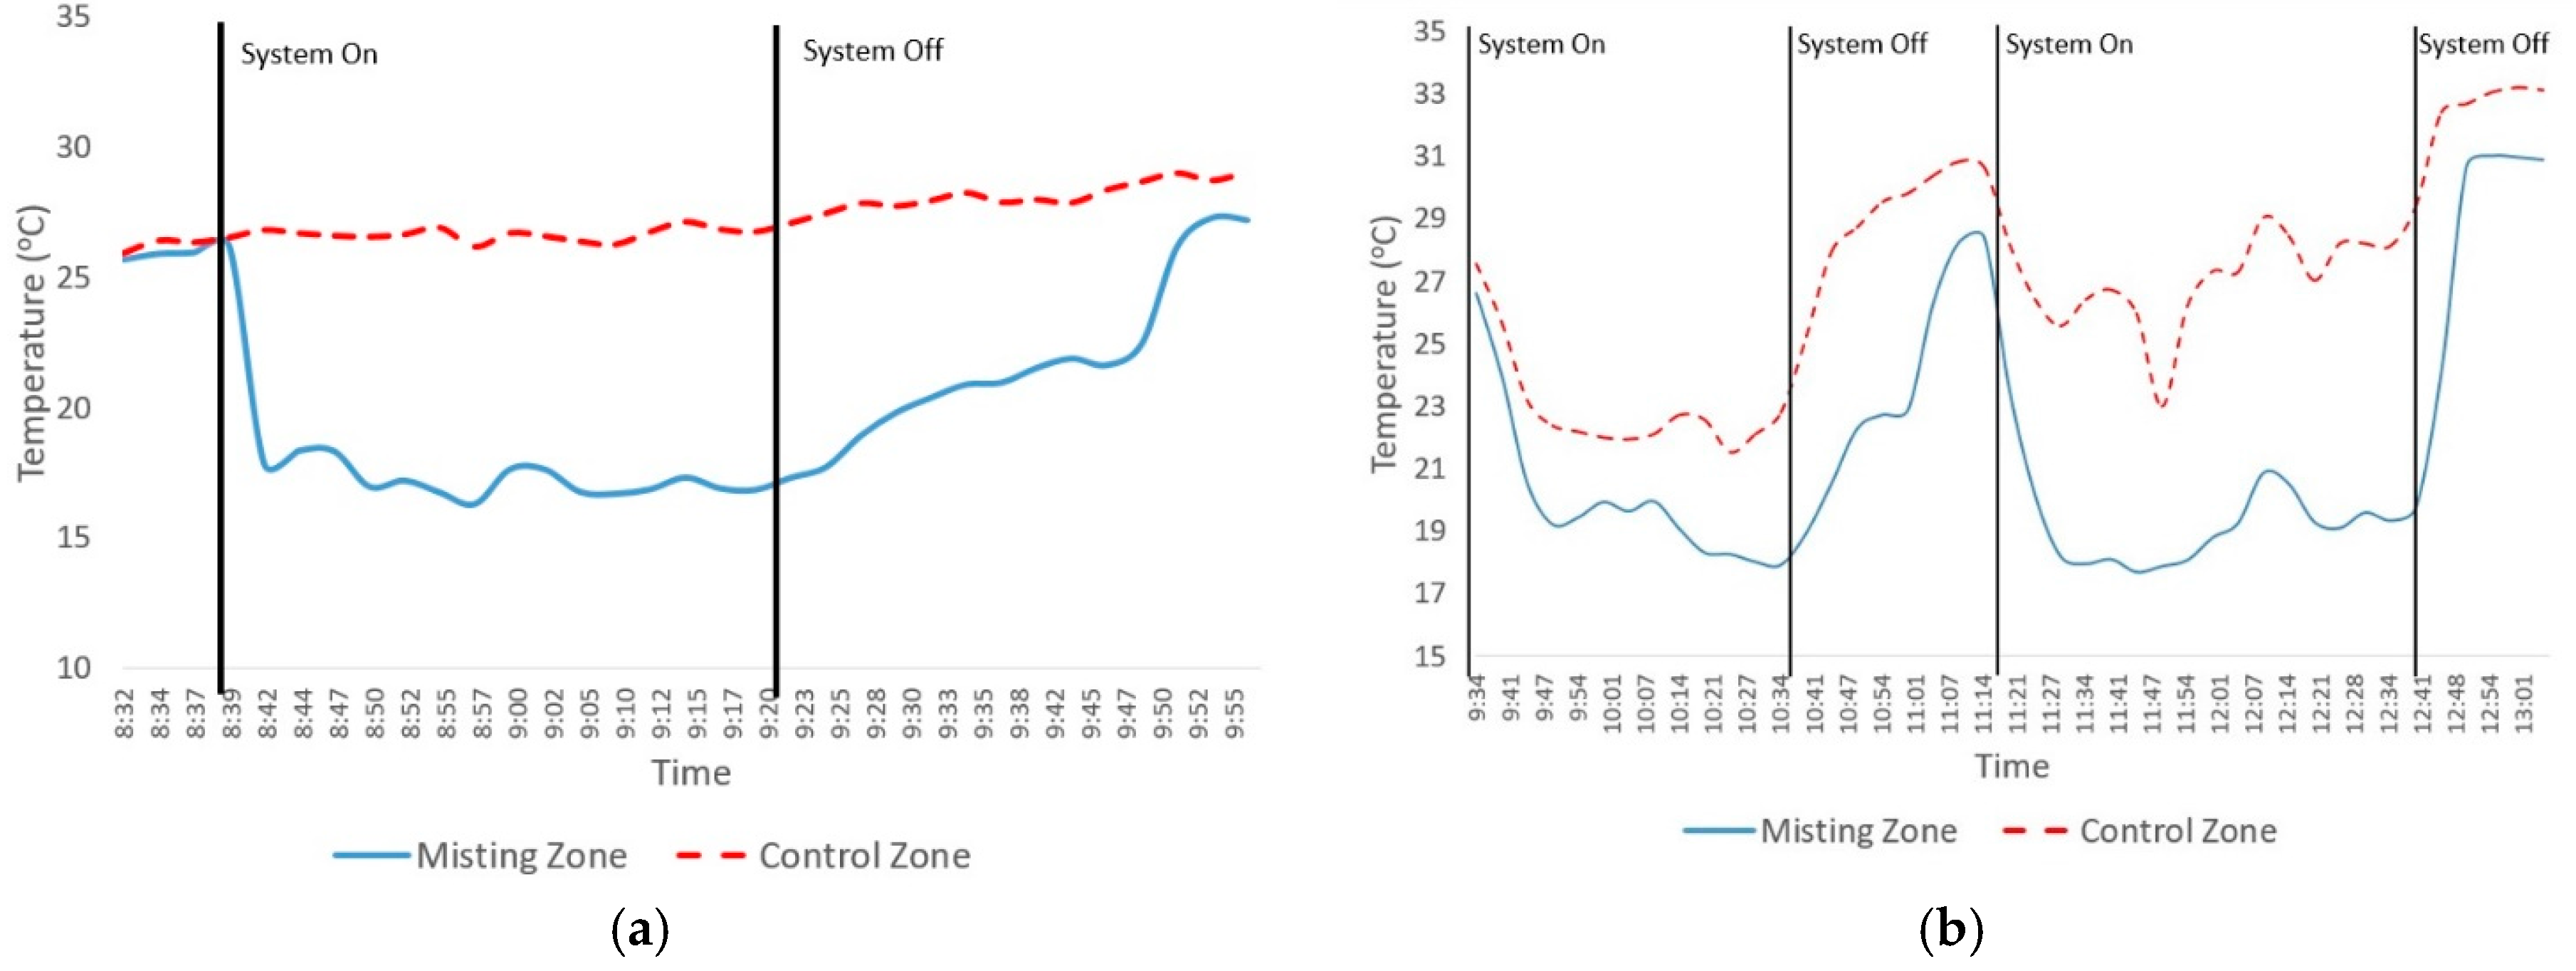
Figure 13.
Temperature decrease (°C) in Zone 1. The black lines represent the CIMIS ambient temperature; the blue curve displays the localized ambient (control) temperature; the red line presents the zone temperature.
Figure 13.
Temperature decrease (°C) in Zone 1. The black lines represent the CIMIS ambient temperature; the blue curve displays the localized ambient (control) temperature; the red line presents the zone temperature.

Figure 14.
Results from “flow event” 4. The first black vertical line indicates when the valve opened and the second vertical line indicates when the valve closed.
Figure 14.
Results from “flow event” 4. The first black vertical line indicates when the valve opened and the second vertical line indicates when the valve closed.
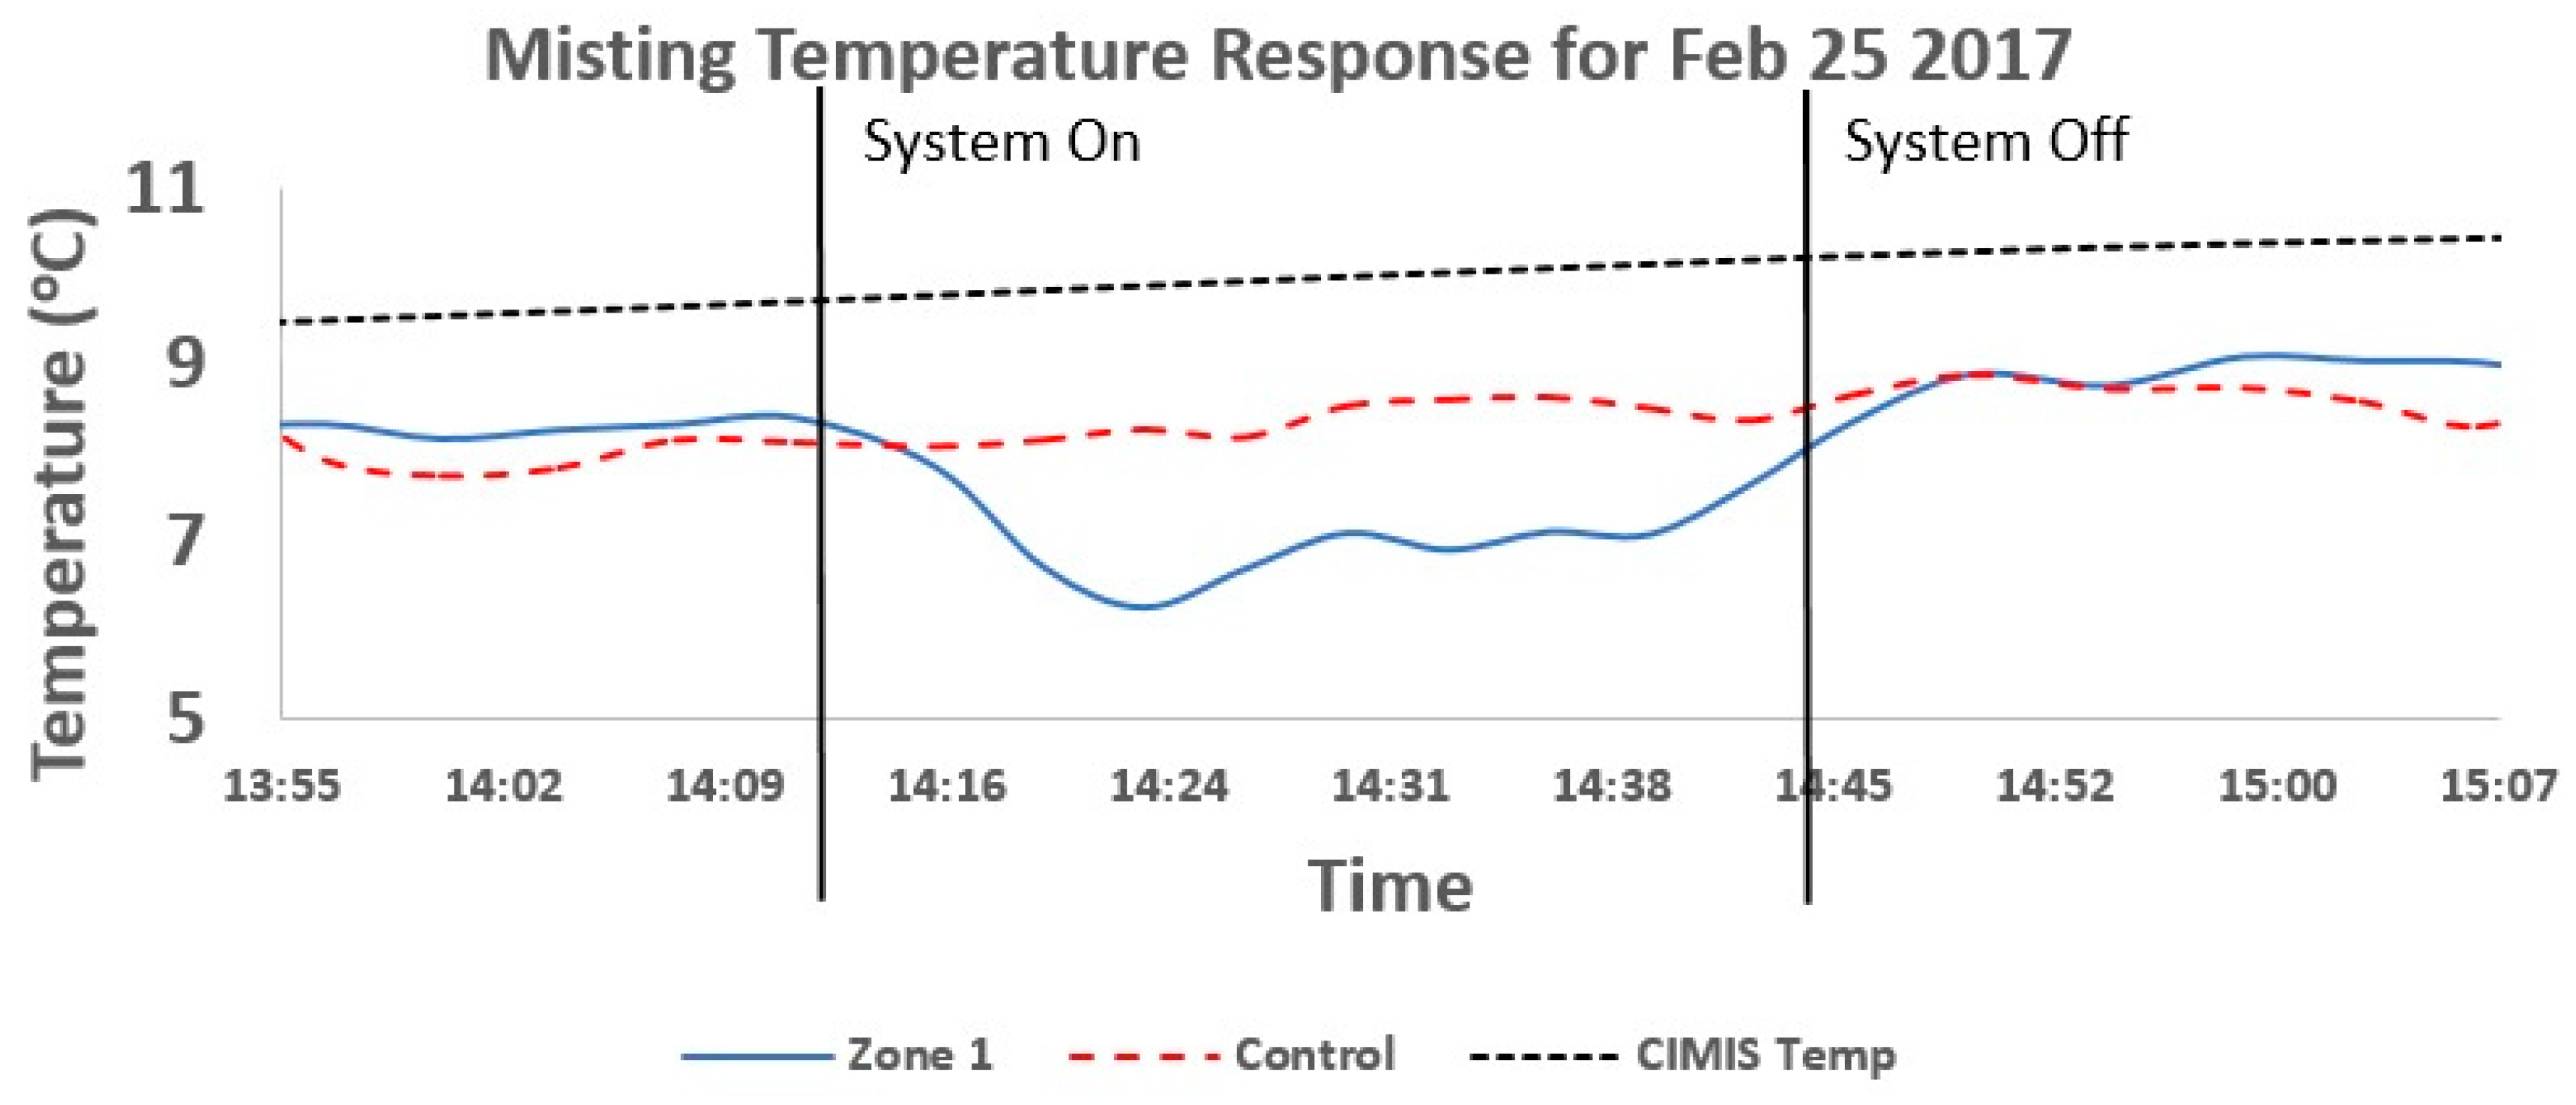
Figure 15.
Results from experiment 3; temperature decrease in each zone. The black vertical line indicates when the valve opened and the orange vertical line indicates when the valve closed.
Figure 15.
Results from experiment 3; temperature decrease in each zone. The black vertical line indicates when the valve opened and the orange vertical line indicates when the valve closed.

© 2018 by the authors. Licensee MDPI, Basel, Switzerland. This article is an open access article distributed under the terms and conditions of the Creative Commons Attribution (CC BY) license (http://creativecommons.org/licenses/by/4.0/).
Share and Cite
MDPI and ACS Style
Ampatzidis, Y.; Kiner, J.; Abdolee, R.; Ferguson, L. Voice-Controlled and Wireless Solid Set Canopy Delivery (VCW-SSCD) System for Mist-Cooling. Sustainability 2018, 10, 421. https://doi.org/10.3390/su10020421
AMA Style
Ampatzidis Y, Kiner J, Abdolee R, Ferguson L. Voice-Controlled and Wireless Solid Set Canopy Delivery (VCW-SSCD) System for Mist-Cooling. Sustainability. 2018; 10(2):421. https://doi.org/10.3390/su10020421
Chicago/Turabian StyleAmpatzidis, Yiannis, Josh Kiner, Reza Abdolee, and Louise Ferguson. 2018. "Voice-Controlled and Wireless Solid Set Canopy Delivery (VCW-SSCD) System for Mist-Cooling" Sustainability 10, no. 2: 421. https://doi.org/10.3390/su10020421
Note that from the first issue of 2016, this journal uses article numbers instead of page numbers. See further details here.