Road Safety Risk Assessment: An Analysis of Transport Policy and Management for Low-, Middle-, and High-Income Asian Countries

 ,
,
Abstract
:1. Introduction
Addressing the preventable problem of inadequate road safety requires the dedicated action of multiple ministries, most notably law, planning, transport, education, public information, and health. The range of measures to ensure road safety includes improving the built environment (e.g., safer road design, regulating sidewalks and traffic lights, introducing safe bicycle lanes), law enforcement and education to increase seatbelt use and helmet wearing while reducing speeding and drink driving, better vehicle standards, and improved post-crash response. Road safety measures that provide safer, more sustainable public transport options are also particularly promising and can support synergies between health, transport and carbon emission reduction targets [6].
2. Related Studies
2.1. Risk and Road Safety Analysis
2.2. DEA and Road Safety Risk Analysis
2.3. SEM and Road Safety Risk Analysis
2.4. DEA-SEM Combination
2.5. Advantages of Using DEA-SEM Method
2.6. Research Gap
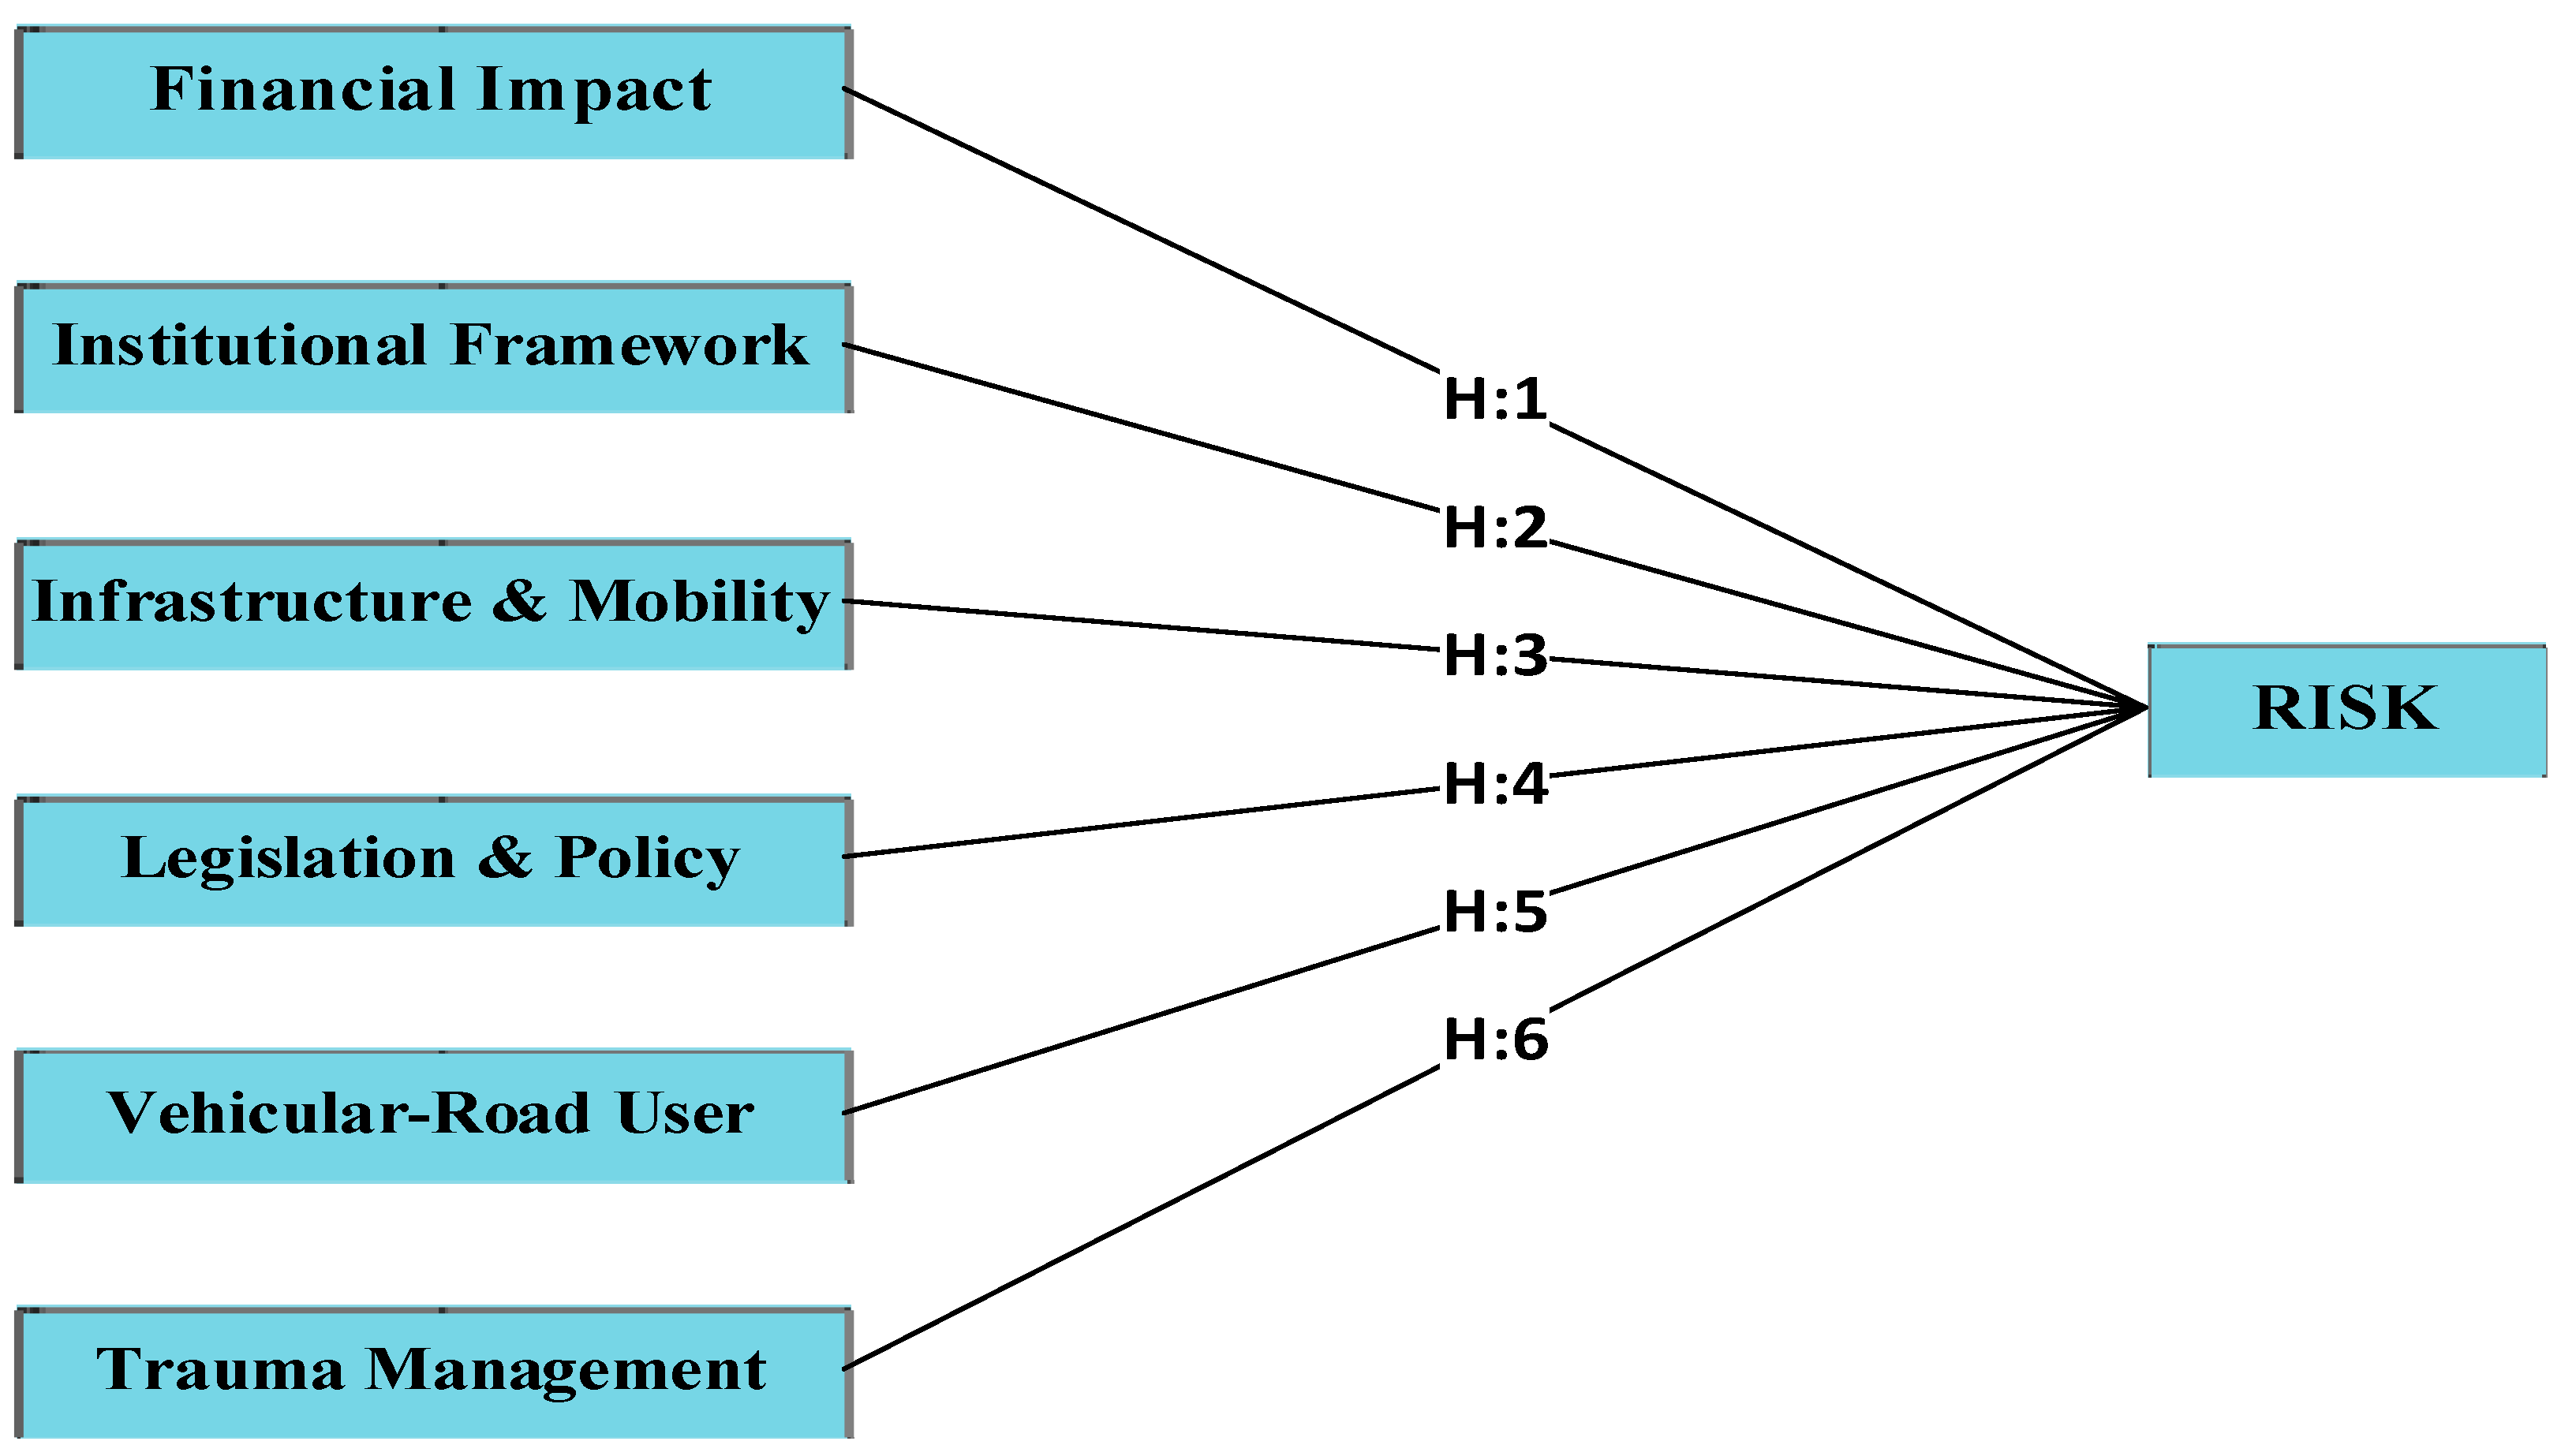
3. Construction of Hypothesis and Model
3.1. H1: Financial Impact → Risk
3.2. H2: Institutional Framework → Risk
3.3. H3: Infrastructure & Mobility → Risk
3.4. H4: Legislation and Policy → Risk
3.5. H5: Vehicular-Road User → Risk
3.6. H6: Trauma Management → Risk
4. Materials and Methods
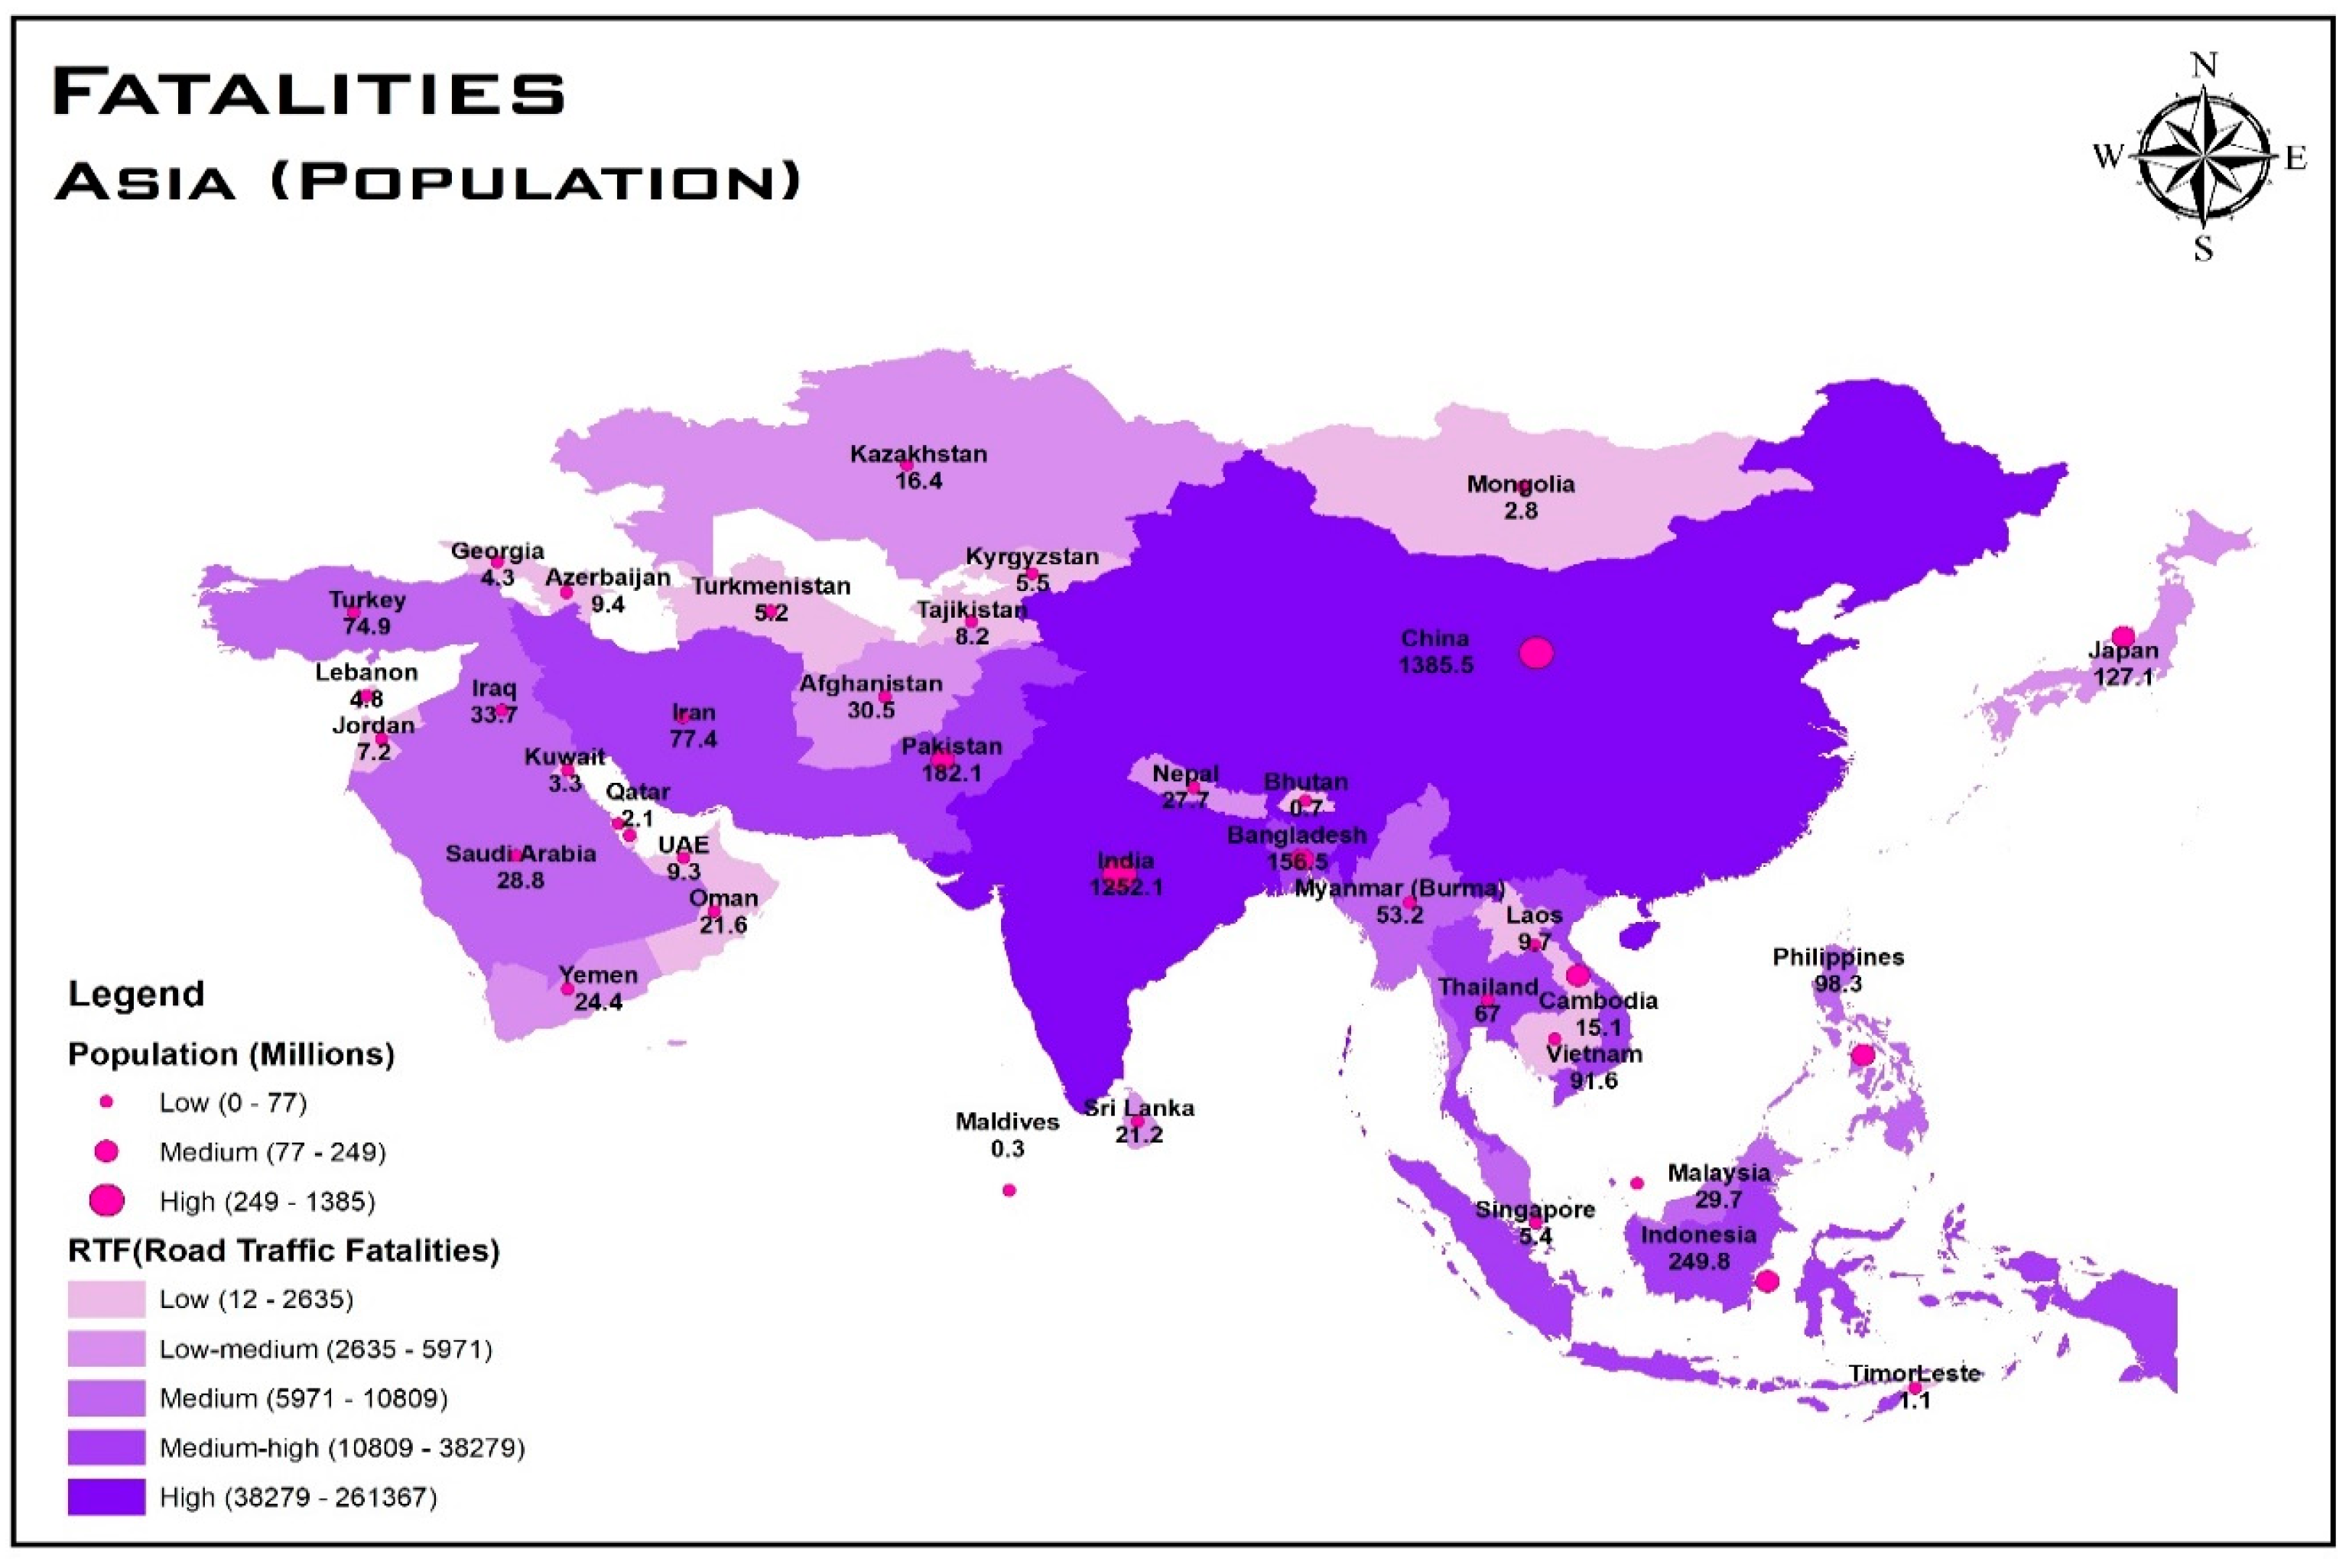
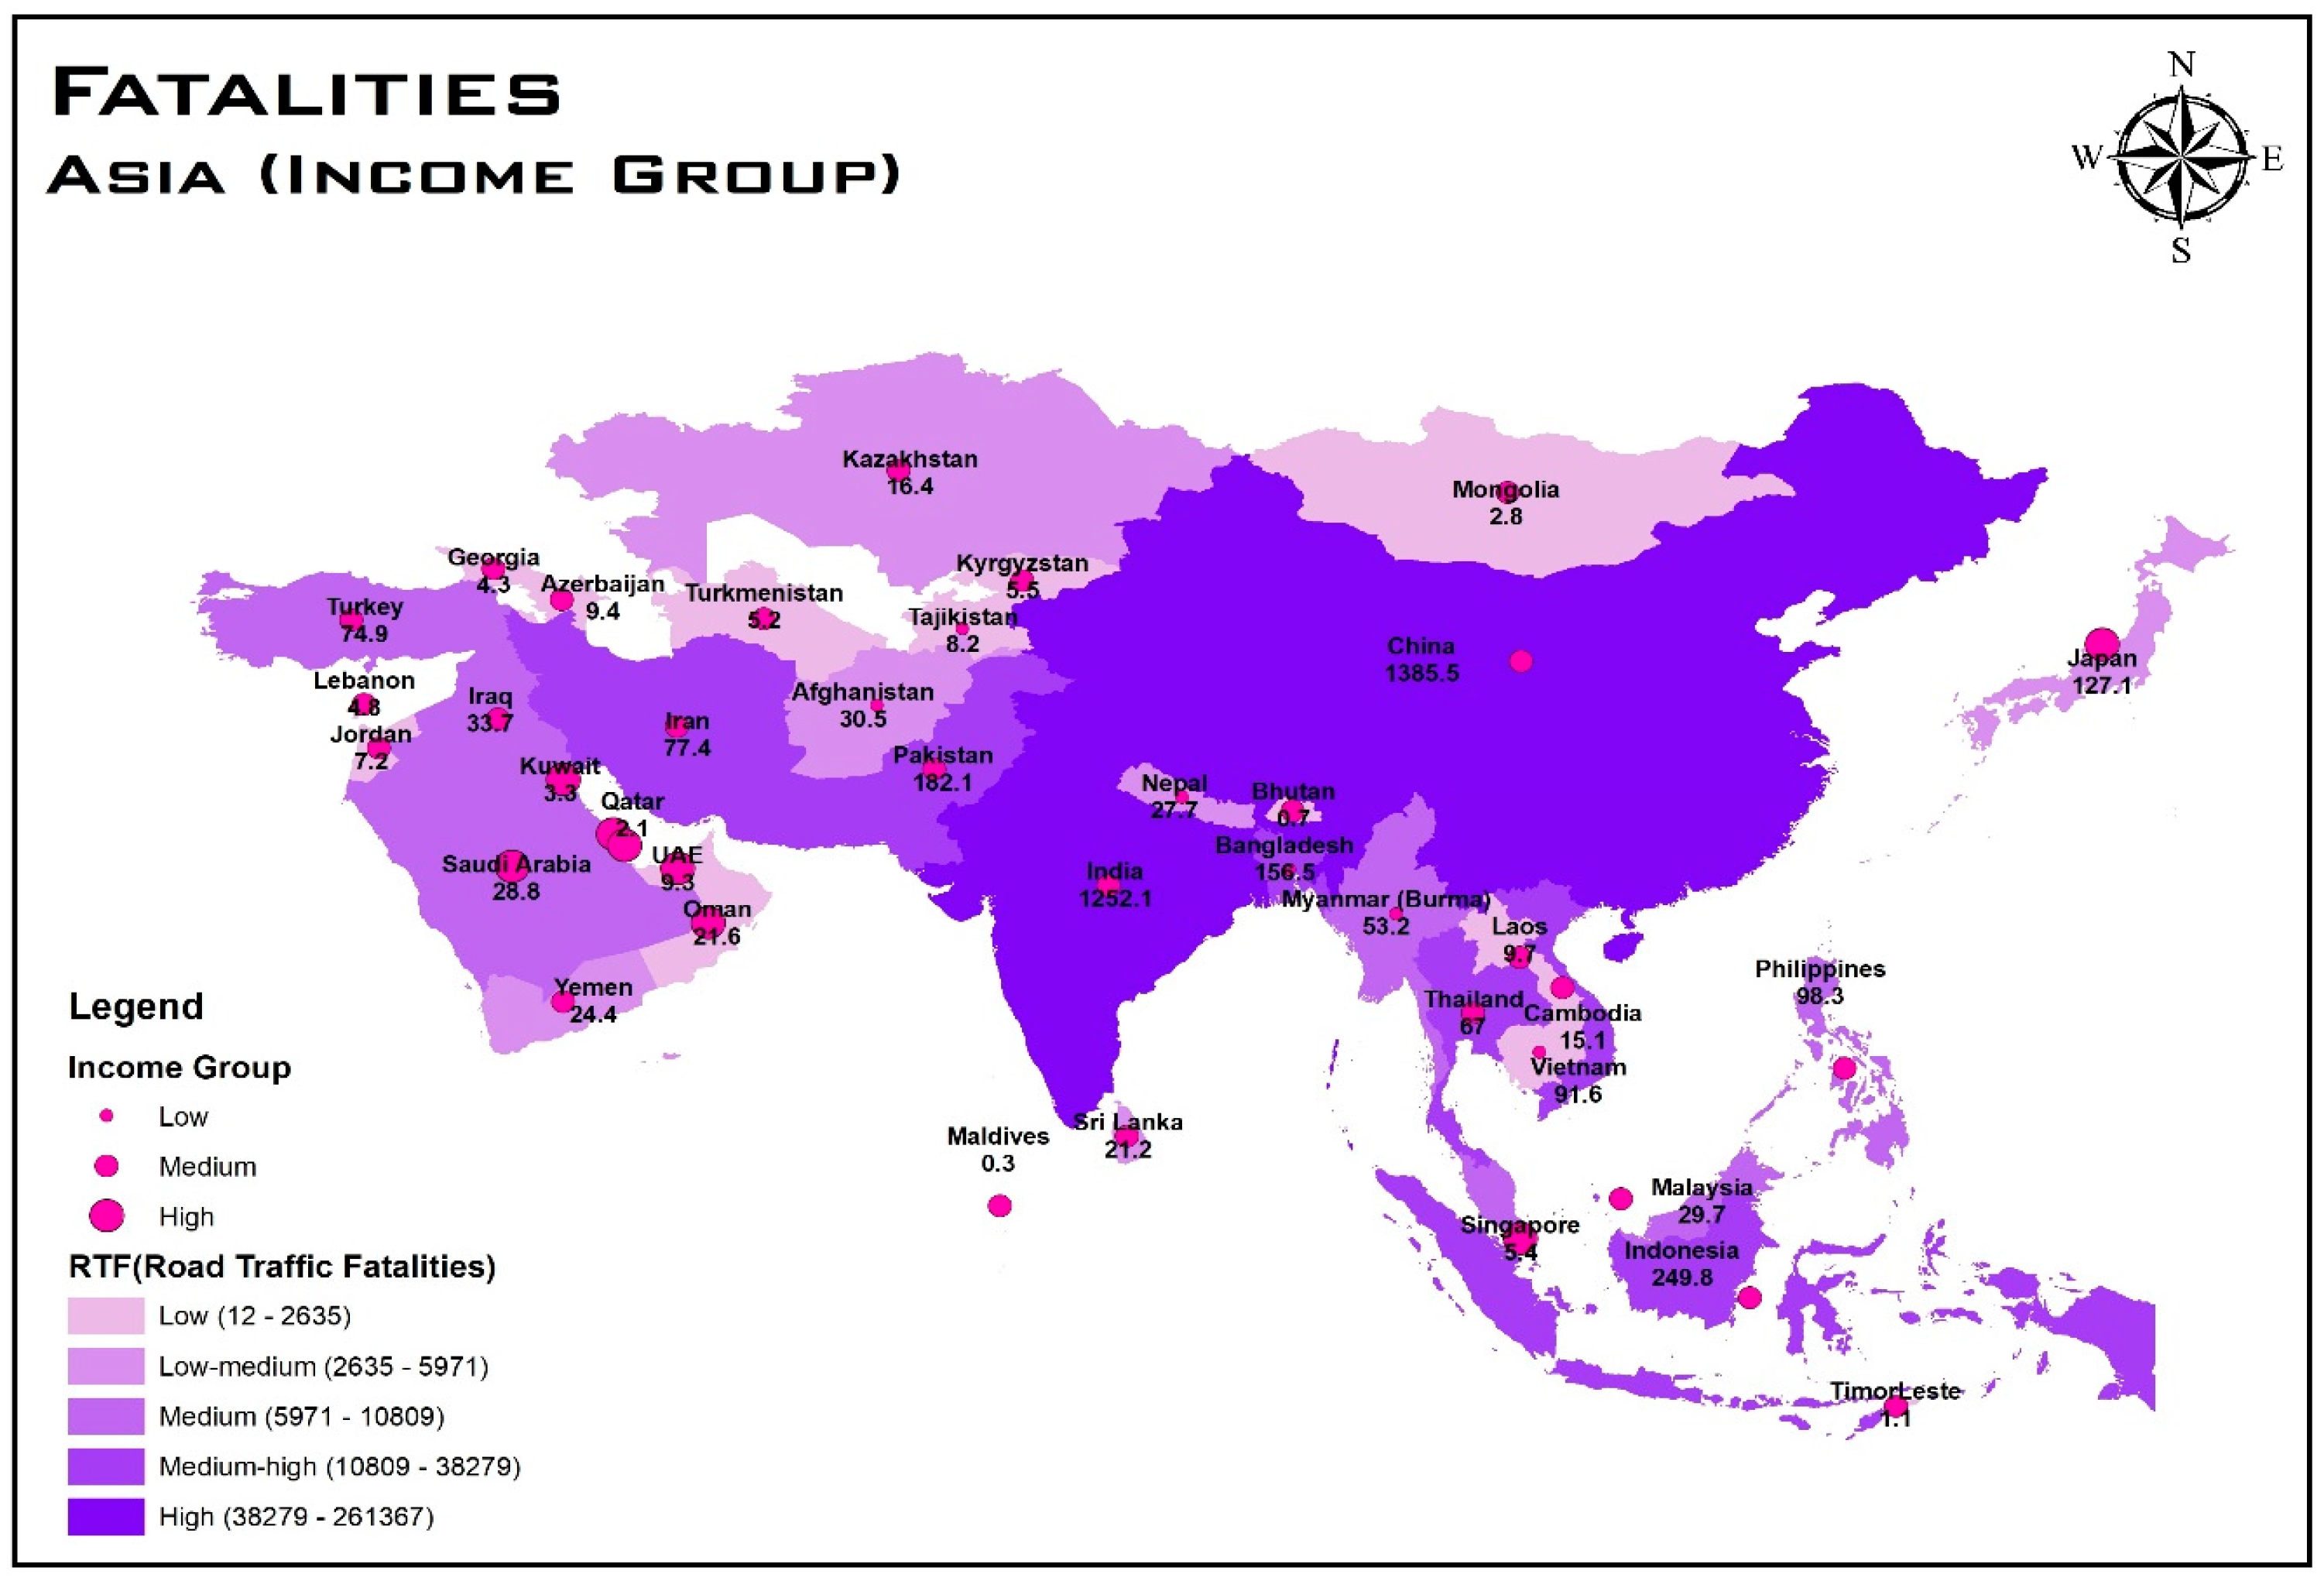
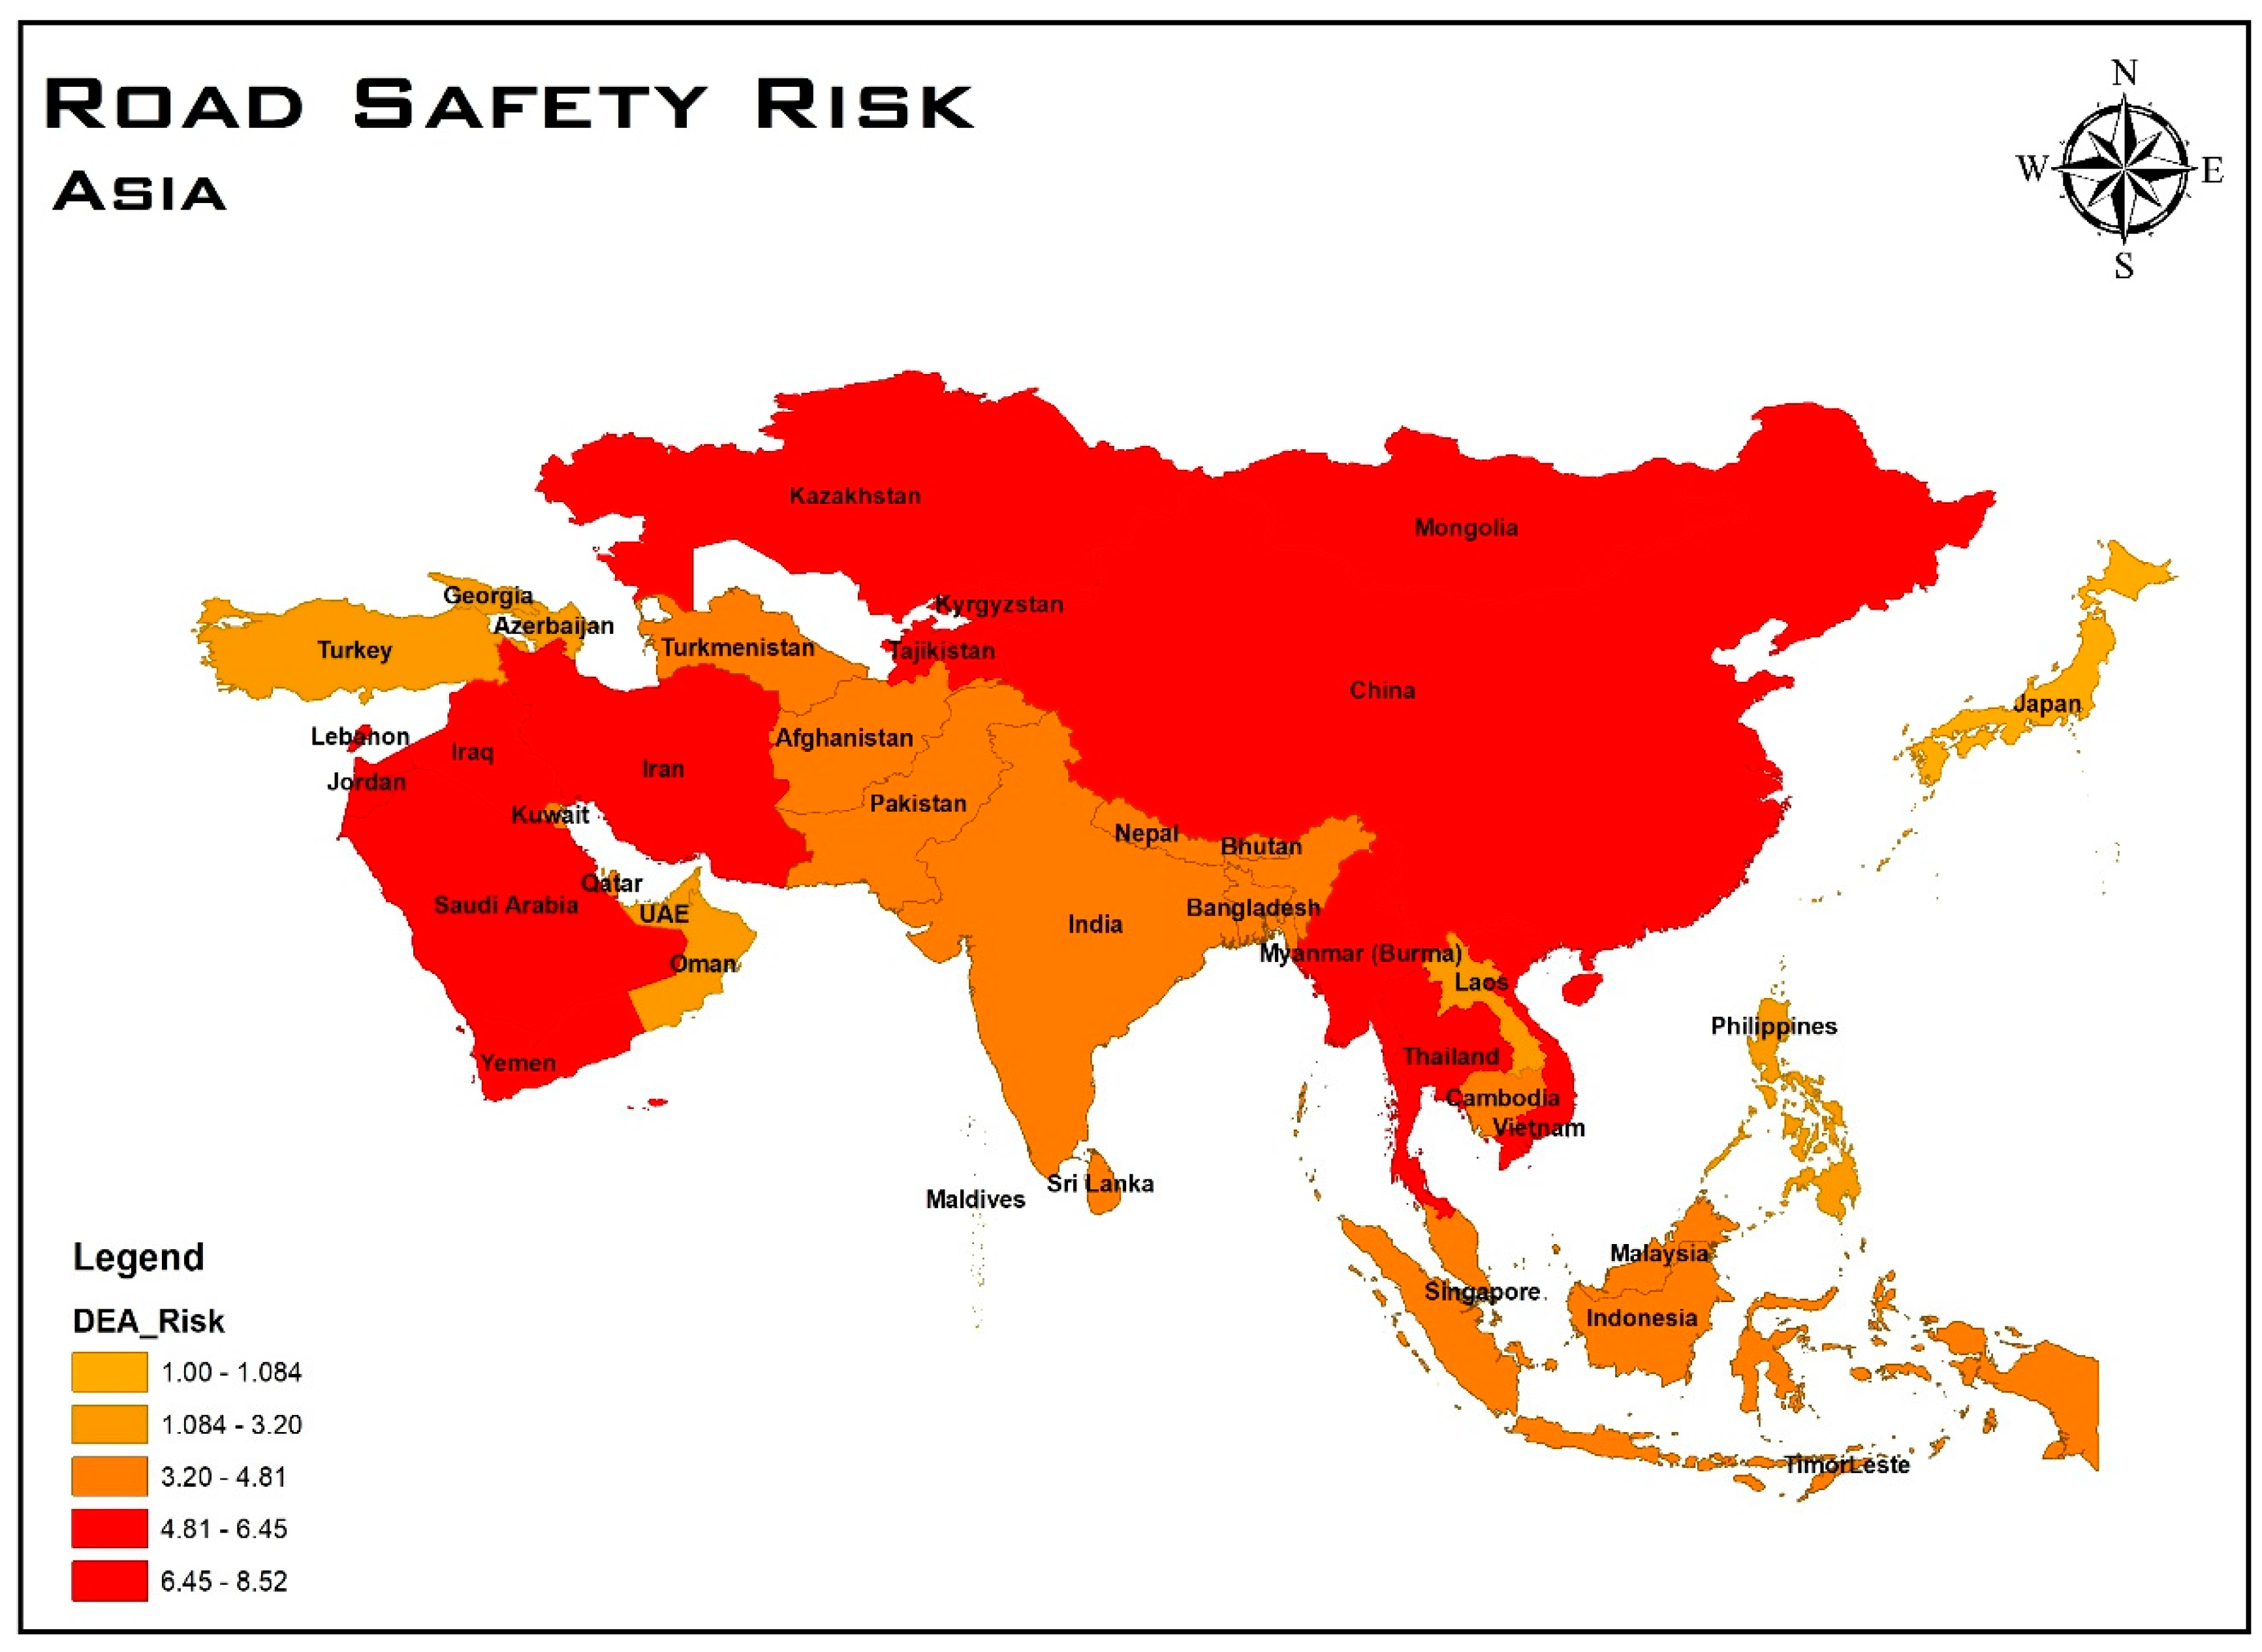
4.1. Study Area
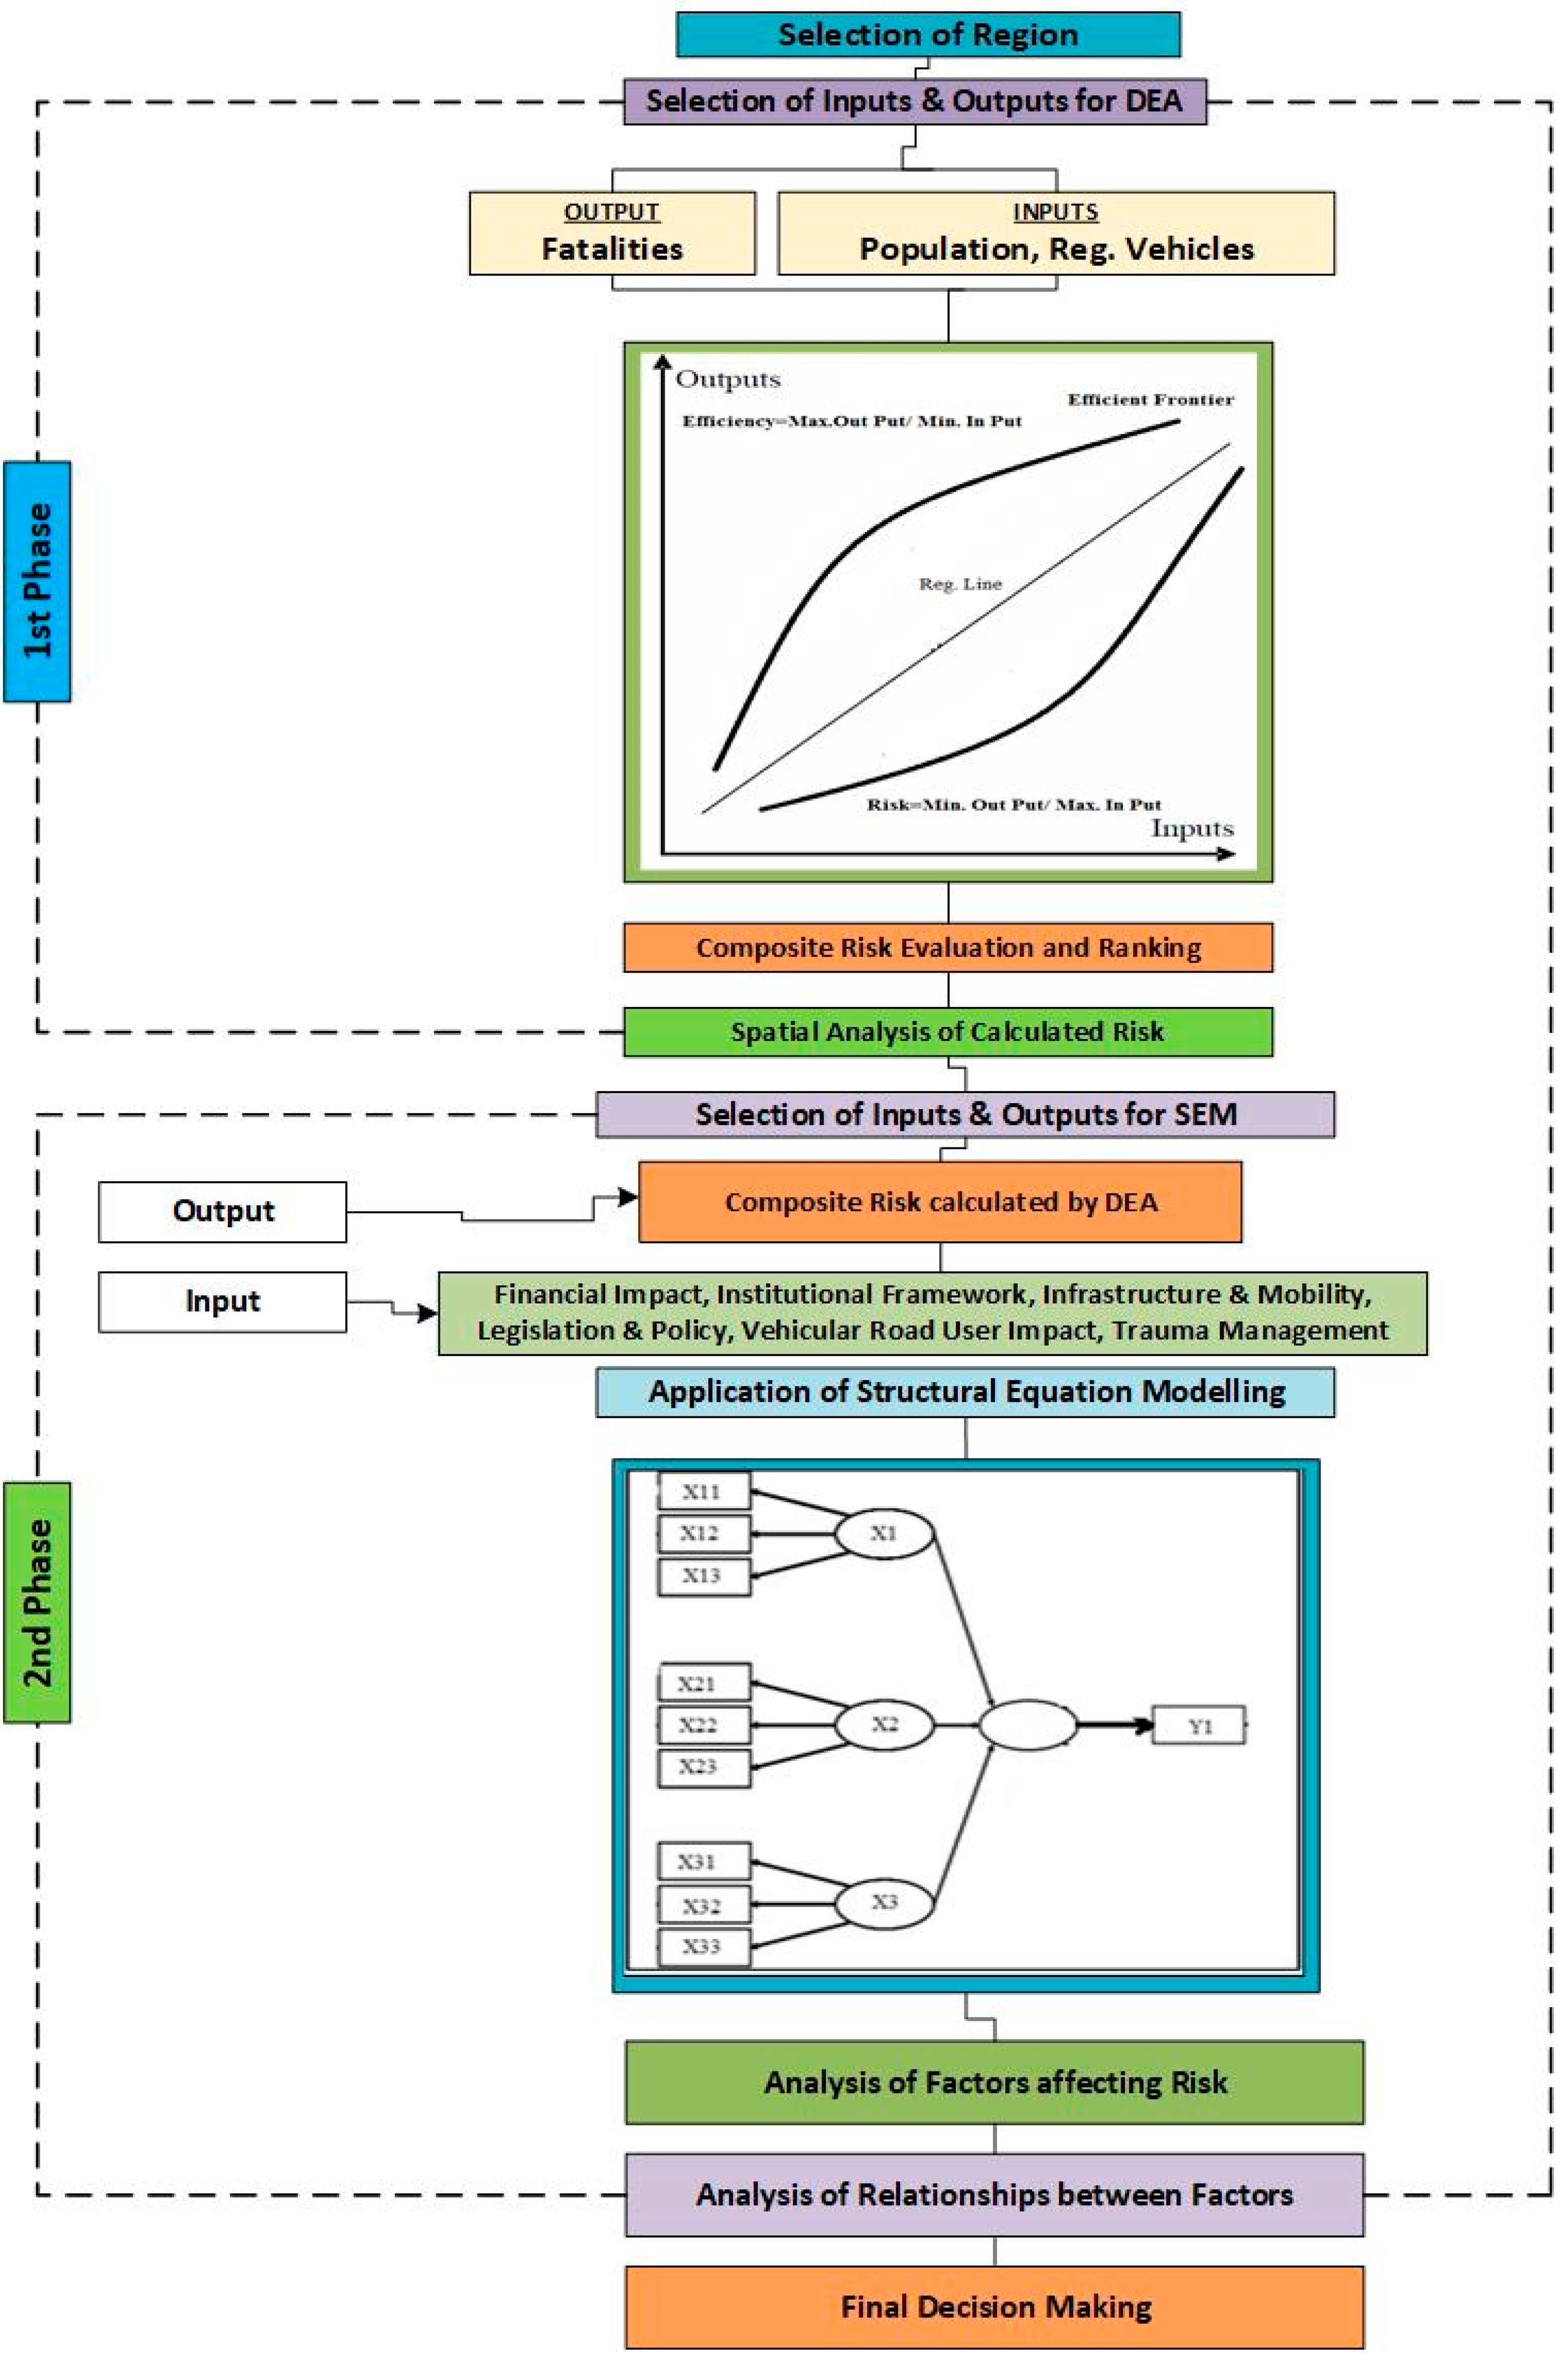
4.2. Methodology
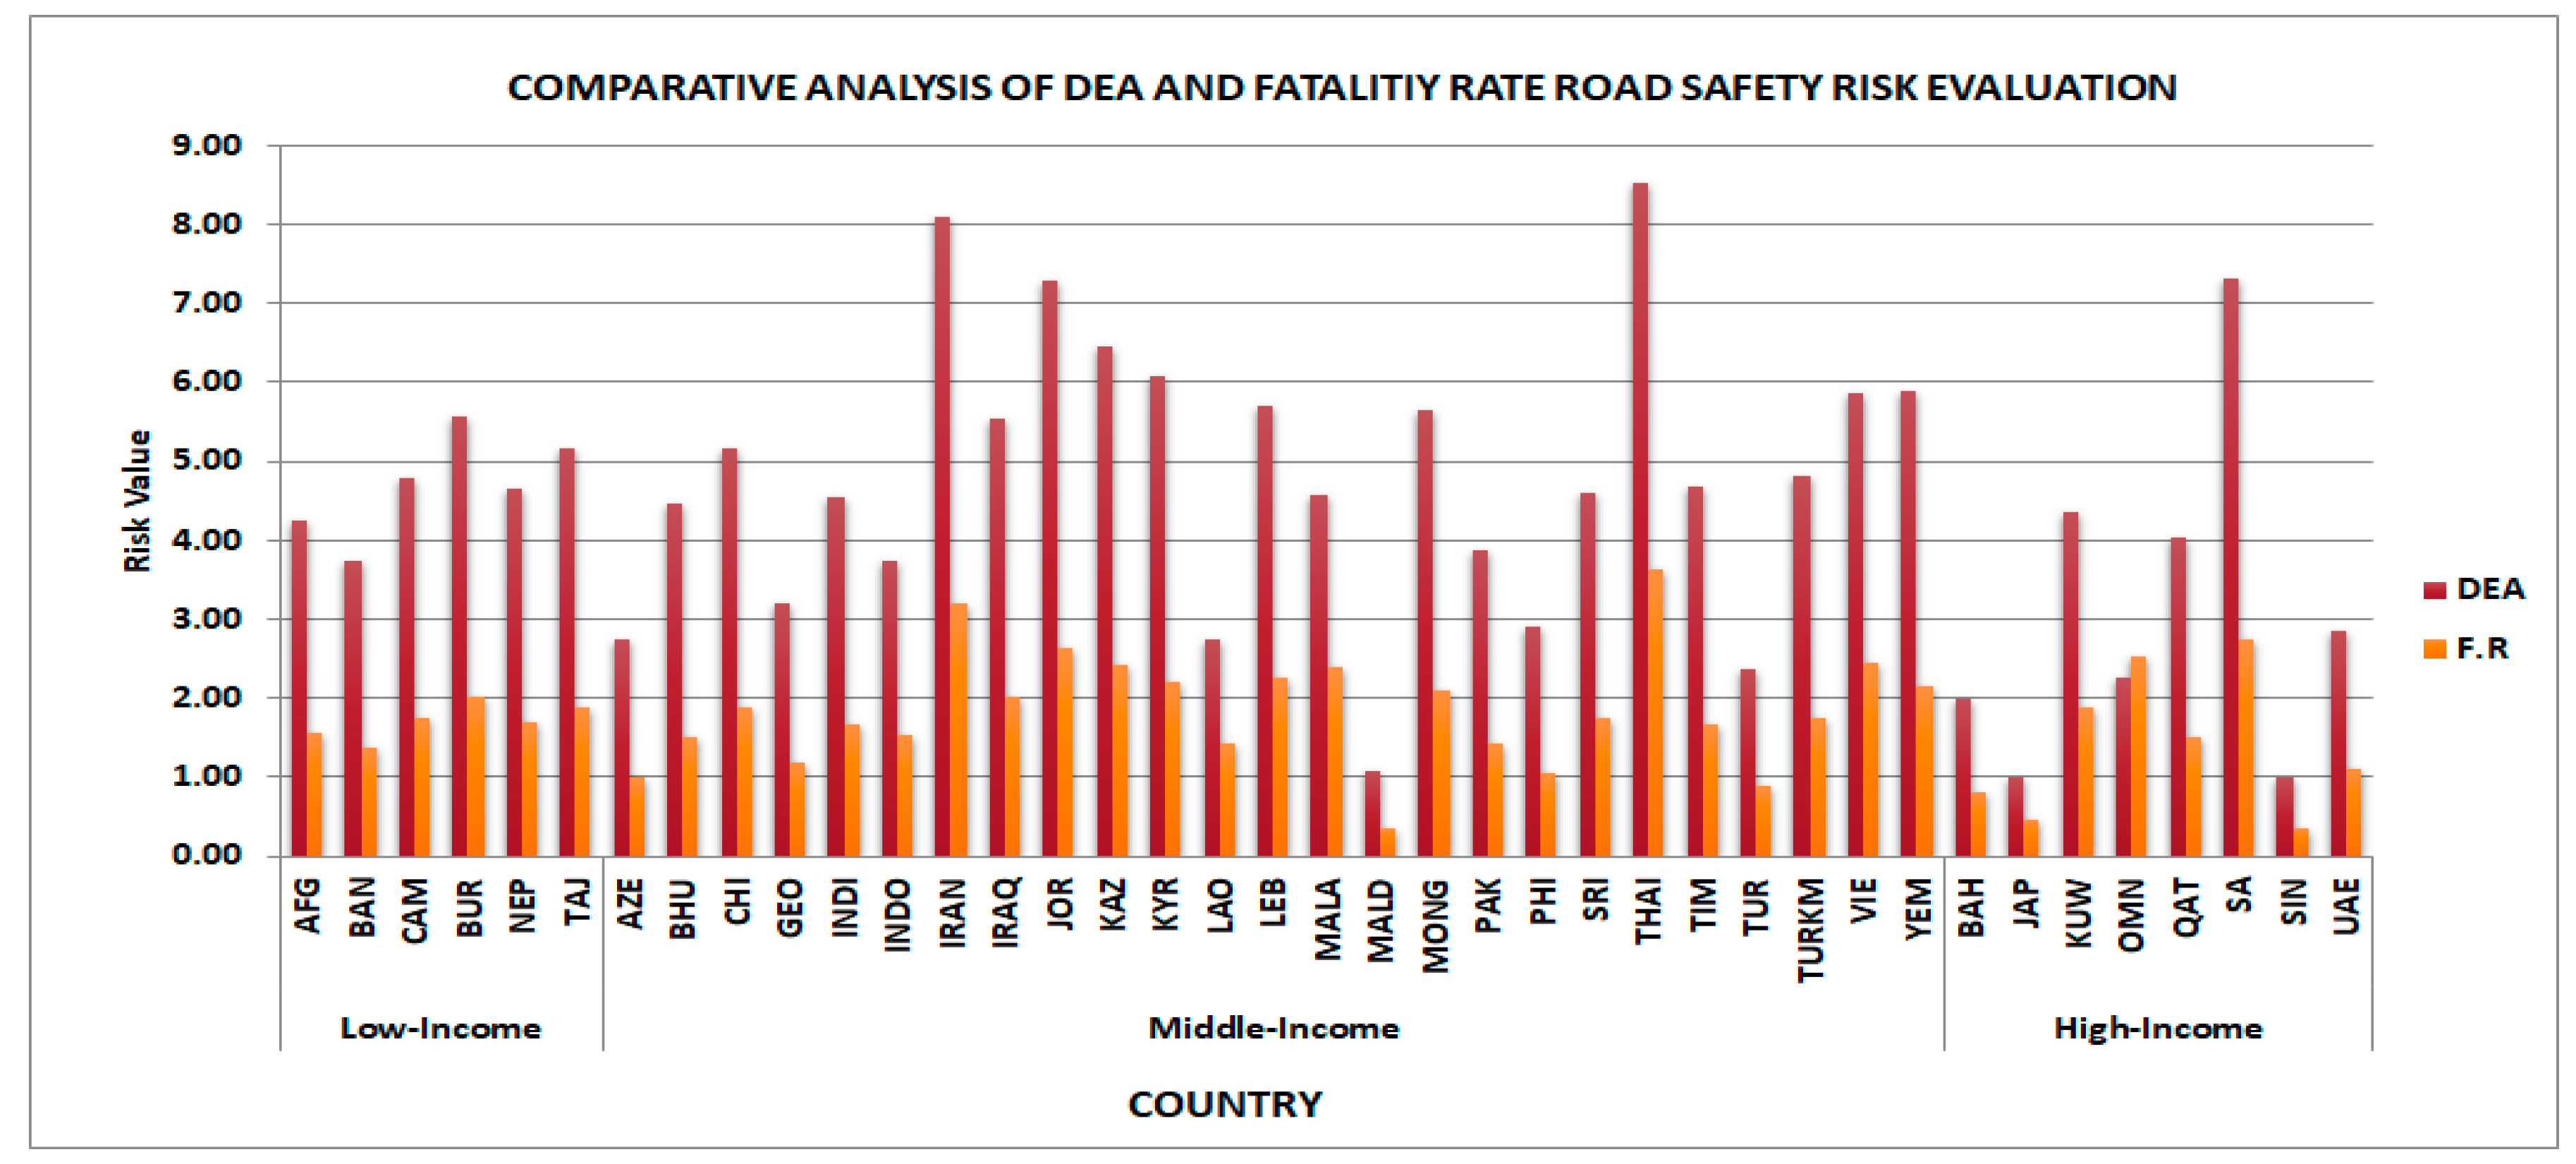
4.2.1. Phase-1-Data Envelopment Analysis-Risk Evaluation
- uk = weight of output k,
- ykj = amount of output k from unit j,
- ul = weight of output l,
- ylj = amount of output l from unit j.
- U1 = weights for 1st output
- V1 = Weights for 1st Input, V2 = weights for 2nd Input.
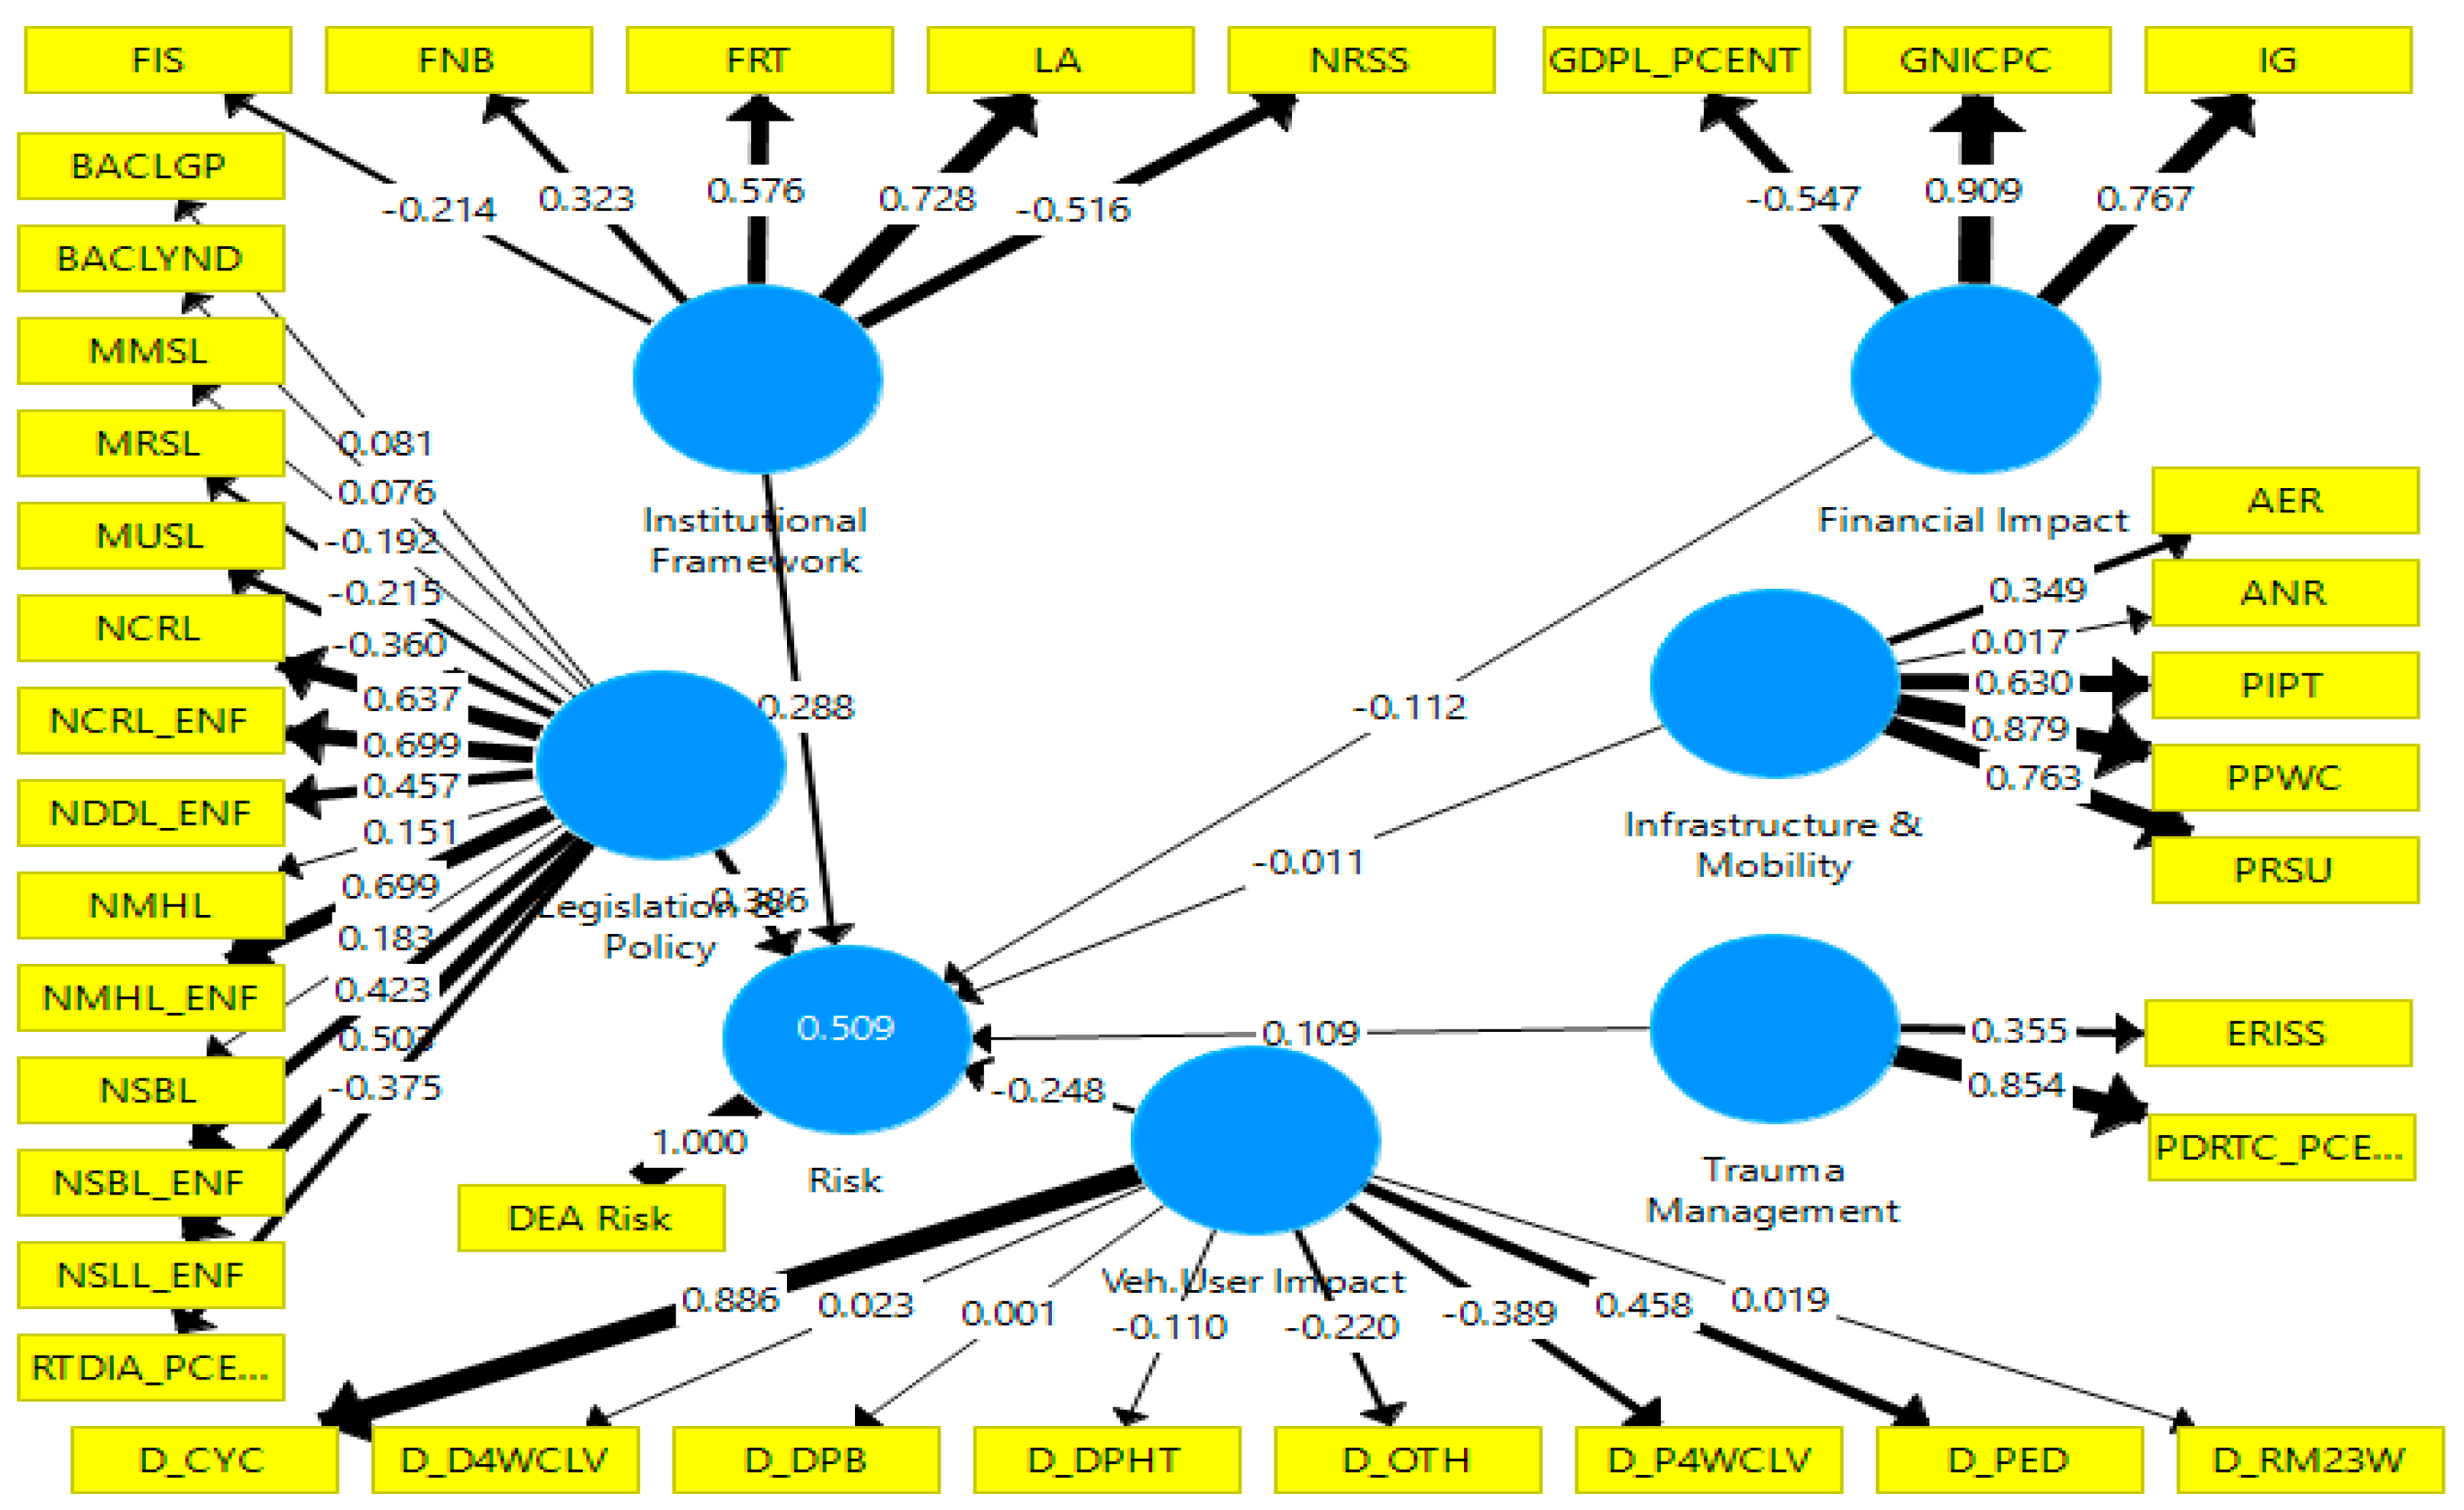
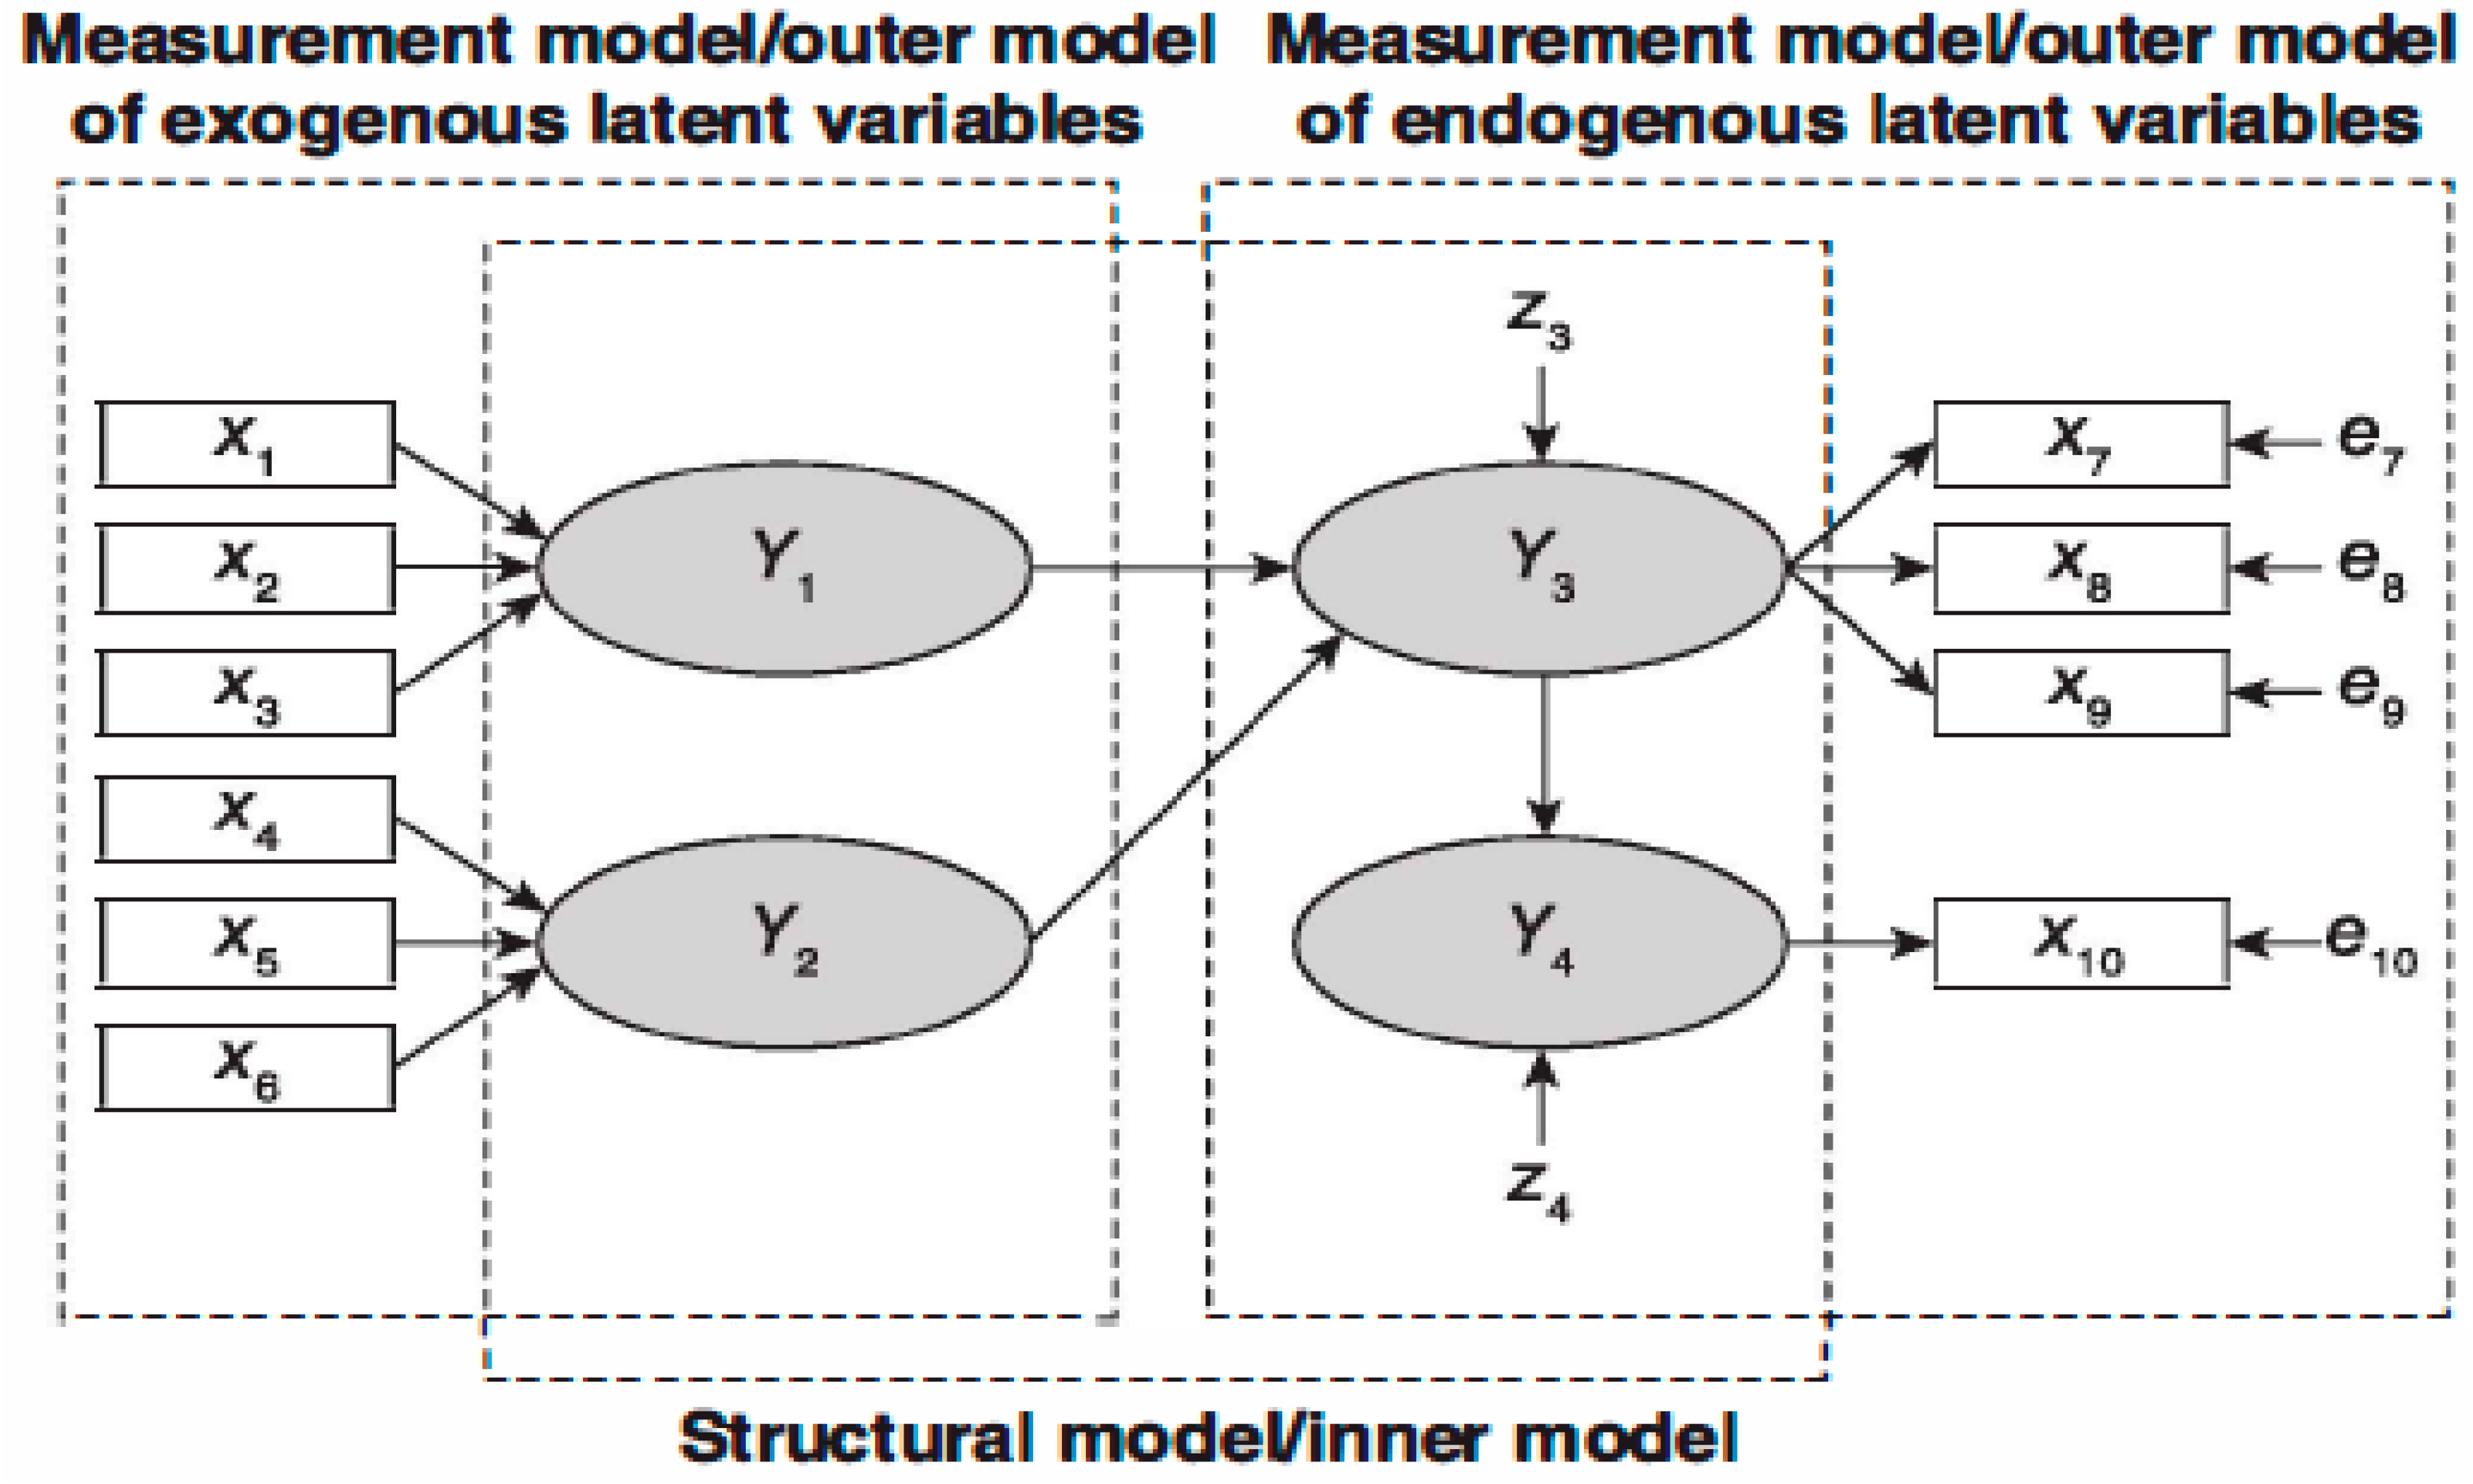
4.2.2. Phase-2 (Structural Equation Modeling)
5. Results and Discussion
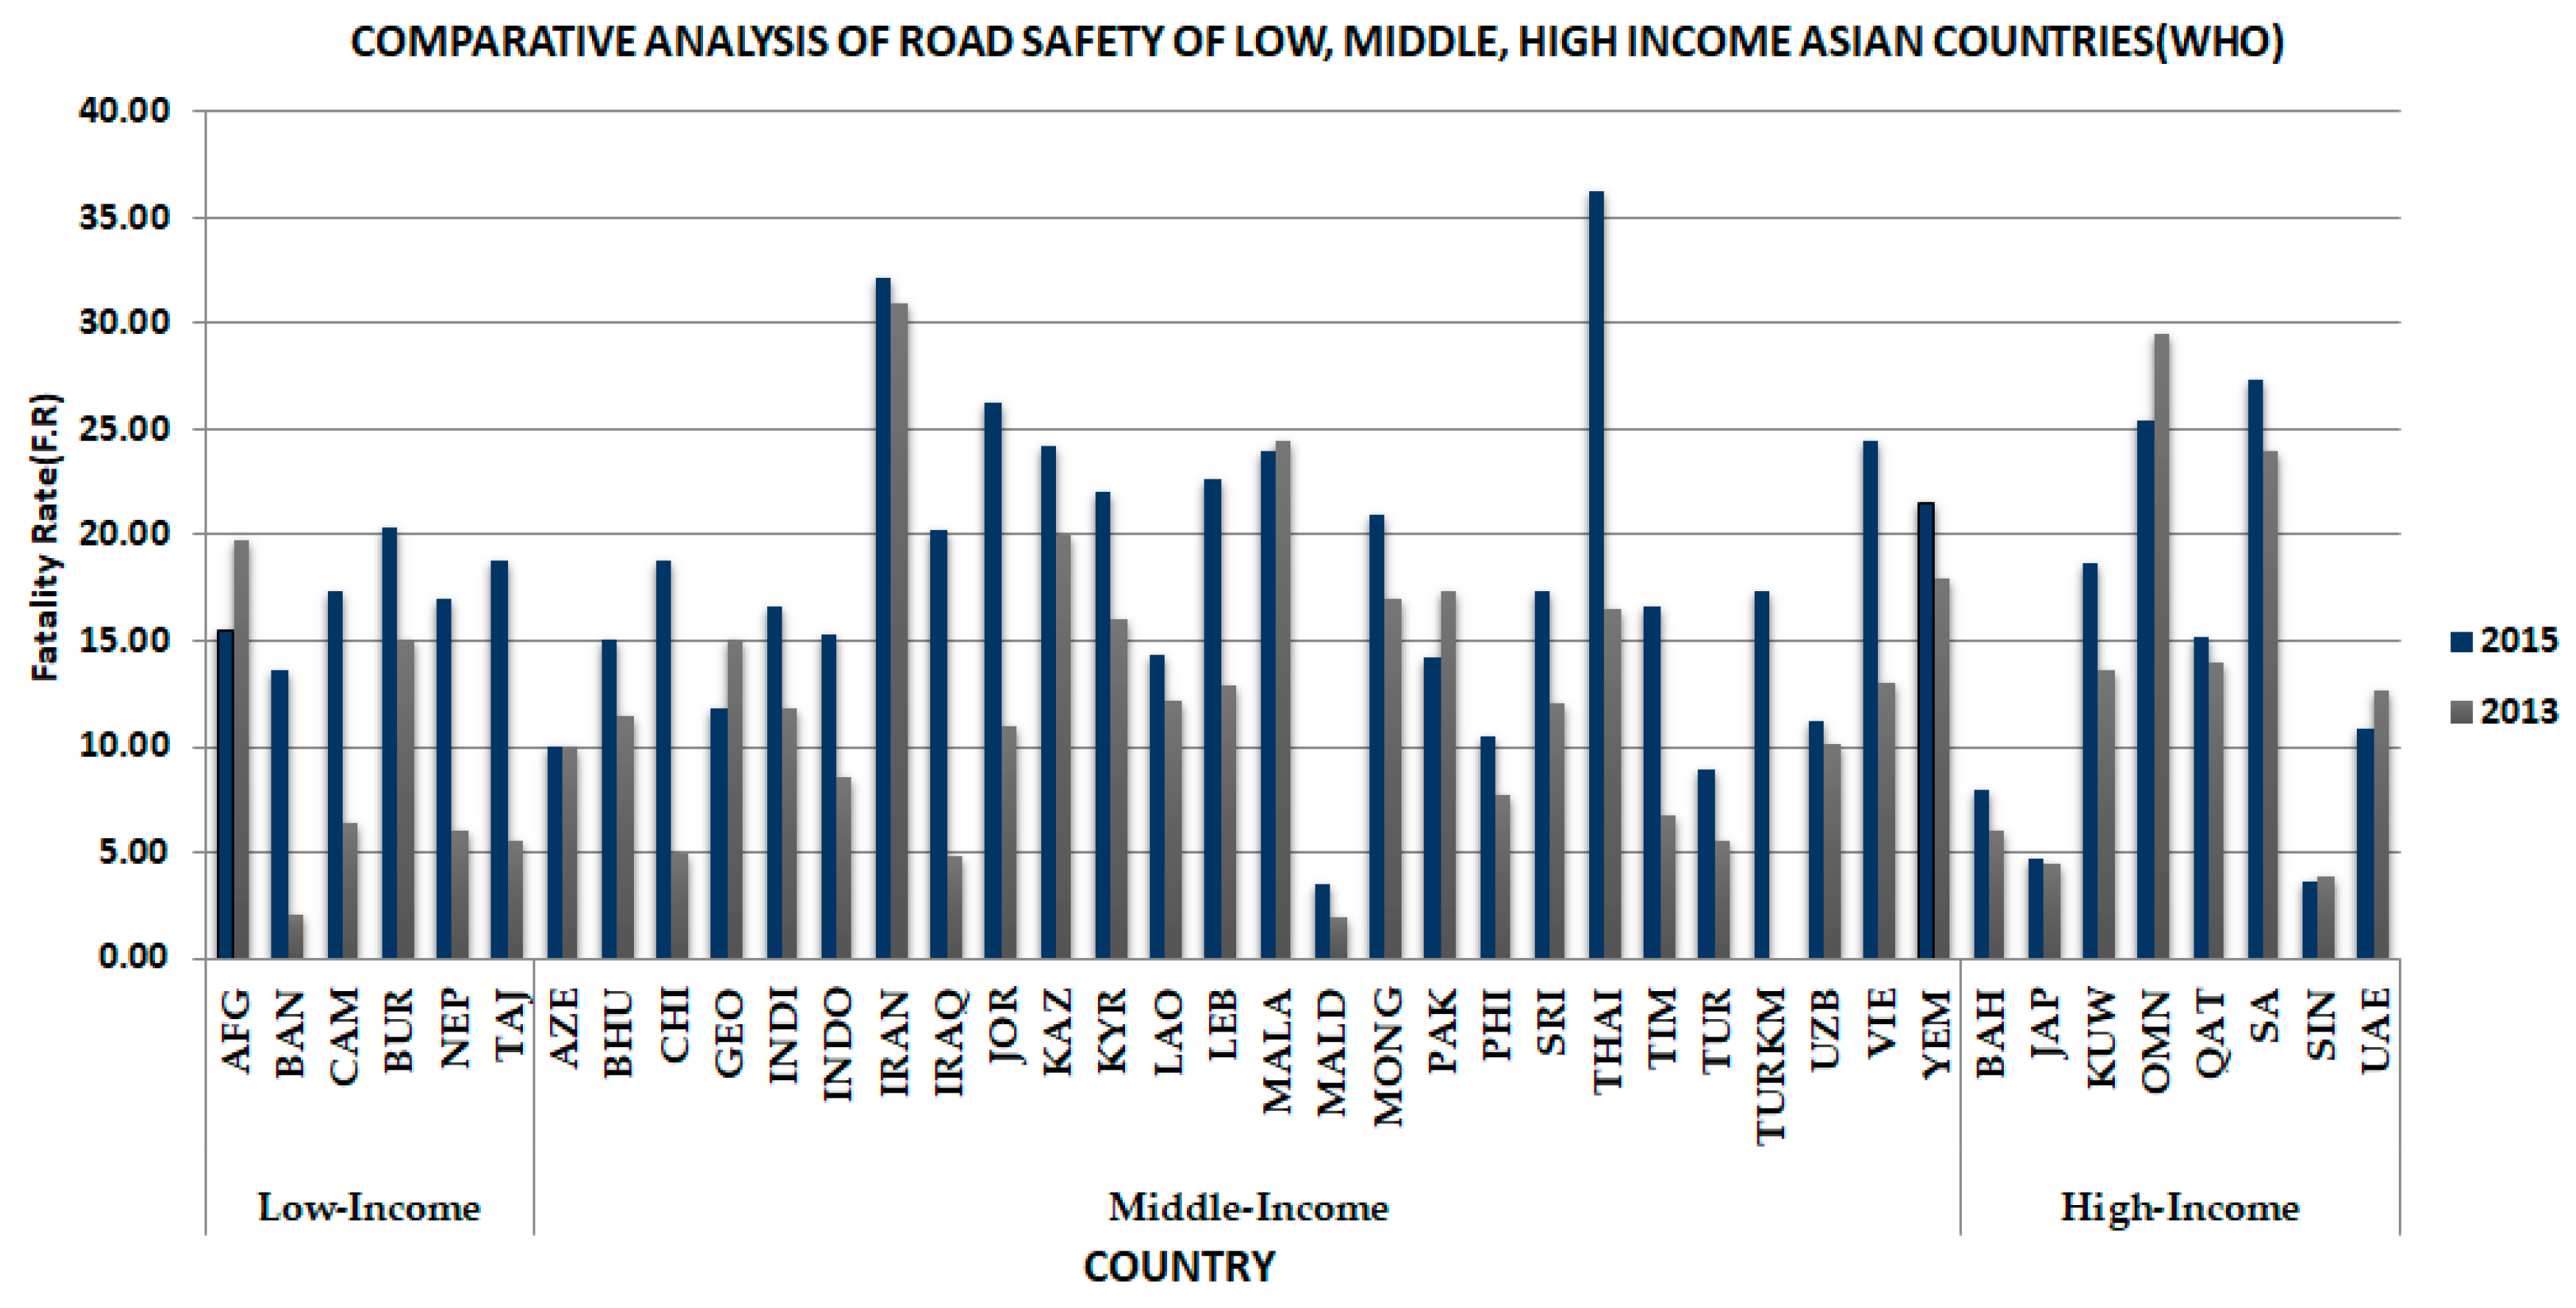
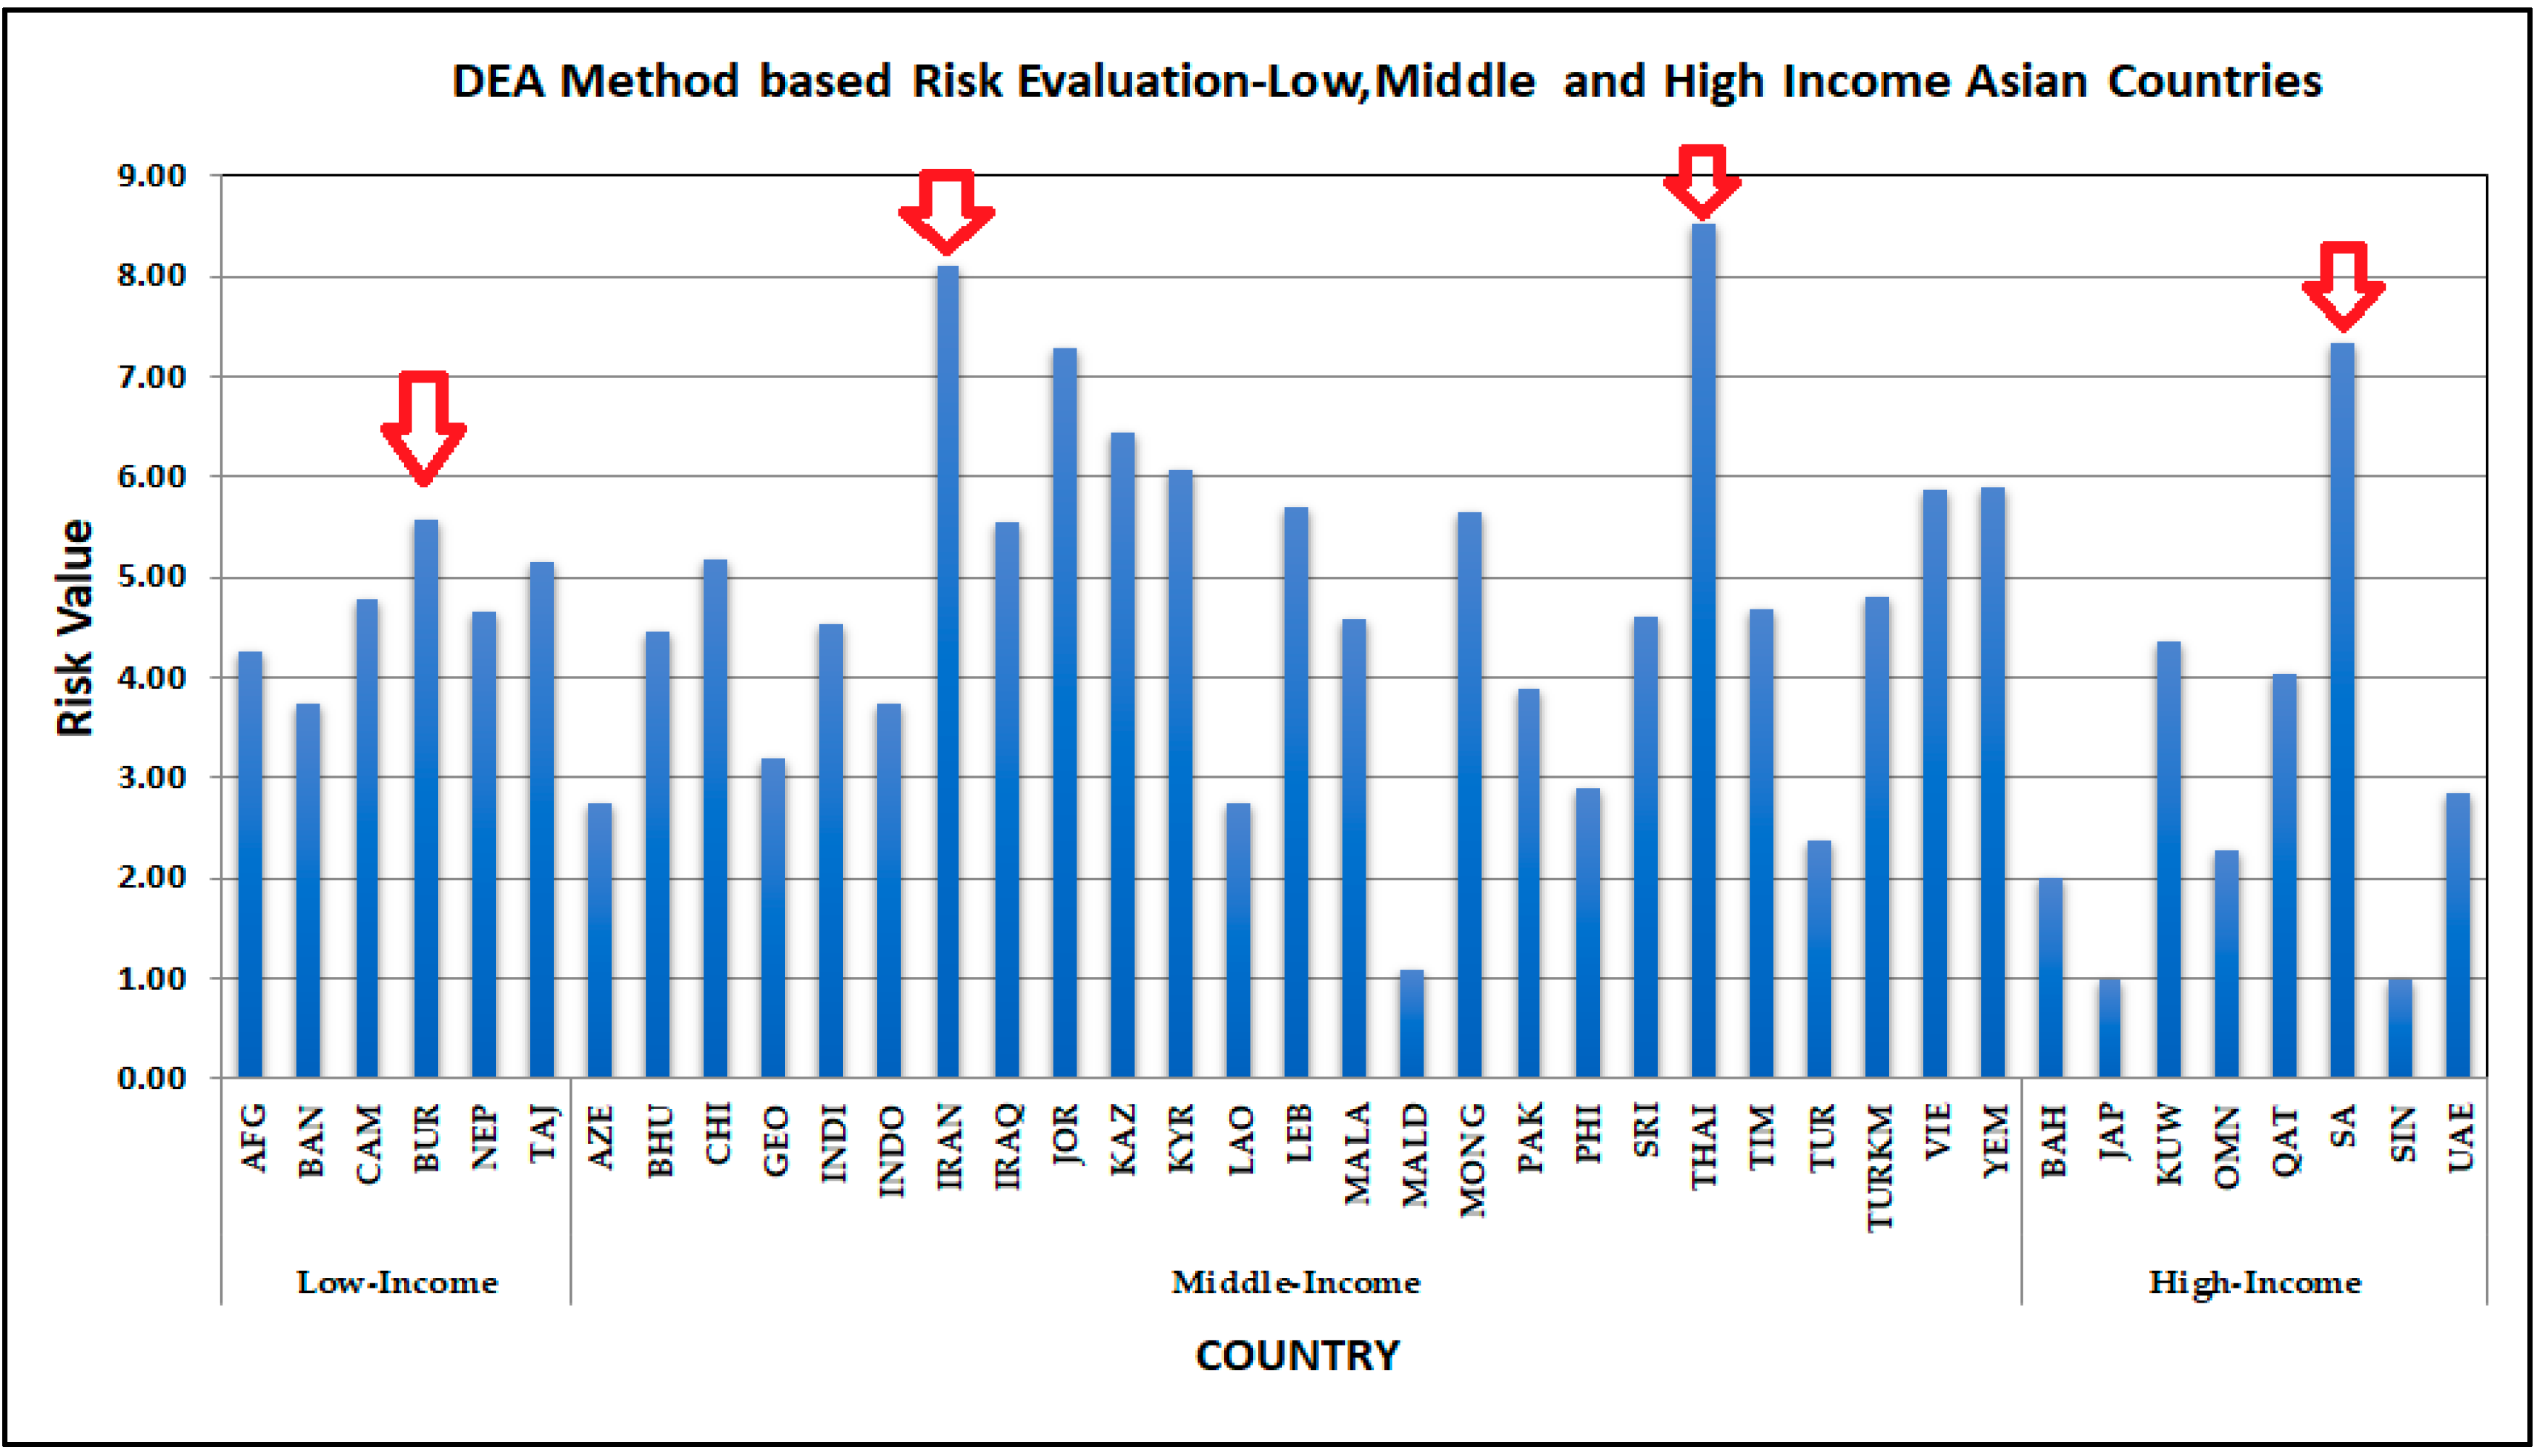
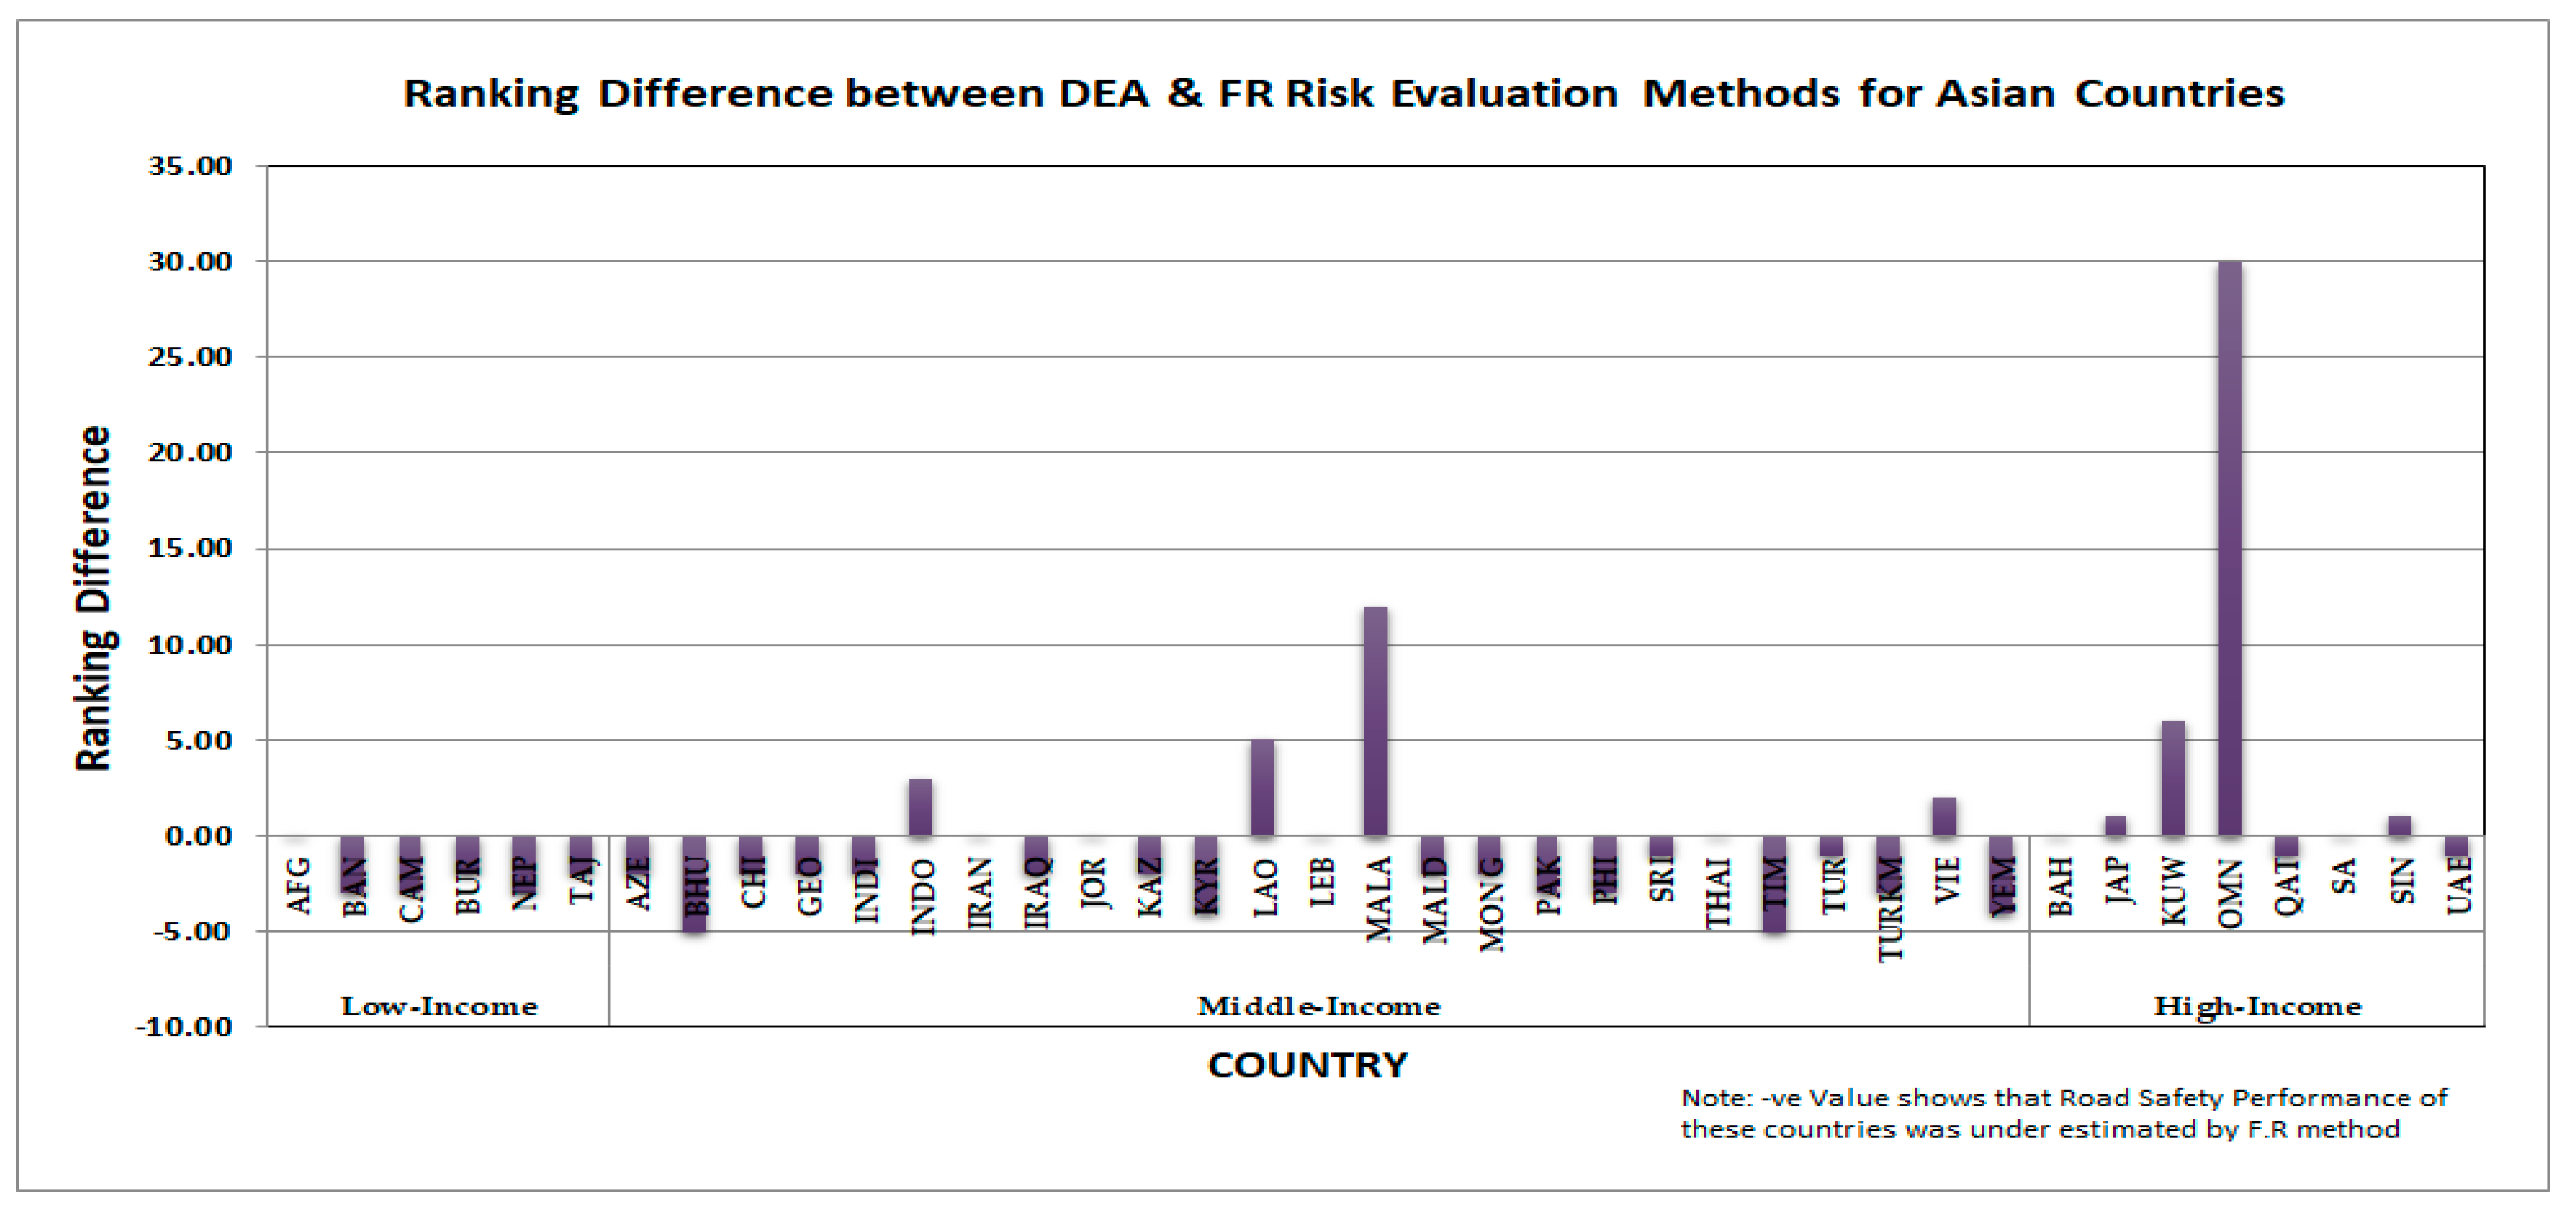
5.1. Risk Analysis
5.1.1. Analysis of Low-Income Asian Countries
- Burma (Myanmar)
- Tajikistan
- Cambodia
Burma (Myanmar):
Tajikistan:
Cambodia:
5.1.2. Analysis of Middle-Income Asian Countries
- Thailand
- Iran
- Jordan
- Kazakhstan
- Yemen
Thailand:
Iran:
Jordan:
Kazakhstan:
Yemen:
5.1.3. Analysis of High-Income Asian Countries
- Saudi Arabia
- Kuwait
- Qatar
Saudi Arabia:
Kuwait:
Qatar:
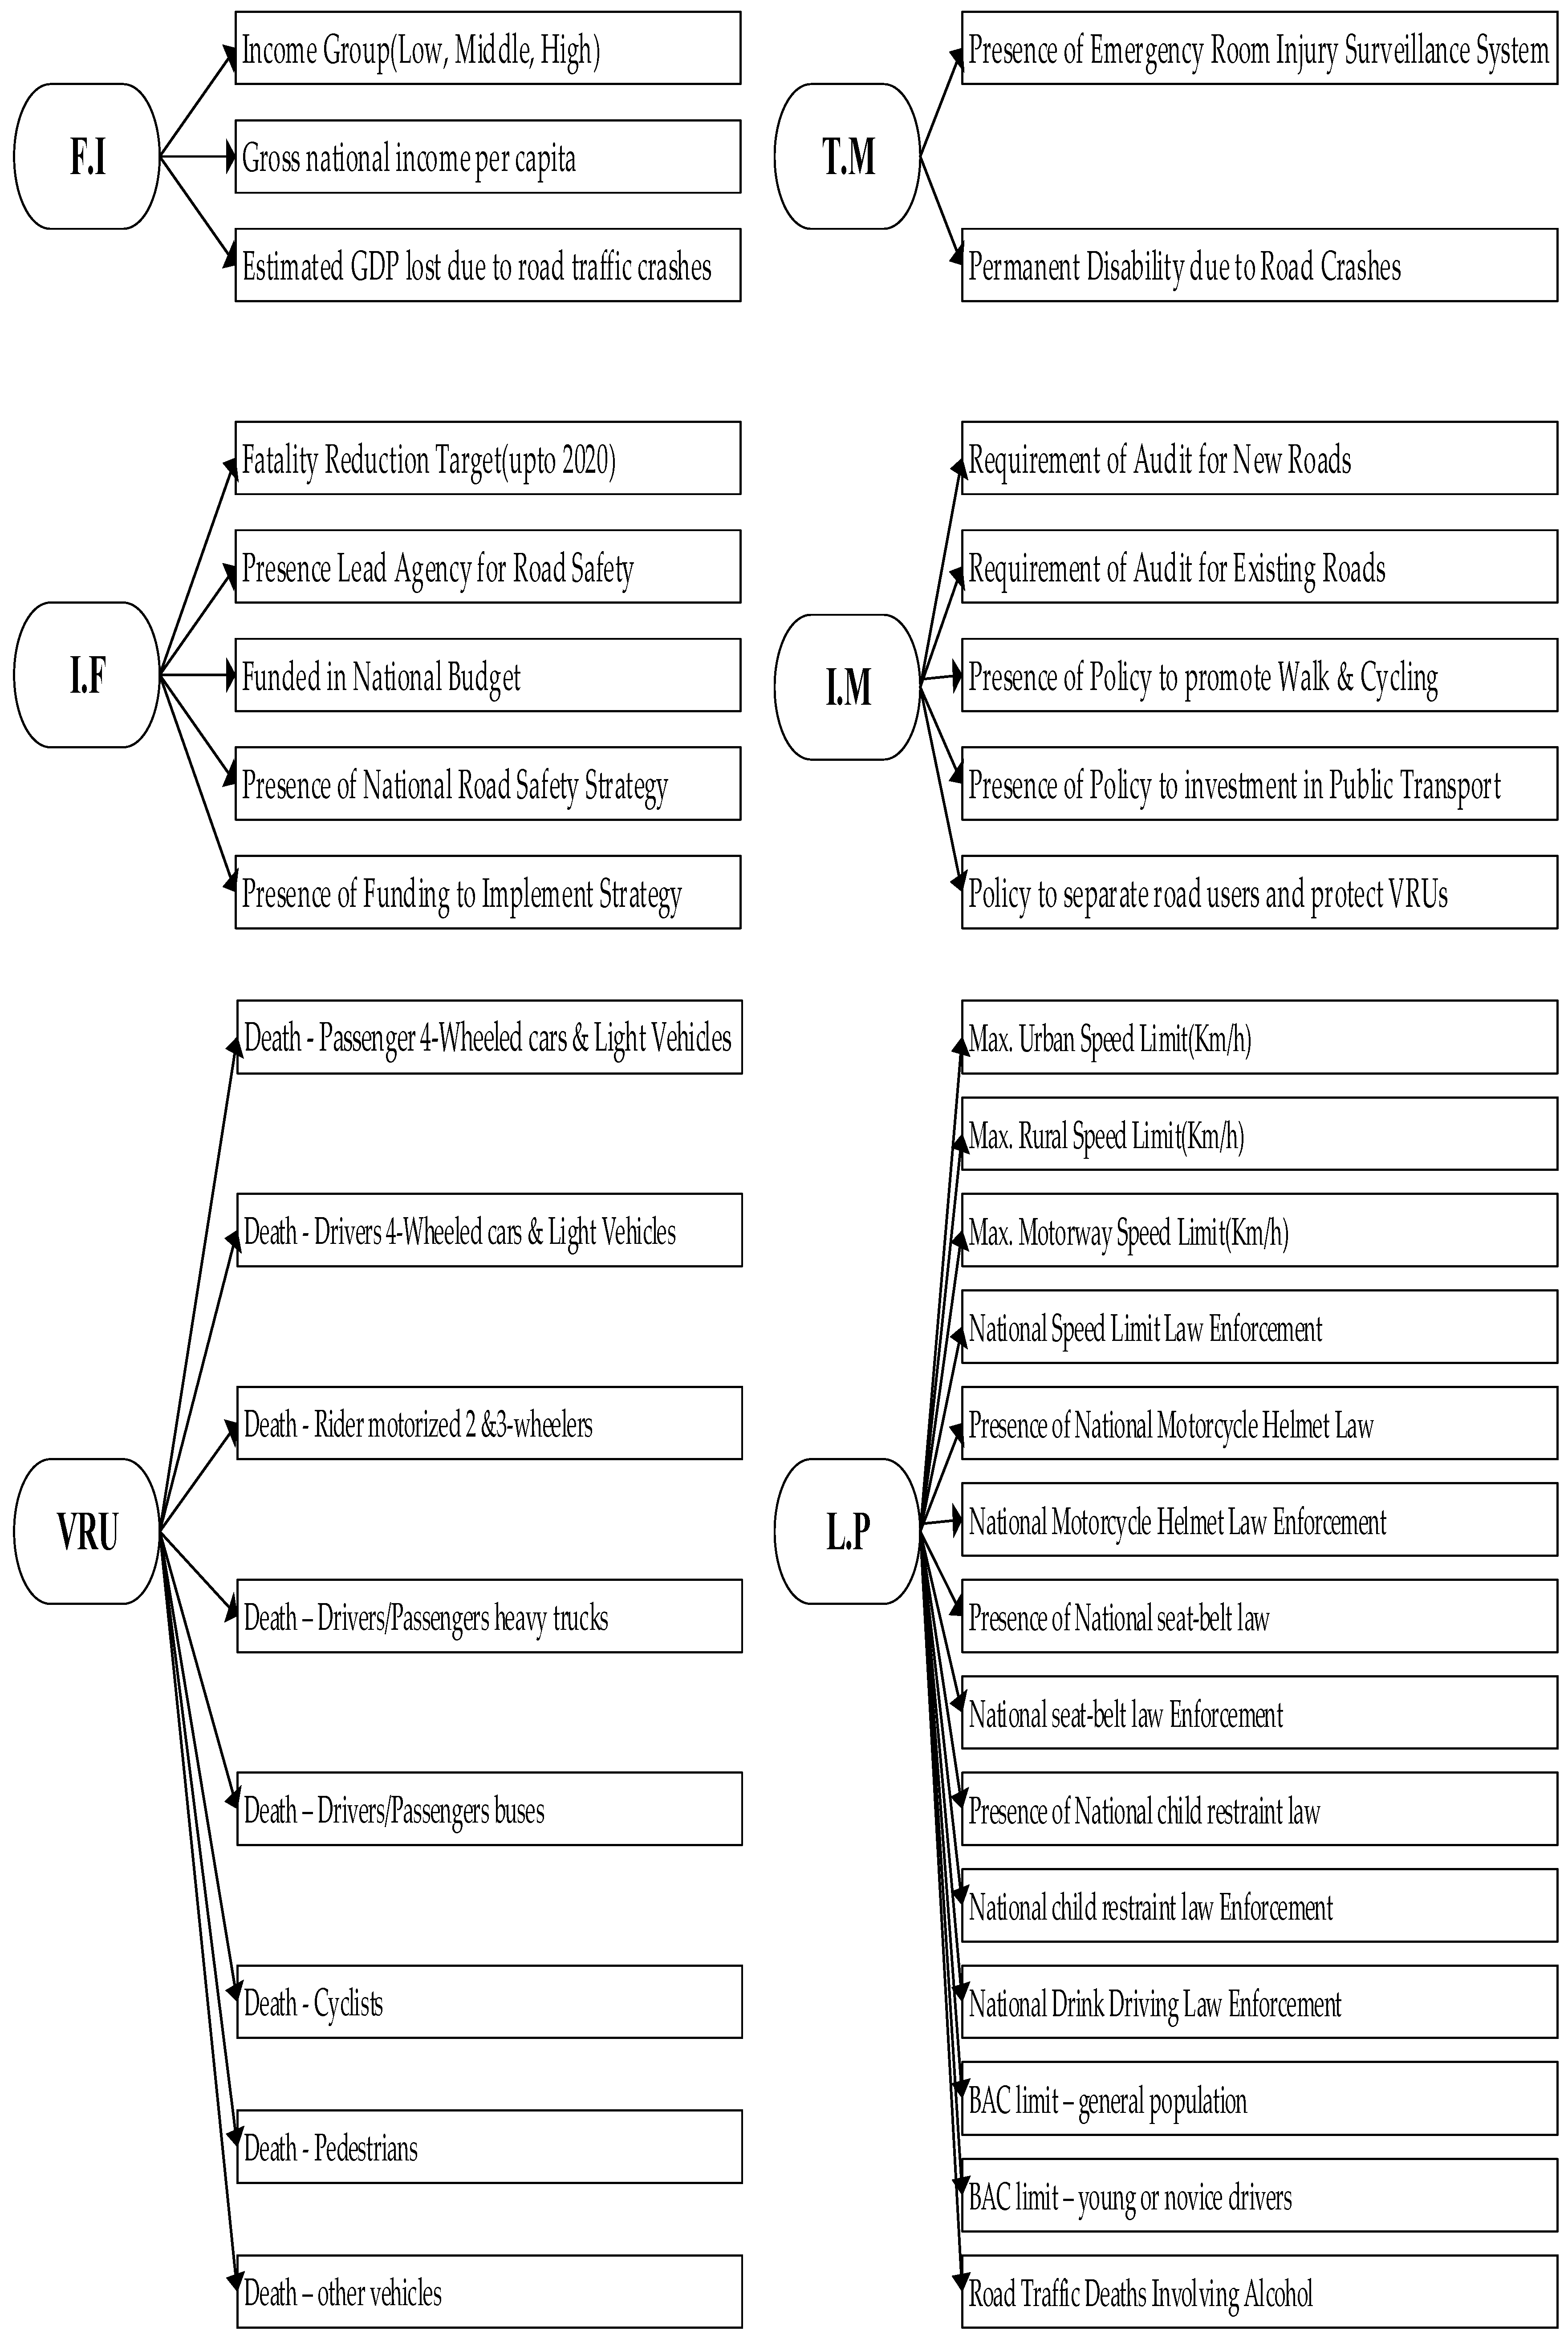
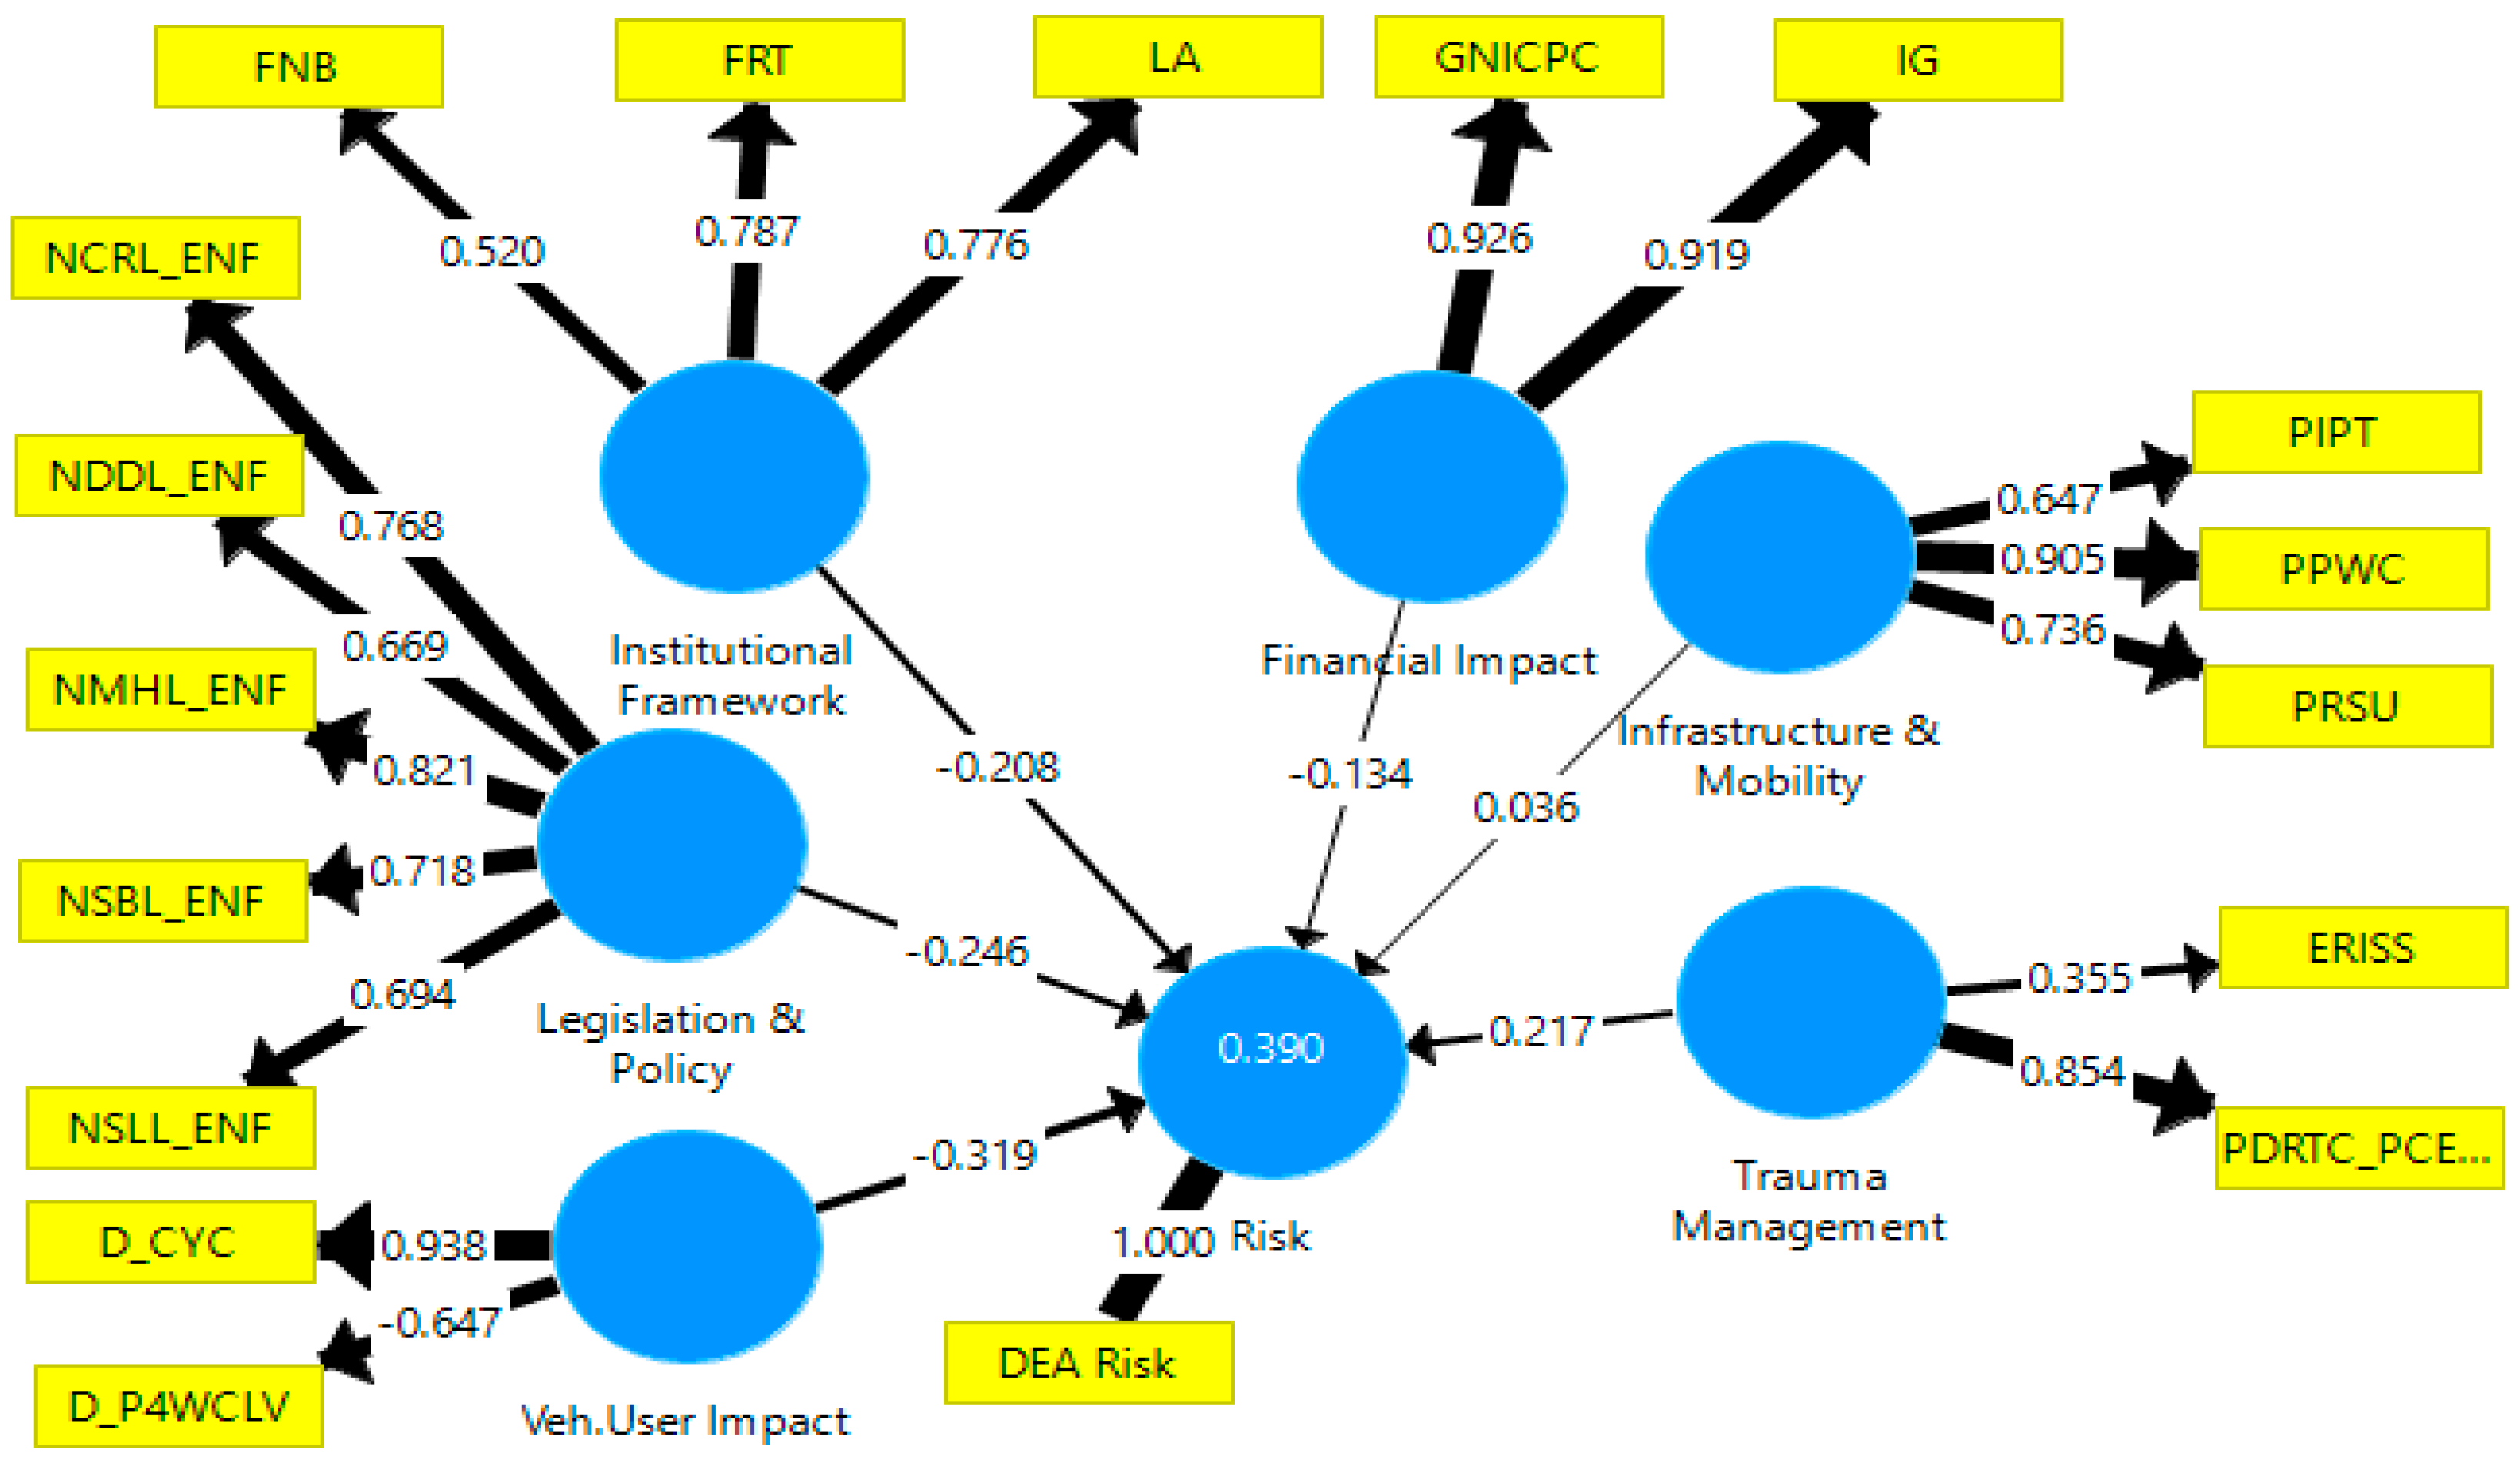
5.2. Analysis of Factors
5.2.1. Measurement Model Evaluation
- Individual Item Reliability and Convergent Validity
- Discriminant Validity
- Structural Relationships
- Overall Model Fitness
5.2.2. Major Problematic Factors
6. Conclusions
Acknowledgments
Author Contributions
Conflicts of Interest
References
- World Health Organization (WHO). World Report on Road Traffic Injury Prevention; World Health Organization: Geneva, Switzerland, 2004. [Google Scholar]
- Nantulya, V.M.; Reich, M.R. The neglected epidemic: Road traffic injuries in developing countries. BMJ 2002, 324, 1139–1141. [Google Scholar] [CrossRef] [PubMed]
- World Health Organization (WHO). Global Status Report on Road Safety 2015; World Health Organization: Geneva, Switzerland, 2015. [Google Scholar]
- Kopits, E.; Cropper, M. Traffic Fatalities and Economic Growth; Policy Research Working Paper No. 3035; World Bank: Washington, DC, USA, 2003. [Google Scholar]
- Murray, C.J.; Lopez, A.D. Mortality by cause for eight regions of the world: Global Burden of Disease Study. Lancet 1997, 349, 1269–1276. [Google Scholar] [CrossRef]
- World Health Organization (WHO). Good Governance—The Case of Road Safety. Available online: http://www.who.int/healthpromotion/conferences/9gchp/good-governance-road-safety/en/ (accessed on 15 April 2017).
- Montazeri, A. Road-traffic-related mortality in Iran: A descriptive study. Public Health 2004, 118, 110–113. [Google Scholar] [CrossRef]
- Norman, L.G.; Organization, W.H. Road Traffic Accidents: Epidemiology, Control, and Prevention; Public Health Papers No. 12; World Health Organization: Geneva, Switzerland, 1962. [Google Scholar]
- Lajunen, T. Personality and accident liability: Are extraversion, neuroticism and psychoticism related to traffic and occupational fatalities? Personal. Individ. Differ. 2001, 31, 1365–1373. [Google Scholar] [CrossRef]
- Petridou, E.; Skalkidou, A.; Ioannou, N.; Trichopoulos, D.; Police, H.R.T. Fatalities from non-use of seat belts and helmets in Greece: A nationwide appraisal. Accid. Anal. Prev. 1998, 30, 87–91. [Google Scholar] [CrossRef]
- Vahdati, S.S.; GhafarZad, A.; Rahmani, F.; Panahi, F.; Rad, A.O. Patterns of road traffic accidents in north west of Iran during 2013 New Year Holidays: Complications and casualties. Bull. Emerg. Trauma 2014, 2, 82–85. [Google Scholar]
- Violanti, J.M. Cellular phones and traffic accidents. Public Health 1997, 111, 423–428. [Google Scholar] [CrossRef]
- International Monetary Fund (IMF). World Economic Outlook Database; IMF: Washington, DC, USA, 2014. [Google Scholar]
- International Monetary Fund (IMF). Nominal GDP-Billions of U.S. Dollars; IMF: Washington, DC, USA, 2017. [Google Scholar]
- Al Haji, G. Towards a Road Safety Development Index (RSDI): Development of An International Index to Measure Road Safety Performance; Linköping University Electronic Press: Linköping, Sweden, 2005. [Google Scholar]
- SafetyNet. State of the Art Report on Risk and Exposure Data. Safetynet Deliverable 2.1; Yannis, G.E.A., Ed.; European Commission: Brussels, Belgium, 2005. [Google Scholar]
- European Transport Safety Council (ETSC). Transport Safety Performance Indicators; European Transport Safety Council: Brussels, Belgium, 2001. [Google Scholar]
- Gitelman, V.; Doveh, E.; Hakkert, S. Designing a composite indicator for road safety. Saf. Sci. 2010, 48, 1212–1224. [Google Scholar] [CrossRef]
- Charnes, A.; Cooper, W.W.; Rhodes, E. Measuring the efficiency of decision making units. Eur. J. Oper. Res. 1978, 2, 429–444. [Google Scholar] [CrossRef]
- Shen, Y.; Hermans, E.; Brijs, T.; Wets, G.; Vanhoof, K. Road safety risk evaluation and target setting using data envelopment analysis and its extensions. Accid. Anal. Prev. 2012, 48, 430–441. [Google Scholar] [CrossRef] [PubMed]
- Hermans, E.; van den Bossche, F.; Wets, G. Combining road safety information in a performance index. Accid. Anal. Prev. 2008, 40, 1337–1344. [Google Scholar] [CrossRef] [PubMed]
- Hermans, E.; Brijs, T.; Wets, G.; Vanhoof, K. Benchmarking road safety: Lessons to learn from a data envelopment analysis. Accid. Anal. Prev. 2009, 41, 174–182. [Google Scholar] [CrossRef] [PubMed]
- Shen, Y.; Hermans, E.; Ruan, D.; Wets, G.; Brijs, T.; Vanhoof, K. A generalized multiple layer data envelopment analysis model for hierarchical structure assessment: A case study in road safety performance evaluation. Expert Syst. Appl. 2011, 38, 15262–15272. [Google Scholar] [CrossRef]
- Alper, D.; Sinuany-Stern, Z.; Shinar, D. Evaluating the efficiency of local municipalities in providing traffic safety using the Data Envelopment Analysis. Accid. Anal. Prev. 2015, 78, 39–50. [Google Scholar] [CrossRef] [PubMed]
- Rosić, M.; Pešić, D.; Kukić, D.; Antić, B.; Božović, M. Method for selection of optimal road safety composite index with examples from DEA and TOPSIS method. Accid. Anal. Prev. 2017, 98, 277–286. [Google Scholar] [CrossRef] [PubMed]
- Lee, J.-Y.; Chung, J.-H.; Son, B. Analysis of traffic accident size for Korean highway using structural equation models. Accid. Anal. Prev. 2008, 40, 1955–1963. [Google Scholar] [CrossRef] [PubMed]
- Golob, T.F. Structural equation modeling for travel behavior research. Transp. Res. Part B 2003, 37, 1–25. [Google Scholar] [CrossRef]
- Hair, J.F., Jr.; Sarstedt, M.; Hopkins, L.; Kuppelwieser, V.G. Partial least squares structural equation modeling (PLS-SEM) An emerging tool in business research. Eur. Bus. Rev. 2014, 26, 106–121. [Google Scholar] [CrossRef]
- Ringle, C.M.; da Silva, D.; Bido, D.D.S. Modelagem de equações estruturais com utilização do SmartPLS. REMark 2014, 13, 54–71. [Google Scholar]
- Do Nascimento, J.C.H.B.; da Silva Macedo, M.A. Structural Equation Models using Partial Least Squares: An Example of the Application of SmartPLS® in Accounting Research. Rev. Educ. Pesqui. Contab. 2016, 10. [Google Scholar] [CrossRef]
- Lee, L.; Petter, S.; Fayard, D.; Robinson, S. On the use of partial least squares path modeling in accounting research. Int. J. Acc. Inf. Syst. 2011, 12, 305–328. [Google Scholar] [CrossRef]
- Chin, W.W. The partial least squares approach to structural equation modeling. Mod. Methods Bus. Res. 1998, 295, 295–336. [Google Scholar]
- Chin, W.W.; Newsted, P.R. Structural equation modeling analysis with small samples using partial least squares. Stat. Strateg. Small Sample Res. 1999, 1, 307–341. [Google Scholar]
- Garson, D. Partial Least Squares: Regression & Structural Equation Modeling; Statistical Associates Publishing, 2016. Available online: https://www.researchgate.net/publication/318722955_Partial_Least_SquaresRegression_and_Structural_Equation_Models (accessed on 20 February 2017).
- Gye-Soo, K. Partial Least Squares Structural Equation Modeling (PLS-SEM): An application in Customer Satisfaction Research. Int. J. u-e-Serv. Sci. Technol. 2016, 9, 61–68. [Google Scholar] [CrossRef]
- Yun Kyung, B.; Jin Hee, K.; Jin-Hyuk, C. Traffic Accident Analysis for Highway on Weather Condition and Time. In Proceedings of the International Conference on Transport, Environment and Civil Engineering (ICTECE’2012), Kuala Lumpur, Malaysia, 25–26 August 2012. [Google Scholar]
- Scott-Parker, B.; Watson, B.; King, M.J.; Hyde, M.K. A further exploration of sensation seeking propensity, reward sensitivity, depression, anxiety, and the risky behaviour of young novice drivers in a structural equation model. Accid. Anal. Prev. 2013, 50, 465–471. [Google Scholar] [CrossRef] [PubMed] [Green Version]
- Sümer, N. Personality and behavioral predictors of traffic accidents: Testing a contextual mediated model. Accid. Anal. Prev. 2003, 35, 949–964. [Google Scholar] [CrossRef]
- Wu, W.-W. Applying DEA and PLS path modeling for efficiency evaluation. Ann. Tour. Res. 2009, 8, 1228–1237. [Google Scholar]
- Lorcu, F.; Bolat, B.A. Comparison of Secondary Education Pisa Results in European Member States and Turkey via DEA and SEM. J. WEI Bus. Econ. 2015, 4, 7–17. [Google Scholar]
- Soteriades, A.D.; Stott, A.W.; Moreau, S.; Charroin, T.; Blanchard, M.; Liu, J.; Faverdin, P. The Relationship of Dairy Farm Eco-Efficiency with Intensification and Self-Sufficiency. Evidence from the French Dairy Sector Using Life Cycle Analysis, Data Envelopment Analysis and Partial Least Squares Structural Equation Modelling. PLoS ONE 2016, 11, e0166445. [Google Scholar]
- Jiang, L.; Folmer, H.; Bu, M. Interaction between output efficiency and environmental efficiency: Evidence from the textile industry in Jiangsu Province, China. J. Clean. Prod. 2016, 113, 123–132. [Google Scholar] [CrossRef]
- Blumenberg, S. Benchmarking Financial Processes with Data Envelopment Analysis. 2005. Available online: www.is-frankfurt.de/publikationenNeu/BenchmarkingFinancialProcesses1208.pdf (accessed on 20 June 2017).
- Charnes, A.; Cooper, W.W.; Lewin, A.Y.; Seiford, L.M. Data Envelopment Analysis: Theory, Methodology, and Applications; Springer Science & Business Media: New York, NY, USA, 2013. [Google Scholar]
- Shackman, J.D. The use of partial least squares path modeling and generalized structured component analysis in international business research: A literature review. Int. J. Manag. 2013, 30, 78. [Google Scholar]
- Tobias, R.D. (Ed.) An Introduction to Partial Least Squares Regression; SAS Institute: Cary, NC, USA, 1997. [Google Scholar]
- Kwon, H.-B. Performance modeling of mobile phone providers: A DEA-ANN combined approach. Benchmarking 2014, 21, 1120–1144. [Google Scholar] [CrossRef]
- Kwon, H.-B. Exploring the predictive potential of artificial neural networks in conjunction with DEA in railroad performance modeling. Int. J. Prod. Econ. 2017, 183, 159–170. [Google Scholar] [CrossRef]
- Hakkert, A.; Gitelman, V.; Vis, M. Road safety performance indicators: Theory. Deliverable D3 2007, 6. Available online: http://erso.swov.nl/safetynet/fixed/WP3/sn_wp3_d3p6_spi_theory.pdf (accessed on 20 February 2017).
- Elvik, R.; Amundsen, A.H. Improving road safety in Sweden. TØI Rep. 2000, 490, 2000. [Google Scholar]
- Lloyd, D.; Wilson, D.; Tuddenham, F.; Goodman, G.; Bhagat, A. Reported road casualties Great Britain 2012. Great Britain: Department for Transport. Available online: https://http://www.gov.uk/government/uploads/system/uploads/attachment_data/file/2:2013 (accessed on 20 February 2017).
- Wismans, J.; Skogsmo, I.; Nilsson-Ehle, A.; Lie, A.; Thynell, M.; Lindberg, G. Implications of road safety in national productivity and human development in Asia. In Proceedings of the Eighth Regional EST Forum in Asia, Colombo, Sri Lanka, 19–21 November 2014; pp. 1–51. [Google Scholar]
- Guria, J. Required Expenditure: Road safety improvement in low and middle income countries. In Addendum: Revised Estimates of Fatalities and Serious Injuries and Related Costs. Report to the World Bank Global Road Safety Facility; New Zealand Institute of Economic Research: Wellington, New Zealand, 2009. [Google Scholar]
- Macaulay, J.; McInerney, R. Evaluation of the Proposed Actions Emanating from Road Safety Audits. 2001. Available online: https://www.onlinepublications.austroads.com.au/items/AP-R209-02 (accessed on 20 February 2017).
- Aljanahi, A.; Rhodes, A.; Metcalfe, A.V. Speed, speed limits and road traffic accidents under free flow conditions. Accid. Anal. Prev. 1999, 31, 161–168. [Google Scholar] [CrossRef]
- Belmont, D.; Forbes, T. Effect of Average Speed and Volume on Motor-Vehicle Accidents on Two-Lane Tangents; Institute of Transportation and Traffic Engineering, University of California: Oakland, CA, USA, 1953. [Google Scholar]
- Elvik, R. Effects on accidents of automatic speed enforcement in Norway. Transp. Res. Rec. 1997, 14–19. [Google Scholar] [CrossRef]
- Balkin, S.; Ord, J.K. Assessing the impact of speed-limit increases on fatal interstate crashes. J. Transp. Stat. 2001, 4, 1–26. [Google Scholar]
- Milton, J.C.; Mannering, F.L. The Relationship between Highway Geometrics, Traffic Related Elements, and Motor Vehicle Accidents; Washington State Department of Transportation: Washington, DC, USA, 1996.
- O’donnell, C.; Connor, D. Predicting the severity of motor vehicle accident injuries using models of ordered multiple choice. Accid. Anal. Prev. 1996, 28, 739–753. [Google Scholar] [CrossRef]
- European Transport Safety Council (ETSC). Reducing the Severity of Road Injuries through Post Impact Care; European Transport Safety Council: Etterbeek, Belgium, 1999. [Google Scholar]
- Hussain, L.; Redmond, A. Are pre-hospital deaths from accidental injury preventable? BMJ 1994, 308, 1077–1080. [Google Scholar] [CrossRef] [PubMed]
- Bank, W. World Development Indicators. Available online: http://data.worldbank.org/products/wdi-maps (accessed on 12 August 2017).
- Avkiran, N.K. An application reference for data envelopment analysis in branch banking: Helping the novice researcher. Int. J. Bank Mark. 1999, 17, 206–220. [Google Scholar] [CrossRef]
- Galagedera, D.; Silvapulle, P. Experimental evidence on robustness of data envelopment analysis. J. Oper. Res. Soc. 2003, 54, 654–660. [Google Scholar] [CrossRef]
- Raab, R.L.; Lichty, R.W. Identifying subareas that comprise a greater metropolitan area: The criterion of county relative efficiency. J. Reg. Sci. 2002, 42, 579–594. [Google Scholar] [CrossRef]
- PLS, S. Smart-PLS: Next Generation Path Modeling (V.3). 2017. Available online: https://www.smartpls.com/downloads (accessed on 15 February 2017).
- Memon, A.H.; Rahman, I.A. SEM-PLS analysis of inhibiting factors of cost performance for large construction projects in Malaysia: Perspective of clients and consultants. Sci. World J. 2014, 2014, 165158. [Google Scholar] [CrossRef] [PubMed]
- Hair, J.F.; Black, W.C.; Babin, B.J.; Anderson, R.E.; Tatham, R.L. Multivariate Data Analysis; Prentice Hall: Upper Saddle River, NJ, USA, 1998; Volume 5. [Google Scholar]
- Ringle, C.M.; Wende, S.; Will, S. SmartPLS 2.0 (M3) Beta, 2005. Available online: http://www.smartpls.de (accessed on 20 February 2017).
- Memon, A.H.; Rahman, I.A. Analysis of cost overrun factors for small scale construction projects in Malaysia using PLS-SEM method. Mod. Appl. Sci. 2013, 7, 78. [Google Scholar] [CrossRef]
- Hair, J.F.; Ringle, C.M.; Sarstedt, M. PLS-SEM: Indeed a silver bullet. J. Mark. Theory Pract. 2011, 19, 139–152. [Google Scholar] [CrossRef]
- Fornell, C.; Larcker, D.F. Evaluating structural equation models with unobservable variables and measurement error. J. Mark. Res. 1981, 18, 39–50. [Google Scholar] [CrossRef]
- Chin, W.W. Issues and opinion on structural equation modeling. MIS Q. 1998, 22, 7–16. [Google Scholar]
- Chinomona, R.; Mofokeng, T.; Pooe, D. The influence of condition of minibus taxis, compliance with road rules on quality of service and commuter satisfaction in Harrismith, South Africa. Mediterr. J. Soc. Sci. 2013, 4, 319. [Google Scholar] [CrossRef]
- Lowry, P.B.; Gaskin, J. Partial least squares (PLS) structural equation modeling (SEM) for building and testing behavioral causal theory: When to choose it and how to use it. IEEE Trans. Prof. Commun. 2014, 57, 123–146. [Google Scholar] [CrossRef]
- Henseler, J.; Ringle, C.M.; Sarstedt, M. A new criterion for assessing discriminant validity in variance-based structural equation modeling. J. Acad. Mark. Sci. 2015, 43, 115–135. [Google Scholar] [CrossRef]
- Tenenhaus, M.; Vinzi, V.E.; Chatelin, Y.-M.; Lauro, C. PLS path modeling. Comput. Stat. Data Anal. 2005, 48, 159–205. [Google Scholar] [CrossRef]
- Cohen, J. Statistical Power Analysis for the Behavioral Sciences; Lawrence Earlbaum Associates: Hillsdale, NJ, USA, 1988; pp. 20–26. [Google Scholar]
- Akter, S.; D’Ambra, J.; Ray, P. An evaluation of PLS based complex models: The roles of power analysis, predictive relevance and GoF index. In Proceedings of the 17th Americas Conference on Information Systems (AMCIS 2011), Detroit, MI, USA, 4–7 August 2011; pp. 1–7. [Google Scholar]
- Söderlund, N.; Zwi, A.B. Traffic-related mortality in industrialized and less developed countries. Bull. World Health Organ. 1995, 73, 175. [Google Scholar] [PubMed]
- Singh, H.; Dhattarwal, S. Pattern and distribution of injuries in fatal road traffic accidents in Rohtak (Haryana). J. Indian Acad. Forensic Med. 2004, 26, 20–23. [Google Scholar]
- Yang, B.-M.; Kim, J. Road traffic accidents and policy interventions in Korea. Inj. Control Saf. Promot. 2003, 10, 89–94. [Google Scholar] [CrossRef] [PubMed]
- Naci, H.; Chisholm, D.; Baker, T.D. Distribution of road traffic deaths by road user group: A global comparison. Inj. Prev. 2009, 15, 55–59. [Google Scholar] [CrossRef] [PubMed]


| Country | Fatalities | Pop(M) | TRV(M) | IG | Country | Fatalities | Pop(M) | TRV(M) | IG |
|---|---|---|---|---|---|---|---|---|---|
| Afghanistan | 4734 | 30.5 | 0.66 | 1 | Maldives | 12 | 0.3 | 0.06 | 2 |
| Azerbaijan | 943 | 9.4 | 1.14 | 2 | Mongolia | 597 | 2.8 | 0.68 | 2 |
| Bahrain | 107 | 1.3 | 0.55 | 3 | Burma | 10,809 | 53.2 | 4.31 | 1 |
| Bangladesh | 21,316 | 156.5 | 2.09 | 1 | Nepal | 4713 | 27.7 | 1.18 | 1 |
| Bhutan | 114 | 0.7 | 0.07 | 2 | Oman | 1881 | 21.6 | 5.99 | 3 |
| Cambodia | 2635 | 15.1 | 2.46 | 1 | Pakistan | 25,781 | 182.1 | 9.08 | 2 |
| China | 26,1367 | 1385.5 | 250.14 | 2 | Philippines | 10,379 | 98.3 | 7.69 | 2 |
| Georgia | 514 | 4.3 | 0.95 | 2 | Qatar | 330 | 2.1 | 0.65 | 3 |
| India | 207,551 | 1252.1 | 159.49 | 2 | Saudi Arabia | 7898 | 28.8 | 6.60 | 3 |
| Indonesia | 38,279 | 249.8 | 104.21 | 2 | Singapore | 197 | 5.4 | 0.97 | 3 |
| Iran | 24,896 | 77.4 | 26.87 | 2 | Sri Lanka | 3691 | 21.2 | 5.20 | 2 |
| Iraq | 6826 | 33.7 | 4.52 | 2 | Tajikistan | 1543 | 8.2 | 0.41 | 1 |
| Japan | 5971 | 127.1 | 91.38 | 3 | Thailand | 24,237 | 67 | 32.48 | 2 |
| Jordan | 1913 | 7.2 | 1.26 | 2 | Timor-Leste | 188 | 1.1 | 0.06 | 2 |
| Kazakhstan | 3983 | 16.4 | 3.93 | 2 | Turkey | 6687 | 74.9 | 17.94 | 2 |
| Kuwait | 629 | 3.3 | 1.84 | 3 | Turkmenistan | 914 | 5.2 | 0.85 | 2 |
| Kyrgyzstan | 1220 | 5.5 | 0.96 | 2 | UAE | 1021 | 9.3 | 2.67 | 3 |
| Laos | 971 | 9.7 | 1.44 | 2 | Vietnam | 22,419 | 91.6 | 40.79 | 2 |
| Lebanon | 1088 | 4.8 | 1.68 | 2 | Yemen | 5248 | 24.4 | 1.20 | 2 |
| Malaysia | 7129 | 29.7 | 23.82 | 2 | - | - | - | - | - |
| Variable | Description | Mean | SD | Min. | Max. |
|---|---|---|---|---|---|
| RTF | Road Traffic Fatalities(Number) | 18,480 | 52,051 | 12 | 261,367 |
| Population | Population of the Country in Millions | 106.30 | 291.40 | 0.3 | 1385.5 |
| TRV | Total Registered Vehicles in Millions | 20.98 | 49.93 | 0.06 | 250.14 |
| Country | Fatalities(No.) | Population(Mil) | RV(Mil) | DEA Risk | Rank |
|---|---|---|---|---|---|
| Output | Input | Input | |||
| Thailand | 24,237 | 67 | 32.48 | 8.53 | 1 |
| Iran | 24,896 | 77.4 | 26.87 | 8.09 | 2 |
| Saudi Arabia | 7898 | 28.8 | 6.60 | 7.32 | 3 |
| Jordan | 1913 | 7.2 | 1.26 | 7.28 | 4 |
| Kazakhstan | 3983 | 16.4 | 3.93 | 6.45 | 5 |
| Kyrgyzstan | 1220 | 5.5 | 0.96 | 6.08 | 6 |
| Yemen | 5248 | 24.4 | 1.20 | 5.90 | 7 |
| Vietnam | 22,419 | 91.6 | 40.79 | 5.88 | 8 |
| Lebanon | 1088 | 4.8 | 1.68 | 5.70 | 9 |
| Mongolia | 597 | 2.8 | 0.68 | 5.65 | 10 |
| Myanmar (Burma) | 10,809 | 53.2 | 4.31 | 5.57 | 11 |
| Iraq | 6826 | 33.7 | 4.52 | 5.55 | 12 |
| China | 261,367 | 1385.5 | 250.14 | 5.17 | 13 |
| Tajikistan | 1543 | 8.2 | 0.41 | 5.16 | 14 |
| Turkmenistan | 914 | 5.2 | 0.85 | 4.82 | 15 |
| Cambodia | 2635 | 15.1 | 2.46 | 4.78 | 16 |
| Timor-Leste | 188 | 1.1 | 0.06 | 4.68 | 17 |
| Nepal | 4713 | 27.7 | 1.18 | 4.66 | 18 |
| Sri Lanka | 3691 | 21.2 | 5.20 | 4.61 | 19 |
| Malaysia | 7129 | 29.7 | 23.82 | 4.58 | 20 |
| India | 207,551 | 1252.1 | 159.49 | 4.54 | 21 |
| Bhutan | 114 | 0.7 | 0.07 | 4.46 | 22 |
| Kuwait | 629 | 3.3 | 1.84 | 4.35 | 23 |
| Afghanistan | 4734 | 30.5 | 0.66 | 4.25 | 24 |
| Qatar | 330 | 2.1 | 0.65 | 4.03 | 25 |
| Pakistan | 25,781 | 182.1 | 9.08 | 3.88 | 26 |
| Bangladesh | 21,316 | 156.5 | 2.09 | 3.73 | 27 |
| Indonesia | 38,279 | 249.8 | 104.21 | 3.73 | 28 |
| Georgia | 514 | 4.3 | 0.95 | 3.21 | 29 |
| Philippines | 10,379 | 98.3 | 7.69 | 2.89 | 30 |
| UAE | 1021 | 9.3 | 2.67 | 2.85 | 31 |
| Azerbaijan | 943 | 9.4 | 1.14 | 2.75 | 32 |
| Laos | 971 | 9.7 | 1.44 | 2.74 | 33 |
| Turkey | 6687 | 74.9 | 17.94 | 2.37 | 34 |
| Oman | 1881 | 21.6 | 5.99 | 2.27 | 35 |
| Bahrain | 107 | 1.3 | 0.55 | 2.00 | 36 |
| Maldives | 12 | 0.3 | 0.06 | 1.08 | 37 |
| Singapore | 197 | 5.4 | 0.97 | 1.00 | 38 |
| Japan | 5971 | 127.1 | 91.38 | 1.00 | 39 |
| Variable | Description | Mean | SD | Min. | Max. | |
|---|---|---|---|---|---|---|
| F.I | IG | Income Group (1-Low,2-Middle,3-High) | -- | -- | 1 | 3 |
| GNICPC | Gross national income per capita (US$) | 11,681 | 18,362 | 690 | 86,790 | |
| GDPL_PCENT | Estimated GDP lost due to road traffic crashes (%age) | 2.43 | 1.16 | 0.25 | 6.00 | |
| I.F | FRT | Fatality Reduction Target (upto 2020) (%age) | 0.23 | 0.20 | 0.00 | 0.50 |
| LA | Presence Lead Agency for Road Safety (1 = Yes, 0 = No) | -- | -- | 0 | 1 | |
| FNB | Funded in National Budget (1 = Yes, 0 = No) | -- | -- | 0 | 1 | |
| NRSS | Presence of National Road Safety Strategy (1 = Yes, 0 = No) | -- | -- | 0 | 1 | |
| FIS | Funding to Implement Strategy (1 = Full, 2 = Partial, 3 = No) | -- | -- | 1 | 3 | |
| I.M | ANR | Requirement of Audit for New Roads (1 = Yes, 0 = No) | -- | -- | 0 | 1 |
| AER | Requirement of Audit for Existing Roads (1 = Yes, 0 = No) | -- | -- | 0 | 1 | |
| PPWC | Presence of Policy to promote Walk & Cycling (1 = Y, 0 = N) | -- | -- | 0 | 1 | |
| PIPT | Presence of Policy to investment in Public Transport (1 = Y, 0 = N) | -- | -- | 0 | 1 | |
| PRSU | Policy to separate road users and protect VRUs (1 = Y, 0 = N) | -- | -- | 0 | 1 | |
| L.P | MUSL | Max. Urban Speed Limit (Km/h) | 60.08 | 17.07 | 30 | 100 |
| MRSL | Max. Rural Speed Limit (Km/h) | 90.44 | 19.74 | 30 | 120 | |
| MMSL | Max. Motorway Speed Limit (Km/h) | 109.87 | 15.07 | 50 | 140 | |
| NSLL_ENF | National Speed Limit Law Enforcement (1 Low-10 High) | 5.62 | 2.11 | 1 | 10 | |
| NMHL | Presence of National Motorcycle Helmet Law (1 = Yes, 0 = No) | -- | -- | 0 | 1 | |
| NMHL_ENF | National Motorcycle Helmet Law Enforcement (1 Low-10 Hi) | 5.97 | 2.81 | 0 | 10 | |
| NSBL | Presence of National seat-belt law (1 = Yes, 0 = No) | -- | -- | 0 | 1 | |
| NSBL_ENF | National seat-belt law Enforcement (1 Low-10 High) | 5.18 | 2.86 | 0 | 10 | |
| NCRL | Presence of National child restraint law (1 = Yes, 0 = No) | -- | -- | 0 | 1 | |
| NCRL_ENF | National child restraint law Enforcement (1 Low-8 High) | 1.08 | 2.30 | 0 | 8 | |
| NDDL_ENF | National Drink Driving Law Enforcement (1 Low-10 High) | 5.51 | 3.03 | 0 | 10 | |
| BACLGP | BAC limit-general population (g/dL) | 0.05 | 0.02 | 0 | 0.08 | |
| BACLYND | BAC limit-young or novice drivers (g/dL) | 0.04 | 0.02 | 0 | 0.08 | |
| RTDIA_PCENT | Road Traffic Deaths Involving Alcohol (%age) | 10.63 | 7.53 | 0.45 | 34 | |
| T.M | ERISS | Presence of Emergency Room Injury Surveillance System | -- | -- | 0 | 1 |
| PDRTC_PCENT | Permanent Disability due to Road Crashes (%age) | 4.34 | 5.27 | 0.006 | 18 | |
| VRUI | D_P4WCLV | Death-Passenger 4-Wheeled cars & Light Vehicles (0-1) | 0.19 | 0.13 | 0 | 0.61 |
| D_D4WCLV | Death-Drivers 4-Wheeled cars & Light Vehicles(0-1) | 0.18 | 0.12 | 0 | 0.46 | |
| D_RM23W | Death-Rider motorized 2 &3-wheelers (0-1) | 0.22 | 0.21 | 0 | 0.73 | |
| D_CYC | Death-Cyclists (0-1) | 0.04 | 0.04 | 0 | 0.17 | |
| D_PED | Death-Pedestrians (0-1) | 0.24 | 0.09 | 0.03 | 0.43 | |
| D_DPHT | Death-Drivers/Passengers heavy trucks(0-1) | 0.04 | 0.04 | 0 | 0.16 | |
| D_DPB | Death-Drivers/Passengers buses (0-1) | 0.04 | 0.06 | 0 | 0.35 | |
| D_OTH | Death-other vehicles (0-1) | 0.06 | 0.11 | 0 | 0.57 |
| Construct | Factors | Estimates | ||
|---|---|---|---|---|
| Loading | AVE | CR | ||
| F.I | GNICPC | 0.926 | 0.852 | 0.920 |
| IG | 0.919 | |||
| I.F | FRT | 0.787 | 0.497 | 0.742 |
| LA | 0.776 | |||
| FNB | 0.520 | |||
| I.M | PPWC | 0.905 | 0.593 | 0.811 |
| PIPT | 0.647 | |||
| PRSU | 0.736 | |||
| L.P | NSLL_ENF | 0.694 | 0.542 | 0.855 |
| NMHL_ENF | 0.821 | |||
| NSBL_ENF | 0.718 | |||
| NCRL_ENF | 0.768 | |||
| NDDL_ENF | 0.669 | |||
| T.M | ERISS | 0.355 | 0.427 | 0.560 |
| PDRTC_PCENT | 0.854 | |||
| VRUI | D_P4WCLV | −0.647 | 0.650 | 0.108 |
| D_CYC | 0.938 | |||
| Criteria [32,35,68,69] | ≥0.4 | ≥0.50 | ≥0.70 | |
| Factors | FI | IM | IF | LP | TM | VI |
|---|---|---|---|---|---|---|
| FI: Financial Impact | 0.923 | |||||
| IM: Infrastructure and Mobility | 0.372 | 0.770 | ||||
| IF: Institutional Framework | −0.071 | 0.389 | 0.705 | |||
| LP: Legislation and Policy | 0.515 | 0.373 | 0.168 | 0.736 | ||
| TM: Trauma Management | −0.282 | 0.000 | 0.064 | −0.208 | 0.352 | |
| VI: Vehicular-Road User Impact | 0.086 | −0.140 | 0.035 | 0.080 | −0.403 | 0.806 |
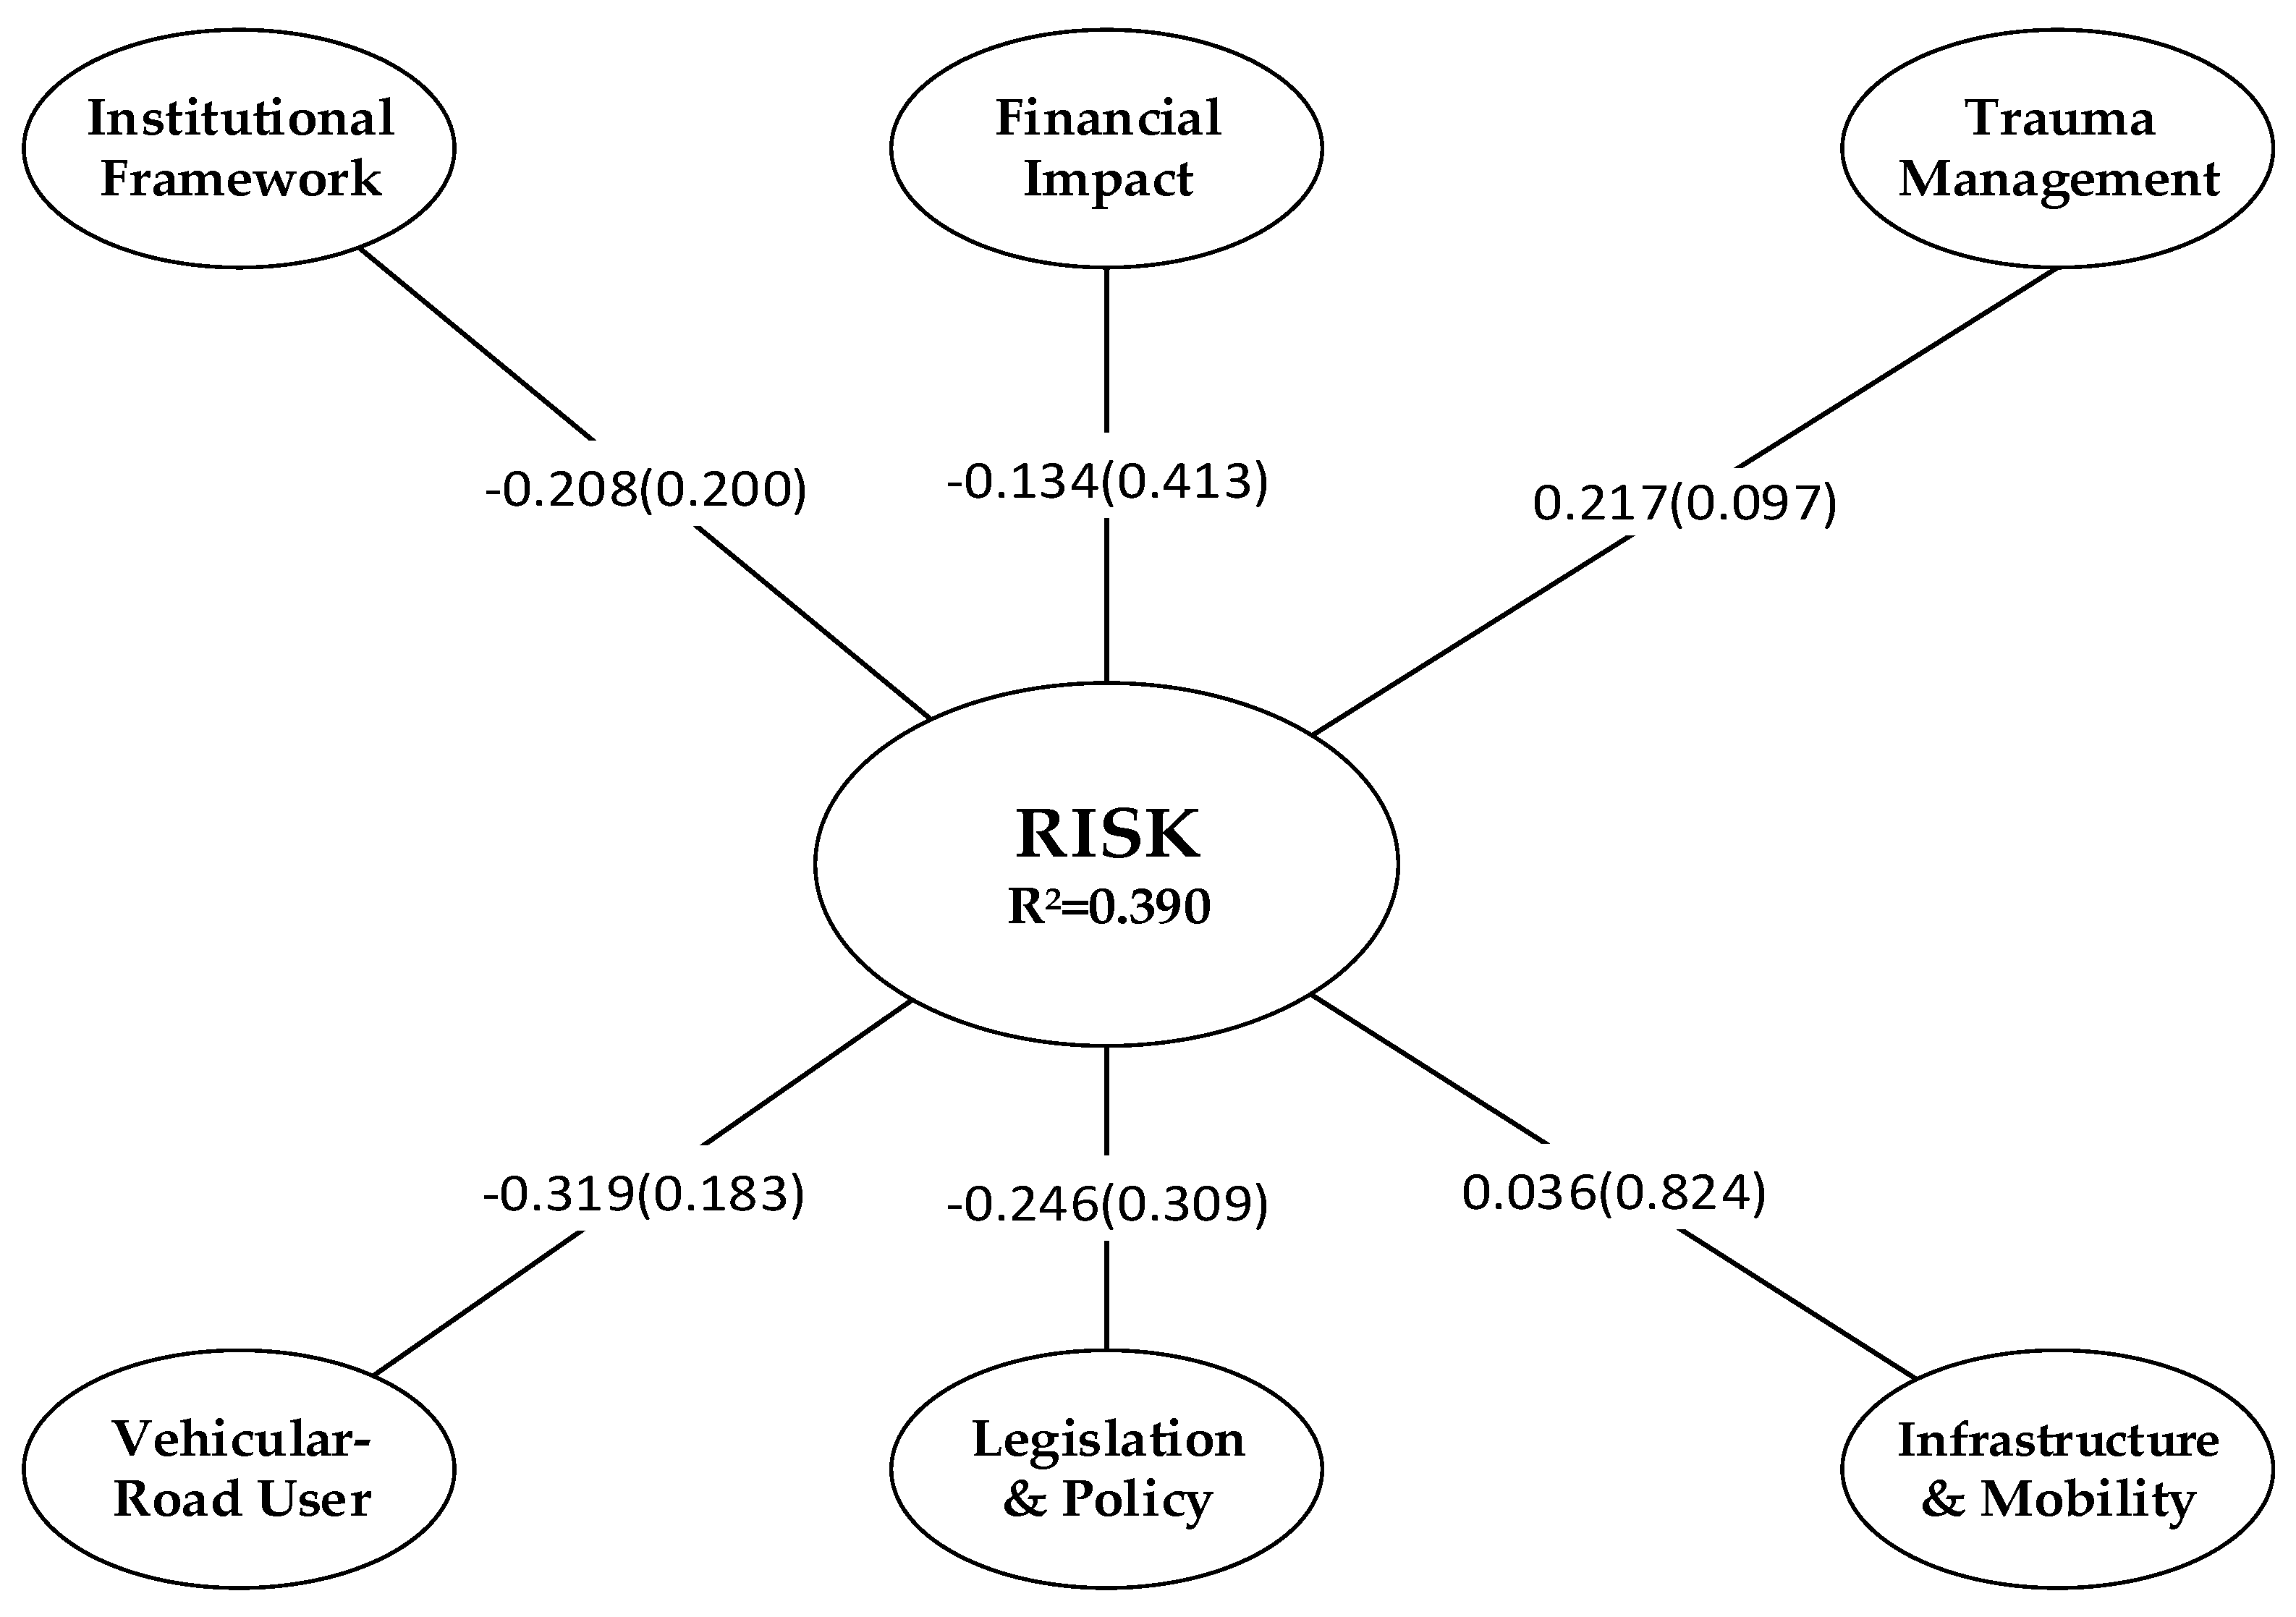
| Relationship Hypothesis | P. Coff. | T. Stat | p-Value | R2 |
|---|---|---|---|---|
| H1: Financial Impact → Risk | −0.134 | 0.820 | 0.413 | |
| H2: Infrastructure & Mobility → Risk | 0.036 | 0.222 | 0.824 | |
| H3: Institutional Framework → Risk | −0.208 | 1.283 | 0.200 | 0.390 |
| H4: Legislation and Policy → Risk | −0.246 | 1.018 | 0.309 | |
| H5: Trauma Management → Risk | 0.217 | 1.665 | 0.097 * | |
| H6: Vehicular R User Impact → Risk | −0.319 | 1.332 | 0.183 |
© 2018 by the authors. Licensee MDPI, Basel, Switzerland. This article is an open access article distributed under the terms and conditions of the Creative Commons Attribution (CC BY) license (http://creativecommons.org/licenses/by/4.0/).
Share and Cite
Shah, S.A.R.; Ahmad, N.; Shen, Y.; Pirdavani, A.; Basheer, M.A.; Brijs, T. Road Safety Risk Assessment: An Analysis of Transport Policy and Management for Low-, Middle-, and High-Income Asian Countries. Sustainability 2018, 10, 389. https://doi.org/10.3390/su10020389
Shah SAR, Ahmad N, Shen Y, Pirdavani A, Basheer MA, Brijs T. Road Safety Risk Assessment: An Analysis of Transport Policy and Management for Low-, Middle-, and High-Income Asian Countries. Sustainability. 2018; 10(2):389. https://doi.org/10.3390/su10020389
Chicago/Turabian StyleShah, Syyed Adnan Raheel, Naveed Ahmad, Yongjun Shen, Ali Pirdavani, Muhammad Aamir Basheer, and Tom Brijs. 2018. "Road Safety Risk Assessment: An Analysis of Transport Policy and Management for Low-, Middle-, and High-Income Asian Countries" Sustainability 10, no. 2: 389. https://doi.org/10.3390/su10020389