Article

How Human Activities Affect Heavy Metal Contamination of Soil and Sediment in a Long-Term Reclaimed Area of the Liaohe River Delta, North China

1
Center for Studies of Marine Economy and Sustainable Development, Liaoning Normal University, No. 850, Huanghe Road, Shahekou District, Dalian 116029, China
2
CAS Key Laboratory of Forest Ecology and Management, Institute of Applied Ecology, Chinese Academy of Sciences, No. 72, Wenhua Road, Shenyang 110164, China
3
JangHo Architectural College, Northeastern University, No. 195, Chuangxin Road, Shenyang 110169, China
*
Author to whom correspondence should be addressed.
Sustainability 2018, 10(2), 338; https://doi.org/10.3390/su10020338
Submission received: 6 January 2018 / Revised: 23 January 2018 / Accepted: 25 January 2018 / Published: 29 January 2018

Abstract

:
Heavy metal pollution in soils and sediments is becoming a matter of wide concern, this study was carried out in Dawa County of the Liaohe River Delta, with the aim of exploring the impacts of land use levels on heavy metal contamination of soil and sediment. A total of 129 soil samples were collected in different land use intensities (LUI). Soil metals (Fe, Mn, Cd, Cr, Cu, Ni, Pb and Zn) and soil salinity, pH, soil organic carbon (SOC), nitrate nitrogen (NO3-N), available phosphorus (AP) and grain sizes were analyzed. Correlation analysis indicated that SOC and grain size played important roles in affecting the heavy metal distribution. The factor analysis results indicated that heavy metal contamination was most probably caused by industrial and agricultural wastewater discharges, domestic sewage discharge and atmospheric deposition. Using ANOVA, it found that human activities significantly changed soil physic-chemical properties through soil erosion, leaching and fertilizer application, further affecting the behaviors of heavy metals in the soil and sediments. The anthropogenic factors could lead to potential environmental risk, as indicated by the Geo-accumulation index (Igeo) results of heavy metals. Overall, the heavy metals generally had approached or even exceeded moderately polluted (0 < Igeo < 1, 1 < Igeo < 2), but the Pb and Cu pollution level was low (Igeo < 0), and the Cd pollution level was moderately or strongly polluted (2 < Igeo < 3, 3 < Igeo < 4) in the five land use levels. This study will provide valuable information for appropriately determining how land should be used in future reclamation areas, as well as for the sustainable management of estuarine areas around the world.

1. Introduction

Soil is not only the material on which land organisms live but also plays important roles in material cycles and energy exchange in terrestrial ecosystems. Rapid industrialization and urbanization have led to soil pollution becoming a serious environmental problem that cannot be ignored [1]. Increased heavy metal concentrations are particularly harmful because heavy metals are toxic, persistent, and non-degradable [2]. Physical and chemical processes (leaching and oxidation) can cause heavy metals accumulated in soil to be released, meaning the metals can enter water bodies and be taken up by crops and eventually affect public health through the water supply and the food chain [3]. Heavy metal pollution has not yet been controlled effectively because anthropogenic activities are increasing, especially in developing countries. There is therefore concern around the world about the release of heavy metals and the behaviors of heavy metals in the environment.
Economic development and growing populations in coastal areas have meant that demand for and supply of land are acutely imbalanced. Coastal wetland reclamation is one of the main ways of meeting increasing demand for new land for housing and development. China now reclaims more land from the sea than any other country, reclaiming 300 km2 a−1 on average [4,5]. Reclaimed land is typically divided into different functional zones, such as agricultural, residential, traffic, and industrial areas. Reclamation will probably markedly change the properties of the soil in any type of area, and this will affect the behaviors of heavy metals in the soil, potentially posing risks to ecosystems and to human health [6]. Bai et al. [7] found that long-term reclamation of land for agricultural use could potentially lead to the average concentrations of heavy metals and metalloids (particularly As and Cr) in cultivated soils being significantly higher than the background concentrations. Li et al. [8] found that reclaimed soils and food crops were contaminated with heavy metals, and they found that Cd and Cu in crops cultivated on reclaimed tidal flat soil could pose health risks. It has previously been shown that heavy metal concentrations tend to be higher in soils of industrial and residential areas than in soils of agricultural areas [9,10]. Li et al. [11] evaluated the pollution levels and sources of heavy metals in the Huishan and Xin districts of Wuxi City, China. They found higher heavy metal concentrations in Xin, where there are many industrial parks, than in Huishan. In particular, Hg pollution levels as high as moderate were found for rural-residential soil and underwater sediment. Some recent studies have been focused on heavy metals in wetland and arable soils, including heavy metal enrichment, spatial distributions, and the potential hazards posed to public health [12,13]. Land use type and intensity are the most basic and important human-controlled factors that influence the geochemical characteristics of heavy metals in soil and sediment. However, few studies have been focused on identifying the sources of heavy metals and assessing heavy metal pollution in soils of different land use intensities, especially in the long-term reclaimed area that have been used for comprehensive development of industry and agriculture.
The Liaohe River Delta, in Liaoning Province, China, is adjacent to the northern part of Liaodong Bay in the Bohai Sea. The delta has a total area of about 5000 km2, and is formed by sediment deposited by the Daliaohe, Dalinghe, Xiaolinghe, and Liaohe (or Shuangtaizihe) rivers. The second largest permanent reed (Phragmites australis (Cav.) Trin. ex Steud.) marsh in the world is within the delta. This marsh was designated as the Shuangtaihekou National Nature Reserve in 1986 and a Wetland of International Importance (by the Ramsar Convention) in 2005. The third largest oilfield in China, the Liao River oilfield, is within the Shuangtaihekou National Nature Reserve. There are two oil-producing regions, called Xinglongtai and Huanxiling, in the oilfield [14]. Panjin is the largest city in the Liaohe River Delta, and Dawa County in Panjin City is the main reclaimed area. According to the local records from Dawa County Annals and the Panjin Water Conservancy Annals, this area used to be marshland that formed through river-sea interactions since the middle–late Holocene. The local government started large-scale reclamation activities in the 1960s, such as the exploitation of “Dawa small delta” in 1990s and the construction of “Liaodong Bay New District” in 2010s. According to the Liaoning Coastal Protection and Utilization Plan introduced in 2013, more than 200 km2 of coastal wetlands will have been reclaimed by 2020, Dawa County is viewed as one of the key areas for development. Thus, research into the effects of reclamation on the heavy metal contamination of soil and sediment in different land use intensities can provide valuable information to balance the planning of future land uses and environmental protection in coastal areas to allow sustainable development to be achieved.
This study was performed in Dawa County with the aim to explore the impacts of land use intensity on soil conditions. Specifically, the objectives of this study were (1) to reveal the relationships between heavy metals and selected soil properties (2) to identify the potential sources of heavy metals in different land use intensity and (3) to assess soil property characteristics and heavy metal pollution in different land use intensities.

2. Materials and Methods
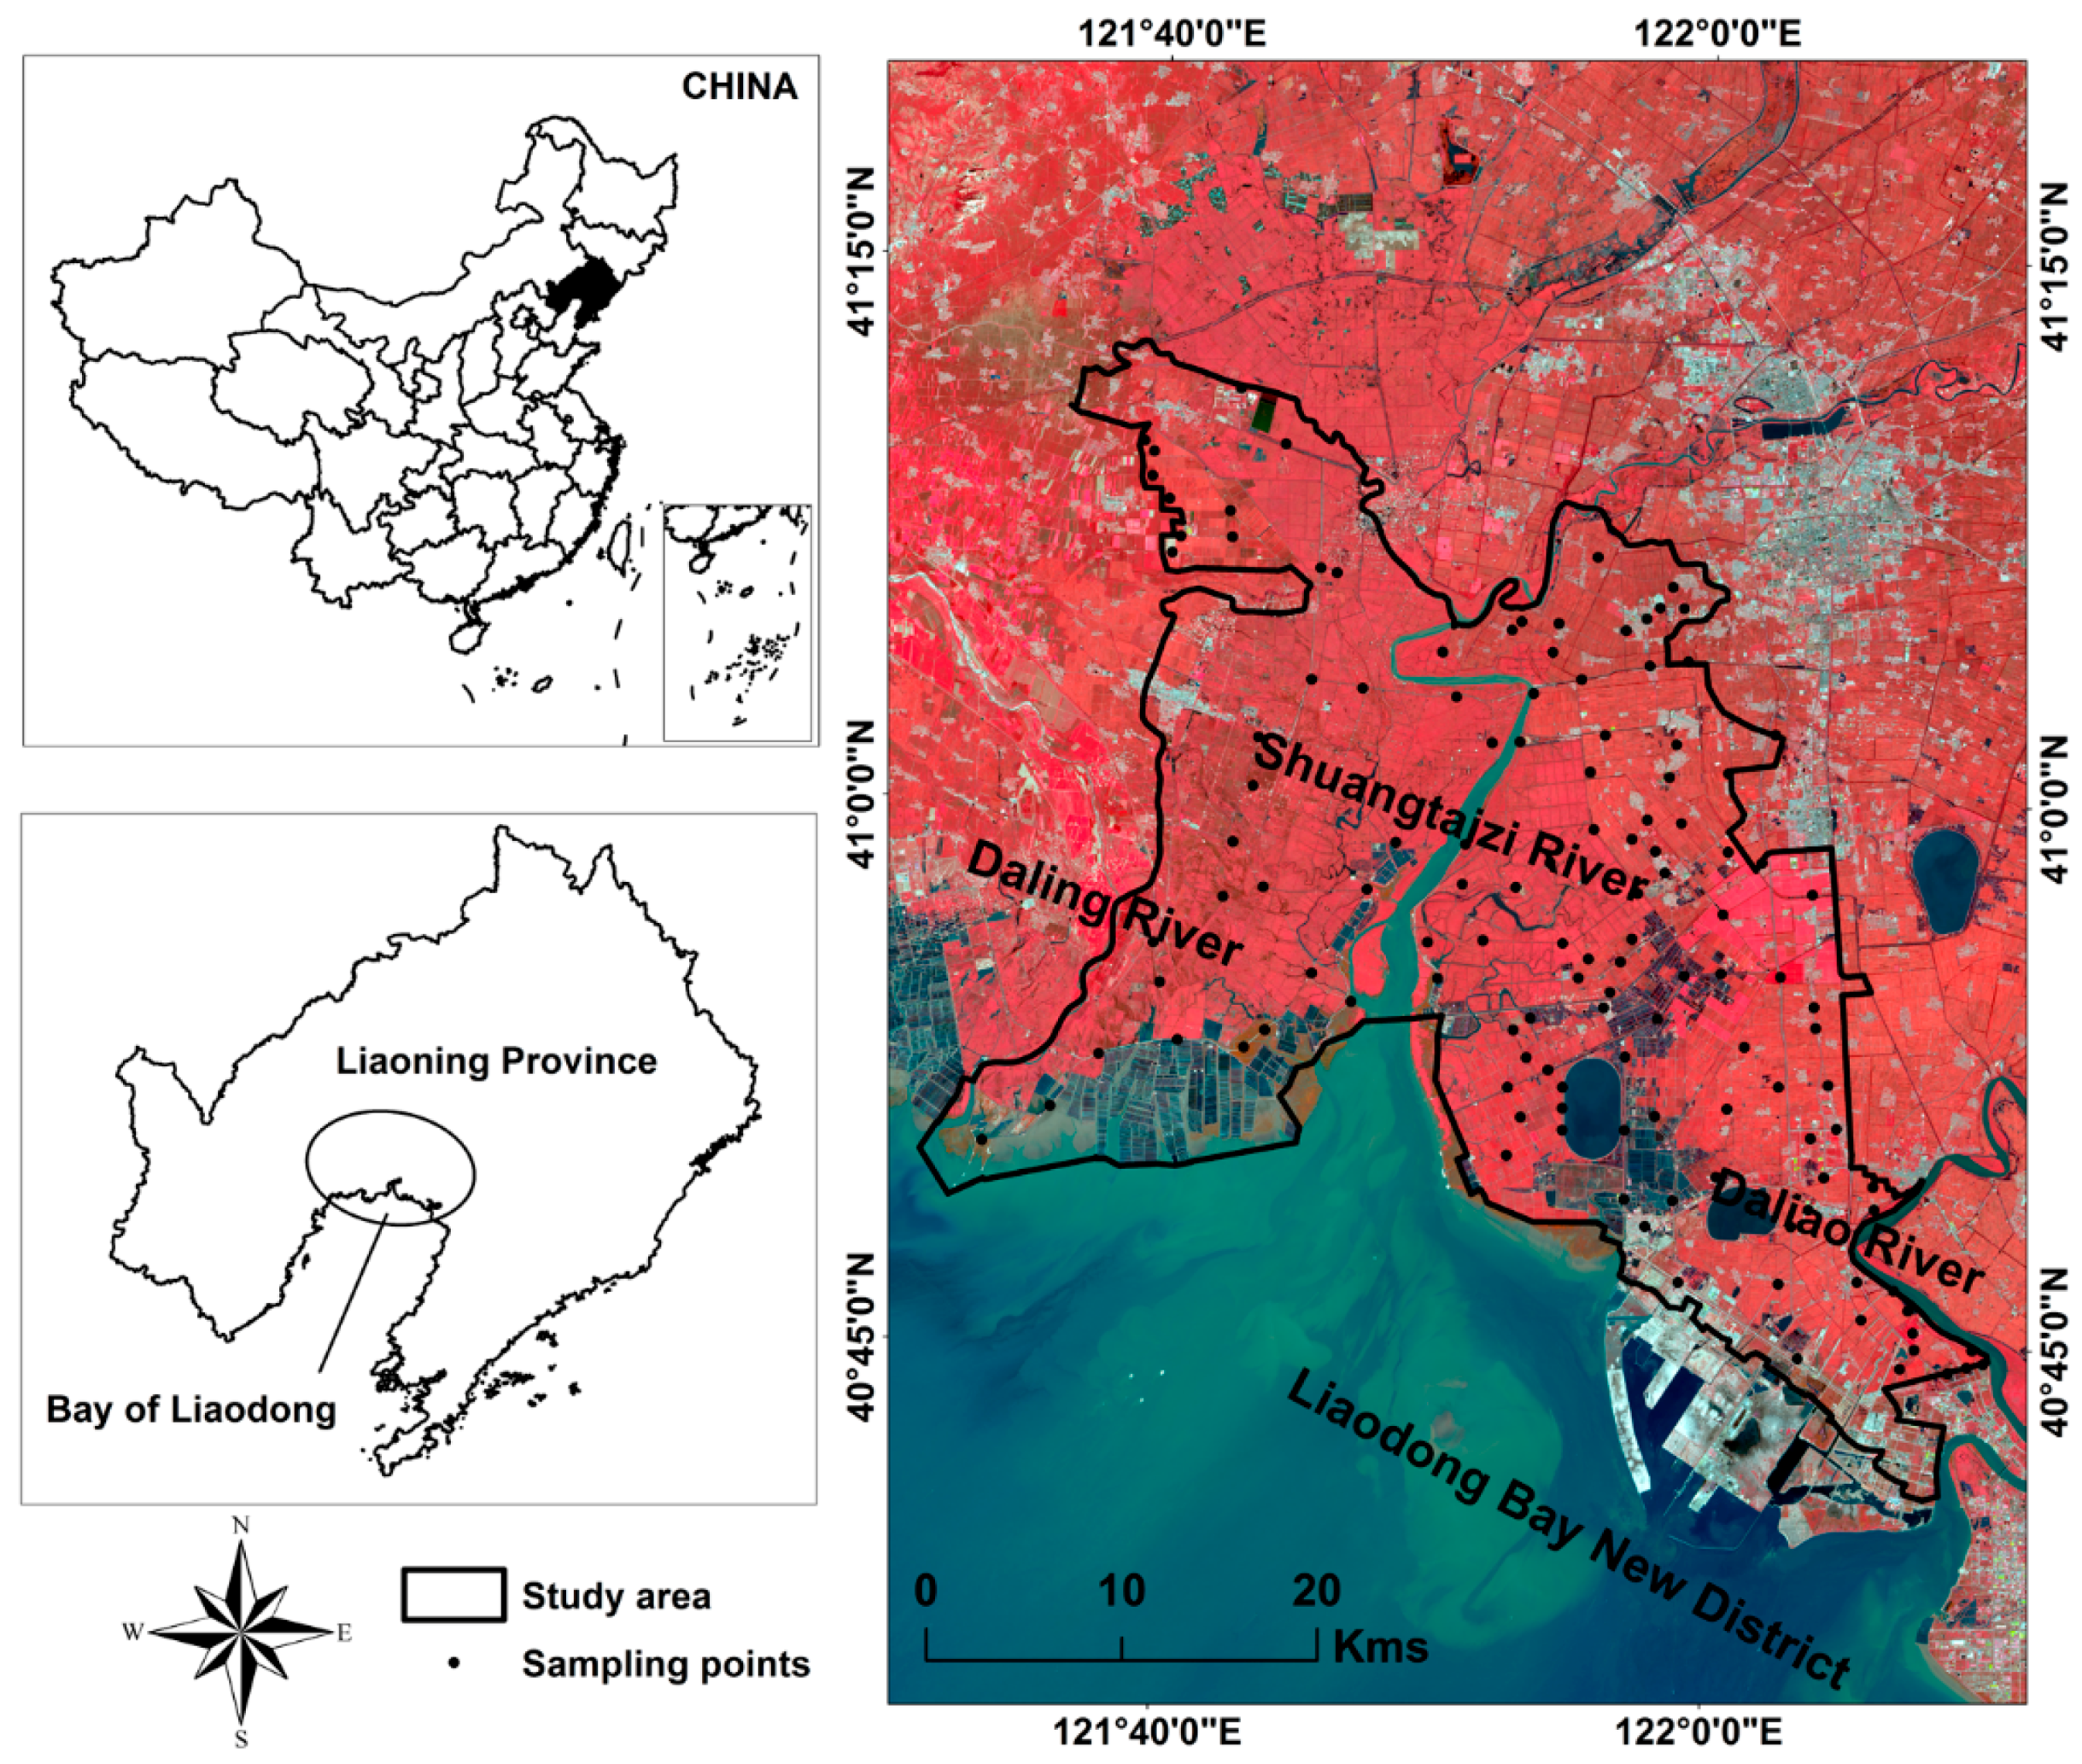
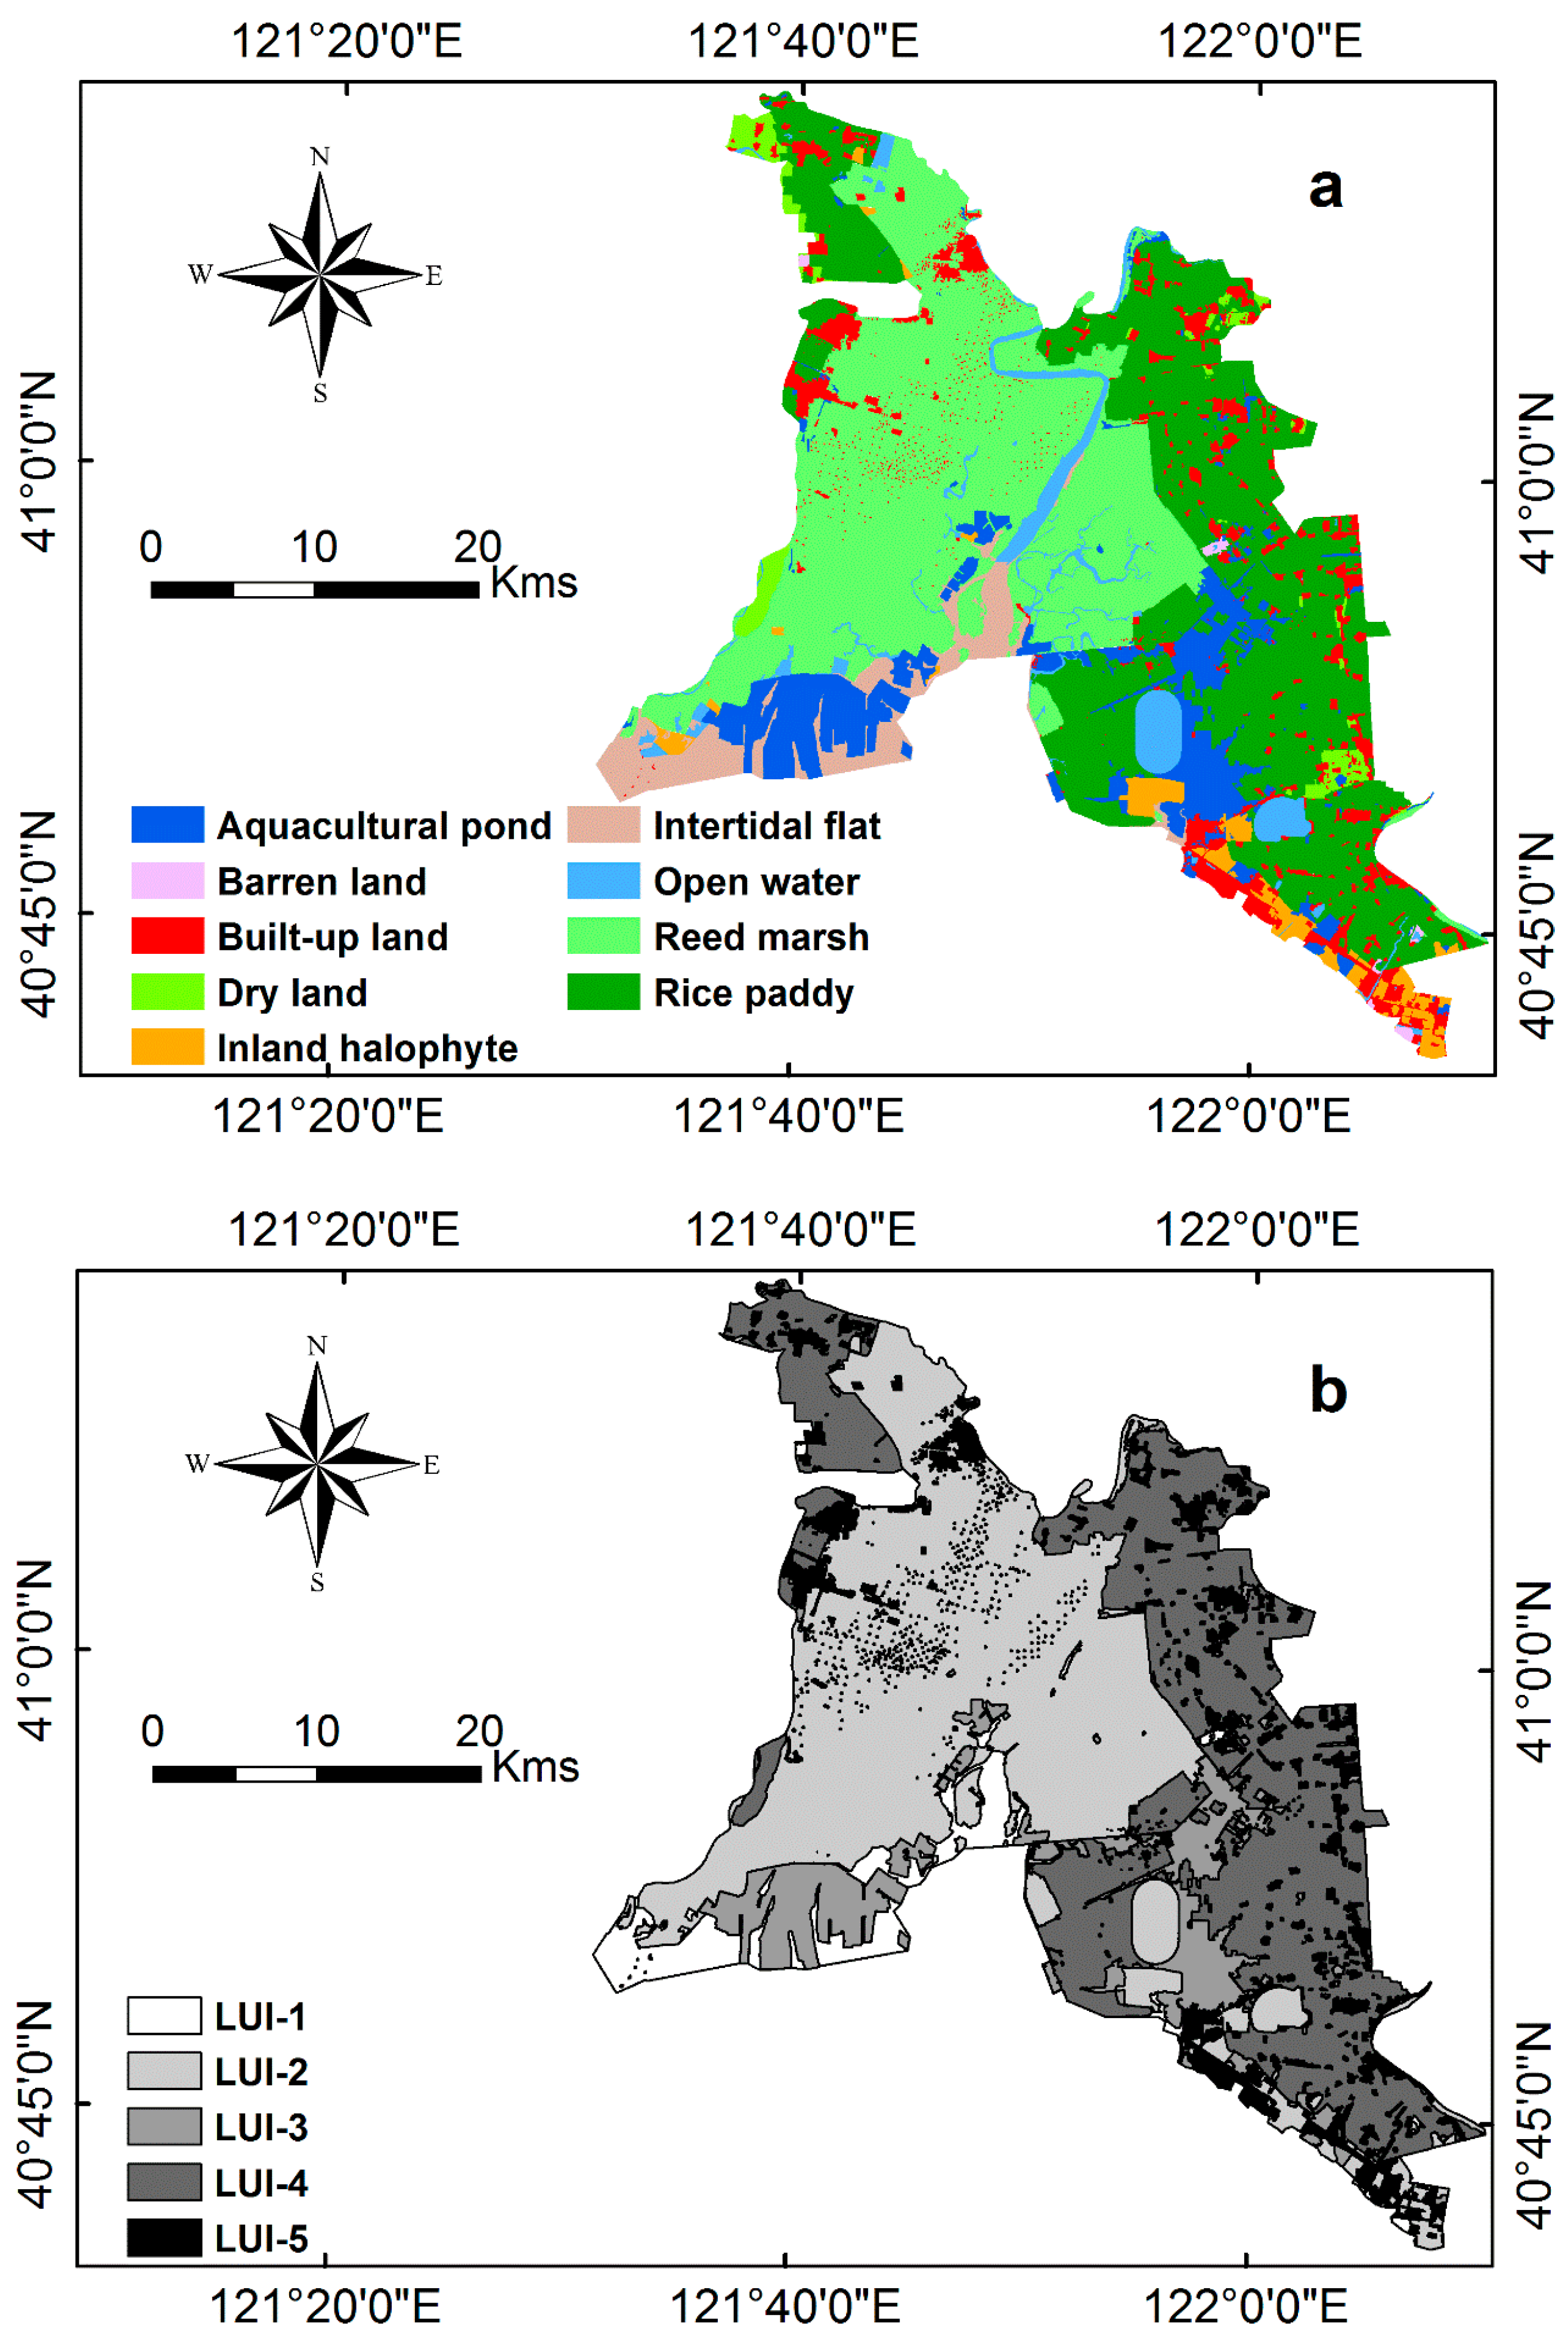
2.1. Study Area

An area (121°31′–122°10′ E, 40°39′–41°12′ N) of about 1249 km2 located in the southwest Dawa County was investigated in this study (Figure 1). The region experiences a semi-humid temperate monsoon climate, where the annual average temperature is 8.3–8.4 °C, the annual average precipitation is 611.6 mm and the annual evaporation is between 1390 and 1705 mm [15].
Land use types were derived from Landsat OLI data obtained in September 2014. Nine land use types (aquacultural pond, barren land, built-up land, dry land, inland halophyte, intertidal flat, open water, reed marsh and rice paddy) were extracted according to the results of field investigation, with a classification accuracy of above 85% for all types (Figure 2a). Land use intensity is proposed to describe the width and depth of land resources development and the intensive level of land resources. It reflects not only the natural attribute of land resources, but also the comprehensive effect that the natural environment and human activities impact on land resources [16]. Therefore, according to Li et al. [17], different land use types could be classified to different land use intensity (LUI). In this study, nine land use types were assigned to five land use intensities (Table 1; Figure 2b), and the area percent of these land use levels arranged in the following order: LUI-2 (42.6%) > LUI-4 (34.7%) > LUI-3 (9.9%) > LUI-5 (7.6%) > LUI-1 (5.2%). Soil sampling sites were selected from the five land use intensities.

2.2. Sample Collection and Preparation

As physicochemical properties and heavy metal elements of the surface soil are more sensitive to anthropogenic activities than that of the deeper layers [18], 129 samples in the top 20 cm of soil were collected from the study area during October 2014, when the paddy rice fields had been drained and reaped (Figure 1). In the study area, the location of sampling sites was determined at random, with special consideration for different land use, vegetation and soil types to ensure an even coverage of the whole study area. The position of each sample site was identified with a portable GPS receiver to an accuracy of 3–5 m. In order to obtain a representative soil sample at each site, three sub-samples 50–100 m apart were collected and then mixed fully to form a composite sample. All soil samples were packed in polyethylene bags and returned to the laboratory.

2.3. Sample Chemical Analysis

These soil samples (average weight of 1 kg) transported to the laboratory were air-dried under normal temperature condition for 3 weeks. After air drying naturally, all samples were sieved through a 2-mm nylon sieve to remove the roots and coarse debris. Portions of the soil samples were then ground with a pestle and mortar until all particles passed through a 0.149-mm nylon sieve. Fourteen indexes were selected to represent the soil quality and the average conditions of heavy metal concentrations. Soil pH was analyzed in soil slurry with a pH meter at a 1:2.5 (g g−1) soil to water suspension. Soil particle size distribution was obtained using a laboratory’s laser particle size analyzer (Microtrac S3500, Microtrac Inc., Montgomeryville, PA, USA). Soil salinity was determined directly during the field survey using a salt-water sensor (SDI-12/RS485, Stevens, Portland, OR, USA). Soil organic carbon (SOC), nitrate nitrogen (NO3-N) and available phosphorus (AP) are important indicators of the soil nutrient content. SOC was measured by a TOC analyzer (HT-1300 Solids Module, Analytik Jena AG, Jena, Germany) after removing soil carbonates with 1 M HCI. Soil AP was analyzed using the photoelectric colorimetry method, while the NO3-N was extracted using the deoxidization photoelectric colorimetry method.
For analysis of total concentrations of soil metals including iron (Fe), manganese (Mn), Pb, Cu, Cd, Zn, Cr and Ni, soil samples (0.149 mm) were digested using an HNO3-HF-HCIO4 mixture in Teflon tubes at 160 °C for 6 h and then measured by inductively coupled plasma-atomic emission spectroscopy (ICP-AES: Hitachi P-4010, Tokyo, Japan). Parallel analysis and standard reference materials (GBW-07401, Chinese Academy of Measurement Sciences) were used to assess the quality assurance and control. The obtained recovery rates for the standards were between 95.12% and 104.47%. The analytical results met the standard requirements of Technical Specification for Soil Environmental Monitoring HJ/T 166-2004 (National Environmental Protection Administration of China 2004).

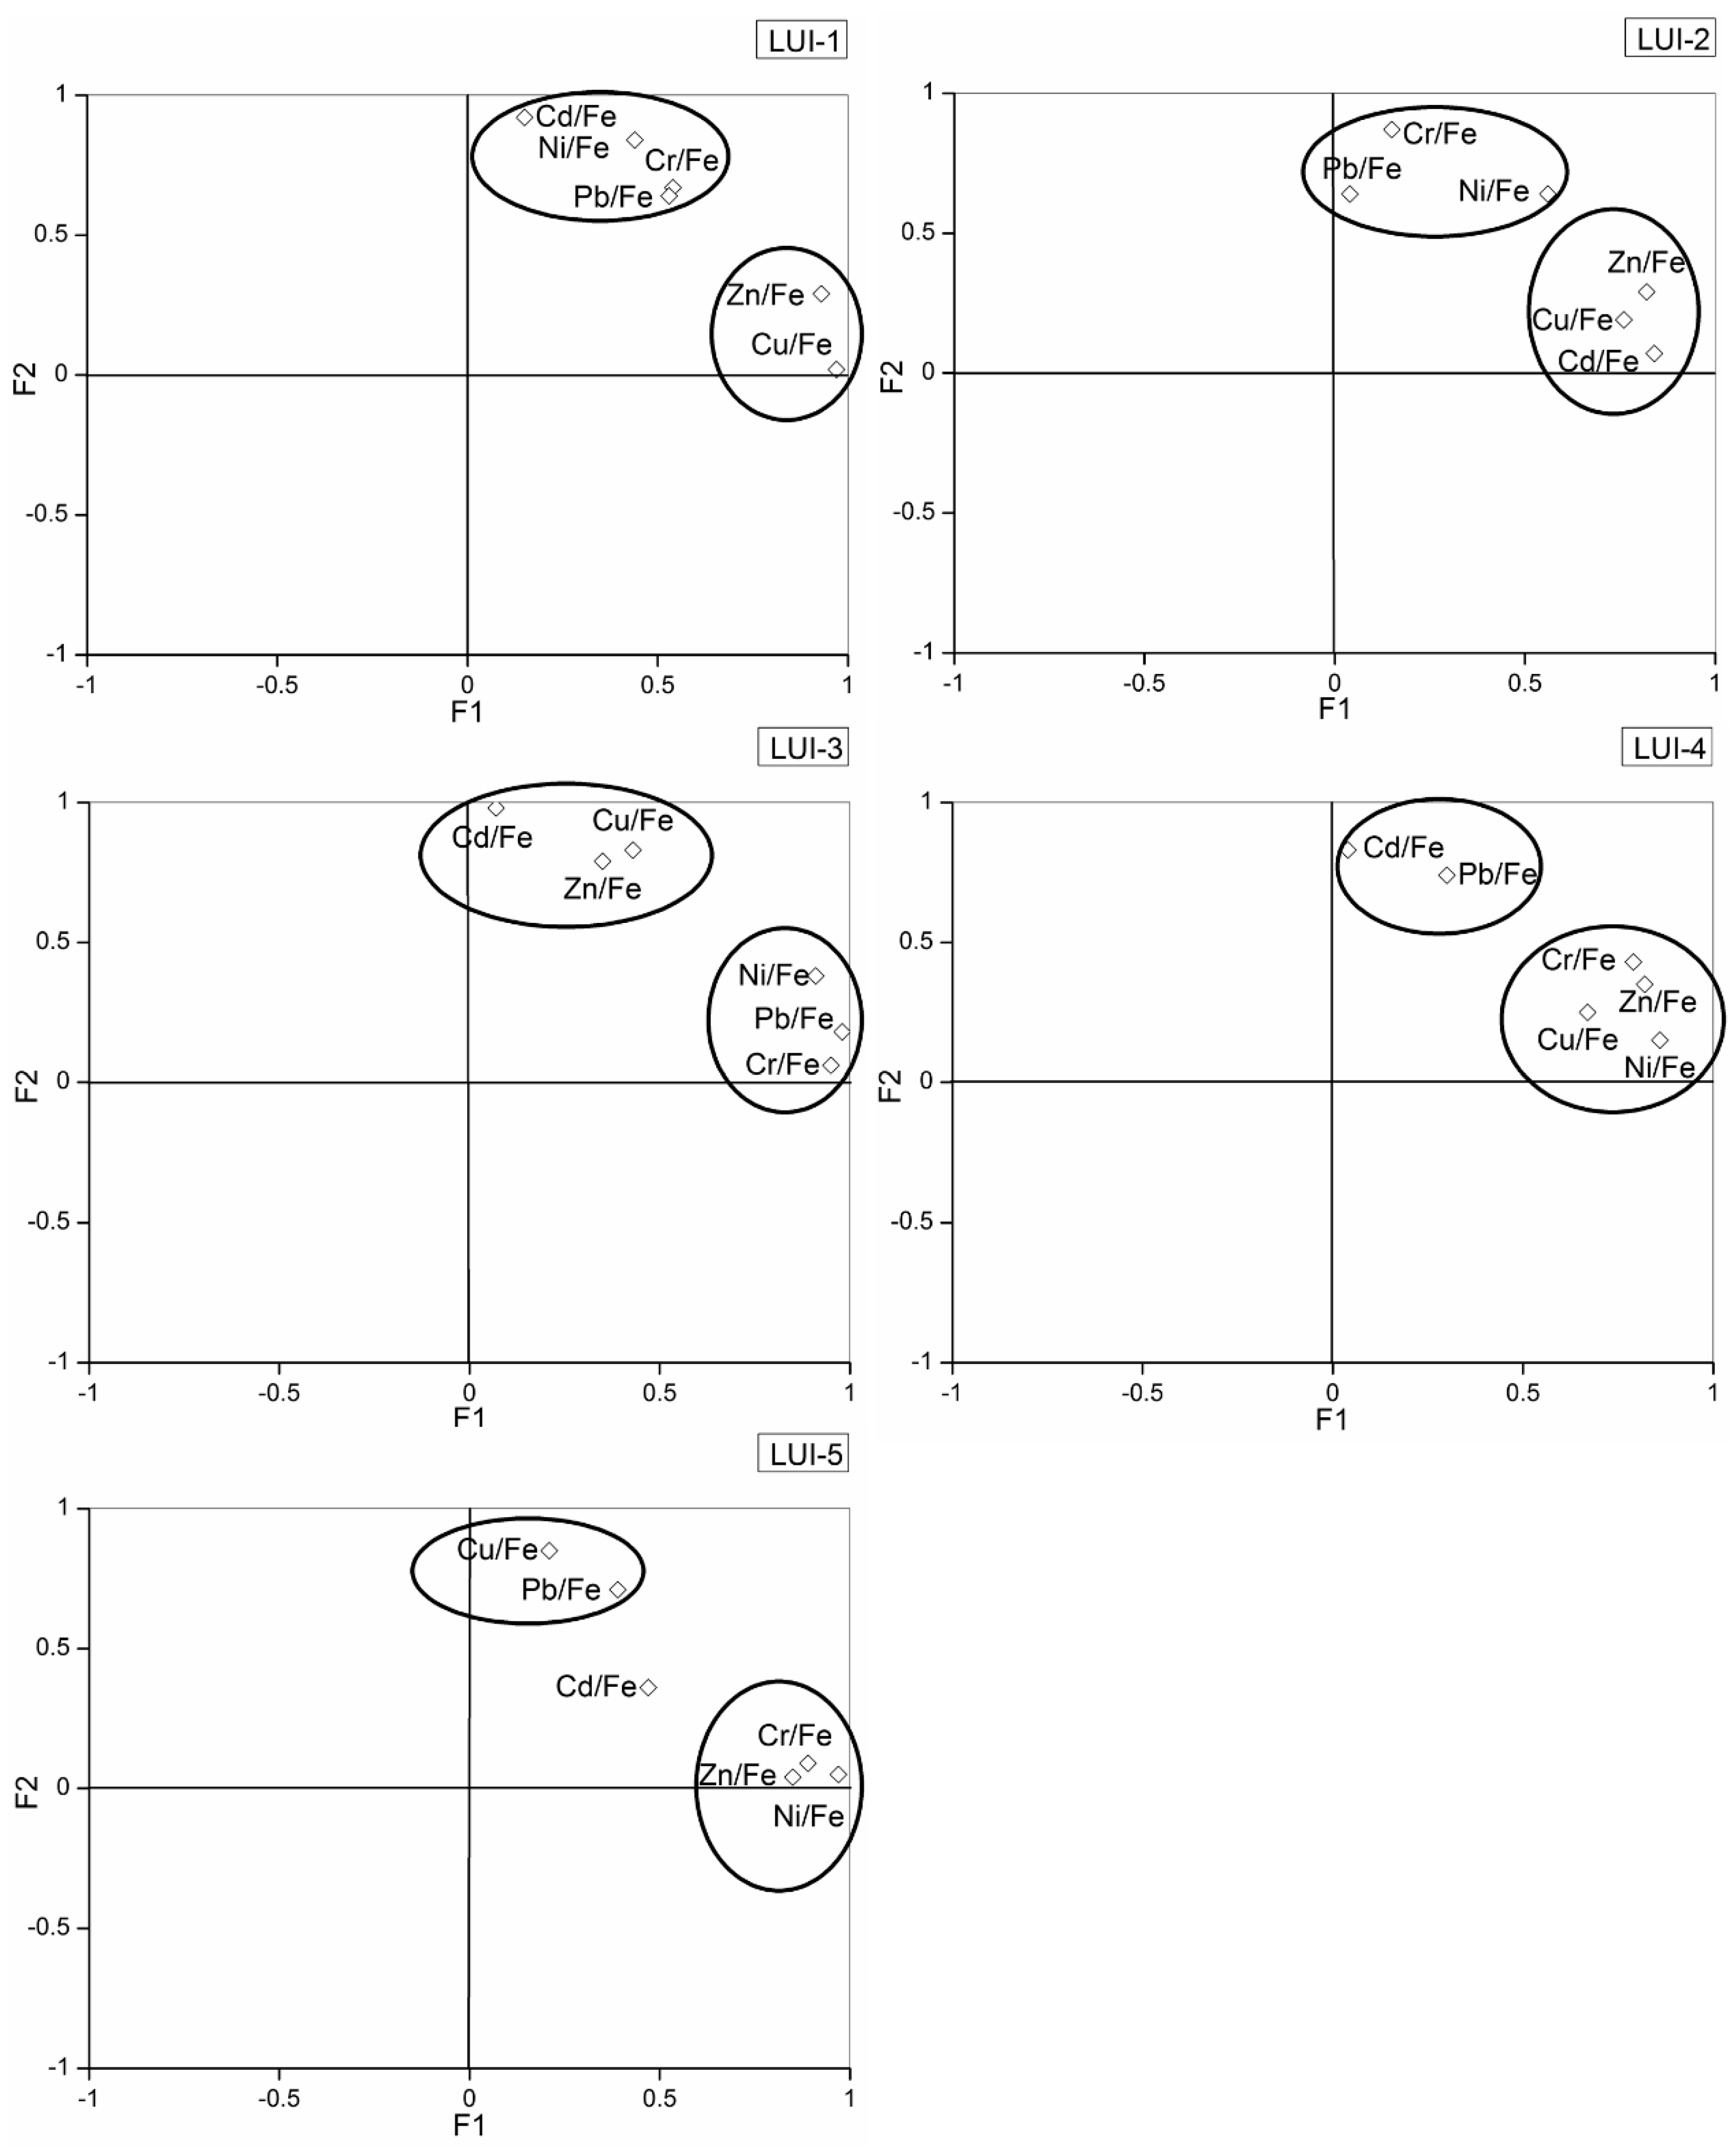
2.4. Statistical Analysis

Descriptive statistics were used to calculate the statistical parameters of soil properties and metals to evaluate the data distribution. The Kolmogorov-Smirnov (K-S) test was used to examine the normality of the probability distributions of soil variables. When these variables were not passing the normality test at the 0.05 significance level, they were normalized by logarithmic transformation or Box-Cox transformation. Pearson’s correlation analysis and factor analysis were carried out to investigate the relationships between the selected soil properties and heavy metals and to identify potential sources of heavy metals. The soil properties and total metal concentrations from different land use intensity were compared using multivariate analysis of variance (ANOVA) followed by post hoc least significant difference test (p < 0.05). All statistical analyses were processed with SPSS 13.0 (SPSS Inc., Chicago, IL, USA). Data transformation was performed using MiniTab 17.0.

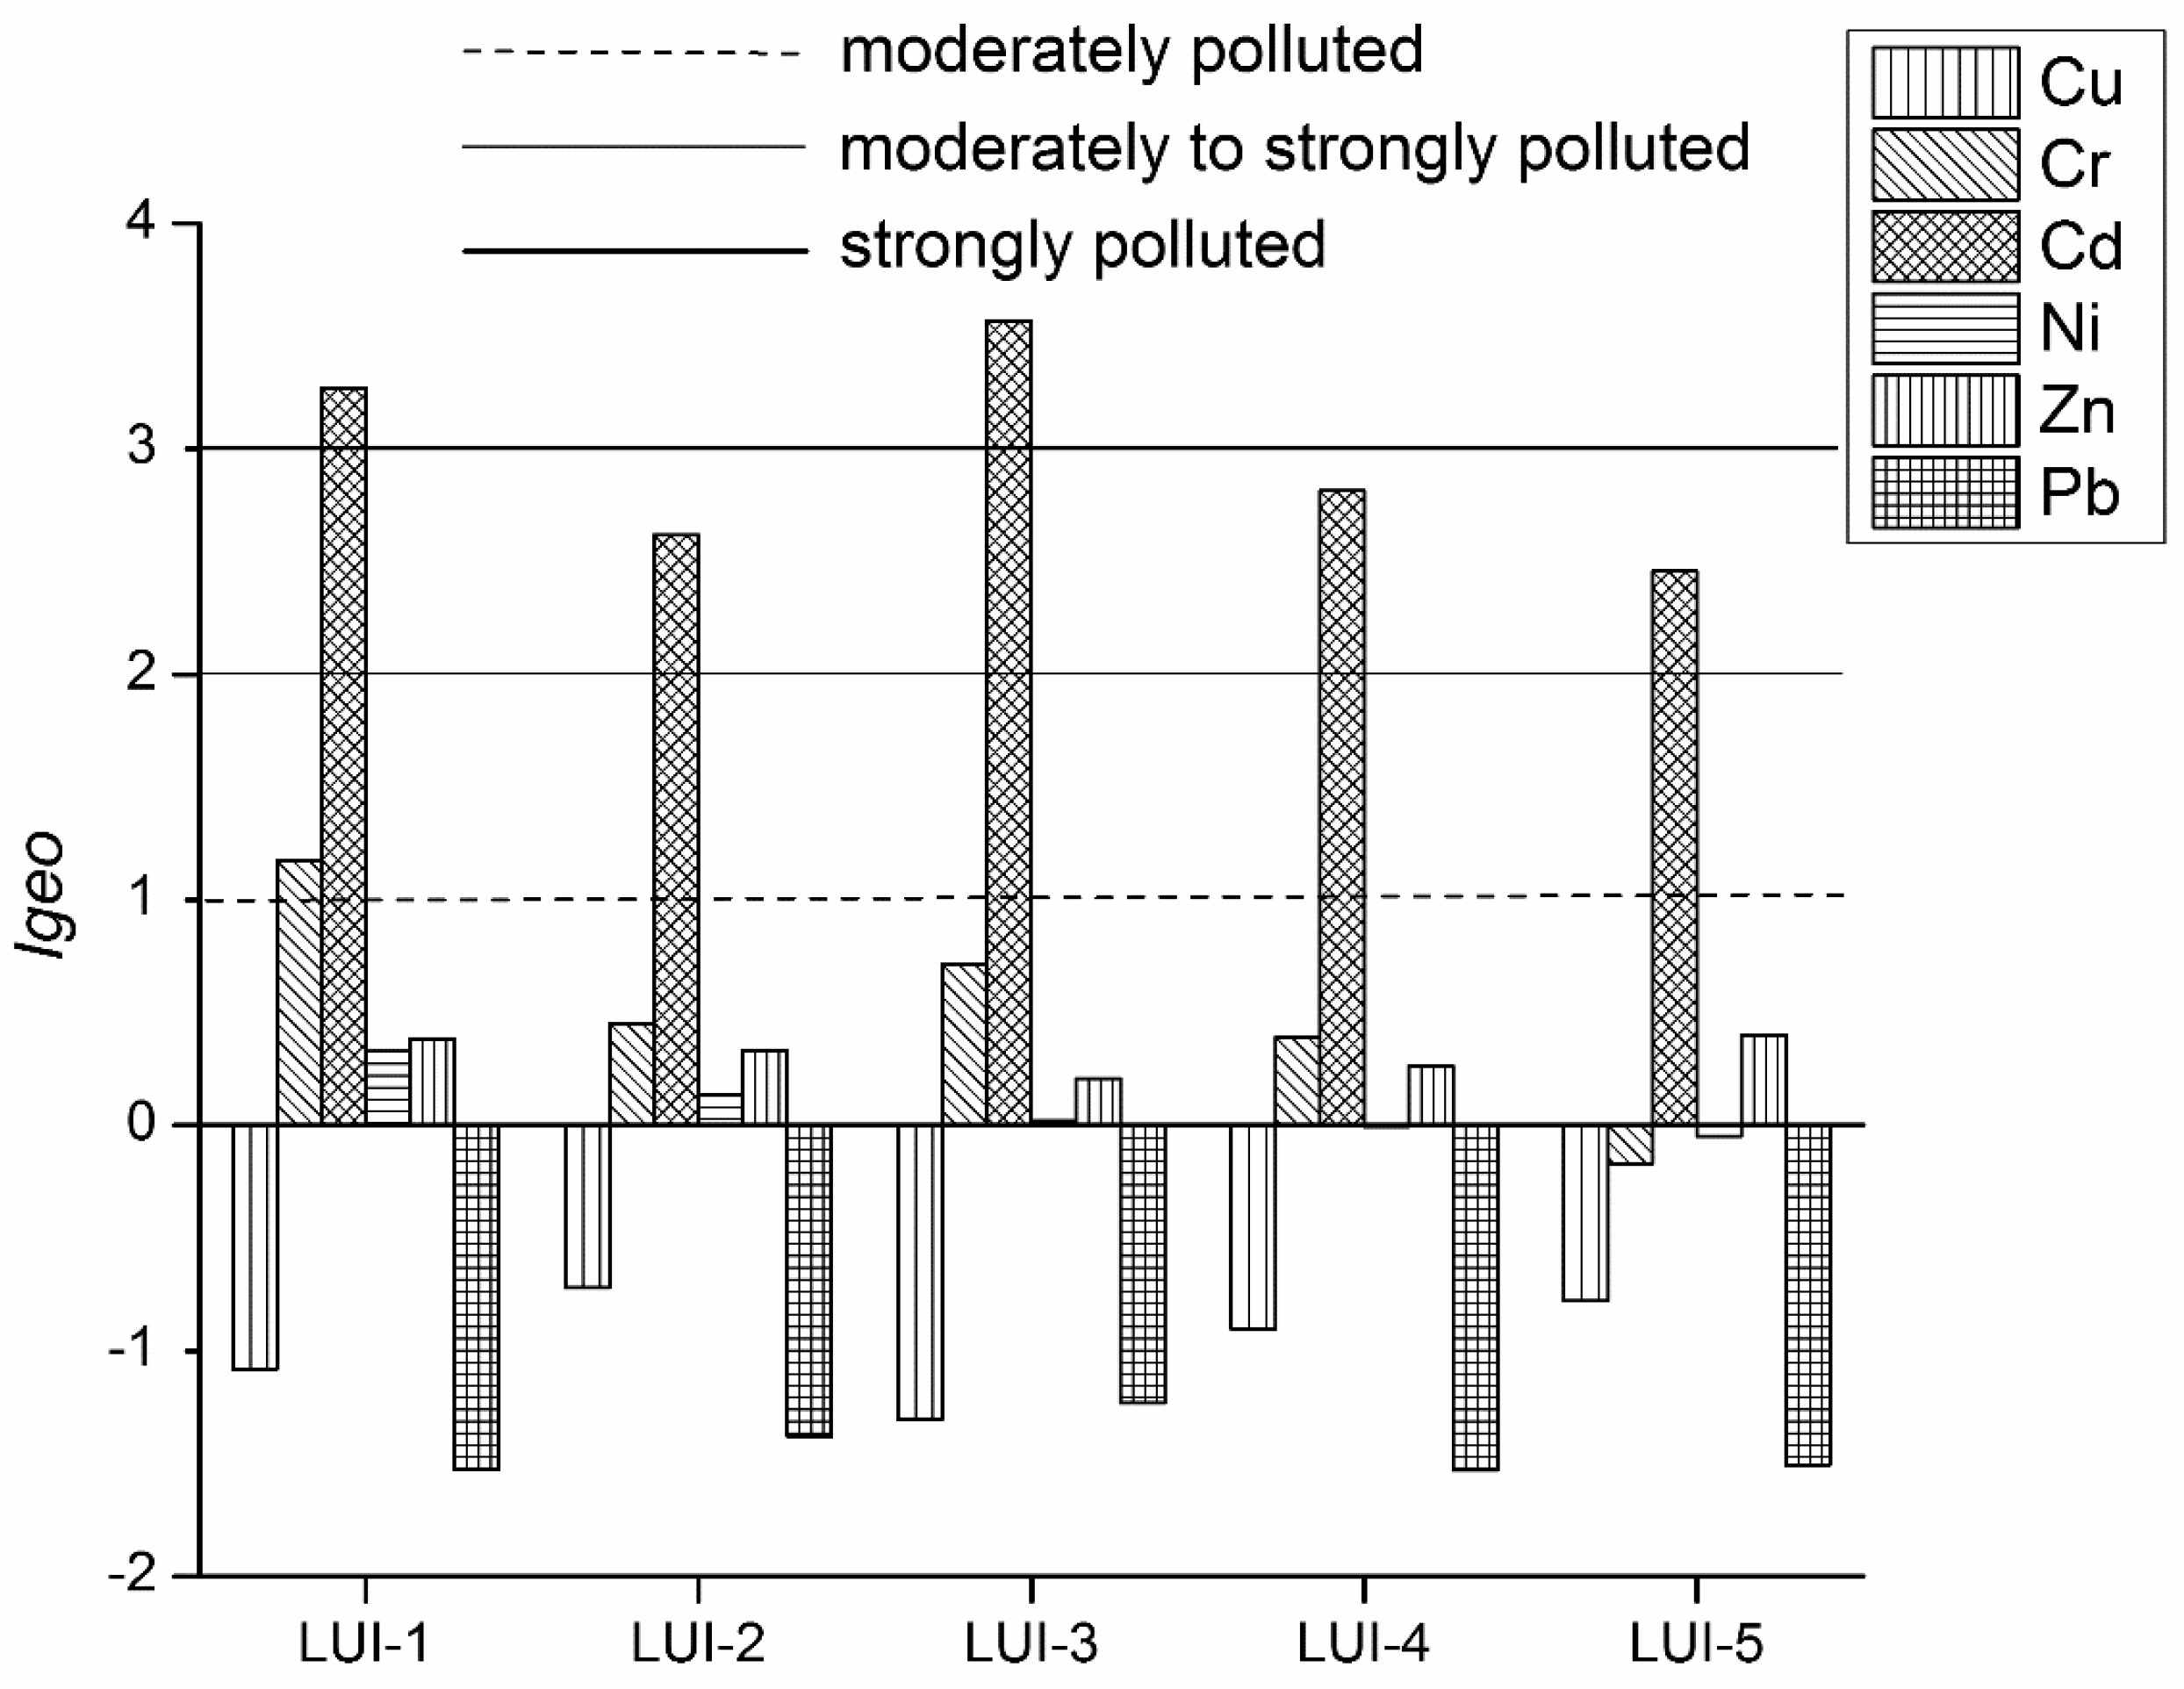
2.5. Index of Geo-Accumulation

The Geo-accumulation index (Igeo) is often used to evaluate enrichment status of soil heavy metals and was calculated by the following formula [19]:
I g e o   =   log 2   ( C n 1.5 B n )
where Cn and Bn are the measured and background values of a given heavy metal (unit: mg kg−1), respectively, and the constant 1.5 compensates for natural fluctuations of given metal and for minor anthropogenic impacts [20]. The corresponding background values for Cd, Cr, Cu, Ni, Pb and Zn were 0.11, 57.9, 19.8, 25.6, 21.4 and 54.2 (unit: mg kg−1), respectively [21]. According to Muller [19], heavy metal pollution can be divided into five levels: unpolluted (Igeo < 0), unpolluted to moderately polluted (0 < Igeo < 1), moderately polluted (1 < Igeo < 2), moderately to strongly polluted (2 < Igeo < 3), strongly polluted (3 < Igeo < 4), strongly to extremely polluted (4 < Igeo < 5), and extremely polluted (Igeo > 5). To identify the potential spatial distribution of soil heavy metal pollution, the inverse distance weighting (IDW) was used for interpolation and for producing maps with ArcGIS software for desktop (ver. 10.1, ESRI). The process of the interpolation was performed as described in this reference [22]. Figures were drawn by OriginPro 8.0 and ArcGIS 10.1.

3. Results and Discussion

3.1. Descriptive Statistics

Descriptive statistics for the soil properties and heavy metal concentrations are shown in Table 2. The rock-forming elements Fe and Mn concentrations were high (>100 mg kg−1), and the mean Cr and Zn concentrations were relatively high, at 154.95 and 102.21 mg kg−1, respectively. The heavy metal concentrations and the soil properties apart from pH varied widely in different samples. The pH values varied in a range from 6.65 to 8.80, indicating the soil samples were weakly acidic to weakly alkaline. The salinity was 0.01–0.62 ms m−1, and the SOC, NO3-N, and AP contents (representing soil nutrient) were 0.05–2.88%, 0.25–10.72 mg kg−1, and 0.72–26.46 mg kg−1, respectively. The coefficients of variation (CV) for the heavy metal elements varied in a range of 12.63–58.23%. Among them, Cd, Cr, Cu, Mn and Pb had relatively high CVs (>30%), suggesting that their distributions might be influenced by human activities. Fe, Ni and Zn had lower CVs (<30%), indicating they were distributed in the study area more evenly. Salinity, NO3-N content, and AP contents had high CVs, 97.33%, 94.68% and 74.80%, respectively, indicating that they varied widely in the study area and implying human activities have affected them. For the soil fractions, statistical results indicated that the major soil texture was from silt loam to sandy loam in the study area (Table 2).

3.2. Correlation Analysis of Soil Physicochemical Properties and Metals

The Pearson correlation matrix shown in Table 3 was used to identify correlations between the metal concentrations and soil properties. The six heavy metal (Cd, Cr, Cu, Ni, Pb and Zn) significantly positively correlated (p < 0.01) with one another. The Cu concentration strongly correlated with the Ni and Zn concentrations (the correlation coefficients were 0.52 and 0.71, respectively), and the Cr-Ni, Cr-Zn and Ni-Zn correlation coefficients were 0.71, 0.52 and 0.57, respectively, suggesting that these metals could have similar anthropogenic origins. The Pb concentration correlated (p < 0.01) with the Cu, Ni and Zn concentrations but weakly correlated with the Cd and Cr concentrations, implying that Cd, Cr and Pb probably had different sources. Turer et al. [23] has reported that atmospheric deposition is an important source of Pb to soil and sediment. The Fe and Mn concentrations significantly positively correlated (p < 0.01), suggesting both elements have a similar chemical behavior, which was presented partly in oxide form and partly in hydroxid form [24]. Zhou et al. [25] and Bai et al. [13] stated that a lithogenic control over the distribution of Fe and Mn in the reclaimed wetlands of Pearl River Estuary (PRE). Therefore, the variability of Fe and Mn was controlled by soil parent materials in the regional scale.
In all measured soil properties, some typical correlations could be identified based on the correlation matrix analysis. As shown in Table 3, the significantly positive correlation was observed between soil salinity and pH (p < 0.01), but they had reverse effects on NO3-N (p < 0.01, 0.05). This finding suggested that the increase of salt concentration could lead to the rise of pH value, while higher salinity and pH might result in decreasing N mineralization [26]. It was obviously found that SOC had significantly positive correlation with clay and silt particles and negative correlation (p < 0.01) with sand content. This result kept in line with Li et al. [27] and Rainer et al. [28], who reported the positive effect between SOC and clay and silt content were due to the stabilization of SOM by fine particles and physical protection of SOC from oxidation by the relatively smaller spaces in soils. Moreover, the significant correlation was observed between SOC and NO3-N, which might imply that soil organic matter was also likely one of the main sources of soil N supply [29].
It has been found that SOM, pH, salinity, and soil texture directly and indirectly affect heavy metal mobilities and solubilities in soil and sediment [13,22]. As shown in Table 3, apart from Cr (p < 0.01) and Ni (p < 0.05), no other metals showed significant correlation with salinity. Although the correlations between pH and heavy metals (except Cu and Pb) were not significant, we found that the pH had the weak reverse impact on heavy metal concentrations and were in agreement with Li et al. [11] and Zhang et al. [30]. They reported that the low-pH soil could facilitate the migration and availability of heavy metals. No significant correlations were observed between NO3-N, AP and metals. The Cd, Cr, Cu, Ni and Zn (but not the Pb) concentrations significantly positively correlated (p < 0.01) with the SOC, clay, and silt contents and significantly negatively correlated (p < 0.01) with the sand content. These findings were supported by previous researches and suggested that SOM and finer particle-size fractions (clay and silt) could act as major sinks for heavy metals due to their strong absorption capacity and increased surface areas [31,32]. However, there was no significant correlation between Fe, Mn and SOC, suggesting that the inputs of SOC might be from external source following other heavy metals.

3.3. Potential Sources of Heavy Metals in Different Land Use Intensity

Understanding the effects of human activities on heavy metals in soil requires the potential sources of the heavy metals in different land use levels to be identified. Multivariate Statistical Analysis (MSA), including Pearson correlation (PC) and factor analysis (FA), was considered to be an effective tool for identifying the potential sources of heavy metals. Iron and Mn are lithogenic metals that enter soil through the weathering of rocks and are often used to distinguish natural and anthropogenic sources of heavy metals [33]. Significant correlations were found between the Cd, Cr, Cu, Ni, Pb and Zn and the Fe but no significant correlations were found between the six heavy metals and the Mn, indicating that the heavy metal concentrations were influenced by both natural and human factors. Normalization with reference elements can remove the influences of the textural characteristic of the soil or sediment on heavy metal concentrations and allow anthropogenic impacts to be described quantitatively [34]. Iron is widely used as a reference metal because it is naturally abundant and inert during the migration process. The coefficient of variation for the Fe concentrations in the samples was low, so Fe could be used to normalize the heavy metal concentrations and correct the effects of natural factors.
The factor analysis results are shown in Table 4. Two main factors (F1 and F2) with eigenvalues greater than 1 were extracted for each land use intensity, which all accounted for over 65% of the total variance. The loading plot for these factors was also displayed as Figure 3, which provided clearly visual information on the relationships among heavy metals. For the LUI-1, the normalized Cu and Zn built a close relative group dominated by F1 and were clearly separated from normalized Cd, Cr, Ni and Pb in F2. This suggested that Cu and Zn had different sources to the other heavy metals. The normalized Cd, Cu and Zn in LUI-2 and LUI-3 were controlled by F1 and F2, respectively, and the Cr, Ni, and Pb in LUI-2 and LUI-3 were controlled by F2 and F1, respectively. In the LUI-4, Fe-normalized Cr, Cu, Ni and Zn were strongly associated with the F1, and the F2 included normalized Cd and Pb. Similarly, for the LUI-5, the F1 was strongly and positively related to normalized Cr, Ni and Zn, and the F2 also showed highly positive factor loadings on normalized Cu and Pb.
Heavy metal contaminations in this study could probably be from industrial and agricultural wastewater, domestic sewage and atmospheric deposition. Low-lying wetland areas (LUI-1 and LUI-2) would have received heavy metals released by anthropogenic activities (LUI-3, LUI-4 and LUI-5) through the processes such as surface runoff and atmospheric dust. Trace metals, i.e., Cd, Cu, Ni and Pb, are normal constituents of crude oil [35]. However, spillages of petroleum hydrocarbons on land can strongly impact concentrations of soil heavy metals and therefore intensify pollution of heavy metals in sediments [36]. Previous studies showed that the concentrations of Cu, Cd and Zn (dominated by F1 in LUI-2, accounting for 40.16% of the variance) were more enhanced in the oil-spill-polluted soils [37]. Industrial activities, particularly the exploitation of the Liao River oilfield, were therefore the main explanations for F1 and F2 in LUI-2. But meanwhile, industrial sewage discharge also brought significant impacts on soils around aquacultural ponds located in the lower basin of the Shuangtaizi River (Cr, Ni and Pb dominated by F1 in LUI-3). Additionally, pharmaceuticals and fertilizers used for aquaculture could be the main sources of Cd, Cu and Zn in LUI-3 [38]. Agriculture (LUI-4) was the main human activity in the study area. Based on the factor analysis results in LUI-4, organic bio-fertilizers produced by animals fed feed containing heavy metals (Cr, Cu and Ni) [39], wastewater, chemical fertilizers and agrochemicals containing Cd and Pb are the most likely sources of the heavy metals in agricultural soils. Atmospheric deposition has previously been found to be the main source of Cu and Pb in soil near busy roads, and industrial wastewater and municipal solid waste have been found to be sources of Cr, Ni and Zn [40].

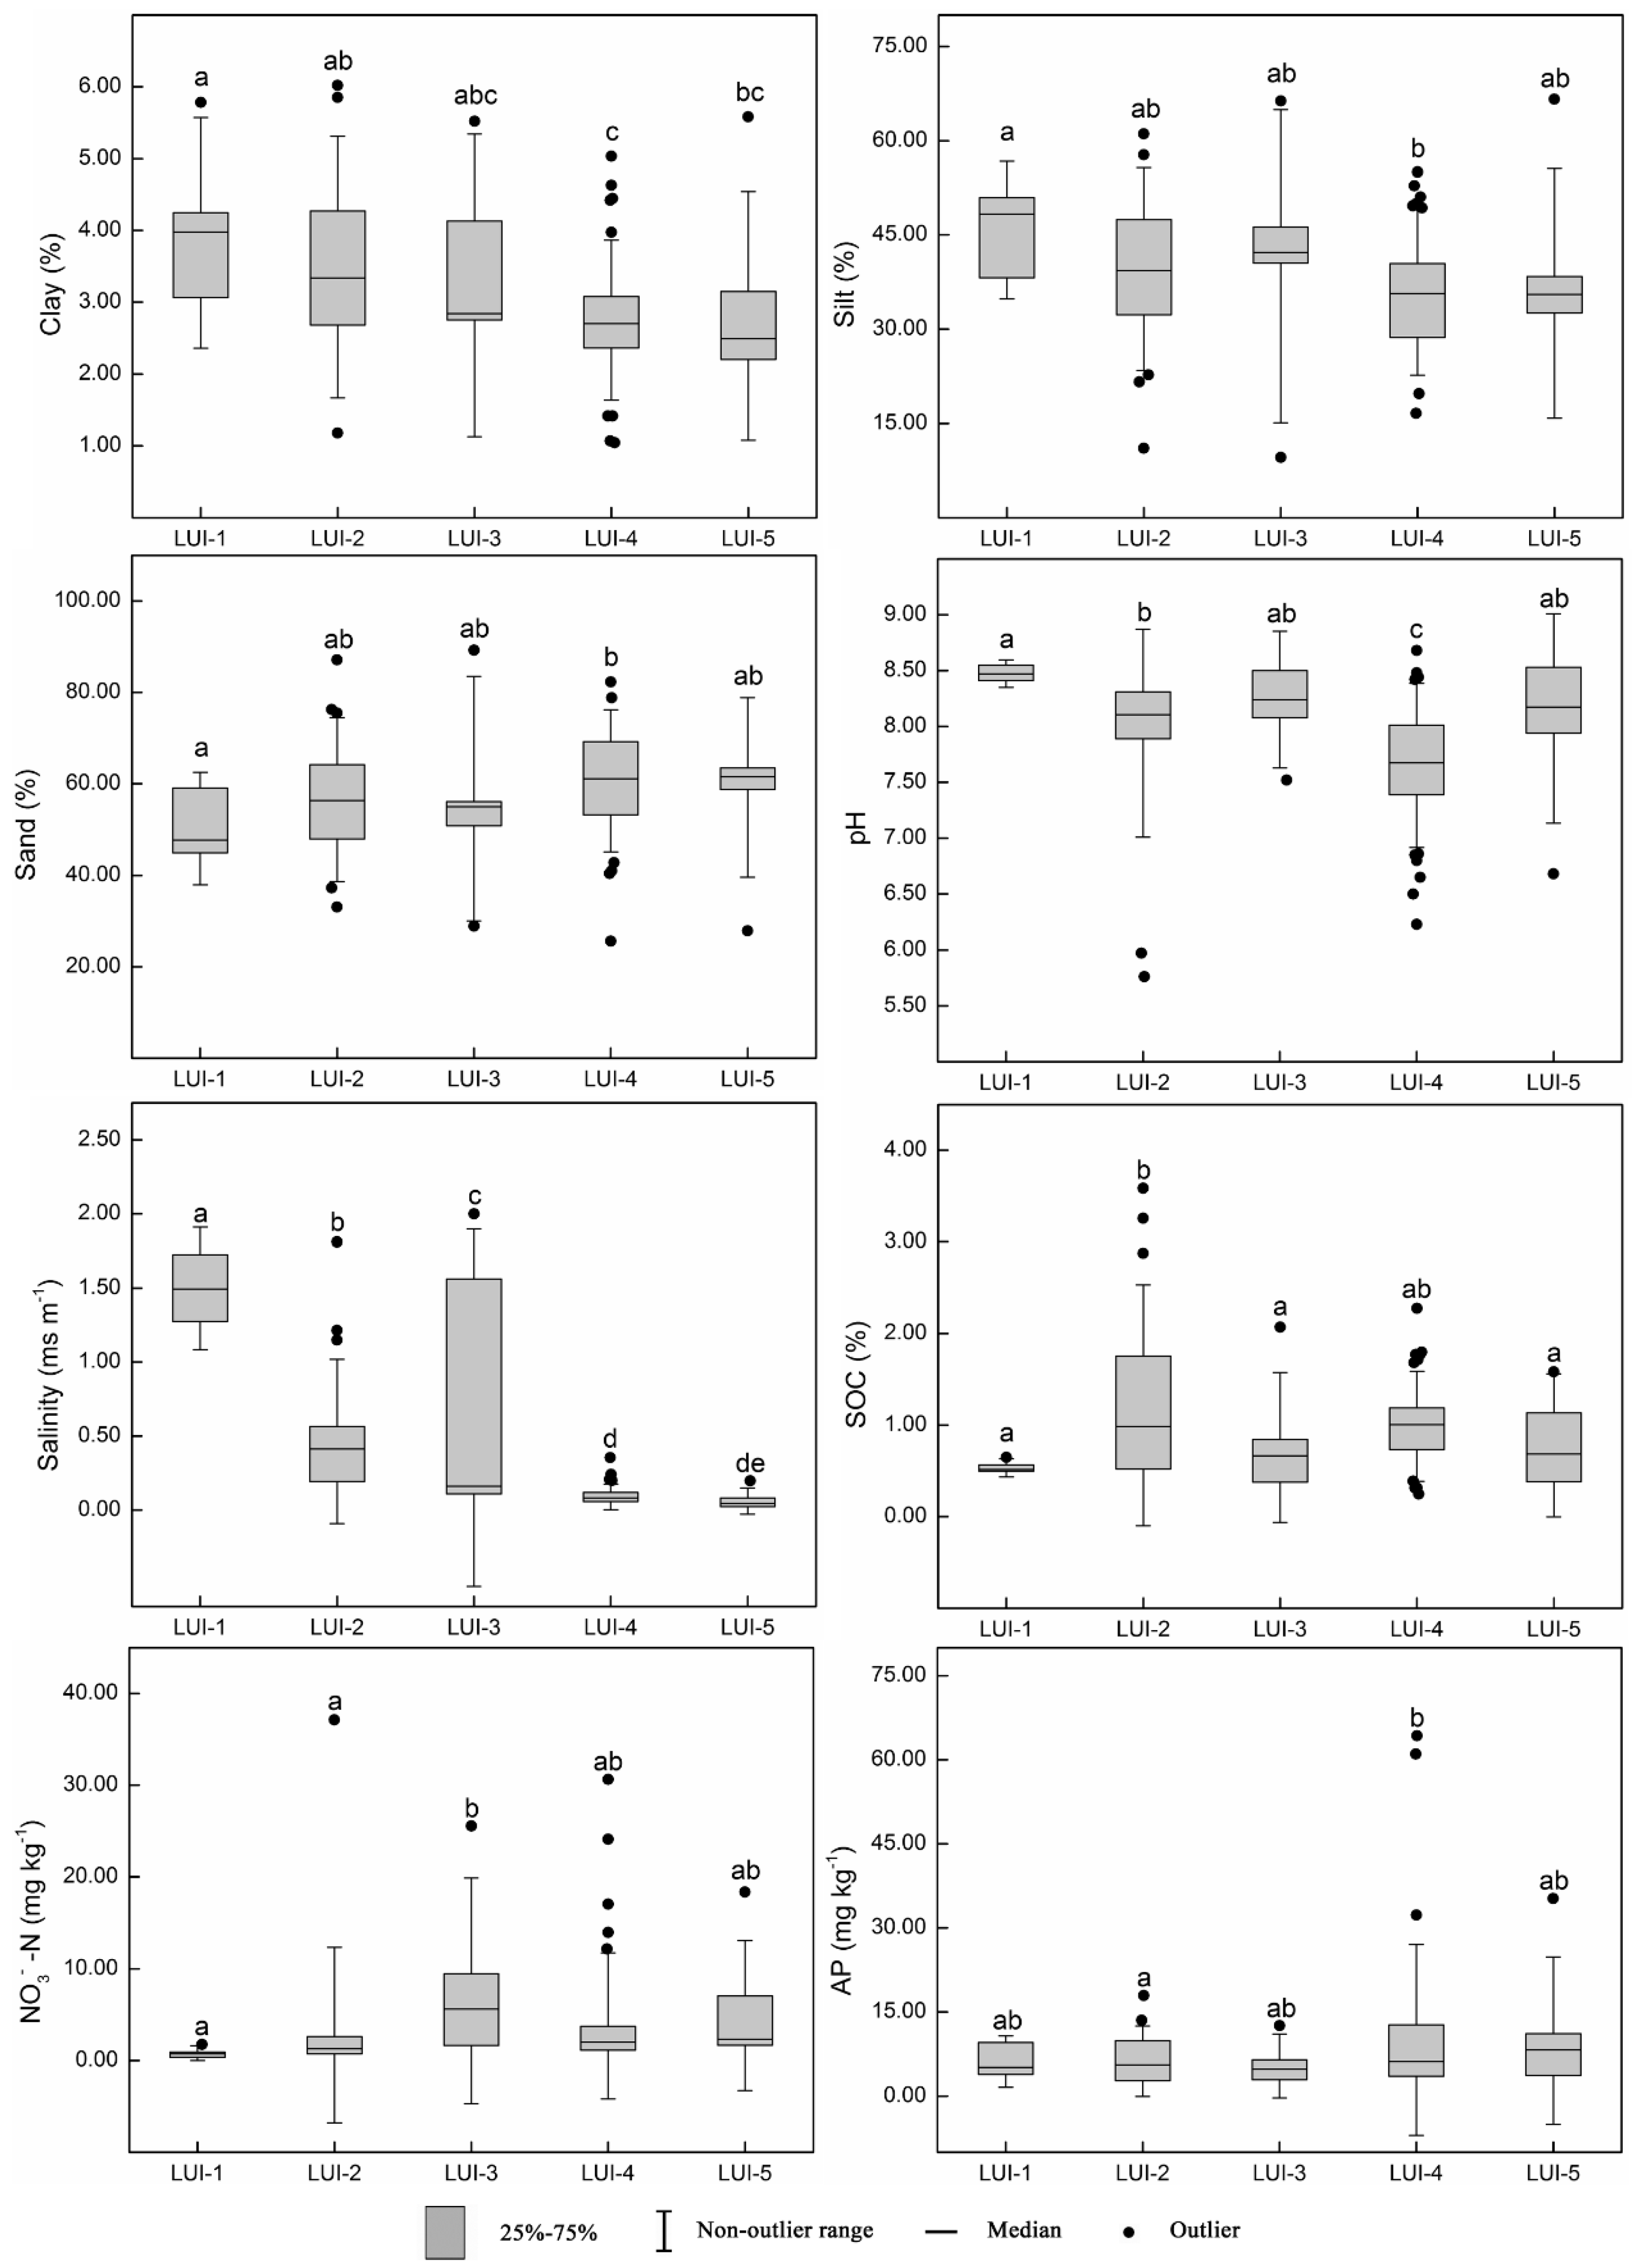
3.4. Effects of Land Use Intensity on Soil Properties

Box plots for the soil particle size, pH, salinity, and soil nutrient (SOC, NO3-N, and AP) contents of the samples representing the five land use intensities were displayed in Figure 4. Lower clay contents were found in the agricultural and built-up areas (LUI-4 and LUI-5) than in the tidal flat area (LUI-1). The silt contents followed a similar pattern, being significantly lower in LUI-4 than in LUI-1. However, the sand contents were significantly higher in the agricultural field area (LUI-4) than in the tidal flat area (LUI-1). Rapid and extensive agricultural reclamation of the coastal wetlands in the study area has occurred over the past five decades. Long-term agricultural practices have led to soil erosion, during which clay and silt are preferentially removed and transported. A lack of fine particles in soil will strongly affect soil structure and fertility. It has previously been found that soil quality can be improved by increasing the vegetation coverage to prevent soil erosion occurring and to decrease the loss of fine particles, especially in the rainy season after crops have been harvested [41]. The pH values ranged from 7.68 to 8.47, with the highest value observed in tidal flats (LUI-1) and the lowest value in agricultural areas (LUI-4). No significant differences were observed among other land use intensities. Generally, the soil in the study area was weakly alkaline because the primary soils were considerably influenced by the coastal deposition background. The study in Sanjiang Plain of northeast China [42] found the decalcification process lowered soil pH from >7 to acidity after long-term reclamation. Soil acidification caused by leaching process as well as overuse of chemical fertilizers has occurred in China’s interior. However in coastal areas, i.e., in the Chongming Island of Yangtze Estuary [29], the soil pH reached 6.71 after 100 years of reclamation on coastal wetlands, implying that soils in the study area may suffer acidification in future if inappropriate agricultural management practices are operated. The soil salinity generally decreased as the land use intensity increased, rapidly from 1.49 ms m−1 in LUI-1 to 0.41 ms m−1 in LUI-2, then slowly to 0.16 ms m−1 in LUI-3. The salinities in the natural areas (LUI-1 and LUI-2) and aquacultural pond area (LUI-3) were significantly different (p < 0.05), but no significant differences (p > 0.05) were found between the salinities of the other two areas. The rapid desalinization was attributed to strong leaching processes caused by cutting off seawater after wetland reclamation [29].
The SOC, NO3-N, and AP contents are strong indicators of soil fertility. In general, SOC was significantly higher in LUI-2 (0.98%) than in other land use areas, except agricultural areas (LUI-4, 0.97%), while LUI-1 (0.51%) had lower SOC content than aquacultural pond and built-up land areas (0.66% for LUI-3, and 0.68% for LUI-5), and no significant differences (p > 0.05) were found among the three land use intensities. LUI-4 retained a level of SOC almost as high as the LUI-2, but no significant differences were found among the agricultural areas, aquacultural pond and built-up land areas. This might be due to high perturbation from outliers. SOC could be physically stabilized by soil aggregates or chemically stabilized by organo-mineral associations [43]. In the study area, large amounts of SOC were stored in soil covered by Phragmites australis (LUI-2), which might have been caused by the large amounts of inputs from higher plants, human activities (i.e., oil exploration), irrigation of paper wastewater and also as consequence of the slow turnover rates of organic material under anaerobic conditions. The agricultural use of reclaimed wetland initially alters the soil environment, the SOC stocks in the surface soil rapidly decomposing once exposed to air. However, long-term fertilization and application of sludge to arable land (especially paddies) allows organic matter to be accumulated and increases the SOC content, finally improving soil fertility. The NO3-N content was significantly higher in aquacultural ponds (LUI-3, 5.63 mg kg−1) than barren land and natural areas (0.74 mg kg−1 for LUI-1, and 1.27 mg kg−1 for LUI-2), while no significant differences were observed among other land use types. The standard deviations for the NO3-N contents for all of the land use intensities except for LUI-1 were high because different forms of N (N2, NH4+, N2O, NO, NO2 and NO3) can be transformed under natural conditions [17]. Aquacultural pond water is partly seawater, which contains less nitrogen than does inland surface water. Applying nitrogen-containing fertilizers to aquacultural pond water can improve water quality and fertility and promote phytoplankton growth, increasing the food intake of the fish and shrimp being cultured. The AP content in agricultural areas (LUI-4) was 6.21 mg kg−1, significantly higher than the AP content in the marsh area (LUI-2, 5.53 mg kg−1). The biogeochemical P cycle is different from the C and N cycles in marsh and arable ecosystems. P is poorly mobile and is easily fixed in the soil [44]. The AP content in LUI-4 could have been higher than the AP contents in the other areas because the inputs of phosphorus as fertilizer application were more than the outputs as crop harvesting. Overall, the SOC, NO3-N, and AP contents indicated that strong soil erosion and leaching processes led to the soil degradation and the decrease of soil salinity and pH but that soil fertility improved as land use intensity increased. In future, it will be necessary to monitor the nutrient statuses of the soils in reclaimed areas, especially in estuaries in semi-closed seas, because eutrophication occurs easily in such areas because of the loss of N and P from the soil through the drainage system [45].

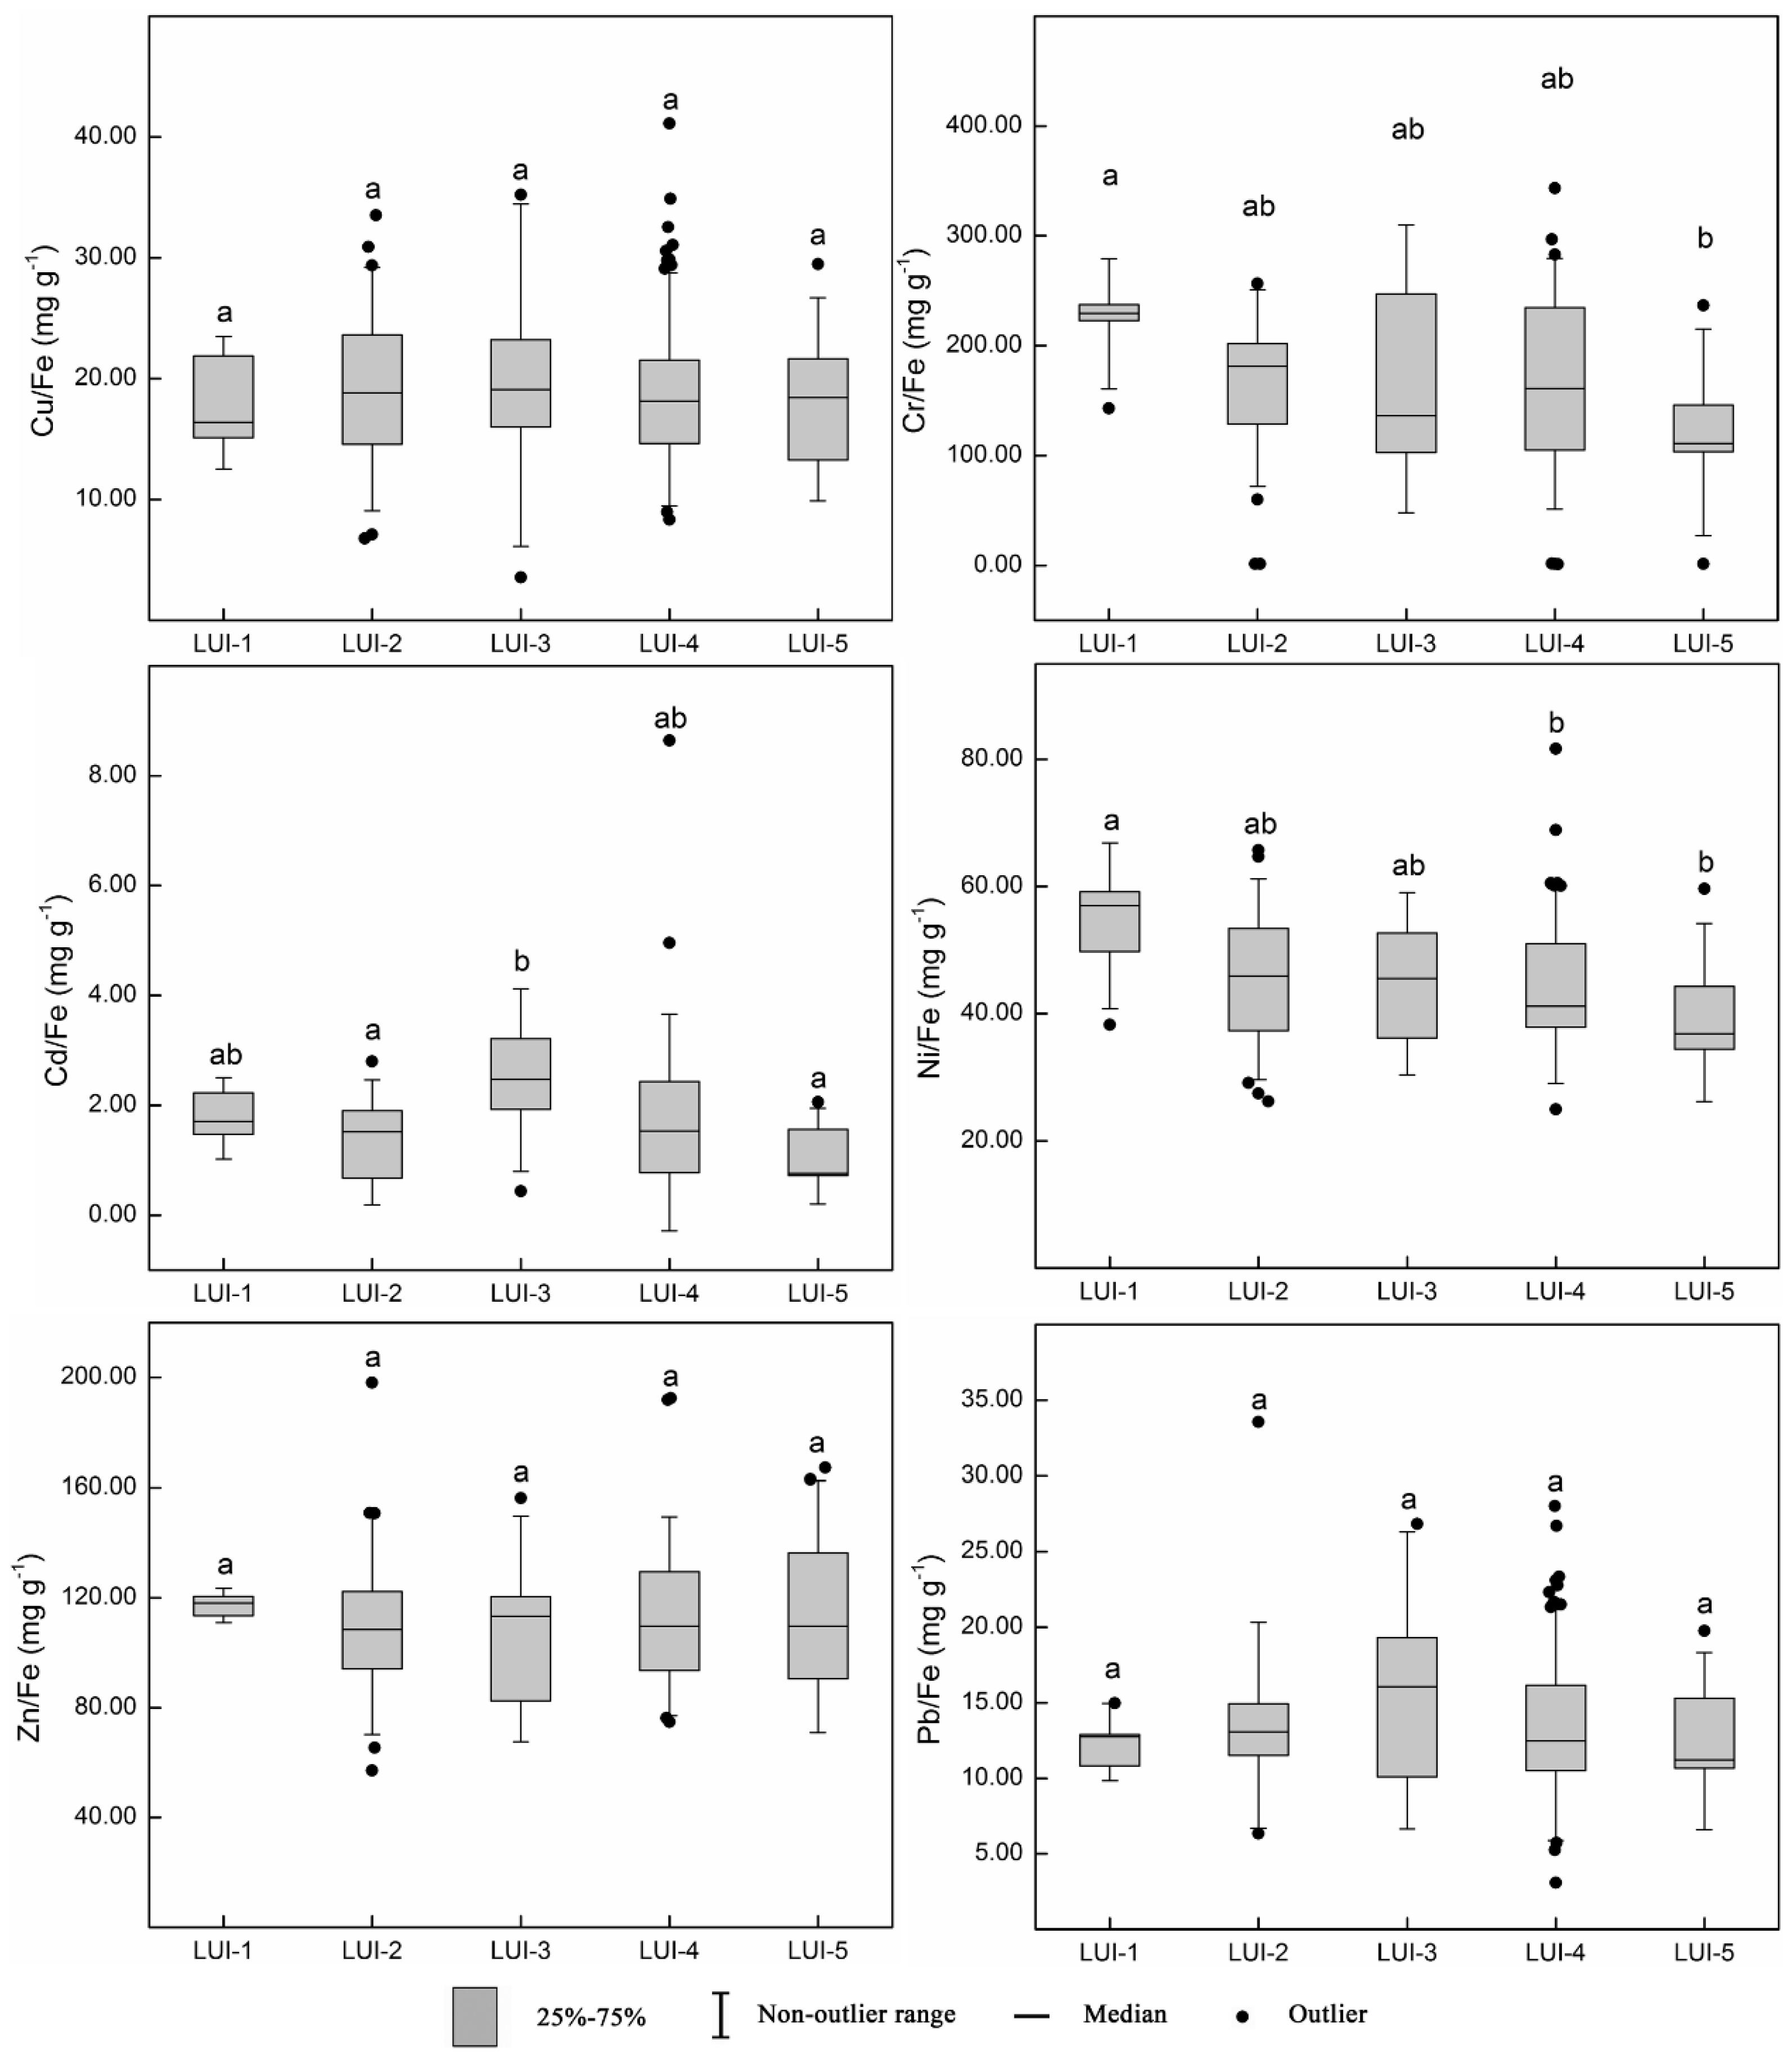
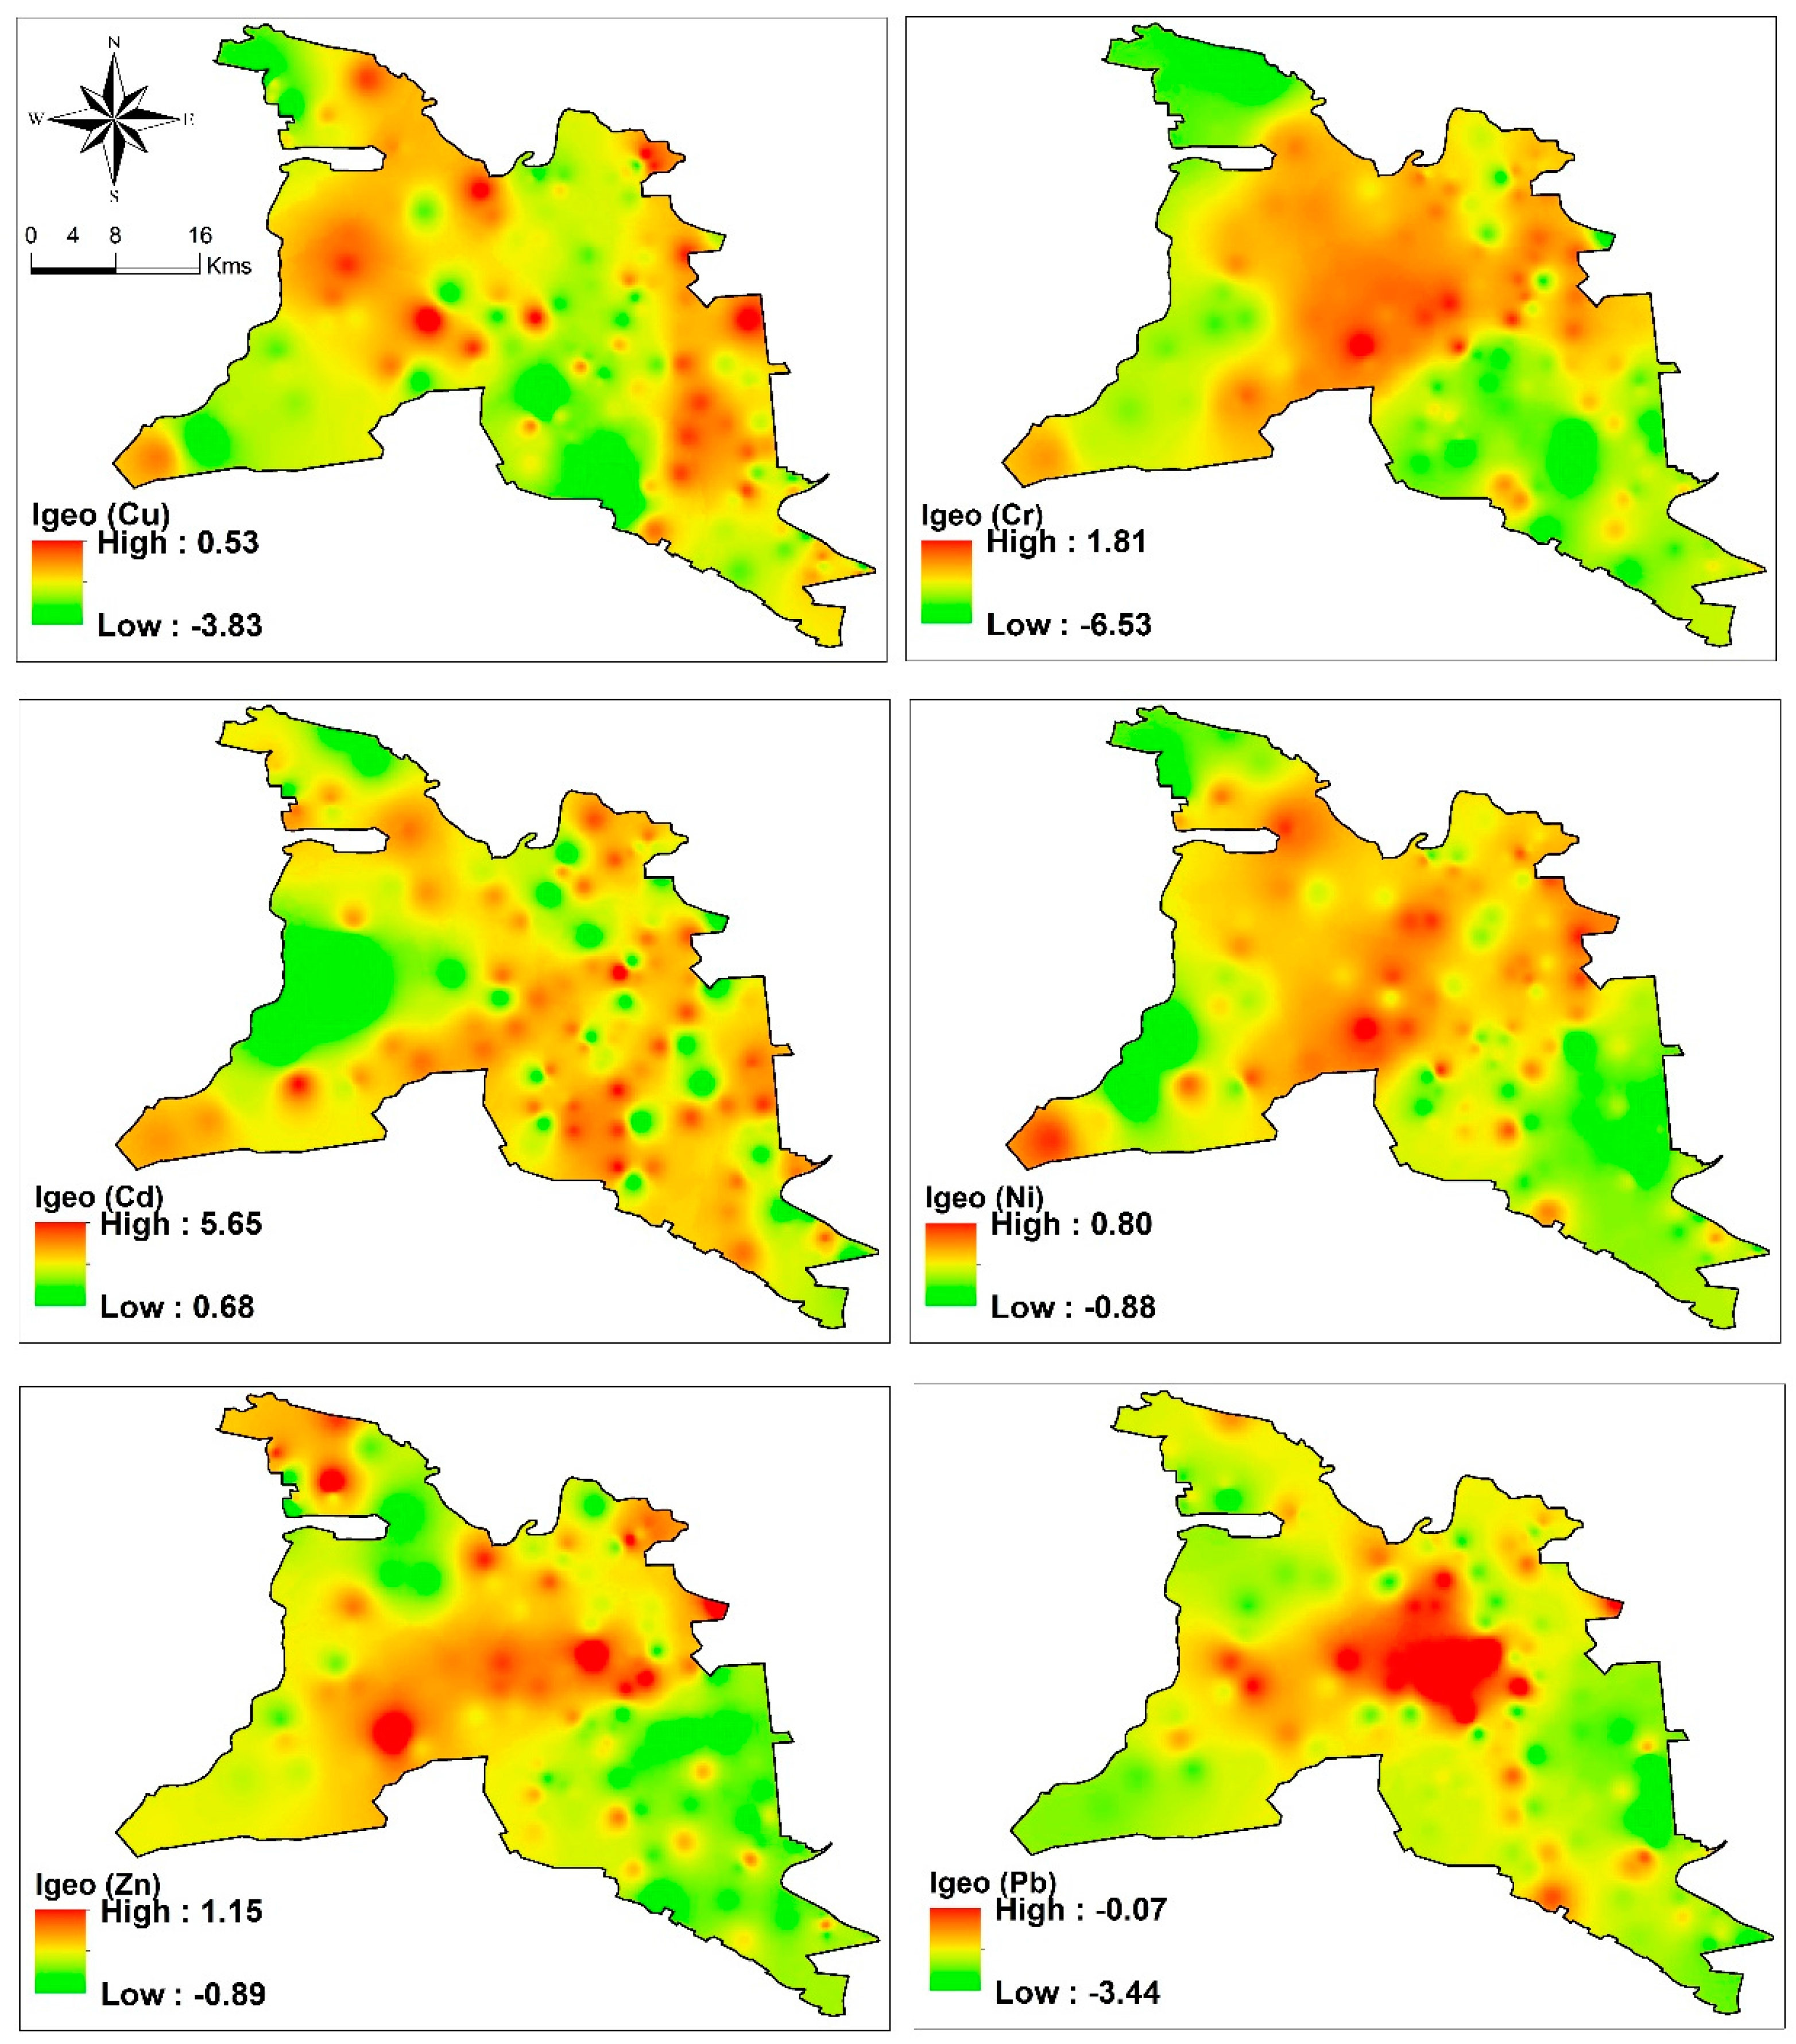
3.5. Assessment of Heavy Metal Pollution under Different Land Use Levels

Natural and anthropogenic processes can affect the heavy metal distributions in soils and sediments [12]. The Fe-normalized heavy metal concentrations were calculated to mitigate the effects of geogenic and pedogenic factors on heavy metal distributions. Significant differences between the six normalized heavy metals in different land use intensities are shown in Figure 5. Generally, Cr showed the highest median value, followed by Zn, Ni, Cu, Pb and Cd. However, although the concentration of Fe-normalized Pb in aquaculture ponds was much higher than in other land use types, the ANOVA showed no significant differences were observed among the concentrations of Fe-normalized Cu, Zn and Pb in the five land use levels (p > 0.05). The concentration of Fe-normalized Cr in tidal flats (LUI-1) was 229.52 mg g−1, which was much higher than in built-up areas (LUI-5, 110.99 mg g−1). Similar land use intensity impact was also found for the concentration of Fe-normalized Ni, i.e., tidal flats (LUI-1) showed a significantly higher level (56.98 mg g−1) than agricultural and built-up areas (LUI-4 and LUI-5, 41.17 mg g−1 and 36.84 mg g−1, respectively). With respect to Fe-normalized Cd, the highest content (about 2.48 mg g−1) appeared in LUI-3, which was significantly higher than in LUI-2 (1.52 mg g−1) and LUI-5 (0.76 mg g−1). Overall, except for the high concentrations of Fe-normalized Cd and Pb in aquaculture ponds (LUI-3), the natural areas (LUI-1 and LUI-2) had higher Fe-normalized Cr, Cu, Ni and Zn concentrations than did the areas affected most by human activities (LUI-3, LUI-4 and LUI-5).
Heavy metal pollution is an inorganic chemical hazard, with the rapid development of China’s economy in the past 30 years, the environmental risk posed by heavy metal pollution is becoming a matter of wide concern [11]. In this study, the features of heavy metal concentrations under diverse land-use level were different. Therefore, based on the factor analysis, it can be expected that the different anthropogenic sources will have had different effects on heavy metal pollution in the five land use levels.
Heavy metal pollution can be evaluated in different ways, such as by using the geo-accumulation index (Igeo), the Hakanson ecological risk index, the mean sediment quality guideline quotient (SQG-Q), or EFs [46]. The Igeo is typically used to assess the degree of anthropogenic or geogenic accumulated pollutant loads and is used most often because it tends to be much more accurate than the other indices [47,48]. The heavy metal pollution levels in different land use intensities were determined using the Igeo, and the results were shown in Figure 6. Inverse distance weighted interpolation was used to indicate the spatial distributions of the pollution levels, and the results were shown in Figure 7.
The heavy metal pollution level was significantly influenced by the land use intensity (Figure 6). Specifically, the Igeo of Cd ranged from 3.57 to 2.46, with the highest value observed in aquaculture ponds (LUI-3, strongly polluted level) and the lowest value in built-up areas (LUI-5, moderately to strongly polluted level). High Cd pollution levels were also found in other land use intensities, especially for tidal flats (LUI-1, 3.27) and agricultural areas (LUI-4, 2.82). Similar result was found by Yang et al. [14], who reported Cd was the main pollutant in Liaodong Bay, adjoining the southern end of this study area used here. The spatial distribution of Cd pollution (Figure 7) showed that the hotspots were mostly appeared in the agricultural and aquaculture areas near the river mouths (Daling River, Shuangtaizi River and Daliao River), suggesting that riverine inputs caused by wide use of agrochemicals (i.e., phosphorus fertilizer and pesticide) might be predominantly responsible for the Cd pollution of Liaodong Bay and the pollution level had posed a serious environmental hazard. Previous studies has reported that Cd and Pb were the major pollutants in the intertidal zone of Liaodong Bay [49]. However, in the current study, the Igeo values of Pb were almost all less than 0, indicating that the Pb pollution levels were not as problematic as previously found. This might be due to the phaseout of leaded gasoline carried out by Chinese government. Nevertheless, some Pb hotspots approached to 0 were found in the reed marsh area (LUI-2). Limitations during the field study meant that surface soil samples in the reed marsh areas were collected mainly along the sides of roads. Atmospheric Pb deposition resulting from leaded gasoline combustion and vehicular tire wear was the main source for Pb pollution in the hotspots. Although Pb contamination was not very severe in this study area, Li et al. [50] found that irrigation promotes the leaching and movement of heavy metals from surface soils to deeper soils on reclaimed land and that Pb is more mobile than other heavy metals. Pollution with Pb cannot therefore be ignored in future, especially in the agricultural area LUI-4, because Pb is very toxic and can enter the food chain and harm public health. Cd was the most abundant pollutant in this study area and furthermore the Igeo of Cr (except for in LUI-5) was also relatively high, and comparatively reached moderately polluted level. The highest pollution value was found in tidal flats (LUI-1, 1.17), followed by the LUI-3, LUI-4, LUI-2 and LUI-5. According to the potential source identification of heavy metal, the Cr content of aquaculture (LUI-3) and agricultural lands (LUI-4) was accumulated because the manure was applied as organic fertilizer. Similarly, for Ni, in addition to influence of the deposition background, anthropogenic activities also caused Ni contamination to nearly reach the unpolluted to moderately polluted (0 < Igeo < 1). Some Ni contamination hotspots were found around oil wells, indicating that oil exploration also played a key role in polluting the surface soils of reed marsh (LUI-2). Moreover, in the five land use intensities, the Cu and Zn contaminations reached the unpolluted and unpolluted to moderately polluted levels, respectively. The hotspots for the two contaminations were closer to the built-up areas (Figure 2). The influence of the domestic sewage and traffic activities might result in the locally high polluted values.

3.6. Implications for Environmental Management and Food Safety

Overall, these findings indicated that the pollution levels of heavy metal arranged in the following order: LUI-3 > LUI-1 > LUI-4 > LUI-2 > LUI-5 (Figure 6). With the rapid development of industrialization and urbanization, elevated heavy metal contents in built-up lands have been found in many coastal areas around the world [51,52]. However, in this study, the concentrations and pollution levels of heavy metal in built-up areas (LUI-5) were generally lower than those of cultivated and aquaculture lands. A close relationship was found between the heavy metal concentrations and the clayish silt grain size, suggesting that soil erosion was the main factor in heavy metal losses of the built-up areas. The surface soil samples in the built-up areas were mainly collected in residential zones lacking large industrial plants. However, the Liaodong Bay New District, which is dominated by petroleum and chemical plants, equipment manufacturing plants, and port logistics areas, is in the study area (see Figure 1). It is suggested that heavy metal pollution in this region needs to be further monitored and controlled by the local government.
The study area is an important agricultural and aquaculture base in Liaoning Province, China. In the last three decades, reclamation activities have been transformed more and more coastal wetlands into crop production and clam fishery breeding areas, which hindered the regional sustainable development caused by soil heavy metal pollution. Long-term fertilization application can improve soil fertility and increase the organic matter content of the soil. However, SOM has strong capacity for binding heavy metal [53]. Therefore, wide use of fertilizers not only results in heavy metal pollution in topsoil but also may increase the potential food safety risk from heavy metal. Cd remained a major contamination in this study area, especially in the aquaculture (LUI-3) and agricultural (LUI-4) areas. Cd is one of the most toxic heavy metals, and excessive Cd accumulation in humans can result in health problems such as bone disease, lung edema, renal dysfunction, liver damage, anemia, and hypertension [54]. A major pathway for Cd intake by humans is through consumption of food products, therefore, from a food safety standpoint, special attention should be paid to the bioaccumulation of Cd in seafood and paddy rice.
The pollution levels for all of the heavy metals were generally highest in LUI-1 and LUI-2 because the wetland ecosystems are at the end of the Liao River, which runs through the Liao River Delta and eventually flows into the Bohai Sea. Agricultural, industrial, and domestic waste are discharged into the Liao River, causing marked heavy metal pollution in sediment and adverse effects in the estuarine environment. In addition to the influence of anthropogenic activities, the clayish silt, fine-grained sand and anoxic condition might be the main environmental factor causing heavy metals to be absorbed by sediments. Heavy metals in wetland soils may accumulate to toxic levels and have the potential to pose an environmental risk, which will affect regional sustainable development because of the need to balance future reclamation activities and the protection of wetland ecosystems. Therefore, it is necessary for local government to take measures to control heavy metal pollution, such as increasing ecological lands, developing ecological agriculture (e.g., rice-crab culture) and constructing natural reserves in key sites. Artificial ditches are a remarkable feature in the study area. Reclamation always promotes the release of heavy metals from combination patterns in soils and sediments to aggregate to ditch and riparian wetlands. Wei et al. [42] has shown that ditch wetland served as a temporary sink of heavy metals was found to pose the lowest dispersion risk of heavy metals. Periodically dredging ditches could effectively decrease inputs of heavy metals into rivers and decrease the threats posed by heavy metals to the aquatic environment in the study area. These results of previous studies have important implications for the environmental management of the study area.

4. Conclusions

These findings revealed that the different land-use intensity could certainly influence the heavy metal concentrations in soils and sediments of a long-term reclaimed area. Correlation analysis indicated that soil properties such as SOC and grain size played important roles in affecting the heavy metal distribution. The factor analysis results indicated that heavy metal contamination in the study area is most probably caused by industrial and agricultural wastewater discharges, domestic sewage discharge and atmospheric deposition. Using ANOVA, it found that human activities significantly changed soil physic-chemical properties through soil erosion, leaching and fertilizer application, further affecting the behaviors of heavy metals in the soil and sediments. The anthropogenic factors could lead to potential environmental risk, as indicated by the Igeo results of heavy metals. Overall, the pollution levels of heavy metals arranged in the following order: LUI-3 > LUI-1 > LUI-4 > LUI-2 > LUI-5. The heavy metals generally had approached or even exceeded moderately polluted (0 < Igeo < 1, 1 < Igeo < 2), but the Pb and Cu pollution level was low (Igeo < 0), but the Cd pollution level was moderately or strongly polluted (2 < Igeo < 3, 3 < Igeo < 4) in the five land use levels. Cd pollution in the aquacultural and agricultural areas is a serious problem, and, from a food safety standpoint, particular attention should be paid to Cd bioaccumulation in seafood and paddy rice. All the heavy metal pollution levels were high in LUI-1 and LUI-2, mainly because of anthropogenic inputs. Continuous reclamation activities, especially for agriculture and aquaculture, which poses even greater risks to public health and environmental degradation, has yet to gain policymakers’ attention. The results presented will provide valuable information for appropriately determining how land should be used in future reclamation areas, as well as for the sustainable management of estuarine areas around the world.

Acknowledgments

This research is supported by Liaoning Planning Fund Project of Philosophy and Social Science (No. L17CJY003), Science Research Projects of Liaoning Education Department (No. H201783631), Dalian Social Science Association Project (No. 2017dlskyb066), China National R & D Program “ecological risk management and spatial pattern optimization in urban area” (No. 2017YFC0505704) and Minister of Education (MOE) Project of Key Research Institutes of Humanities and Social Sciences in Universities (No. 16JJD790021). We thank Mr. Zhong for hard work during the field investigation.

Author Contributions

Xiaolu Yan made substantial contributions toward the collection, processing, analysis, and interpretation of data and assisted with manuscript preparation; Yuanman Hu and Miao Liu were mainly responsible for the structure design and content verification. Jingqiu Zhong was responsible for the field survey; Jinting Guo and Wen Wu were responsible for the data analysis.

Conflicts of Interest

The authors declare no conflict of interest.

References

  1. Micó, C.; Recatalá, L.; Peris, M.; Sánchez, J. Assessing heavy metal sources in agricultural soils of an European Mediterranean area by multivariate analysis. Chemosphere 2006, 65, 863–872. [Google Scholar] [CrossRef] [PubMed]
  2. Sheng, J.J.; Wang, X.P.; Gong, P.; Tian, L.D.; Yao, T.D. Heavy metals of the Tibetan top soils Level, source, spatial distribution, temporal variation and risk assessment. Environ. Sci. Pollut. Res. 2012, 19, 3362–3370. [Google Scholar] [CrossRef] [PubMed]
  3. Hossain, M.B.; Jahiruddin, M.; Panaullah, G.M.; Loeppert, R.H.; Islam, M.R.; Duxbury, J.M. Spatial variability of arsenic concentration in soils and plants, and its relationship with iron, manganese and phosphorus. Environ. Pollut. 2008, 156, 739–744. [Google Scholar] [CrossRef] [PubMed]
  4. Wang, W.; Liu, H.; Li, Y.Q.; Su, J.L. Development and management of land reclamation in China. Ocean Coast. Manag. 2014, 102, 415–425. [Google Scholar] [CrossRef]
  5. Suzuki, T. Economic and geographic backgrounds of land reclamation in Japanese ports. Mar. Pollut. Bull. 2003, 47, 226–229. [Google Scholar] [CrossRef]
  6. Sheoran, A.S.; Sheoran, V. Heavy metal removal mechanism of acid mine drainage in wetlands: A critical review. Miner. Eng. 2006, 19, 105–116. [Google Scholar] [CrossRef]
  7. Bai, J.H.; Cui, B.S.; Yang, Z.F.; Xu, X.F.; Ding, Q.Y.; Gao, H.F. Heavy metal contamination of cultivated wetland soils along a typical plateau lake from southwest China. Environ. Earth Sci. 2009, 59, 1781–1788. [Google Scholar] [CrossRef]
  8. Li, Q.S.; Chen, Y.; Fu, H.B.; Cui, Z.H.; Shi, L.; Wang, L.L.; Liu, Z.F. Health risk of heavy metals in food crops grown on reclaimed tidal flat soil in the Pearl River Estuary, China. J. Hazard. Mater. 2012, 227–228, 148–154. [Google Scholar] [CrossRef] [PubMed]
  9. Antonijević, M.M.; Dimitrijević, M.D.; Milić, S.M.; Nujkić, M.M. Metal concentrations in the soils and native plants surrounding the old flotation tailings pond of the Copper Mining and Smelting Complex Bor (Serbia). J. Environ. Monit. 2012, 14, 866–877. [Google Scholar] [CrossRef] [PubMed]
  10. Imperato, M.; Adamo, P.; Naimo, D.; Arienzo, M.; Stanzione, D.; Violante, P. Spatial distribution of heavy metals in urban soils of Naples city (Italy). Environ. Pollut. 2003, 124, 247–256. [Google Scholar] [CrossRef]
  11. Li, J.G.; Pu, L.J.; Liao, Q.L.; Zhu, M.; Dai, X.Q.; Xu, Y.; Zhang, L.F.; Hua, M.; Jin, Y. How anthropogenic activities affect soil heavy metal concentration on a broad scale: A geochemistry survey in Yangtze River Delta, Eastern China. Environ. Earth Sci. 2015, 73, 1823–1835. [Google Scholar] [CrossRef]
  12. Ma, C.; Zheng, R.; Zhao, J.L.; Han, X.M.; Wang, L.; Gao, X.J.; Zhang, C.S. Relationships between heavy metal concentrations in soils and reclamation history in the reclaimed coastal area of Chongming Dongtan of the Yangtze River Estuary, China. J. Soils Sediments 2014, 15, 139–152. [Google Scholar] [CrossRef]
  13. Bai, J.H.; Xiao, R.; Cui, B.S.; Zhang, K.J.; Wang, Q.G.; Liu, X.H.; Gao, H.F.; Huang, L.B. Assessment of heavy metal pollution in wetland soils from the young and old reclaimed regions in the Pearl River Estuary, South China. Environ. Pollut. 2011, 159, 817–824. [Google Scholar] [CrossRef] [PubMed]
  14. Yang, X.L.; Yuan, X.T.; Zhang, A.G.; Ma, Y.Z.; Li, Q.; Zong, H.M.; Wang, L.J.; Li, X.D. Spatial distribution and sources of heavy metals and petroleum hydrocarbon in the sand flats of Shuangtaizi Estuary, Bohai Sea of China. Mar. Pollut. Bull. 2015, 95, 503–512. [Google Scholar] [CrossRef] [PubMed]
  15. Li, X.W.; Liang, C.; Shi, J. Developing wetland restoration scenarios and modeling its ecological consequences in the Liaohe River Delta wetlands, China. CLEAN 2012, 40, 1185–1196. [Google Scholar] [CrossRef]
  16. Di, X.; Hou, X.; Wang, Y.; Li, W. Spatial-temporal characteristics of land use intensity of coastal zone in China during 2000–2010. Chin. Geogr. Sci. 2015, 25, 51–61. [Google Scholar] [CrossRef]
  17. Li, X.Z.; Sun, Y.G.; Mander, Ü.; He, Y.L. Effects of land use intensity on soil nutrient distribution after reclamation in an estuary landscape. Landsc. Ecol. 2012, 28, 699–707. [Google Scholar] [CrossRef]
  18. Ellis, S.; Atherton, J.K. Properties and development of soils on reclaimed alluvial sediments of the Humber estuary, eastern England. Catena 2003, 52, 129–147. [Google Scholar] [CrossRef]
  19. Muller, G. Index of geoaccumulation in sediments of the Rhine River. Geol. J. 1969, 2, 108–118. [Google Scholar]
  20. Taylor, S.R.; Mclennan, S.M. The geochemical evolution of the continental crust. Rev. Geophys. 1995, 33, 241–265. [Google Scholar] [CrossRef]
  21. Wu, Y.; Li, J.; Wang, X. Soil Element Background Values of Liaoning Province in China; China Environmental Science Press: Beijing, China, 1994; pp. 1–562. [Google Scholar]
  22. Wei, J.; Wei, O.Y.; Hao, F.H.; Liu, B.; Wang, F.L. Geochemical variability of heavy metals in soil after land use conversions in northeast China and its environmental applications. Environ. Sci. 2014, 16, 924–931. [Google Scholar]
  23. Turer, D.; Maynard, J.B.; Sansalone, J.J. Heavy metal contamination in soils of urban highways comparison between runoff and soil concentrations at Cincinnati, Ohio. Water Air Soil Pollut. 2001, 132, 293–314. [Google Scholar] [CrossRef]
  24. Chapman, P.M.; Wang, F.; Janssen, C.; Persoone, G.; Allen, H.E. Ecotoxicology of metals in aquatic sediments: Binding and release, bioavailability, risk assessment, and remediation. Can. J. Fish. Aquat. Sci. 1998, 55, 2221–2243. [Google Scholar] [CrossRef]
  25. Zhou, H.Y.; Peng, X.T.; Pan, J.M. Distribution, source and enrichment of some chemical elements in sediments of the Pearl River Estuary, China. Cont. Shelf Res. 2004, 24, 1857–1875. [Google Scholar] [CrossRef]
  26. Rosenberg, O.; Persson, T.; Högbom, L.; Jacobson, S. Effects of wood-ash application on potential carbon and nitrogen mineralisation at two forest sites with different tree species, climate and N status. For. Ecol. Manag. 2010, 260, 511–518. [Google Scholar] [CrossRef]
  27. Li, D.; Shao, M.A. Soil organic carbon and influencing factors in different landscapes in an arid region of northwestern China. Catena 2014, 116, 95–104. [Google Scholar] [CrossRef]
  28. Rainer, B.; Guenther, S.; Luca, M.; Eric, V.R. Carbon concentrations and stocks in forest soils of Europe. For. Ecol. Manag. 2010, 260, 262–277. [Google Scholar]
  29. Cui, J.; Liu, C.; Li, Z.L.; Wang, L.; Chen, X.F.; Ye, Z.Z.; Fang, C.M. Long-term changes in topsoil chemical properties under centuries of cultivation after reclamation of coastal wetlands in the Yangtze Estuary, China. Soil Tillage Res. 2012, 123, 50–60. [Google Scholar] [CrossRef]
  30. Zhang, H.; Wang, Z.F.; Zhang, Y.L.; Hu, Z.J. The effects of the Qinghai—Tibet railway on heavy metals enrichment in soils. Sci. Total Environ. 2012, 439C, 240–248. [Google Scholar] [CrossRef] [PubMed]
  31. Laing, G.D.; Rinklebe, J.; Vandecasteele, B.; Meers, E.; Tack, F.M.G. Trace metal behaviour in estuarine and riverine floodplain soils and sediments: A review. Sci. Total Environ. 2008, 407, 3972–3985. [Google Scholar] [CrossRef] [PubMed]
  32. Zhang, W.; Yu, L.; Hutchinson, S.M.; Xu, S.; Chen, Z.; Gao, X. China’s Yangtze Estuary: I. Geomorphic influence on heavy metal accumulation in intertidal sediments. Geomorphology 2001, 41, 195–205. [Google Scholar] [CrossRef]
  33. Shi, J.B.; Ip, C.C.; Zhang, G.; Jiang, G.B.; Li, X.D. Mercury profiles in sediments of the Pearl River Estuary and the surrounding coastal area of South China. Environ. Pollut. 2010, 158, 1974–1979. [Google Scholar] [CrossRef] [PubMed]
  34. Duan, D.D.; Ran, Y.; Cheng, H.F.; Chen, J.A.; Wan, G.J. Contamination trends of trace metals and coupling with algal productivity in sediment cores in Pearl River Delta, South China. Chemosphere 2014, 103, 35–43. [Google Scholar] [CrossRef] [PubMed]
  35. Osuji, L.C.; Onojake, C.M. Trace heavy metals associated with crude oil: A case study of ebocha-8 oil-spill-polluted site in Niger Delta, Nigeria. Chem. Biodivers. 2004, 1, 1708–1715. [Google Scholar] [CrossRef] [PubMed]
  36. Santos-Echeandía, J.; Prego, R.; Cobelo-García, A. Influence of the heavy fuel spill from the Prestige tanker wreckage in the overlying seawater column levels of copper, nickel and vanadium (NE Atlantic ocean). J. Mar. Syst. 2008, 72, 350–357. [Google Scholar] [CrossRef]
  37. Nie, M.; Xian, N.; Fu, X.; Chen, X.; Li, B. The interactive effects of petroleum-hydrocarbon spillage and plant rhizosphere on concentrations and distribution of heavy metals in sediments in the Yellow River Delta, China. J. Hazard. Mater. 2010, 174, 156–161. [Google Scholar] [CrossRef] [PubMed]
  38. Sutherland, T.F.; Petersen, S.A.; Levings, C.D.; Martin, A.J. Distinguishing between natural and aquaculture-derived sediment concentrations of heavy metals in the Broughton Archipelago, British Columbia. Mar. Pollut. Bull. 2007, 54, 1451–1460. [Google Scholar] [CrossRef] [PubMed]
  39. Min, W.F.; Liu, C.Z.; Xue, S.Y.; Ling, G.Y.; Xian, Y.J. Investigation on the pollution of organoarsenical additives to animal feed in the surroundings and farmland near hog farms. Acta Ecol. Sin. 2006, 26, 154–162. [Google Scholar]
  40. Fakayode, S.O.; Olu-Owolabi, B.I. Heavy metal contamination of roadside topsoil in Osogbo, Nigeria: Its relationship to traffic density and proximity to highways. Environ. Geol. 2003, 44, 150–157. [Google Scholar]
  41. Yan, Y.C.; Xin, X.P.; Xu, X.L.; Wang, X.; Yang, G.X.; Yan, R.R.; Chen, B.R. Quantitative effects of wind erosion on the soil texture and soil nutrients under different vegetation coverage in a semiarid steppe of northern China. Plant Soil 2013, 369, 585–598. [Google Scholar] [CrossRef]
  42. Wei, J.; Wei, O.Y.; Hao, F.; Wang, F.; Liu, B. Long-term cultivation impact on the heavy metal behavior in a reclaimed wetland, Northeast China. J. Soils Sediments 2013, 14, 567–576. [Google Scholar]
  43. Six, J.; Conant, R.T.; Paul, E.A.; Paustian, K. Stabilization mechanisms of soil organic matter: Implications for C-saturation of soils. Plant Soil 2002, 241, 155–176. [Google Scholar] [CrossRef]
  44. Shen, J.B.; Yuan, L.X.; Zhang, J.L.; Li, H.G.; Bai, Z.H.; Chen, X.P.; Zhang, W.F.; Zhang, F.S. Phosphorus dynamics: From soil to plant. Plant Physiol. 2011, 156, 997–1005. [Google Scholar] [CrossRef] [PubMed]
  45. Boesch, D.F. Challenges and opportunities for science in reducing nutrient over-enrichment of coastal ecosystems. Estuaries 2002, 25, 886–900. [Google Scholar] [CrossRef]
  46. Caeiro, S.; Costa, M.H.; Ramos, T.B.; Fernandes, F.; Silveira, N.; Coimbra, A.; Medeiros, G.; Painho, M. Assessing heavy metal contamination in Sado Estuary sediment: An index analysis approach. Ecol. Indic. 2005, 5, 151–169. [Google Scholar] [CrossRef]
  47. Banat, K.M.; Howari, F.M.; Al-Hamad, A.A. Heavy metals in urban soils of central Jordan: Should we worry about their environmental risks? Environ. Res. 2005, 97, 258–273. [Google Scholar] [CrossRef] [PubMed]
  48. Yaylalı-Abanuz, G. Heavy metal contamination of surface soil around Gebze industrial area, Turkey. Microchem. J. 2011, 99, 82–92. [Google Scholar] [CrossRef]
  49. Feng, M.H. Ecological risk evaluation of heavy metals of marine sediment in Liaodong Bays shallow waters. Mar. Sci. 2003, 27, 52–56. [Google Scholar]
  50. Li, Q.S.; Liu, Y.N.; Du, Y.F.; Cui, Z.H.; Shi, L.; Wang, L.L.; Li, H.J. The behavior of heavy metals in tidal flat sediments during fresh water leaching. Chemosphere 2011, 82, 834–838. [Google Scholar] [CrossRef] [PubMed]
  51. Cheng, S. Heavy metal pollution in China: Origin, pattern and control. Environ. Sci. Pollut. Res. 2003, 10, 192–198. [Google Scholar] [CrossRef]
  52. Sowana, A.; Shrestha, R.P.; Parkpian, P.; Pongquan, S. Influence of coastal land use on soil heavy-metal contamination in Pattani Bay, Thailand. J. Coast. Res. 2013, 27, 252–262. [Google Scholar] [CrossRef]
  53. Frimmel, F.H.; Huber, L. Influence of humic substances on the aquatic adsorption of heavy metals on defined mineral phases. Environ. Int. 1996, 22, 507–517. [Google Scholar] [CrossRef]
  54. Basta, N.; Raun, W.; Gavi, F. Wheat grain cadmium under long-term fertilization and continuous winter wheat production. Better Crops 1998, 82, 14–15. [Google Scholar]
Figure 1. Location of the study area and distribution of sampling points. The image of the year 2014 is displayed as false color composition using band 5, 4 and 3.
Sustainability 10 00338 g001
Figure 2. Land use types (a) and intensities (b) of the study area in 2014.
Sustainability 10 00338 g002
Figure 3. Scatter plots of Fe-normalized heavy metals in the five land use intensities.
Sustainability 10 00338 g003
Figure 4. Multiple comparison analysis of ANOVA and box plots for soil properties in different land use intensities. Different letters marked for bars represent significant differences (p < 0.05).
Sustainability 10 00338 g004
Figure 5. Multiple comparison analysis of ANOVA and box plots for Fe-normalized heavy metal concentrations in different land use levels. Different letters marked for bars represent significant differences (p < 0.05).
Sustainability 10 00338 g005
Figure 6. The Igeo of heavy metals in different land use levels.
Sustainability 10 00338 g006
Figure 7. The spatial distribution of heavy metal pollution in the study area.
Sustainability 10 00338 g007
Table 1. Land use intensity level and descriptions of land use types.
Land Use Intensities (LUI)Land Use TypeArea Percent (%)Descriptions
LUI-1Barren land0.2Saline land formed early on reclamation areas; Unutilized land for industry construction
Intertidal flat5.0Intertidal mud flat areas with less than 30% vegetation cover
LUI-2Reed marsh35.6Estuarine and reclamation areas with vegetation cover exceeding 30%, dominated by reeds
Open water4.5 Rivers, artificial reservoirs and ponds
Inland halophyte2.5 Reclamation areas with vegetation cover exceeding 30%, dominated by Suaeda
LUI-3Aquacultural pond9.9 Artificial ponds for fish/shrimp/crab farming
LUI-4Rice paddy32.7 Paddy fields or aquatic agricultural crop cultivated land
Dry land2.0 Xeric agricultural crop cultivated land
LUI-5Built-up land7.6 Residential, industrial and transportation lands
Table 2. Descriptive statistics for soil properties and heavy metal concentrations in topsoil.
VariableMinimumMedianMaximumMeanS.D.C.V. (%)
Cu (mg kg−1)4.55 15.65 31.67 17.23 6.05 35.10
Cr (mg kg−1)50.65 153.43 275.79 154.95 52.16 33.66
Cd (mg kg−1)0.26 1.63 3.46 1.41 0.82 58.23
Ni (mg kg−1)20.87 39.33 59.34 40.71 9.13 22.44
Zn (mg kg−1)53.40 99.59 149.50 102.21 19.44 19.02
Pb (mg kg−1)2.95 11.26 19.57 11.97 3.66 30.54
Mn (mg kg−1)25.78 96.42 211.90 100.46 30.94 30.80
Fe (g kg−1)0.63 0.93 1.18 0.93 0.12 12.63
Salinity (ms m−1)0.01 0.11 0.62 0.15 0.14 97.33
pH6.65 7.95 8.80 7.89 0.48 6.07
SOC (%)0.05 0.84 2.88 0.93 0.48 51.81
NO3-N (mg kg−1)0.25 1.56 10.72 2.35 2.23 94.68
AP (mg kg−1)0.72 5.61 26.46 7.23 5.41 74.80
Clay (%)1.04 2.83 6.02 3.04 1.04 34.09
Silt (%)9.59 37.19 66.58 37.63 10.46 27.81
Sand (%)25.60 59.07 89.25 58.72 11.63 19.81
Table 3. Person’s correlation matrix for soil properties and heavy metal concentrations.
CuCrCdNiZnPbMnFeSalinitypHSOCNO3-N APClaySiltSand
Cu1
Cr0.47 **1
Cd0.22 **0.20 **1
Ni0.52 **0.71 **0.30 **1
Zn0.71 **0.52 **0.19 **0.57 **1
Pb0.43 **0.25 **0.23 **0.35 **0.37 **1
Mn0.29 **−0.11 0.05−0.10 0.160.131
Fe0.57 **0.35 **0.24 **0.27 **0.28 **0.20 **0.39 **1
Salinity0.030.25 **0.070.20 *−0.02 0.070.01−0.03 1
pH−0.14 *−0.09 −0.13 −0.17 −0.04 −0.33 **0.24 **0.18 **0.38 **1
SOC0.32 **0.24 **0.34 **0.26 **0.25 **0.130.020.07−0.30 −0.32 **1
NO3-N 0.01−0.07 −0.06 −0.07 −0.08 0.180.09−0.05 −0.26 **−0.22 *0.33 **1
AP−0.10 −0.01 0.12−0.06 −0.05 0.16−0.03 −0.01 −0.09 −0.10 0.050.151
Clay0.29 **0.37 **0.13 **0.29 **0.23 **0.130.20 *0.160.27 **0.180.37 **−0.21 *−0.22 *1
Silt0.35 **0.43 **0.23 **0.35 **0.32 **0.050.170.060.130.050.23 **0.04−0.22 *0.78 **1
Sand−0.37 ** −0.44 **−0.15 **−0.36 **−0.27 **−0.06 −0.17 −0.12 −0.07 0.01−0.26 **0.030.28 **−0.82 **−0.99 **1
* p < 0.05. ** p < 0.01.
Table 4. Rotated component matrix for Fe-normalized heavy metals.
LUI-1LUI-2LUI-3LUI-4LUI-5
1212121212
Cu/Fe0.970.02 0.760.19 0.43 0.830.670.25 0.21 0.85
Cr/Fe0.54 0.670.15 0.870.950.06 0.790.43 0.890.09
Cd/Fe0.15 0.920.840.07 0.07 0.980.04 0.830.47 0.36
Ni/Fe0.44 0.840.56 0.640.910.38 0.860.15 0.970.05
Zn/Fe0.930.29 0.820.29 0.35 0.790.820.35 0.850.04
Pb/Fe0.53 0.640.04 0.640.980.18 0.30 0.740.39 0.71
Eigenvalue2.69 2.49 2.41 1.69 3.51 1.97 2.57 1.62 2.89 1.38
Total variance (%)44.92 41.61 40.16 28.28 58.43 32.82 42.77 27.07 48.20 22.94
Cumulative variance (%)44.92 86.53 40.16 68.44 58.43 91.25 42.77 69.84 48.20 71.14
Extraction method: principal component analysis; rotation method: varimax with Kaiser normalization. The significance of ‘bold’ font is at 0.05.

