Effect of Mechanical Pre-Treatment of the Agricultural Substrates on Yield of Biogas and Kinetics of Anaerobic Digestion

Institute of Agricultural Engineering, Wroclaw University of Environmental and Life Sciences, Wrocław 50-375, Poland
*
Authors to whom correspondence should be addressed.
Sustainability 2018, 10(10), 3669; https://doi.org/10.3390/su10103669
Submission received: 13 July 2018
/
Revised: 1 October 2018
/
Accepted: 1 October 2018
/
Published: 14 October 2018
(This article belongs to the Section Sustainable Agriculture)
Abstract
:The effect of mechanical pre-treatment of nine different agricultural substrates minced to particle sizes of 1.5 mm, 5 mm and 10 mm on biogas and methane yields and fermentation kinetics was investigated. The results showed, that for five of the nine tested substrates (grass, Progas rye, Palazzo rye, tall wheatgrass, beet), a higher biogas production was obtained for the degree of fragmentation of 10 mm compared to fragmentation of 5 mm and 1.5 mm. For fragmentation of 5 mm, the highest biogas production was achieved for sorghum silage, Atletico maize and Cannavaro maize—649.80, 735.59 and 671.83 Nm3/Mg VS, respectively. However, for the degree of fragmentation of 1.5 mm, the highest biogas production (510.43 Nm3/Mg volatile solid (VS)) was obtained with Topinambur silage. The modified Gompertz model fitted well the kinetics of anaerobic digestion of substrates and show a significant dependence of the model parameters Hmax (biogas production potential) and Rmax (maximum rate of biogas production) on the degree of substrate fragmentation.
1. Introduction
Biogas is an important source of alternative energy, produced from various types of biomass in anaerobic digestion (AD) [1,2,3]. At present, many new biogas plants have been established in Europe and in Poland, and biomass supplies have become a challenge. As a result, sources of new biomass are sought after. One of the most important directions for the development of renewable energy is the development of agricultural biogas plants in Poland in 2010–2020. The idea of creating such installations is also placed among the key objectives of “Poland’s Energy Policy to 2030”. The document provides for Poland to reach by 2020 a 15% share of energy from renewable sources in final energy consumption [4]. Agricultural biogas is an important part of achieving the assumed goal. It is important to realize that the efficient use of energy potential in available biomass is of great importance to the economic viability of biogas. The main advantage of biomass as a feedstock for fermentation is the use of grass meadows and biomass from energy crops grown on marginal surfaces for energy purposes, where their conventional use as animal feed decreases as feed quality is unable to meet the required standards [5,6,7]. Grass biomethane has been shown to be a sustainable gaseous transport biofuel, with a good energy balance and significant potential for economic viability [8,9,10].
There are many energy crops that can be grown for biogas plants such as maize, sorghum, topinambour, Rye, grass, tallwheatgrass. However, there are two key issues for the use of biomass in biogas plants for high biogas production: (a) suitable biomass harvesting technology for proper silageation; (b) efficient and cost-effective biomass pre-treatment methods to increase its biodegradability. Maize silage is a widely used raw material to ensure stable methane fermentation in biogas plants and a high yield of biogas [11]. With one ton of corn silage with a content of 30% to 40% of the dry matter, 170–220 m3 of biogas with a content of 50%–55% methane can be obtained [12,13,14]. For cultivars of maize for biogas in Poland, variety of FAO (Food and Agriculture Organization of the United Nations) 250 are recommended [15].
There are other energy crops with similar biogas production to maize and, at the same time, their cultivation is less competitive for food production and for production of feed for animals. This plant can be sorghum, which is characterized by photosynthesis type C4, and excellent tolerance of water deficiency in the soil. Under Polish conditions, for the sorhgum, the yield of green fodder can reach up to 100 t/ha [16], on average about 60–80 t /ha, with a content of about 22% total solid (TS). With 1 ton of sorghum silage you can get about 110 m3 of biogas with 54% methane content. Silage production technology for biogas production is identical to the technology of cattle feed [15,17]. The difference is in the size of the particles of plant material after crushing. The biomass for biogas needs to be finely divided. In literature [15], there is a view that the shorter the chaff, the higher the yield of biogas, It is recommended that the chop length be between 4 mm and 8 mm. However in other literature sources [18], fragmentation of fibers in manure up to 2 mm resulted in a 16% increase of biogas production, while size reduction up to 0.35 mm resulted in a 20% increase, and no significant difference was observed of biogas production with further size reduction. In the case of grasses, there is a view that increasing the degree of fragmentation affects the higher yields of biogas, but too much fragmentation decreases the process efficiency. For beet pulp and grass silage and maize, the maximum particle size should be between 20 and 30 mm. During anaerobic fermentation of maize silage up to 4 mm, the production of biogas is 12% higher compared to the fragmentation of 20 mm [17]. However, in practice, achieving a cutting length in the recommended range 4 or 8 mm is associated with high energy consumption. Lignocellulose is a tough material which has a complex and rigid structure resistant to mechanical stress and enzymatic action. Water molecules cannot enter the lignocellulosic fiber because of the combination of accessible surface area, presence of lignin and crystallinity of cellulose. The fibers are protected and strengthened by lignin which is inhibiting to the action of enzymes [19]. Furthermore, the crystalline structure of cellulose decreases the availability of surface contact to enzymes [20]. It is hard to identify the most suitable pre-treatment for all types of lignocellulosic materials. Effective pre-treatment should have three qualities: (1) increase the porosity of the substrate which makes the carbohydrates more accessible for enzymes; (2) preserve the different fractions without losing or degrading organic matter; and (3) limit the formation of inhibitors. Furthermore, pre-treatment should take economic issues into consideration. Each pre-treatment has advantages and drawbacks. The optimal operation depends on the characteristies of the materials. The main purpose of pre-treatment for biogas production is to increase the accessibility to the hemicellulose content of the lignocellulosic material.
Mechanical pre-treatment generally produces a large surface area in the organic material, facilitating a larger contact area for the microorganisms that degrade the material, thus resulting in increased biogas yields [21]. The biogas yield of some substrates increases almost linearly with increasing outer surface [22]. However, the fibre size cannot be directly correlated to increased biogas yield as there may also be a shearing effect from the treatment that cannot be measured from fibre size alone [23].
In the light of different views in the literature regarding the effect of the degree of fragmentation of plant material on biogas yield [17,18], the novelty of the research is to show whether the far-reaching grinding of vegetable raw material before ensiling into granulation of 5 mm or 1.5 mm is reasonable compared to 10 mm fragmentation, which is typical for forage harvesters. The aim of the study was to compare the effect of the varying degree of fragmentation of the nine substrates to the levels of 1.5 mm, 5 mm, 10 mm on the biogas yield and kinetics of the fermentation process.
The novelty of the work is that in the process of anaerobic digestion, particles with granulation of exactly 1.5mm, 5mm and 10mm were used, which is something new in contrast to other works, where the fragmentation was possibly majority participation in sieve analysis, with a much larger particle size divergence [24,25].
2. Materials and Methodology
2.1. Substrates
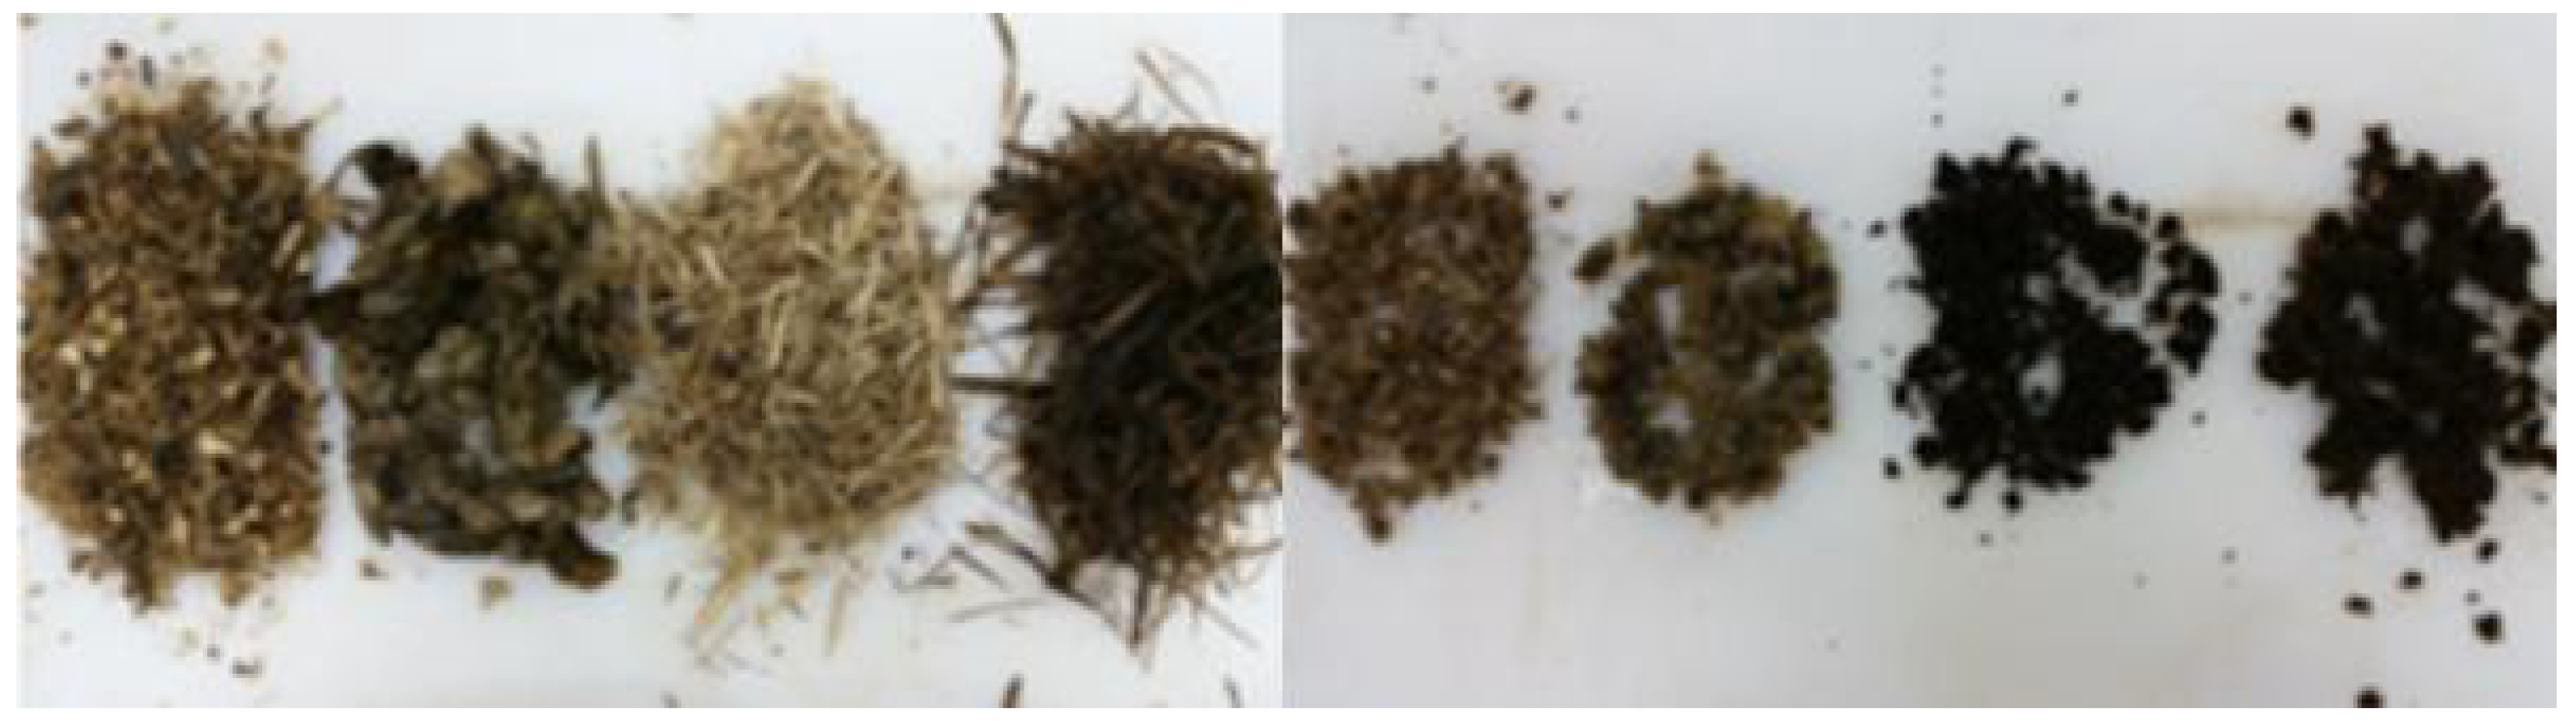
In the nine substrates used in the study were silages from: maize Cannavaro (Zea mays L. Var. Cannavaro), maize Atletico (Zea mays L. Var. Atletico), grass (Poaceae (R. Br.) Barnh), rye Progas (Secale L. Var. Progas), rye Palazzo (Secale L. Var. Palazzo), sorghum (Sorghum Moench), tall wheatgrass (Elymus repens), beet (Beta L. Var Elvira) and topinambour (Helianthus tuberosus L.). The substrates were taken from the same farm, making the process of obtaining raw materials and silage production the same. The test material was subjected to a standard analytical attempt to determine the physicochemical properties of the tested substrates. Analyses of total solid content (TS), volatile solid (VS), pH, carbon to nitrogen ratio, and the elemental analysis of substrates, were performed. The content of VS in silage, before grinding ranged from 17.92% for grass silage to 58.20% for rye Progas silage (Table 1). After chemical analysis, all substrates, without drying, were fragmented using a specialized laboratory grinder with appropriate screens. Three different types of sieves with holes: 1.5 mm, 5 mm, 10 mm were used to grind the silages, resulting in a material with a theoretical particle size, adequate for the sieves used in the mill. To obtain the substrates for anaerobic fermentation with precise granulation of 1.5 mm, 5 mm and 10 mm, the material obtained for each series of grinding from a laboratory mill was subjected to sieve analysis, where six sieves with holes of 11 mm, 10 mm, 6 mm, 5 mm, 2.5 mm and 1.5 mm were used. Based on three screening tests for each degree of fragmentation it was found that: —the size 1.5 mm had a substrate remaining on the sieve with holes of 1.5 mm, —the size 5 mm had a substrate remaining on the sieve with 5 mm and the size 10 mm had a substrate remaining on the sieve with 10 mm (Figure 1).
2.2. Laboratory Measurements
Before biogas production the substrates were properly fragmented (the particle length was changed accordingly for each fragmentation variant: 1.5 mm, 5 mm and 10 mm). Subsequently, the substrates and the inoculum (digestate from an agricultural biogas plant using only plant batch) were subjected to detailed physicochemical analyses to exclude abnormalities during the biogas production. The inoculum parameters are shown in Table 1.
The process of anaerobic digestion was carried out in accordance with norm DIN 38 414-S8 [26] in triplicate for each fragmentation of the substrate (Figure 2). Research of batch process was conducted in 30 fermenters (eudiometers) with a capacity of 1 L at 38 °C. The analysis of physicochemical substrates and products of their anaerobic digestion was performed using standard analytical methods.
The pH was indicated potentiometricaly: the total solid (TS) was indicated according to [27], the value of volatile solid VS was indicated in accordance with [28], the total nitrogen content was indicated by Kjeldahl and ammonia nitrogen by distillation. A Behr atom IRF C500 analyzer was used to indicate of the total organic carbon; the values of Na, K, and Ca were measured by flame photometry; the content of P and Mg were measured by spectrophotometry. The contents of elments: Cd, Cr, Cu, Pb, Zn, Sn, Fe, Ni, and Mn were measured by the spectrophotometric method (spectrophotometer FAAS and ICP); and Hg was determined by using a mercury analyzer MA 2000 NIC. The fat content was determined using a Soxhlet extraction by weighing the content of reducing sugars with the spectrophotometric method. Protein content was determined by the Kjeldahl method and the content of volatile fatty acids by gas chromatography.
The volume of biogas produced and the composition of biogas (CH4, CO2, NH3, O2, H2S) was read from the scale of a GA 2000 Plus analyzer. Biogas production values were converted for normal conditions (Nm3/Mg VS), after conversion to normal temperature t0 = 273 K; p0 = 1013 hPa.
2.3. The Method of Anaerobic Digestion
Anaerobic digestion was based on the DIN 38 414-S8 norms [16], which defines the procedures for conducting the experiment. The test was performed in 30 parallel reactors of 1000 mL capacity (working volume of 400 mL). The norm assumes that the total amount of batch (substrate and inoculum) is always 400 g at a TS content of 8%. For the prepared batch for each fragmentation of the substrate, the experiment was carried out in three reactors, and in the fourth there was a control test, where the charge (400 mL) was the inoculum itself. In the case of anaerobic digestion of the solid substrates, the norm assumes periodic stirring and duration of the experiment until a daily yield of biogas is below 1% of the cumulative biogas production (Figure 2). Therefore, at the end of the AD process, the content of volatile solid VS was not analyzed. The yield of biogas was measured every 24 h, although in the first days of AD, measurements were taken twice a day. Three repetitions were made for each substrate and degree of fragmentation and the results are presented as a means value ± standard deviation.
2.4. Cumulative Biogas Production
Norm DIN 38 414-S8 defines the procedures followed for the anaerobic digestion of total solids, and specifies the manner of sampling, data collection and conversion of AD tests. Its main objectives are to state the conditions that must be met in order to properly determine the yield of substrates. According to the standard, inoculum was taken from biogas plants of similar feedstock, the total solids content in the inoculum was in the range of 1.5 to 2%. The proportions in the fermenter were selected so that the dry mass was about 8%, the pH was in the optimum range of 6.7–7.5, and the carbon to nitrogen ratio was 20–30:1. The analysis of the results started from the conversion of biogas yield to normal conditions (Equation (1)):
where:
- Vo—normal volume of biogas, Nml;
- V—read out biogas volume, ml;
- pl—air pressure at the time of reading, hPa;
- pw—pressure of water vapor in the ambient temperature, hPa;
- To—the normal temperature To = 273 K;
- po—normal pressure po = 1013 hPa;
- T—ambient temperature, K.
The next step was to calculate the yield of biogas produced by the inoculum (Equation (2)):
where:
- Vis—the volume of biogas produced from the inoculum, Nml;
- ΣVis—the total volume of biogas produced from the inoculum, Nml;
- mis—inoculum mass, g;
- mm—weight of inoculum in the control sample, g;
Then, the amount of biogas produced by the substrate was deducted from the amount of biogas obtained by inoculum (biogas yield were also tested with the same inoculum) (Equation (3)):
where:
- Vn—net volume of biogas, Nml.
Finally, the unitary amount of produced biogas was calculated in the course of the experiment (Equation (4)):
where:
- Vs—unit biogas produced during the experiment;
- M—substrate mass, g;
- TS—total solid, %
- VS—volatile solid, % TS.
2.5. Kinetic Model of Biogas Production
The kinetics of biogas production was modeled using a modified Gompertz equation [29,30]. It was assumed that in batch processes, biogas production was affected by the specific growth rate of microorganisms in a digester [31]. The modified Gompertz equation is as follows (Equation (5)):
where:
- QB is the cumulative biogas production (Nm3/Mg VS) at time t (day), t is the time (day) over the digestion period, Hmax is biogas production potential (Nm3/Mg VS), Rmax is maximum rate of biogas production (Nm3/Mg VS day) while λ is the lag phase (day) or minimum time between the inoculation and biogas appearance). Kinetic constants Hmax, Rmax, λ and R2 were determined using the non-linear regression and the root mean square error (RMSE) error was estimated. The use of the Gompertz model to describe the test results gave good results at work [15], where the model was characterized by a good fit to the test results. First, the use of the model was dictated by the need to demonstrate the effect of the degree of fragmentation of substrates on fermentation kinetics.
2.6. Measurement Error Analysis and Statistical Analysis
The absolute error of measurement forming the difference between an actual value of measuring and the value measured (∆x = │x − xz│) for the research stand (eudiometers) was 2 mL. For the gas analyzer, the absolute error is ±3.0%. It should be noted that the gas analyzer was calibrated regularly according to the instructions of the device.
2.7. Data Analysis
The statistical analysis was performed using the Statistica 12 programme. The significance levels of differences for all fragmentation of the substrates were determined by one-way analysis of variance (ANOVA). In the tests, a significance level value of 0.05 was obtained.
3. Results and Discussion
3.1. Substrate Characteristics
The results of the physicochemical analysis for substrates (Table 1) showed that the highest content of total solids was obtained in rye Progas silage (58.20 ± 4.12%), which also achieved the best content of volatile solids (86.75 ± 4.21% TS). Maize Cannavaro silage was characterized by a high content of volatile solids (96,92 ± 2.25% TS) with total solids (40.63 ± 4.20%). These results are comparable to the results of other authors [24]. The optimal pH for the methanogenic bacteria involved in the last two phases of methane AD is from 5.1 (Methanoregula boonei) to 9.2 (Methanosalsum zhilinae) [32]. Physicochemical analyses showed that all starting materials had pH lower than these values, which also achieved the best content of VS (86.75 ± 4.21%). The pH index ranged from 4.0 for beet silage to 5.6 for grass silage. Another important factor determining the yield of methane in the biogas is the carbon to nitrogen ratio, which should fall in the range of 20–30/1. In the case of excessively high content of carbon, bacteria cannot carry out a complete conversion of the element, where the amount of the obtained biogas is not optimal. The lowest C/N was found for grass silage (13.8) and the highest (41.7) for beet silage. For other substrates, these values were included or close to the recommended ratio of 30/1.
If this ratio is not fulfilled, the supply amount of the substrate may be too small for bacteria in the reactor, which means that the charge in the fermenter has too low a content of organic substances. The C/N ratio may also create the right conditions for nitrifying bacteria that compete with archea (the case when there is too much nitrogen) and the last possibility when all biomass organic matter content is not spread (the case when there is too much carbon).
3.2. Batch Anaerobic Digestion
First, the cumulative biogas and methane production for the tested substrates for the fragmentation 10 mm were analized. The highest cumulative values of biogas production (726.12 ± 33.31 Nm3/Mg VS) were obtained for Elvira beet at a fragmentation of 10 mm (Figure 3). The lowest biogas yield for this fragmentation was obtained for Topinambur, where biogas production was 418.70 ± 25.54 Nm3/Mg VS. The nature of the curves of cumulated biogas production is similar, but the biogas production values are different (from 418.7 to 726.12 Nm3/Mg VS). It should be noted that VS content was also varied and ranged from 74.36 ± 2.11% for grass to 96.22 ± 2.23% for Canavaro maize (Table 1). Similarly, the production of biogas proceeded the methane production, and its concentration in the biogas (Figure 3). The influence of VS content in substrates on biogas production is described by the linear regression equation QB = 4.668 VS + 1551.1 although with the low coefficient of covariance R2 = 0.1485.
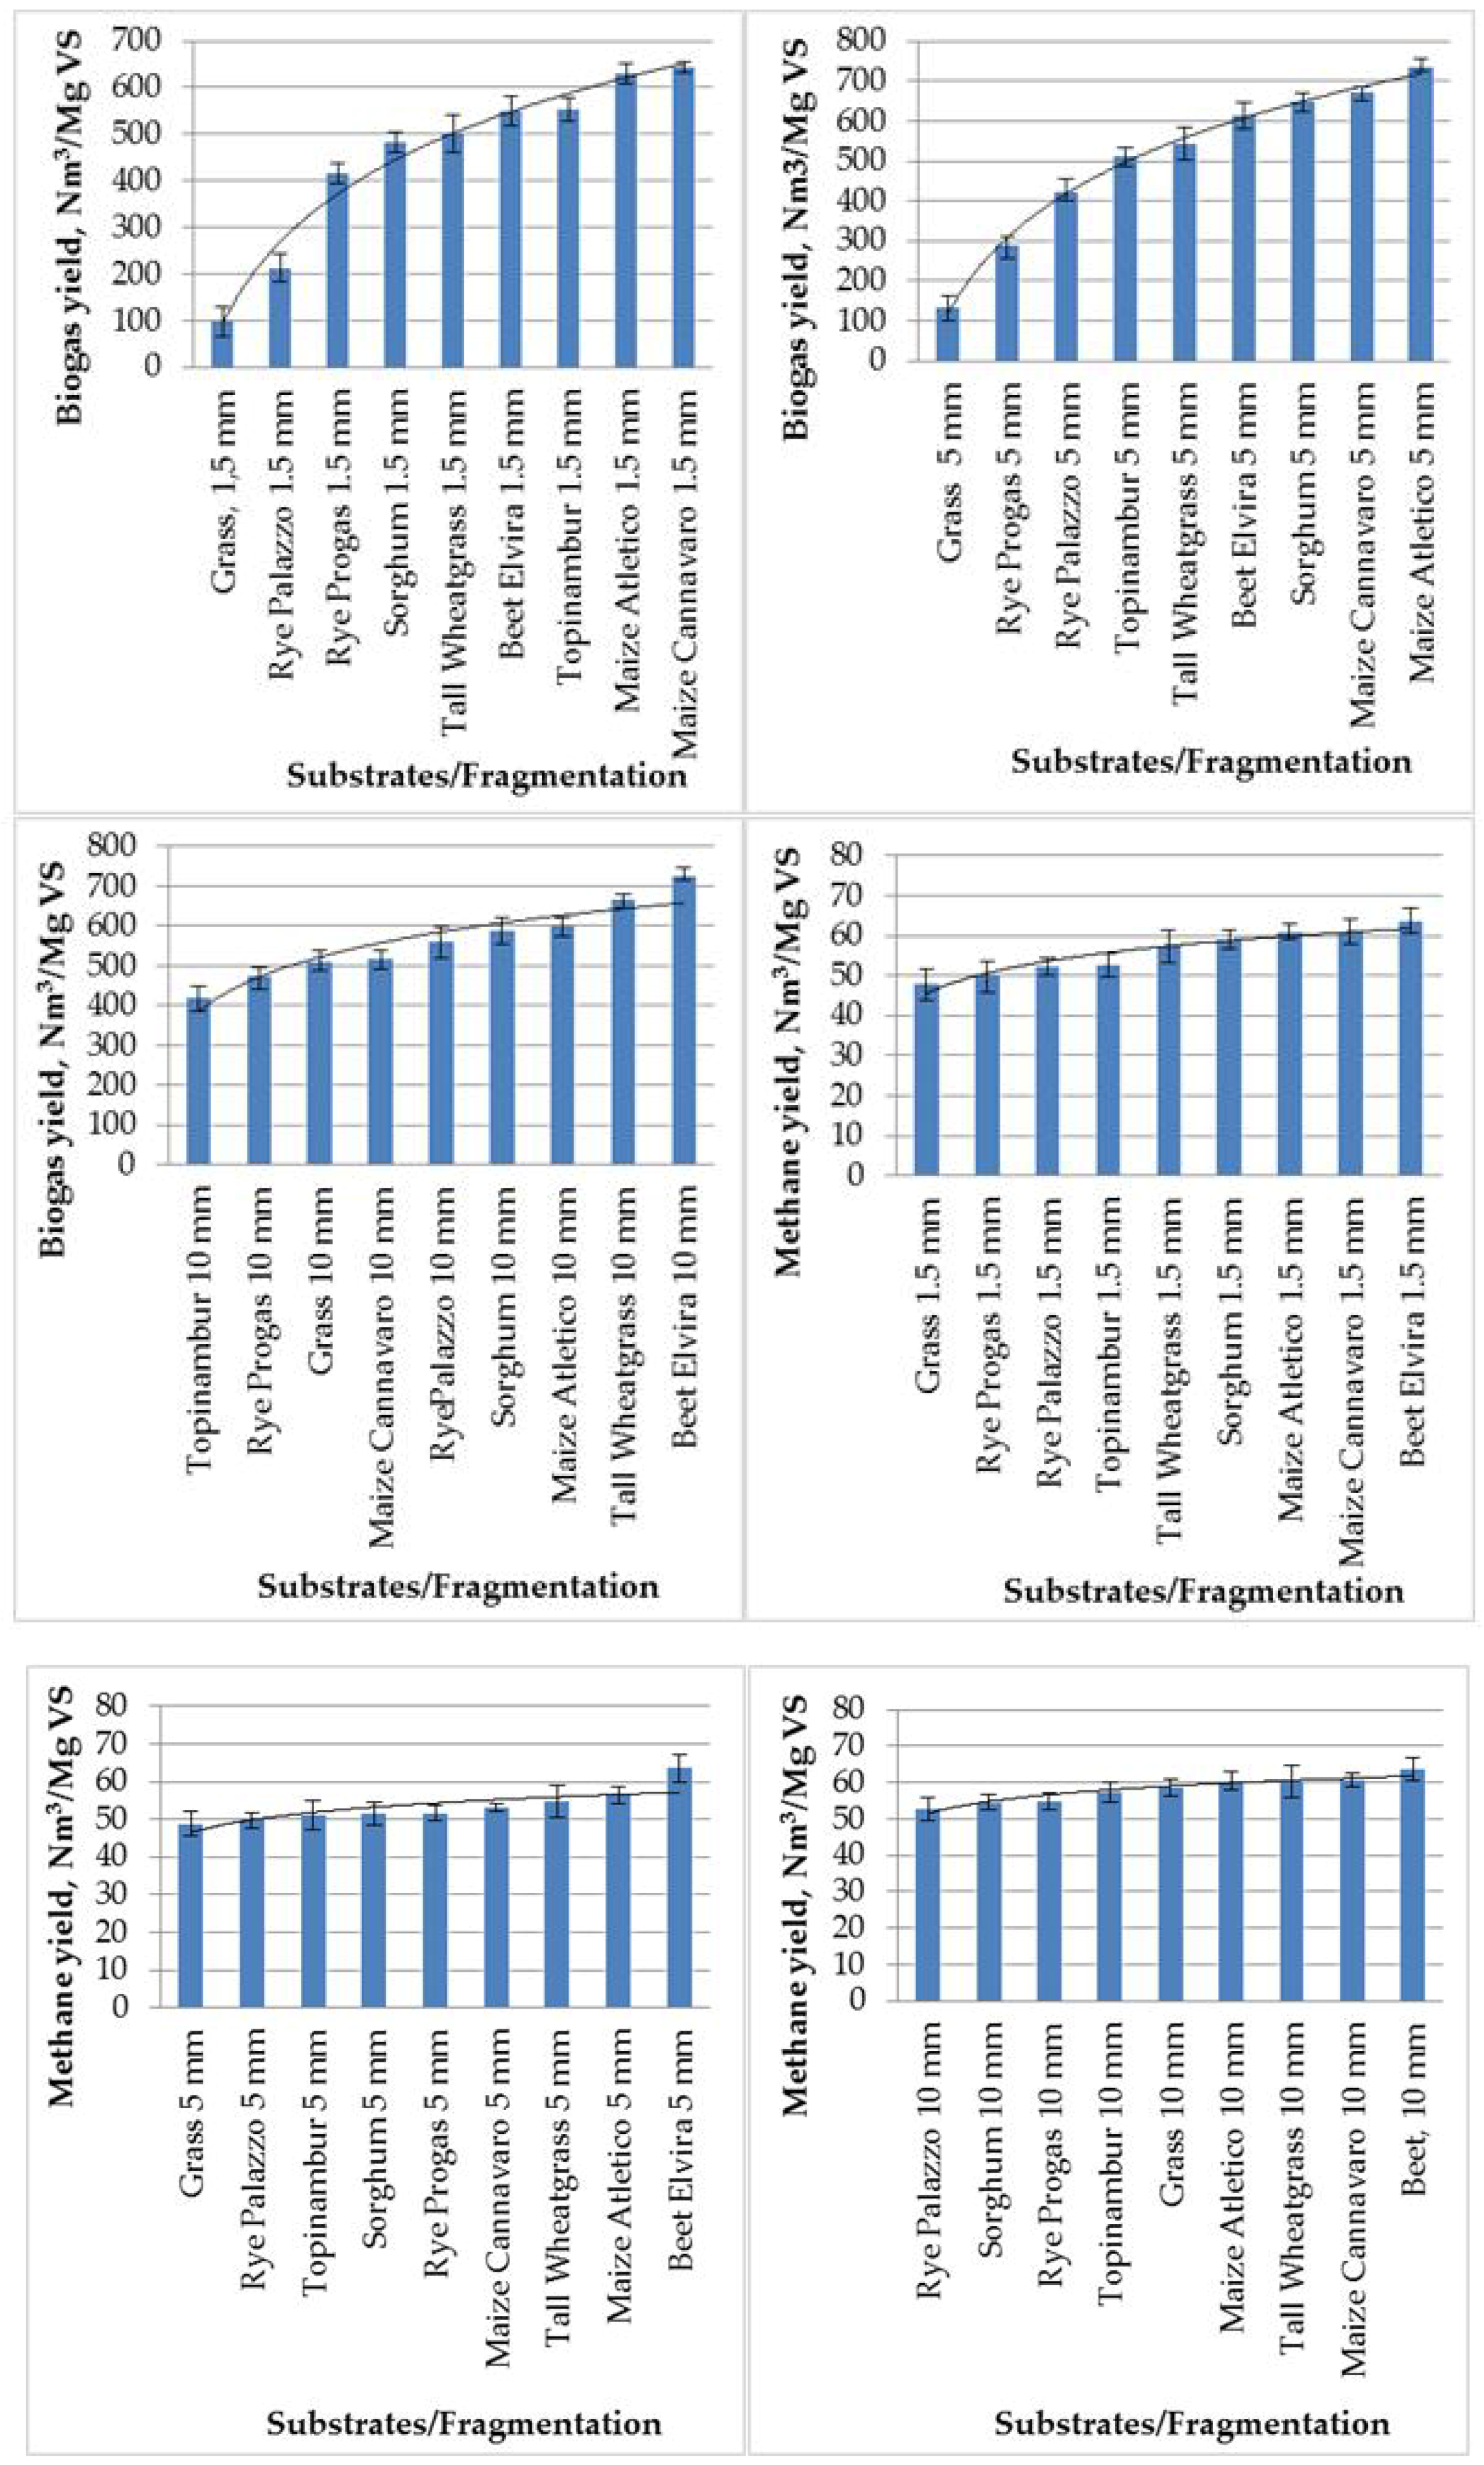
Next, an analysis of the reasonableness of grinding of substrates in terms of biogas efficiency and impact on process kinetics was performed. Changes in the AD parameters show that both the AD course and the biogas yield for the tested substrates were changed due to the degree of fragmentation (Table 2). Degree of fragmentation of substrates had a variable impact on biogas production. Five substrates (grass, rye Progas, rye Palazzo, tall wheatgrass and beet) achieved higher biogas values for degree of fragmentation of 10 mm compared to the degree of fragmentation of 5 mm and 1.5 mm (Figure 4). These results are not fully consistent with the suggestions [17,18]. For the 5 mm degree of fragmentation, the highest biogas production was obtained for sorghum, Atletico maize and Cannavaro maize silage (649.80 ± 20.98; 735.59 ± 21.87 and 671.83 ± 13.02 Nm3/Mg VS). Only in the case of Topinambur, the highest biogas production (553.67 ± 26.15 Nm3/Mg VS) was obtained for 1.5 mm degree of fragmentation.
Multivariate statistical analysis (ANOVA) of the influence of the substrate type, degree of fragmentation and volatile solid content on the biogas and methane yield (Table 3), shows a highly significant correlation coefficient for the substrate (0.8960) and the degree of fragmentation (0.8780). This indicates a significant effect of fragmentation on the methane yield.
It should be noted that the reduction of VS was relatively low (51.2%–52.6%). Despite the initial adjustment of pH to about 7.25 this parameter was significantly reduced at the end of the anaerobic digestion to 6.06–6.98, which is beneficial for metanogenic bacteria. According to literature, the optimum initial pH of substrates subjected to anaerobic digestion is 6.7–7.5 [33]. In the initial phase of this process it drops even below 6.0 because of accumulation of volatile fatty acids and carbon dioxide. When these intermediates are converted to a mixture of methane and carbon dioxide, pH is increased and maintained at a constant level. However, when the activity of microorganisms that conduct processes of hydrolysis and acetic acid production is too high, and the function of microorganisms responsible for methane synthesis is insufficient, pH is decreased that brings about the termination of methanogenesis [34]. In addition, the decrease in pH may be caused by the specificity of batch processes because the depletion of carbon sources brings about disadvantageous changes in the C/N and C/P ratios that in turn reduce the metabolic activity of methane-producing microorganisms. This leads to the rise in organic acid concentrations and a decrease in pH in a digester [35]. The correlation of the degree of fragmentationon on methane yield (Table 3) is justified at a higher CH4/CO2 ratio for sorghum silage, which shows higher values for a 1.5 mm degree of fragmentation (Table 2).
3.3. Kinetics of Anaerobic Digestion
The kinetics of biogas production from investigated substrates by batch AD was modeled using a modified Gompertz equation. The values of kinetic constants Hmax, Rmax, λ (Table 4)—were determined by non-linear regression. The simulation of expected biogas yield, using experimental data and the Gompertz equation, is presented in Figure 3. The analysis of data, which are shown in Table 4, leads to a conclusion that the values of kinetic constants depended on substrates and degree of fragmentation.
The biogas production for degree of fragmentation of substrates varies considerably, but this relationship is not unequivocal. The highest dependence there is between degree of fragmentation and time lag phase is where the correlation is highest at 0.9714 (Table 5). When the substrates were ground to 1.5 mm, the lag phase was shortened from 10.21 to 7.37 days, respectively. Unmistakable lag time is proportional to the fragmentation only for beet silage. The use of the Gompertz model to describe the kinetics of fermentation of other substrates did not show a significant dependence of the parameters of the Hmax and Rmax model on the degree of substrate disintegration. Correlation of the impact of the degree of fragmentation on Hmax was significant and amounted to −0.3852 and Rmax was negligible and amounted to 0.11144. The modified Gompertz model fitted the experimental results well, which is shown in Figure 5 since values of the correlation coefficient R2 varied from 0.986 to 0.999 and RMSE from 1.18 to 20.23. According to this model, the highest potential biogas yield, Hmax = 715.82 Nm3/Mg VS, could be obtained from Atletico maize silage and for degree of fragmentation 5 mm. This value was correlated with the maximum biogas production rate (Rmax) of 114.19 Nm3/Mg VS day. These values of Hmax were 14.40% higher than those obtained for the degree of fragmentation of 1.5 mm and 23.45% higher than those obtained for degree of fragmentation of 10 mm. The values of Rmax were 29.68% higher than the results obtained for the degree of fragmentation of 1.5 mm and 46.86% higher than those obtained for grinding of 10 mm. The highest methane production, regardless of the degree of grinding, was obtained for beet silage (Figure 6).
4. Discusion
The results of anaerobic digestion for nine agriculture substrates in the form of silage and degree of fragmentation close to the assumed ones, ie: 1.5 mm, 5 mm and 10 mm, did not show an unambiguous effect of the degree of fragmentation on biogas yield and fermentation kinetics. It should be noted that the tested substrates in the whole mass of the batch had dimensions very close to the assumed ones, i.e.,: 1.5 mm; 5 mm and 10 mm, which were obtained in a sieve test. In a 1.5 mm sample, particles smaller than 2.5 mm and larger than 1.5 mm were included; in a 5 mm sample, particles smaller than 6 mm and larger than 5 mm were included; and in a 10 mm sample, particles smaller than 11 mm and larger than 10 mm were included. The results of biogas yields from grass, rye Progas, rye Palazzo, tall wheatgrass and beet silage were highest for 10 mm degree of fragmentation. Only for topinambur silage was the highest biogas production (510.43 ± 24.18 Nm3/Mg VS) obtained for 1.5 mm degree of fragmentation.
The results obtained differ from the results of [24], where two different mechanical pre-treatment apparatuses, i.e., a Grubben deflaker and a Krima disperser, were tested in a full scale setup to evaluate their effects on ley crop silage. The treatments were investigated with regard to their effects on particle size, methane potential, capacity and energy balance. The results show that methane production increased by 59% and 43% respectively after grinding with the two different methods. It should be noted that for both types of fragmentation, 90% of the ley crop was ground to particles of less than 2 mm and more than 50% of the sample was reduced to particles smaller than 0.125 mm. This means that the fragmentation of the batch was not homogeneous. The batch in the reactor contained particles of larger dimensions, which is important in terms of providing conditions in the fermenter for the development of menthanogenic bacteria.
Similar remarks can be made about the results contained in [21,25,36], where the effect of the degree of fragmentation below 0.5 mm on the biogas yield was demonstrated, but also in this case the batch structure in the fermenter was not homogeneous in terms of particle size.
There is a view in literature that for the individual degree of fragmentation there is a specific ability to create colonies of methanogenic bacteria (microbial conditions) important for the digestive process. Similar observations occur at work [37] in studies on an up-flow anaerobic sludge blanket (UASB). Granulated microorganisms are also attached to the medium; hence, a high-density microbial population is being reactivated, creating a hybridization of microbial floe and adhesion.
5. Conclusions
All the tested mechanical pre-treatment methods improved the digestibility of ensiled plant substrates and contributed to biogas enhancement.
A novelty of the work, in contrast to other works in this field are the effects of the impact of more precise determination of the degree of fragmentation of plant substrates on the production of biogas, methane and the kinetics of anaerobic digestion.
The results of biogas and methane yield obtained refer to the vegetable charge of fragmentation (particle length) close to the dimensions of 1.5 mm, 5 mm, 10 mm. The results obtained in five cases indicate that the optimum degree of fragmentation is 10 mm and only for topinambur silage is there a better yield for the degree of fragmentation of 1.5 mm. The modified Gompertz model fitted the experimental results obtained in this study well. According to this model, the highest potential biogas yield, Hmax = 715.82 Nm3/Mg VS, could be obtained from Atletico maize silage and for a degree of fragmentation of 5 mm. This value was correlated with the maximum biogas production rate (Rmax) of 114.19 Nm3/Mg VS day. The results obtained have a high cognitive and economic significance. They indicate that the fragmentation of plant materials before anaerobic digestion to 10 mm ensures high biogas production. For most substrates, there is no need to incur large amounts of energy to reduce the dimension to 5 mm or 1.5 mm.
Author Contributions
Conceptualization, J.S.; methodology, J.S. and H.P.; software, J.S. and H.P.; formal analysis, M.F. and A.L.; investigation, H.P. and M.F.; data curation, H.P.; writing—original draft preparation, J.S., H.P. and M.F.; writing—review and editing, J.S., H.P., M.F. and A.L.; visualization, J.S. and H.P; supervision, J.S.; project administration, J.S.; funding acquisition, J.S., H.P. and M.F.
Funding
The work was carried out as part of the NCBR PBS3/B8/23/2015 project ID: 247127 entitled “Non-waste biogas production from plant substrates based on the transformation of digestate into a valuable organic-mineral granular fertilizer”.
Conflicts of Interest
The authors declare no conflict of interest
References
- El Achkar, J.H.; Lendormi, T.; Hobaika, Z.; Salameh, D.; Louka, N.; Maroun, R.G.; Lanoisellé, J.L. Anaerobic digestion of nine varieties of grape pomace: Correlation between biochemical composition and methane production. Biomass Bioener. 2017, 107, 335–344. [Google Scholar] [CrossRef]
- Tyagi, V.K.; Fdez-Güelfo, L.A.; Zhou, Y.; Álvarez-Gallego, C.J.; Garcia, L.I.R.; Ng, W.J. Anaerobic co-digestion of organic fraction of municipal solid waste (OFMSW): Progress and challenges. Renew Sustain. Energy Rev. 2018, 93, 380–399. [Google Scholar] [CrossRef]
- Kalambura, S.; Krička, T.; Kiš, D.; Marić, S.; Guberac, S.; Kozak, D.; Stoić, A.; Racz, A. Anaerobic digestion of specific biodegradable waste and final disposal. Tehnicki Vjesnik 2016, 23, 1601–1607. [Google Scholar]
- Ministry of Economy. Energy policy of Poland until 2030 — Annex to Resolution No. 202/2009 of the Council of Ministers; Ministry of Economy: Warsaw, Poland, 2009.
- Gonzalez-Fernandez, C.; Sialve, B.; Molinuevo-Salces, B. Anaerobic digestion of microalgal biomass: Challenges, opportunities and research needs. Bioresour. Technol. 2015, 198, 896–906. [Google Scholar] [CrossRef] [PubMed]
- Lindmark, J.; Thorin, E.; Bel Fdhila, R.; Dahlquist, E. Effects of mixing on the result of anaerobic digestion: Review. Renew Sustain. Energy Rev. 2014, 40, 1030–1047. [Google Scholar] [CrossRef]
- Rada, E.C.; Ragazzi, M.; Torretta, V. Laboratory-scale anaerobic sequencing batch reactor for treatment of stillage from fruit distillation. Water Sci. Technol. 2013, 67, 1068–1074. [Google Scholar] [CrossRef] [PubMed] [Green Version]
- Nizami, A.S.; Orozco, A.; Groom, E.; Dieterich, B.; Murphy, J.D. How much gas can we get from grass? Appl. Energy 2012, 92, 783–790. [Google Scholar] [CrossRef]
- Chiumenti, A.; Boscaro, D.; da Borso, F.; Sartori, L.; Pezzuolo, A. Biogas from Fresh Spring and Summer Grass: Effect of the Harvesting Period. Energies 2018, 11, 1466. [Google Scholar] [CrossRef]
- Boscaro, D.; Pezzuolo, A.; Sartori, L.; Marinello, F.; Mattioli, A.; Bolzonella, D.; Grigolato, S. Evaluation of the energy and greenhouse gases impacts of grass harvested on riverbanks for feeding anaerobic digestion plants. J. Clean. Prod. 2018, 172, 4099–4109. [Google Scholar] [CrossRef]
- Fugol, M.; Prask, H. Porównanie uzysku biogazu z trzech rodzajów kiszonek; z kukurydzy, lucerny i trawy. Comparison of biogas yield from three types of silage; from corn, alfalfa and grass. Inż. Rol. 2011, 9, 31–39. [Google Scholar]
- Szlachta, J. Expertise on Obtaining Agricultural Biogas as a Renewable Energy Source. Available online: http://www.agengpol.pl/LinkClick.aspx?fileticket=O67VGkyovAE%3d&tabid=144 (accessed on 22 October 2009).
- Szlachta, J.; Fugol, M.; Prask, H. The impact of the raw material composition on fermentation kinetics and the yield of biogas and methane. Przem. Chem. 2016, 95, 1805–1810. [Google Scholar]
- Kozyra, A.; Production of biomass and GMOs. Renewable Energy Sources a New Challenge for Rural Areas in Poland. Available online: https://docplayer.pl/2898851-Odnawialne-zrodla-energii-nowym-wyzwaniem-dla-obszarow-wiejskich-w-polsce.html (accessed on 22 October 2009).
- Podkówka, W.; Podkówka, Z.; Kowalczyk-Juśko, A.; Pasyniuk, P. Agricultural biogas renewable energy source. Theory and practical application. Wydawnictwo PWRiL 2012, 147–152. [Google Scholar]
- Budzichowska, J. Will Sorghum Replace Maize. Warszawa. Available online: http://www.modr.mazowsze.pl/index.php/porady-dla-rolnikow/produkcja-roslinna/115-czy-sorgo-zastapi-kukurydze (accessed on 14 October 2009).
- Węglarzy, K.; Podkówka, W. Agrobiogazownia; Instytut Zootechniki: Grodziec Śląski, Poland, 2010. [Google Scholar]
- Angelidaki, I.; Ahring, B.K. Methods for increasing the biogas potential from the recalcitrant organic matter contained in manure. Water Sci. Techno. 2000, 41, 189–194. [Google Scholar] [CrossRef]
- Saulnier, L.; Marot, C.; Chanliaud, E.; Thibauld, J.F. Cell wall Polysaccharide interactions in maize bran. Carbohydr. Polym. 1995, 26, 279–287. [Google Scholar] [CrossRef]
- Hendriks, A.T.W.M.; Zeeman, G. Pretreatments to enhance the digestibility of lignocellulosic biomas. Bioresour. Technol. 2009, 100, 10–18. [Google Scholar] [CrossRef] [PubMed]
- Antognoni, S.; Ragazzi, M.; Rada, E.C.; Plank, R.; Aichinger, P.; Kuprian, M.; Ebner, C. Potential Effects of Mechanical Pre-treatments on Methane Yield from Solid Waste Anaerobically Digested. Int. J. Environ. Bioremed. Biodegrad. 2013, 1, 20–25. [Google Scholar]
- Jędrczak, A.; Królik, D. Influence of paper particle size on the efficiency of digestion process. Environ. Prot. Eng. 2007, 33, 145–155. [Google Scholar]
- Hartmann, H.; Angelidaki, I.; Ahring, B.K. Increase of anaerobic degradation of particulate organic matter in full-scale biogas plants by mechanical maceration. Water Sci. Technol. 2004, 41, 145–153. [Google Scholar] [CrossRef]
- Lindmark, J.; Leksell, N.; Schnürer, A.; Thorin, E. Effects of mechanical pre-treatment on the biogas yield from ley crop silage. Appl. Energy 2012, 97, 498–502. [Google Scholar] [CrossRef]
- Tsapekos, P.; Kougias, P.G.; Angelidaki, I. Biogas production from ensiled meadow grass; effect of mechanical pretreatments and rapid determination of substrate biodegradability via physicochemical methods. Bioresour. Technol. 2015, 182, 329–335. [Google Scholar] [CrossRef] [PubMed]
- DIN 38414 S 8. German Standard Methods for the Examination of Water, Waste Water and Sludge; Sludge and Sediments (Group S); Determination of the Amenability to Anaerobic Digestion (S 8); DIN Deutches Institut für Normung e. V.: Berlin, Germany, 2012. [Google Scholar]
- Polski Komitet Normalizacyjny. Oznaczanie Suchej Masy Osadu i Substancji Organicznych. Woda i ścieki. Badania Specjalne Osadów PN-75/C-04616/01; PKN: Płock, Poland, 2004. [Google Scholar]
- Polski Komitet Normalizacyjny. Charakterystyka Osadów ściekowych—Oznaczanie Strat Przy Prażeniu Suchej Masy Osadu PN-EN 12879; PKN: Płock, Poland, 2004. [Google Scholar]
- Lo, H.M.; Kurniawan, T.A.; Sillanpää, M.E.T.; Pai, T.Y.; Chiang, C.F.; Chao, K.P.; Liu, M.H.; Chuang, S.H.; Banks, C.J.; Wang, S.C.; et al. Modeling biogas production from organic fraction of MSW co-digested with MSWI ashes in anaerobic bioreactors. Bioresour. Technol. 2010, 101, 6329–6335. [Google Scholar] [CrossRef] [PubMed]
- Mulka, R.; Szulczewski, W.; Szlachta, J. Estimation of methane production for batch technology—A new approach. Renew. Energy 2016, 90, 440–449. [Google Scholar] [CrossRef]
- Budiyono, B.; Widiasa, I.N.; Johari, S.; Sunarso, S. The kinetic of biogas production rate from cattle manure in batch mode. Int. J. Chem. Biol. Eng. 2010, 3, 39–44. [Google Scholar]
- Jabłoński, S.; Rodowicz, P.; Łukaszewicz, M. Methanogenic archaea database containing physiological and biochemical characteristics. Int. J. Syst. Evol. Microbiol. 2015, 65, 1360–1368. [Google Scholar] [CrossRef] [PubMed] [Green Version]
- Daisy, A.; Kamaraj, S. The impact and treatment of night soil in anaerobic digester: A review. J. Microbial Biochem. Technol. 2011, 3, 43–50. [Google Scholar]
- Staubmann, R.; Foidl, G.; Foidl, N.; Gübitz, G.M.; Lafferty, R.M.; Arbizu, V.M.; Steiner, W. Biogas production from Jatropha curcas press-cake. Appl. Biochem. Biotechnol. 1997, 63, 457–467. [Google Scholar] [CrossRef] [PubMed]
- Ziemiński, K.; Kowalska-Wentel, M. Effect of Different Sugar Beet Pulp Pretreatments on Biogas Production Efficiency. Appl. Biochem. Biotechnol. 2017, 181, 1211–1227. [Google Scholar] [CrossRef] [PubMed]
- Tsapekos, P.; Egelund, P.G.; Larsen, U.; Pedersenc, J.; Trénelc, P.; Angelidakia, I. Mechanical pretreatment at harvesting increases the bioenergy output from marginal land grasses. Renew. Energy 2017, 111, 914–921. [Google Scholar] [CrossRef]
- Ziemiński, K.; Frąc, M. Methane fermentation process as anaerobic digestion of biomass Transformations, stages and microorganisms. Afr. J. Biotechnol. 2012, 11, 4127–4139. [Google Scholar]
Figure 1.
Non-fragmented and fragmented substrates.

Figure 2.
Research stand: eudiometers.

Figure 3.
Biogas and methane production.
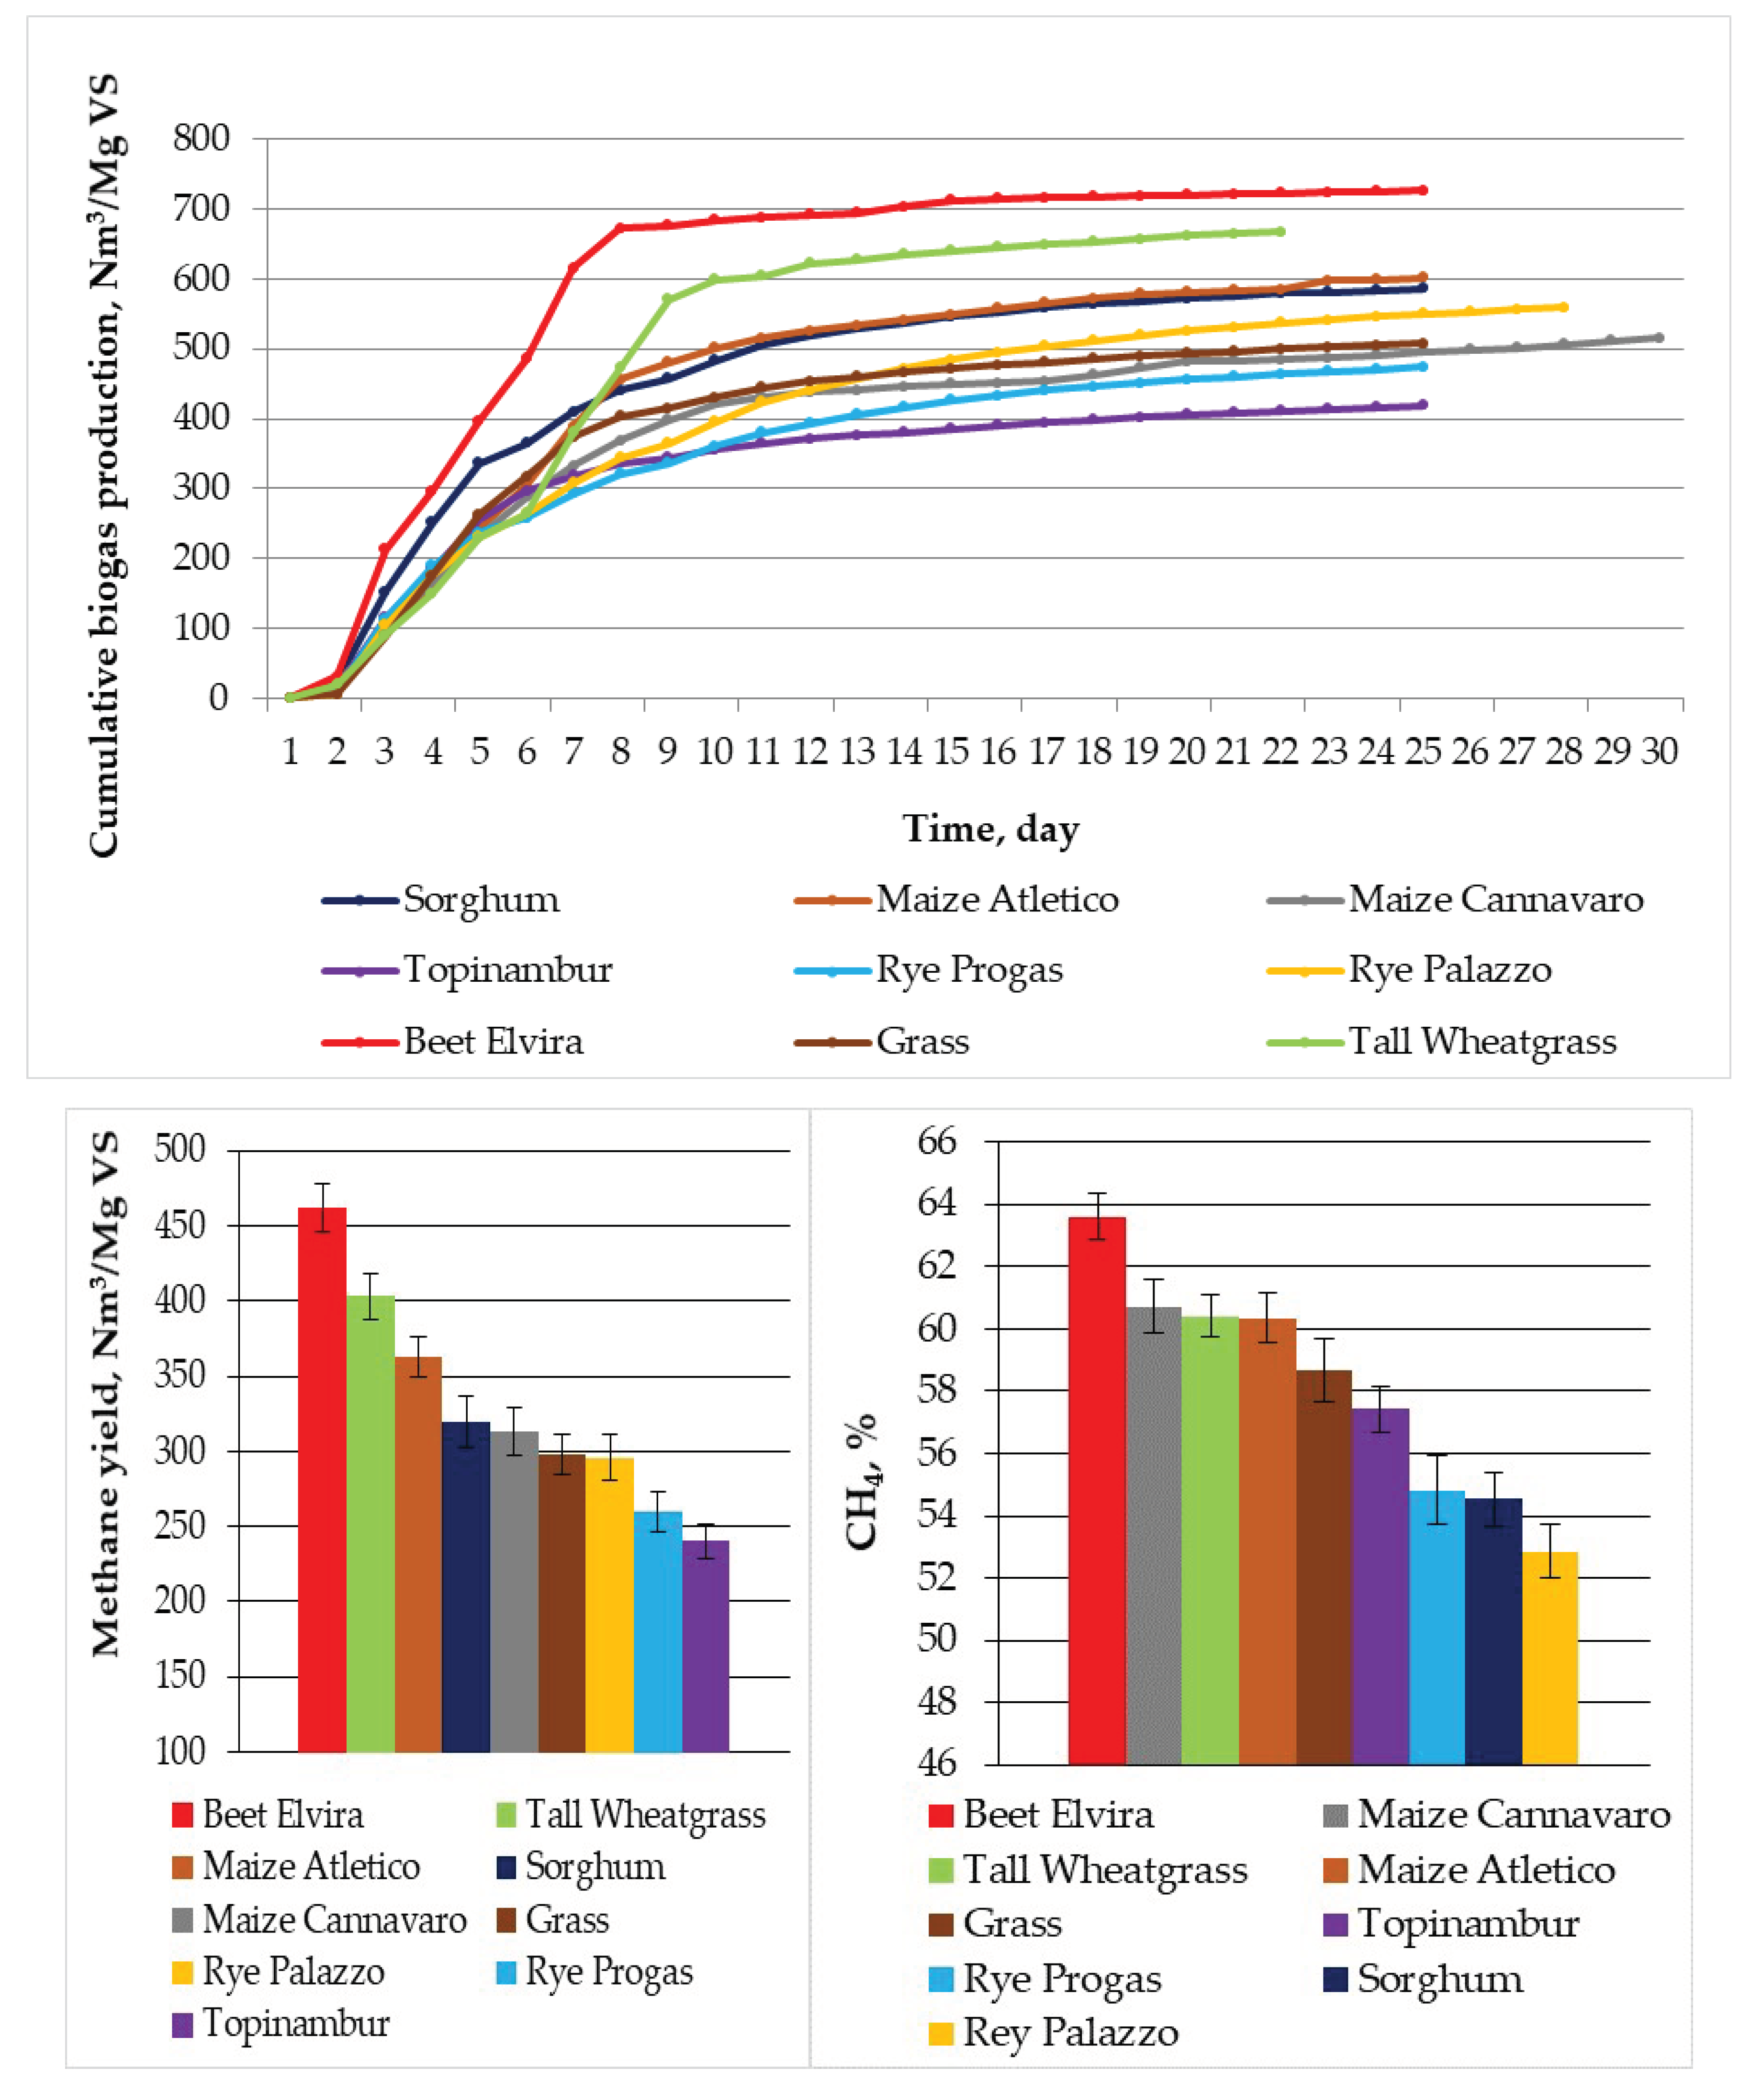
Figure 4.
Variable impact of biogas production on degree of fragmentation of substrates.
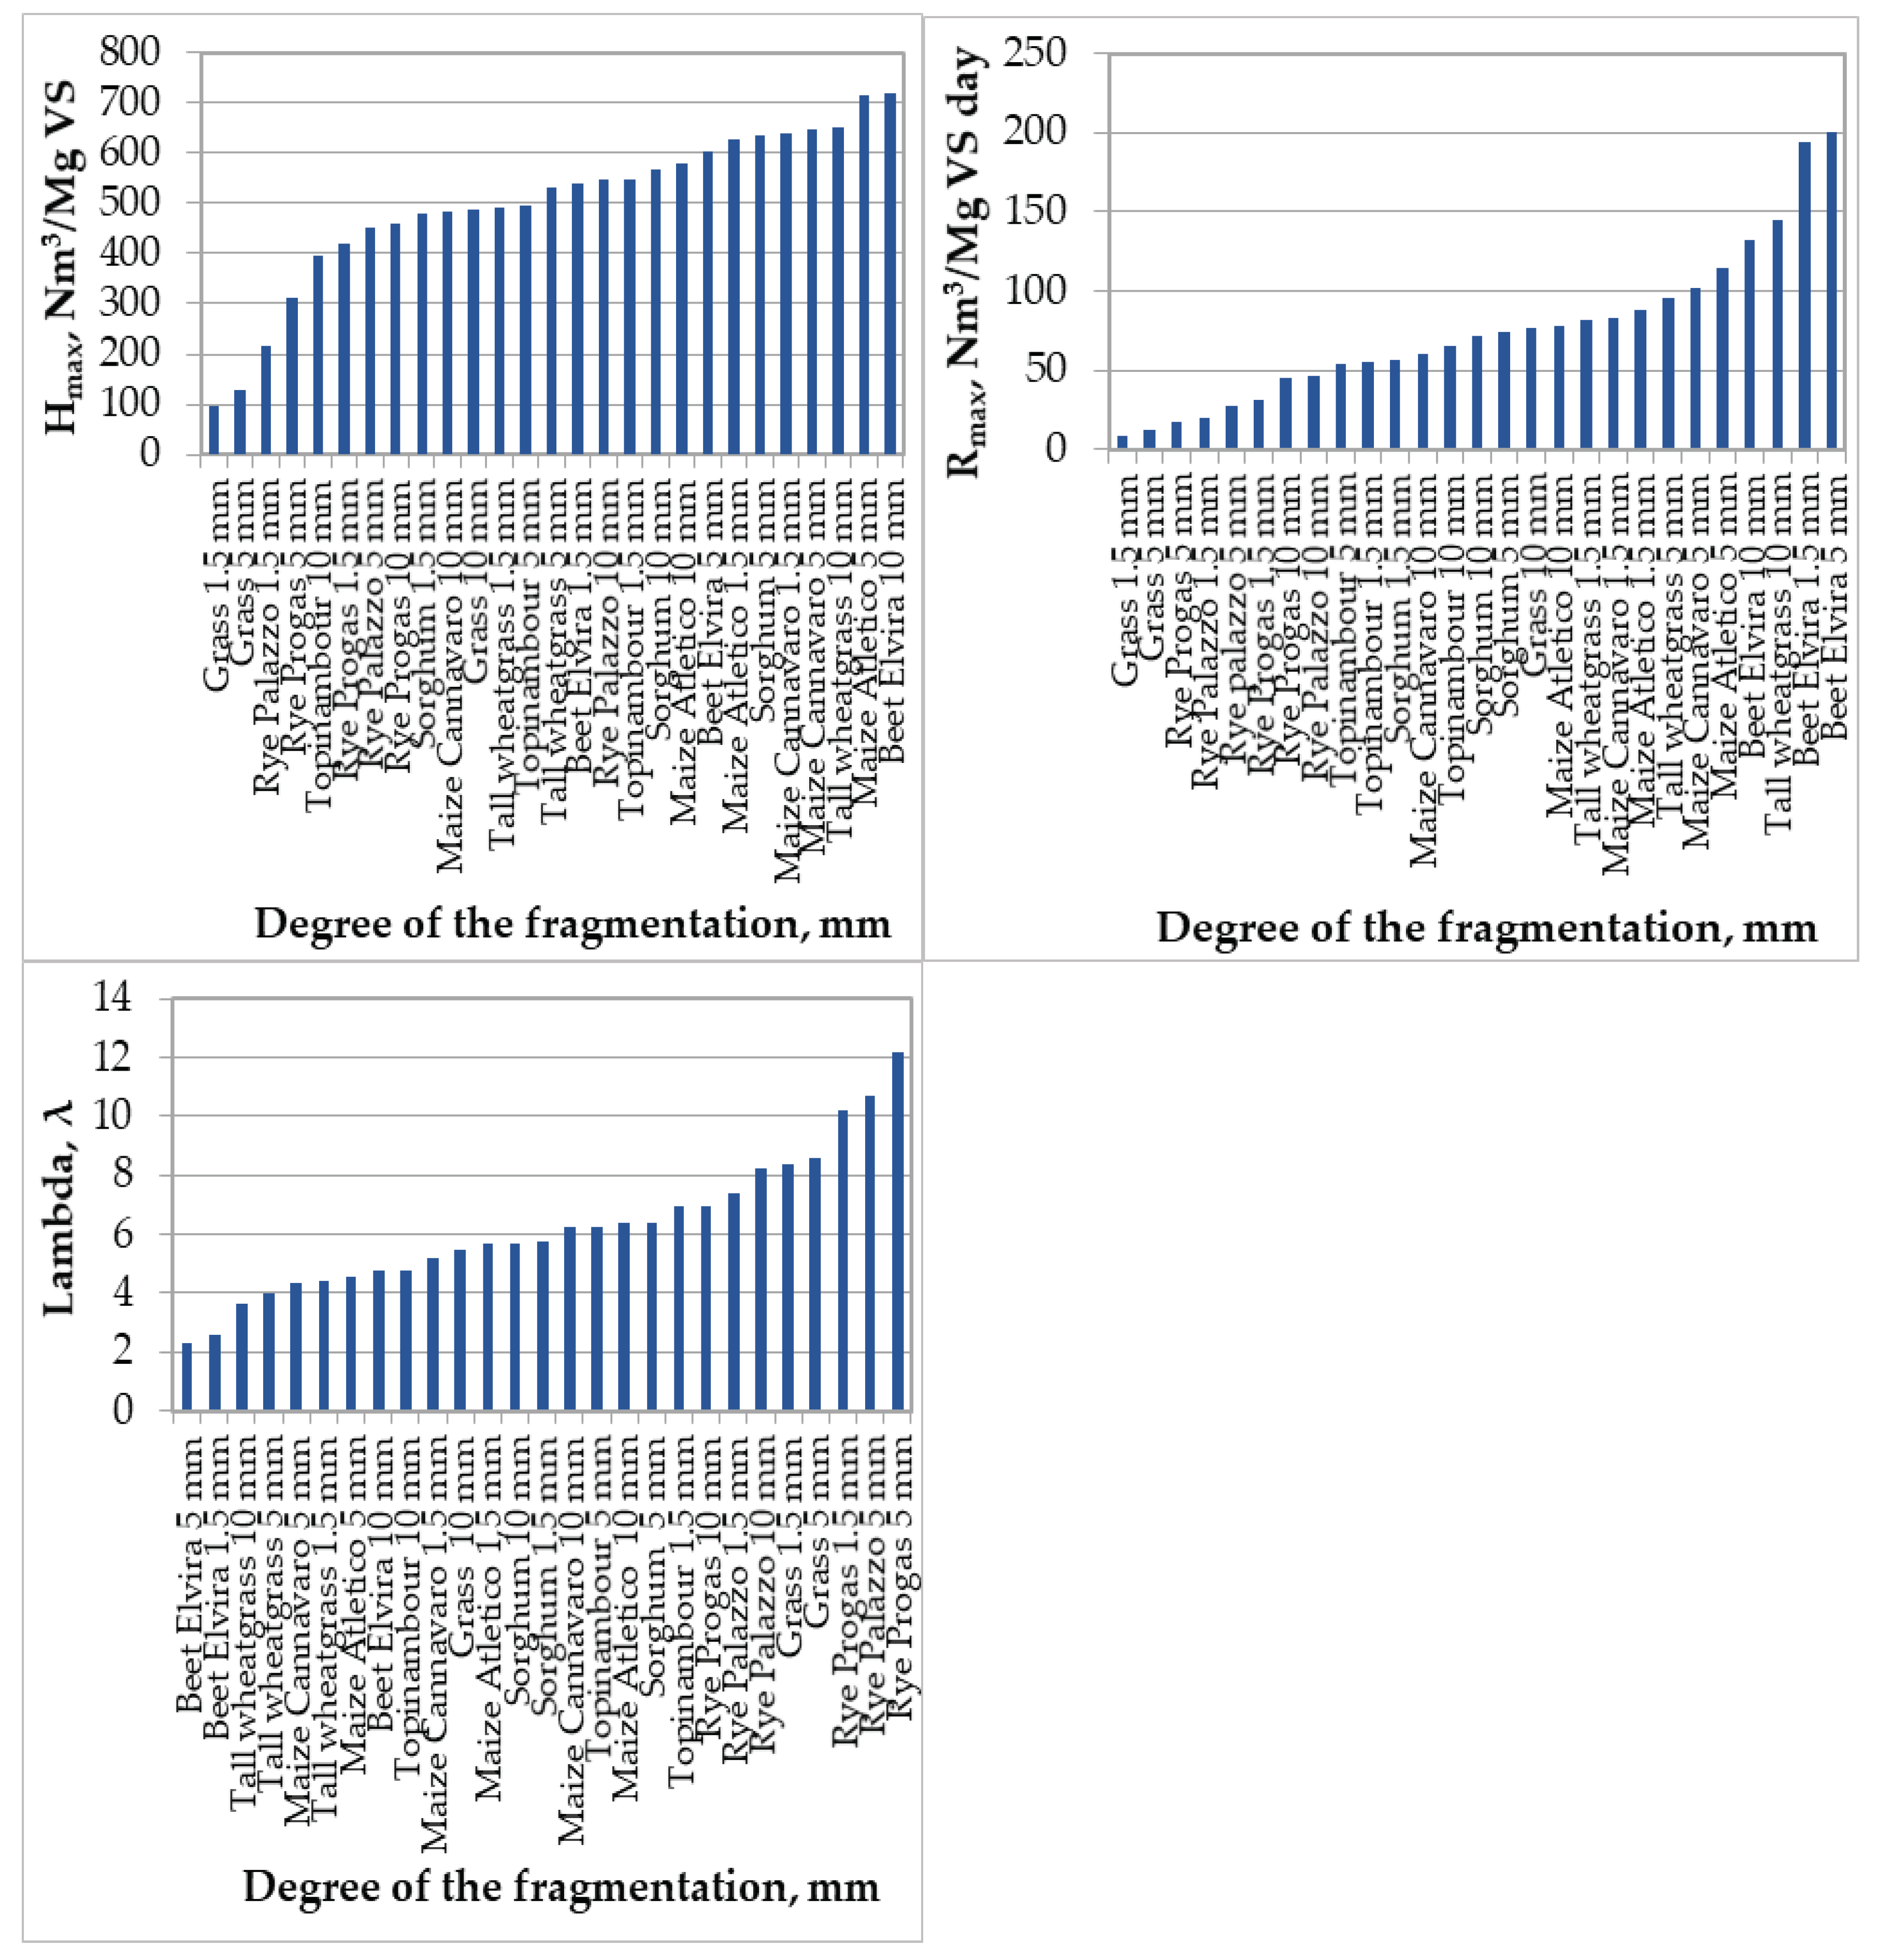
Figure 5.
The modified Gompertz model for chosen substrates.

Figure 6.
Biogas and methane yield from fragmentation substrates.


Table 1.
Physicochemical analyses of substrates prior to anaerobic digestion and cumulative biogas production.
Table 1.
Physicochemical analyses of substrates prior to anaerobic digestion and cumulative biogas production.
| Parameter | Inoculum | Maize Cannavaro Silage | Maize Atletico Silage | Sorghum Silage | Beet Silage | Topinambur Silage | Rye Progas Silage | Rye Palazzo Silage | Grass Silage | Tall Wheatgrass Silage |
|---|---|---|---|---|---|---|---|---|---|---|
| Total solid (TS, %) | 5.9 ± 0.1 | 40.63 ± 4.20 | 37.32 ± 3.51 | 25.81 ± 3.32 | 18.74 ± 2.32 | 21.84 ± 3.33 | 58.20 ± 4.12 | 54.54 ± 4.21 | 17.92 ± 2.34 | 22.25 ± 0.23 |
| Volatile solid (VS, % TS) | 76.9 ± 0.12 | 96.92 ± 2.25 | 96.22 ± 2.23 | 93.53 ± 2.43 | 91.41 ± 3.21 | 81.94 ± 2.20 | 86.75 ± 4.21 | 82.11 ± 4.12 | 74.36 ± 2.11 | 87.41 ± 4.21 |
| Ash (%) | 1.37 ± 0.10 | 1.28 ± 0.13 | 1.41 ± 0.23 | 1.69 ± 016 | 1.61 ± 052 | 3.94 ± 1.12 | 7.86 ± 0.87 | 9.70 ± 0.32 | 4.59 ± 0.38 | 2.79 ± 0.43 |
| pH | 8,8 | 4.4 | 4.3 | 4.4 | 4.0 | 5.3 | 5.2 | 4.9 | 5.6 | 4.8 |
| N (% TS) | 7,84 ± 0.11 | 1.59 ± 0.12 | 1.55 ± 0.11 | 1.54 ± 0.09 | 0.98 ± 0.07 | 1.51 ± 0.14 | 1.15 ± 015 | 1.32 ± 0.19 | 2.92 ± 0.21 | 2.14 ± 0.23 |
| C (% TS) | 46.3 ± 014 | 45.66 ± 3.21 | 46.25 ± 2.18 | 44.70 ± 1.98 | 40.95 ± 1.98 | 41.00 ± 2.08 | 36.92 ± 2.12 | 29.63 ± 2.17 | 40.46 ± 2.17 | 45.66 ± 2.19 |
| C/N | 5.9 | 28.7 | 29.8 | 29.0 | 41.7 | 27.2 | 32.1 | 22.4 | 13.8 | 21.3 |
| QB (Nm3/Mg VS) | 212.84 ± 15.2 | 515.61 ± 12.36 | 601.20 ± 22.50 | 586.62 ± 21.14 | 726.14 ± 33.31 | 418.70 ± 25.54 | 473.87 ± 23.16 | 559.18 ± 33.17 | 508.32 ± 32.87 | 667.47 ± 43.12 |
| P (g/kg TS) | 9.3 | 3.21 | 1.46 | 1.84 | 1.29 | 2.37 | 1.27 | 1.06 | 2.27 | 1.8 |
| P-PO4 (g/kg TS) | 1.8 | 1.34 | 1.24 | 1.28 | 1.26 | 1.35 | 0.37 | 0.51 | 1.29 | 1.67 |
| K (g/kg TS) | 94.6 | 7.69 | 6.49 | 12.17 | 11.73 | 25.9 | 8.05 | 8.15 | 31.63 | 20.96 |
| Ca (g/kg TS) | 93.6 | 1.56 | 1.76 | 5.26 | 3.94 | 27.69 | 1.62 | 15.8 | 29.95 | 8.44 |
| Na (g/kg TS) | 9.9 | 0.4 | 0.55 | 0.91 | 1.71 | 1.26 | 0.87 | 0.75 | 1.23 | 1.14 |
| N-NH4 (g/kg TS) | 40.4 | 1.01 | 1.28 | 1.49 | 0.42 | 0.05 | 1.03 | 1.47 | 0.24 | 2.19 |
| Hg (mg/kg TS) | 0.0130 | 0.0048 | 0.0050 | 0.0136 | 0.0175 | 0.0528 | 0.0248 | 0.0250 | 0.0580 | 0.0253 |
| Zn (mg/kg TS) | 832 | 29.0 | 35.0 | 50.3 | 25.0 | 42.7 | 41.5 | 47.2 | 51.0 | 36.0 |
| Pb (mg/kg TS) | 5.54 | 1.38 | 2.09 | 2.12 | 2.43 | 8.26 | 6.94 | 6.74 | 11.6 | 5.26 |
| Cd (mg/kg TS) | <0.900 | <0.100 | <0.100 | 0.479 | 0.178 | 0.391 | 0.283 | 0.277 | 0.416 | 0.119 |
| Cr (mg/kg TS) | 21.7 | 15.6 | 9.10 | 20.2 | 21.7 | 7.95 | 12.41 | 9.24 | 7.76 | 26.31 |
| Cu (mg/kg TS) | 295 | 5.37 | 6.04 | 7.72 | 9.79 | 16.82 | 13.54 | 13.81 | 22.83 | 10.32 |
| Ni (mg/kg TS) | 18.5 | 10.70 | 6.45 | 7.11 | 18.6 | 5.01 | 52.3 | 45.92 | 4.74 | 11.90 |
| S (g/kg TS) | 5.98 | 1.10 | 1.04 | 1.40 | 1.18 | 1.77 | 1.47 | 1.60 | 2.47 | 2.63 |
| Mg (g/kg TS) | 3.46 | 1.39 | 1.53 | 2.05 | 2.24 | 4.86 | 0.801 | 0.825 | 6.42 | 4.24 |
| Fe (g/kg TS) | 2.58 | 0.213 | 0.167 | 0.266 | 2.56 | 0.394 | 2.82 | 3.52 | 0.541 | 0.781 |
| P (g/kg TS) | 11.4 | 2.68 | 2.66 | 2.25 | 2.23 | 1.61 | 1.24 | 1.47 | 2.35 | 3.26 |
| K (g/kg TS) | 45.2 | 8.24 | 7.84 | 17.0 | 16.1 | 39.0 | 10.7 | 10.5 | 3.62 | 29.1 |
| Co (g/kg TS) | <0.250 | <0.100 | <0.100 | <0.100 | <0.100 | <0.100 | 0.269 | 0.280 | <0.100 | <0.100 |
| Mo (g/kg TS) | <0.480 | 0.705 | 0.557 | 0.579 | 0.958 | 0.629 | 2.01 | 1.12 | 0.801 | 1.93 |
| Mn (g/kg TS) | 15.6 | 16.6 | 19.6 | 44.8 | 42.9 | 71.4 | 160 | 164 | 90.3 | 45.3 |
Reference: own study.
Table 2.
Parameters of batch before anaerobic digestion (batch: inoculum + substrate).
| Silages from Substrates | Degree of Fragmenta -tion (mm) | TS (%) | VS (% TS) | Cumulative Biogas Yield QB (Nm3/Mg VS) | Methane Yield (Nm3/Mg VS) | CO2 (%) | CH4/CO2 | VS Removal (%) | pH Initial | pH Final |
|---|---|---|---|---|---|---|---|---|---|---|
| 1.5 | 18.00 | 74.36 | 98.02 ± 32.17 | 46.86 ± 11.2 | 34.02 | 1.68 | 51.2 | 7.12 | 6.06 | |
| Grass | 5 | 17.92 | 74.36 | 131.23 ± 31.19 | 63.99 ± 10.02 | 25.30 | 1.87 | 51.7 | 7.21 | 6.12 |
| 10 | 17.92 | 74.36 | 508.34 ± 32.87 | 298.18 ± 7.02 | 24.68 | 1.92 | 51.9 | 7.27 | 6.13 | |
| 1.5 | 58.23 | 86.75 | 414.82 ± 21.87 | 206.38 ± 11.73 | 36.48 | 1.52 | 51.5 | 7.18 | 6.14 | |
| Rye Progas | 5 | 58.20 | 86.75 | 287.65 ± 22.25 | 148.65 ± 6.24 | 43.75 | 1.14 | 51.9 | 7.25 | 6.19 |
| 10 | 58.20 | 86.75 | 473.78 ± 23.16 | 259.77 ± 6.75 | 34.30 | 1.67 | 51.9 | 7.22 | 6.12 | |
| 1.5 | 54.54 | 82.11 | 213.46 ± 31.19 | 111.51 ± 6.78 | 38.84 | 1.32 | 51.3 | 7.14 | 6.12 | |
| Rye Palazzo | 5 | 54.54 | 82.11 | 421.49 ± 32.19 | 209.86 ± 11.01 | 37.83 | 1.36 | 51.3 | 7.23 | 6.13 |
| 10 | 54.54 | 82.11 | 559.11 ± 33.17 | 295.51 ± 9.51 | 35.31 | 1.48 | 51.8 | 7.32 | 6.14 | |
| 1.5 | 25.81 | 93.53 | 482.96 ± 22.09 | 284.85 ± 6.90 | 39.72 | 1.29 | 51.5 | 7.13 | 6.12 | |
| Sorghum | 5 | 25.81 | 93.53 | 649.80 ± 20.98 | 334.22 ± 8.67 | 34.99 | 1.36 | 51.8 | 7.22 | 6.12 |
| 10 | 25.81 | 93.53 | 586.59 ± 21.14 | 319.88 ± 6.42 | 37.62 | 1.23 | 51.2 | 7.22 | 6.12 | |
| 1.5 | 22.25 | 87.41 | 501.54 ± 40.25 | 287.03 ± 12.48 | 36.04 | 1.59 | 51.1 | 7.23 | 6.13 | |
| Tall Wheatgrass | 5 | 22.25 | 87.41 | 544.06 ± 39.18 | 297.95 ± 12.99 | 35.03 | 1.52 | 51.3 | 7.19 | 6.13 |
| 10 | 22.25 | 87.41 | 667.36 ± 43.12 | 403.15 ± 13.20 | 34.49 | 1.75 | 51.9 | 7.13 | 6.14 | |
| 1.5 | 18.74 | 91.41 | 549.66 ± 32.87 | 349.88 ± 9.63 | 35.02 | 1.82 | 52.4 | 7.23 | 6.93 | |
| Beet | 5 | 18.74 | 91.41 | 612.37 ± 32.98 | 388.57 ± 10.53 | 34.87 | 1.99 | 52.7 | 7.32 | 6.95 |
| 10 | 18.74 | 91.41 | 726.12 ± 33.31 | 461.80 ± 9.93 | 34.12 | 2.08 | 52.9 | 7.13 | 6.98 | |
| 1.5 | 37.32 | 96.22 | 629.35 ± 21.98 | 383.30 ± 6.06 | 36.57 | 1.67 | 51.9 | 7.22 | 6.72 | |
| Maize Atletico | 5 | 37.32 | 96.22 | 735.59 ± 21.87 | 413.93 ± 6.75 | 35.97 | 1.76 | 52.7 | 7.22 | 6.83 |
| 10 | 37.32 | 96.22 | 601.20 ± 22.50 | 362.80 ± 7.50 | 36.54 | 1.61 | 51.8 | 7.23 | 6.72 | |
| 1.5 | 40.63 | 96.92 | 643.79 ± 11.87 | 392.49 ± 9.60 | 34.98 | 1.60 | 51.9 | 7.13 | 6.62 | |
| Maize Cannavaro | 5 | 40.63 | 96.92 | 671.83 ± 13.02 | 356.80 ± 3.36 | 35.89 | 1.51 | 52.6 | 7.32 | 6.68 |
| 10 | 40.63 | 96.92 | 515.61 ± 12.36 | 313.05 ± 5.55 | 35.44 | 1.58 | 51.7 | 7.22 | 6.62 | |
| 1.5 | 21.84 | 81.94 | 553.67 ± 26.15 | 291.48 ± 8.97 | 38.07 | 1.38 | 51.8 | 7.23 | 6.13 | |
| Topinambur | 5 | 21.84 | 81.94 | 510.43 ± 24.18 | 260.63 ± 7.86 | 35.27 | 1.44 | 51.3 | 7.13 | 6.12 |
| 10 | 21.84 | 81.94 | 418.70 ± 25.54 | 240.39 ± 8.04 | 40.10 | 1.34 | 52.2 | 7.17 | 6.12 |
Reference: own study.
Table 3.
Correlation matrix for the parameters of anaerobic digestion (AD).
| Parameters | Correlation Significant for N = 28, p < 0.05 | ||||||
|---|---|---|---|---|---|---|---|
| Average | Standard Deviation | Degree of Fragmentation | Substrate | Volatile Solid | Biogas Yield | Methane Yield | |
| Degree of fragmentation | 8.9107 | 18.3818 | 1.000000 | 0.972036 | 0.326022 | -−0.374277 | 0.878026 |
| Substrate | 8.4286 | 18.3251 | 0.972036 | 1.000000 | 0.399170 | −0.349097 | 0.896007 |
| Volatile solid | 88.3196 | 7.4841 | 0.326022 | 0.399170 | 1.000000 | 0.462835 | 0.545469 |
| Biogas yield | 493.1985 | 179.4309 | −0.374277 | −0.349097 | 0.462835 | 1.000000 | −0.105449 |
| Methane yield | 57.4587 | 9.7675 | 0.878026 | 0.896007 | 0.545469 | −0.105449 | 1.000000 |
Reference: own study.
Table 4.
Kinetic constants of biogas production.
| Substrate | Biogas Prod. Potential Hmax (Nm3/Mg VS) | Max. Rate of Biogas Prod. Rmax (Nm3/Mg VS day) | The Lag Phase λ (day) | Coefficient of Determination R2 | Root Mean Squared Error RMSE |
|---|---|---|---|---|---|
| Topinambour silage 1.5 mm | 545.84 | 55.60 | 6.93 | 0.998 | 11.78 |
| Topinambour silage 5 mm | 497.13 | 54.55 | 6.28 | 0.999 | 12.41 |
| Topinambour silage 10 mm | 396.99 | 65.83 | 4.78 | 0.987 | 15.42 |
| Rye Progas silage 1.5 mm | 420.81 | 30.97 | 10.21 | 0.999 | 4.74 |
| Rye Progas silage 5 mm | 313.82 | 17.28 | 12.19 | 0.999 | 6.04 |
| Rye Progas silage 10 mm | 459.79 | 45.36 | 6.95 | 0.989 | 17.91 |
| Maize Cannavaro silage 1.5 mm | 639.41 | 83.66 | 5.21 | 0.999 | 7.82 |
| Maize Cannavaro silage 5 mm | 647.94 | 102.52 | 4.34 | 0.998 | 18.85 |
| Maize Cannavaro silage 10 mm | 485.21 | 59.90 | 6.26 | 0.997 | 15.85 |
| Beet silage 1.5 mm | 539.85 | 194.58 | 2.55 | 0.998 | 9.48 |
| Beet silage 5 mm | 601.15 | 200.72 | 2.33 | 0.998 | 11.81 |
| Beet silage 10 mm | 718.16 | 131.98 | 4.75 | 0.999 | 17.82 |
| Grass silage 1.5 mm | 96.70 | 9.26 | 8.38 | 0.999 | 1.18 |
| Grass silage 5 mm | 129.79 | 12.29 | 8.60 | 0.997 | 3.06 |
| Grass silage 10 mm | 486.63 | 77.08 | 5.46 | 0.998 | 14.05 |
| Sorghum silage 1.5 mm | 478.67 | 56.22 | 5.73 | 0.996 | 15.21 |
| Sorghum silage 5 mm | 636.28 | 73.79 | 6.42 | 0.999 | 13.52 |
| Sorghum silage 10 mm | 567.51 | 71.75 | 5.70 | 0.999 | 20.23 |
| Rye palazzo silage 1.5 mm | 216.10 | 20.38 | 7.37 | 0.999 | 4.13 |
| Rye palazzo silage 5 mm | 451.32 | 27.39 | 10.68 | 0.998 | 12.50 |
| Rye palazzo silage 10 mm | 545.44 | 47.02 | 8.22 | 0.998 | 16.93 |
| Tall wheatgrass silage 1.5 mm | 490.73 | 81.66 | 4.44 | 0.999 | 15.62 |
| Tall wheatgrass silage 5 mm | 533.11 | 95.25 | 3.97 | 0.998 | 10.62 |
| Tall wheatgrass silage 10 mm | 650.83 | 144.29 | 3.62 | 0.999 | 11.72 |
| Atletico maize silage 1.5 mm | 625.65 | 88.05 | 5.67 | 0.999 | 9.66 |
| Atletico maize silage 5 mm | 715.82 | 114.19 | 4.54 | 0.998 | 15.38 |
| Atletico maize silage 10 mm | 579.66 | 77.75 | 6.39 | 0.999 | 13.35 |
Reference: own study.
Table 5.
Correlation matrix for the kinetic constants of biogas production.
| Parameters | Kinetic Constants of Biogas Production, N = 28 Correlation Significant for p < 0.05 | ||||||
|---|---|---|---|---|---|---|---|
| Average | Standard Deviation | Substrate | Degree of Fragmen-tation | Hmax (Nm3/Mg VS) | Rmax (Nm3/Mg VS day) | Lambda, λ | |
| Substrate | 8.4286 | 18.3251 | 1.000000 | 0.972036 | −0.405666 | 0.117710 | 0.978675 |
| Degree of fragmentation | 8.9107 | 18.3818 | 0.972036 | 1.000000 | −0.385217 | 0.114477 | 0.971377 |
| Hmax (Nm3/Mg VS) | 484.6907 | 173.2062 | −0.405666 | −0.385217 | 1.000000 | 0.567290 | −0.497057 |
| Rmax (Nm3/Mg VS day) | 76.4400 | 48.5657 | 0.117710 | 0.114477 | 0.567290 | 1.000000 | −0.008957 |
| Lambda, λ | 9.6061 | 18.0606 | 0.978675 | 0.971377 | 0.497057 | −0.008957 | 1.000000 |
Reference: own study.
© 2018 by the authors. Licensee MDPI, Basel, Switzerland. This article is an open access article distributed under the terms and conditions of the Creative Commons Attribution (CC BY) license (http://creativecommons.org/licenses/by/4.0/).
Share and Cite
MDPI and ACS Style
Szlachta, J.; Prask, H.; Fugol, M.; Luberański, A. Effect of Mechanical Pre-Treatment of the Agricultural Substrates on Yield of Biogas and Kinetics of Anaerobic Digestion. Sustainability 2018, 10, 3669. https://doi.org/10.3390/su10103669
AMA Style
Szlachta J, Prask H, Fugol M, Luberański A. Effect of Mechanical Pre-Treatment of the Agricultural Substrates on Yield of Biogas and Kinetics of Anaerobic Digestion. Sustainability. 2018; 10(10):3669. https://doi.org/10.3390/su10103669
Chicago/Turabian StyleSzlachta, Józef, Hubert Prask, Małgorzata Fugol, and Adam Luberański. 2018. "Effect of Mechanical Pre-Treatment of the Agricultural Substrates on Yield of Biogas and Kinetics of Anaerobic Digestion" Sustainability 10, no. 10: 3669. https://doi.org/10.3390/su10103669
Note that from the first issue of 2016, this journal uses article numbers instead of page numbers. See further details here.