Article

Valuing Cultural Services of the Kailash Sacred Landscape for Sustainable Management

1
South Asian Network for Development and Environmental Economics (SANDEE), ICIMOD, Kathmandu, Nepal
2
Institute of Economic Growth (IEG), New Delhi 110007, India
3
International Centre for Integrated Mountain Development (ICIMOD), Kathmandu, Nepal
4
G.B. Pant National Institute of Himalayan Environment and Sustainable Development (GBPNIHESD), Kosi-Katarmal, Almora 263643, India
*
Author to whom correspondence should be addressed.
Sustainability 2018, 10(10), 3638; https://doi.org/10.3390/su10103638
Submission received: 16 August 2018 / Revised: 26 September 2018 / Accepted: 2 October 2018 / Published: 11 October 2018
(This article belongs to the Section Tourism, Culture, and Heritage)

Abstract

:
Hindu Kush Himalaya is home to many cultural and religious sites. The literature on the valuation of cultural sites in the mountain terrains is thin. Hence, their development and sustainability are often ignored. Using primary survey data from three different sites in the Kailash Sacred Landscape of India and Nepal, the cultural value of religious sites to the visitors and households living in the surrounding areas was estimated using a modified travel cost method. As visitors travel by foot and offer donations at the religious sites, the estimations account for these aspects in travel cost calculations. For the sample sites, the per year average use value of cultural services was estimated to be USD 2.9 million. Excluding the use value to the outside visitors, the annual estimated use value of cultural services to the approximately 200,000 households of the entire KSL area, which covers 31,252 km2, is over USD 22.6 million, which is over 7% and 15% of the per capita income of Indian and Nepali households, respectively, indicating the importance of the natural-cultural environments in rural livelihoods. The estimated values will help planners manage these cultural sites sustainably for improving the livelihoods of the people living in the area.

1. Introduction

The Hindu Kush-Himalayan (HKH) region extends over 3500 km from Afghanistan in the west to Myanmar in the east, covering all or part of Afghanistan, Bangladesh, Bhutan, China, India, Myanmar, Nepal and Pakistan. This region is home to 210 million people, with fragile and complex mountain systems due to active tectonic plate activity, and highly diverse in terms of culture, hydrology, ecology and climate [1]. The mountains in the HKH region are the water towers of the world for supplying water to over 1.3 billion people downstream [2]. However, resources in the HKH region are under pressure from changing climate and socioeconomic conditions, increasing the risks of extreme events such as floods, landslides and droughts [3].
The mountains in the region have been considered as sacred places of spiritual power and realization by many religions including Hinduism, Buddhism, Jainism, Sikhism, and the indigenous Bon tradition [4]. Mt Kailash (6714 m) and its surrounding area is a holy cultural site in the HKH that lies in the trijunction of China, India and Nepal. This holy mountain and surrounding wetlands such as Lake Mansarovar are worshipped by devotees of different religions such as Hindu, Buddhist, Bon and Jain, who travel to the site from across the globe but especially from China, India and Nepal. Given the importance that people have been attributing to HKH, in 2010, the Kailash Sacred Landscape (KSL) was delineated by the partnering institutions from three neighboring countries with facilitation from the International Center for Integrated Mountain Development (ICIMOD). The aim of delineating the KSL was to conserve and sustain its ecosystem services and to promote the landscape as a trans-boundary cultural and natural heritage site for the purpose of improving the livelihood of the people living in the area while keeping the site in its sustainable state [5].
Although the mainstreaming of the ecosystem services concept into landscape management is desirable, it is challenging due to difficulties in identification of appropriate services, their quantification, valuation, and trade-offs [6]. Among four types of ecosystem services (provisioning, regulating, supporting, and cultural) that have been identified by the Millennium Ecosystem Assessment [7], cultural ecosystem services are considered different from the other three services. These services are created through interactions between humans and ecosystems rather than as priority products of nature that people utilize to enhance their well-being [8]. They are combined with built, human and social capital to produce recreation, scientific and cultural identity, or other cultural benefits [9]. Therefore, considering their distinct nature, understanding the value of cultural ecosystem services could help manage such sites sustainably for addressing real world problems [10].
In brief, cultural values are frequently underestimated in the valuation of ecosystem services literature [11]. In addition, the literature on the valuation of cultural ecosystem services are disproportionately located in urban areas. This may be due to cultural ecosystem services in urban contexts being relatively visible and directly experienced (e.g., urban parks), making it easier to estimate the value (mostly recreational) and incorporating it into environmental management and planning decisions for sustainable use of the resources [12]. On the contrary, mountain landscapes are challenging while cultural ecosystem services are both intangible [13] and difficult to measure; they are therefore rarely included in their public discourses by the research community [14,15].
The existing literature on the valuation of cultural services is largely limited to tourism or recreational benefits [16]. However, there are other important cultural ecosystem benefits such as identities (belonging, spirituality, rootedness, and sense of place) that are rarely studied. The main research question that this study examined is: What is the value of cultural services that visitors and households derive from the cultural sites located in the Kailash Sacred Landscape? While answering this question, this study used cultural and religious services interchangeably, and intended to understand and estimate the use value of the cultural services that the domestic visitors, pilgrims and local residents receive from the KSL, a difficult mountainous terrain with sparse to no human settlement in a larger portion of the landscape. There are numerous cultural and religious sites within the KSL area and thousands of domestic visitors visit these sites each year for cultural, religious and spiritual fulfilment despite difficulties in travel due to cold weather, lack of night-stay facilities, and difficult trails.
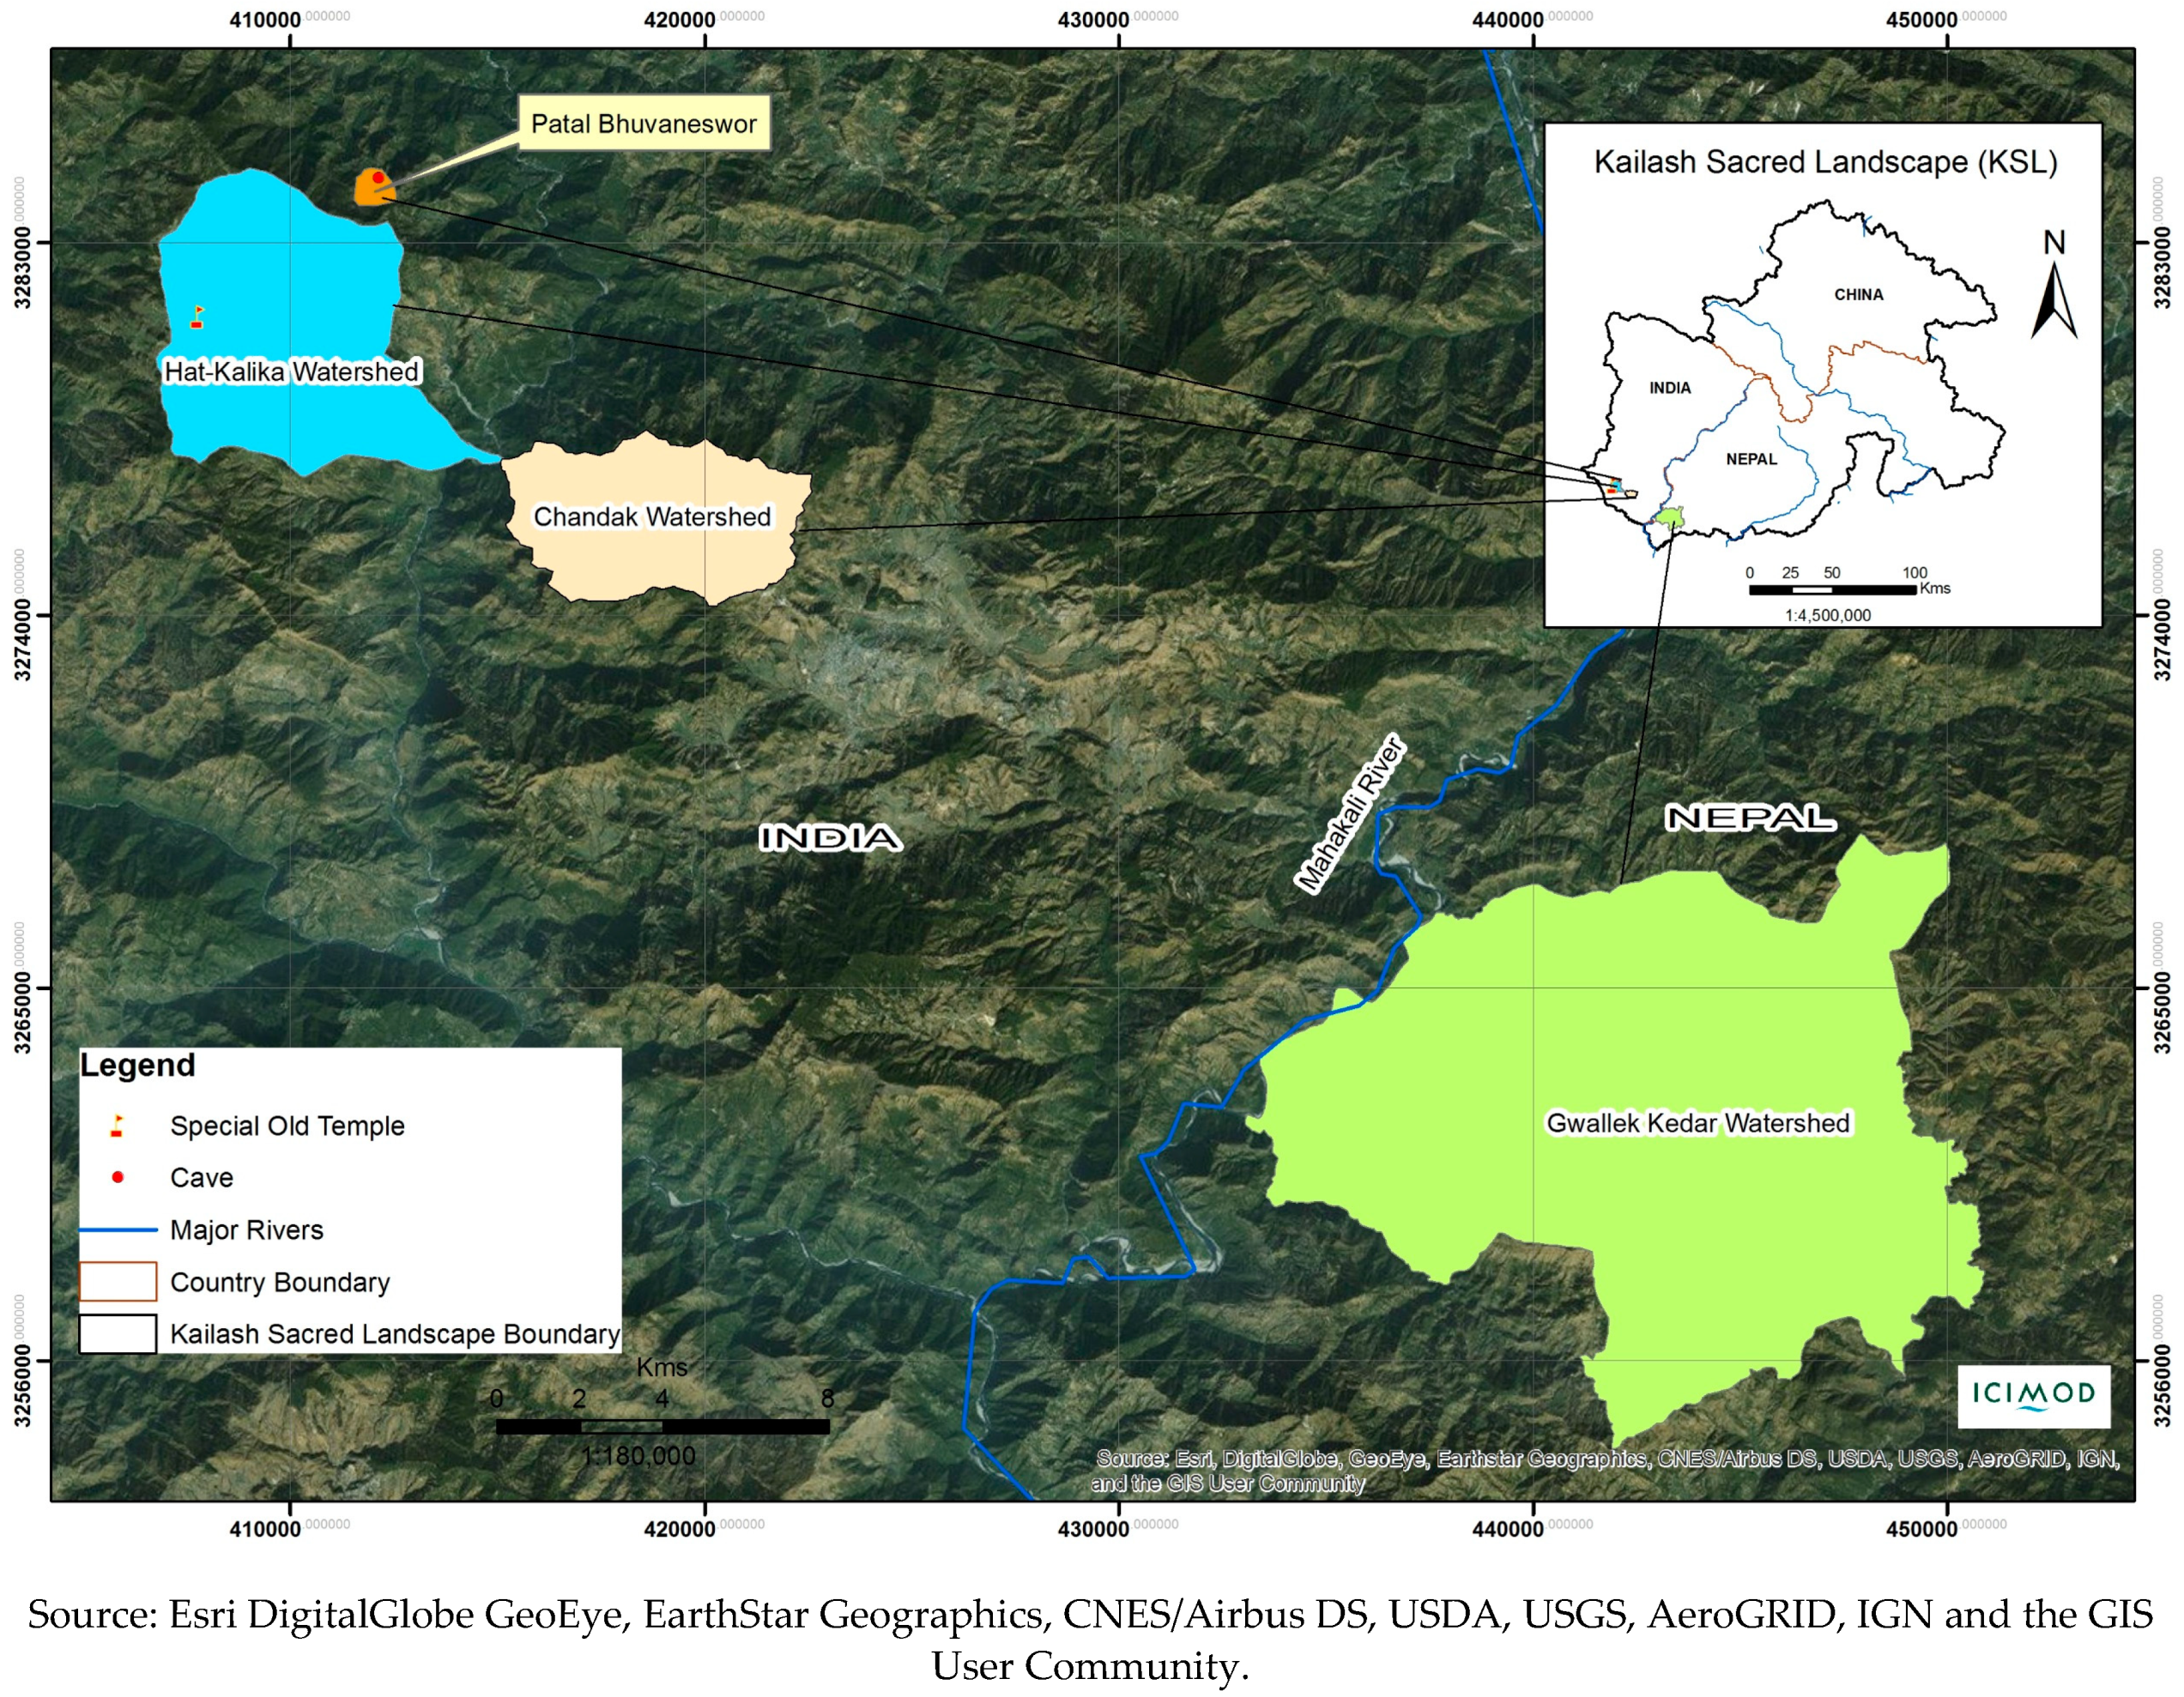
This study examined the use (monetary) value of cultural services from three such sites in two countries (India and Nepal). The sites are Patal Bhuvaneshwar cave temple and Hat-Kalika temple in Uttarakhand, India, and Gwallek Kedar in Baitadi, Nepal. The research design entailed intercepting domestic visitors to the Patal Bhubaneswar cave temple and surveying the local residents of the watersheds (see description of study area and Figure 1 for details), who often visit Hat-Kalika and Gwallek Kedar temples for religious, spiritual and cultural purposes, to collect the necessary data for the estimation of the empirical models. The visitation rates and welfare gain of visitors and local residents were estimated using the behavioral economics model and the travel cost method [17].
Given that about 7900 visitors enter Patal Bhuvaneshwar cave temple each year paying a nominal entry fee, the total welfare gain for these visitors is approximately INR 108.4 million (or NPR 173.4 million/USD 1.7 million) per year. (NPR refers to the Nepali currency and INR refers to the Indian currency. The exchange rate was 1 US$ = NPR 104 = INR 65 as per the April 2016 rate.) For the three watersheds, the annual estimated use value of the religious sites is NPR 126.7 million (or INR 79.2 million/USD 1.22 million). Therefore, the combined average annual estimated cultural value of the three sample sites is NPR 300 million (or INR 187.6 million/USD 2.9 million).
The estimated use value of the religious sites to the local residents is close to NPR 2.35 billion (or INR 1.47 billion/USD 22.6 million) per year. These estimates for the value of the cultural services of the KSL area reported in this paper are the lower-bound as the method used in this study considers only the use value (i.e., consumer surplus) of these services to the local households and does not capture the producer surplus of hotels, retailers of locally produced goods and other service providers.
Nonetheless, this research fills an important gap in the valuation of cultural services, especially religious services, since much of the extant literature on the valuation of cultural services disproportionately focuses on the recreational services provided by nature [19,20,21,22]. In contrast, few studies have focused on cultural services with studies on religious values almost non-existent [23,24]. However, understanding and capturing the religious values of the landscape are important in the context of the Himalayas, where communities living in the region place great value on the religious sites and the natural landscapes. However, the quality of these sites is deteriorating due to lack of planned management while these sites are threatened by mass commercial tourism that is pervading the mountain landscapes [25,26].
In the absence of an accurate assessment of the cultural and religious values of the mountain ecosystem services, decision-making relating to landscape management in the Himalayas may not only be incomplete but also lead to conflict, leading to unsustainable use of resources. However, estimating the economic value of spiritual and religious services is not straightforward as these services are mostly subjective and intangible [27]. This has meant a dearth of literature on the valuation of spiritual and religious services [14]. This study attempted to fill this gap. Although the travel cost method captures only the use value of the cultural or religious services of the ecosystem, the use value of the cultural services of the ecosystem reported in this study provides much-needed information on the value that local residents and visitors place on religious sites. Such values would be of use to policy makers in landscape management and decision-making to ensure their sustainable use. Furthermore, fresh avenues of economic incentivization for conserving such services can be opened up by such assessment of values that in turn would result in socioeconomic and environmental stability (e.g., ecotourism can be incentivized based on the local community’s performance on sustainability parameters). The study also provides the basis for future research on the valuation of religious/cultural services of other landscapes.

2. Materials and Methods

2.1. Study Sites

This study focused on three sites, carrying particular cultural importance of the KSL. The selection of the study site (see Figure 1) was mainly driven by the pilot sites selected by ICIMOD’s country partners under the Kailash Sacred Landscape Initiative. Besides their cultural importance, the sites are also well known for their beautiful landscapes with patches of forests and the spectacular views they offer of the broader ranges of the Himalayas, including the Nanda Devi, Panchachuli, Api, Nampa and Saipal Mountains.

2.1.1. Patal Bhuvaneshwar

Patal Bhuvaneshwar is a mystical cave temple in Uttarakhand, India. The cave is 160 m long and 27 m deep. The available evidence suggests that the first historically documented pilgrimages to the site began in the 12th century when Aadi Shankaraacharya, a theologian and philosopher, discovered the cave in 1191 AD. The cave remains sacred for both local residents and outside visitors alike and is one of the most visited religious destinations in the KSL area, which now charges a modest entrance fee of INR 20/person/visit.

2.1.2. Hat-Kalika Temple

Hat-Kalika is a temple (Shakti Peeth of Goddess Kali) located approximately 1 km from the town of Gangolihat, about 77 km away from the district headquarters of Pithoragarh in Uttarakhand, India. According to the Uttarakhand Tourism Development Board, this temple was chosen by Adi Sankaracharya for the installation of the Mahakali Shaktipeeth during his visit to the site in the 12th century, which has made it one of the most revered places for Hindus over many centuries. This place is popular among both people from the neighboring villages as well as visitors from outside.

2.1.3. Gwallek Kedar

Gwallek Kedar is a sacred Hindu temple on the top of the Gwallek religious forest that covers an area of more than 5700 hectare in Baitadi, one of the districts falling within the KSL area in Nepal [18]. It is 20 km from the Baitadi district headquarters. The forest area is surrounded by 23 villages, with a total population of 28,400 and 5393 households [28]. The entire forest area is devoted to Lord Shiva and the temple on the hilltop is called Kedar Dham, which is considered a sacred place for worshipping Lord Shiva. The sacred site is visited by a large number of people from the surrounding areas as well as from other parts of Nepal and India on various occasions. The place is also rich in biodiversity and is the main source of the water supply for all the villages in the watershed as well as for the district headquarters [29].

2.2. Methodology

2.2.1. Basic Theory

The individual travel cost method [17,30,31,32,33,34] was used to estimate the trip generating function and consumer surplus, which is an economic measure of welfare, for travelers who travel to the study sites. The Travel Cost Method (TCM) has been used extensively for valuation of recreational sites as well as for valuation of the use value of cultural heritage sites [35,23]. The main idea behind this method is that the expenditure of visitors to the site is the demand price of the service provided by the site or the value visitors place on the site. In other words, the expenditure incurred by a visitor during the journey to any one of these sites is equal to the use value of the spiritual and religious sites for the visitor. It is hypothesized that the higher is the cost to visit these sites, the lower is the visitation rates. This study estimated a trip generating function for estimating the use value of the spiritual and religious services generated by these sites.
It is assumed that an individual derives utility from consuming a bundle of goods and services (X) and visiting a cultural site with a given quality (q). The individual spends the total available time for work (t1) traveling to the site (t2) and for spending time at the destination site (t3) and earns non-labor (Y1) and labor income (w.t1). The estimation formalizes a representative consumer’s problem as:
M a x   U ( X , r , q )
Subject to:
Y 1 + w . t 1 = X + c . r
and
t = t 1 + r ( t 2 + t 3 )
where r is the number of trips to a given site within a certain period, and c is the cost of round-trip travel to the cultural site that accounts for the cost of transportation, food and lodging, including the amount the visitor offers to the god and the priest as bheti, and w is the wage rate. Without loss of generality, the price of composite goods (X) was normalized to 1. Here, Equations (2) and (3) are the income and time constraints, respectively. Substituting t 1 from Equation (3) into Equation (2) obtains the joint constraint,
Y 1 + w . [ t r . ( t 2 + t 3 ) ] = X + c . r
The time spent in cultural activities (travel time plus time spent on the site) can be used in other activities. Therefore, the total cost of a trip (TC) is the sum of the travel cost, time costs and entrance fee. Maximizing Equation (1) subject to Equation (4) gives the trip generating function or the travel demand function for a religious site as:
t = r ( T C , M , q )
where M is the total income (both labor and non-labor) and TC is the total travel cost for a trip including the entrance fee and the time cost for the ith visitor. Since the travel demand function for a religious site depends on the cost of visiting a substitute site (if any) and the socio-economic and demographic characteristics of the visitor (i), the modified travel demand function to a religious site can be written as:
r i = r ( T C i , T C i s , M i , Z i ,   q )
where T C i s is the travel cost to the substitute site and Z i is a vector of the characteristics of the visitor i.

2.2.2. Econometric Issues

As the dependent variable in Equation (6) is a non-negative integer, it violates the major assumptions of the classical linear model. Hence, the use of the Ordinary Least Squared (OLS) estimator is inappropriate. For the non-negative integer, either the Poisson or Negative Binomial estimator can be used. The Poisson distribution assumes equality between the mean and the variance of number of trips (r) that the visitors make. If equality between the mean and the variance of the dependent variable does not hold, then the Negative Binomial estimator is more appropriate as this model allows over-dispersion [36,37]. For empirical purposes, both Poisson and Negative Binomial models were estimated but the results from the later model are reported, using the following log-linear demand function for religious or cultural travel:
E ( r i | T C , X ) = exp ( β 0 + β 1 T C i + β 2 T C i s + β 3 M i + β 4 Z i + β 5 q )
where X refers to all covariates except TC. The use value of cultural services is given by the consumer surplus, which is an area under the demand curve (Equation (7)) after subtracting the travel costs. For the log-linear demand function, it can be shown that the Consumer Surplus (CSi) is a measure of visitor i’s welfare gain per trip, which is given by the following expression [38,39]:
C S i = 1 β 1 ^
Since the main goal of this research is to estimate the cultural use value of the landscape, not simply the value of one particular site, visitors who were in multi-destination trips as well as single-destination visitors on day trips were included in the sample. Therefore, the travel demand function is estimated using the full sample of Patal Bhuvaneshwar visitors as well as the sub-sample of day visitors who come from surrounding areas to visit the site. For Hat-Kalika temple, households in the two watersheds in KSL-India (Hat-Kalika and Chandak-Aunla Ghat) were surveyed while, for Gwallek Kedar, households of the Gwallek watershed in KSL-Nepal were interviewed. Therefore, there are no outside visitors in the Hat-Kalika and Gwallek Kedar samples. The estimated value of these cultural sites is interpreted as the lower bound since TCM considers the use value of the cultural sites or landscape to the visitors. The estimated use value includes neither the value to the hotel owners and other service providers (producer surplus) nor the existence or non-use value of the cultural sites. The following equation was used to estimate the aggregate use value of the cultural services to the local households living in the KSL area:
A g g r e g a t e   C S = 1 β ^ 1 × # o f   H H s × a n n u a l   # o f   t r i p s × g r o u p   s i z e × %   o f   H H s   v i s i t i n g   l o c a l   c u l t u r a l   s i t e
In the analysis, Patal Bhuvaneshwar visitor data and household data were used separately since these two groups of respondents can be considered as two different sets of people—one group surveyed on site and the other group surveyed in their homes. The results are discussed in the following subsection.

2.2.3. Data Collection

The research team visited all the three watersheds including the identified cultural sites during September 2015, and held discussions with local communities to gather ground level information on the different aspects of these sites and the visitor characteristics. In total, eight focus-group discussions and 10 key informant interviews were conducted which included nearby hotel owners, government officials, researchers, villagers and NGO leaders. A draft questionnaire was developed based on these interviews and pre-tested in Patal Bhuvaneshwar and the nearby villages of Hat-Kalika and Gwallek watersheds. The piloting was done outside the actual study sites to keep the actual sample different from the pre-tested sample. Based on the visitors’ and villagers’ responses, the questionnaire was revised. Using the revised questionnaire, 200 visitors from the Patal Bhuvaneshwar cave temple, 600 households from both Hat-Kalika and Chandak-Aunla Ghat watersheds, and 350 households from the Gwallek watershed were surveyed between 10 March 2016 and 30 April 2016.
For Patal Bhuvaneshwar, the visitor intercept surveys were conducted for 12 days covering all seven days of two weeks, where visitors who were intercepted at the cave temple site were requested by the enumerators to participate in the survey, while selecting one visitor from each group as respondent. The questionnaire was divided into two broad sections. The first section was related to general information on the respondents while the second sought information related to the visit to the site and other locations, including information related to costs of traveling, accommodation costs, food and other expenses including bheti (donation) to the religious sites, travel time from their home to the site, site quality and purpose of the visit.
A systematic random sampling method was used in selecting the sample households, where the first household was selected randomly while the selection of the rest of the households was done at systematic intervals [40,41]. The intervals in these three watersheds were based on the number of households living in these watersheds and a pre-determined sample size. Information on the household’s socio-economic characteristics and whether the households had visited the Hat-Kalika or the Gwallek Kedar temple in the past five years was recorded in the survey questionnaire. If the respondent or other household member(s) had visited these local cultural sites in the past five years, information on how often as well as the different components of the travel-related costs for the most recent trip was recorded. Included in the travel-related costs were transportation costs, expenses on food, offerings to the temple as bheti, costs of performing the religious ceremony, if any, and the time-costs of the household member who visited the site. If more than one household member were in the group, the travel and time costs of only one member of the household were recorded. To estimate the time cost of the visit, the reported average daily earning/income of the person who travelled to the site and the time spent on the round-trip were used.

3. Results

3.1. Visitors’ Characteristics

Of the total respondents surveyed at the Patal Bhuvaneshwar, more than one third (35%) were female (Table 1). As indicated in Table 1, most of the visitors to the cave temple were educated urban residents. In addition, a majority of them (88%) were pilgrims or religious tourists who were traveling in groups with the average group size at more than six.
More than half of the respondents (58%) who visited Patal Bhuvaneshwar were residents of the Indian state of Uttarakhand followed by Uttar Pradesh (28%) and West Bengal (5%). The remaining respondents (8%) were from other parts of India. Of the respondents from Uttarakhand, 97% were day visitors. This is not surprising as a majority of the pilgrims were visitors from nearby towns and villages. Roughly 44% of the respondents in the sample said they stayed overnight at the site as they were multi-destination pilgrims from different parts of India.
For Patal Bhuvaneshwar, on average, the site had been visited by each visitor twice in the last five years (Table 1) with the number of trips made by respondents ranging from 1 to 8. Between 1.5 and 12 h had been spent by the day visitors with the average time spent being 4.3 h for the visit. Taxis were a popular mode of transportation (42%), followed by private cars (21%), public buses (16%), tourist buses (14%), and motorcycles (7%).
About 24% of the sampled households from the Chandak-Aunla Ghat watershed had visited the Hat-Kalika temple within the past 5 years. However, this figure was over 75% for the sample households from the Hat-Kalika watershed due to proximity where, on average, the Hat-Kalika temple had been visited by household members more than 15 times in the past five years with their expenditure at the site at less than INR 300 per person for the most recent trip (Table 2). A majority of the respondents (at 70%) were women who had a lower education level with the monthly income of the majority of the respondents’ households at less than INR 50,000. In the sample, about 40% of respondents were Dalit, who are at the bottom of the Hindu caste system and considered untouchable and therefore socially barred from entering the houses of higher caste people as well as temples and holy places.
For Gwallek Kedar, out of 350 sample households, about 40% of households reported that a household member(s) had visited the Gwallek Kedar at least once in the past five years. On average, those who visited made 21 trips in the past five years, incurring an average individual travel cost of NPR 354. About 17% of the households belong to the lower caste Dalit community, who are at the bottom of the Hindu caste system and often barred from entering holy places, such as Gwallek Kedar. The average family size in the sample comprised seven members while less than 30% of the respondents had more than six years of education.
It is to be noted that, unlike visitors to Patal Bhuvaneshwar, where the site was visited mostly for recreational purposes, these cultural sites were visited by local residents solely for religious purposes. Women make up a significant fraction of these visitors to the local cultural sites. On average, the site was visited by approximately three household members per group with women comprising 50% of the group. The local people did not stay overnight at these cultural sites, the reason for this being that either they were from nearby areas or the absence of facilities for overnight stay. In the sample, it was indicated by about 16% of the respondents who had already visited at least one of the two named religious sites on previous occasions that they would stay overnight provided there were night-stay facilities at the sites. Villagers traveling to the sites mostly traveled on foot (53%) or used public transport (46%).
In the sample, Mt. Kailash, the ultimate destination for religious visitors in the KSL area, had been visited by only four respondents (out of 950) in the past five years. An additional 13 respondents indicated that they would visit Mt. Kailash in the coming years. The limited interest in taking part in the journey to Mt. Kailash was due mainly to the high travel and time costs (see discussion section for further details).

3.2. Patal Bhuvaneshwar: Full Sample

The dependent variable, which is the number of trips that the visitors to Patal Bhuvaneshwar had made in the past five years, is a non-negative integer. Therefore, the count data modeling technique was used for estimating the trip generating function (Equation (7)). As the visitors were surveyed on site, problems of truncation (at least each visitor has one visit) and endogenous stratification (i.e., the surveying of frequent visitors, thus leaving out the general population who had not visited the site during the survey period but could have visited the site at some other time) were encountered in the study. To address the issues of endogenous stratification and truncation, truncated negative binomial regression models were estimated (Table 3).
The first set of results of the three different models that account for endogenous stratification and truncation is presented in Table 3. The first model (M1) is the basic model with travel cost as the main variable of concern, with costs to visit an alternative site and visitors’ characteristics as the covariates. In the second model (M2), the visitor’s education and occupation as preference shifters are added, while, in the last model (M3), site quality is added to examine the robustness of the findings. Since all three models give comparable results in terms of the sign and size of the estimated coefficients of the Travel Cost, the results of M2 are discussed since the coefficients of site quality indicators in M3 are not statistically significant.
As shown in the table, the coefficient of the Travel Cost is negative and significant, suggesting that, after controlling for visitor and site characteristics and costs to visit the alternate site, on average, the site is visited less frequently by visitors if the travel cost is high. However, the coefficient of the Travel Cost to the alternative site is not statistically significant. This indicates that the Patal Bhuvaneshwar cave temple has no close substitute for those visitors whose primary reason for visiting the site is cultural. The perceived site quality or the purpose of the visit (recreation vs. religious) does not seem to affect the number of trips that the visitors make. The results of this study also suggest that educated visitors visit the site more often than less educated visitors. However, the site appears to be less frequently visited by wealthier and urban visitors. This result is counterintuitive at first glance when the results are compared with those of similar studies on recreational travel to particular sites. As most studies that report travel cost results show, more trips are made when visitors are wealthier [42,43]. In this case, it is just the opposite as there was the predominance of less wealthy visitors. This may be because the primary reason for visiting the site, among the sampled visitors, is religious rather than recreational, where household wealth may not play as big a role.

3.2.1. Patal Bhuvaneshwar: Day Visitors

Since both day visitors, who only visit the Patal Bhuvaneshwar cave temple, and those who visit multiple sites before coming to Patal Bhuvaneshwar are included in the sample, another set of models was estimated using the sub-sample of day visitors only to segregate the value that single site visitors attribute to the landscape compared to those who visit multiple sites (Table 4).
In both cases, the results are similar to those presented in Table 3. Hence, when the travel cost increases, the site is visited less frequently by visitors, which evidences the internal consistency of the results. The results from the two models (M1 and M2) are reported in Table 4 as Model M3 does not converge when site quality is added in M2. As the site quality is not significant in any of the previous models, the main results are not affected by dropping M3 from Table 4.

3.2.2. Chandak-Aunla Ghat and Hat-Kalika

The results for the sample of households who visited the local Hat-Kalika Temple at least once in the past five years are reported in Table 5. Unlike in the case of the sampled visitors from the Patal Bhuvaneshwar cave temple who were surveyed on site, the problem of endogenous stratification was not encountered in the case of the sampled households in the present instance as the survey was not conducted on site. Since the sample of villagers were more homogenous and were all living in a rural area mostly engaged in subsistence agriculture, a set of covariates was used, such as travel cost, cost to alternative site, and household income as well as a few variables as preference shifters such as the respondent’s gender, age, education, ethnicity, and household size, for estimating the travel cost models. The results are mostly consistent with the ones presented in Table 3 and Table 4, suggesting that the results are internally consistent. As before, the coefficient of income is negative as in the case of Patal Bhuvaneshwar though not significant.

3.3. Gwallek Kedar

On the Nepal side of the KSL, out of 350 households in the sample, 139 households reported that some of the household members had visited Gwallek Kedar at least once in the past five years. The model used in the case of the Chandak-Aunla Ghat and Hat-Kalika sample was used in this case as well. The results from zero truncated Poisson estimates are reported in Table 6.
As indicated in the results, visitation rate of the households to the local religious site declines with the travel cost. The coefficient of the Alternative Site TC is positive and significant, indicating that Gwallek Kedar is visited more frequently if the cost to the alternative site is higher, suggesting that there are alternative sites to Gwallek Kedar. For this sub-sample, the coefficient of household income is positive and significant, which is the opposite of the results for Patal Bhuvaneshwar, suggesting that the effect of income on religious travel is not conclusive in this sample.

3.4. Pooled Sample

Finally, the Chandak-Aunla Ghat and Hat-Kalika sample with the Gwallek sample were pooled and estimated using the same models reported in Table 5 and Table 6. The pooled sample include 443 observations after dropping observations with incomplete responses and missing values. The results of the zero truncated negative binomial models from the pooled sample are reported in Table 7. Results from the pooled sample are consistent with the ones reported in earlier tables indicating that the results reported in the different tables are robust and reliable.

3.5. Cultural/Religious Value of the Landscape

3.5.1. Per Visitor per Year Value

Using the estimated coefficients of the travel cost models, the welfare gain by the visitors and households who had visited the religious sites (Patal Bhuvaneshwar cave Temple, Hat-Kalika Temple, and Gwallek Kedar) at least once in the past five years was estimated. The average consumer surplus per visit per person, a measure of social welfare or the use value of cultural services that the Kailash Sacred Landscape provides to visitors’ households living in the three watersheds within the KSL area, is reported in Table 8. As indicated by the results, the per visit per capita average value of the cultural services to the Patal Bhuvaneshwar visitors ranges between NPR 21,947 and 23,774 (or between INR 13,717 and 14,859), which is roughly USD 210–230. For the day visitors, the per visit per capita average value of the cultural services is between NPR 6723 and 7110 (or INR 4202–4444/USD 65–68).
For households living in the Chandak-Aunla Ghat and Hat-Kalika watersheds visiting the religious site Hat-Kalika Temple at least once in the past five years, the average per visit per capita use value of the cultural services is NPR 1784–1880 (or INR 1115–1175/USD 17–18). For the households living in the Gwallek watershed, the use value of cultural services ranges NPR 3300–3413 (or INR 2063–2133/USD 32–33). For the pooled sample of all three watersheds, the average cultural value of the sampled landscape is NPR 1980–2027 (or INR 1225–1357/USD 19–21) per person per visit.

3.5.2. Annual Use Value of Cultural Services to the KSL Residents

To estimate the aggregate use value of cultural services that were derived by visitors and households from the KSL area, information on the number of visitors to the Patal Bhuvaneshwar site for the past five years was obtained by the study team. As there is an entry fee of INR 20 per visitor, a record exists of the visitors who entered the cave temple premises paying the entrance fee. However, no such official record is available for local people from the surrounding villages who also travel to the site frequently, although an entrance fee is not paid by them to enter the temple premises. According to records, in the past five years, the cave temple had been visited by roughly 39,380 visitors who had paid an entrance fee, with an annual average of 7900 visitors. In conversation, a rough estimate of around 12,000 visitors per each year was however given by the local priests, which includes the local visitors who do not enter the cave temple. Using a per visitor per year welfare gain of NPR 22,400 (or INR 14,000/USD 215), and an official estimate of 7900 visitors each year, the estimated annual use value of cultural services to the visitors coming to the Patal Buhwaneshwar cave is NPR 180 million (or INR 112 million/USD 1.7 million). Depending on the figure used to denote the number of visitors, this amount will change.
In the three watersheds, Hat-Kalika, Chandak-Aunla Ghat and Gwallek, there are 1750, 1774 and 5393 households, respectively. One of these three sites was visited at least once in the past five years from these watersheds, by roughly 77%, 25% and 40% of the sample households, respectively. The average number of visits by the residents is 15 to the Hat-Kalika temple and 22 to the Gwallek Kedar site in the past five years. On average, the sites were visited by about three people per household, of which about 50% were females. Therefore, the average annual estimated use value of cultural services to the local households from the Hat-Kalika and Gwallek Kedar sites is NPR 38.4 million (or INR 24 million/USD 368,770) and NPR 88.3 million (or INR 55.2 million/USD 850,000), respectively. The combined annual use value of cultural services from these three sites to the households is NPR 305.92 million (or INR 191.2 million/USD 2.9 million).

4. Discussion

This study examined the cultural value of religious sites in the KSL area using travel cost method. Travel cost usually has a negative relationship with the frequency of travel [44]. It has been shown in research that the value of similar cultural services varies between different locations depending on accessibility and the degree of human interaction with the locations [45]. Similar findings were obtained in this study. For instance, Patal Bhuvaneshwar Cave, which is accessible to distant visitors, was visited by a majority for recreational purposes. However, visits to the local cultural sites that were undertaken by local pilgrims were solely for religious purposes. The accessibility of religious sites is also determined by the socio-cultural system. For instance, in this study, religious sites are less frequently visited by Dalits (the lowest caste in the Hindu hierarchy) compared to other castes. This is because, in Hinduism, social norms are determined by the nexus between religion and the caste system, which influences in turn accessibility to a given site [46].
About 1.1 million people live in the KSL area [47]. With an average family size of 5.5, this translates into over 200,000 households in the KSL area. Assuming that the local cultural sites in the KSL area are visited by three members of each household from 50% of the households four times annually (the sample average of these three watersheds), on average, the estimated use value of the annual cultural services provided by the KSL landscape to the local residents is USD 22.6 million. This value translates into 7% and 15% of the per capita household income of the Indian and Nepali households, respectively [48,49]. The value to visitors from elsewhere who visit the different sites of the KSL area are not included in this estimate due to lack of data on the number of travelers to these sites except for Patal Bhuvaneshwar. This estimate also depends on the number of visits that households make to the local sites since not all households make a similar number of trips every year. These results, based on the sample information from three watersheds, thus consider the heterogeneity of the households, not simply in terms of socio-economic characteristics but also in terms of proximity to the site under consideration since households from the surrounding villages as well as from neighboring villages (e.g., visitors to the Hat-Kalika temple from the Chandak-Aunla Ghat watershed) are included in the study sample giving a basis for generalization of the results to the entire KSL area.
Furthermore, as evident in this research, Mansarovar/Kailash had been visited by only 0.42% (4 out of 950) respondents, although an additional 1.4% (13 respondents) said that they plan on visiting the sites in the coming years. This low number of pilgrims was mainly attributable to the time and money required to complete the Kailash journey. Around 16 days in terms of time and USD 1140 per trip in terms of finances were needed to visit the sites which was almost equal or more than the average annual per capita income of households in the study sites. In 2016, the per capita income of India and Nepal was USD 1703 and USD 766, respectively [48,49]. Moreover, the Mansarovar/Kailash journey is organized by certified travel agents and requires obtaining a passport (which most of these villagers do not have) from the national government as well as visas from the Chinese government, all of which incur a further high expenditure in addition to the more than two weeks of travel time that the journey demands.
The estimated value of the cultural services provided by the religious sites of KSL clearly signifies the importance of the landscape in the daily lives of KSL residents. The values reported in this study should thus be noted by policy makers and landscape managers and religious sites should be included in landscape management to ensure their sustainability as well as development so that local people would benefit from such programs and policies in the long run [10]. The results reported in the study would also contribute to justifying the enlistment of KSL as a UNESCO World Heritage Site.

5. Conclusions

The literature on the valuation of the cultural services of the surrounding ecosystems of religious sites and landscapes is very thin [23]. This study provides lower bound estimates of use value of cultural services that the religious sites provide to the visitors and the local residents in the KSL area. This study shows that cultural services have high value to both local residents and the visitors in the study area. Therefore, the inclusion of cultural services in assessing the value of landscapes must find attention in planning and making conservations policies for sustainability of the cultural landscapes. Understanding the value that these sites provide to visitors and residents would make it possible for local communities to be included in the sustainable management of these sites. In this regard, more research is needed to profile the value of cultural services provided by landscapes to visitors and residents.
This study is unique in that it tries to value the utility derived from religious sentiments in consumer surplus calculations as it includes voluntary religious donations to the temples and expenditure on ceremonies that the visitors performs in those temples as a part of the travel cost. Religious tourism is a significant component of the travel and tourism sector in South Asia, especially in the Indian subcontinent. Hence, as evident from this study, the conservation, maintenance and sustainable use of such religious sites can contribute significantly to the local economy. This study also provides a methodological innovation to value the cultural/religious services of important sites by modifying the traditional travel cost method.
Finally, an attempt was also made in the study to understand the contribution of visitors to the local economy for the purpose of ensuring sustainable livelihoods. In the sample, only 17% of the visitors purchased local products from the sites while none of the visitors stayed overnight at these sites, indicating that the contribution to the local economy from such visits was minimal. This may be attributable to the lack of local products for sale at these sites and the non-availability of over-night stay facilities around the cultural sites. However, it was indicated by the sampled respondents that they were willing to stay overnight incurring an expenditure of NPR 88 (excluding the food cost) if overnight-stay facilities were available. Although this rate may seem very low compared to the per night cost at local hotels for travelers who travelled to the Patal Bhuvaneshwar cave temple from outside, it is comparable with what a home-stay tourist would pay per night (NPR 100 per person) for staying in some of the popular trekking routes in rural Nepal. This information suggests that making home-stay facilities available around these sites would help improve the local economy, a byproduct of cultural tourism in the KSL area. Further, scope for marketing local handicrafts/value-added items may also be expanded by such arrangements, which would generate employment to local artisans for sustainable livelihoods.

Author Contributions

Conceptualization, M.N., R.K.R., S.D. and L.D.B.; Data curation, M.S.K.; Formal analysis, M.N.; Funding acquisition, M.N., S.D., L.D.B. and R.K.; Investigation, M.N. and R.K.R.; Methodology, M.N.; Project administration, R.K., M.S.K. and R.S.R.; Resources, L.D.B. and R.K.; Software, M.S.K.; Supervision, M.N.; Writing—original draft, R.K.R.; and Writing—review and editing, M.N., S.D., L.D.B., R.K., R.S.R. and G.C.S.N.

Funding

This study was funded by the International Center for Integrated Mountain Development (ICIMOD) under the Kailash Sacred Landscape Conservation and Development Initiative (KSLCDI). KSLCDI is a joint effort to promote transboundary cooperation on landscape conservation among China, India and Nepal through the respective governments and partners and is supported by the German Ministry for Economic Cooperation and Development (BMZ) and DFID/UKAid as well as core funds of ICIMOD contributed by the governments of Afghanistan, Australia, Austria, Bangladesh, Bhutan, China, India, Myanmar, Nepal, Norway, Pakistan, Switzerland, and the United Kingdom.

Acknowledgments

We thank the donors who supported KSLCDI. We received comments and suggestions from several individuals. Fieldwork was supported by several individuals including Kamal Aryal, Ishwari Paudel, Krishna Thagunna, and Yadav Uprety, as well as several enumerators and field supervisors. E. Somanathan provided valuable comments at different stages of the research. Comments from the four anonymous referees helped to improve the quality of the paper. However, the views expressed in this publication are those of the authors and should not be attributed to the affiliated or funding organizations.

Conflicts of Interest

The authors declare no conflict of interest. The funders had no role in the design of the study; in the collection, analyses, or interpretation of data; in the writing of the manuscript, and in the decision to publish the results.

References

  1. Bajracharya, S.R.; Shrestha, B.R. The Status of Glaciers in the Hindu Kush-Himalayan Region; International Centre for Integrated Mountain Development (ICIMOD): Kathmandu, Nepal, 2011. [Google Scholar]
  2. Eriksson, M.; Xu, J.; Shrestha, A.B.; Vaidya, R.A.; Santosh, N.; Sandström, K. The Changing Himalayas: Impact of Climate Change on Water Resources and Livelihoods in the Greater Himalayas; International Centre for Integrated Mountain Development (ICIMOD): Kathmandu, Nepal, 2009. [Google Scholar]
  3. Mukherji, A.; Molden, D.; Nepal, S.; Rasul, G.; Wagnon, P. Himalayan waters at the crossroads: Issues and challenges. Int. J. Water Resour. Dev. 2015, 31, 151–160. [Google Scholar] [CrossRef] [Green Version]
  4. Bernbaum, E. Sacred mountains: Themes and teachings. Mt. Res. Dev. 2006, 26, 304–309. [Google Scholar] [CrossRef]
  5. Pandey, A.; Kotru, R.; Pradhan, N. A Framework for the Assessment of Cultural Ecosystem Services of Sacred Natural Sites in the Hindu Kush Himalayas. 2016. Available online: http://lib.icimod.org/record/32317 (accessed on 8 October 2018).
  6. De Groot, R.S.; Alkemade, R.; Braat, L.; Hein, L.; Willemen, L. Challenges in integrating the concept of ecosystem services and values in landscape planning, management and decision making. Ecol. Complex. 2010, 7, 260–272. [Google Scholar] [CrossRef]
  7. Millennium Ecosystem Assessment Millennium Ecosystem Assessment Synthesis Report; Island Press: Washington, DC, USA, 2005.
  8. Fish, R.; Church, A.; Winter, M. Conceptualising cultural ecosystem services: A novel framework for research and critical engagement. Ecosyst. Serv. 2016, 21, 208–217. [Google Scholar] [CrossRef]
  9. De Groot, R.; Brander, L.; Van Der Ploeg, S.; Costanza, R.; Bernard, F.; Braat, L.; Christie, M.; Crossman, N.; Ghermandi, A.; Hein, L. Global estimates of the value of ecosystems and their services in monetary units. Ecosyst. Serv. 2012, 1, 50–61. [Google Scholar] [CrossRef] [Green Version]
  10. Milcu, A.I.; Hanspach, J.; Abson, D.; Fischer, J. Cultural ecosystem services: A literature review and prospects for future research. Ecol. Soc. 2013, 18. Available online: https://www.jstor.org/stable/26269377 (accessed on 8 October 2018). [CrossRef]
  11. Kenter, J.O. Shared, plural and cultural values. Ecosyst. Serv. 2016, 21, 175–183. [Google Scholar] [CrossRef]
  12. Barthel, S.; Colding, J.; Elmqvist, T.; Folke, C. History and local management of a biodiversity-rich, urban cultural landscape. Ecol. Soc. 2005, 10, 1–27. [Google Scholar] [CrossRef]
  13. Haines-Young, R.; Potschin, M. Common International Classification of Ecosystem Services; Nottingham, UK, 2012. Available online: https://cices.eu/content/uploads/sites/8/2018/01/Guidance-V51-01012018.pdf (accessed on 8 October 2018).
  14. Daniel, T.; Muhar, A.; Arnberger, A. Contributions of cultural services to the ecosystem services agenda. Proc. Natl. Acad. Sci. USA 2012, 8812–8819. [Google Scholar] [CrossRef] [PubMed]
  15. Van Berkel, D.; Verburg, P. Spatial quantification and valuation of cultural ecosystem services in an agricultural landscape. Ecol. Indic. 2014, 37, 163–174. [Google Scholar] [CrossRef]
  16. Hernández-Morcillo, M.; Plieninger, T.; Bieling, C. An empirical review of cultural ecosystem service indicators. Ecol. Indic. 2013, 29, 434–444. [Google Scholar] [CrossRef]
  17. Parsons, G.; Wilson, A. Incidental and joint consumption in recreation demand. Resour. Econ. Rev. 1997, 26, 1–6. [Google Scholar] [CrossRef]
  18. Nepal, M.; Das, S.; Rai, R.K.; Bhatta, L.D.; Somanathan, E.; Kotru, R.; Khadayat, M.S.; Rawal, R.S.; Negi, G.C. Valuation of Ecosystem Services in the Kailash Sacred Landscape; ICIMOD Research Report 2017/2. Kathmandu, 2017. Available online: http://lib.icimod.org/record/33726 (accessed on 8 October 2018).
  19. Caulkins, P.; Bishop, R. The travel cost model for lake recreation: A comparison of two methods for incorporating site quality and substitution effects. Am. J. 1986, 68, 291–297. [Google Scholar] [CrossRef]
  20. Willis, K.; Garrod, G. An individual travel-cost method of evaluating forest recreation. J. Agric. Econ. 1991, 42, 33–42. [Google Scholar] [CrossRef]
  21. Weiqi, C.; Huasheng, H.; Yan, L.; Zhang, L. Recreation demand and economic value: An application of travel cost method for Xiamen Island. China Econ. Rev. 2004, 15, 398–406. [Google Scholar]
  22. Fleming, C.; Cook, A. The recreational value of Lake McKenzie, Fraser Island: An application of the travel cost method. Tour. Manag. 2008, 29, 1197–1205. [Google Scholar] [CrossRef] [Green Version]
  23. Alberini, A.; Longo, A. Combining the travel cost and contingent behavior methods to value cultural heritage sites: Evidence from Armenia. J. Cult. Econ. 2006, 30, 287–304. [Google Scholar] [CrossRef]
  24. Tuan, T.; Navrud, S. Valuing cultural heritage in developing countries: Comparing and pooling contingent valuation and choice modelling estimates. Environ. Resour. Econ. 2007, 38, 51–69. [Google Scholar] [CrossRef]
  25. Salerno, F.; Viviano, G.; Thakuri, S.; Flury, B.; Maskey, R.K.; Khanal, S.N.; Bhuju, D.; Carrer, M.; Bhochhibhoya, S.; Melis, M.T. Energy, forest, and indoor air pollution models for Sagarmatha National Park and Buffer Zone, Nepal: Implementation of a participatory modeling framework. Mt. Res. Dev. 2010, 30, 113–126. [Google Scholar] [CrossRef]
  26. Singh, G.; Rawat, G.S.; Verma, D. Comparative study of fuelwood consumption by villagers and seasonal “Dhaba owners” in the tourist affected regions of Garhwal Himalaya, India. Energy Policy 2010, 38, 1895–1899. [Google Scholar] [CrossRef]
  27. Groot, R. De Function-analysis and valuation as a tool to assess land use conflicts in planning for sustainable, multi-functional landscapes. Landsc. Urban Plan. 2006, 75, 175–186. [Google Scholar] [CrossRef]
  28. CBS District/VDC Wise Population of Nepal; Central Bureau of Statistics: Kathmandu, Nepal, 2012.
  29. Rai, R.K.; Nepal, M.; Bhatta, L.D.; Das, S.; Khadayat, M.S.; Somanathan, E.; Baral, K. Ensuring Water Availability to Water Users through Incentive Payment for Ecosystem Services Scheme: A Case Study in a Small Hilly Town of Nepal. Water Econ. Policy 2017, 1850002. [Google Scholar] [CrossRef]
  30. Hotelling, H. The Economics of Public Recreation; The Prewitt Report; Land and Recreation Planning Division, National Park Service: Washington, DC, USA, 1949. [Google Scholar]
  31. Brown, W.; Nawas, F. Impact of aggregation on the estimation of outdoor recreation demand functions. Am. J. Agric. 1973, 55, 246–249. [Google Scholar] [CrossRef]
  32. Brown, W.; Sorhus, C.; Chou-Yang, B. Using individual observations to estimate recreation demand functions: A caution. Am. J. 1983, 65, 154–157. [Google Scholar] [CrossRef]
  33. McConnell, K. The economics of outdoor recreation. Handb. Nat. Resour. Energy Econ. 1985, 2, 677–722. [Google Scholar]
  34. Rosenthal, D. The Necessity for Substitute Prices Recreation Demand Analyses. Am. J. Agric. 1987, 69, 828–837. [Google Scholar] [CrossRef]
  35. Poor, P.; Smith, J. Travel cost analysis of a cultural heritage site: The case of historic St. Mary’s city of Maryland. J. Cult. Econ. 2004, 28, 217–229. [Google Scholar] [CrossRef]
  36. Cameron, A.C.; Trivedi, P.K. Econometric models based on count data: Comparisons and applications of some estimators and tests. J. Appl. Econ. 1986, 1, 29–53. [Google Scholar] [CrossRef]
  37. Nepal, M.; Bohara, A.; Berrens, R. The impacts of social networks and household forest conservation efforts in rural Nepal. Land Econ. 2007, 83, 174–191. [Google Scholar] [CrossRef]
  38. Creel, M.; Loomis, J. Theoretical and empirical advantages of truncated count data estimators for analysis of deer hunting in California. Am. J. Agric. 1990, 72, 434–441. [Google Scholar] [CrossRef]
  39. Willis, K. The Recreational Value of the Forestry Commission Estate in Great Britain: A Clawson-Knetsch Travel Cost Analysis. Scott. J. Polit. Econ. 1991, 38, 58–75. [Google Scholar] [CrossRef]
  40. Rai, R.K.; Scarborough, H. Economic value of mitigation of plant invaders in a subsistence economy: Incorporating labour as a mode of payment. Environ. Dev. Econ. 2013, 18, 225–244. [Google Scholar] [CrossRef]
  41. Rai, R.K.; Scarborough, H. Nonmarket valuation in developing countries: Incorporating labour contributions in environmental benefits estimates. Aust. J. Agric. 2015, 59, 479–498. [Google Scholar] [CrossRef]
  42. Ezebilo, E.E. Economic value of a non-market ecosystem service: An application of the travel cost method to nature recreation in Sweden. Int. J. Biodivers. Sci. Ecosyst. Serv. Manag. 2016, 12, 314–327. [Google Scholar] [CrossRef]
  43. Ulfarsson, G.F.; Steinbrenner, A.; Valsson, T.; Kim, S. Urban household travel behavior in a time of economic crisis: Changes in trip making and transit importance. J. Transp. Geogr. 2015, 49, 68–75. [Google Scholar] [CrossRef]
  44. Zhang, F.; Wang, X.H.; Nunes, P.A.L.D.; Ma, C. The recreational value of gold coast beaches, Australia: An application of the travel cost method. Ecosyst. Serv. 2015, 11, 106–114. [Google Scholar] [CrossRef] [Green Version]
  45. Pandey, A.; Kotru, R.; Pradhan, N. Bridging cultural heritage, conservation and development through a transboundary landscape approach. Asian Sacred Nat. Sites Philos. Pract. Prot. Areas Conserv. 2016, 18, 145–158. [Google Scholar]
  46. Nepal Rastra Bank. Macoeconomic Indicators of Nepal; Nepal Rastra Bank: Kathmadu, Nepal, 2016; Available online: https://nrb.org.np/red/publications/economic_bulletin/Macroeconomic_Indicators_of_Nepal--2016-11_(November_2016).pdf (accessed on 8 October 2018).
  47. Department of Economic Affairs. Economic Survey 2016–17; Department of Economic Affairs, Ministry of Finance: New Delhi, 2017. Available online: https://www.indiabudget.gov.in/es2016-17/echapter.pdf (accessed on 8 October 2018).
  48. Thiagarajah, J.; Wong, S.K.M.; Richards, D.R.; Friess, D.A. Historical and contemporary cultural ecosystem service values in the rapidly urbanizing city state of Singapore. Ambio 2015, 44, 666–677. [Google Scholar] [CrossRef] [PubMed] [Green Version]
  49. Malik, S.K. Social Exclusion and the Mindscapes of Caste: A Study of Kendrapara District of Odisha. In Marginalities in India; Springer: Berlin, Germany, 2018; pp. 35–49. [Google Scholar]
Figure 1. Kailash sacred landscape and study sites [18].
Sustainability 10 03638 g001
Table 1. Descriptive statistics (Patal Bhuvaneshwar visitors).
VariablesVariable DefinitionMeanSDMinMax
Total TripsNo. of trips in 5 years2.091.4518
Travel CostTotal travel costs for current trip8789973337043,950
Alternative Site TCTravel costs to alternative site281188130104,925
HH Income > 300,0001 if annual HH income >INR 300,0000.480.5001
Male1 if respondent is male0.650.4801
Respondent’s AgeRespondent’s age in years3882162
Urban1 if visitor is from urban area0.730.4401
Group SizeNo. of people visiting together6.53.3230
Recreational Purpose1 if the visitor is traveling for recreation0.120.3301
Agriculture1 if visitor’s occupation is agriculture0.130.3401
Business1 if visitor’s occupation is business0.140.3501
Government Employee1 if visitor is a government employee0.230.4201
NGO/Private1 if visitor works for NGO/Private0.210.4101
Housewife1 if visitor is a housewife0.200.4001
Other1 if visitor’s occupation is “other”0.080.2701
Less than 12th grade1 if visitor has <12 years of schooling0.360.4801
Bachelor’s1 if visitor has Bachelor’s degree0.350.4801
MA/PhD1 if visitor has MA/PhD degree0.290.4501
Site Quality—Average1 if site quality is average0.040.2001
Site Quality—Good1 if site quality is good0.360.4801
Site Quality—Very Good1 if site quality is very good0.600.4901
Notes: Sample size decreased from 200 to 187 after adjusting for missing and incomplete information.
Table 2. Descriptive statistics and variable definition of visitors’ characteristics.
VariablesDefinitionHat-Kalika VisitorsGallek Visitors
MeanSDMeanSD
Total TripsNo. of trips in 5 years15.1517.4121.8824.23
Travel CostTravel costs for the last trip284499354221
Alternative Site TCTravel costs to alternative site163291786437
Household income >50,0001 if monthly household income >50,0000.250.430.740.44
Male1 if respondent is male0.30.460.60.49
Respondent’s ageRespondent’s age in years45154514
Household sizeNo. of members in household5.362.1673.3
Dalit1 if respondent is classified as lower caste *0.390.480.170.38
Education more than grade 61 if respondent has more than grade 6 education0.480.50.290.46
Notes: Sample size with complete information for Hat-Kalika site is 305 after excluding households who did not travel to the Hat-Kalika temple at least once in the past five years. Sample size for Gwallek with complete information for the site is 139. * Lower castes who are at the bottom of the Hindu caste system are also known as Dalit. Historically, they constituted occupational groups such as blacksmiths/goldsmiths, cobblers and tailors and continue to be socially disadvantaged groups. The monetary units are measured in INR for India and NPR for Nepal. The exchange rate between these two currencies is 1 INR = 1.60 NPR.
Table 3. Truncated negative binomial estimates with endogenous stratification (Patal Bhuvaneshwar).
VariablesZero Truncated Negative Binomial Estimates
M1M2M3
Travel Cost (TC)−6.73 × 10⁻⁵ ***−7.29 × 10⁻⁵ ***−7.07 × 10⁻⁵ ***
(1.87 × 10⁻⁵)(1.91 × 10⁻⁵)(1.90 × 10⁻⁵)
Alternative Site TC−2.20 × 10⁻⁵−1.32 × 10⁻⁵−1.62 × 10⁻⁵
(1.71 × 10⁻⁵)(2.51 × 10⁻⁵)(2.50 × 10⁻⁵)
HH Income (base < 50,000)−0.218−0.429−0.474 *
(0.246)(0.267)(0.265)
Male0.2900.2250.143
(0.207)(0.329)(0.328)
Age of Respondent0.009090.01120.0132
(0.0122)(0.0129)(0.0129)
Urban−0.348−0.613 **−0.525 **
(0.219)(0.251)(0.246)
Group Size−0.02400.0006710.00867
(0.0347)(0.0351)(0.0347)
Recreational Purpose−0.343−0.456−0.470
(0.364)(0.377)(0.374)
Site Quality (base: average)
Good 14.41
(574.6)
Very Good 14.43
(574.6)
Respondent Education (base: below 12th grade)
Bachelor’s 0.3740.420
(0.277)(0.279)
Masters and Above 0.834 **0.790 **
(0.359)(0.356)
Constant−0.295−0.490−14.89
(0.662)(0.728)(574.6)
Ln (alpha)0.0665−0.280−0.479
(0.841)(0.813)(0.796)
Observations188185185
Notes: In M2 and M3, the occupation categories of the respondents were controlled but these coefficients are not included here for reasons of space. Results are available upon request. Standard errors in parentheses; *** p < 0.01, ** p < 0.05, * p < 0.1.
Table 4. Truncated negative binomial estimates Patal Bhuvaneshwar (day visitors).
VariablesZero Truncated Negative Binomial Estimates
M1M2
Travel Cost−0.000225 ***−0.000238 ***
(7.07 × 10⁻⁵)(7.48 × 10⁻⁵)
Alternative Site TC−2.59 × 10⁻⁵−1.80 × 10⁻⁵
(1.91 × 10⁻⁵)(2.78 × 10⁻⁵)
HH Income (base < 50,000)−0.197−0.553**
(0.257)(0.277)
Male0.403 *0.368
(0.211)(0.340)
Age of Respondent0.003830.0102
(0.0117)(0.0119)
Urban−0.0637−0.447 *
(0.200)(0.236)
Group Size0.02290.0629 *
(0.0360)(0.0351)
Recreational Purpose−0.447−0.687
(0.500)(0.509)
Respondent Education (base: below 12th grade)
Bachelor’s 0.470 *
(0.250)
Masters and Above 1.296 ***
(0.356)
Constant0.269−0.420
(0.524)(0.683)
Ln (alpha)−1.444−2.247
(0.921)(1.388)
Observations108105
Notes: In M2, we controlled for occupation categories of the respondents but these coefficients are not included here to save space. Standard errors in parentheses; *** p < 0.01, ** p < 0.05, * p < 0.1.
Table 5. Zero truncated negative binomial estimates (Chandak-Aunla Ghat and Hat-Kalika).
VariablesZero Truncated Negative Binomial Estimates
M1M2
Travel Cost−0.000851 ***−0.000897 ***
(0.000120)(0.000123)
Alternative Site TC0.0002740.000304
(0.000213)(0.000214)
HH Income (base < 50,000)−0.176−0.206
(0.177)(0.177)
Male0.0738−0.0477
(0.147)(0.166)
Age0.0174 ***0.0215 ***
(0.00509)(0.00571)
Family Size−0.00744−0.0159
(0.0365)(0.0369)
Dalit−0.290 *−0.215
(0.153)(0.160)
Education (Base: up to grade 6)
More than Grade 6 0.256
(0.162)
Constant2.150 ***1.906 ***
(0.292)(0.331)
Pseudo R-squared0.0250.026
Observations305305
Standard errors in parentheses, *** p < 0.01, ** p < 0.05, * p < 0.1.
Table 6. Zero truncated Poisson estimates (Gwallek Kedar).
VariablesZero Truncated Poisson Estimates
M1M2
Travel Cost−0.000303 ***−0.000293 ***
(8.97 × 10⁻⁵)(8.89 × 10⁻⁵)
Alternative Site TC0.00108 ***0.00117 ***
(5.02 × 10⁻⁵)(5.05 × 10⁻⁵)
HH Income (base < 50,000)0.127 **0.199 ***
(0.0522)(0.0529)
Male−0.0902 **−0.333 ***
(0.0410)(0.0462)
Age0.00786 ***0.00224
(0.00139)(0.00150)
Family Size−0.0527 ***−0.0516 ***
(0.00696)(0.00700)
Dalit−0.238 ***−0.352 ***
(0.0556)(0.0567)
Education (Base: up to grade 6)
More than Grade 6 −0.551 ***
(0.0512)
Constant2.504 ***2.952 ***
(0.0924)(0.0992)
Pseudo R-sq0.220.25
Observations138138
Standard errors in parentheses, *** p < 0.01, ** p < 0.05, * p < 0.1.
Table 7. Zero truncated negative binomial estimates (pooled-sample).
VariablesZero Truncated Negative Binomial Estimates
M1M2
Travel Cost−0.000789 ***−0.000816 ***
(0.000117)(0.000122)
Alternative Site TC0.000944 ***0.000966 ***
(0.000160)(0.000164)
HH Income (base < 50,000)−0.0869−0.0769
(0.136)(0.137)
Male0.04900.0370
(0.117)(0.118)
Age0.0147 ***0.0156 ***
(0.00417)(0.00432)
Family Size−0.0301−0.0309
(0.0235)(0.0235)
Dalit−0.315 **−0.292 **
(0.133)(0.136)
Education (Base: up to grade 6)
More than Grade 6 0.1000
(0.122)
Constant2.258 ***2.172 ***
(0.229)(0.252)
Pseudo R-squared0.0210.022
Observations443443
Note: Standard errors in parentheses, *** p < 0.01, ** p < 0.05, * p < 0.1. While pooling the data, INR was converted to NPR using the 1.60 exchange rate.
Table 8. Per person per trip use value of cultural services at KSL area in NPR (USD).
Patal BhuvaneshwarM1M2M3
Full Sample (Table 3)23,77421,94722,630
(229)(211)(218)
Day Visitors (Table 4)71106.723
(68)(65)
Hat-Kalika Visitors (Table 5)18801784
(18)(17)
Gwallek Kedar Visitors (Table 6)33003413
(32)(33)
Pooled Sample (local residents of Sites 2 and 3) (Table 7)20271980
(20)(19)
KSL Area
i. Total cultural (use) value for the three sites (annual)-NPR 300 million-
(USD 2.9 million)
ii. Total cultural (use) value of KSL area (for local residents only) (annual)-NPR 2.35 billion-
(USD 22.6 million)
Note: In the Chandak-Aunla Ghat-Hat-Kalika sample, the site quality related information is missing and M3 is not estimated. In the day visitors’ case, M3 does not converge. For the Gwallek watershed sample, the zero-truncated negative binomial model does not converge. The pooled sample includes a sample from Chandak-Aunla Ghat-Hat-Kalika and Gwallek watersheds. The cultural value of the KSL area to local residents is estimated using the use value of NPR 1980 per person/trip/year (Model M2) for 200,000 households, in which 50% are likely to visit the sites more than four times a year in a group of three members on average. This amounts to 13% and 27% of per capita household income in Nepal and India, respectively.

