CSR Strategic Approach, Financial Resources and Corporate Social Performance: The Mediating Effect of Innovation


1
Department of Business and Law Studies, University of Siena, Piazza San Francesco 7, 53100 Siena, Italy
2
Brighton Business School, University of Brighton, Mithras House, Lewes Road, Brighton BN2 4AT, UK
*
Author to whom correspondence should be addressed.
Sustainability 2018, 10(10), 3611; https://doi.org/10.3390/su10103611
Submission received: 12 September 2018
/
Revised: 1 October 2018
/
Accepted: 2 October 2018
/
Published: 10 October 2018
(This article belongs to the Section Economic and Business Aspects of Sustainability)
Abstract
:Given the current undefined relational effect between corporate financial performance (CFP) and corporate social performance (CSP) and the potentially myopic behavior of managers, this paper answers the call from some scholars to contribute towards a better understanding of the relationship between CFP and CSR. Different from other papers, it does so by analyzing the role of innovation activities as a mediator between CFP and CSR, applying a regression and mediation analysis between firms’ financial resources, innovation initiatives, and social and environmental performance. The results demonstrate that innovation is a critical factor in the relationship between CFP and corporate social performance (CSP) as it enables organizations to respond to new economic, social and environmental challenges faster and better than organizations that are not able to innovate. Therefore, the investment of financial resources in innovation initiatives is one of the most important levers to pursue and to increase CSP.
1. Introduction
Over the past few decades, the way in which companies conduct their business has changed profoundly [1,2]. In order to compete on the global stage, companies have had to continuously innovate and redefine their strategies, while contemporaneously taking into consideration their local features [3]. Additionally, companies cannot currently adopt unethical business practices (e.g., environmental pollution, unfair labor practices, safety concerns, etc.) without exposing themselves to a negative reaction from their markets and from society as a whole [4]. To be successful, companies must be concerned not only about their profits, but also about all their stakeholders’ needs [5,6]. A responsible company should consider the social and environmental impact of its business processes, collaborate with its customers and suppliers, and be supportive of its employees [7]. In particular, Corporate Social Responsibility (CSR) implies that firms do something extra for their stakeholders beyond their usual expectations and requirements [8,9]. CSR has become increasingly relevant for managers at all levels and it is an attractive field of study with a number of research questions still to be answered [10].
There are several good reasons for executives to engage in CSR. Legitimation and reputation are frequently mentioned among the main reasons for declaring and implementing such initiatives. In industries with intense competition, CSR initiatives may be a key factor in adding value to the product and directing customers’ attention to important social and environmental issues that go beyond product cost [11,12].
Companies are increasingly undertaking CSR activities to better align their internal processes with their economic, social and environmental goals, to carry out successful innovation initiatives, and to engage customers and employees. This change in perspective is due, in large part, to increasing societal pressure on company leaders and managers to recognize the importance of social and environmental activities. Socially responsible objectives are regarded as being among the most important CEO priorities. Many are the reasons for this prioritization: consistency between CSR goals and firms’ financial interests, managers’ altruism and managers’ professional and/or personal reputation [13]. Therefore, firms adopt CSR-oriented strategies for various reasons, but scholars have focused mainly on financial aspects, i.e., whether CSR activities enhance financial performance. Previous empirical research has addressed the impact of CSR on corporate financial performance (CFP), but the results are inconsistent [14]. Several studies show a positive relationship between CSR and CFP [15], while others show the opposite [5,16,17,18,19]. Analyzing past and recent literature, as pointed out by Margolis and Walsh [20] and Lu et al. [21], scholars have been devoted less attention to the relationship between CFP and CSR and even less has been the interest toward understanding how to operationalize in practice the aforementioned relationship. To have enough resources, especially financial resources, could be a condition to adopt a socially responsible behavior, but limited are the studies researching the way through which the relationship between CFP and CSR is operationalized. To fill this gap, in this paper we focus on the relationship between corporate financial performance (CFP) and CSR outcomes, or corporate social performance (CSP) [22], with a specific interest in understanding the role of innovation. The adoption of new processes and technologies could be the way towards balancing the potential conflicts existing between stakeholders’ economic and social purposes. The availability of financial resources could be among the most important conditions for investment in CSR-innovation initiatives [5,6,16]. Following this assumption, the achievement of higher CFP can be considered a stimulus that boosts the implementation of socio-environmental and ethical activities geared towards enhancing CSP.
Managers are more likely to use available resources on activities that are expected to be profitable in the short-term [23] although they may sacrifice short-term performance to increase sales at a given level of return [24]. Consequently, in times of declining financial results, managers might not invest in CSR activities, since they generally require a longer period to positively affect a firm’s financial performance [25]. This is especially true if the CSR activities in question result in, or stem from, the implementation of innovative processes which themselves usually take some time to improve financial performance [26].
Given the current lack of definition of the relational effect between CFP and CSR and the potentially myopic behavior of managers, this paper answers Carroll and Shabana’s [27] call to contribute to better understanding of the previously mentioned relationship. Adopting a strategic approach to CSR, business resources are invested to produce both financial and non-financial value, either internal or external to firms. Businesses need to create and capture value to make investments with socially responsible objectives while enhancing financial performance in the longer term. Much depends on managers’ motivations and behavior. The availability of resources is not in itself enough to support the pursuit of socially responsible objectives. Resources have to be strategically allocated and invested. Therefore, also to implement CSR activities and pursue CSP managers must strategically allocate financial resources. To this end, this paper focus on the role innovation plays in the relationship between CFP and CSP. The amount and quality of expenditures in innovation have a strong relationship with company performance [28]. According to many scholars, innovation plays a crucial role in the relationship between CFP and CSP [29,30,31,32]. This paper aims to contribute to understanding whether innovation could play a role as moderator and/or mediator in the relationship between CFP and CSP. To pursue this aim, we ran a regression and mediation analysis regarding firms’ financial resources, innovation intensity, and CSP.
When it first appeared on the academic and economic scenes, CSR theory was mainly focused on firms’ obligation and accountability to society [33], but in this paper the concept of CSP is adopted to emphasize the outcomes and results of CSR activities [22]. CSP is measured in terms of CSR ratings, as these proxies offer the greatest credibility and transparency [34]. This study develops an empirical analysis on a sample made up of the firms listed in the “Corporate Knights’ Index” (the Global 100 Index), a CSR index. The annual Global 100 Index constituents list traditionally represents group of large transnational companies that consciously aim to play crucial roles in society and on the international market, maximizing corporate sustainable value to satisfy CSR stakeholders’ expectations. Companies ranked in the Global 100 Index can be identified as top CSP performers worldwide, due to their high CSR standards, some of which foster the implementation of cleaner production, focusing on specific key corporate performance intensity targets such as energy use, carbon emissions, water consumption and waste produced. These management issues are particularly determinant for those non-financial companies (NFCs), both manufacturing and nonmanufacturing, which aim to improve their CSP.
This paper proceeds as follows. Section 2 proposes the existence of a link between CFP, innovation and CSP, and presents the research hypothesis. In Section 3, the methodology used to develop the statistical analysis is outlined, and in the following Section 4, the study findings are presented. In Section 5, discussion and some final remarks are offered.
2. Theoretical Framework and Hypothesis Development
Research on CSR has grown significantly in recent years [35], and various theories have been adopted to explain the framing, implementation and effects of CSR initiatives. Looking at their objectives, theories on CSR could be classified into four categories: (1) instrumental theories, (2) political theories, (3) ethical theories, and (4) integrative theories [36]. Apart from instrumental theories, the other approaches highlight the concept of CSR as an area in which companies are no longer merely expected to passively report results indirectly achieved through their core activities but must manage CSR as a specific area of performance on its own [37]. CSR is a strategic area to manage to increasingly satisfy the needs of a company’s stakeholders beyond their expectations. Adopting mainly a resource-based view perspective, previous studies have focused on the effect CSP could produce on CFP. In general, these studies have summarized the impact of CSP on CFP in the possibility of firms with higher CSP to differentiate themselves from their competitors through the production of internal and/or external benefit [38]. Internally, the achievement of superior CSP could be due to a good corporate governance and the construction of those intangible resources related with employee work environment, particularly useful to maintain motivate employees’ and to attract new talents as well. The external benefits of CSR could be related to its effect on corporate reputation resulting in the development of better relations with external key business supporters, such as public administrations and investors. Furthermore, if managers foster the implementation of those CSR strategic initiatives such as customer-oriented activities these managerial actions could affect the consumer behavior in the medium-long term [39], as much as to achieve competitive advantages and sales improvements.
The study of the relationship between CSP and CFP could be also reversed. If the objective of CSR strategies is to increase stakeholders’ satisfaction beyond expectations and regulations, firms should exploit and invest in those activities that allow them to achieve that objective while (re)creating capabilities resulting in a sustainable future financial situation to avoid potential failure [40]. CSR objectives are no more to be considered functionally to firms’ financial performance but have to be pursued on their own as a constituent of the overall performance of a firm. To this end, companies should merge the different “theatres” of reference of CSR initiatives and activities to build a unified dimension consistent with the core financial strategy, leading to the development of an organic company-wide strategy. The assumption of a strategic perspective implies not only the definition of the business’ future direction and objectives, but also an understanding of the amount and apportionment of available resources. Sufficient resources, especially financial ones, make any firm potentially more flexible and able to develop strategies suitable for pursuing opportunities coherent with its current and prospective environment and capacities [41].
The main problem linked to a strategic CSR management approach is, thus, related to the possibility of making this dimension of strategy fit with other dimensions of company strategy. The CSR dimension of a strategy must necessarily fit, to the same degree as all others, with its financial dimension [42]. This implies the need to correlate the two strategic dimensions to define company strategy and make it implementable. In fact, the direct or indirect availability of adequate financial resources is of fundamental importance in evaluating the feasibility of any strategy. Hence, even a CSR-oriented strategy would require a proper fit with a firm’s financial situation. This means that good CSP results—which, based on non-instrumental theories of CSR, should come about regardless of the company’s financial conditions—could more readily be pursued and achieved in concomitance with good financial performance [16,17,43] and profitability in particular. The greater the profitability of a company, the greater its financial flexibility, which strongly affects managerial decision-making. Within the context of this discussion on the definition and implementation of a CSR-oriented company strategy, we must take into due consideration the managers’ role, as they can bring individual interests to the table that might conflict with those of other stakeholders, especially in cases where managers draw short-term remunerative advantages based on the company’s financial performance. This conflict of interest is more significant in companies with less financial flexibility, where management consequently has limited space for decision-making. In situations of scarce financial resources, managers tend to allocate resources to initiatives that are more remunerative in the short term, rather than CSR investments, which generally provide financial advantages only in the mid- to long-term period. Orlitzky et al. [44], who highlight that a positive relationship between CFP and CSP works when firms have slack resources, confirm this reason. The achievement of superior financial performance creates extra funds for investments in social and environmental activities non-contrasting with managers’ self-interests. Differently—but this proves the rule that managers’ self-interests conflict with a strategic approach to CSR—managers could invest in activities coherent with a CSR-oriented outlook in periods of weak financial performance as well, but in such cases, they would be motivated by the will to devise justifications for the company’s poor financial performance [45]. However, such a situation is sustainable only if one looks at the current financial year, and not the mid-to-long term. Thus, managers are interested in investing in CSR-oriented strategies only because the company already enjoys good financial performance. The importance of financial performance and the flexibility it provides increases in times of economic downturn, such as the period after the 2008 financial crisis. According to Ullmann [46], even the disclosure of CSR expenditure information is avoided by firms for keeping away complaints from their shareholders that could see it as a way to redirect profit away from them.
In summary, the availability of sufficient resources is one of the most important elements in defining and implementing successful strategies by compromising the interest of the different firms’ stakeholders with those of the shareholders and mangers. The availability of sufficient financial resources makes any firm potentially more flexible and able to develop strategies suitable for pursuing opportunities coherent with its current and prospective environment, which is increasingly characterized by a strong call to implement CSR activities resulting in higher CSP [16,17,43].
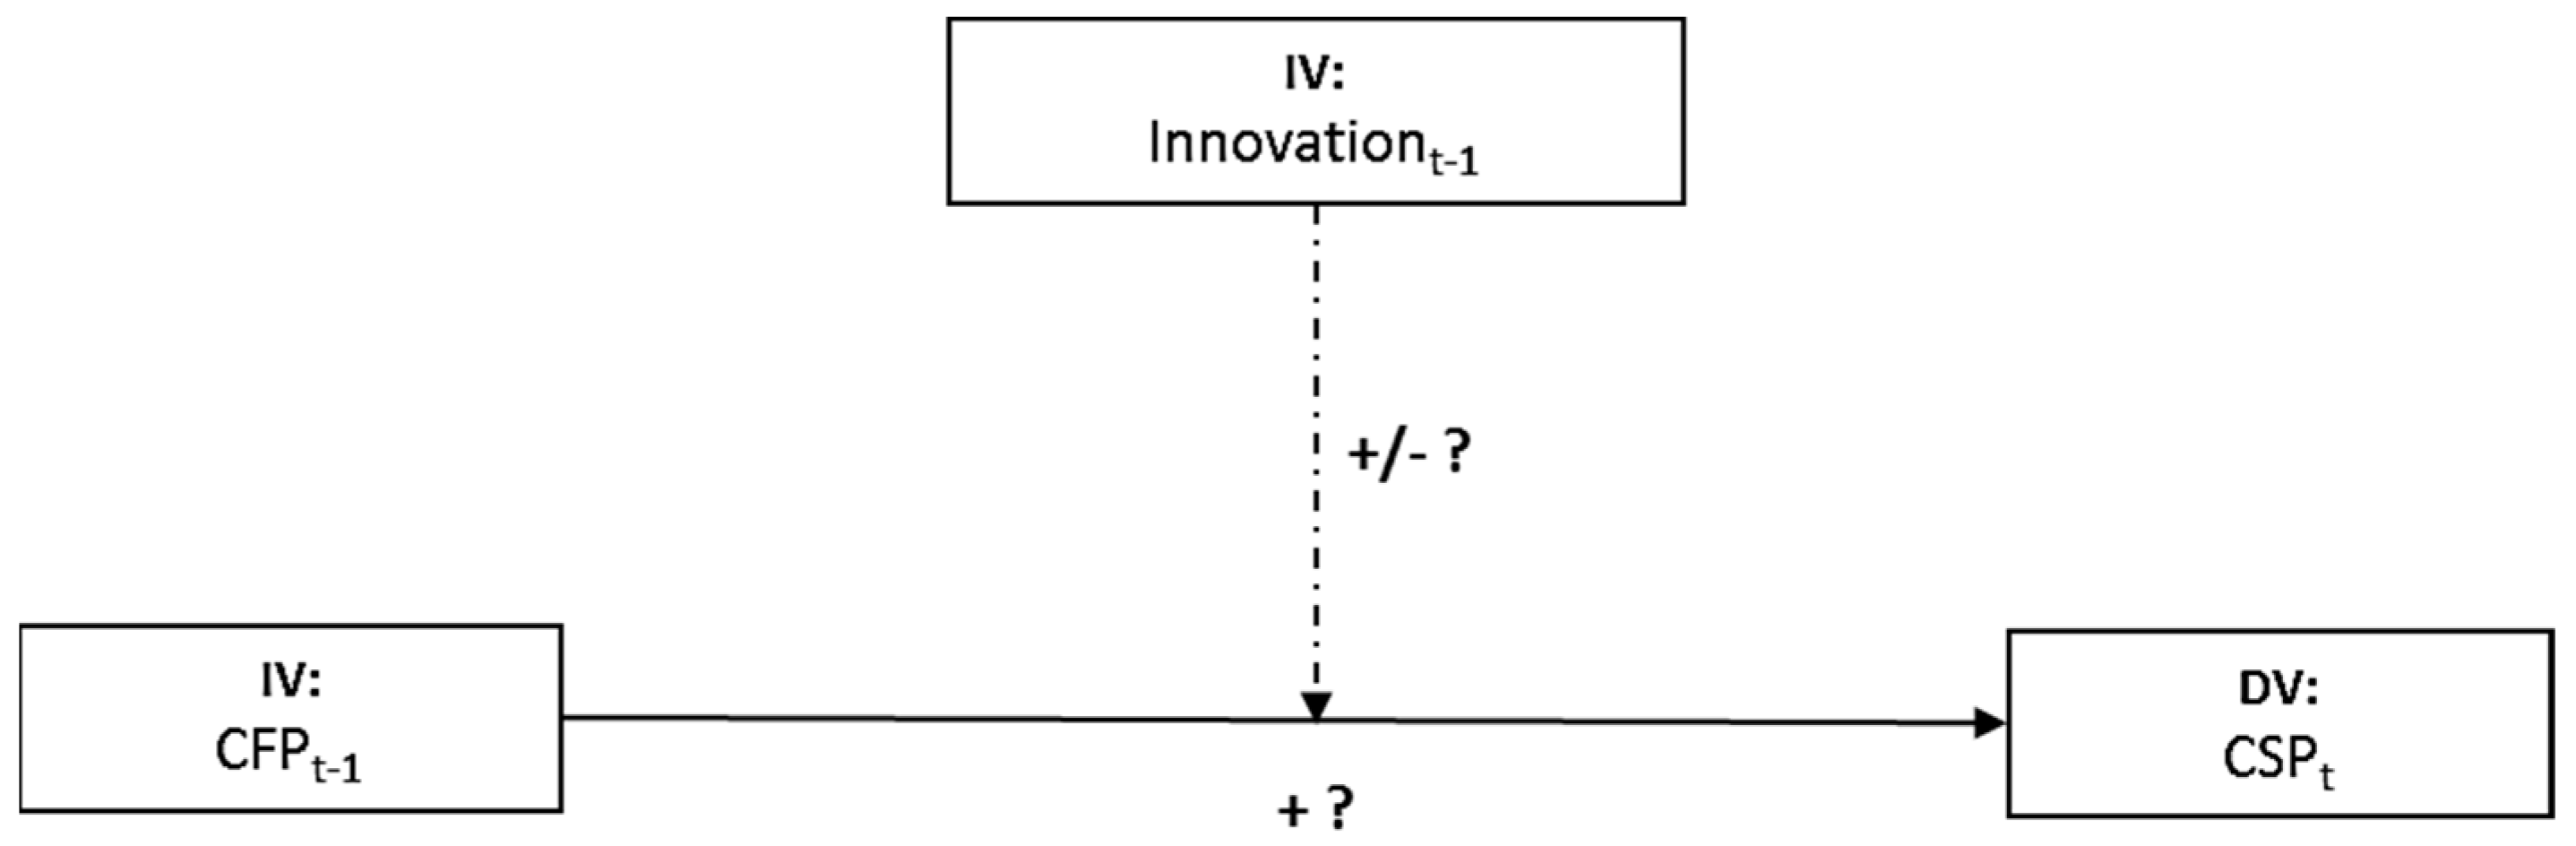
Hypothesis 1 (H1).
For this reason, we can assume that companies’ financial performance has a direct and positive impact on their CSP. (cf. Figure 1).
In addition to the availability of sufficient resources, another important key to a good and effective business strategy is the appropriate allocation of these resources [47]. Research and development (R&D) investments and their effective implementation are usually considered critical for firms’ success, as they can increase a company’s uniqueness [28]. In particular, the investment of financial resources in R&D activities could result in innovations leading to new or updated organizational/production processes and products able to responding better to all internal and external stakeholders’ social and environmental concerns coupled with financial ones [48,49]. However, as stated in previous studies [50,51], in order to boost R&D investments that sustain corporate innovation, managers need to cover such sunk costs, and overcome internal and external financial constraints by utilizing available resources. Such resources are most likely to be produced when management performs efficiently in terms of profitability, thus generating a virtuous cycle that fosters new R&D activities and innovation and leads to increased future profits.
Hypothesis 2 (H2).
Therefore, we can assume that corporate profitability could foster the implementation of innovation activities. (cf. Figure 2).
Furthermore, if management is strongly committed to developing innovation strategies, the firm might invest more in R&D activities. Therefore, we agree with McWilliams and Siegel [49] and Padgett and Galan [52] in assuming that the firm’s attitude to increase R&D expenses could foster process and product innovations because of CSR activities, which also serve to enhance CSP. In the light of this, prior studies have adopted an instrumental perspective to investigating the relationship between innovation and CSR [14,25,52]. In particular, CSR has been considered from a business perspective as a contributor to the development and marketization of innovative products that give firms social legitimization. This corporate legitimization should ultimately result in higher turnover and profitability. In the end, CSR-driven innovation should help a company to enhance its reputation in the market and gain a competitive advantage stemming from products that better match its current and prospective customers’ preferences and values [53]. This virtuous interaction, however, strongly depends on managers’ behavior and their decision-making attitudes pro CSR. In particular, as pointed out by Bocquet et al. [54], the managerial CSR activism may range from the strategic to the responsive approach till to minimize or hinder firms’ innovation processes. Gallego et al. [48] identify several reasons, all related to managers’ behavior, to explain the negative relationship innovation and CSR. Because of the time lag effect associated with innovation, CSR projects entail an increase in a firms’ expenses, resulting, at least in the short term, in decreasing profits and stock value. Another explanation may be the accidental origin of most discoveries resulting in innovation. Additionally, when innovative products prove to meet customers’ expectations and needs, management may see little need to implement CSR projects and practices to be more appealing to their customers.
In this paper, we adopt a different perspective, focusing on the relationship between CFP and innovation investments to understand their impact on CSP. This approach differs from previous analyses in that it considers CSR as an area of firms’ activity, so managers must manage it on its own jointly with all other managerial areas. To this end, the investment of the available financial resources in innovation processes could give the opportunity to combine all the different stakeholders’ expectations of a firm.
Based on the above-mentioned arguments, our analysis also aims to investigate the following research hypotheses:
Hypothesis 3 (H3).
Corporate innovation produces a positive impact on subsequent CSP. (cf. Figure 3).
Hypothesis 4 (H4).
There is a moderation effect between CFP and CSP driven by corporate innovation. (cf. Figure 4).
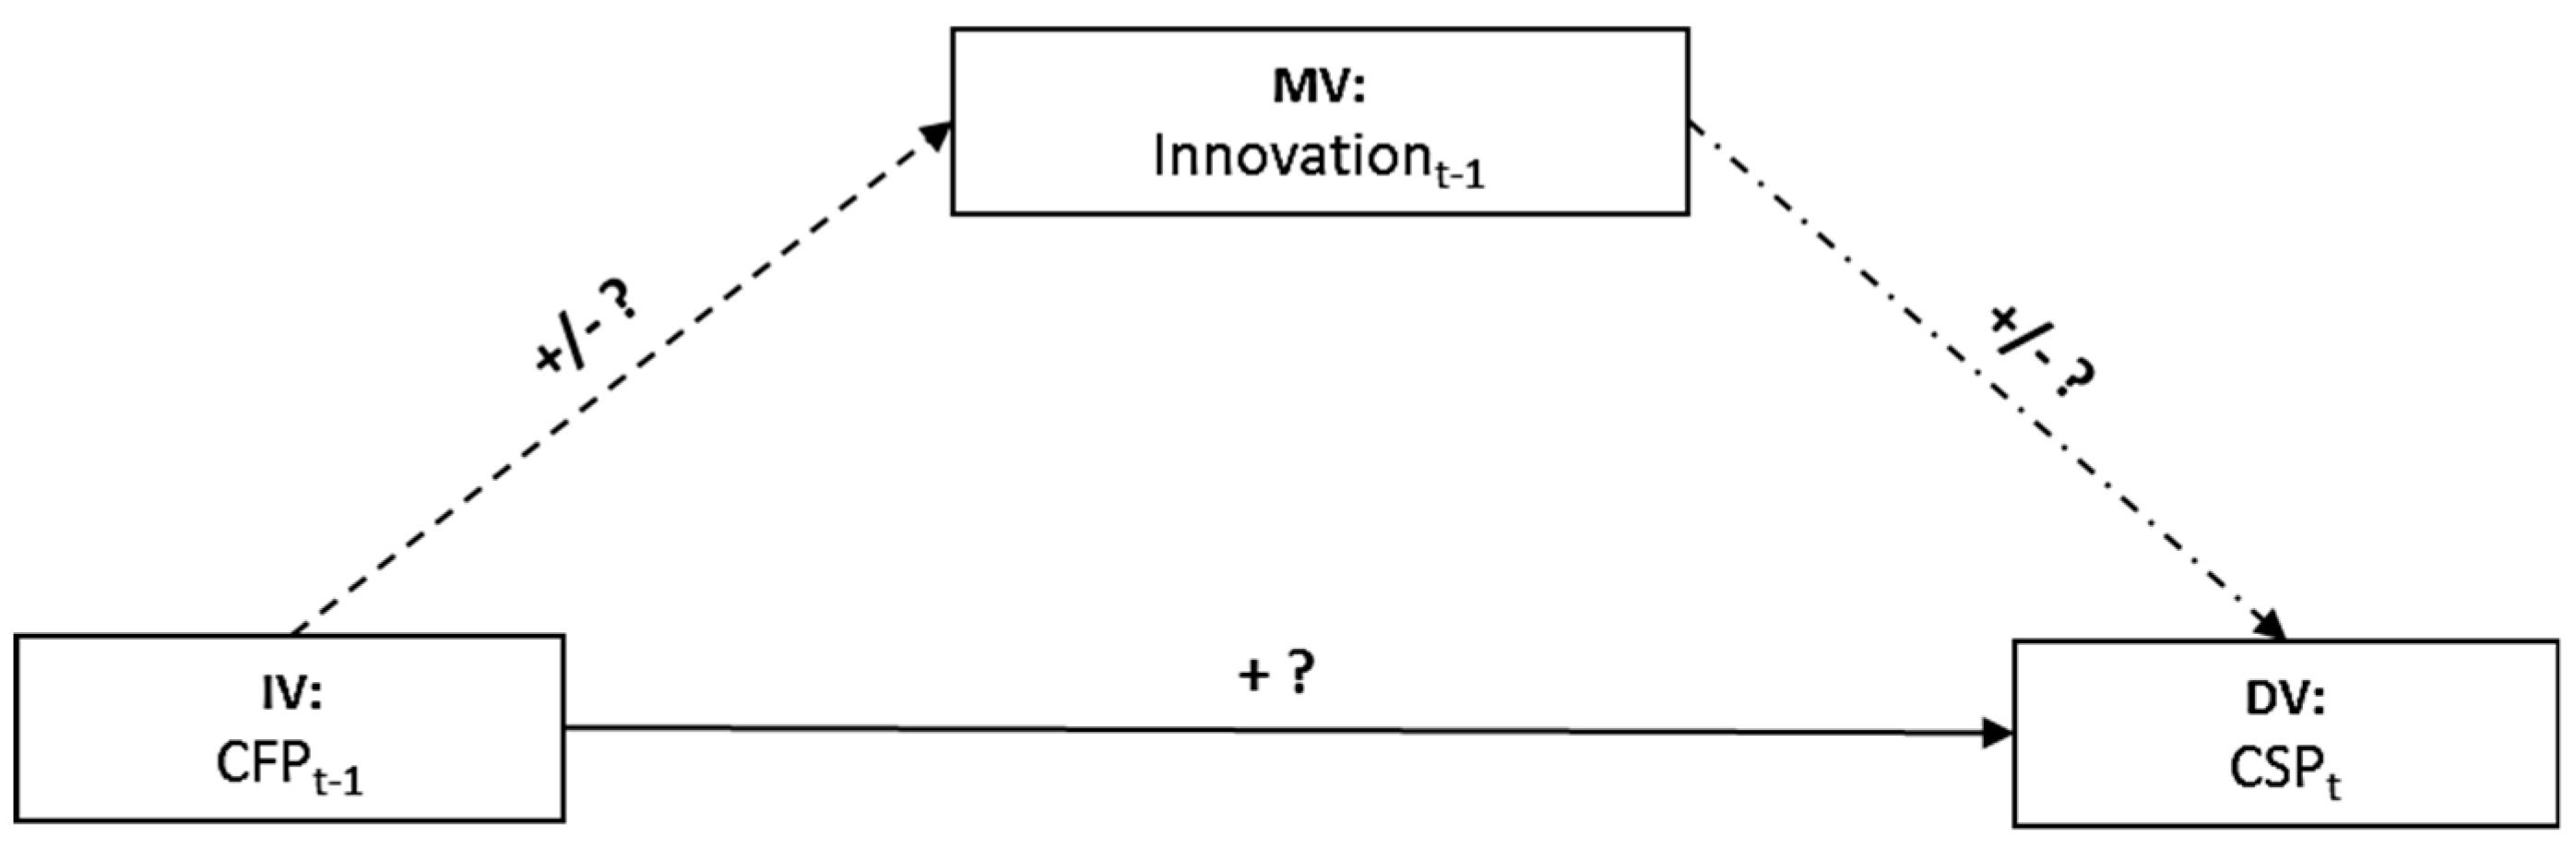
Hypothesis 5 (H5).
There is a mediation effect between CFP and CSP driven by corporate innovation. (cf. Figure 5).
3. Research Methods
This study presents an analysis carried out on 825 observations organized as a panel data that is multidimensional data involving measurements overtime. This panel data is strongly balanced as each panel contains the same time points for all the subjects included in the sample. The sample is composed of 165 NFCs that were included at least once in the Global 100 Index during the period 2010 to 2014. Financial data for the period 2009–2013 was collected from the Bloomberg platform. In the analysis, a time-lag effect of one year was considered: CFP for a given year was used to study the impact on CSP for the following year in terms of inclusion in or exclusion from the Global 100 Index.
We focused our analysis on NFCs due to the different tangible and material aspects characterizing possible improvement of the CSR in production processes through innovation for this company category, and due to the need to develop statistical investigations on similar and comparable accounting data. Table 1 below shows the industry sample distribution of companies involved in the evaluation process characterizing the annual definition of the Global 100 Index in the period 2010–2014.
The Global 100 Index is managed by the Canadian clean capitalism “Corporate Knights” magazine, one of the most popular and influential CSR journals for managers, policy-makers, and stakeholders.
The Corporate Knights research unit periodically screens about 4000 listed mid-size and large companies (about $2 billion of market value) to develop the annual ranking of the top 100 worldwide corporate leaders in CSR. This ranking is announced every January during the World Economic Forum in Davos. Like other CSR ratings (e.g., Bloomberg ESG Data Service, Dow Jones Sustainability Index, FTSE4Good, ISS, MSCI ESG Research, Thomson Reuters Asset4, etc.), the Global 100 Index aims to highlight companies’ socially responsible investments. It is built through the collection of publicly disclosed data (i.e., financial filings, sustainability reports) and the gathering of information directly from corporations for auditing purposes prior to their final evaluation. In particular, all companies ranked in the Global 100 Index are scored on a maximum of 14 key performance indicators (KPIs) covering environmental, socioeconomic and governance (ESG) factors, weighted differently according to the industry. (for more details about the Global 100 methodology visit the following weblink: https://www.corporateknights.com/wp-content/uploads/2017/01/2017-Global-100_Methodology-Final.pdf)
In short, the Global 100 Index is a CSR rating that ranks mid-, large- and mega-capitalized transnational companies and is less impacted by auditing biases than other such rankings because it is scored using industry-specific weighed KPIs and takes into account public corporate data and information. The ESG factors elaborated by the Global 100 are readily accessible to corporate stakeholders (for more details about the Global 100 annual ranking list as well as for insights visit the following website: http://www.corporateknights.com/reports/global-100/)through both Bloomberg and Reuters databases. Furthermore, this rating gives its constituents great visibility, enhancing their capacity to attract capital from socially responsible investors worldwide to support sustainable business investments/programs and bolster innovation geared towards cleaner production.
In our analysis, we take the Global 100 Index companies as the “best in class”, respectively, for each Global Industry Classification Standard (GICS) industry in terms of standards of CSR achieved in a given year. In our model, we set a binomial dependent variable that considers a company’s inclusion in the Global 100 Index because of highest annual CSP produced with respect to the overall mean. We then developed our statistical analysis focusing on the highest overall CSP global performers to find evidence that best emphasized the relationships stated in our research hypothesis.
In line with previous and recent studies [16,17,18,19], in our model we considered CFP as the independent variable (IV). In particular, we used Return on Assets (ROA) to quantify CFP because this measure is identified by the majority of studies as the cumulative accounting-based proxy for measuring these type of firms’ performance [19,55]. As innovation is a key driver in sustaining firms’ competitive advantage and growth [56], and in enhancing CSR and improving CSP in the long run [43,48,49] and also as suggested in prior studies [16,55,57,58,59], we included in our model firms’ R&D expenses scaled by Net Sales (such as the sum of gross sales and operating revenues less discounts, returns and allowances) to measure firms’ “innovation intensity,”. We included this composite variable as another explanatory variable in our analytical model because we assume that any increase in R&D expenses generally depends on the availability of enough financial resources and the company’s propensity to make this kind of investment. On the one hand, R&D expenses reflect resources invested to activate business innovation programs, and on the other, this value, scaled by Net Sales, determines the importance of R&D investments for a given business by expressing their level of intensity.
In the literature, there are various alternatives to estimate firms’ R&D investments, such as the price-to-research-ratio (PRR) [60], the price/growth flow [61] as well as the patents-per-R&D-expenses ratio. However, none of these measures is in line with our research aim. Thus, we focused our attention on the innovation intensity variable, as it measures how investments in R&D activities relate to company operations activities. It is an accounting-based measure, like the other parameters that characterize our analytical model, ROA and the book value of Total Assets. This is a proxy commonly used by scholars examining CFP—CSP relationships, which can measure a company’s efforts and strategic orientation to develop its business through the implementation of socially responsible innovative processes and production instrumental to the achievement of higher CFP and CSP.
In order to control for differences between sectors and capture related qualitative effects which may impact the analytical model, like the innovation intensity variable, we included industry dummy control variables (CVs) as suggested by prior studies [62,63]. There are differences among industries in terms of regulation and expected socially and environmentally responsible actions (i.e., each industry has its own regulations regarding environmental protection) that must be considered. Like the GICS, our model considers nine industrial sectors (energy, basic materials, industrials, consumer goods, consumer services, health care, information technology, telecommunication services, and utilities).
Since some previous studies have shown the existence of a relationship between firm size and CSP [62], we include in the analysis the “firm size” as another CV. In this study, firm size may be a determinant as it could affect stakeholders’ expectations and concerns regarding socially and environmentally responsible activities. Therefore, coherently with Waddock and Graves [16] we suppose that the larger the company, the higher stakeholders’ expectations for CSR. However, as stated by Dang et al. [64], by fine tuning the analysis, scholars have to identify a right measure of firm size within different available market and accounting-based proxies coherently with the topic and the main goal investigated. This is fundamental for avoiding possible biases in producing and interpreting empirical results. To this end, in line also with previous studies [46,55], we identified the natural logarithm of Total Assets, such as the proper measure of firm size to perform our analysis. In particular, the inclusion of this proxy in our model is justified because the present study focuses on the capacity of firms in producing CSP by generating and allocating appropriately its financial resources, i.e., boosting innovation activities.
The inclusion in our model of CVs, namely firm size and industry, supports the analysis to check for unobservable time-invariant firm/industry specific characteristics, e.g., firm culture, managerial capabilities, technology, sector competitiveness intensity, etc.
Furthermore, as the passing of time could affect relationships among the model variables, we include in the analysis a dummy CV to control for timing effects.
A sustainable organization implements long-term CSR strategies, as well as innovation activities to achieve its main goal, which is to create shared value for a large proportion of stakeholders and maintain it over time [6,12,48,49]. More specifically, in this analysis CSP (expressed in terms of inclusion in or exclusion from the Global 100 Index) was considered as a dependent variable for the years 2010–2014, while the independent variables—CFP and innovation intensity—and the control variables (Total Assets and Industry) were considered for the period 2009–2013. We assumed that each IV produces possible effects on CSP of subsequent years. Therefore, we set a one-year time lag between the DV, the IVs and the control variables in the model. This model setting aims to analyze the time-series lead-lag interactions between the predictor and the explanatory variables and to examine the possible virtuous cycle between previous CFP and R&D investments and successive CSP, as highlighted by prior studies [16,17,18,19,48].
Finally, we define our analytical model considering suggestions by [65] in order to mitigate plausible endogeneity effects within the variables, which are often due to both the nature of firm level data used and the probable reverse causal interactions between the predictor and the explanatory variables. In particular, below we describe our analytical model which composed of lagged explanatory variables (ROA and Innovation), the predictor computed as another lagged IV (Global100t−1), and the CVs (such as lagged firm size, industry and timing), namely:
where:
- ■
- i identifies the companies which were Global 100 Index constituents for at least one year in the period 2010–2014;
- ■
- t stands for the time covered by the analysis;
- ■
- Global100t is the dependent variable (DV), with a value of 1 or 0 depending on whether the firm is listed in the index or not at time t;
- ■
- is the value of the intercept characterizing the logistic regression line;
- ■
- , … represent each coefficient for every independent variable (IV);
- ■
- ROAt−1 is an IV proxy for the CFP at time t − 1;
- ■
- Innovationt−1 is another IV that measures corporate innovation intensity defined as the ratio between R&D expenses and Net Sales (or revenues) at time t − 1;
- ■
- ROA*Innovationt−1 is the composite IV included in the model to check for possible moderation effects at time t − 1;
- ■
- SIZEt−1 is the control variable (CV) for firm size measured by the natural logarithm of Total Assets at time t − 1;
- ■
- Global100t−1, which accounts for possible effects produced on the DV and the IVs by the previous inclusion/s in the index;
- ■
- Industry is a set of dummy variables included in the model to control for sector;
- ■
- Time is a set of dummy variables included in the model to control for the possible effect of time; and
- ■
- ε, which represents the disturbance term.
The following Table 2 summarizes main variables included in the analytical model in line to investigate the insights that emerged from both the prior research design and in the present section.
In order to test the main hypothesis defined in Section 2, we performed a logistic regression analysis using the analytical model shown above. We adopted this regression technique due to the binomial form of the DV, and to analyze whether the probability of a company’s inclusion in the Global 100 Index would be verified (DV is equal to 1) given the set of regressors included in the model.
Finally, to analyze whether innovation plays a mediating role in the relationship between CFP and CSP, we used the Sobel-Goodman [66] and Judd-Kenny [67,68] test to measure indirect mediation effects.
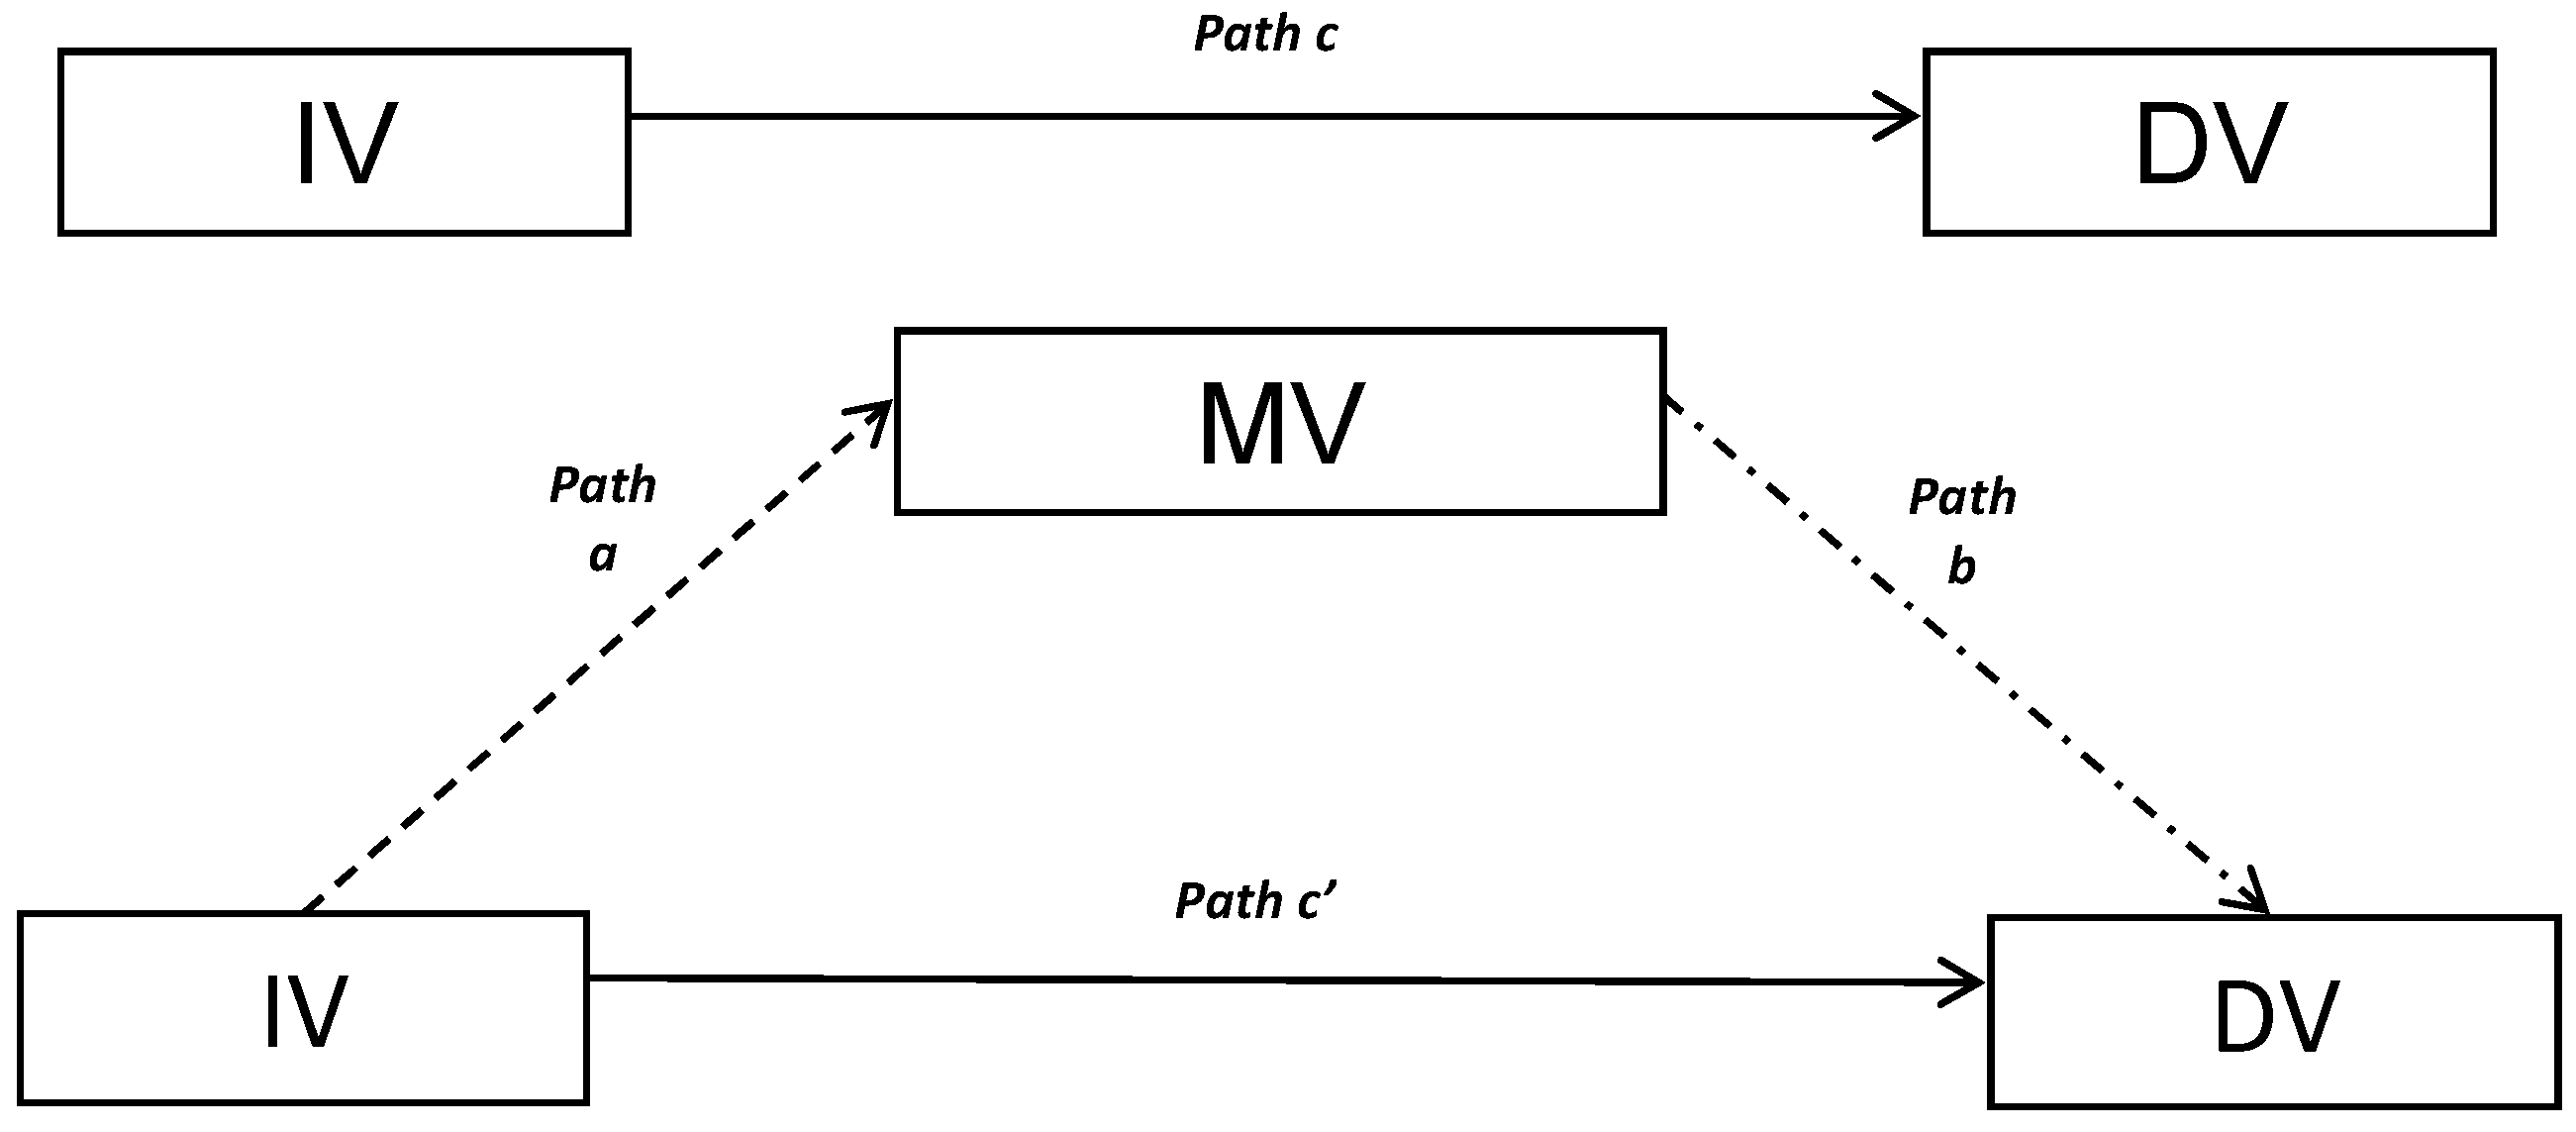
Moreover, to analyze the possible mediating role played by innovation in the relationship between ROA and inclusion in the Global 100 Index, we adopted the causal steps approach defined by previous studies [66,67,68]. This method is commonly used particularly in the social science literature to examine possible mediation effects in a causal chain of variables by means of serial tests [69]. In particular, the mediation analysis carried out in our study uses four sequential tests identified by the causal steps approach, as itemized and reported in Figure 6 below:
- The first test is a regression analysis investigating whether the IV produces a total effect on the potentially-mediated DV (the estimation of Path c, as shown in Figure 6);
- The second test analyzes possible correlation between the IV and the mediator (MV) (the estimation of Path a, as shown in Figure 6), using a regression equation in which M is the criterion variable and the IV is the predictor;
- The third test analyzes possible correlation between the MV and the DV, commonly known as the direct effect (the estimation of Path b in Figure 6);
- The last step of the mediation analysis involves a regression equation that estimates the IV’s possible effects on the DV controlling for the MV (the estimation of Path b and Path c’, as shown in Figure 6).
Finally, we performed Sobel-Goodman tests [66] to estimate the intensity of how the MV mediates the total effect produced by the IV on the DV. These analyses elaborated findings produced by the prior four sequential tests, with the final aim of quantifying the role played by the MV. In particular, Sobel-Goodman tests highlight an aspect of performance that allows us to understand the portion of total effect mediated. In particular, this is quantified by the ratio between indirect effects on total effect, specifically:
4. Results
The study summarized in this paper was developed in four steps:
- a descriptive statistical analysis of variables to better understand the composition of our sample;
- a Pearson correlation test on the variables that defined the analysis model;
- a logistic regression analysis followed by a collinearity diagnostic, useful to examine the sort of interaction assumed in the research hypotheses H1, H2, H3 and H4; and
For the Pearson correlation test and the logistic regression analysis, the level of significance was set at 5%. All statistical analyses were performed using STATA analytical software.
Table 3 reports the descriptive statistics for some of the relevant variables used in the study. Table 4 presents the correlation matrices of all the variables. Table 5 shows the level of correlations between 2010–2014 CSP data and the one-year-lagged financial data and other independent/control variables.
The findings of the Pearson correlation analyses indicate that CFP and CSP are significantly (at ρ < 0.05) and positively (ROA, r = 0.1740) correlated. Results shown in Table 3 indicate that innovation intensity is significantly (at ρ < 0.05) and positively correlated with both CFP (ROA, r = 0.1423) and CSP (Global100, r = 0.2734). Therefore, these results indirectly support H1, H2, and H3. Moreover, this test highlighted the interaction between CFP and innovation significantly (at ρ < 0.05) and positively affect CSP (ROAInnovation, r = 0.2112), confirming what stated in H4. Further, considering the output produced by Pearson analysis relatively to Global100t−1 it seems that prior CSP positively affect subsequent CSR outcomes (Global100t−1, r = 0.3156, at ρ < 0.05).
Finally, focusing on the possible unobservable effects produced by industry differences on CSP, the Pearson correlation test produced some interesting significant results, even though the interactions between variables performed weak coefficients. In particular, we observe that companies operating in energy (Energy, r = 0.0992) and industrial (Industrial, r = 0.0785) sectors appear to be inclined to achieve higher CSP. On the other hand, firms operating in industries such as basic materials (BaMat r = −0.0977) and consumer services (ConsS r = −0.1015) seem to be worse performers of CSP respect to other sectors.
However, to better understand the correlations shown in Table 4, it is necessary to compare these preliminary results with the evidence produced by the logistic regression analysis (see Table 5). Once correlation is demonstrated to exist between the variables, it can then be assumed, and regression analysis can be performed in order to test whether and how CFP and innovation are linked to CSP.
As shown in Table 5, the findings of the regression analysis provide evidence that prior CFP (2009–2013) has a positive effect on later CSP (2010–2014), thus supporting H1. In particular, ROA is positively correlated with CSP considering a confidence level of 95% (ρ = 0.001; α1 ≅ 0.07). This first result of logit regression confirms findings of prior studies that highlighted the positive interaction between CFPt−1—CSPtliterature being as well as an empirical evidence of slack resources theory [16,17,18,19].
The results of the analysis also confirm H3. Evidence in Table 5 shows that innovation is significantly and positively linked with the Global 100 Index (ρ = 0.006; α2 ≅ 1.18) as a proxy of CSP. This is another evidence perfectly in line with findings theoretically and empirically highlighted by prior studies about the key role played by innovation in the relationship between CFP-CSP [29,30,31,32,52,54,56].
A moderation analysis between ROA and Innovation on CSP was carried out, but similar with [30], the result scored a negative coefficient but not statistically significant (ρ = 0.393; α3 = −0.03). Therefore, we can reject H4. Nevertheless, on the light of the regression results we can state that firm size scored a negative coefficient but it is not a determinant able to affect DV (ρ = 0.10; α4 = −0.235), such as CSP, diversely to what stated in prior studies [55,62]. We suppose that this result is due to the sample of our analysis characterized by biggest corporations that are quietly different in terms of firm size.
On the other hand, considering the regression outcomes relatively to the variable Global100t−1 (ρ = 0.008; α5 = 0.72), we could state that the annual inclusion of a firm in the Global 100 Index supposedly could be a driver to stimulate managers and stakeholder in supporting continue improvements in firms’ CSP year by year.
The regression analysis also highlighted that being part of a given industry affects a firm’s financial performance and, consequently, its socially and environmentally responsible activities. In particular, as shown in Table 5, results indicate that operating in the Energy sector (ρ = 0.038) has a significant effect on the dependent variable.
Regarding to the effect of time on the dependent variable, the overall trend is statistically significant. In particular, as shown in Table 5, each year of the period analyzed is significantly correlated with the Global 100 (ρ < 0.05) scoring different signs as well. This result evidences that some of the variation in our data model due to unobserved events that took place those years critically affected the inclusion of firms in the Global 100 ranking.
The robustness of these results was tested through a collinearity analysis that confirms, as shown in Table 6a,b, the absence of multicollinearity within our model. The variance inflation factors (VIF) of variables examined are very low [70] and equal about 1.
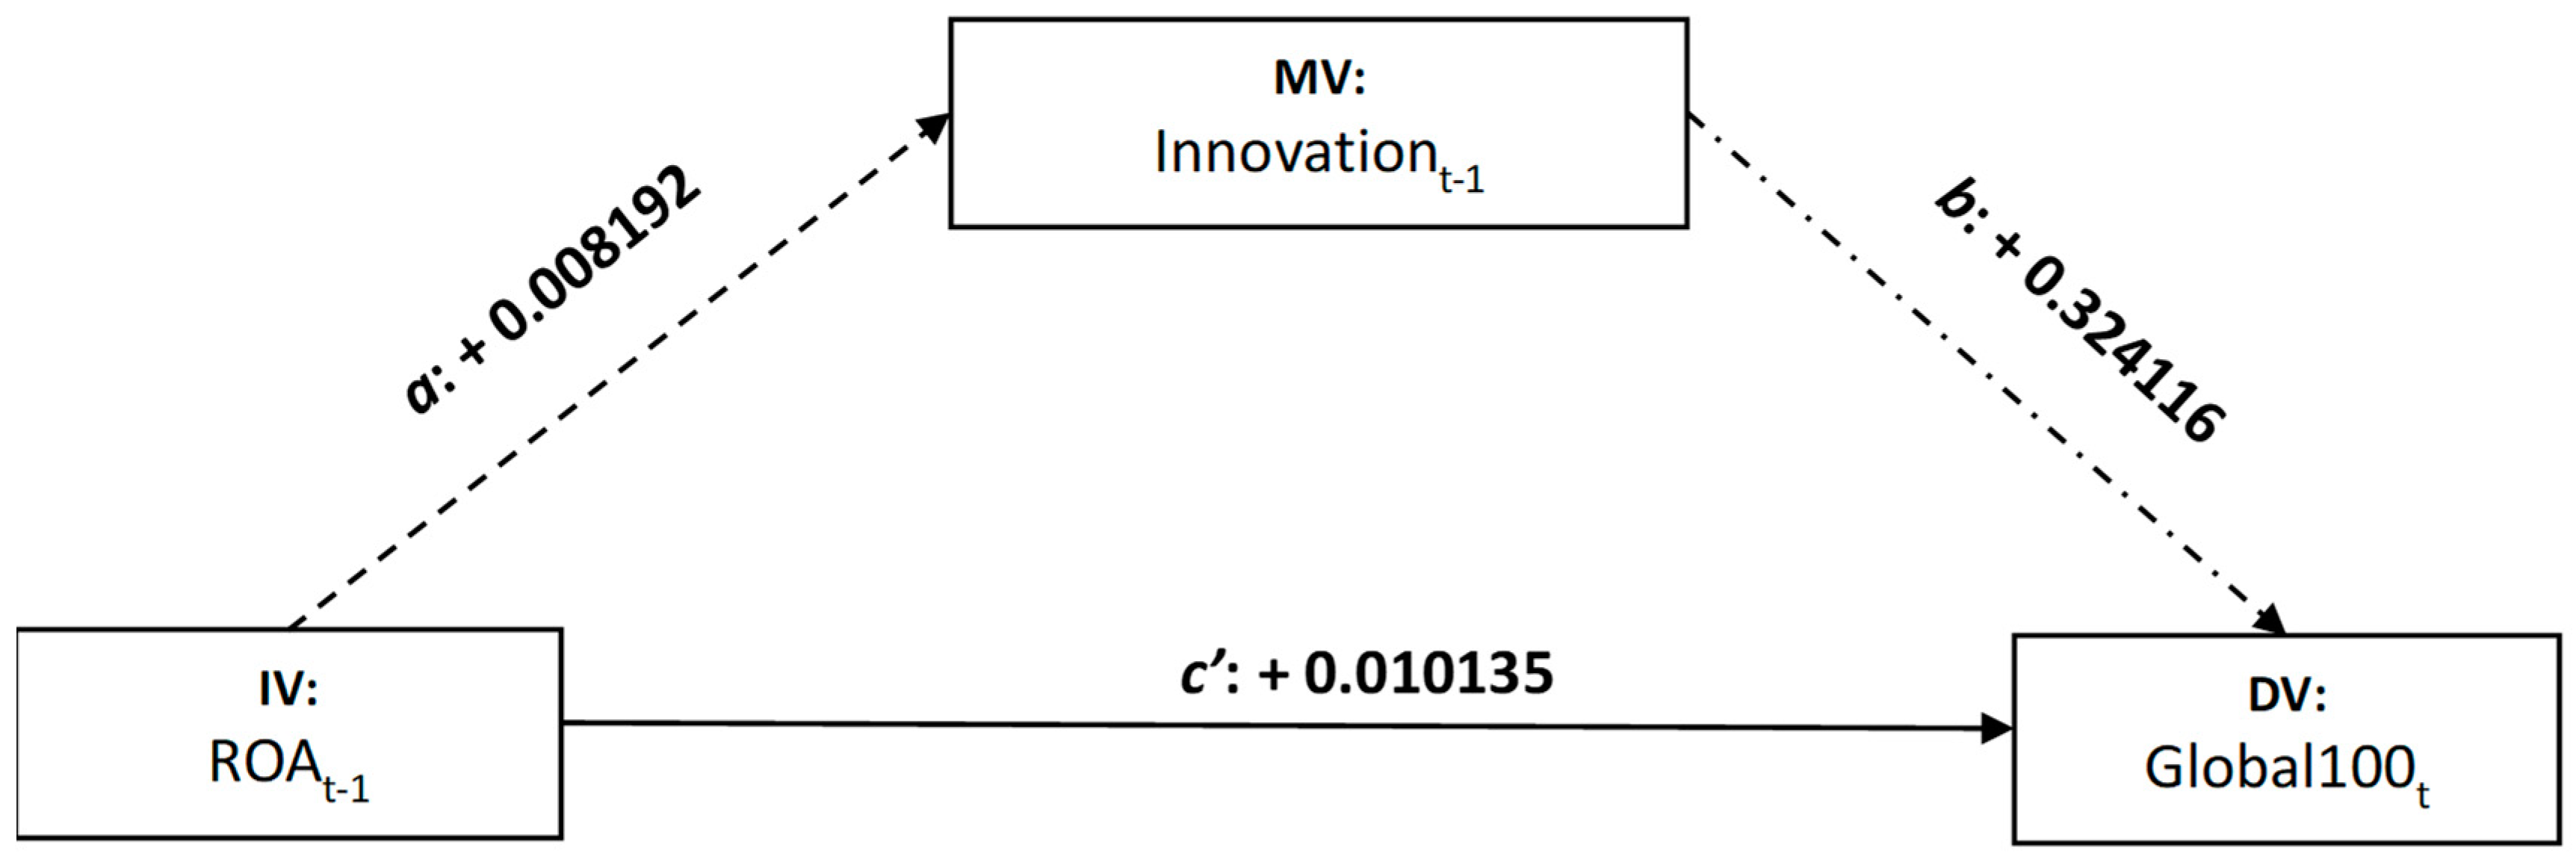
Finally, a Sobel-Goodman [66] test was performed to analyze the interaction between CFP (i.e., ROA) and Innovation, and the effect on CSP (i.e., inclusion in the Global 100 Index). The results, shown in Table 7 and summarized in Figure 7 and Figure 8, highlight that innovation plays an important partial mediation role in the relationship between CFP and CSP.
Furthermore, according to the results of the Sobel-Goodman [66] mediation tests shown in Table 8, innovation partially mediates about 20% (≅0.20760143) of the total effect of CFP on CSP. The partial mediation in our case is justified because the effect of ROA on Global 100 still exist but in a smaller magnitude if we compare the total and direct effect. This result partially supports H5.
5. Discussion and Conclusions
Several studies have examined the relationship between CFP and CSP, showing a mixed interaction [20,21]. These findings suggest that there is a need for further empirical analysis. Although many studies support the idea that CSR activities could help companies to establish a competitive advantage over their rivals, as these activities enhance reputation [12,22,56], foster innovation, attract talents and increase customer and investor loyalty (among other things), managers need reliable and valid evidence to adopt CSR practices. Managers implement CSR activities only if this contributes to increase firms’ financial performance. In this paper, considering the multidimensionality of firms’ performance we have adopted a different perspective. CSR is a managerial area whose performance are as much relevant as financial performance. In managing firms, it is important to allocate the limited financial resources in different investments able to satisfy all stakeholders’ expectations and not only shareholders. Therefore, our main aim has been to understand if and how availability of financial resources affects firms’ CSP. In particular, we have analyzed the hypothesized positive relationship between CFP and CSP, and the potential impact of innovation directly on CSP and as a mediator between CFP and CSP. The proxy measure for CSP was the listing of firms in the Global 100 Index, which ranks the top 100 most sustainable listed companies in the world each year based on twelve key performance indicators. The proxy measure for CFP was ROA. Innovation was defined as the amount of money that companies are investing in R&D as a percentage of their revenues. We tested the CFP-CSP relationship using the Pearson correlation test and a logistic regression analysis on a sample built using companies listed at least once in the Global 100 Index. The study used extensive data covering a five-year period for both CFP (2009–2013) and CSP (2010–2014).
The contribution of this paper is two-fold. Firstly, based on findings of the logistic regression, we can state that there is a positive and significant correlation between CFP and CSP. Even if CSP are many times immaterial, their production implies to consume resources, financial and non-financial, which need to be coordinated along the production process. Therefore, firms need to dispose sufficient financial resources and to manage them appropriately to pursue CSR objectives. Consequently, CSR activities needs to be systematically planned as any other firm’s activity and adequately financed to reach its objectives. In this way, to satisfy the different stakeholders’ needs managers have to put more and more attention at the strategic level on CSR activities in order to make a selection of the CSR activities to invest on and to manage adequately the available resources to reach both financial and social objectives. According to Boesso and Michelon [71], a comprehensive CSR strategy addressing all potential social issues could be too much expensive and result in the creation of tension within firms between their financial and social performance. CSR has become pervasive at the social level, firms cannot resist any more to the call for a CSR-oriented change of their set of activities, products, and processes but this change must be strategically governed. Any resistance could result exclusively in an increasing inefficiency in pursuing CSP. From our analysis is evident that a CSR-oriented change in firms’ culture could be the way to step up the process for achieving CSP more easily. The listing in the Global 100 enhance the probability of a firm to reach a certain level of CSP also the next year. This confirms what is argued by Porter and Kramer [12,56]: that to be successful in the long-term firms should learn to plan and implement policies able to create shared value rather than focusing on the tension between financial and non-financial performance. From a practical point of view, a CSR-oriented strategy should be supported by the implementation of a managerial reward system that foster the balanced pursuing of both financial objectives and CSP. Managerial reward system should consider financial and non-financial objectives as interdependent and not as mutually exclusive [23].
Secondly, our analysis highlighted that the more profitable companies are, and the more available resources they have invested in R&D, the more effective their innovative activities become in producing social performance. This suggests that the firms that perform best in terms of CFP and invest their slack financial resources in innovation are more likely to improve their CSP. Investments in R&D can increase firms’ capacity and competence to develop processes and products able to contribute directly or indirectly to the satisfaction of stakeholders’ needs at the highest possible level without offending shareholders and managers’ interests. Thus, our analysis produced a result in line with the findings of some prior studies [16,17,18,19]. In firms with higher levels of CSP, managers tend to pursue profitability more than sales maximization, and to invest in innovation-oriented activities that could increase companies’ market value in the long-term [72]. Managers seem more prone to meet more the interest of the stakeholders and shareholders compared to theirs. A good manager could be perceived as such not because of his capacity to increase firm profitability or firm market share but also because of his capacity to pursue CFP and CSP jointly. The positive relationship between CFP and CSP sustains the idea that in firms with a strong CSR approach and high CSP managers may be more oriented to emphasize profit over sales maximization. The continuous call for a CSR-focused orientation could lead managers to maximize companies’ profits in order to guarantee the availability of enough resources to satisfy both shareholders’ financial expectations and stakeholders’ non-financial requests.
As our analysis shows, innovation is a critical factor in the relationship between CFP and CSP. In particular, innovation has more of a mediating than moderating role between CFP and CSP. This indicates that managers who implement CSR strategies should enhance their companies’ level of innovation intensity to increase the probability of achieving a higher level of CSP. Innovation should increase firms’ flexibility to better and more rapidly respond to requests from their stakeholders. This is particularly true when companies try to engage stakeholders in defining innovation policy [73]. Furthermore, the availability of financial resources and investments in innovation must be appropriately managed in order to produce CSP over time. CSR activities need to be continuously supported to produce effects. Therefore, it is possible to assert that in order to pursue higher CSP, managers should invest available financial resources in innovation. The relevance of innovation in mediating the relationship between CFP and CSP could support the idea to include KPIs of firms’ innovation activities to measure their level of CSR confidence. The joint evaluation of KPIs related to firms’ financial results and their innovation activities could give the possibility to forecast future firms’ CSP. In this way, there would be the possibility to distinguish firms with a CSR strategic-oriented approach from those just responsive [54].
An additional result coming from our analysis is related to the industries firms belongs. Differently from Padgett and Galan [52] which stated that innovation affect CSR in manufacturing industries compared to non-manufacturing, our analysis shows that the achievement of higher CSP does not depend on the economic sector within which a company operates, apart from those in the energy sector. The increasing call and rhetoric for a CSR-focused orientation of companies has permeated all economic sectors. Companies in the energy sector could be more sensitive to a CSR rhetoric because of their high potential impact on the availability of scarce resources (e.g., fossil fuels) and/or the necessity to appropriately manage renewable resources to guarantee their regeneration (e.g., water).
There are some caveats to the results reported in this paper. First, the sample analyzed is made up of companies listed in the Global 100 because of their high level of CSP, which could produce a selection bias. Second, resources were measured using only accounting-based figures; further investigation should consider market-based measures in order to widen the perspective on firm performance. Another limitation relates to the specific period covered in the analysis, a period characterized by a profound financial crisis. It would be worthwhile to analyze a different period to confirm whether the relationship examined in the paper holds true in the anon-crisis period, and to check for any effects on the strength of the linkage.
Although our analysis focused on a sample of the largest multinational NFCs, the insights highlighted in this study suggest that not only a financial justification, but also an innovation-oriented strategic CSR approach, may be necessary to maximize CSP. Managers and corporate stakeholders can no longer neglect this important interaction if they intend to establish a virtuous cycle that is determinant for firm growth. Corporate stakeholders should consider this a crucial management issue not only for large companies, but particularly for small/medium enterprises (SMEs), which aim to implement CSR strategies that enhance CSP and support sustainable development as well. The results of our analysis highlight the need to govern the financial dimension of SMEs in such a way as to increase their capacity to implement CSR-oriented activities and achieve higher CSP. SMEs are usually more localized and, thus, sensitive to social issues, but this inclination may be hindered by a dearth of available resources. This same lack of resources also makes it impossible to finance continuously and systematically innovation processes. These factors, taken together, can impede the achievement of good CSP. Therefore, in order to improve CSP, SMEs may need to rethink their financing in order to have greater availability of financial resources and be more active in terms of CSR and, consequently, achieve better performance with regard to social responsibility.
The results of this paper suggest some areas for further research. In particular, the analysis points out that the role of innovation, although partial, is important in terms of mediation between CFP and CSP. Innovation activities could be considered strategic management efforts geared towards catalyzing firms’ resources to achieve higher sustainable-shared value, activating and sustaining a virtuous cycle between CFP and CSP [16,74,75]. Therefore, managers have a strong indication to invest resources in a manner that increases their likelihood to improve CSP in the long term. As some other scholars suggest [76], future research should focus both on defining the types of innovation activities (or an optimal mix of them) that could best drive financial resources to maximize the probability of higher CSP, and on understanding what other drivers could mediate or catalyze virtuous cycles between CFP and CSP. Another important aspect to investigate is the existence and strength of relationships between CFP, innovation and CSP in SMEs.
Author Contributions
Funding
This research received no external funding.
Conflicts of Interest
The authors declare no conflict of interest.
References
- Scherer, A.G.; Palazzo, G. The New Political Role of Business in a Globalized World: A Review of a New Perspective on CSR and its Implications for the Firm, Governance, and Democracy. J. Manag. Stud. 2011, 48, 899–931. [Google Scholar] [CrossRef] [Green Version]
- Visser, W. The Age of Responsibility: CSR 2.0 and the New DNA of Business. J. Bus. Syst. Gov. Ethics 2010, 5, 7–22. [Google Scholar] [CrossRef]
- Svensson, G. ‘Glocalization’ of business activities: A ‘glocal strategy’ approach. Manag. Decis. 2001, 39, 6–18. [Google Scholar] [CrossRef]
- Windsor, D. The Future of Corporate Social Responsibility. Int. J. Org. Anal. 2001, 9, 225–256. [Google Scholar] [CrossRef]
- Donaldson, T.; Preston, L.E. The Stakeholder Theory of the Corporation: Concepts, Evidence, and Implications. Acad. Manag. Rev. 1995, 20, 65–91. [Google Scholar] [CrossRef]
- Freeman, R.E. Strategic Management: A Stakeholder Approach; Pitman: Boston, MA, USA, 1984; ISBN 978-0-521-15174-0. [Google Scholar]
- Kopnina, H. Sustainability: New strategic thinking for business. Environ. Dev. Sustain. 2015, 19, 27–43. [Google Scholar] [CrossRef]
- Doane, D. The myth of CSR-The problem with assuming that companies can do well also doing good is that markets do not really work that way. Stanf. Soc. Innov. Rev. 2005, 21–29. Available online: https://ssir.org/articles/entry/the_myth_of_csr (accessed on 7 February 2018).
- Crane, A.; Matten, D.; Spence, L.J. (Eds.) Corporate Social Responsibility in a Global Context. In Corporate Social Responsibility: Readings and Cases in a Global Context, 2nd ed.; Routledge: Abingdon, UK, 2014; pp. 3–26. ISBN 978-0-415-68324-1. [Google Scholar]
- Aguinis, H.; Glavas, A. What We Know and Don’t Know About Corporate Social Responsibility: A Review and Research Agenda. J. Manag. 2012, 38, 932–968. [Google Scholar] [CrossRef]
- Kemper, J.; Schilke, O.; Reimann, M.; Wang, X.; Brettel, M. Competition-motivated corporate social responsibility. J. Bus. Res. 2013, 66, 1954–1963. [Google Scholar] [CrossRef]
- Porter, M.E.; Kramer, M.R. Strategy and Society: The Link between Competitive Advantage and Corporate Social Responsibility. Harv. Bus. Rev. 2006, 78–93. Available online: https://hbr.org/2006/12/strategy-and-society-the-link-between-competitive-advantage-and-corporate-social-responsibility (accessed on 16 January 2018).
- Borghesi, R.; Houston, J.F.; Naranjo, A. Corporate socially responsible investments: CEO altruism, reputation, and shareholder interests. J. Corp Financ. 2014, 26, 164–181. [Google Scholar] [CrossRef]
- Goyal, P.; Rahman, Z.; Kazmi, A.A. Corporate sustainability performance and firm performance research. Literature review and future research agenda. Manag. Decis. 2013, 51, 361–379. [Google Scholar] [CrossRef]
- Alshehhi, A.; Nobanee, H.; Khare, N. The impact of sustainability practices on corporate financial performance: Literature trends and future research potential. Sustainability 2018, 10, 494. [Google Scholar] [CrossRef]
- Waddock, S.A.; Graves, S.B. The corporate social performance financial performance link. Strateg. Manag. J. 1997, 18, 303–319. [Google Scholar] [CrossRef]
- Preston, L.E.; O’Bannon, D.P. The corporate social-financial performance relationship: A typology and analysis. Bus. Soc. 1997, 36, 419–429. [Google Scholar] [CrossRef]
- Testa, M.; D’Amato, A. Corporate environmental responsibility and financial performance: Does bidirectional causality work? Empirical evidence from the manufacturing industry. Soc. Responsib. J. 2017, 13, 221–234. [Google Scholar] [CrossRef]
- Melo, T. Slack-resources hypothesis: A critical analysis under a multidimensional approach to corporate social performance. Soc. Responsib. J. 2012, 8, 257–269. [Google Scholar] [CrossRef]
- Margolis, J.D.; Walsh, J.P. Misery loves companies: Rethinking social initiatives by business. Adm. Sci. Q. 2003, 48, 268–305. [Google Scholar] [CrossRef]
- Lu, W.; Chau, K.; Wang, H.; Pan, W. A decade’s debate on the nexus between corporate social and corporate financial performance: A critical review of empirical studies 2002–2011. J. Clean. Prod. 2014, 79, 195–206. [Google Scholar] [CrossRef] [Green Version]
- Wood, D.J. Corporate Social Performance Revisited. Acad. Manag. Rev. 1991, 16, 691–718. [Google Scholar] [CrossRef]
- Merchant, K.A.; van der Stede, W.A. Management Control Systems. In Performance Measurements, Evaluation and Incentives, 2nd ed.; Pearson: London, UK, 2007; ISBN 978-0-273-73761-2. [Google Scholar]
- Baumol, W.J. On the Theory of Expansion of the Firm. Am. Econ. Rev. 1962, 52, 1078–1087. Available online: https://www.jstor.org/stable/1812183 (accessed on 17 January 2018).
- Boesso, G.; Kumar, K.; Michelon, G. Descriptive, instrumental and strategic approaches to corporate social responsibility: Do they drive the financial performance of companies differently? Account. Audit. Account. J. 2013, 26, 399–422. [Google Scholar] [CrossRef]
- Berkhout, G.; van der Duin, P.; Hartmann, D.; Ortt, R. Innovation Takes Time: The Role of Futures Research in CIM. In The Cyclic Nature of Innovation: Connecting Hard Sciences with Soft Values; Berkhout, G., van der Duin, P., Hartmann, D., Ortt, R., Eds.; Emerald: San Diego, CA, USA, 2007; pp. 71–85. ISBN 978-0-7623-1336-5. [Google Scholar]
- Carroll, A.B.; Shabana, K.M. The Business Case for Corporate Social Responsibility: A Review of Concepts, Research and Practice. Int. J. Manag. Rev. 2010, 12, 85–105. [Google Scholar] [CrossRef] [Green Version]
- Gobble, M.M. Innovation and strategy. Res. Technol. Manag. 2012, 55, 63–67. [Google Scholar] [CrossRef]
- Martinez-Conesa, I.; Soto-Acosta, P.; Palacios-Manzano, M. Corporate social responsibility and its effect on innovation and firm performance: An empirical research in SMEs. J. Clean. Prod. 2017, 142, 2374–2383. [Google Scholar] [CrossRef]
- Blanco, B.; Guillamón-Saorín, G.; Guiral, A. Do Non-socially Responsible Companies Achieve Legitimacy Through Socially Responsible Actions? The Mediating Effect of Innovation. J. Bus. Ethics 2010, 117, 67–83. [Google Scholar] [CrossRef]
- Guiral, A. Corporate social performance, innovation intensity and their impacts on financial performance: Evidence from lending decisions. Behav. Res. Account. 2012, 24, 65–85. [Google Scholar] [CrossRef]
- Surroca, J.; Tribo, J.A.; Waddock, S. Corporate responsibility and financial performance: The role of intangible resources. Strateg. Manag. J. 2010, 31, 463–490. [Google Scholar] [CrossRef] [Green Version]
- Valor, C. Corporate Social Responsibility and Corporate Citizenship: Towards Corporate Accountability. Bus. Soc. Rev. 2005, 110, 191–212. [Google Scholar] [CrossRef] [Green Version]
- Gjølberg, M. Measuring the immeasurable? Constructing an index of CSR practices and CSR performance in 20 countries. Scand. J. Manag. 2009, 25, 10–12. [Google Scholar] [CrossRef]
- Wang, S. Literature Review of Corporate Social Responsibility. In Chinese Strategic Decision-Making on CSR; Wang, S., Ed.; Springer: Berlin, Germany, 2015; pp. 7–28. ISBN 978-3-662-44996-7. [Google Scholar]
- Garriga, E.; Melé, D. Corporate Social Responsibility theories: Mapping the Territory. J. Bus. Ethics 2004, 53, 51–74. [Google Scholar] [CrossRef]
- Maon, F.; Lindgreen, A.; Swaen, V. Designing and Implementing Corporate Social Responsibility: An Integrative Framework Grounded in Theory and Practice. J. Bus. Ethics 2009, 87, 71–89. [Google Scholar] [CrossRef]
- Branco, M.C.; Rodrigues, L.L. Corporate Social Responsibility and resource-based perspectives. J. Bus. Ethics 2006, 69, 111–132. [Google Scholar] [CrossRef]
- Du, S.; Bhattacharya, C.; Sen, S. Corporate Social Responsibility and Competitive Advantage: Overcoming the Trust Barrier. Manag. Sci. 2011, 57, 1528–1545. [Google Scholar] [CrossRef] [Green Version]
- Teece, D.J.; Pisano, G.; Shuen, A. Dynamic capabilities and strategic management. Strateg. Manag. J. 1997, 18, 509–533. Available online: https://links.jstor.org/sici?sici=0143-2095%28199708%2918%3A7%3C509%3ADCASM%3E2.0.CO%3B2-%23 (accessed on 23 January 2018). [CrossRef] [Green Version]
- Greenley, G.E.; Oktemgil, M. A Comparison of Slack Resources in High and Low Performing British Companies. J. Manag. Stud. 1998, 35, 377–398. [Google Scholar] [CrossRef]
- Gray, C.S. Modern Strategy; Oxford University Press: Oxford, UK, 1999; ISBN 978-0198782513. [Google Scholar]
- Artiach, T.; Lee, D.; Nelson, D.; Walker, J. The determinants of corporate sustainability performance. Account. Financ. 2010, 50, 31–51. [Google Scholar] [CrossRef]
- Orlitzky, M.; Schmidt, F.L.; Rynes, S.L. Corporate social and financial performance: A meta-analysis. Organ. Stud. 2003, 24, 403–441. [Google Scholar] [CrossRef]
- Surroga, J.; Tribò, J.A. Managerial Entrenchment and Corporate Social Performance. J. Bus. Financ. Account. 2008, 35, 748–789. [Google Scholar] [CrossRef] [Green Version]
- Ullmann, A.A. Data in search of a theory: A critical examination of the relationships among social performance, social disclosure, and economic performance of US firms. Acad. Manag. Rev. 1985, 10, 540–557. [Google Scholar] [CrossRef]
- Grant, R. Contemporary Strategy Analysis, 7th ed.; Wiley: London, UK, 2010; ISBN 978-0-470-74710-0. [Google Scholar]
- Gallego-Alvarez, I.; Prado-Lorenzo, J.M.; Garcıa-Sanchez, I.-M. Corporate social responsibility and innovation: A resource-based theory. Manag. Decis. 2011, 49, 1709–1727. [Google Scholar] [CrossRef]
- McWilliams, A.; Siegel, D. Corporate social responsibility and financial performance: Correlation or misspecification? Strateg. Manag. J. 2000, 21, 603–609. [Google Scholar] [CrossRef]
- Stiglitz, J.E. Learning to Learn, Localized Learning and Technological Progress. In Economic Policy and Technological Performance; Dasgupta, P., Stoneman, P., Eds.; Cambridge University Press: Cambridge, MA, USA, 1987; pp. 125–153. ISBN 978-0521022217. [Google Scholar]
- Mañez, J.A.; Rochina-Barrachina, M.E.; Sanchis, A.; Sanchis, J.A. The Role of Sunk Costs in the Decision to Invest in R&D. J. Ind. Econ. 2009, 57, 712–735. [Google Scholar] [CrossRef]
- Padgett, R.C.; Galan, J.I. The effect of R&D intensity on corporate social responsibility. J. Bus. Ethics 2010, 93, 407–418. [Google Scholar] [CrossRef]
- Brammer, S.; Millington, A. Does it pay to be different? An analysis of the relationship between corporate social and financial performance. Strateg. Manag. J. 2008, 29, 1325–1343. [Google Scholar] [CrossRef]
- Boucquet, R.; Le Bas, C.; Mothe, C.; Poussing, N. Are firms with different CSR profiles equally innovative? Empirical analysis with survey data. Eur. Manag. J. 2013, 31, 642–654. [Google Scholar] [CrossRef] [Green Version]
- Callan, S.J.; Thomas, M.J. Corporate Financial Performance and Corporate Social Performance: An Update and Reinvestigation. Corp Soc. Responsib. Environ. Manag. 2009, 16, 61–78. [Google Scholar] [CrossRef]
- Porter, M.E.; Kramer, M.R. Creating shared value. How to reinvent capitalism—And unleash a wave of innovation and growth. Harv. Bus. Rev. 2011, 1–17. Available online: https://hbr.org/2011/01/the-big-idea-creating-shared-value (accessed on 13 March 2018).
- Kim, T.H.; Kim, B. Firm’s Environmental Expenditure, R&D Intensity, and Profitability. Sustainability 2018, 10, 2071. [Google Scholar] [CrossRef]
- Garcia-Castro, R.; Ariño, M.A.; Canela, M.A. Does Social Performance Really Lead to Financial Performance? Accounting for Endogeneity. J. Bus. Ethics 2010, 92, 107–126. [Google Scholar] [CrossRef]
- Barnett, M.L.; Salomon, R.M. Does it pay to be really good? Addressing the shape of the relationship between social and financial performance. Strateg. Manag. J. 2012, 33, 1304–1320. [Google Scholar] [CrossRef]
- Fisher, K.L. Super Stocks; Dow Jones-Irwin: New York, NY, USA, 1984; ISSN 0-07-149981–4. [Google Scholar]
- Murphy, M. Every Investor’s Guide to High-tech Stocks & Mutual Funds: Proven Strategies for Picking High-Growth Winners, 2nd ed.; Broadway Books: Portland, OR, USA, 1998; ISBN 978-0767903301. [Google Scholar]
- Andersen, M.L.; Dejoy, J.S. Corporate social and financial performance: The role of size, industry, risk, R&D and advertising expenses as control variables. Bus. Soc. Rev. 2011, 116, 237–256. [Google Scholar] [CrossRef]
- Hull, C.E.; Rothenberg, S. Firm performance: The interactions of corporate social performance with innovation and industry differentiation. Strateg. Manag. J. 2008, 29, 781–789. [Google Scholar] [CrossRef]
- Dang, C.; Li, F.; Yang, C. Measuring firm size in empirical corporate finance. J. Bank. Financ. 2018, 86, 159–176. [Google Scholar] [CrossRef]
- Li, F. Endogeneity in CEO power: A survey and experiment. Investig. Anal. J. 2016, 45, 149–162. [Google Scholar] [CrossRef]
- Sobel, M.E. Asymptotic Confidence Intervals for Indirect Effects in Structural Equation Models. Sociol. Methodol. 1982, 13, 290–312. [Google Scholar] [CrossRef]
- Judd, C.M.; Kenny, D.A. Process analysis: Estimating mediation in treatment evaluations. Eval. Rev. 1981, 5, 602–619. [Google Scholar] [CrossRef]
- Judd, C.M.; Kenny, D.A. Estimating the Effects of Social Interventions; Cambridge University Press: Cambridge, UK, 1981. [Google Scholar]
- MacKinnon, D.P.; Lockwood, C.M.; Hoffman, J.M.; West, S.G.; Sheets, V. A comparison of methods to test mediation and other intervening variable effects. Psychol. Methods 2002, 7, 83–104. [Google Scholar] [CrossRef] [PubMed]
- Diamantopoulos, A.; Siguaw, J.A. Formative versus reflective indicators in organizational measure development: A comparison and empirical illustration. Br. J. Manag. 2006, 17, 263–282. [Google Scholar] [CrossRef]
- Boesso, G.; Michelon, G. The Effects of Stakeholder Prioritization on Corporate Financial Performance: An Empirical Investigation. Int. J. Manag. 2010, 27, 470–496. Available online: https://www.questia.com/library/journal/1P3-2184287391/the-effects-of-stakeholder-prioritization-on-corporate (accessed on 15 March 2018).
- Xueming, L.; Bhattacharya, C.B. Corporate Social Responsibility, Customer Satisfaction, and Market Value. J. Mark. 2006, 70. [Google Scholar] [CrossRef]
- Steiner, G. Supporting sustainable innovation through stakeholder management: A systems view. Int. J. Innov. Learn. 2008, 5, 595–616. [Google Scholar] [CrossRef]
- Xiong, B.; Lu, W.; Skitmore, M.; Chau, K.W.; Ye, M. Virtuous nexus between corporate social performance: A study of construction enterprises in China. J. Clean. Prod. 2016, 129, 223–233. [Google Scholar] [CrossRef]
- Lee, Y.; Hu, J. Integrated approaches for business sustainability: The perspective of corporate social responsibility. Sustainability 2018, 10, 2318. [Google Scholar] [CrossRef]
- Javed, M.; Rashid, M.A.; Hussain, G. When does it pays to be good—A contingency perspective on corporate social and financial performance: Would it work? J. Clean. Prod. 2016, 133, 1062–1073. [Google Scholar] [CrossRef]
Figure 1.
H1: Previous CFP has a direct positive impact on subsequent CSP. Source: Authors’ elaboration.
Figure 1.
H1: Previous CFP has a direct positive impact on subsequent CSP. Source: Authors’ elaboration.

Figure 2.
H2: CFP have a positive impact on corporate innovation. Source: Authors’ elaboration.

Figure 3.
H3: Innovation have a positive impact on CSP. Source: Authors’ elaboration.

Figure 4.
H4: Innovation is a moderating factor between CFP and CSP. Source: Authors’ elaboration.

Figure 5.
H5: Innovation is a mediating factor of the relationship between CFP and CSP. Source: Authors’ elaboration.
Figure 5.
H5: Innovation is a mediating factor of the relationship between CFP and CSP. Source: Authors’ elaboration.

Figure 6.
The four causal steps method for mediation analysis. Source: Authors’ elaboration.

Figure 7.
The total effect produced by ROA on Global 100. Source: Authors’ elaboration.

Figure 8.
The indirect effect of ROA on Global 100 partially mediated by innovation. Source: Authors’ elaboration.
Figure 8.
The indirect effect of ROA on Global 100 partially mediated by innovation. Source: Authors’ elaboration.


Table 1.
Sample industry distribution.
| Industry | Freq. | % | Cum. |
|---|---|---|---|
| Basic Materials | 21 | 12.73 | 12.73 |
| Consumer Goods | 33 | 20.00 | 32.73 |
| Consumer Services | 9 | 5.45 | 38.18 |
| Energy | 17 | 10.30 | 48.48 |
| Healthcare | 16 | 9.70 | 58.18 |
| Industrial | 21 | 12.73 | 70.91 |
| Technology | 24 | 14.55 | 85.46 |
| Telecommunication | 14 | 8.48 | 93.94 |
| Utilities | 10 | 6.06 | 100 |
| Total | 165 | ||
Table 2.
Main variables investigated.
| Variable | Definition | Role Played in the Regression |
|---|---|---|
| Global100t | The dummy variable set to examine the firm’s inclusion in the Global 100 ranking, as a proxy of higher CSP produced annually. | DV |
| Innovationt−1 | The selected accounting-based proxy of corporate innovation measured by R&D Expenses/Net Sales. | IV |
| ROAt−1 | The Return on Assets is the accounting measure used as a proxy of CFP. | IV |
| ROA*Innovationt−1 | The composite variable useful to check for possible moderation effects produced by the interaction between CFP and Innovation on CSP. | CV |
| SIZEt−1 | The book value of Total Assets computed in natural logarithmic form to normalize data, such as the accounting-based proxy of firm size. | CV |
| Global100t−1 | The lagged DV included in the model to control for possible observable and unobservable effects produced by past CSP on the predictor and the explanatory variables. | CV |
| Industry | A set of dummy variables useful to check for possible qualitative effects produced by industry differences on the relationships between CFP and CSP. | CV |
| Time | A set of dummy annual variables defined in order to tackle possible timing unobservable effects in the model. | CV |
Table 3.
Descriptive statistics.
| Variable | Mean | Median | SD | Variance | Max | Min | Skewness | Kurtosis |
|---|---|---|---|---|---|---|---|---|
| GLOBAL100 | 0.4315152 | 0 | 0.4955881 | 0.2456075 | 1 | 0 | 0.2765458 | 1.076478 |
| ROA | 6.108953 | 5.273361 | 6.742166 | 45.4568 | 40.04038 | −24.41184 | 0.5455895 | 6.621968 |
| Innovation | 0.2378246 | 0 | 0.3880432 | 0.1505775 | 0.9409684 | 0 | 1.024556 | 2.065619 |
| SIZE | 23.42814 | 23.47372 | 1.311754 | 1.7207 | 27.05026 | 19.74242 | −0.0653461 | 2.713501 |
Table 4.
Pearson correlation analysis.
| Global 100 | ROA | Innovation | ROAInnovation | SIZE | Global100t−1 | BaMat | ConsG | ConsS | Energy | HealthCare | Industrial | Tech | Telecom | Utilities | |
|---|---|---|---|---|---|---|---|---|---|---|---|---|---|---|---|
| Global 100 | 1.00 | ||||||||||||||
| ROA | 0.1740 * | 1.00 | |||||||||||||
| Innovation | 0.2734 * | 0.1423 * | 1.00 | ||||||||||||
| ROAInnovation | 0.2112 * | 0.4673 * | 0.6983 * | 1.00 | |||||||||||
| SIZE | 0.0714 * | −0.1646 * | 0.1042 * | −0.0468 | 1.00 | ||||||||||
| Global100t−1 | 0.3156 * | 0.1412 * | 0.6090 * | 0.4264 * | 0.0848 * | 1.00 | |||||||||
| BaMat | −0.0977 * | −0.1375 * | −0.0620 | −0.0222 | −0.1923 * | −0.0918 * | 1.00 | ||||||||
| ConsG | −0.0257 | 0.0475 | −0.0512 | −0.0434 | −0.0235 | −0.0137 | −0.1909 * | 1.00 | |||||||
| ConsS | −0.1015 * | 0.0386 | −0.1358 * | −0.0913 * | −0.1559 * | −0.1114 * | −0.0917 * | −0.1201 * | 1.00 | ||||||
| Energy | 0.0992 * | −0.0487 | −0.1562 * | −0.1253 * | 0.2168 * | 0.1021 * | −0.1294* | −0.1695 * | −0.0814 * | 1.00 | |||||
| HealthCare | 0.0536 | 0.2060 * | 0.1540 * | 0.2536 * | −0.0759 * | 0.0618 | −0.1251 * | −0.1638 * | −0.0787 * | −0.1111 * | 1.00 | ||||
| Industrial | 0.0785 * | −0.0761 * | 0.1604 * | 0.0312 | 0.1542 * | 0.0726 | −0.1458 * | −0.1909 * | −0.0917 * | −0.1294 * | −0.1251 * | 1.00 | |||
| Tech | 0.0154 | 0.0289 | 0.1555 * | 0.1004 * | −0.0120 | 0.0130 | −0.1576* | −0.2063 * | −0.0991 * | −0.1398 * | −0.1352 * | −0.1576 * | 1.00 | ||
| Telecom | −0.0018 | 0.0376 | −0.0359 | −0.0461 | 0.0273 | −0.0259 | −0.1163 * | −0.1522 * | −0.0731 * | −0.1032 * | −0.0998 * | −0.1163 * | −0.1256 * | 1.00 | |
| Utilities | −0.0469 | −0.0981 * | −0.1022 * | −0.1022 * | 0.0448 | −0.0398 | −0.0970* | −0.1270 * | −0.0610 | −0.0861* | −0.0832 * | −0.0970 * | −0.1048 * | −0.0773 * | 1.00 |
Note: * stands for significant at ρ < 5%.
Table 5.
Logistic regression results.
| Random-Effects Logistic Regression | Number of Obs = | 660 | ||||
| Group Variable: id | Number of groups = | 165 | ||||
| Random effects u_i ~ Gaussian | Obs per group: | |||||
| min = | 4 | |||||
| avg = | 4.0 | |||||
| max = | 4 | |||||
| Integration method: mvaghermite | Integration pts. = | 12 | ||||
| Wald chi2(16) = | 98.68 | |||||
| Log likelihood = −374.00887 | Prob > chi2 = | 0.0000 | ||||
| Global 100t | Coef. | Std. Err. | z | P > |z| | [95% Conf. Interval] | |
| ROAt−1 | 0.0712359 | 0.0216042 | 3.30 | 0.001 | 0.0288924 | 0.1135794 |
| Innovationt−1 | 1.175801 | 0.4297502 | 2.74 | 0.006 | 0.3335065 | 2.018096 |
| ROAInnovationt−1 | −0.0328445 | 0.0384909 | −0.85 | 0.393 | −0.1082854 | 0.0425964 |
| SIZEt−1 | −0.1019223 | 0.085746 | −1.19 | 0.235 | −0.2699814 | 0.0661367 |
| Global100t−1 | 0.7228701 | 0.2741993 | 2.64 | 0.008 | 0.1854494 | 1.260291 |
| BasicMaterials | −0.5308388 | 0.5289605 | −1.00 | 0.316 | −1.567582 | 0.5059047 |
| ConsumerGoods | −0.1140233 | 0.4815713 | −0.24 | 0.813 | −1.057886 | 0.829839 |
| ConsumerServices | −1.029434 | 0.6720984 | −1.53 | 0.126 | −2.346723 | 0.2878545 |
| Energy | 1.099322 | 0.5311778 | 2.07 | 0.038 | 0.0582331 | 2.140412 |
| HealthCare | 0.0380103 | 0.5491803 | 0.07 | 0.945 | −1.038363 | 1.114384 |
| Industrial | 0.7002438 | 0.5134865 | 1.36 | 0.173 | −0.3061712 | 1.706659 |
| Technological | 0.0439347 | 0.5056498 | 0.09 | 0.931 | −0.9471207 | 1.03499 |
| Telecommunication | 0.1883038 | 0.5451738 | 0.35 | 0.730 | −0.8802171 | 1.256825 |
| y2012 | 0.6365292 | 0.2522968 | 2.52 | 0.012 | 0.1420366 | 1.131022 |
| y2013 | −0.7945686 | 0.2677179 | −2.97 | 0.003 | −1.319286 | −0.2698511 |
| y2014 | −0.5319664 | 0.2685604 | −1.98 | 0.048 | −1.058335 | −0.0055977 |
| _cons | 1.063773 | 2.083159 | 0.51 | 0.610 | −3.019144 | 5.146689 |
| /lnsig2u | −1.08605 | 0.8255747 | −2.704146 | 0.5320471 | ||
| sigma_u | 0.5809882 | 0.2398246 | 0.2587034 | 1.304766 | ||
| rho | 0.0930545 | 0.0696747 | 0.0199379 | 0.3410091 | ||
| LR test of rho = 0: chibar2(01) = 2.02 | Prob ≥ chibar2 = 0.077 | |||||
note: Utilities omitted because of collinearity.
Table 6.
(a,b) Collinearity diagnostics results.
| (a) | ||||
| Variable | VIF | SQRT VIF | Tolerance | R-Squared |
| Global 100 | 1.11 | 1.05 | 0.9018 | 0.0982 |
| ROA | 1.08 | 1.04 | 0.9251 | 0.0749 |
| Innovation | 1.10 | 1.05 | 0.9052 | 0.0948 |
| SIZE | 1.05 | 1.03 | 0.9512 | 0.0488 |
| Mean VIF | 1.09 | |||
| (b) | ||||
| Eigenval | Cond Index | |||
| 1 | 3.5156 | 1.0000 | ||
| 2 | 0.6246 | 2.3724 | ||
| 3 | 0.4443 | 2.8130 | ||
| 4 | 0.4140 | 2.9140 | ||
| 5 | 0.0015 | 48.7303 | ||
| Condition Number 48.7303 | ||||
| Eigenvalues and the Cond Index are computed from scaled raw sscp (with intercept) Det (correlation matrix) 0.8449 | ||||
Table 7.
Mediation analysis results.
| Model with dv Regressed on iv (path c) | ||||||
| Number of obs | 825 | |||||
| Source | SS | df | MS | F (1, 823) | 25.70 | |
| Model | 6.12730293 | 1 | 6.12730293 | Prob > F | 0.0000 | |
| Residual | 196.253303 | 823 | 0.238460879 | R-squared | 0.0303 | |
| Total | 202.380606 | 824 | 0.245607532 | Adj R-squared | 0.0291 | |
| Root MSE | 0.48832 | |||||
| Global 100 | Coef. | Std. Err. | t | P > t | [95% Conf. Interval] | |
| ROA | 0.01279 | 0.0025232 | 5.07 | 0.000 | 0.0078374 | 0.0177426 |
| _cons | 0.3533814 | 0.0229485 | 15.40 | 0.000 | 0.308337 | 0.3984258 |
| Model with mediator regressed on iv (path a) | ||||||
| Number of obs | 825 | |||||
| Source | SS | df | MS | F (1, 823) | 17.02 | |
| Model | 2.51379406 | 1 | 2.51379406 | Prob > F | 0.0000 | |
| Residual | 121.562103 | 823 | 0.147706079 | R-squared | 0.0203 | |
| Total | 124.075897 | 824 | 0.150577545 | Adj R-squared | 0.0191 | |
| Root MSE | 0.38433 | |||||
| Innovation | Coef. | Std. Err. | t | P > t | [95% Conf. Interval] | |
| ROA | 0.0081922 | 0.0019858 | 4.13 | 0.000 | 0.0042944 | 0.0120901 |
| _cons | 0.1877787 | 0.0180611 | 10.40 | 0.000 | 0.1523275 | 0.2232299 |
| Model with dv regressed on mediator and iv (paths b and c’) | ||||||
| Number of obs | 825 | |||||
| Source | SS | df | MS | F (2, 822) | 42.33 | |
| Model | 18.8975273 | 2 | 9.44876365 | Prob > F | 0.0000 | |
| Residual | 183.483079 | 822 | 0.223215424 | R-squared | 0.0934 | |
| Total | 202.380606 | 824 | 0.245607532 | Adj R-squared | 0.0912 | |
| Root MSE | 0.47246 | |||||
| Global 100 | Coef. | Std. Err. | t | P > t | [95% Conf. Interval] | |
| Innovation | 0.3241158 | 0.0428512 | 7.56 | 0.000 | 0.2400051 | 0.4082264 |
| ROA | 0.0101348 | 0.0024663 | 4.11 | 0.000 | 0.0052938 | 0.0149758 |
| _cons | 0.2925194 | 0.0236159 | 12.39 | 0.000 | 0.2461649 | 0.3388739 |
Table 8.
Sobel-Goodman mediation tests results.
| Coef | Std Err | Z | P > Z | |
| Sobel | 0.00265523 | 0.00073314 | 3.622 | 0.00029265 |
| Goodman-1 (Aroian) | 0.00265523 | 0.00073806 | 3.598 | 0.0003212 |
| Goodman-2 | 0.00265523 | 0.00072818 | 3.646 | 0.00026597 |
| Coef | Std Err | Z | P > Z | |
| a coefficient | 0.008192 | 0.001986 | 4.1254 | 0.000037 |
| b coefficient | 0.324116 | 0.042851 | 7.56375 | 3.9 × 10⁻¹⁴ |
| Indirect effect | 0.002655 | 0.000733 | 3.62172 | 0.000293 |
| Direct effect | 0.010135 | 0.002466 | 4.10934 | 0.00004 |
| Total effect | 0.01279 | 0.002523 | 5.06904 | 4.0 × 10⁻⁷ |
| Proportion of total effect that is mediated | 0.20760143 | |||
| Ratio of indirect to direct effect | 0.26199117 | |||
| Ratio of total to direct effect | 1.2619912 | |||
© 2018 by the authors. Licensee MDPI, Basel, Switzerland. This article is an open access article distributed under the terms and conditions of the Creative Commons Attribution (CC BY) license (http://creativecommons.org/licenses/by/4.0/).
Share and Cite
MDPI and ACS Style
Ruggiero, P.; Cupertino, S. CSR Strategic Approach, Financial Resources and Corporate Social Performance: The Mediating Effect of Innovation. Sustainability 2018, 10, 3611. https://doi.org/10.3390/su10103611
AMA Style
Ruggiero P, Cupertino S. CSR Strategic Approach, Financial Resources and Corporate Social Performance: The Mediating Effect of Innovation. Sustainability. 2018; 10(10):3611. https://doi.org/10.3390/su10103611
Chicago/Turabian StyleRuggiero, Pasquale, and Sebastiano Cupertino. 2018. "CSR Strategic Approach, Financial Resources and Corporate Social Performance: The Mediating Effect of Innovation" Sustainability 10, no. 10: 3611. https://doi.org/10.3390/su10103611
Note that from the first issue of 2016, this journal uses article numbers instead of page numbers. See further details here.