Social Preferences for Small-Scale Solar Photovoltaic Power Plants in South Korea: A Choice Experiment Study


Department of Energy Policy, Graduate School of Energy & Environment, Seoul National University of Science & Technology, 232 Gongreung-Ro, Nowon-Gu, Seoul 01811, Korea
*
Author to whom correspondence should be addressed.
Sustainability 2018, 10(10), 3589; https://doi.org/10.3390/su10103589
Submission received: 31 August 2018
/
Revised: 22 September 2018
/
Accepted: 27 September 2018
/
Published: 9 October 2018
(This article belongs to the Special Issue Circular Economy—Sustainable Energy and Waste Policies)
Abstract
:To reduce greenhouse gas emissions, the South Korean government plans to expand the installation of small-scale solar photovoltaic (SPV) power plants, which do not occupy large spaces and have a smaller environmental impact than large-scale SPV power plants. This article applies a choice experiment to evaluate quantitatively the value given by people to the attributes of the installation of small-scale SPV power plants. To reflect the preference heterogeneity of South Korean people, a Bayesian estimation of a mixed-logit model is successfully performed. According to the results, South Korean people consider the electricity bill, the operating body, and the installation location as being more important than other attributes. The respondents prefer small-scale SPV power plants that are located in residential areas, have a large scale of installation, are operated by a private corporation and produce electricity for self-consumption. For these attributes, the South Korean people are willing to pay an additional electricity bill of South Korean won (KRW) 4286/month, KRW 3712/kW, KRW 2885/month and KRW 3731/month, respectively. The results provide meaningful implications regarding the aspects of installation on which the government should focus. In addition, the results can be utilized in policy making and decision making related to the installation of small-scale SPV power plants.
1. Introduction
The most common way to produce electricity is to use fossil fuels, such as coal or oil. However, the use of fossil fuels emits large amounts of greenhouse gases (GHGs), the cause of climate change. South Korea is the fifth-largest emitter of GHGs among the Organization for Economic Co-operation and Development (OECD) countries. Between 2000 and 2013, its GHG emissions increased by 39 percent, ranked second after Turkey among the OECD countries [1]. In addition, the rate of carbon dioxide (CO2) emissions from coal combustion was the highest in the OECD countries in 2013 compared with 1990 [2]. Therefore, as discussed at the 2015 United Nations Climate Change Conference, the South Korean government decided to reduce its GHG emissions by 37% by 2030 compared with the business-as-usual level [3].
The development and dissemination of alternative energy sources is a major option for reducing GHG emissions. Accordingly, the South Korean government plans to expand the electricity supply by replacing some of the fossil fuels with renewable sources, such as solar energy. For example, it is planning to increase the ratio of renewable electricity generation in the total power generation from 7% in 2016 to 20% by 2030 and to supply more than 95% of new generation capacity with clean energy, such as solar and wind power [4]. This would increase the total capacity of the solar photovoltaic (SPV) power plants from 5.7 GW in 2017 to 36.5 GW by 2030.
To install a considerable number of SPV panels, large spaces are required. However, it is difficult to secure such large spaces in South Korea, because forest areas occupy about 70% of the entire country and the population density is high. Large-scale SPV power plants installed in mountainous areas can cause negative environmental damage, such as damage to forests and ecosystems, and encroach on the natural scenery [5]. On the other hand, small-scale SPV power plants can be installed in a relatively small space, such as on roofs of residences or buildings, and cause less environmental damage. Therefore, a small-scale SPV power plant is a realistic alternative in some countries, like South Korea. If the use of small-scale SPV power plants is expanded, the following positive effects are expected. First, the GHG emissions will be reduced. Second, the amount of air pollutants, which are the cause of fine dust, will be diminished. Third, unnecessary power transmission facilities will decrease, because power generation and consumption can be performed simultaneously [6,7]. Finally, the dependence on energy imports will be reduced and the uses of domestic energy increased.
For these reasons, several countries are expanding the installation of small-scale SPV power plants. In the case of South Korea, the government of Seoul City is planning to supply SPV power plants to one million households by 2022, an amount that is equivalent to the capacity of a nuclear power plant (1 GW). Therefore, new rental apartments will be required to install small-scale SPV power plants from 2018, and small-scale SPV power plants will be installed in all public buildings and schools unless there are safety problems [8]. The city of Busan also plans to increase its rate of renewable electricity generation compared with the total electricity consumption to 30% by 2030. Thus, it is expanding its SPV energy self-reliant villages by installing small-scale SPV power plants on top of old residences and ships [9]. As an international example, the Japanese government has been implementing the Net-Zero Energy House (ZEH), a zero-energy housing project, since 2012. This project aims to reduce energy consumption through SPV power generation and improved insulation performance. To that end, the majority of new residences will be built as ZEHs by 2020 [10]. In the U.S., California has set a goal of reducing carbon emissions by 40 percent by 2030 and supplying 50 percent of its electricity to renewable energy. In addition, new residences will have to install SPV energy from 2020 [11].
As the interest in renewable energy has increased, many related studies have been published. In general, there are many papers that studied SPV power in many countries. Most studies have assessed the economic feasibility, financial evaluation, government incentives, environmental value and negative environmental impact of SPV energy e.g., [5,12,13,14,15,16,17,18,19]. Furthermore, there are papers on consumption, optimal price and the offering strategy problem that can be considered in SPV market e.g., [20,21,22] and evaluating relationship between renewable energy and citizens’ life quality from an economic standpoint e.g., [23,24].
However, as a countermeasure to reduce the negative environmental impacts of large-scale SPV power plants, research on small-scale SPV power plants is underway, but the number of such studies in the literature applying stated preference (SP) methods is very small. In the literature, many studies have evaluated the willingness to pay (WTP) for expanding large-scale renewable energy. In the SP methods applied in this study, contingent valuation (CV) e.g., [25,26,27,28,29] and choice experiment (CE) e.g., [30,31,32] are representative.
Few studies have analyzed the social preference for small-scale SPV power plant installation at the level of detailed attributes, focusing on the quantitative estimation of the public’s WTP. Therefore, this study aims to analyze the social preferences of the detailed attributes of installing small-scale SPV power plants in South Korea and to quantitatively predict public acceptance of small-scale SPV power plants through simulation of virtual small-scale SPV power plants. This allows you to set policy priorities for various types of small-scale SPV power plants. The results of this study can be used as the basis for the policy formulation, as public attitude is crucial for a successful renewable energy project. The results of the study will also provide meaningful insights to enhance the public acceptance and reliability of policies when increasing the number of small-scale SPV power plants. The rest of the study is composed of three sections. Section 2 is devoted to explaining the methodology adopted in the study. Section 3 presents and discusses the results. The final section contains the conclusions and related policy implications of this study.
Current Issues Regarding Small-Scale Solar Photovoltaic Power Plants
At the 2015 United Nations Climate Change Conference in Paris (COP21), countries have submitted their Intended Nationally Determined Contributions (INDCs) to indicate their emissions reduction commitments. The reduction targets for each country are considered to be quite challenging [3,33,34,35,36]. As part of the efforts to achieve such reduction target, many countries are concentrating on expanding renewable energy through government incentive schemes such as Emission Trading System (ETS) or Feed-In Tariff (FIT) and Feed-In Premium (FIP). In case of ETS, about 39 countries around the world, including the EU, are running ETS, and the United States, Japan, and China are only implemented in some regions. Some countries, including Mexico, Chile, and Brazil, are considering introducing the system [37]. The FIT was in effect in 60 countries in 2014, and FIP, which improved FIT, has recently been applied to ease the increase in electricity bill and the development of biased energy [38,39,40,41,42].
Among renewable energies, SPV energy is expected to play an important role in expanding renewable energy voluntarily based on ETS, FIT, and FIP. This is because SPV power is simple to install and it takes shorter time to operate than other renewable power sources. In addition, the rate of decline in SPV power generation costs was 60% between 2010 and 2015, the highest among other energy generation costs. It is expected that the cost will continue to decline and it will be competitive with the fossil fuel power generation [43]. Price competitiveness is expected to have a positive impact on small-scale SPV power generation.
From a long-term perspective, small-scale SPV industries need to be informed about the public’s acceptance of small-scale SPV power plants because they can contribute significantly to the voluntary supply of SPV power. The current SPV-related policy, which is sporadic and focused only on supply expansion, should be improved, as it would be a huge financial burden to implement a government policy on installation of small-scale SPV power plants. In addition, it is necessary to predict in advance the extent to which the public will support a small-scale SPV power plant with specific characteristics for voluntary dissemination. Therefore, the main goal of this study is to obtain policy implications for small-scale SPV power plant installations in the future by quantitatively analyzing the social preference for installing small-scale SPV power plants to reflect current issue.
2. Methodology
2.1. Survey Design and Data Collection: A Choice Experiment
To analyze the social preferences for installing small-scale SPV power plants, it is necessary to conduct a survey of the public’s preferences regarding their installation. In this study, we use the CE approach, a representative SP method, to analyze the social preferences for small-scale SPV power plant installation. The CE presents respondents with several product (or service) alternatives, consisting of attributes and levels related to the target goods, and then asks them to choose their preferred alternative among them.
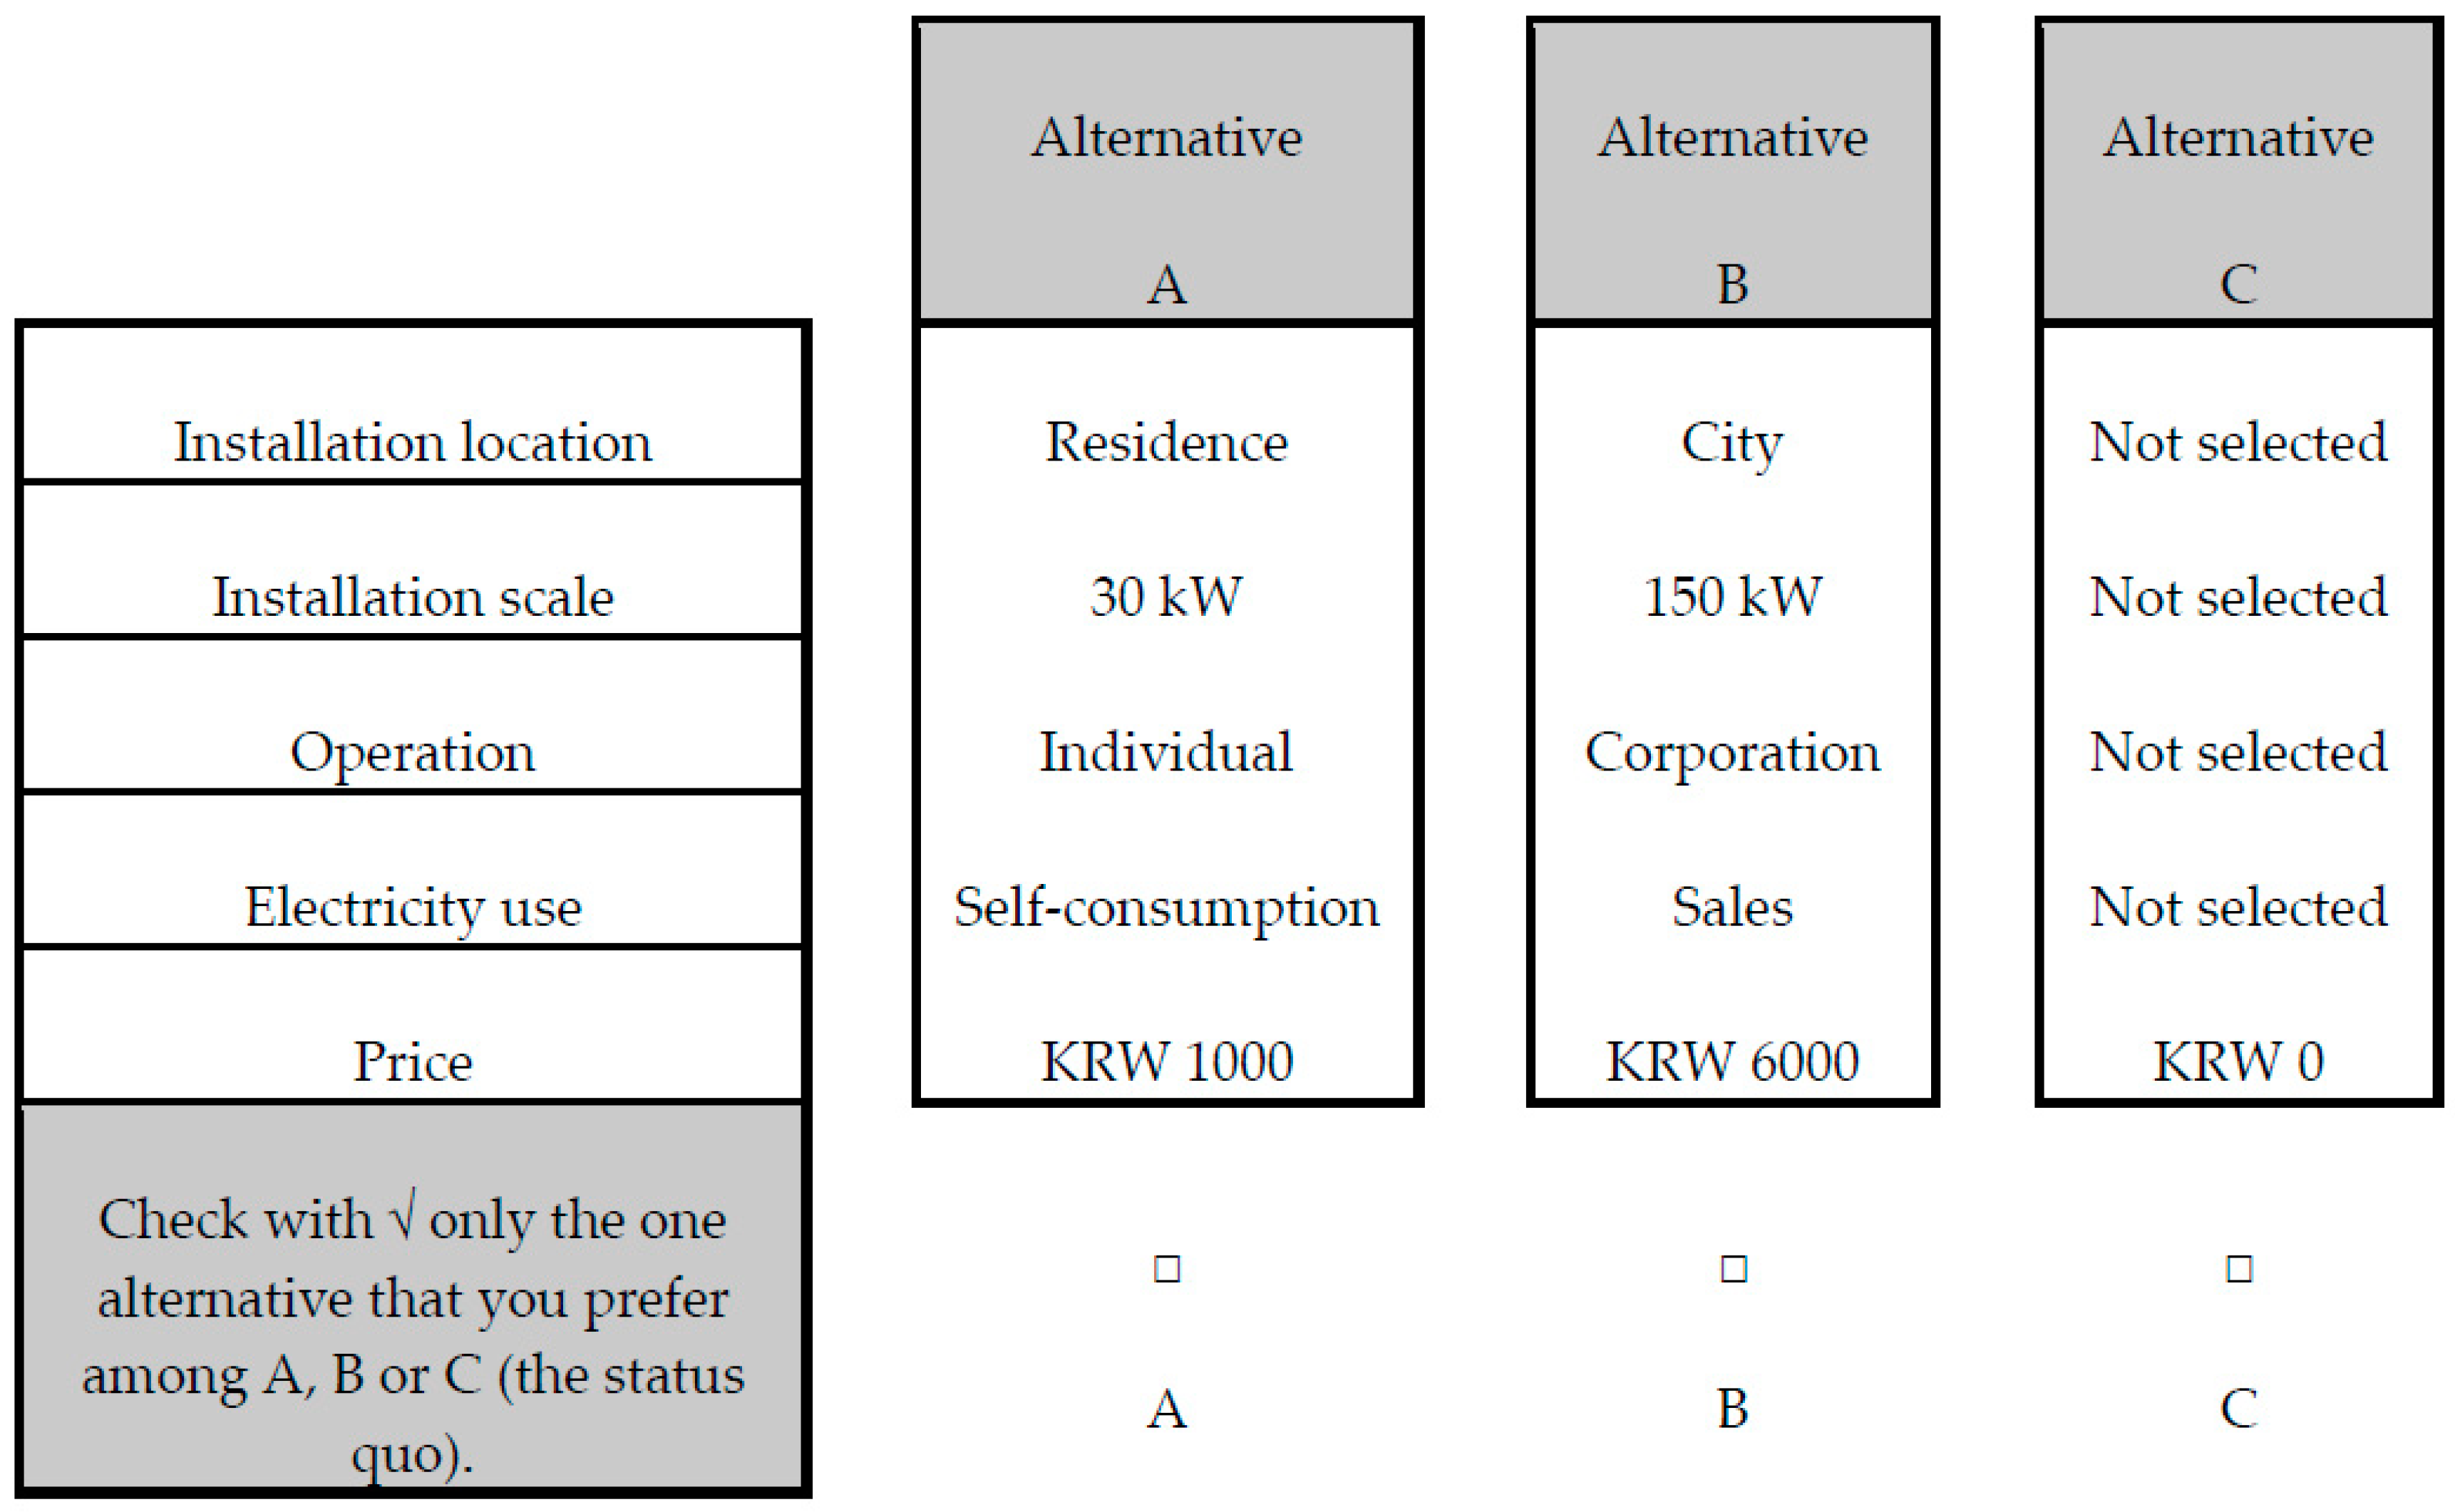
To design an appropriate CE questionnaire, we need to select the attributes and levels of small-scale SPV power plant installation. The selected attributes and levels are obtained through an extensive literature review and consultation with experts in the energy sector. As shown in Table 1, the five attributes selected are the installation location, installation scale, operating body, use of the electricity produced and additional electricity bills.
First, the installation location of small-scale SPV power plants can be divided into residence, city and suburb. Residence is assumed to be a home, and in cities small-scale SPV power plants can be installed on the rooftops of buildings. In suburbs, small-scale SPV power plants can be installed on forest, idle land or the roofs of livestock pens. Second, the installation scale was limited to a maximum of 150 kW; the larger the scale, the more electricity can be produced. The installation scale attributes are set at 30 kW (the scale that can be installed on the roof of a residence), 80 kW (the scale that can be installed on the roof of buildings) and 150 kW (the scale that can be installed on forest or idle land). Third, the operation can be divided into individual, corporation and government, and the ownership of the electricity produced lies with the operating entity. Fourth, the detailed level of electricity use produced is self-consumption or sales. Finally, the price attribute is set as the monthly electricity bill per household that is additionally paid. Compared with conventional coal-fired power plants, renewables have a high cost of power generation; thus, the electricity bill could rise if the proportion of small-scale SPV power plants increases. Therefore, in this study, the level of price attributes is considered by referring to Lim et al. [18], who investigated the WTP for the expansion of renewable energy facilities. There are four levels of 1000, 3000, 6000 and 10,000 KRW/month. The attributes and their levels are summarized in Table 1. It is assumed that the levels of possible attributes other than these five attributes, which may affect respondents’ preference, are the same in all the alternatives.
The CE question consists of three alternatives. One is alternative C, which represents the present state (status quo), and the other two are composed of different attribute levels for small-scale SPV power plant installation. There is a total of possible choice alternatives in combination with the suggested attributes and their levels. However, it is not possible to ask the respondents to choose among all these possible alternatives in the survey. Thus, a minimum set of alternatives is derived through the orthogonal main-effects design, and a total of 16 alternative sets are extracted. In fact, we randomly mix 16 alternative sets into eight alternative sets with two alternatives. For the convenience of the respondents, we split the respondents into two groups and survey only four alternative sets per group. The respondents are directed to choose their preferred alternative among the three within the alternative set. Figure 1 is an example of an alternative set presented to the respondents.
The actual fieldwork was conducted by a professional polling firm (Research Prime) for one month in June 2016. To improve the reliability of the SP data, the survey respondents were limited to the household owners and their spouses who have the actual burden of electricity bill payment and who are aged from 20 to 65 years. The sample of the survey consists of 600 South Korean households, which were selected according to the purposive quota sampling to obtain a similar ratio to the actual population in South Korea. In addition, face-to-face surveys were conducted to ensure a better understanding of various attributes and to provide sufficient information to raise the response rates. In this study, we examine the number of respondents to gender, family size, age and monthly average household income. Information on respondents’ characteristics is summarized in Table 2. The distribution of respondents’ characteristics in Table 2 is very similar to that of actual Korean population at the time of the survey [44], which indicates that the samples were adequately drawn.
2.2. The Model Specifications
The collected SP data are analyzed using a discrete choice model (DCM) based on random utility models. DCMs have been used for many years in marketing analyses to assess consumer preferences for different product attributes [45,46]. They have also been used in the fields of energy and environment [47,48] due to their wide applicability. In this study, the CE data obtained through the survey is inherently discrete characteristics, as respondents choose the one alternative that gives them the highest utility among the various alternatives. Therefore, the DCM is suitable as an analytical model for this study because it can jointly evaluate the trade-offs by considering several important attributes. In the DCM, the utility () that the decision maker obtains from alternative consists of the deterministic utility () and the random utility (). Respondents choose the alternative that would give them the highest utility. Thus, the probability that respondent would choose alternative is the case that the utility of alternative would be greater than the utility of any other alternatives [49,50], which is expressed as follows:
In Equation (1), various forms of DCM are derived depending on how the probability distribution of the unobserved portion of utility is assumed. For a typical standard multinomial logit model, it is assumed that all respondents have a homogeneous preference structure. In addition, standard logit model follows unrealistic independent from irrelevant alternatives (IIA) characteristic that the ratio of the choice probability of the two alternatives in the choice set is not affected by the presence of other alternatives. To overcome these limitations, this study uses a mixed logit model that reflects the heterogeneity of respondents’ preferences. Several recent studies have identified the existence of preference heterogeneity for renewable energy technologies [51,52,53], which should be considered in developing sophisticated policies. Therefore, it is necessary to consider heterogeneity in respondents’ preference for installing of small-scale SPV power plants. Mixed logit model is very appropriate for this research purpose. The mixed logit model assumes that the coefficient vector , which is the value given by the respondent to each attribute, follows a specific probability distribution for the population and that the probability density function is . The mixed logit model also allows more accurate analysis of respondents’ preferences by assuming different probability distributions for each attribute [54].
In the mixed logit model, the utility that respondent derives from an alternative within the choice set t is expressed [49,54] as:
where is the utility that respondent n obtains from alternative , is the representative utility that relates the observed factors to the respondent’s utility, and is a disturbance that is the unobserved portion of utility. is also a vector consisting of attributes related to alternative within choice set . is the vector that represents the coefficient of attributes and follows a probability distribution with an average of and a variance of . Assuming as a random disturbance with a distribution of i.i.d. extreme value, the choice probability is derived [54] as:
After assuming a specific distribution for each coefficient, the likelihood function is derived as:
refers to a vector that collects all of the alternatives that each respondent chooses from the th set of alternatives.
On the other hand, it is difficult to compare the relative value of attributes from the coefficient estimates based on the mixed logit model, since they represent the marginal contribution to the utility of each attribute with different units. Therefore, it is necessary to calculate the MWTP from the estimated results. MWTP means the amount that a respondent is willing to pay to keep his or her utility the same as before when the quantity or quality of the attribute changes by one unit. Assuming that the deterministic utility () consists of an alternative price attribute () and any other attribute () except for it, the MWTP for each attribute can be calculated as:
In addition, when respondents choose an alternative, each attribute has a different relative importance (RI) to the decision. If the part worth of each attribute is calculated, the RI of each attribute can be obtained as shown in the following Equation (6). The part worth of attribute can be obtained by multiplying the minimum level minus the maximum level of attribute by the coefficient of of attribute .
3. Results and Discussion
3.1. Estimation Results: Social Preferences for Installing Small-Scale SPV Power Plants
For the analysis of respondents’ preference for small-scale SPV power plant installation, the utility that respondent obtains when s/he chooses alternative is specified as:
In Equation (7), , and are the dummy variables representing residence, city and suburb in the installation location attribute, respectively. is the variable representing the installation scale attribute. , and are the dummy variables meaning individual, corporation and government in the operation attribute, respectively. and are the dummy variables indicating self-consumption and sales in the electricity use attribute, respectively. The ‘not selected’ level is set to the base for all the dummy variables. Finally, means the additional electricity bill.
As mentioned above, the mixed logit model has the advantage that researchers can assign a specific distribution to each coefficient based on the characteristics of the variables [54]. This study assumes that all the parameters follow a normal distribution. The Bayesian method is used to estimate the model. The Bayesian estimation method has the advantage of being able to solve the global optimization problem and the initial value problem compared with the conventional maximum likelihood estimation [55,56,57]. The estimated coefficients, as well as the median MWTP and average RI derived from them, are shown in Table 3. The mean and standard deviation of all the estimated parameters are significant at the 1% or 5% level.
First, the RI of small-scale SPV power plant installation (the last column in Table 3) shows that respondents regard the additional electricity bills as the most important consideration when installing a small-scale SPV power plant. When comparing the category of attributes, it is shown that the operating body (28.18%) and installation location (27.26%) are considered to be similar in importance, followed by additional electricity bills (16.61%) and electricity use (16.06%). On the other hand, the RI of the scale of installation is relatively low, 11.88%, indicating that the respondents do not consider it as an important attribute in the process of small-scale SPV power plant installation. Because small-scale SPV power plants are installed in the living environment of the public, there is a considerable visual impact. Therefore, the respondents’ interest in how the small-scale SPV power plants operate and where they are installed will have greatly influenced their choices.
Next, it is necessary to examine the respondents’ preferences and MWTP for individual attributes. For the installation location, all the parameters except for parameter are positive. This result indicates that the respondents do not prefer suburbs as the location for installing small-scale SPV power plants. This is very interesting, as the majority of small-scale SPV power plants are currently located in suburban areas in the case of South Korea. The public’s interest in safe and clean energy has increased over the last decade. As a result, the public’s preference for renewable energy, such as solar energy, has increased, and thus members of the public have a positive view of the installation of small-scale SPV power plants in densely populated residential and city areas. In addition, the government’s support for and promotion of renewable energy may help to encourage people to think that SPV power plants are no longer obnoxious facilities. For their preferred installation location, the respondents are willing to pay an additional electricity bill of KRW 4286/month.
The sign of the parameter estimate for the installation scale is also positive. Since the amount of electricity production is proportional to the scale of a power plant, the result of a positive parameter is predictable. As the installation scale grows by 1 kW, the respondents indicate that they are willing to pay an additional electricity bill of KRW 3712/month.
The sign of the parameter is positive for all the operating bodies, and the corporation attribute showed the largest value among them. Looking at the structure of South Korea’s power industry, the state-run Korea Electric Power Corp. has integrated control over the field of transmission, distribution and sales. It does not seem that the respondents trust the current energy governance, mainly operated by a few public corporations. Therefore, the operation attribute is interpreted as reflecting a preference for private corporations rather than the government. The respondents would be willing to pay an additional electricity bill of KRW 2885/month if the operating entity was a private corporation.
All the parameters of attributes in electricity use are also positive. In particular, the mean of the estimate shows that self-consumption is about five times higher than sales, which means that self-consumption is preferred to selling the renewable electricity produced. These results indicate that the institutional expansion of energy prosumers (a compound word for a producer and a consumer) and the promotion of small-scale distributed power have improved the social acceptance of energy self-consumption. Therefore, the respondents are willing to pay an additional electricity bill of KRW 3731/month when they consume their own electricity.
Finally, we examine the standard deviation of the estimates. For installation locations, the standard deviation of residences and cities are relatively higher than those for other attributes. This means that the distribution of the respondents’ preferences is broader than that of other attributes and that the WTP distribution is also broad. Therefore, an increase in the electricity bill based on changing the installation location will be controversial compared with the manipulation of other attributes. The standard deviation for the government is also relatively high compared with individuals and corporations within the operation attributes. This means the respondents have different attitudes toward the government in operating small-scale SPV power plants from individuals or private corporations. There is a wide distribution of the respondents’ preference for sales in the attributes of the electricity produced. That is, the electricity produced is likely to be less controversial in paying an additional electricity bill for self-consumption than for sales. On the other hand, we can see that the consumer preferences for other attributes are relatively consistent.
3.2. Simulations: Scenario Analysis of Future Small-Scale SPV Power Plant Installation
This section deals with possible scenarios for future small-scale SPV power plant installation. Based on the estimation results, we can predict how the public acceptance of a hypothetical small-scale SPV power plant installation will change due to variations in the levels of some attributes, such as the installation location and electricity bill. Next, we reflect the possible increase in the electricity bill for each scenario and simulate its impact on the level of public acceptance. First, the base scenario is set to reflect the current status of the installation of small-scale SPV power plants in South Korea. In 2015, 6944 commercial SPV power plants were completed, and more than 90% of them were less than 100 kW. In addition, most of them were established in rural areas [58]. Therefore, suburb is selected as the installation location in the base scenario, and the installation scale is set 80 kW, which is close to 100 kW in the survey attributes. The private corporation and self-consumption levels are chosen as the levels of attributes of the operating body and electricity use, which are the preferred level of each attribute. The price is based on KRW 1000, the lowest price of the scale KRW 1000 to KRW 10,000. Depending on the installation location, the scenario is divided into Scenario A, Scenario B, and Scenario C. The other attributes are set to be identical to the base scenario. Table 4 summarizes four scenarios of future small-scale SPV power plant installations.
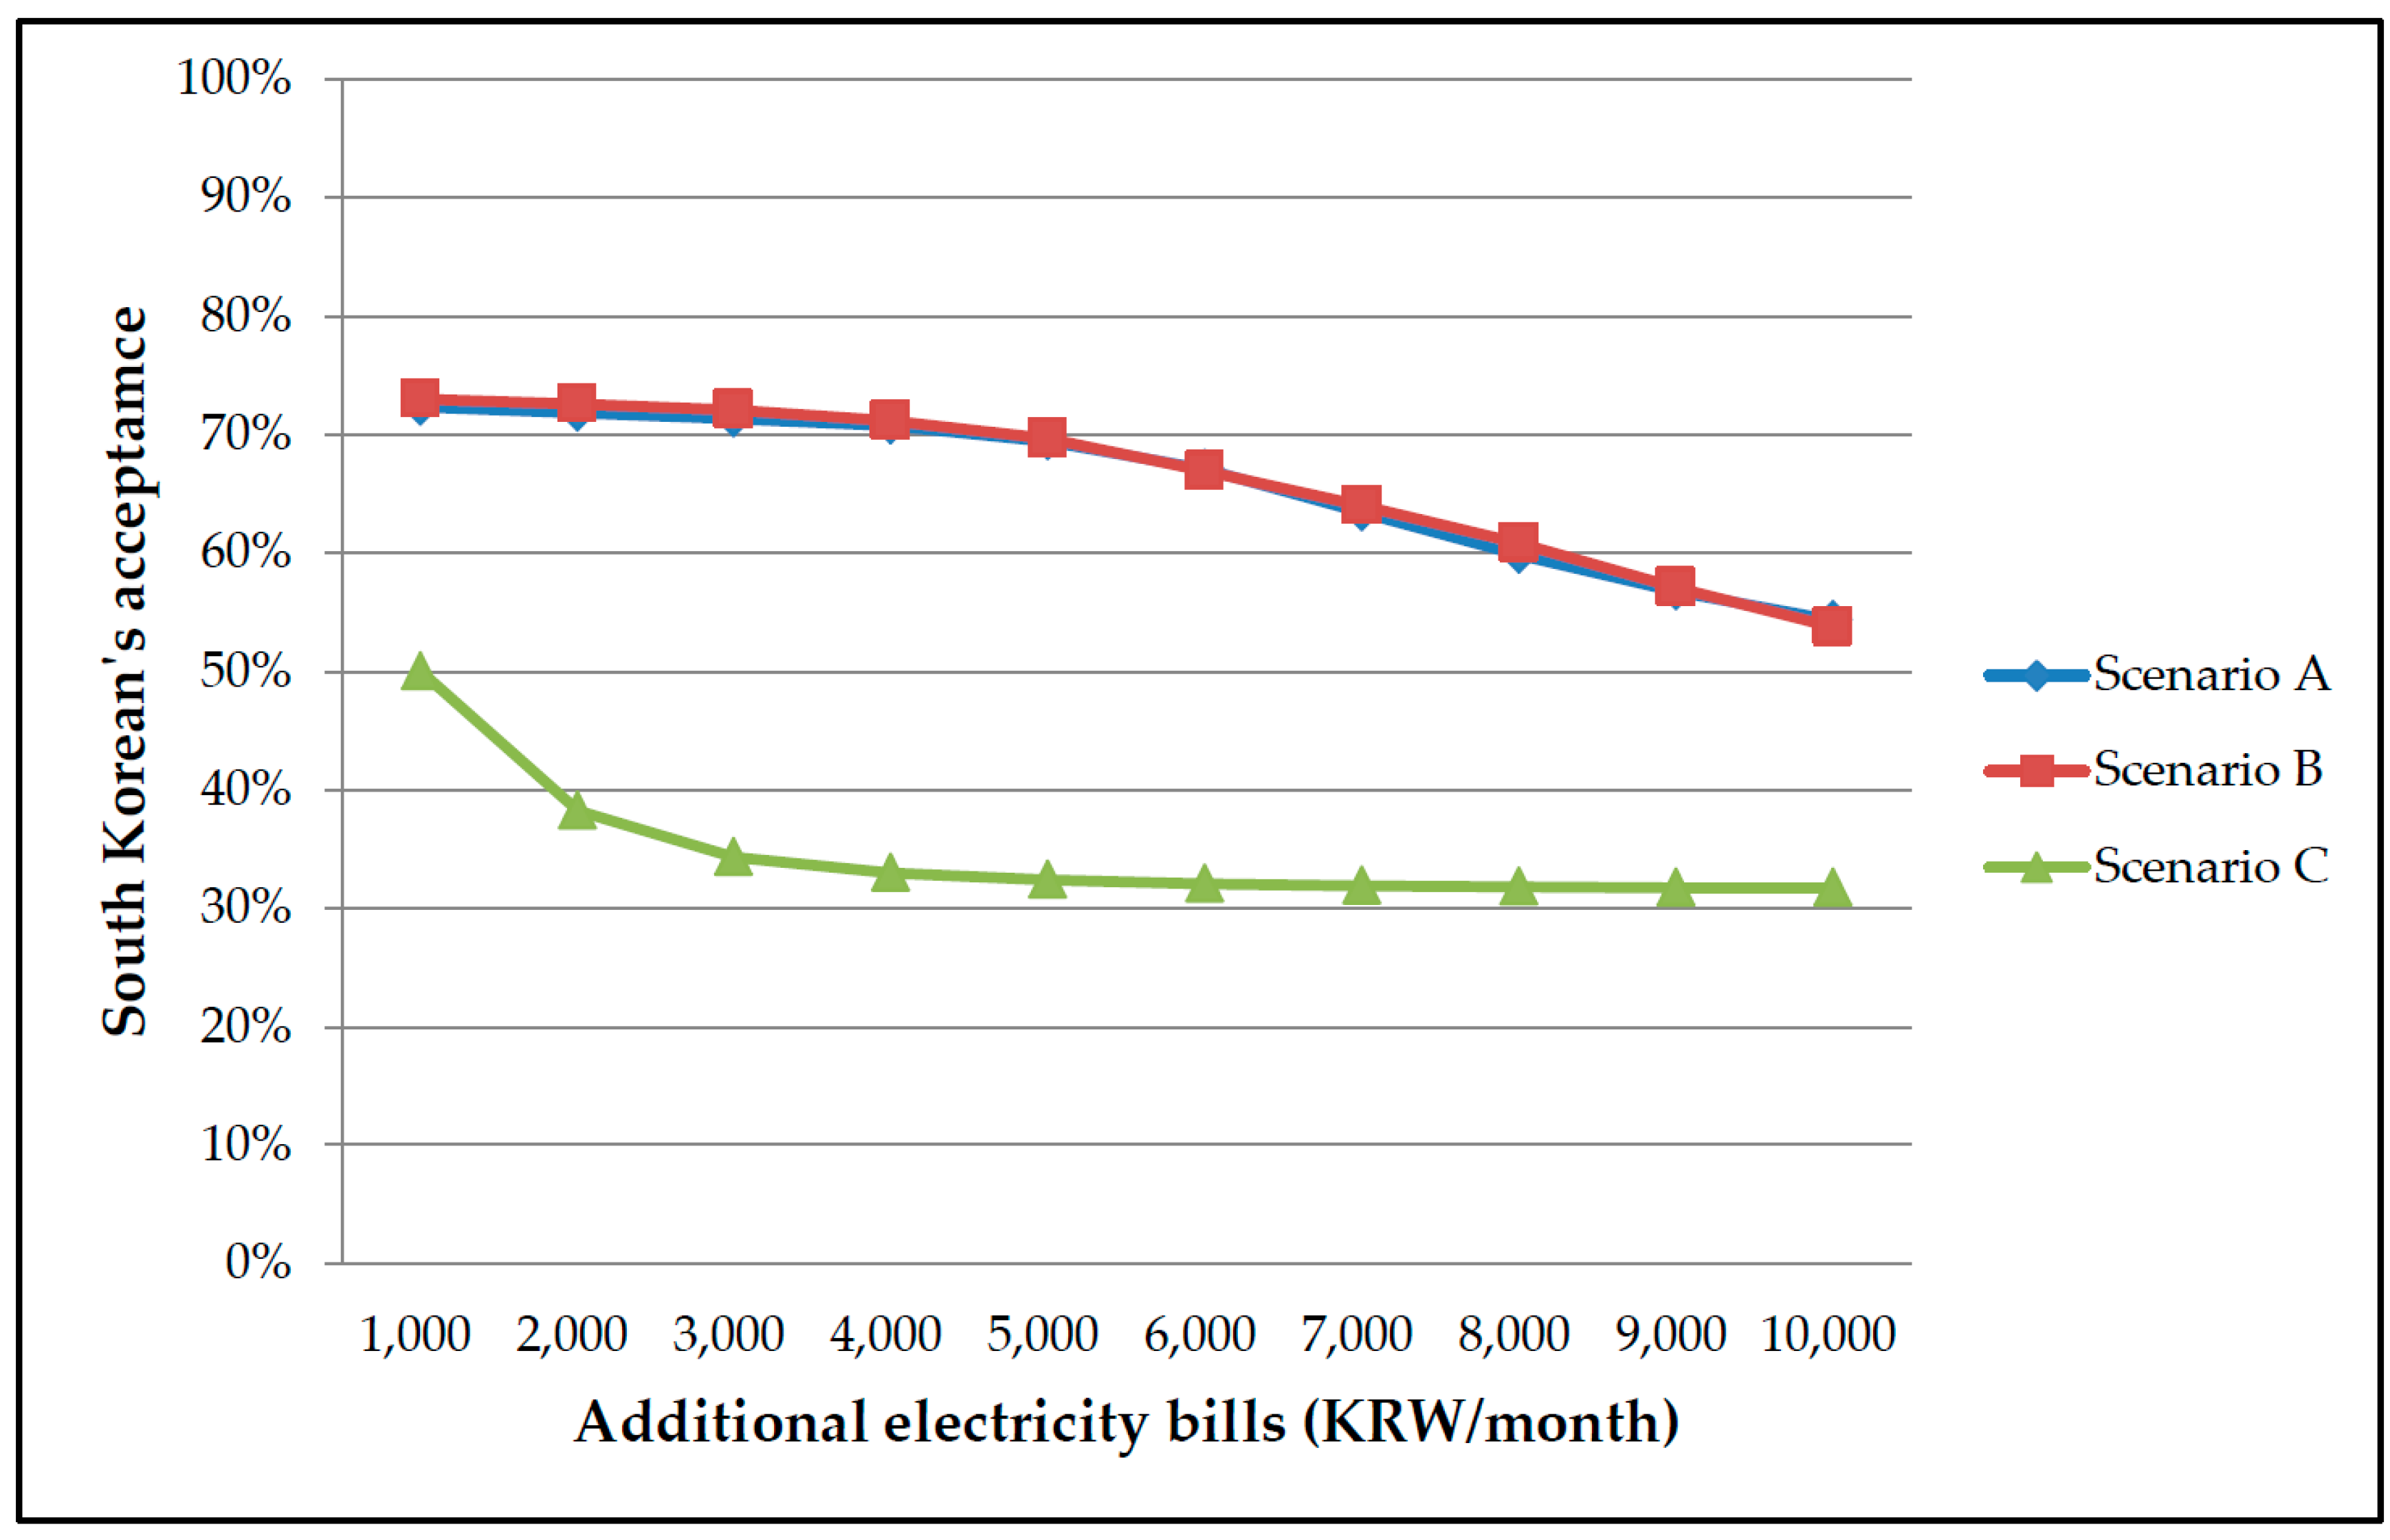
According to the scenarios established above, the public acceptance of changes in the additional electricity bill is simulated by calculating the choice probability between the base scenario and one of the three alternative scenarios. The results are described in Table 5 and Figure 2.
According to the results of the simulation, the higher the additional electricity bill, the lower the overall respondents’ acceptance. However, it is found that respondents are in favor of installing small-scale SPV power plants in their residence or city if they typically have to pay the same additional electricity bill. Despite the higher additional electricity bill, the respondents’ acceptance remains above the current state of 50%. This means that the respondents’ acceptance of installation in residential areas and city areas is positive and the need for installation is high. As seen in the estimation results mentioned above, it is possible to predict that Scenario A and Scenario B are similar, because there is not much difference in preference between residence and city. In the case of Scenario C, as the additional electricity bill increases, the public acceptance decreases from 50% to 31.69%. This corresponds to the estimated result of the parameter in suburban areas having a negative value. Unlike other power plants that use renewable energy, SPV power plants do not seem to be considered as obnoxious facilities. Therefore, when the government implements a policy to expand small-scale SPV power plants, it should actively consider installing them in residences or cities. As a result of the simulation, the increase in the electricity bill is still a critical factor that greatly affects the public acceptance. Therefore, it is necessary to conduct a more detailed analysis of the factors that contribute to the increase in the electricity bill due to the expansion of small-scale SPV power plants.
4. Conclusions
This study quantitatively analyzes the social preference for and public acceptance of the installation of small-scale SPV power plants in South Korea. To achieve this research objective, data collected through a CE questionnaire, a type of SP technique, are analyzed using a mixed logit model. The analysis shows that people considered the electricity bill, the operating body and the installation location to be more important than other attributes. The respondents prefer small-scale SPV power plants that are located in residential areas, have a large scale of installation, are operated by a private corporation and produce self-consumed electricity. The MWTP for these attributes are estimated to be KRW 4286/month, KRW 3712/kW, KRW 2885/month and KRW 3731/month, respectively.
As seen in the above results, the public’s interest in safe and clean energy has increased and the perception of small-scale SPV power plants has changed positively. Considering the location of small-scale SPV power plants installation in accordance with the preference of the people, it is necessary to expand the installation around the residential area. The government should also come up with a system that grants various incentives to power generation operators to build small-scale SPV power plants that meet the public’s preferences. Because there is the preferences heterogeneity for all attributes, the government should continue monitoring and try to change their attitude to potential opponents who do not like those attributes. The results of the simulation show that the public acceptance of installing small-scale SPV power plants in residential area or city area is maintained at over 50% despite the increase in additional electricity bill. As the choice of installation location is widened, it will be possible to supply small-scale SPV power plants with various sizes and shapes, and to develop the technology according to demand.
It is costly to install a number of new small-scale SPV power plants due to the higher cost of SPV power generation compared to the traditional fossil fuel generation [59,60]. Considering the cost will ultimately be passed on to the end-users of electricity, it is vital to gather public opinion on whether or not citizens are willing to pay for the installation. This is because the installation cannot be successful without public support in the long run, as public acceptance of renewable energy is becoming increasingly important [61,62]. Moreover, policymakers seek quantitative information about people’s willingness to pay for the installation of small-scale SPV power plants. The purpose of this study was to provide such information to policymakers. In this regard, the results from the study are useful from the perspective of policy. In addition, this study provides quantitative acceptance according to the rise in electricity bill by predicting the public acceptance through simulations of installing small-scale SPV power plants.
However, the following issues should be considered when establishing policies. Since members of the public prefer private corporations to the government as an operating body, it is necessary to make efforts to recover the credibility of the South Korean government by supplementing the stable supply of SPV power and operation management. Alternatively, it may be possible to consider a policy that increases the participation rate of private corporations in planned SPV projects. The preference for self-consumption can be used as a basis for implementing the government’s plans to increase the decentralized power grid, which can be self-sufficient on a regional basis. A decentralized power grid will enable improvements in local power independence.
Since there are few studies that have dealt with the social preferences of small-scale SPV power plants in the literature, it is difficult to compare our findings with the findings of other studies on this topic. However, new insights into the social preferences of small-scale SPV installations can be gained by comparing our results with data analysis of other countries, clarifying the differences and examining the factors that influence those gaps. These kinds of works could give us a new perspective on the social preferences of installation of small-scale SPV power plants. It makes academic and practical contributions from the following perspectives. First, it provides the basis for setting priorities for small-scale SPV power plant installation. Small-scale SPV companies can install SPV cells indiscriminately for profit. Therefore, to expand the supply of small-scale SPV power plants systematically, it is necessary to establish concrete policies reflecting the public acceptance. The social preference for each attribute of small-scale SPV power plant installation provides strategic implications for establishing initial and long-term plans. Second, it can provide implications for the calculation of a government subsidy. Since SPV modules are still expensive, the public’s preference for and acceptance of small-scale SPV power plant installation are high, but it is not easy to install them. The subsidy payment policy plays an important role in increasing the installation of small-scale SPV power plants. In addition, this study has the academic meaning of applying a SP technique to small-scale SPV power plant installation to check its applicability and fill the gaps in the existing relevant studies.
Author Contributions
All the authors played an important role in the preparation of this paper. H.-J.L. wrote most of the paper; S.-Y.H. conducted the empirical analysis; and S.-H.Y. took charge of making the survey questionnaire and gathering the data.
Acknowledgments
This work was supported by the Korea Institute of Energy Technology Evaluation and Planning (KETEP) and the Ministry of Trade, Industry & Energy (MOTIE) of the Republic of Korea (No. 20184030202230).
Conflicts of Interest
The authors declare no conflicts of interest.
References
- Carbon Dioxide Emissions Embodied in International Trade. OECD. 2015. Available online: http://www.oecd.org/sti/ind/carbondioxideemissionsembodiedininternationaltrade.htm (accessed on 1 August 2018).
- Korea’s CO2 Emissions Increase Rate Is the First in Disgrace. Yonhap News Agency. Available online: http://www.yonhapnews.co.kr/bulletin/2016/04/08/0200000000AKR20160408164600003.HTML (accessed on 1 August 2018).
- OECD Environmental Performance Reviews: Korea 2017. OECD. 2017. Available online: http://www.oecd.org/korea/oecd-environmental-performance-reviews-korea-2017-9789264268265-en.htm (accessed on 5 August 2018).
- Implementation Plan for Renewable Energy 3020. Ministry of Trade, Industry and Energy. 2017. Available online: https://www.gov.kr/portal/ntnadmNews/127962 (accessed on 12 July 2018).
- Yang, H.J.; Lim, S.Y.; Yoo, S.H. The environmental costs of photovoltaic power plants in South Korea: A choice experiment study. Sustainability 2017, 9, 1773. [Google Scholar] [CrossRef]
- Chaurey, A.; Kandpal, T.C. Assessment and evaluation of PV based decentralized rural electrification: An overview. Renew. Sustain. Energy Rev. 2010, 14, 2266–2278. [Google Scholar] [CrossRef]
- Sigarchian, S.G.; Paleta, R.; Malmquist, A.; Pina, A. Feasibility study of using a biogas engine as backup in a decentralized hybrid (PV/wind/battery) power generation system–Case study. Energy 2015, 90, 1830–1841. [Google Scholar] [CrossRef]
- Energy Saving City. Seoul. Available online: http://energy.seoul.go.kr/seoul/ (accessed on 5 August 2018).
- (Interview) Sang-In Han, The city of Busan, Clean Energy Policy Director. Electrictimes. Available online: http://www.electimes.com/article.php?aid=1518074335153439033 (accessed on 5 August 2018).
- Japan, Easy-To-Install Small Capacitor Market Opens. Kotra News. Available online: https://news.kotra.or.kr/user/globalBbs/kotranews/4/globalBbsDataView.do?setIdx=243&dataIdx=160698 (accessed on 5 August 2018).
- Mandatory Installation of Home Solar Photovoltaic Energy from 2020 in the U.S., California. Korea Energy Agency. Available online: http://www.energy.or.kr/web/kem_home_new/energy_issue/mail_vol88/pdf/issue_191_03_02.pdf (accessed on 5 August 2018).
- Haas, R. The value of photovoltaic electricity for society. Sol. Energy 1995, 54, 25–31. [Google Scholar] [CrossRef]
- Varho, V. Environmental impact of photovoltaic electrification in rural areas. Energy Environ. 2002, 13, 81–104. [Google Scholar] [CrossRef] [Green Version]
- Syed, A.M.; Fung, A.S.; Ugursal, V.I. Environmental and economic impacts of integrating photovoltaic and wind-turbine energy systems in the Canadian residential sector. Bull. Sci. Technol. Soc. 2008, 28, 210–218. [Google Scholar] [CrossRef]
- Oliva, S.; MacGill, I.; Passey, R. Estimating the net societal value of distributed household PV systems. Sol. Energy 2014, 100, 9–22. [Google Scholar] [CrossRef]
- Rodrigues, S.; Torabikalaki, R.; Faria, F.; Cafôfo, N.; Chen, X.; Ivaki, A.R.; Mata-Lima, H.; Morgado-Dias, F. Economic feasibility analysis of small-scale PV systems in different countries. Sol. Energy 2016, 131, 81–95. [Google Scholar] [CrossRef]
- Tsoutsos, T.; Frantzeskaki, N.; Gekas, V. Environmental impacts from the solar energy technologies. Energy Policy 2005, 33, 289–296. [Google Scholar] [CrossRef] [Green Version]
- Sun, P.C.; Wang, H.M.; Huang, H.L.; Ho, C.W. Consumer attitude and purchase intention toward rooftop photovoltaic installation: The roles of personal trait, psychological benefit, and government incentives. Energy Environ. 2018. [Google Scholar] [CrossRef]
- Firouzjah, K.G. Assessment of small-scale solar PV systems in Iran: Regions priority, potentials and financial feasibility. Renew. Sustain. Energy. Rev. 2018, 94, 267–274. [Google Scholar] [CrossRef]
- Seme, S.; Sredenšek, K.; Praunseis, Z.; Štumberger, B.; Hadžiselimović, M. Optimal price of electricity of solar power plants and small hydro power plants–Technical and economical part of investments. Energy 2018, 157, 87–95. [Google Scholar] [CrossRef]
- Saranya, A.; Swarup, K.S. Offering strategy for a photovoltaic power plant in electricity market. In Proceedings of the Power and Energy Conference at Illinois (PECI), Champaign, IL, USA, 22–23 February 2018; pp. 1–6. [Google Scholar]
- McKenna, E.; Pless, J.; Darby, S.J. Solar photovoltaic self-consumption in the UK residential sector: New estimates from a smart grid demonstration project. Energy Policy 2018, 118, 482–491. [Google Scholar] [CrossRef]
- Ntanos, S.; Skordoulis, M.; Kyriakopoulos, G.; Arabatzis, G.; Chalikias, M.; Galatsidas, S.; Batzios, A.; Katsarou, A. Renewable energy and economic growth: Evidence from european countries. Sustainability 2018, 10, 2626. [Google Scholar] [CrossRef]
- Ntanos, S.; Kyriakopoulos, G.; Chalikias, M.; Arabatzis, G.; Skordoulis, M.; Galatsidas, S.; Drosos, D. Social assessment of renewable energy sources usage and contribution to life quality: The case of an Attica urban area in Greece. Sustainability 2018, 10, 1414. [Google Scholar] [CrossRef]
- Guo, X.; Liu, H.; Mao, X.; Jin, J.; Chen, D.; Cheng, S. Willingness to pay for renewable electricity: A contingent valuation study in Beijing, China. Energy Policy 2014, 68, 340–347. [Google Scholar] [CrossRef]
- Lee, C.Y.; Heo, H. Estimating willingness to pay for renewable energy in South Korea using the contingent valuation method. Energy Policy 2016, 94, 150–156. [Google Scholar] [CrossRef]
- Lee, M.K.; Kim, J.H.; Yoo, S.H. Public willingness to pay for increasing photovoltaic power generation: The case of Korea. Sustainability 2018, 10, 1196. [Google Scholar] [CrossRef]
- Ntanos, S.; Kyriakopoulos, G.; Chalikias, M.; Arabatzis, G.; Skordoulis, M. Public perceptions and willingness to pay for renewable energy: A case study from Greece. Sustainability 2018, 10, 687. [Google Scholar] [CrossRef]
- Cho, Y.C.; Lim, S.Y.; Yoo, S.H. The external benefits of expanding the micro photovoltaic power generation in Korea: A contingent valuation study. Sol. Energy 2017, 158, 898–904. [Google Scholar] [CrossRef]
- Ku, S.J.; Yoo, S.H. Willingness to pay for renewable energy investment in Korea: A choice experiment study. Renew. Sustain. Energy. Rev. 2010, 14, 2196–2201. [Google Scholar] [CrossRef]
- Scarpa, R.; Willis, K. Willingness-to-pay for renewable energy: Primary and discretionary choice of British households’ for micro-generation technologies. Energy Econ. 2010, 32, 129–136. [Google Scholar] [CrossRef]
- Lim, S.Y.; Lim, K.M.; Yoo, S.H. External benefits of waste-to-energy in Korea: A choice experiment study. Renew. Sustain. Energy. Rev. 2014, 34, 588–595. [Google Scholar] [CrossRef]
- Muuls, M.; Colmer, J.; Martin, R.; Wagner, U.J. Evaluating the EU Emissions Trading System: Take It or Leave It? An Assessment of the Data after Ten Years; Grantham Institute Briefing Paper; Imperial College: London, UK, 2016. [Google Scholar]
- U.S. Department of Energy. United States Intended Nationally Determined Contribution (INDC). Available online: https://www.iea.org/media/workshops/2015/15thghgtradingworkshop/1.2Greenwald.pdf (accessed on 17 September 2018).
- Climate Action Tracker. Available online: https://climateactiontracker.org/countries/china/ (accessed on 17 September 2018).
- Ministry of Foreign Affairs of Japan. Available online: https://www.mofa.go.jp/ic/ch/page1we_000104.html (accessed on 17 September 2018).
- International Carbon Action Partnership (ICAP). Available online: https://icapcarbonaction.com/en/status-report-2015 (accessed on 17 September 2018).
- REN21. Renewables 2017 Global Status Report; REN21 Secretariat: Paris, France, 2017; ISBN 978-3-9818107-6-9. [Google Scholar]
- 2017 German Renewable Energy Law (EEG). 2017. Available online: https://www.bmwi.de/Redaktion/EN/Downloads/renewable-energy-sources-act-2017.pdf%3F__blob%3DpublicationFile%26v%3D3 (accessed on 17 September 2018).
- Embassy of the Republic of Korea to the Hellenic Republic. Greek Renewable Energy Status and policy. Available online: http://overseas.mofa.go.kr/gr-ko/index.do (accessed on 18 September 2018).
- Im, J.Y. Background and contents of improvement of Japan’s Feed-in Tariff. World Energy Market Insight 2016, 16, 15–56. [Google Scholar]
- Kim, M.K.; Lee, Y.H. Energy Frostmer, a New Power Supply and Demand, Needs to Be Activated Using Distributed Resource Brokerage Market; The Seoul Institute: Seoul, Korea, 2018. [Google Scholar]
- International Energy Agency (IEA) 2016. Energy, Climate Change and Environment, 2016 Insights. 2016. Available online: www.iea.org/publications/freepublications/publication/ECCE2016.pdf (accessed on 17 September 2018).
- Statistics Korea. Available online: http://kosis.kr (accessed on 10 August 2018).
- Eggers, F.; Sattler, H.; Teichert, T.; Völckner, F. Choice-Based Conjoint Analysis; Springer: Berlin, Germany, 2018; pp. 1–39. [Google Scholar]
- Green, P.E.; Krieger, A.M.; Wind, Y. Thirty years of conjoint analysis: Reflections and prospects. In Marketing Research and Modeling: Progress and Prospects; Springer: Boston, MA, USA, 2004; pp. 117–139. [Google Scholar]
- Alriksson, S.; Öberg, T. Conjoint analysis for environmental evaluation. Environ. Sci. Pollut. Res. 2008, 15, 244–257. [Google Scholar] [CrossRef]
- Lüthi, S.; Wüstenhagen, R. The price of policy risk—Empirical insights from choice experiments with European photovoltaic project developers. Energy Econ. 2012, 34, 1001–1011. [Google Scholar] [CrossRef]
- McFadden, D. Conditional logit analysis of qualitative choice behavior. In Frontiers of Econometrics; Zarembka, P., Ed.; Academic Press: New York, NY, USA, 1974; pp. 105–142. [Google Scholar]
- Train, K.E. Discrete Choice Methods with Simulation; Cambridge University Press: New York, NY, USA, 2003. [Google Scholar]
- Bergmann, A.; Colombo, S.; Hanley, N. Rural versus urban preferences for renewable energy developments. Ecol. Econ. 2008, 65, 616–625. [Google Scholar] [CrossRef]
- Willis, K.; Scarpa, R.; Gilroy, R.; Hamza, N. Renewable energy adoption in an ageing population: Heterogeneity in preferences for micro-generation technology adoption. Energy Policy 2011, 39, 6021–6029. [Google Scholar] [CrossRef]
- Yoo, J.; Ready, R.C. Preference heterogeneity for renewable energy technology. Energy Econ. 2014, 42, 101–114. [Google Scholar] [CrossRef]
- Train, K.E. Discrete Choice Methods with Simulation, 2nd ed.; Cambridge University Press: New York, NY, USA, 2009. [Google Scholar]
- Edwards, Y.D.; Allenby, G.M. Multivariate analysis of multiple response data. J. Mark. Res. 2003, 40, 321–334. [Google Scholar] [CrossRef]
- Allenby, G.M.; Rossi, P.E. Marketing models of consumer heterogeneity. J. Econom. 1999, 89, 57–78. [Google Scholar] [CrossRef]
- Huber, J.; Train, K. On the similarity of classical and Bayesian estimates of individual mean partworths. Mark. Lett. 2001, 12, 259–269. [Google Scholar] [CrossRef]
- Korea Energy Corporation, Renewable Energy Center. Available online: https://www.knrec.or.kr/ (accessed on 10 August 2018).
- Kumar Sharma, N.; Raj Sood, Y. Reduction in subsidy for solar power as distributed electricity generation in Indian future competitive power market. J. Renew. Sustain. Energy 2012, 4, 053120. [Google Scholar] [CrossRef]
- del Río, P.; Peñasco, C.; Mir-Artigues, P. An overview of drivers and barriers to concentrated solar power in the European Union. Renew. Sustain. Energy. Rev. 2018, 81, 1019–1029. [Google Scholar] [CrossRef]
- Wüstenhagen, R.; Wolsink, M.; Bürer, M.J. Social acceptance of renewable energy innovation: An introduction to the concept. Energy Policy 2007, 35, 2683–2691. [Google Scholar] [CrossRef] [Green Version]
- Yuan, X.; Zuo, J.; Ma, C. Social acceptance of solar energy technologies in China—End users’ perspective. Energy Policy 2011, 39, 1031–1036. [Google Scholar] [CrossRef]
Figure 1.
An example of the choice experiment.

Figure 2.
South Koreans’ acceptance of each hypothetical scenario according to the additional electricity bill.
Figure 2.
South Koreans’ acceptance of each hypothetical scenario according to the additional electricity bill.


Table 1.
Descriptions and levels of the five chosen attributes.
| Attributes | Descriptions | Levels |
|---|---|---|
| Installation location | Installation location of small-scale photovoltaic power plants | Level 1: Not selected 1 Level 2: Residence Level 3: City Level 4: Suburb |
| Installation scale | Installation scale of small-scale photovoltaic power plants (limit installation scale to 150 kW) | Level 1: Not selected 1 Level 2: 30 kW Level 3: 80 kW Level 4: 150 kW |
| Operation | Small-scale photovoltaic power plants can be operated by an individual, corporation or government, and ownership of the electricity generated from small-scale photovoltaic power plants belongs to the operating entity | Level 1: Not selected 1 Level 2: Individual Level 3: Corporation Level 4: Government |
| Electricity use | Choose to consume or sell electricity generated by small-scale photovoltaic power plants | Level 1: Not selected 1 Level 2: Self-consumption Level 3: Sales |
| Price | Monthly additional electricity bill per household for installation of small-scale photovoltaic power plants (unit: South Korean won) | Level 1: KRW 0 1 Level 2: KRW 1000 Level 3: KRW 3000 Level 4: KRW 6000 Level 5: KRW 10,000 |
Notes: 1 indicates the current level of each attribute. USD 1.0 was approximately equal to KRW 1167.7 at the time of the survey.
Table 2.
Characteristics of the survey respondents.
| Variables | Number of Sample (Ratio %) | |
|---|---|---|
| Gender | Male | 300 (50.0%) |
| Female | 300 (50.0%) | |
| Family size | 1–2 | 151 (25.2%) |
| 3–4 | 399 (66.5%) | |
| 5–6 | 50 (8.3%) | |
| Age (years) | 20–29 | 23 (3.8%) |
| 30–39 | 124 (20.7%) | |
| 40–49 | 208 (34.7%) | |
| 50–59 | 180 (30.0%) | |
| 60–69 | 65 (10.8%) | |
| Monthly household income | Less than KRW 3 million | 112 (18.7%) |
| KRW 3–4 million | 148 (24.7%) | |
| KRW 4–5 million | 137 (22.8%) | |
| KRW 5–6 million | 83 (13.8%) | |
| More than KRW 6 million | 120 (20.0%) | |
| Total | 600 (100%) | |
Table 3.
Estimation results of the mixed logit model.
| Variables 1 | Assumed Distribution | Mean of the Estimate, b | Standard Deviation of Estimate, | Median MWTP 3 | Average RI (%) 4 | |
|---|---|---|---|---|---|---|
| ASC 2 | Normal | 4.8036 | 19.7203 | - | - | |
| Installation location | Residence | Normal | 3.2706 ** | 48.6588 ** | 4286 KRW/month | 9.72 |
| City | Normal | 2.7939 ** | 51.5031 ** | 4171 KRW/month | 10.16 | |
| Suburb | Normal | −3.4755 ** | 19.1387 ** | −2714 KRW/month | 7.39 | |
| Installation scale | Installation scale (unit: kW) | Normal | 5.3991 ** | 27.4433 ** | 3712 KRW/kW | 11.88 |
| Operation | Individual | Normal | 3.1616 ** | 22.5141 ** | 2811 KRW/month | 7.70 |
| Corporation | Normal | 5.4051 ** | 32.1585 ** | 2885 KRW/month | 10.71 | |
| Government | Normal | 3.3647 ** | 39.4655 ** | 1344 KRW/month | 9.77 | |
| Electricity use | Self-consumption | Normal | 5.5952 ** | 32.0638 ** | 3731 KRW/month | 10.43 |
| Sales | Normal | 1.0202 * | 16.4477 ** | 2070 KRW/month | 5.63 | |
| Additional electricity bill (unit: KRW/month) | Normal | −0.6751 ** | 1.4623 ** | - | 16.61 | |
Notes: 1 The variables are defined in Table 1. 2 ASC refers to alternative-specific constants that represent dummies for the respondents choosing alternative A. ** and * indicate statistical significance at the 1% and 5% levels, respectively. 3 The MWTP is calculated based on 2000 values drawn from the distribution of the estimated coefficient, and the median of the 2000 MWTP observations is presented. 4 The RI of each attribute is calculated based on 2000 values drawn from the distribution of the estimated coefficient, and the mean of the 2000 RI observations is presented.
Table 4.
Current and future scenarios of the installation of small-scale solar photovoltaic power plants.
Table 4.
Current and future scenarios of the installation of small-scale solar photovoltaic power plants.
| Attributes | Base Scenario | Scenario A | Scenario B | Scenario C |
|---|---|---|---|---|
| Installation location | Suburb | Residence | City | Suburb |
| Installation scale | 80 kW | 80 kW | 80 kW | 80 kW |
| Operation | Corporation | Corporation | Corporation | Corporation |
| Electricity use | Self-consumption | Self-consumption | Self-consumption | Self-consumption |
| Price | KRW 1000 | KRW 1000~10,000 | KRW 1000~10,000 | KRW 1000~10,000 |
Table 5.
Simulation results for each scenario.
| Additional Electricity Bill | KRW/Month | 1000 | 2000 | 3000 | 4000 | 5000 | 6000 | 7000 | 8000 | 9000 | 10,000 |
|---|---|---|---|---|---|---|---|---|---|---|---|
| Scenario A | South Koreans’ acceptance (%) | 72.36 | 71.83 | 71.37 | 70.73 | 69.40 | 67.06 | 63.42 | 59.80 | 56.71 | 54.32 |
| Scenario B | South Koreans’ acceptance (%) | 73.01 | 72.60 | 72.05 | 71.19 | 69.63 | 66.90 | 64.01 | 60.82 | 57.09 | 53.74 |
| Scenario C | South Koreans’ acceptance (%) | 50.00 | 38.25 | 34.34 | 32.97 | 32.37 | 32.07 | 31.90 | 31.80 | 31.73 | 31.69 |
© 2018 by the authors. Licensee MDPI, Basel, Switzerland. This article is an open access article distributed under the terms and conditions of the Creative Commons Attribution (CC BY) license (http://creativecommons.org/licenses/by/4.0/).
Share and Cite
MDPI and ACS Style
Lee, H.-J.; Huh, S.-Y.; Yoo, S.-H. Social Preferences for Small-Scale Solar Photovoltaic Power Plants in South Korea: A Choice Experiment Study. Sustainability 2018, 10, 3589. https://doi.org/10.3390/su10103589
AMA Style
Lee H-J, Huh S-Y, Yoo S-H. Social Preferences for Small-Scale Solar Photovoltaic Power Plants in South Korea: A Choice Experiment Study. Sustainability. 2018; 10(10):3589. https://doi.org/10.3390/su10103589
Chicago/Turabian StyleLee, Hye-Jeong, Sung-Yoon Huh, and Seung-Hoon Yoo. 2018. "Social Preferences for Small-Scale Solar Photovoltaic Power Plants in South Korea: A Choice Experiment Study" Sustainability 10, no. 10: 3589. https://doi.org/10.3390/su10103589
Note that from the first issue of 2016, this journal uses article numbers instead of page numbers. See further details here.