The Human Sustainability of ICT and Management Changes: Evidence for the French Public and Private Sectors


1
Laboratoire Interdisciplinaire pour la Sociologie Economique, Centre d’Etudes de l’Emploi et du Travail, Conservatoire National des Arts et Métiers, Paris 75003, France
2
Laboratoire Interdisciplinaire Recherche en Sciences de l’Action, Centre d’Etudes de l’Emploi et du Travail, Conservatoire National des Arts et Métiers, Paris 75003, France
3
Fédération de Recherche Travail, Emploi et Politiques Publiques, Paris East University, Champs-sur-Marne 77420, France
4
Laboratoire d’Economie Mathématiques et de Microéconomie Appliquée, Paris II University, Paris 75006, France
*
Author to whom correspondence should be addressed.
Sustainability 2018, 10(10), 3570; https://doi.org/10.3390/su10103570
Submission received: 11 September 2018
/
Revised: 28 September 2018
/
Accepted: 1 October 2018
/
Published: 6 October 2018
(This article belongs to the Special Issue The Impact of Technological Change on Employment, Skills and Earnings)
Abstract
:We investigate the human sustainability of Information and Communication Technology (ICT) and management changes using a French linked employer-employee survey on organizational changes and computerization. We approach the human sustainability of changes through the evolutions of work intensity, skills utilization, and the subjective relationship to work. We compare in the private sector and the state civil service the impacts of ICT and management changes on the evolution of these three dimensions of work experience. We find that intense ICT and management changes are associated, in the public sector, with work intensification and knowledge increase. In the private sector, ICT and management changes increase the use of skills, but at a rate decreasing with their intensity and without favoring the accumulation of new knowledge. However, their impacts on the subjective relationship to work are much stronger, with public sector employees expressing discouragement, as well as the feeling of an increased effort-reward imbalance when private sector employees become more committed. We find that this divergence is neither explained by the self-selection of employees in the two sectors nor by implementation of performance pay. We identify two partial explanations: one is related to employee turnover in the private sector, the other to the role of trade unions. These results suggest that the human sustainability of ICT and management changes depends on their intensity and on how their implementation takes into account the institutional context of the organization.

1. Introduction
Primarily referring to environmental and economic matters, the European agenda on sustainability now tends to include the question of work sustainability. Last decades, it has become a strategic issue for public policies and productive organizations in Europe, with the ageing of the population [1], combined with major changes since the 1980s, in public and private organizations. These changes take the form of a large diffusion of Information and Communication Technologies (ICTs) and new management tools advocated by the paradigms of New Public Management [2] and High Performance Work Organization [3]. Close to the notion of quality of work, work sustainability focuses on the “regeneration of human and social resources “[4]. Researches in social sciences explored sustainable work from different angles and developed tools to measure its various dimensions. Volkoff and Gaudard [5] argue that sustainable work depends on physical constraints, which can become harmful for physical health in the long run, but also on work organization, that may favor or alter well-being, mental health and skills’ development according to how work intensity, autonomy and workers’ cooperation are combined in the workplace. Most of this literature comes from ergonomics and it is based on case study evidence of workplaces and/or specific occupations.
In France, questions surrounding the work experience of employees have entered strongly the public debate, after what the media has described as a spate of suicides between 2006 and 2009 in large companies like France Télécom, under the pressure of major restructurings. A set of converging empirical results further established the difficulty of performing work in France. International surveys on the values of individuals revealed that the French gave work a particularly high importance while simultaneously demonstrating reluctance about the place that it took in their lives, revealing a contradiction that generated unease between the growing demands of work on one side and the need to protect their personal lives on the other [6]. Furthermore, between 1995 and 2015, French workers have faced a slow but persistent degradation of their working conditions, creating a vulnerability to work-related risks above the European median [7]. As possible sources of this deterioration of the quality of working life, several authors have emphasized the effects of changes in productive organizations since the 1980s.
If the context of organizational change is often described as one of the main culprits in jeopardizing the sustainability of work, only a few empirical studies based on quantitative data address this issue. There is a clear division between authors who stress the role of organizational changes in the intensification of work and those who emphasize the mutual gains for firms and workers through improved efficiency and enrichment of work [8]. Furthermore, some authors argue that with New Public Management the state civil service has moved towards the practices and values of the private sector [2,9] even though other influences also prevail. It is therefore relevant to consider how these changes impact working conditions in both institutional sectors. Some empirical studies have shown that organizational changes did not have the same effects in the two sectors. For instance, [10] found that the methods developed in the private sector affected workers’ autonomy differently when applied in the public sector.
We contribute to this debate showing evidences for France. We study how indicators of change in private sector organizations and in the State civil service relate with indicators of evolution in the work experience of employees. To our knowledge, it is only in Norway [11] and Britain [12,13] that attempts to analyze the dynamic dimension of the relationship between workplace practices and employee outcomes have been made using representative datasets. In addition, we consider multiple dimensions of both organizational changes and work experience. We summarize organizational changes with two continuous indicators that describe the evolutions in the use of ICTs and management tools [14]. Likewise, we consider three dimensions of work sustainability reported by employees: work intensity, skills utilization, and the subjective relationship to work.
We use a distinctive survey on organizational change and computerization (Changements Organisationnels et Informatisation, COI) which has three remarkable features: it is nationally representative; it is a linked employer-employee survey; and it covers both the private and the public sectors. ICT and management changes measurements are based on employer’s answers to a specific section of the survey while sustainability indicators rely on the responses of employees working within the responding organizations. Our main finding is the identification of a divergence between the public and the private sector in how organizational changes driven by the adoption of new ICT and management tools interact with the subjective relationship to work. We further discuss this result by considering and testing possible explanations related to institutional differences between the two sectors.
2. Materials and Methods
2.1. Basic Econometric Model
Work is sustainable if it allows workers to maintain three major resources: health, skills, and engagement. Occupational health scientists have showed that some factors of the psychosocial work environment to which employees are exposed are likely to damage their health. Among them, intensified workload with little control [15] has negative impacts on physical and mental health. Both job control and skills development depend on skills utilization [16]. A job where employees have little or decreasing opportunities to use their skills is detrimental to their cognitive and emotional functioning [17,18]. The underutilization of skills is also a source of skills obsolescence and human capital depreciation [19]. If the objective characteristics of the work environment are key, the growing importance of the subjective relationship to work has also been stressed in the literature [20,21]. For instance, the perception of imbalanced reciprocity or unfairness at the workplace interferes both with work engagement and with health [22,23]. Hence, as dependent variables in our model, we consider the evolution of three dimensions of work experience likely to be influenced by organizational changes and contributing to the sustainability of work: work intensity, skills utilization, and the subjective relationship to work.
The intensity of organizational change is the independent variable we choose to focus our attention on. In our model, we are going to capture its influence with a quadratic form, involving two types of change. Indeed, we assume that tools used by organizations reflect models of organized action and that an entrepreneur reveals her or his intentions of changes through the adoption or dropping of tools. As a result, the diffusion dynamics of new equipment and tools reflects the intensity of organizational changes [24]. We distinguish two types of tools: those that relate to the management of information systems and those that concern the management of productive activity. ICTs are part of the first family. The rapid decline in the relative prices of computer equipment and the growing scope of its applications due to technological progress, as well as network effects, have fueled their diffusion. Management tools like just in time production or quality certifications are part of the second family. They relate with the diffusion of management paradigms like High Performance Work Organizations in the private sector and New Public Management in the public sector.
The distinction between these two broad types of tools allows to cover a large set of organizational changes and to consider the consequences of their joint adoption for employees’ work experience. Indeed, the literature on productive complementarity argues that it is their joint use that yields the highest performance impact in private as well as public sector organizations [25,26,27,28,29]. Additionally, employees’ work experience is more sensitive to the cumulative adoption of tools or practices than to the implementation of any specific one [30]. As the number of high performance practices increases, their positive effect on workers’ well-being decreases and eventually becomes negative, especially for self-esteem and satisfaction [31]. Thus, if the joint adoption of tools is beneficial for efficiency, it could be to the detriment of employees’ quality of working life, which questions the human sustainability of economic performance.
The generic model we estimate is the following:
identifies the change in work experience indicators for the worker i in the productive organization j. This change is captured by binary or ordinal variables. The X and Y vectors represent control variables defining, respectively, the characteristics of the worker i and of his employer j. and are, respectively, the mean centred indicators of changes in ICTs and in use of management tools for employer j. Finally, i is a random error term specific to worker i. All the regressions we run are weighted to take into account the complex sampling frame of the survey. The quadratic form of the specification we choose allows for nonlinear effects of organizational changes. Beyond some intensity thresholds, a mitigation or aggravation of the influence of changes on work experience indicators could occur. The last variable is an interaction term between the two types of changes capturing the impact on work experience indicators of simultaneous changes in ICTs and management tools.
Specification (1) is a first differences model chosen to eliminate all constant fixed effects in the 2003–2006/2007 period of observation, like those created by the subjective perception of employee work experience. Thus, the unobservable heterogeneity that we cannot control here would play through omitted variables influencing simultaneously organizational changes and the evolution of the perception of working life.
Considering that we are only looking for an evaluation of the partial effects of explanatory variables, we estimate the generic specification (1) at the sample mean using a linear model. In fact, as stated by Wooldridge [32], using linear estimation of a binary or ordinal variable is correct as far as the estimated coefficients are not used for the purpose of predictions. This choice has consequences on the interpretation of marginal effects as can be seen from the influence of changes in ICT tools:
This effect varies with the intensity of changes both in management and in ICT tools. The estimated coefficient measures the marginal effect of changes in ICT tools when both types of changes are at the sample mean (). As the quadratic form in specification (1) allows for both non-constant returns and complementarity effects in the influence of changes, a complete picture of the relationship requires estimation at various points of the distributions of changes. We have run these estimations and we will use their results in interpreting the results at the sample mean, but we will not present tables for them.
Furthermore, we have considered the possibility of a voluntary ex ante selection of workers in the sectors. We perform the Heckman two stages method. The first stage consists in estimating the choice of sector by the worker with a probit model. The second stage takes into account this possible voluntary selection augmenting specifications (1) with the inverse Mills ratio (or ). This ratio, which corrects the omitted variable bias, is calculated from the estimated results of the first stage regression. We use two sets of instrumental variables to identify our model. The first contains indicators describing the occupation held by the father of the worker when she or he was eighteen, and the second identifies whether her or his mother was of French nationality. Indeed, the assumption of social reproduction predicts an influence of parental choice on the career paths for the children. In addition, the preference for employment in the public sector can be part of a public sector motivation, which foundations may rely on parental education. Finally, foreign origin is usually an obstacle for entry into the French civil service. We will present further specifications in Section 4, with their associated theoretical hypothesis.
2.2. Data, Measurement Frame, and Descriptive Statistics
2.2.1. A Linked Employer-Employee Survey
We rely on the linked employer-employee survey on organizational change and computerization (COI 2006), which includes a survey of private sector organizations (COI) as well as a survey of the State civil service (COIFP). COI 2006 has been carried out by the National institute of statistics and economic studies while the scientific guidance of its development took place at Centre d’Etudes de l’Emploi (CEE). Random samples of organizations with 10 employees and more have been selected in both sectors. Each survey has a specific questionnaire with a common architecture, and mostly covers a similar set of information on changes in the organization of productive units. The survey has been conducted in 2006 in the private sector and 2007 in the public sector. The questionnaire includes a set of retrospective questions where the respondent describes the situation of the organization in 2003 in addition to the information provided for the year of the survey. This allows us to measure the organizational changes that occurred between 2003 and 2006/2007.
The questions capturing work experience come from a unique questionnaire addressed to employees whatever the institutional characteristic of their organization. Employees have been randomly selected in responding organizations. Once sampled, employees have been interviewed about 12 months later, with the consequence that they have at least one year of seniority.
In order to study a comparable population from the two sectors in terms of occupations, we took out from the sample of private sector employees those whose occupations are not represented in the public sector like salespersons, drivers or labourers. Reciprocally, we excluded from the study magistrates, teachers and agents of the Ministry of Defence because their work activity had no equivalent in the private sector. We merged the employer and employee sections of each sector survey in the final sample. This leads to restricting the private sector to units of 20 or more employees as private employees have not been sampled below this size threshold. The resulting working sample is representative of the population of stable employees with occupations existing in both the private and the public sector and belonging to private sector companies with 20 or more employees or public organizations with 10 and more employees. It contains 11,731 employees working in 5643 enterprises and 946 public agents working in 298 organizations. We replicated our analysis with a more restrictive sample of the private sector including only banking and insurance and business services in the private sector and found very similar results that we do not show here.
2.2.2. The Intensity of Organizational Change
The analysis of organizational changes in the private and public sectors requires addressing three methodological issues. First changes measured in the private and the public sectors have to be comparable. This requires the identification of a set of tools used in both institutional sectors. We conducted a thorough comparison of questions concerning ICTs and management tools in the two employer questionnaires and selected questions about similar or comparable tools. Fifteen ICT tools and thirteen management tools came out from this analysis as common to both sectors. This list reflects the fact that like in many European nations, the reform of the French civil service relies on the import of management tools used in the private sector [9]. Table A1 in the Appendix gives the list of ICTs and management tools and the percentage of organizations using them in 2003 and 2006/2007 in the private and the public sector.
Second, because no single tool or equipment can summarize by itself the heterogeneity of observed management strategies, we have to find a way to capture the diversity in the uses of modernizing tools by productive organizations. We thus choose to synthesize the use of ICTs and management tools with composite indices that take into account this diversity. We apply Multiple Correspondence Analysis (MCA) to produce a simplified low-dimensional representation of the information contained in the large frequency table where each item response, identifying whether the company uses each of the listed tools, is coded as a dummy variable. The MCA generates quantitative scores, called dimensions, which are linear combinations of the dummy variables that maximize the average correlation among them. Each of these new dimensions can be considered as a synthetic indicator whose interpretation rely on the variables that take a significant part in their construction. We limit ourselves to the first dimension of the MCA, which reflects the intensity in use of the selected tools. On this first dimension, organizations using several tools jointly are opposed with organizations that are non-users or that are only using a small number of them. More advanced tools that are at the beginning of their diffusion curve in the population of organizations score higher in the composite index. Thus, a composite index with a higher value indicates that the organization uses a larger set of more advanced ICT or management tools. We interpret the vector of coefficients in the linear combination of the dummy variables along this first dimension as a metric determined by the set of situations taken into account in the analysis and corresponding to a given type of tools in an institutional sector at a given date.
Third, we have to measure the change over time and in the two sectors of our composite index. The COI survey collects information at the date of the survey (2006 for the private sector and 2007 for the state civil service) and for 2003 through retrospective questions. We could perform the MCA for both dates and both sectors with the disadvantage of obtaining a representation of the data determined in different situations in time. We therefore make an additional hypothesis for comparison. As the date of the survey is an implicit reference in the retrospective questions throughout the questionnaire, we apply to the tools used by the productive organizations in 2003 the metric conditioned by the situations at this date. In computational terms, this calculation amounts to applying the vector of coefficients defining the position of the productive organizations on the first dimension of the MCA conducted for the year 2006 to the vector of the tools used in 2003 (Table A1 in the Appendix). We obtain a synthetic indicator of the tools observed in 2003, expressed in the metric of 2006. As the private sector is an implicit reference for the tools used in the public sector, we also use this private sector baseline metric to compute the 2003 synthetic indicator for the public sector. We then simply compute the change indicator as the first difference between the intensity in use of modernization tools observed in 2006/2007 and in 2003 (expressed in private sector base 2006).
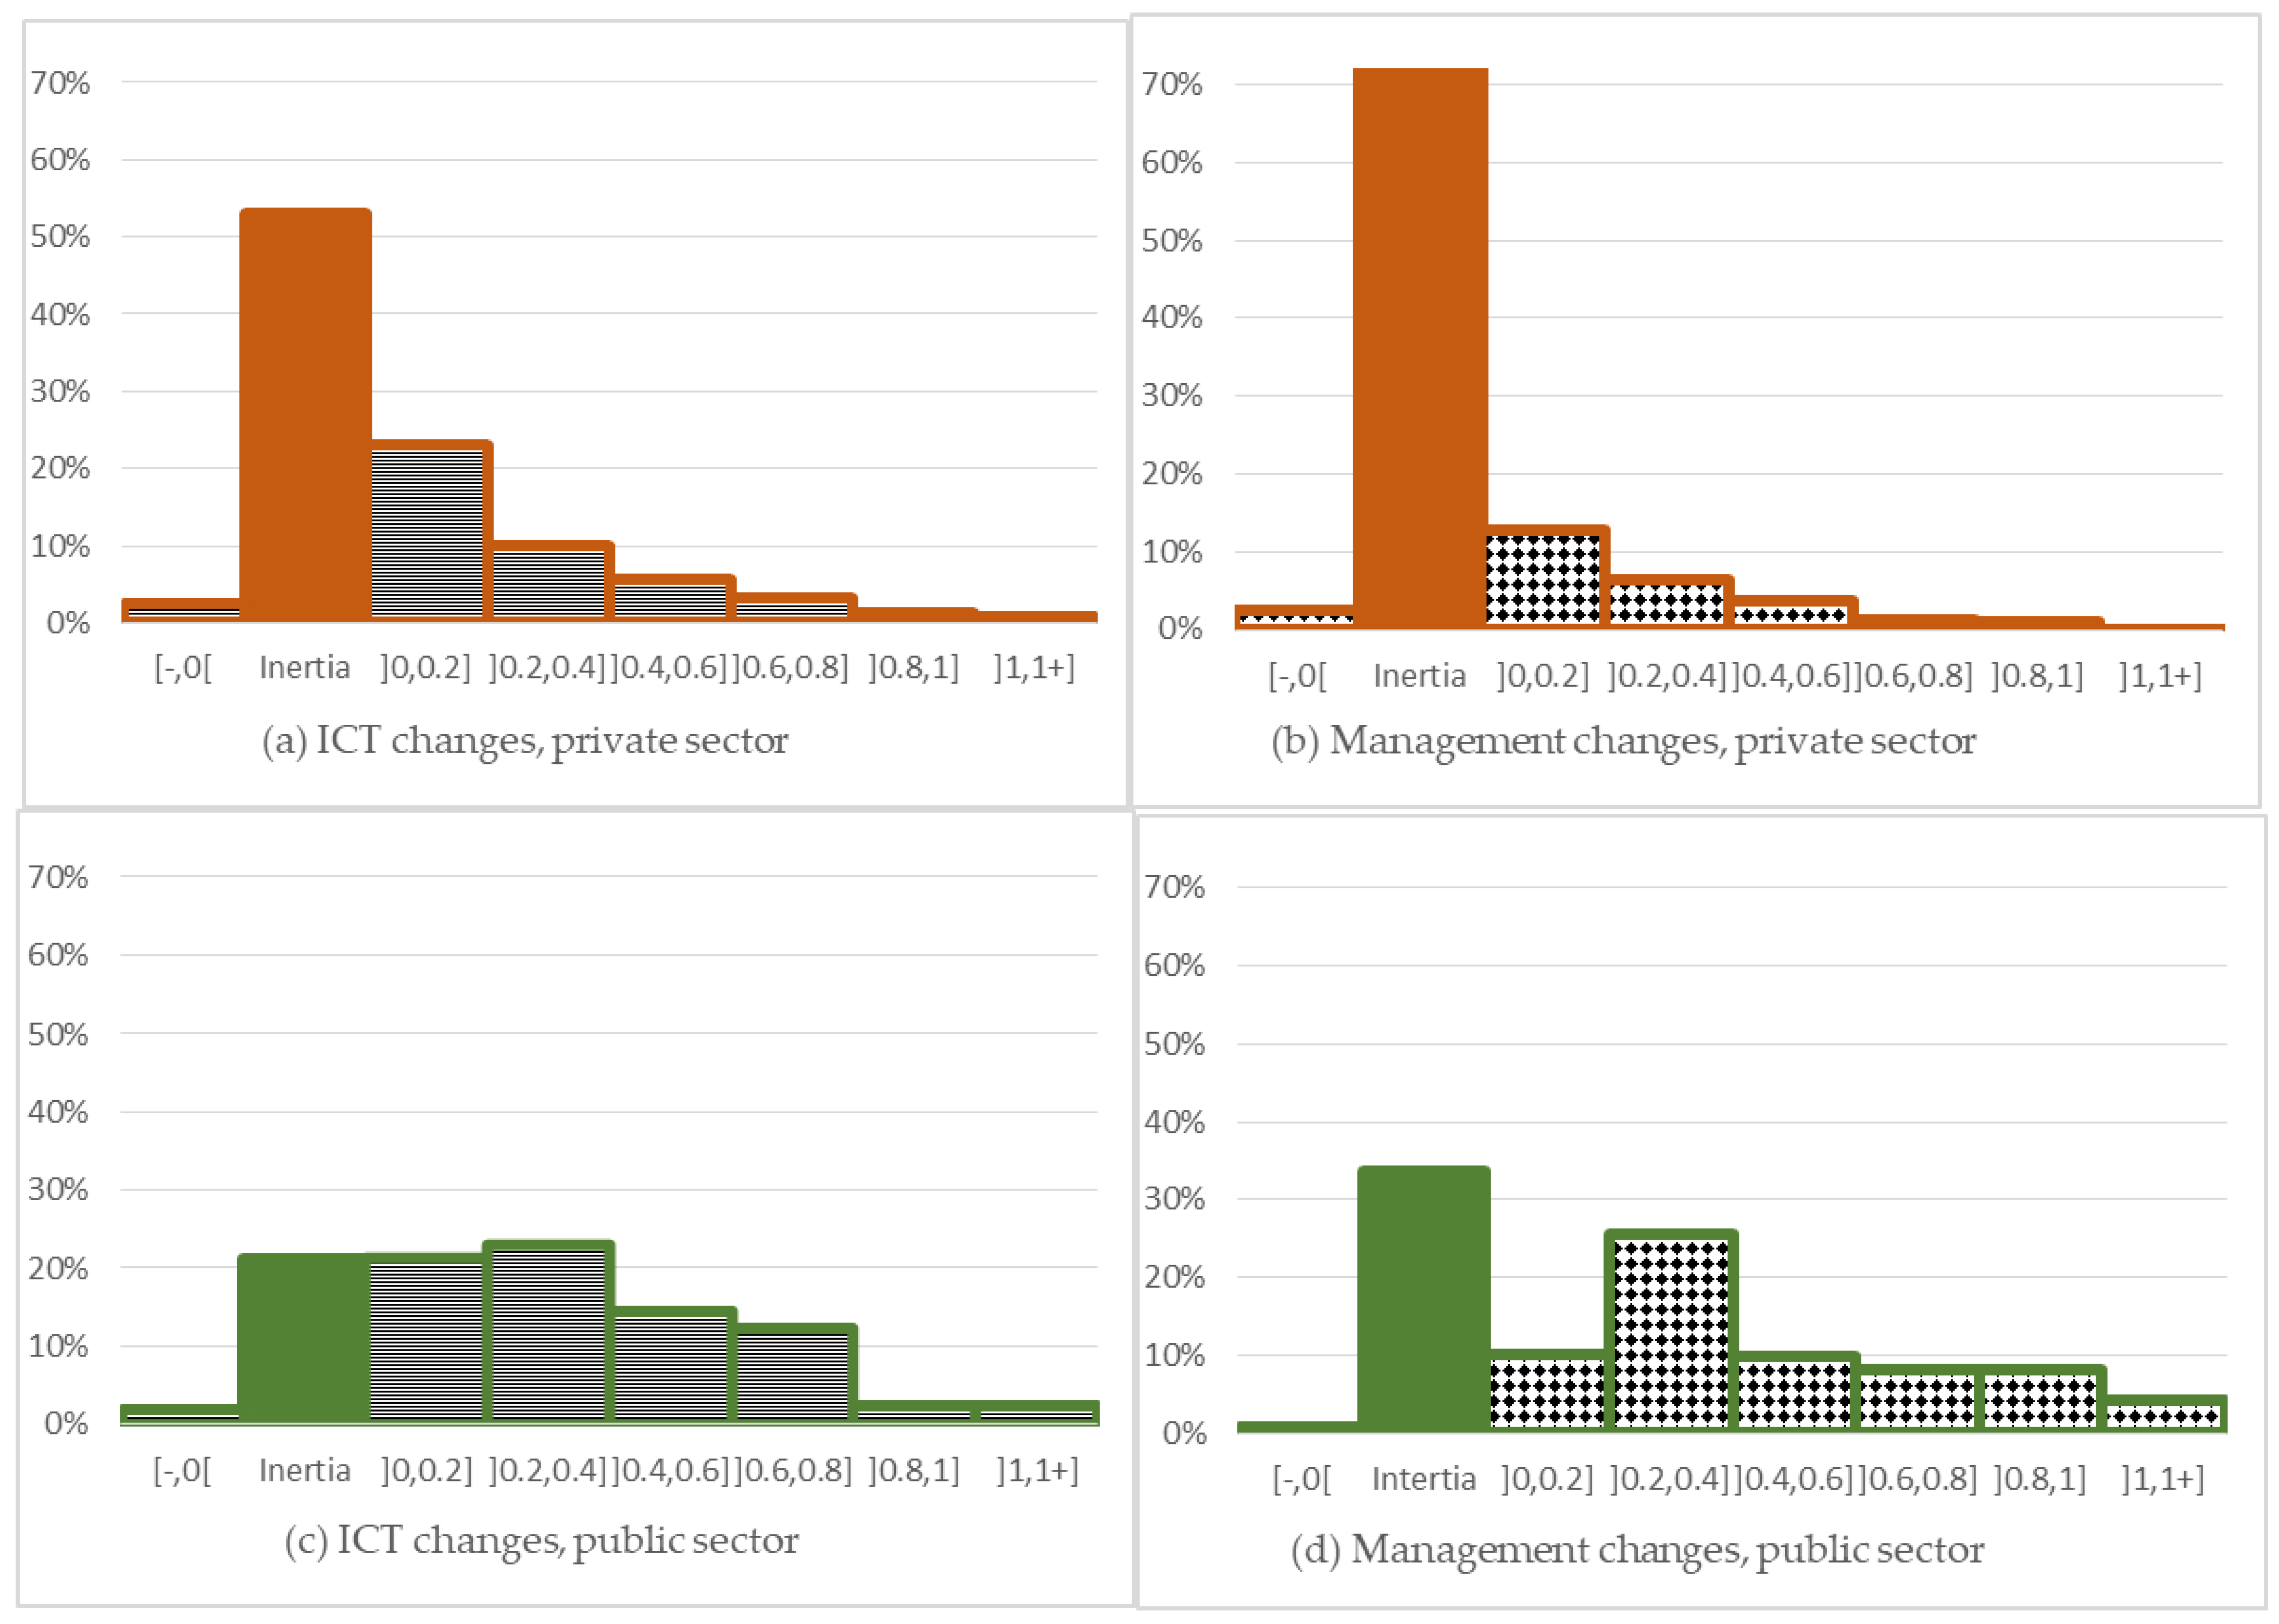
Figure 1 plots the distribution of our indicators of ICT and management changes in the private sector (orange) and in the public sector (green). One striking feature in Figure 1, which is contrary to common belief, is the higher inertia of private sector companies compared with public administrations. In the private sector, 53% of firms have not implemented any ICT changes (a) and 72% any management changes (b) when these figures amount to, respectively, 21% (c) and 34% (d) of organizations in the state civil service. As a result, there is substantial average difference between public and private employers. The average change was twice as large in the State civil service for ICT changes and more than four times greater for management changes. Furthermore, in the private sector, the share of companies having implemented changes decreases with their intensity when situations are more contrasted in the public sector. The mode of the two distributions of changes in the private sector is inertia. In the public sector, intermediate intensity of changes [0.2, 0.4] constitute the modal group for ICT changes and the second modal group for management changes which distribution is bimodal. It is also interesting to note that private and public sector organizations seldom indicate that they drop tools. The change dynamics is that of an accumulation of new tools rather than a process of substitution between them. Finally, the ICTs dynamics is stronger than the management tools dynamics, especially in the private sector where only a small share of companies has implemented management changes.
To seize how ICT relates with management change, we have crossed two dummy variables indicating whether the organization had implemented a change other than marginal (changes strictly lower to 0.2). We are, thus, able to identify four groups of organizations: stable ones, with substantial ICT changes only, with substantial management changes only, with both substantial ICT and management changes. The top part of Table 1 shows the exposure of employees to these four types of organizational contexts in the private and public sectors. It confirms the findings of Figure 1 and gives further information. About 60% of employees in the private sector work in companies that have remained stable as they have not implemented any substantial ICT or management changes. The most frequent type of change in this sector is ICT changes only, which affects 21% of employees. In contrast, only 23% of public sector employees belong to stable organization and 37% of them are exposed to substantial ICT and management changes. Overall, the working environment of employees in the state civil service seems more unsettled than that of private sector employees.
2.2.3. The Dependent and Control Variables
We consider the evolutions of three dimensions of work experience: work intensity, skills utilization, and the subjective relationship to work. We distinguish two indicators of work intensification. The first measures whether the constraints weighing on work pace decreased, increased, or remained stable over the last three years. The questionnaire identifies five types of constraints according to their sources: internal demands, external demands, deadlines or production standards to meet, automatic movement of a product or part or machine pace, and the work of one or more colleagues. The measurement of work intensity through constraints weighing on the work pace is a classical approach in working conditions surveys, in which it is implicitly assumed that the technical and organizational environment regulates workers’ activity. The inclusion of the reference to an external demand requiring an immediate response from the employee augmented this classic measure to adapt it to service activities. The second indicator measures whether activity peaks became more or less frequent over the past three years or whether their frequency remained unchanged. This second indicator complements the first one by further assessing work intensity in the service sector where it is even more difficult to control the pace of work, as most of the time the work activity cannot be isolated from the constraints imposed by delivery of the service.
We approach skills utilization with two complementary indicators. The first one measures the evolution of skills use over the past three years. This indicator tells us whether employees need to exercise their knowledge while working more or less intensively than before. The second indicator seizes whether employees feel that they have the opportunity of learning new things at work. We are thus able to assess both the change in skills use and the acquisition of new knowledge. However, increased skills use or knowledge are likely to make work richer and more interesting but also more complex.
Finally, we measure the evolution of the subjective relationship to work with two questions. The first one captures the evolution of employees’ involvement by a direct answer to the question: “Do you get involved more, less, or as much as you did three years ago or when you arrived at the company (if recently hired)?” The COI survey supplements this measure by an assessment of the recognition of employees’ work by the employer. This question, asked at the very end of the questionnaire, determines whether employees believe that their work is recognized at fair value upon consideration of what they bring to their company and the corresponding benefits they get. It measures the employees’ perception of the fairness of the treatment that they receive in the workplace.
We report descriptive statistics across sectors for these indicators in Table 1. Public sector employees report slightly more frequent work intensification (41.3% vs. 39.8% for increased constraints on work pace and 42.2% vs. 38.5% for more activity peaks) as well as more frequent opportunities of learning new things at work (81.6% vs. 73.8%), but without higher increase in skills use (40.1% vs. 41.8%). In addition, employees of the State civil service more often report that they are less involved (30.6% vs. 33%) and that they do not feel recognized at their fair value (61.2% vs. 55.1%).
Control variables in our regressions benefit from the linkage between the employer and employee survey, which makes high quality and detailed information on both levels available. From the employer’s side a first set of dummies indicate the main sector where the company operates and in the State civil service the relevant ministry; a second set of dummies indicate the size of the interviewed employer unit. From the employees’ side, the control variables taken into account are as follows: sex, seniority, age, education, marital status, spouse’s employment status (employed or non-employed), weekly working hours, part-time work, employment status, and pay net of all social security contributions. Estimated regressions of (1) also include the inverse Mills ratio to control for the ex-ante self-selection of employees in the private and public sectors.
3. Results
We present successively the results on the impacts of ICT and management changes on the evolution of the three dimensions of sustainable work, starting with work intensity.
3.1. Work Intensification in the Public Sector for Intense ICT-Related Organizational Changes
Table 2 displays the estimated results for the indicators of work intensification: the evolution of constraints weighing on the work pace and the evolution of activity peaks. It shows the coefficients associated with the quadratic form for ICT and management changes. It does not show the control variables coefficients except for the inverse Mills ratio (Lambda). As an illustration, the coefficient reported in the first row and the first column identifies the marginal effect of the indicator of ICT changes (Ch. ICT) on the evolution of constraints on the work pace in the private sector, measured at the sample mean. It is positive and non significant (β = 0.083, t = 1.585, p > 0.1).
The evolution of constraints weighing on the work pace seems to be relatively unaffected by organizational changes in the private sector as none of the coefficients reported in the first column of Table 2 is significant at conventional statistical thresholds (t-values, p < 0.05). The estimations at various points of the distribution of changes (which we do not report here) confirm this result: we observe only weak positive marginal effect of ICT changes on the evolution of work pace constraints for median values of the two indicators of change. The second indicator of work intensification, the evolution of activity peaks, shows similar results at sample mean (third column of Table 2) although at the second-order, ICT changes have a weakly significant negative impact (β = −0.196, t = −1.782, p < 0.1). However, the estimations at various points of the distribution of changes do not suggest a decrease in the incidence of activity peaks in response to organizational changes in the private sector.
Results are somewhat more conclusive in the public sector for intense ICT related organizational changes. The second column of Table 2 shows that at the second-order the coefficient associated with ICT changes is positive and weakly significant (β = 0.262, t = 1.856, p < 0.1), suggesting a U-shaped relationship. The estimations at various points of the distribution of changes confirm this relationship. In administrations with high intensities of both types of changes, state officials feel reinforced obligations to adjust to an imposed work pace. In the fourth column of Table 2, the results for activity peaks show a similar profile as those for work pace constraints, with a positive but weakly significant coefficient (β = 0.250, t = 1.939, p < 0.1) associated with ICT changes at the second order. However, the estimations at various points of the distribution of changes show at best a positive marginal effect of management changes on increased activity peaks, which increases in value and significance with the intensity of organizational changes.
Finally, the coefficients associated with lambda are negative but non-significant. Therefore, the inclusion of the inverse Mills ratio in the regressions has not altered the result.
3.2. Contrasted Change Related Skills Utilization in the Private and Public Sectors
In contrast to the results discussed so far, the evolution of skills utilization reported in Table 3 shows a clear difference between the private and the public sectors. Public officials in the State civil service do not seem to perceive organizational changes as inducing changes in the use of their skills (column 2) and the estimations at various points of the distribution of ICT and management changes confirm this result. In contrast, private sector employees perceive an increased use of their skills with ICT and management changes, but at a rate that decreases with the intensity of changes (column 1). Indeed, first order terms are positive and significant (β = 0.098, t = 1.987, p < 0.05 for ICT; β = 0.194, t = 2.230, p < 0.05 for management), second order terms are negative (β = −0.241, t = −2.328, p < 0.05 for ICT; β = −0.201, t = −1.369, p > 0.1) for management and the interaction effect is positive (β = 0.300, t = 1.899, p < 0.1). However, the positive impact on skills use is stronger for management changes than for ICT changes: the first order effect is of higher magnitude and the second order effect is non-significant. The estimations at various points of the distribution of changes show that the increased use of skills vanishes when ICT changes reach their higher decile, but remains positive and significant, albeit with a lower magnitude, for management changes. It is striking to see that employees in the private sector do not seem to accumulate new knowledge with ICT and management changes (column 3). The negative impact of ICT changes at the second order on learning new things at work (β = −0.111, t = −2.095, p < 0.05) does not lead to any significant result in the estimations at different points in the distribution of changes. Thus, in the private sector, changes contribute to an increased utilization of skills, but with some limitations. They increase the use of skills, but at a decreasing rate and without favouring the accumulation of new knowledge. This limitation seems to be stronger for ICT than for management changes.
If skills use appears unaffected by ICT and management changes in the public sector, employees seem to accumulate new knowledge with some combinations of changes. The last column of Table 3 shows a positive but weakly significant coefficient associated with ICT changes (β = −0.076, t = 1.808, p < 0.1) and the estimations at various points of the distribution of changes show positive impacts on learning new things at work for high magnitudes of changes in the two families of tools.
The coefficient associated with lambda is positive and significant in the public sector (β = 0.302, t = 2.481, p < 0.05). Hence, there is a positive correlation between unobserved heterogeneity favouring self-selection in the public sector and learning new things at work. However, the results on the evolution of skills utilization are robust to the inclusion of inverse Mills ratio in the regressions.
3.3. Diverging Impacts of Changes on the Evolution the Subjective Relationship to Work in the Two Sectors
The largest differences between the private and public sectors appear in the field of the subjective relationship to work. Actually, ICT and organizational changes seem to be more strongly affecting this subjective dimension than they are affecting the more objective dimensions of work intensity and skills utilization.
The results reported in the first column of Table 4 show that organizational changes in the private sector go most of the time with a higher involvement of employees. However, it is nonetheless necessary to distinguish between ICT and management changes. The effects of the former on the evolution of involvement at the workplace are generally limited: the first and second order coefficients associated with ICT changes are negative but non-significant (resp. β = −0.060, t = −1.269, p > 0.1 and β = −0.030, t = −0.355, p > 0.1) and the interaction term with management changes is strong and positive (β = 0.444, t = 2.993, p < 0.01). As a result, the marginal effects of ICT changes are most of the time non-significant except at the top of their distribution and for low levels of management changes, where they become significantly negative. The effects of management changes are very positive as long as their magnitude is not too large: the first order coefficient is positive (β = 0.176, t = 2.880, p < 0.01), the second order one is negative (β = −0.237, t = −1.680, p < 0.1) and the interaction term is positive (see above). Therefore, the marginal effects of management changes are positive through the distribution of both indicators of changes, but they are weaker and less significant for higher deciles. Overall management changes in the private sector help maintain employee involvement.
In the public sector, by contrast, ICT and management changes are associated with declining employee involvement. The first and second order coefficients for ICT changes are negative but the latter only is significant (resp. β = −0.001, t = −0.014, p > 0.1 and β = −0.308, t = −2.518, p < 0.05); the first order coefficient of management changes is negative and significant (β = −0.151, t = −2.316, p < 0.05 and the second order one is weakly positive and non-significant (β = 0.034, t = 0.256, p > 0.1); the interaction term is strongly negative (β = −0.485, t = −2.767, p < 0.01). The resulting marginal effects of ICT and management tools are negative along the distribution of both indicators of change, stronger and more significant for higher deciles. In the public sector, the accumulation of changes in the work environment seems to be at odds with the usual exercise of duties.
The analysis of how employees feel about the fair recognition of their work (columns 3 and 4) confirms this diversity of effects across sectors: coefficients have the same signs as those reported for the evolution of involvement, but they have different magnitude and significance level. In the private sector, the negative effect of ICT changes at the first order is stronger (β = −0.107, t = −1.866, p < 0.1) and the positive interaction term is smaller (β = 0.201, t = 1.764, p < 0.1). Consequently, we find a negative marginal effect of ICT changes on the feeling of fair work recognition, in particular when they are in the higher deciles. The marginal effects of management changes are positive and significant through the distribution of both indicators of change, except in the highest decile of their distribution where they become non-significant.
In the public sector, effects at the second order differ from those observed for the evolution of involvement. The second order coefficient of ICT changes is non-significant (β = 0.024, t = 0.229, p > 0.1) when the second order coefficient of management change is positive and significant (β = 0.355, t = 3.053, p < 0.01). Hence, compared with the evolution of involvement, the negative impact of the higher deciles of ICT and management changes are lower.
The coefficient associated with lambda is significant in the regressions concerning the evolution of involvement. It is positive in the private sector and negative in the public sector. The unobserved heterogeneity that explains self-selection into each sector has thus opposite effects on the evolution of involvement in the two sectors. It favours involvement in the private sector and hinders it in the public sector. However, regression results are robust to the control for employee self-selection. The diverging impact of changes on the subjective relationship to work in the private and the public sector is not explained by the fact that employees are differing in the unobserved characteristics that have motivated the choice to work in one sector or in the other.
4. Discussion
Although organizational changes have some common orientation in the private and public sectors, allowing for a common measure, we find a divergence between the two sectors in their impact on the subjective relationship to work. Public sector employees facing ICT and management changes express discouragement as well as the feeling of an increased effort-reward imbalance. In the private sector, mainly management changes interact positively with involvement and fair work recognition, within certain limits in terms of change intensity. In this section, we discuss these results and test three hypotheses to explain this divergence.
4.1. Does the Divergence Come From the Turnover of Unhappy Employees in Private Sector Firms?
Our first hypothesis relies on the fact that dissatisfaction with ICT and management changes could drive employees to react differently in the two sectors. When employees are unhappy with organizational changes they may opt for a withdrawal behaviour. First, they may choose to resign. Indeed, high levels of job dissatisfaction are good predictors of quits [33]. Second, as quits are costly, employees may prefer some form of internal disengagement [34,35,36,37]. However, private firms can still induce disengaged employees to quit or even chose to dismiss them. In the French public sector, on the contrary, voluntary and involuntary job exits are sporadic due to strict employment protection.
In the COI survey, employees were randomly sampled in the population of responding firms or administrations. However, at the time of the interview, some 12 months later, around 10% of selected private employees had left their company while only 4% of the public agents were missing. Therefore, we hypothesize that we could explain the increased involvement of employees in changing private companies by the exits of unhappy workers.
To test this ex post selection hypothesis, we take advantage of the sample of the employees who left the company for which they had been sampled at the time of their interview. Still, as these employees have left, we cannot observe the counterfactual subjective relationship to work, which is their work involvement and feeling of fair work recognition had they continued to work with that company. Therefore, we chose an extreme hypothesis: we assume that all of them would have declared a decrease in their work involvement and a feeling that their work was not recognized at fair value. Besides, we observe leavers during the year 2006 only. As we measure changes that have taken place during a three years’ span, we assume that the rate of voluntary exit has been the same in 2004 and 2005. Therefore, in our robustness check, we give each leaver a weight of three, bringing our sample of 1140 leavers to a size 3420 individuals.
We duplicate in the first two columns of Table 5 below the results from Table 4 using the initial private sector sample and we report in the following two columns the results using the sample of private sector employees extended with exits. Making the hypothesis that employees who left were dissatisfied does not change the influence of ICT changes on the evolution of involvement, nor on the feeling of fair recognition. However, management changes do not contribute the same to the evolution of the subjective relationship to work in this extended sample. The coefficients measuring the first order effect of management changes are close to nil and non-significant (resp. β = −0.047, t = −0.703, p > 0.1 and β = 0.038, t = 0.819, p > 0.1) when they were positive and highly significant in the initial sample (resp. β = 0.176, t = 2.880, p < 0.01 and β = 0.122, t = 2.698, p < 0.01). The second order coefficients are still negative, but their magnitudes are reduced, and it is no more significant for the evolution of involvement (resp. β = −0.237, t = −1.680, p < 0.1 and β = −0.125, t = −0.886, p > 0.1,). The interaction effect is still positive, but it is smaller for the evolution of involvement (resp. β = 0.444, t = −2.993, p < 0.01 and β = 0.297, t = 1.814, p < 0.05).
Overall, the fact that management changes interact positively with involvement and fair work recognition, when their intensity is not too high could be due to the resignation of unhappy employees. Hence the ex post selection hypothesis could contribute to explaining the favourable impact of management changes in the private sector. Nevertheless, even with this extreme assumption, the effects of management changes on the subjective relationship to work in the private sector are not as negative as those observed in the state civil service. In addition, the complementarity of ICT and management changes keeps its positive influence on involvement and feelings of fairness in opposition with the evidence in public administrations.
4.2. Does the Divergence Come From Different Impacts of the Implementation of Performance Pay?
The private sector may complement management and ICT changes with human resource management practices that favour the involvement of employees in the change process, in particular performance pay. In fact, performance pay is one of the most cited practices among the ones forming the management paradigm of High Performance Work Organization. This incentive system is likely to induce insider employees to increase their level of productive effort and to attract the most motivated outsiders to engage themselves in the productive organization.
Why do public organizations seldom use performance pay, when it has proved its efficiency in the private sector? The limited scope of the implementation of performance pay in the public sector has three main reasons [38]. First, many public agencies have multiple and complex objectives and public employees perform multi task jobs. In such jobs, performance pay may induce high effort in compensated tasks and crowd it out from uncompensated ones. Second, the performances of civil servants frequently depend on the effort and quality of the public service users who somehow coproduce with them. A well-known example of this situation is the relationship between teachers and pupils. If teachers are paid according to the performance of their pupils, they may over-invest helping those who have the best results. Finally, civil servants may have selected themselves in the public sector because of their public service motivation to participate to the goals of public institutions [39]. Hence, this intrinsic motivation may substitute for performance pay [40]. Moreover, this intrinsic motivation may be crowded out by the implementation of performance pay as this incentive system can create doubt about the fact that the public employer is completely confident about their commitment [41]. The use of a similar performance pay system in both sectors may then lead to opposite effects on the subjective relationship to work.
The “employee” section of the COI survey has a set of questions on performance pay. It shows that 11% of the private workforce has benefitted from the introduction of performance pay between 2003 and 2006 while only 5.5% of public agents were concerned by such an implementation. To test our hypothesis about the role of performance pay on the subjective relationship to work, we augment Equation (1) with a dummy variable measuring the introduction of performance pay between 2003 and 2006 and two interaction terms between this dummy and the measure of each type of changes. The positive or negative effects of these interaction terms signals whether performance pay eased or amplified the relationship between organizational changes and the evolution of the subjective relationship to work.
We display the full results in Table A2 of the appendix. As expected, the introduction of performance pay has a positive effect on the evolution of involvement in the private sector, but not in the public sector. However, it has almost no moderating influence on the impact of changes on the subjective relationship to work. No interaction terms with performance pay are significant in the regressions on the evolution of involvement. Two interaction terms with ICT changes are significant as far as fair work recognition is concerned: the interaction with the second order term is negative in the private sector (β = −0.313, t = −1.661, p < 0.1) and the interaction with the first order term is positive in the public sector (β = 0.545, t = 2.662, p < 0.01).
In Table 6, we summarize the marginal effects of ICT and management changes on the evolution of involvement and the feeling of fair recognition for the average employee according to her eligibility to performance pay in the last three years. We also report the result on the total sample of employees for sake of comparison (shade colour). When there is no performance pay, the impact of management changes on both the evolution of involvement and the feeling of fair work recognition remains opposite in the two sectors, positive in the private sector and negative in the state civil service.
In the group of workers who benefit from performance pay, results on the subjective relationship to work do not seem to converge either. Interestingly, in the private firms, the implementation of performance pay seems to deteriorate the positive effect of management changes on the feeling of fair work recognition observed in the whole sample (resp. m = −0.077, t = −0.60, p > 0.1 and m = 0.126, t = 2.53, p < 0.05). In the state civil service, when workers are eligible to a compensation premium, ICT changes impacts positively the feeling of fair recognition of the average public agent (m = 0.462, t = 2.32, p < 0.05), as if this premium was compensating for an effort to assimilate the new knowledge associated with technological innovation.
4.3. Does the Moderating Role of the Presence of Union Representatives Explain the Divergence?
The way organizational changes are discussed and assessed when implemented at the workplace could also influence their impact on the subjective relationship to work. We will consider here the potential role played by union delegates. First, unions can have a regulating influence both on the nature of changes and on the way they are implemented. Without institutional representation of the workforce, it is more difficult for a common claim to emerge from workforce requests. In case of a significant power of consultation, employees can expect to suggest some adjustments in changes to make them more advantageous. Activation of formal exchanges between employers’ and employees’ representatives may limit the negative consequences for employees through their influence on the content of changes, by negotiating compensation possibilities in terms of wages, training, job security, by fostering a climate of trust that allows the expression of employees and by ensuring a supporting social role. Indeed, some evidence that the detrimental effects of changes on workers’ job anxiety vanish when union representatives are involved in their process of introduction have been found from a large British employer-employee dataset [13].
Second, the unions may have a revealing influence on the consequences of the changes. The presence of employee representatives contributes to the development of a cognitive context that encourages the expression of criticism [42]. Information exchanges between union delegates and the workforce expose the difficulties and defects associated with organizational changes and negative perception is likely to be increased. If the changes involve increased efforts, higher skills obsolescence or more job insecurity, then worker’s feeling of equity and security may be damaged. Furthermore, if management does not properly involve the unions in the process of negotiating the implementation of changes or refuse to study their demands, employees may interpret the process of changes as unfair. Unions at the workplace may then act either as a regulator when their participation to the process of the changes mitigates their adverse effects for employees or as a pointer when they reinforce the perception of their negative consequences.
The capacities of unions to interfere within the process of organizational changes depend on their local strength and on institutional features [43]. Differences in the legal requirements to negotiate within private and public organizations explain the uneven capacity of employee voice to accompany the progress of innovative projects. Thereby, the right to negotiate in the private sector for unions and the topics of bargaining alike differ from those in the state civil service.
In fact, in France, union representatives are entitled to the right of negotiation in the private sector while they only have the right of consultation in the public sector. Hence, we could say that their regulating power in administrations is restricted. However, this legal restriction is actually not so clear as the law authorizes quasi-negotiations about working conditions [44]. Bilateral overviews, informal consultations, working groups and preparatory meetings usually organized before the meetings of the Joint Technical Committee (Comité technique paritaire) are all part of these quasi-negotiations. Those committees involving employer and employee representatives are required to transmit a consultative advice about the general organization of public services, tools and methods of work, major evolution of professional activities, and especially the use of new technologies. Furthermore, in the private sector since 1982, the Auroux laws create a set of obligations to negotiate but a large fraction of firms does not fulfil this legal requirement [44]. Therefore, it is difficult to decide whether union representatives have more power to regulate in the private sector or in the public sector.
However, some reasons plead for a more regulating influence of union representatives in the private sector. Because of their obligation to negotiate in the private sector, union representatives would have more influence on changes. Organizational changes are also more likely to be regulated through compensation, as it is possible to negotiate wages within firms while pay raises are negotiated at a national centralized level in the state civil service. Likewise, union delegates may negotiate employment protection against active participation in the implementation of management and ICT changes. Additionally, the most important changes in the organization of the state civil service for the period covered by the data were decided by the legislative route and were mainly impossible to negotiate at the local level (for instance the LOLF- organic law of the finance law of 1 August 2001 and the e-administration). Conversely, the detailed information transmitted by well-informed public sector unions may explain why the changes, and especially management ones, have negative impacts on the evolution of work involvement and the feeling of fair work recognition.
In fact, unions are more established in the State civil service. Statistical figures from the COI survey show that 38% of public agents have a union affiliation against only 15% of private employees. Moreover, 73% of these private employees declare the presence of a union representative in the firm against 90% of the employees of the state civil service.
To explore the moderating effect of trade union presence on the relationship between changes, evolution of involvement and feeling of fair work recognition, we add to specification (1) a dummy variable indicating union presence and interact it with indicators of ICT and management changes. The significance of the interaction terms reflects the moderating influence of trade union presence on the relationship between changes and the evolution of the subjective relationship to work (Table A3 in the Appendix). Table 7 reports the marginal effects of changes for the average employee in the public and private sectors, according to trade union presence.
In the private sector, the positive effects of management changes on the subjective relationship to work seem to be explained by the regulating effect of trade union presence. In firms without unions, there is no more significant influence of management changes on the evolution of involvement and the feeling of fair recognition (resp. m = 0.125, t = 1.48, p > 0.1 and m = 0.001, t = 0.02, p > 0.1). In the public sector, we can observe the opposite effect: in public administrations trade unions, have a revealing influence, informing civil servants on the adverse impacts of management changes. In the absence of trade unions, the effects of management changes on the evolution of involvement and the feeling of fair work recognition would be the same as in the private sector (resp. m = −0.043, t = −0.22, p > 0.1 and m = 0.015, t = −0.01, p > 0.1). The different moderating roles of trade unions facing management changes contribute to explaining the observed divergence in the evolution of the subjective relationship to work.
For ICT changes, the presence of trade unions accentuates the deterioration of involvement and of the feeling of fair work recognition in the private sector (resp. m = −0.118, t = −2.08, p < 0.05 and m = −0.132, t = −2.04, p < 0.05) but has no specific influence in the public sector (resp. m = 0.041, t = 0.47, p > 0.1 and m = −0.074, t = −1.11, p > 0.1). Hence, in the private sector, union delegate would have a higher capacity to regulate management changes than ICT changes.
5. Conclusions
This contribution breaks new ground in the assessment of ICT and management changes by analyzing how it impacts sustainable work. It also offers a comparative perspective between the private and the public sectors that gives a better understanding of the role played by the institutional context in how employees cope with organizational change.
This assessment is based on a unique linked employer employee survey on organizational change and computerization (COI). This survey approaches the evolution of three dimensions of sustainable work, work intensity, skills utilization, and subjective relationship to work, through questions directly addressed to employees, while asking employers about the changes they have implemented in their workplace over the past three years and resulting in two continuous indicators describing the changes in the intensity of use of ICT and management tools. We related sustainable work with organizational change using an econometric model with two innovative features: it takes into account the self-selection of employees in each sector and includes a quadratic form for ICT and management changes, allowing for threshold effects beyond some intensity level, as well as for a complementarity between the two types of changes.
Our first result is thought provoking as we find that in the first decade of the millennium in France, organizational changes were more intense in the state civil service than in the private sector. This confirms the importance of the changes in the work environment of civil service officials in the context of the modernization of the State. However, these reforms have not translated into a systematic intensification of work. It is necessary to achieve very high levels of changes to record an increase in pace constraints or more frequent activity peaks. Thus, only employees whose administrations have introduced radical changes (i.e., the cumulative adoption of new ICT or management tools) had to cope with work intensification.
In the private sector, the changes were on average less intense and not significantly associated with variations in the intensity of work. They appear to be related to an enrichment of work that does not lead however to the accumulation of new skills. Indeed, employees report that their skills are used more intensively than before but do not report facing increased opportunities of learning new things at work.
It is in the more subjective areas of employee involvement and fair work recognition that the differences between the private sector and State civil service are the largest. Employees of the state express discouragement when faced with changes. An average intensity of change in management tools and a high intensity of ICT changes lead to a decline in employee involvement. In addition, a combination of changes in both domains in the state civil service has an additional negative effect on the evolution of involvement. On the contrary, in the private sector, organizational changes increase employees’ involvement as long as their magnitude is not too high.
Changes in both sectors also influence employees’ assessment of the fairness of treatment at work. Private sector employees reported a feeling of fair work recognition that decreased with an increasing use of ICT tools. However, the balance between the investment in work and the benefits obtained appears to improve if the management changes are not very intense. However, the combined presence of changes in both domains strengthen this effect in the private sector, in contrast to the public sector, in which the combination of changes reinforces the perception of an effort-reward imbalance.
We tested three possible explanations on the causes of this sector-based divergence in the area of the subjective relationship to work. We ruled out the possible role of the implementation of performance pay. Two other explanations partially clarify the seemingly more virtuous nature of management changes in the private sector and thus contribute to the explanation of the divergence. First, dissatisfied workers tend to leave their company while public agents are more stable even if they face more adverse conditions because of strong employment protection. Second, trade unions have differing moderating roles in the two sectors. More precisely, if unions regulate management changes in the private sector, they tend to raise the critics about them in the public sector. Furthermore, in the private sector, union delegates seem to have a higher capacity to regulate management changes than ICT changes, which have overall consequences that are more ambiguous.
These results have several lessons for practitioners. First they show that the human sustainability of ICT and management changes depends on their intensity. There are some thresholds over which organizational changes tend to increase adverse impacts for employees. Intense organizational changes are a source of work intensification and of workers’ disengagement in the public sector when intense ICT related changes face a limit in the private sector as far as productive skills use and feeling of fair work recognition are concerned. We have argued that the complementarity between ICT and management changes may push employers towards the implementation of more intense levels of organizational changes. However, companies and administration have to be aware that such choices have to be carefully designed as they may clash against human sustainability issues and, in turn, affect performance negatively in the longer run. Indeed, new empirical evidences from nationally-representative linked employer employee datasets tend to show that employees’ subjective wellbeing is positively related with workplace performance [45,46].
Furthermore, the human sustainability of organizational changes is embedded in the institutional context and modernizing strategies have to be tailored taking into account the objectives of the organization and the settings of the work and employment relations. In the private sector in France, organizational changes, especially management changes seem to be more virtuous in terms of employee outcomes than in the public sector. However, we have identified that the turnover of unhappy employees plays a role in this difference between the two sectors. This could make specific issues invisible in the private sector like the loss of knowledge and skills associated with these exits. In the public sector, employment protection plays a role in the fact that organizational changes impact negatively the subjective relationship to work. We also observe that ICT and management changes have asymmetric impacts in the two sectors. The public sector seems to deal better with ICT changes and the private sector with management changes. We have identified that the moderating role of union delegates explains part of this difference. The careful planning and preparation of changes, the exercise of employee voice at the conception phase and the search for mutual gains ahead of implementation are important steps to maintain employees’ engagement in both sectors. However, some knowledge gaps remain on the interrelation between organizational change management in the public and private context, human resource management [47], social dialogue and sustainable work, leaving theoretical, qualitative, and quantitative avenues opened for further research.
Author Contributions
N.G. directed the scientific development of the COI survey, which has been carried out by the French public statistics bodies (Insee, Dares, DGAFP). Authors have collaborated on each stage of the research.
Funding
This work has received a funding from the French Ministry of the Public Sector (Direction générale de l’administration et de la fonction publique, DGAFP) and a funding from the French National Agency of Research in the context of COI-COSA project under grant agreement no. ANR-07-ENTR003.
Conflicts of Interest
The authors declare no conflict of interest. The founding sponsors had no role in the design of the study; in the collection, analyses, or interpretation of data; in the writing of the manuscript; or in the decision to publish the results.
Appendix A

Table A1.
Diffusion of ICTs and management tools in productive units.
| Private Sector | Public Sector | Private Sector Baseline | |||
|---|---|---|---|---|---|
| % of Productive Units | 2003 | 2006 | 2003 | 2007 | Metric |
| ICTs | |||||
| Website | 61.2 | 73.3 | 68.0 | 88.6 | 0.065 |
| Local Area Network | 61.3 | 66.7 | 91.3 | 96.7 | 0.071 |
| Software or firmware for HRM | 63.4 | 65.3 | 90.2 | 95.3 | 0.064 |
| Intranet | 47.9 | 57.8 | 84.1 | 97.5 | 0.084 |
| Software or firmware for R&D | 47.4 | 49.8 | 41.1 | 45.5 | 0.041 |
| Tools for data analysis | 39.5 | 47.1 | 37.8 | 51.5 | 0.065 |
| Electronic data interchange system (EDI) | 36.2 | 45.8 | 38.3 | 47.5 | 0.060 |
| Databases for HRM | 34.5 | 38.5 | 74.9 | 89.3 | 0.082 |
| Extranet | 25.0 | 30.2 | 51.8 | 66.6 | 0.081 |
| ERP | 26.6 | 29.6 | 40.3 | 51.1 | 0.059 |
| Databases for R&D | 26.1 | 28.8 | 30.7 | 37.9 | 0.075 |
| Tools for interfacing databases | 21.1 | 28.6 | 24.2 | 47.9 | 0.067 |
| Tools for automated data archiving or research | 21.4 | 27.4 | 18.4 | 32.7 | 0.087 |
| Tools for collaborative work (groupware) | 15.1 | 21.0 | 28.1 | 59.8 | 0.099 |
| Tools for process modelling (workflow) | 8.8 | 12.7 | 12.0 | 26.3 | 0.111 |
| Management tools | |||||
| Contractual commitment to provide a product or a service or customer service within a limited time | 66.1 | 68.5 | 18.0 | 42.4 | 0.087 |
| Long-term relationships with suppliers | 51.7 | 54.7 | 58.6 | 72.8 | 0.076 |
| Requirement for suppliers to meet tight deadline | 51.5 | 53.5 | 61.0 | 69.9 | 0.090 |
| Quality certification s | 36.3 | 41.4 | 5.5 | 21.5 | 0.092 |
| Satisfaction surveys of customers | 32.9 | 38.7 | 27.0 | 47.5 | 0.079 |
| Teams or autonomous work groups | 30.7 | 33.8 | 30.2 | 40.8 | 0.089 |
| Tools for tracing goods or services | 28.3 | 32.9 | 9.5 | 31.5 | 0.075 |
| Tools for labelling goods or services | 28.3 | 30.8 | 7.5 | 25.4 | 0.093 |
| Call or contact centres | 25.5 | 28.0 | 24.6 | 30.4 | 0.080 |
| Just in time production | 22.9 | 24.3 | 17.7 | 20.8 | 0.071 |
| Methods of problem solving (FMECA) | 17.3 | 20.9 | 6.1 | 7.2 | 0.114 |
| Customer relationship management (CRM) | 9.7 | 14.3 | 2.0 | 7.1 | 0.072 |
| Environmental or ethical certification | 9.7 | 12.9 | 19.5 | 64.6 | 0.107 |
Data source: COI 2006/INSEE-DARES-CEE, COIFP 2006/DGAFP-DARES-CEE. Coverage: Productive units of 20 or more employees in the private sector and of 10 or more employees in the public sector. Weighted data. Note: The private sector baseline metric comes from the Multiple Correspondence Analysis (MCA) applied in 2006 to the private sector. It is the reference metric for 2003 in the private sector and for 2003 and 2007 in the state civil service.
Table A2.
The moderating effect of performance pay.
| Private Sector | Public Sector | |||
|---|---|---|---|---|
| Evolution of Involvement | Fair Work Recognition | Evolution of Involvement | Fair Work Recognition | |
| Ch. ICT | −0.064 | −0.105 * | −0.007 | −0.070 |
| (−1.351) | (−1.872) | (−0.103) | (-1.063) | |
| Ch. ICT2 | −0.016 | 0.004 | −0.309 ** | 0.042 |
| (-0.188) | (0.055) | (−2.354) | (0.358) | |
| Ch. Mangt | 0.175 *** | 0.120 *** | −0.144 ** | −0.140 ** |
| (2.855) | (2.723) | (-2.220) | (−2.105) | |
| Ch. Mangt2 | −0.268 * | −0.247 *** | 0.027 | 0.332 *** |
| (−1.894) | (−3.178) | (0.195) | (2.811) | |
| Interaction Ch. | 0.436 *** | 0.180 | −0.502 ** | −0.269 |
| (2.904) | (1.595) | (−2.828) | (−1.552) | |
| Performance pay | 0.086 *** | 0.004 | 0.128 | −0.133 |
| (2.606) | (0.136) | (0.744) | (−1.253) | |
| Ch. ICT * Performance pay | 0.075 | 0.074 | −0.343 | 0.545 *** |
| (0.534) | (0.634) | (−1.297) | (2.662) | |
| Ch. ICT2 * Performance pay | −0.195 | −0.313 * | −0.040 | −0.583 |
| (−0.844) | (−1.661) | (-0.085) | (−1.258) | |
| Ch. Mangt * Performance pay | 0.241 | −0.221 | 0.050 | −0.260 |
| (1.482) | (-1.516) | (0.197) | (−1.422) | |
| Ch. Mangt2 * Performance pay | 0.302 | 0.326 | 0.020 | 0.436 |
| (1.094) | (1.403) | (0.059) | (1.495) | |
| Interaction Ch. * Performance pay | −0.439 | −0.131 | −0.870 | 0.379 |
| (−1.142) | (-0.416) | (-1.243) | (0.533) | |
| Lambda | 0.147 ** | −0.907 | −0.757 *** | −0.158 |
| (2.190) | (−1.380) | (−2.890) | (−0.869) | |
| Observations | 11,731 | 11,731 | 946 | 946 |
| R² | 0.034 | 0.073 | 0.079 | 0.077 |
Data sources: COI 2006/INSEE-DARES-CEE, COIFP 2006/DGAFP-DARES-CEE. Coverage: Stable employees (one year of service) from productive units of 20 or more employees in the private sector and 10 or more employees in the public sector. Note: Controls included for employee and employer level characteristics and employee self-selection. The set of control variables is the same for all regressions and comprises net wage, weekly hours of work, age, seniority, gender, level of education, long or short duration labour contract, part-time work, marital status, occupation status, size and industry dummies. Weighted regressions, Student t-values are in parentheses: *** p < 0.01, ** p < 0.05, * p < 0.1, bold coefficients are significant at least at the 10% level.
Table A3.
The moderating effect of trade unions.
| Private Sector | Public Sector | |||
|---|---|---|---|---|
| Evolution of Involvement | Fair Work Recognition | Evolution of Involvement | Fair Work Recognition | |
| Ch. ICT | −0.047 | −0.093 * | 0.006 | −0.067 |
| (−1.012) | (−1.853) | (0.079) | (−1.111) | |
| Ch. ICT2 | −0.049 | −0.009 | −0.313 ** | 0.0629 |
| (−0.581) | (−0.129) | (−2.579) | (0.660) | |
| Ch. Mangt | 0.170 *** | 0.106 *** | −0.157 ** | −0.141 ** |
| (3.031) | (2.733) | (−2.348) | (−2.281) | |
| Ch. Mangt2 | −0.221 * | −0.224 *** | 0.035 | 0.335 *** |
| (−1.671) | (−3.208) | (0.267) | (3.014) | |
| Interaction Ch. | 0.419 *** | 0.162 | −0.483 *** | −0.286 * |
| (2.920) | (1.584) | (−2.747) | (−1.767) | |
| Trade union presence | −0.021 | −0.046 * | 0.014 | −0.028 |
| (−0.838) | (−1.920) | (0.130) | (−0.29) | |
| Ch. ICT * Trade union presence | −0.237 ** | −0.129 | 0.197 | −0.088 |
| (−2.367) | (−1.488) | (0.938) | (-0.499) | |
| Ch. ICT2 * Trade union presence | 0.420 ** | 0.091 | −0.314 | −0.935 ** |
| (2.099) | (0.633) | (−0.508) | (−2.152) | |
| Ch. Mangt * Trade union presence | 0.026 | 0.106 | −0.111 | −0.289 * |
| (0.202) | (1.131) | (−0.496) | (−1.666) | |
| Ch. Mangt2 * Trade union presence | −0.250 | 0.090 | 0.041 | 0.338 |
| (−0.910) | (0.551) | (0.0903) | (1.049) | |
| Interaction Ch. * Trade union presence | 0.473 | 0.337 | 0.397 | 1.480 *** |
| (1.405) | (1.425) | (0.536) | (3.223) | |
| Lambda | 0.152 ** | −0.089 | −0.766 *** | −0.114 |
| (2.294) | (−1.361) | (−2.874) | (−0.623) | |
| Observations | 11,731 | 11,731 | 946 | 946 |
| R2 | 0.033 | 0.074 | 0.082 | 0.083 |
Data sources: COI 2006/INSEE-DARES-CEE, COIFP 2006/DGAFP-DARES-CEE. Coverage: Stable employees (one year of service) from productive units of 20 or more employees in the private sector and 10 or more employees in the public sector. Note: Controls included for employee and employer level characteristics and employee self-selection. The set of control variables is the same for all regressions and comprises net wage, weekly hours of work, age, seniority, gender, level of education, long or short duration labour contract, part-time work, marital status, occupation status, size and industry dummies. Weighted regressions, Student t-values are in parentheses: *** p < 0.01, ** p < 0.05, * p < 0.1, bold coefficients are significant at least at the 10% level.
References
- Eurofound. Sustainable Work over the Life Course: Concept Paper; Publications Office of the European Union: Luxembourg, 2015. [Google Scholar]
- Wise, L.R. Public Management Reform: Competing Drivers of Change. Public Admin. Rev. 2002, 62, 555–567. [Google Scholar] [CrossRef]
- Godard, J.A. Critical Assessment of the High-Performance Paradigm. Br. J. Ind. Relat. 2004, 42, 349–378. [Google Scholar] [CrossRef]
- Docherty, P.; Forslin, J.; Shani, A.B.; Kira, M. Emerging work systems. In Creating Sustainable Work Systems: Emerging Perspectives and Practice; Docherty, P., Forslin, J., Shani, A.B., Eds.; Routledge: London UK; New York, NY, USA, 2002. [Google Scholar]
- Volkoff, S.; Gaudart, C. Working Conditions and “Sustainability”: Converting Knowledge into Action; Rapport de recherché n°92; Centre D’études de L’emploi: Noisy le Grand, France, 2015; Available online: http://ceet.cnam.fr/publications/rapports-de-recherche/rapports-de-recherche-2015-954187.kjsp?RH=1507626803290 (accessed on 1 October 2018).
- Davoine, L.; Méda, D. Importance and Meaning of Work in Europe: A French Singularity; Document de Travail n°96; Centre D’études de L’emploi: Noisy le Grand, France, 2008; Available online: http://ceet.cnam.fr/publications/documents-de-travail/documents-de-travail-2008-950556.kjsp?RH=1507626749912 (accessed on 1 October 2018).
- Greenan, N.; Seghir, M. Measuring Vulnerability to Adverse Working Conditions: Evidence from European Countries; Document de Travail n°193; Centre d’Etudes de l’Emploi et du Travail: Noisy le Grand, France, 2017; Available online: http://ceet.cnam.fr/publications/documents-de-travail/documents-de-travail-2017-950547.kjsp?RH=1507626749912 (accessed on 1 October 2018).
- Kalmi, P.; Kauhanen, A. Workplace innovations and employee outcomes: Evidence from Finland. Ind. Relat. 2008, 47, 430–459. [Google Scholar] [CrossRef]
- Jeannot, G.; Rouban, L. Changer la Fonction Publique. Revue Française d’Administration Publique 2009, 4, 665–672. [Google Scholar] [CrossRef]
- Härenstam, A.; Bejerot, E.; Leijon, O.; Schéele, P.; Waldenström, K.; MOA Research Group. Multilevel analyses of organizational change and working conditions in public and private sector. Eur. J. Work Organ. Psychol. 2004, 13, 305–343. [Google Scholar] [CrossRef]
- Østhus, S. For better or worse? Workplace changes and the health and wellbeing of Norwegian workers. Work Employ. Soc. 2007, 21, 731–750. [Google Scholar] [CrossRef]
- Green, F. Why has work effort become more intense? Ind. Relat. 2004, 43, 709–741. [Google Scholar] [CrossRef]
- Bryson, A.; Dale-Olsen, H.; Barth, E. The effects of organizational change on worker wellbeing and the moderating role of trade unions. Ind. Labor Relat. Rev. 2013, 66, 989–1011. [Google Scholar] [CrossRef]
- Greenan, N.; Hamon-Cholet, S. La mesure des changements dans une approche comparative secteur privé/Fonction publique d’Etat. In Salariés du Public, Salariés du Privé Face Aux Changements; Greenan, N., Hamon-Cholet, S., Ughetto, P., Eds.; L’Harmattan, Collection Conception et Dynamique des Organisations: Paris, France, 2016; pp. 299–307. [Google Scholar]
- Karasek, J.R. Job Demands, Job Decision Latitude, and Mental Strain: Implications for Job Redesign. Adm. Sci. Q. 1979, 24, 285–308. [Google Scholar] [CrossRef]
- Green, F.; Felstead, A.; Gallie, D.; Inanc, H. Job-related well-being through the great recession. J. Happiness Stud. 2016, 17, 389–411. [Google Scholar] [CrossRef]
- Frese, M. Occupational socialization and psychological development: An underemphasized research perspective in industrial psychology. J. Occup. Organ. Psychol. 1982, 55, 209–224. [Google Scholar] [CrossRef] [Green Version]
- Felstead, A.; Gallie, D.; Green, F.; Inanc, H. Fits, misfits and interactions: Learning at work, job satisfaction and job-related well-being. Hum. Resour. Manag. J. 2015, 25, 294–310. [Google Scholar] [CrossRef]
- Van Loo, J.; De Grip, A.; De Steur, M. Skills obsolescence: Causes and cures. Int. J. Manpower 2001, 22, 121–138. [Google Scholar] [CrossRef]
- Kahneman, D.; Krueger, A.B. Developments in the measurement of subjective well-being. J. Econ. Perspect. 2006, 20, 3–24. [Google Scholar] [CrossRef]
- Bakker, A.B.; Albrecht, S.L.; Leiter, M.P. Key questions regarding work engagement. Eur. J. Work Organ. Psychol. 2011, 20, 4–28. [Google Scholar] [CrossRef]
- Kivimaki, M.; Elovainio, M.; Vahtera, J.; Ferrie, J.E. Organizational Justice and Health of Employees: Prospective Cohort Study. Occup. Environ. Med. 2003, 60, 27–34. [Google Scholar] [CrossRef] [PubMed]
- Siegrist, J. Social Reciprocity and Health: New Scientific Evidence and Policy Implications. Psychoneuroendocrinology 2005, 30, 1033–1038. [Google Scholar] [CrossRef] [PubMed]
- Greenan, N.; Walkowiak, E. La dynamique des changements de long terme. Réseaux 2010, 162, 229–272. [Google Scholar] [CrossRef]
- Milgrom, P.; Roberts, J. Bargaining and Influence Cost and the Organization of Economic Activity. In Perspectives on Positive Political Economy; Alt, J., Shepsle, K., Eds.; Cambridge University Press: Cambridge, UK, 1990; pp. 154–159. [Google Scholar]
- Bresnahan, T.F.; Brynjolfsson, E.; Hitt, L.M. Information Technology, Workplace Organization, and the Demand for Skilled Labor: Firm-Level Evidence. Q. J. Econ. 2002, 117, 339–376. [Google Scholar] [CrossRef]
- Athey, S.; Stern, S. An Empirical Framework for Testing Theories about Complementarities in Organizational Design; Working Paper n°6600; National Bureau of Economic Research: Cambridge, MA, USA, 1998. [Google Scholar]
- Garicano, L.; Heaton, P. Information Technology, Organization, and Productivity in the Public Sector: Evidence from Police Departments. J. Labor Econ. 2010, 28, 167–201. [Google Scholar] [CrossRef] [Green Version]
- Brynjolfsson, E.; Milgrom, P.R. Complementarity in Organizations. In Handbook of Organizational Economics; Gibbons, R., Roberts, J., Eds.; Princeton University Press: Princeton, NJ, USA, 2013; pp. 11–55. [Google Scholar]
- Greenan, N.; Mairesse, M. Les changements organisationnels, l’informatisation des entreprises et le travail des salariés. Rev. Econ. 2006, 57, 1137–1175. [Google Scholar]
- Godard, J. High performance and the transformation of work? The implications of alternative work practices for the experience and outcomes of work. Ind. Labor Relat. Rev. 2001, 54, 776–805. [Google Scholar] [CrossRef]
- Wooldridge, J.M. Econometric Analysis of Cross Section and Panel Data; The MIT Press: Cambridge, MA, USA; London, UK, 2010; p. 563. [Google Scholar]
- Clark, A. What really matters in a job? Hedonic measurement using quit data. J. Labour Econ. 2001, 8, 223–242. [Google Scholar] [CrossRef]
- Hirschman, A.O. Exit, Voice, and Loyalty: Responses to Decline in Firms, Organizations, and States; Harvard University Press: Cambridge, MA, USA, 1970. [Google Scholar]
- Bajoit, G. Exit, Voice, Loyalty... and Apathy: Les réactions individuelles au mécontentement. Rev. Franç. Sociol. 1988, 29, 325. [Google Scholar] [CrossRef]
- Bigi, M.; Cousin, O.; Méda, D.; Sibaud, L.; Wiewjorka, M. Travailler au XXIe Siècle: Des Salariés en Quête de Reconnaissance; Robert Laffont: Paris, France, 2015. [Google Scholar]
- Baudelot, C.; Gollac, M.; Bessières, C.; Coutant, I.; Godechot, O.; Serre, D.; Viguier, F. Travailler Pour Être Heureux; Le Bonheur et le Travail en France: Paris, France, 2003. [Google Scholar]
- Dixit, A. Power of Incentives in Private versus Public Organizations. Am. Econ. Rev. 1997, 87, 378–382. [Google Scholar]
- Perry, J.L.; Hondeghem, A. Motivation in Public Management: The Call of Public Service; Oxford University Press: Oxford, UK, 2008. [Google Scholar]
- Besley, T.; Ghatak, M. Competition and incentives with motivated agents. Am. Econ. Rev. 2005, 95, 616–636. [Google Scholar] [CrossRef] [Green Version]
- Bénabou, R.; Tirole, J. Intrinsic and Extrinsic Motivation. Rev. Econ. Stud. 2003, 70, 489–520. [Google Scholar] [CrossRef] [Green Version]
- Amossé, T.; Coutrot, T. L’évolution des modèles socio-productifs en France depuis 15 ans: Le néo-taylorisme n’est pas mort. In Les Relations Sociales en Entreprise. Un Portrait à Partir des Enquêtes Relations Professionnelles et Négociations D’entreprise (REPONSE 1992–1993, 1998–1999, 2004–2005); Amossé, T., Bloch-London, C., Wolff, L., Eds.; Editions la Découverte: Paris, France, 2008; pp. 423–461. [Google Scholar]
- Frost, A.C. Explaining variation in workplace restructuring: The role of local union capabilities. ILR Rev. 2000, 53, 559–578. [Google Scholar] [CrossRef]
- Lallement, M. Sociologie des Relations Professionnelles; La Découverte, Collection Repères: Paris, France, 2008. [Google Scholar]
- Böckerman, P.; Ilmakunnas, P. The job satisfaction-productivity nexus: A study using matched survey and register data. ILR Rev. 2012, 65, 244–262. [Google Scholar] [CrossRef]
- Bryson, A.; Forth, J.; Stokes, L. Does employees’ subjective well-being affect workplace performance? Hum. Relat. 2017, 70, 1017–1037. [Google Scholar] [CrossRef] [Green Version]
- De Stefano, F.; Bagdadli, S.; Camuffo, A. The HR role in corporate social responsibility and sustainability: A boundary-shifting literature review. Hum. Resour. Manag. 2018, 57, 549–566. [Google Scholar] [CrossRef]
Figure 1.
Distribution of ICT and management changes in the populations of private and public organizations. Data source: COI 2006/INSEE-DARES-CEE, COIFP 2006/DGAFP-DARES-CEE. Coverage: Productive units of 20 or more employees in the private sector and of 10 or more employees in the public sector. Weighted data. Note: The unit of the horizontal axis expresses the intensity of change in the metric of the MCA performed in 2006 for each type of change.

Table 1.
Employees’ exposure to organizational change and evolutions of dimensions of sustainable work across sectors.
Table 1.
Employees’ exposure to organizational change and evolutions of dimensions of sustainable work across sectors.
| % Employees | Private Sector | Public Sector |
|---|---|---|
| Exposure to organizational change | ||
| ICT and management changes | 8.2 | 36.8 |
| ICT changes only | 20.9 | 18.1 |
| Management changes only | 11.2 | 21.9 |
| Inertia or marginal changes (<0.20) | 59.7 | 23.2 |
| Evolutions of dimensions of sustainable work | ||
| Work intensity | ||
| Increased constraints on work pace | 39.8 | 41.3 |
| Decreased constraints on work pace | 5.2 | 3.7 |
| Stable constraints on work pace | 40.9 | 34.5 |
| No constraints on work pace | 14.1 | 20.5 |
| More activity peaks | 38.5 | 42.2 |
| Similar activity peaks | 41.4 | 41.2 |
| Fewer activity peaks | 12.2 | 8.9 |
| No activity peaks | 7.9 | 7.7 |
| Skills utilization | ||
| Increased use of skills | 41.8 | 40.1 |
| Similar use of skills | 46.6 | 46.4 |
| Reduced use of skills | 11.6 | 13.6 |
| Learning new things at work | 73.8 | 81.6 |
| Subjective relationship to work | ||
| More involved | 33.0 | 30.6 |
| Similarly involved | 52.5 | 56.8 |
| Less involved | 14.6 | 12.6 |
| Work recognised at fair value | 44.9 | 38.8 |
| Number of observations | 11,731 | 946 |
Data source: COI 2006/INSEE-DARES-CEE, COIFP 2006/DGAFP-DARES-CEE. Coverage: Stable employees (one year of service) from productive units of 20 or more employees in the private sector and 10 or more employees in the public sector. Weighted data.
Table 2.
Effects of organizational changes on work intensification.
| Evolution of… | …Constraints on Work Pace | …Activity Peaks | ||
|---|---|---|---|---|
| Private Sector | Public Sector | Private Sector | Public Sector | |
| Ch. ICT | 0.083 | −0.055 | 0.072 | −0.101 |
| (1.585) | (−0.631) | (1.237) | (−1.106) | |
| Ch. ICT² | −0.126 | 0.260 * | −0.196 * | 0.250 * |
| (−1.095) | (1.856) | (−1.782) | (1.939) | |
| Ch. Management | 0.019 | 0.001 | −0.002 | 0.122 |
| (0.278) | (0.004) | (−0.028) | (1.418) | |
| Ch. Management² | −0.073 | 0.157 | −0.023 | 0.113 |
| (−0.562) | (1.153) | (−0.190) | (0.904) | |
| Interaction ch. | −0.172 | 0.075 | 0.131 | 0.041 |
| (−1.012) | (0.302) | (0.848) | (0.180) | |
| Lambda | −0.155 | −0.431 | −0.058 | −0.181 |
| (1.524) | (1.550) | (−0.703) | (−0.647) | |
| Observations | 10,079 | 752 | 10,806 | 873 |
| R² | 0.066 | 0.086 | 0.028 | 0.065 |
Data sources: COI 2006/INSEE-DARES-CEE, COIFP 2006/DGAFP-DARES-CEE. Coverage: Stable employees (one year of service) from productive units of 20 or more employees in the private sector and 10 or more employees in the public sector. Note: Controls included for employee and employer level characteristics and employee self-selection. The set of control variables is the same for all regressions and comprise net wage, weekly hours of work, age, seniority, gender, level of education, long or short duration labour contract, part-time work, marital status, occupation status, size, and industry dummies. Weighted regressions, Student t-values are in parentheses, significance level: * p < 0.1, bold coefficients are significant at the 10% level.
Table 3.
Effects of organizational changes on the evolution of skills utilization.
| Evolution of Skills Use | Learning New Things at Works | |||
|---|---|---|---|---|
| Private Sector | Public Sector | Private Sector | Public Sector | |
| Ch. ICT | 0.098 ** | 0.066 | 0.0323 | 0.076 * |
| (1.987) | (0.667) | (1.031) | (1.808) | |
| Ch. ICT² | −0.241 ** | −0.169 | −0.111 ** | −0.076 |
| (−2.328) | (−0.847) | (−2.085) | (−1.179) | |
| Ch. Management | 0.194 ** | −0.104 | 0.037 | −0.064 |
| (2.230) | (−1.190) | (0.944) | (−1.440) | |
| Ch. Management² | −0.201 | 0.183 | −0.037 | 0.089 |
| (−1.369) | (1.358) | (−0.581) | (1.274) | |
| Interaction ch. | 0.300 * | 0.198 | 0.034 | 0.159 |
| (1.899) | (0.779) | (0. 421) | (1.417) | |
| Lambda | −0.108 | −0.115 | 0.009 | 0.302 ** |
| (−1.032) | (−0.387) | (0.250) | (2.481) | |
| Observations | 11,731 | 946 | 11,731 | 946 |
| R² | 0.052 | 0.062 | 0.132 | 0.170 |
Data sources: COI 2006/INSEE-DARES-CEE, COIFP 2006/DGAFP-DARES-CEE. Coverage: Stable employees (one year of service) from productive units of 20 or more employees in the private sector and 10 or more employees in the public sector. Note: Controls included for employee and employer level characteristics and employee self-selection. The set of control variables is the same for all regressions and comprise net wage, weekly hours of work, age, seniority, gender, level of education, long or short duration labour contract, part-time work, marital status, occupation status, size, and industry dummies. Weighted regressions, Student t-values are in parentheses, significance levels: ** p < 0.05, * p < 0.1, bold coefficients are significant at least at the 10% level.
Table 4.
Effects of organizational changes on the evolution the subjective relationship to work.
| Evolution of Involvement | Work Recognised at Fair Value | |||
|---|---|---|---|---|
| Private Sector | Public Sector | Private Sector | Public Sector | |
| Ch. ICT | −0.060 | −0.001 | −0.107 * | −0.064 |
| (−1.269) | (−0.014) | (−1.866) | (−1.025) | |
| Ch. ICT² | −0.030 | −0.308 ** | −0.007 | 0.024 |
| (−0.355) | (−2.518) | (−0.099) | (0.229) | |
| Ch. Management | 0.176 *** | −0.151 ** | 0.122 *** | −0.139 ** |
| (2.880) | (−2.316) | (2.698) | (−2.158) | |
| Ch. Management² | −0.237 * | 0.034 | −0.248 *** | 0.355 *** |
| (−1.680) | (0.256) | (−3.131) | (3.053) | |
| Interaction ch. | 0.444 *** | −0.485 *** | 0.201 * | −0.300 * |
| (2.993) | (2.767) | (1.764) | (−1.781) | |
| Lambda | 0.150 ** | −0.760 *** | −0.090 | −0.140 |
| (2.264) | (−2.909) | (−1.378) | (−0.766) | |
| Observations | 11,731 | 946 | 11,731 | 946 |
| R² | 0.031 | 0.075 | 0.072 | 0.068 |
Data sources: COI 2006/INSEE-DARES-CEE, COIFP 2006/DGAFP-DARES-CEE. Coverage: Stable employees (one year of service) from productive units of 20 or more employees in the private sector and 10 or more employees in the public sector. Note: Controls included for employee and employer level characteristics and employee self-selection. The set of control variables is the same for all regressions and comprise net wage, weekly hours of work, age, seniority, gender, level of education, long or short duration labour contract, part-time work, marital status, occupation status, size, and industry dummies. Weighted regressions, Student t-values are in parentheses, significance levels: *** p < 0.01, ** p < 0.05, * p < 0.1, bold coefficients are significant at least at the 10% level.
Table 5.
The role of turnover in the private sector.
| Private Sector | Private sector with Exits | |||
|---|---|---|---|---|
| Evolution of Involvement | Fair Work Recognition | Evolution of Involvement | Fair Work Recognition | |
| Ch. ICT | −0.060 | −0.107 * | −0.014 | −0.086 * |
| (−1.269) | (−1.866) | (−0.247) | (−1.656) | |
| Ch. ICT² | −0.030 | −0.007 | −0.001 | −0.006 |
| (−0.355) | (−0.099) | (0.001) | (−0.100) | |
| Ch. Mangt. | 0.176 *** | 0.122 *** | −0.047 | 0.038 |
| (2.880) | (2.698) | (−0.703) | (0.819) | |
| Ch. Mangt.² | −0.237 * | −0.248 *** | −0.125 | −0.197 *** |
| (−1.680) | (−3.131) | (−0.886) | (−2.702) | |
| Interaction ch. | 0.444 *** | 0.201 * | 0.297 ** | 0.188 * |
| (2.993) | (1.764) | (1.814) | (1.696) | |
| Lambda | 0.150 ** | −0.090 | 0.077 | −0.072 |
| (2.264) | (−1.378) | (1.006) | (−1.198) | |
| Observations | 11,731 | 11,731 | 15,151 | 15,151 |
| R² | 0.031 | 0.072 | 0.130 | 0.085 |
Data sources: COI 2006/INSEE-DARES-CEE, COIFP 2006/DGAFP-DARES-CEE? Coverage: Stable employees (one year of service) from productive units of 20 or more employees in the private sector and 10 or more employees in the public sector. Note: Controls included for employee and employer level characteristics and employee self-selection. The set of control variables is the same for all regressions and comprise net wage, weekly hours of work, age, seniority, gender, level of education, long or short duration labour contract, part-time work, marital status, occupation status, size, and industry dummies. Weighted regressions, Student t-values are in parentheses: *** p < 0.01, ** p < 0.05, * p < 0.1, bold coefficients are significant at least at the 10% level.
Table 6.
Effects of ICT and management changes according to the introduction of performance pay.
| Private Sector | Public Sector | ||||
|---|---|---|---|---|---|
| Evolution of Involvement | Fair Work Recognition | Evolution of Involvement | Fair Work Recognition | ||
| No performance pay | Ch. ICT | −0.077 (−1.47) | −0.115 * (−1.86) | 0.026 (0.32) | −0.099 (−1.37) |
| Ch. Mangt | 0.152 * (1.95) | 0.150 *** (2.70) | −0.140 ** (−2.08) | −0.127 * (−1.70) | |
| Total sample | Ch. ICT | −0.061 (−1.29) | −0.109 * (−1.83) | 0.014 (0.18) | −0.062 (−0.94) |
| Ch. Mangt | 0.179 *** (2.58) | 0.126 ** (2.53) | −0.144 ** (−2.15) | −0.141 ** (−1.97) | |
| Performance pay | Ch. ICT | 0.004 (0.03) | −0.038 (−0.35) | −0.307 (−1.18) | 0.462 ** (2.32) |
| Ch. Mangt | 0.389 *** (2.70) | −0.077 (−0.60) | −0.075 (−0.29) | −0.402 ** (−2.24) | |
Data sources: COI 2006/INSEE-DARES-CEE, COIFP 2006/DGAFP-DARES-CEE. Coverage: Stable employees (one year of service) from productive units of 20 or more employees in the private sector and 10 or more employees in the public sector. Note: Average effects from regressions in Table A2, Student t-values are in parentheses, significance level: *** p < 0.01, ** p < 0.05, * p < 0.1, bold coefficients are significant at least at the 10% level.
Table 7.
Effects of ICT and management changes according to trade union presence.
| Private Sector | Public Sector | ||||
|---|---|---|---|---|---|
| Evolution of Involvement | Fair Work Recognition | Evolution of Involvement | Fair Work Recognition | ||
| No trade union presence | Ch. ICT | 0.125 (1.48) | 0.001 (0.02) | −0.162 (−0.82) | −0.002 (−0.01) |
| Ch. Mangt | 0.152 (1.42) | 0.035 (0.46) | −0.043 (−0.22) | 0.015 (0.387) | |
| Total sample | Ch. ICT | −0.061 (−1.29) | −0.109 * (−1.83) | 0.014 (0.18) | −0.062 (−0.94) |
| Ch. Mangt | 0.179 *** (2.58) | 0.126 ** (2.53) | −0.144 ** (−2.15) | −0.141 ** (−1.97) | |
| Trade union presence | Ch. ICT | −0.118 ** (−2.08) | −0.132 ** (−2.04) | 0.041 (0.47) | −0.074 (−1.11) |
| Ch. Mangt | 0.180 ** (0.021) | 0.138 *** (2.64) | −0.161 ** (−2.10) | −0.175 ** (0.017) | |
Data sources: COI 2006/INSEE-DARES-CEE, COIFP 2006/DGAFP-DARES-CEE. Coverage: Stable employees (one year of service) from productive units of 20 or more employees in the private sector and 10 or more employees in the public sector. Note: Average effects from regressions in table A3, Student t-values are in parentheses, significance level: *** p < 0.01, ** p < 0.05, * p < 0.1, bold coefficients are significant at least at the 10% level.
© 2018 by the authors. Licensee MDPI, Basel, Switzerland. This article is an open access article distributed under the terms and conditions of the Creative Commons Attribution (CC BY) license (http://creativecommons.org/licenses/by/4.0/).
Share and Cite
MDPI and ACS Style
Bigi, M.; Greenan, N.; Hamon-Cholet, S.; Lanfranchi, J. The Human Sustainability of ICT and Management Changes: Evidence for the French Public and Private Sectors. Sustainability 2018, 10, 3570. https://doi.org/10.3390/su10103570
AMA Style
Bigi M, Greenan N, Hamon-Cholet S, Lanfranchi J. The Human Sustainability of ICT and Management Changes: Evidence for the French Public and Private Sectors. Sustainability. 2018; 10(10):3570. https://doi.org/10.3390/su10103570
Chicago/Turabian StyleBigi, Maëlezig, Nathalie Greenan, Sylvie Hamon-Cholet, and Joseph Lanfranchi. 2018. "The Human Sustainability of ICT and Management Changes: Evidence for the French Public and Private Sectors" Sustainability 10, no. 10: 3570. https://doi.org/10.3390/su10103570
Note that from the first issue of 2016, this journal uses article numbers instead of page numbers. See further details here.