Strategies for Implementing Public Service Electric Bus Lines by Charging Type in Daegu Metropolitan City, South Korea

Department of Electrical Energy Engineering, Keimyung University, 1095 Dalgubeol-daero, Daegu 42601, Korea
*
Author to whom correspondence should be addressed.
Sustainability 2018, 10(10), 3386; https://doi.org/10.3390/su10103386
Submission received: 20 August 2018
/
Revised: 17 September 2018
/
Accepted: 19 September 2018
/
Published: 21 September 2018
Abstract
:The large-scale adoption of electric vehicles in the public sector is essential for achieving emission reduction targets for transportation. In particular, the replacement of buses with internal combustion engines, which travel long distances and produce massive greenhouse gas emissions, by their electric counterparts can drastically reduce emissions. A variety of electric buses with different power supply systems are currently available, and their performance, charging type, battery capacity, and operating environment are related parameters that must be addressed for their successful and massive adoption. For instance, the appropriate charging type of electric buses depends on conditions, such as the operating environment. In this study, we determined the optimum capacity of electric bus batteries by considering the electric bus range, battery depth of discharge, and deterioration cost while using ADVISOR, which is a MATLAB-based electric vehicle simulator. In addition, we assessed the energy consumed and charging time according to the operating environments of electric buses. Finally, an economic efficiency analysis allowed for determining the appropriated charging type for electric buses. By integrating these data and analyses, we propose a comprehensive plan for selecting the most appropriate charging type according to the operating environment of these electric vehicles. We expect that the proposed plan will contribute to the adoption of electric buses and achieve the greenhouse gas reduction targets set by South Korea.
1. Introduction
The interest in environmental issues is increasing, owing to CO2 emission control reinforcement and the concerning greenhouse gas emissions that is caused by intensive fossil fuel use. The transportation sector accounts for a large proportion of fossil fuel consumption, and global efforts target to the adoption of electric buses for public transportation to reduce the related emissions [1,2,3,4].
In major Asian and European cities, electric vehicles with much lower CO2 emissions than those of conventional internal combustion engine vehicles are being employed for urban transportation [5,6,7,8,9,10,11,12,13,14,15]. Although the high initial cost of electric vehicles remains a major obstacle to their widespread use, their application is promoted by European companies and is mainly fostered by Chinese automakers. In fact, China is currently the top worldwide producer and consumer of electric vehicles, including buses, taxis, and trucks. Moreover, it is becoming the world leader in key technologies and market for electric vehicles. Accordingly, Beijing will replace 80% of its conventional buses by electric buses by 2019 and it provides purchase subsidies for electric buses and operating subsidies up to RMB 80,000 per year. Besides China, the United States (US) and Europe are developing and producing electric vehicles with varying performance, and the penetration of electric vehicles into the public sector is being promoted through government funding and incentive policies [16].
Likewise, many studies on electric vehicles have been conducted in South Korea, and various efforts pursue the increased utilization of such vehicles. For instance, plug-in charging electric buses have been introduced into city bus routes since November 2016 [3]. Moreover, small-scale electric-bus demonstrations have been conducted, and many local governments, including the Jeju Island government, are actively pursuing the use of electric buses. Similarly, Daegu City has been performing a demonstration project for electric taxi adoption since 2016 aiming to become a leading city for electric vehicles and intends to distribute 2000 electric vehicles by 2020.
According to the International Energy Agency, the main obstacles for the widespread adoption of electric vehicles include high purchase prices, shortage of charging infrastructure, and battery service life. These factors must be considered for the successful introduction of electric vehicles into the public sector [16], and various studies have been conducted to realize this objective. For instance, analyses of charging infrastructure placement have been developed to minimize the total installation costs of electric bus charging stations [17,18,19]. However, the proposed analyses are limited because all of the electric buses are assumed to have the same charging type. On the other hand, meta-heuristic solutions using approaches, such as genetic algorithms, have been delivered for constructing charging infrastructure for electric vehicles [11,20,21,22,23]. Still, these solutions can only be applied under specific conditions, although the distance between charging locations was optimized and the charging infrastructure cost was minimized. Chan [24] performed a feasibility assessment considering the technical limitations of electric buses, but assumed that the electric buses are charged with equal capacity during the same period.
Depending on the charging type, electric buses present different advantages and drawbacks. In addition, parameters such as performance, battery capacity, and operating environment of electric buses are related and must be considered for their deployment and adoption. Therefore, the proper charging type must be selected according to these parameters to enable the widespread adoption of electric buses in the public sector. In this paper, we determine the optimum capacity of electric bus batteries by considering the electric bus range, depth of discharge (DOD), and deterioration cost of batteries by using the MATLAB-based vehicle simulation program ADVISOR. From this analysis, we extend our evaluation considering energy consumption and charging time according to the operating environment of electric buses. Then, an economic efficiency analysis allows us to determine the appropriate charging type for electric buses. Using these insights and data, we propose a plan for selecting the proper charging type according to the operating environment of public service electric buses. We expect that this plan will contribute to the large-scale adoption of such vehicles and to the greenhouse gas reduction targets that are set by South Korea. The rest of this paper is organized as follows. In Section 2, we describe electric vehicle characteristics by charging type. Section 3 presents estimation of electric bus battery characteristics. Section 4 details public service electric bus analyses. Finally, we discuss our findings in Section 6.
2. Electric Vehicle Characteristics by Charging Type
Electric buses can belong to three categories depending on the charging type: plug-in charging, battery swapping, and wireless charging. The cost of plug-in charging facilities is the lowest and simplest among the charging types, because the vehicle battery is charged by using an electric plug. However, plug-in charging is very slow and additional electric buses would be required to maintain the bus headway.
A battery-swapping electric vehicle is supplied from a detachable battery that is mounted on it, avoiding the necessity of additional buses as the battery can be replaced in a very short time. However, the infrastructure construction costs that are associated with this type of vehicle are the highest among the presented charging types. To mitigate this economic impact, the charging stations can be installed at the intersections of multiple routes to distribute the construction costs over the operation rate of the routes.
A wireless-charging vehicle transforms the electromagnetic field generated by the electric wires buried under the road into electrical energy by employing a current collector mounted underneath the vehicle. Therefore, battery charging can be achieved while driving the electric vehicle. This technology has not been implemented yet, but research suggests it as a promising solution. Wireless charging can be either has dynamic or static, where the former allows for charging the battery while driving, whereas the latter requires the vehicle to remain stationary while charging. Despite its convenience, dynamic charging retrieves a lower efficiency than static charging. Therefore, as electric buses travel long distances, static wireless charging would be preferred. In fact, static wireless charging of electric buses is currently being operated and tested on the city bus in Gumi, South Korea. Pilot lines operating with this technology have demonstrated the accelerated energy supply for electric buses [25]. Nevertheless, the infrastructure construction costs of wireless charging are higher than those of plug-in charging, and additional electric buses are required to maintain the bus headway given the slow charging. Table 1 summarizes the characteristics and the Korean specifications of electric buses with fixed battery capacity (100 kWh), according to the charging type [26].
3. Estimation of Electric Bus Battery Characteristics
3.1. Battery DOD Range Estimation
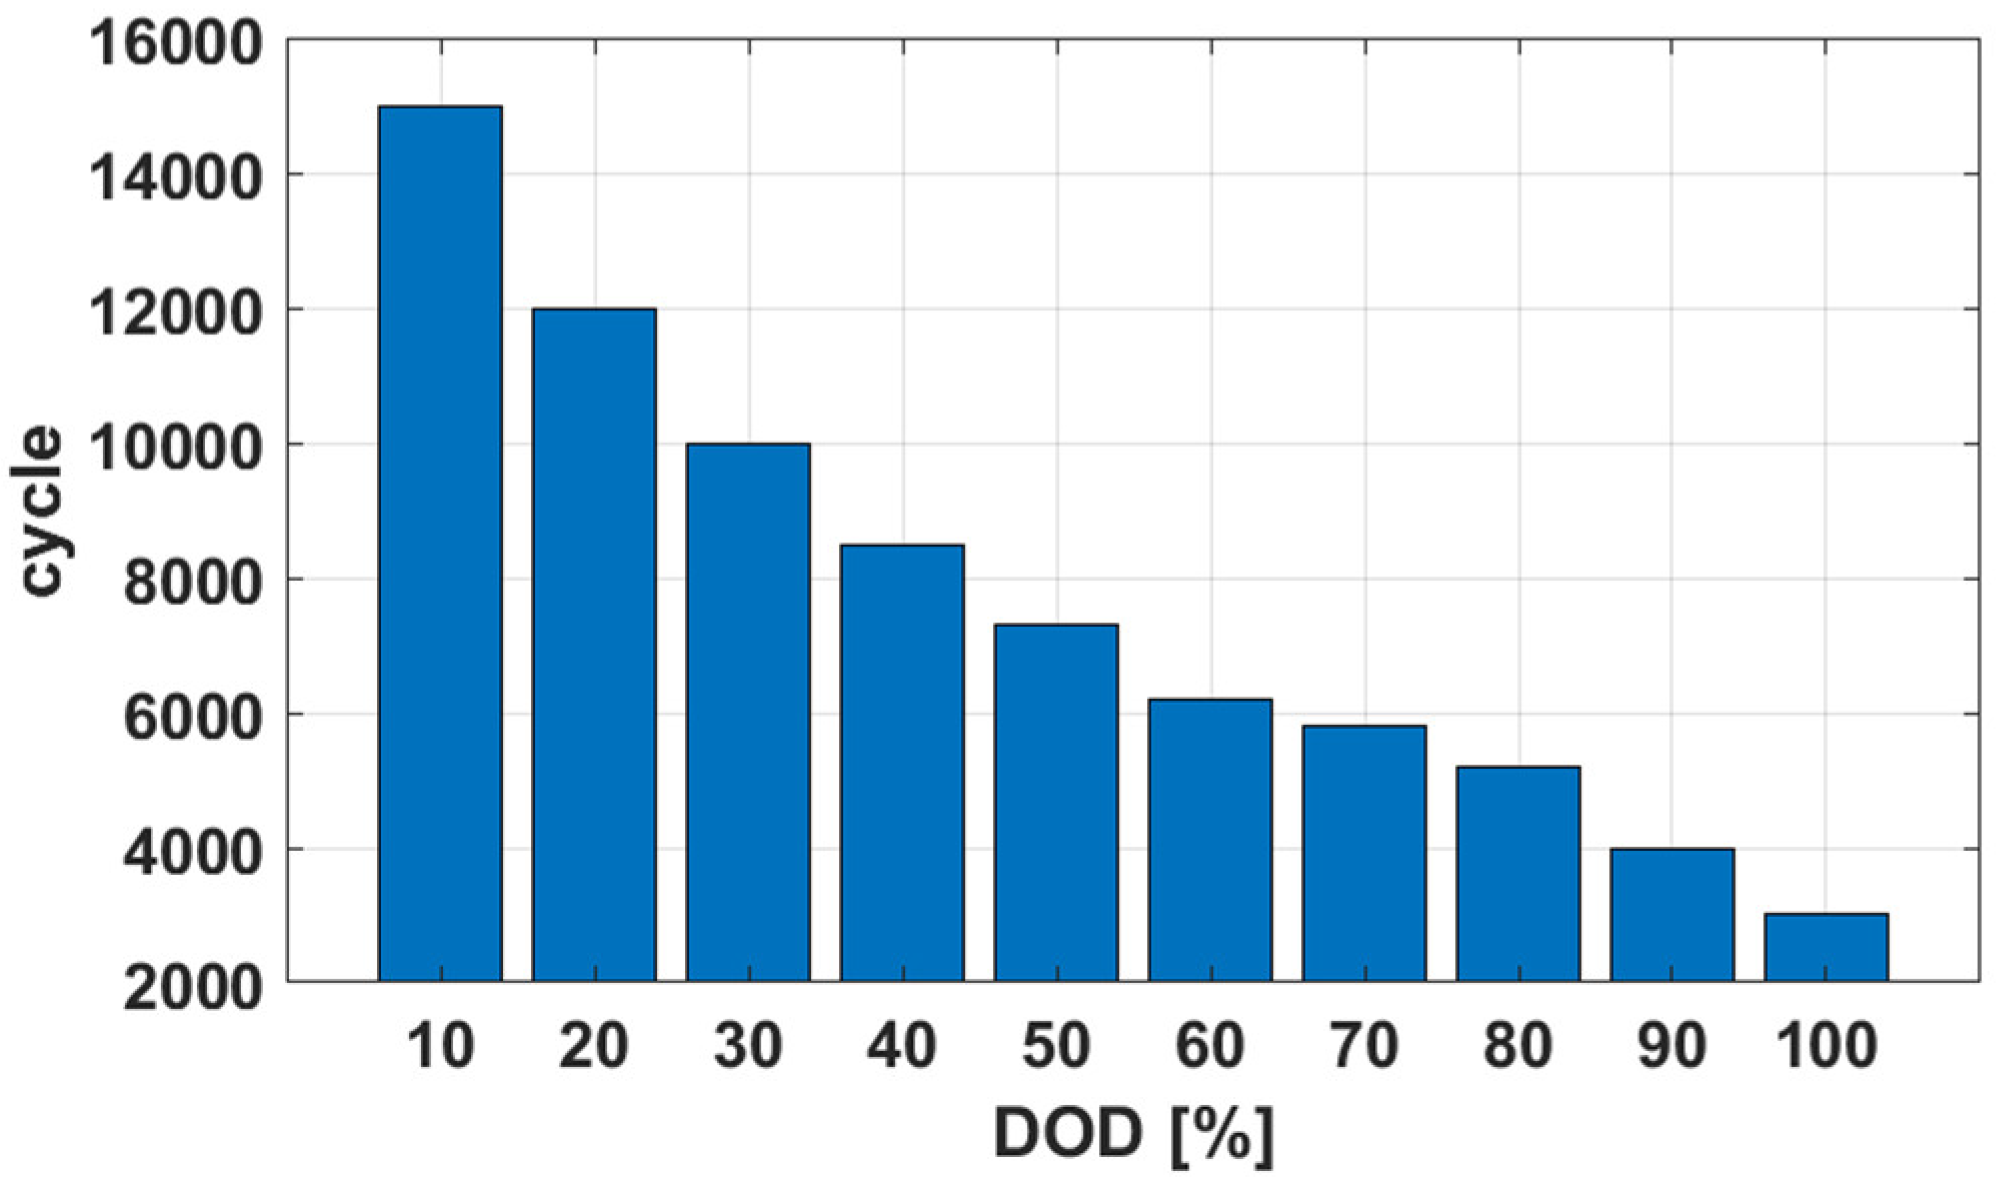
The International Energy Agency stated battery service life as a major obstacle to the proliferation of electric vehicles. Therefore, this aspect must be thoroughly investigated to the widespread commercialization of electric buses. In addition, the related DOD determines the battery capacity that can be used during the service life, with the largest usable capacity being preferred. Figure 1 shows the tradeoff between the service life and DOD of a lithium-ion battery. Note that reducing the DOD to extend the service life also reduces efficiency, because the total usable capacity of the battery decreases. Therefore, the battery degradation cost should be minimized, while ensuring a high DOD by using the following relation [27]:
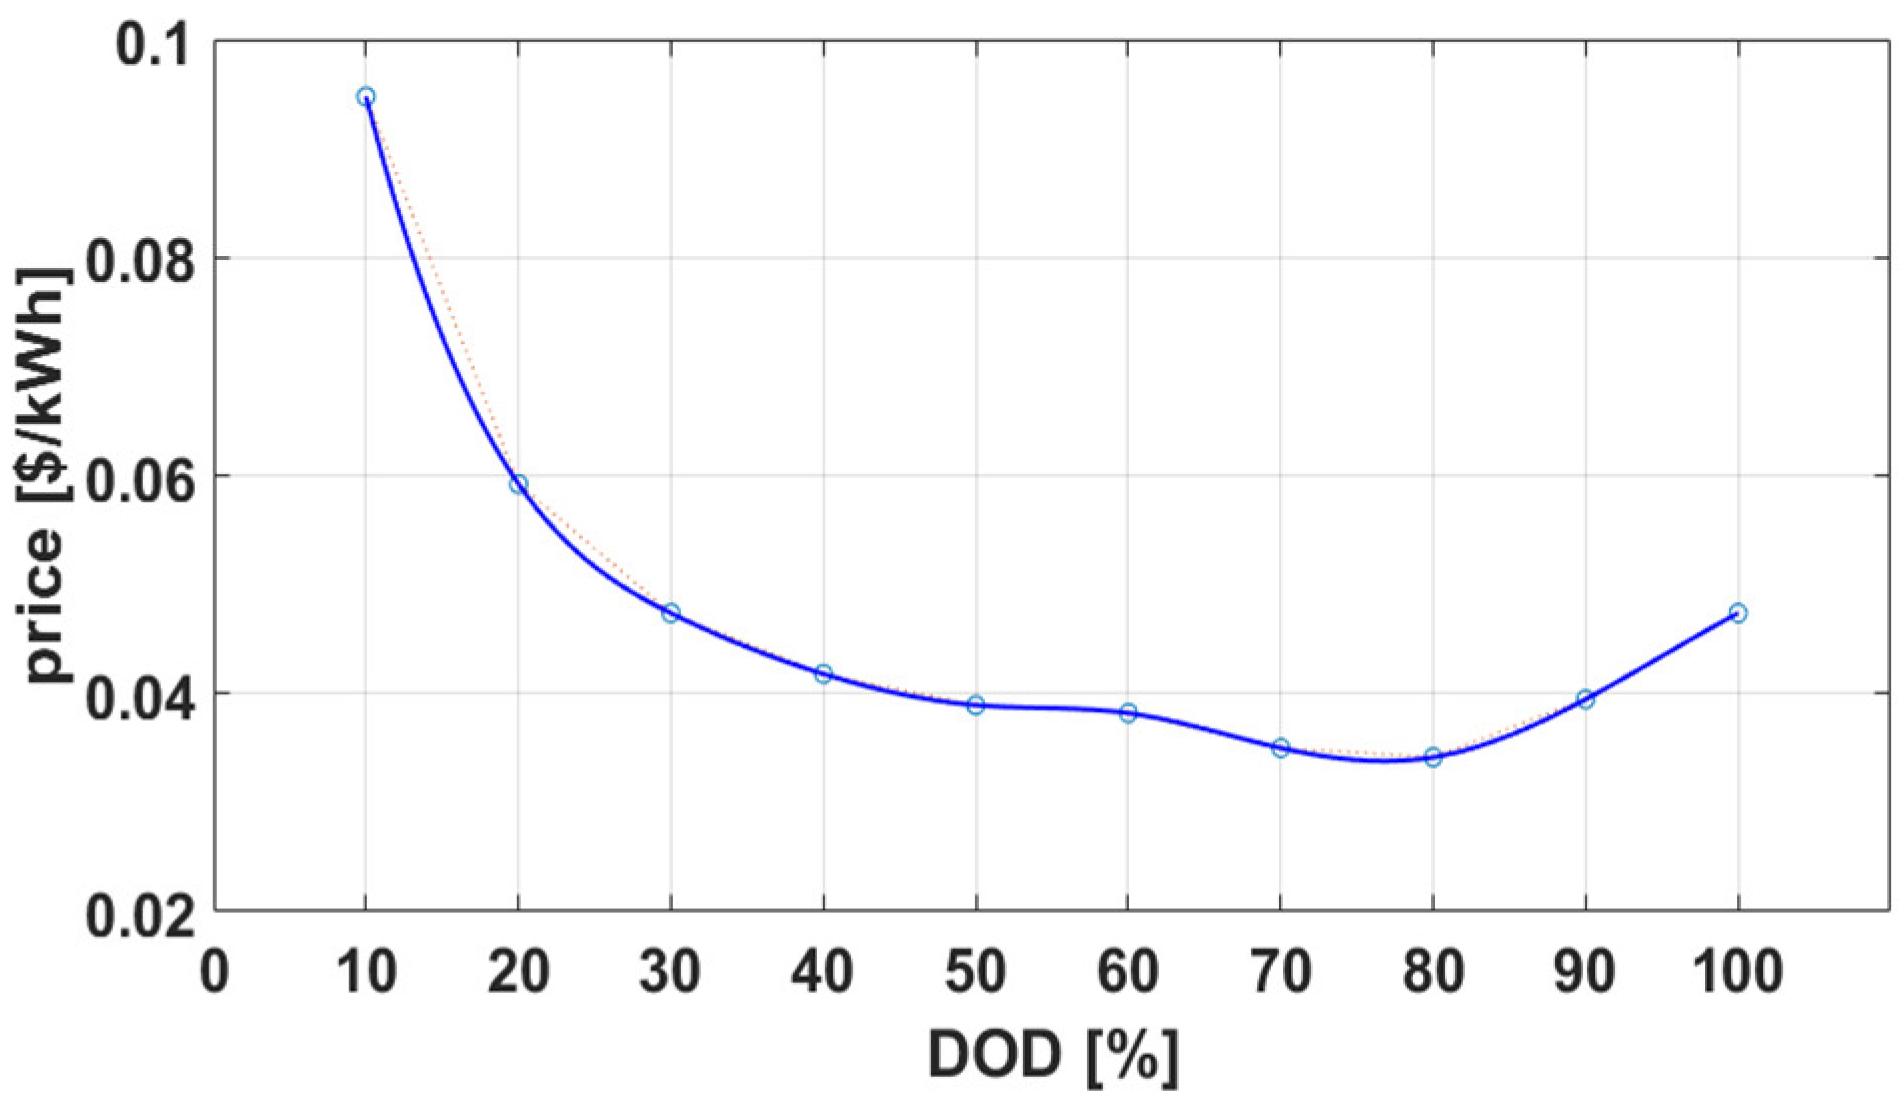
Figure 2 depicts the battery degradation cost for cycling within a specific state of charge (SOC) range. We analyzed the degradation cost using the DOD–cycle graph in Figure 1. Alternatively, lithium–titanate batteries can avoid the shortcomings of lithium-ion batteries in aspects, such as service life, safety, charging time, transfer speeds, and operation under extreme temperatures Moreover, lithium–titanate batteries provide stable charging and discharging performance, being suitable for electric buses. However, their price is 30% higher than that of lithium-ion batteries. In this study, we considered a lithium-ion battery price of $273/kWh with discharge efficiency of 0.97. In addition, an appropriate DOD is 75% while considering battery degradation [28,29].
3.2. Battery Capacity Estimation
We estimate battery capacity while considering the all-electric range (AER), battery DOD, and other vehicle specifications by using Equation (2), and energy consumption considering electric motor characteristics and other parameters that are specified in Table 2 by using Equation (3) [30].
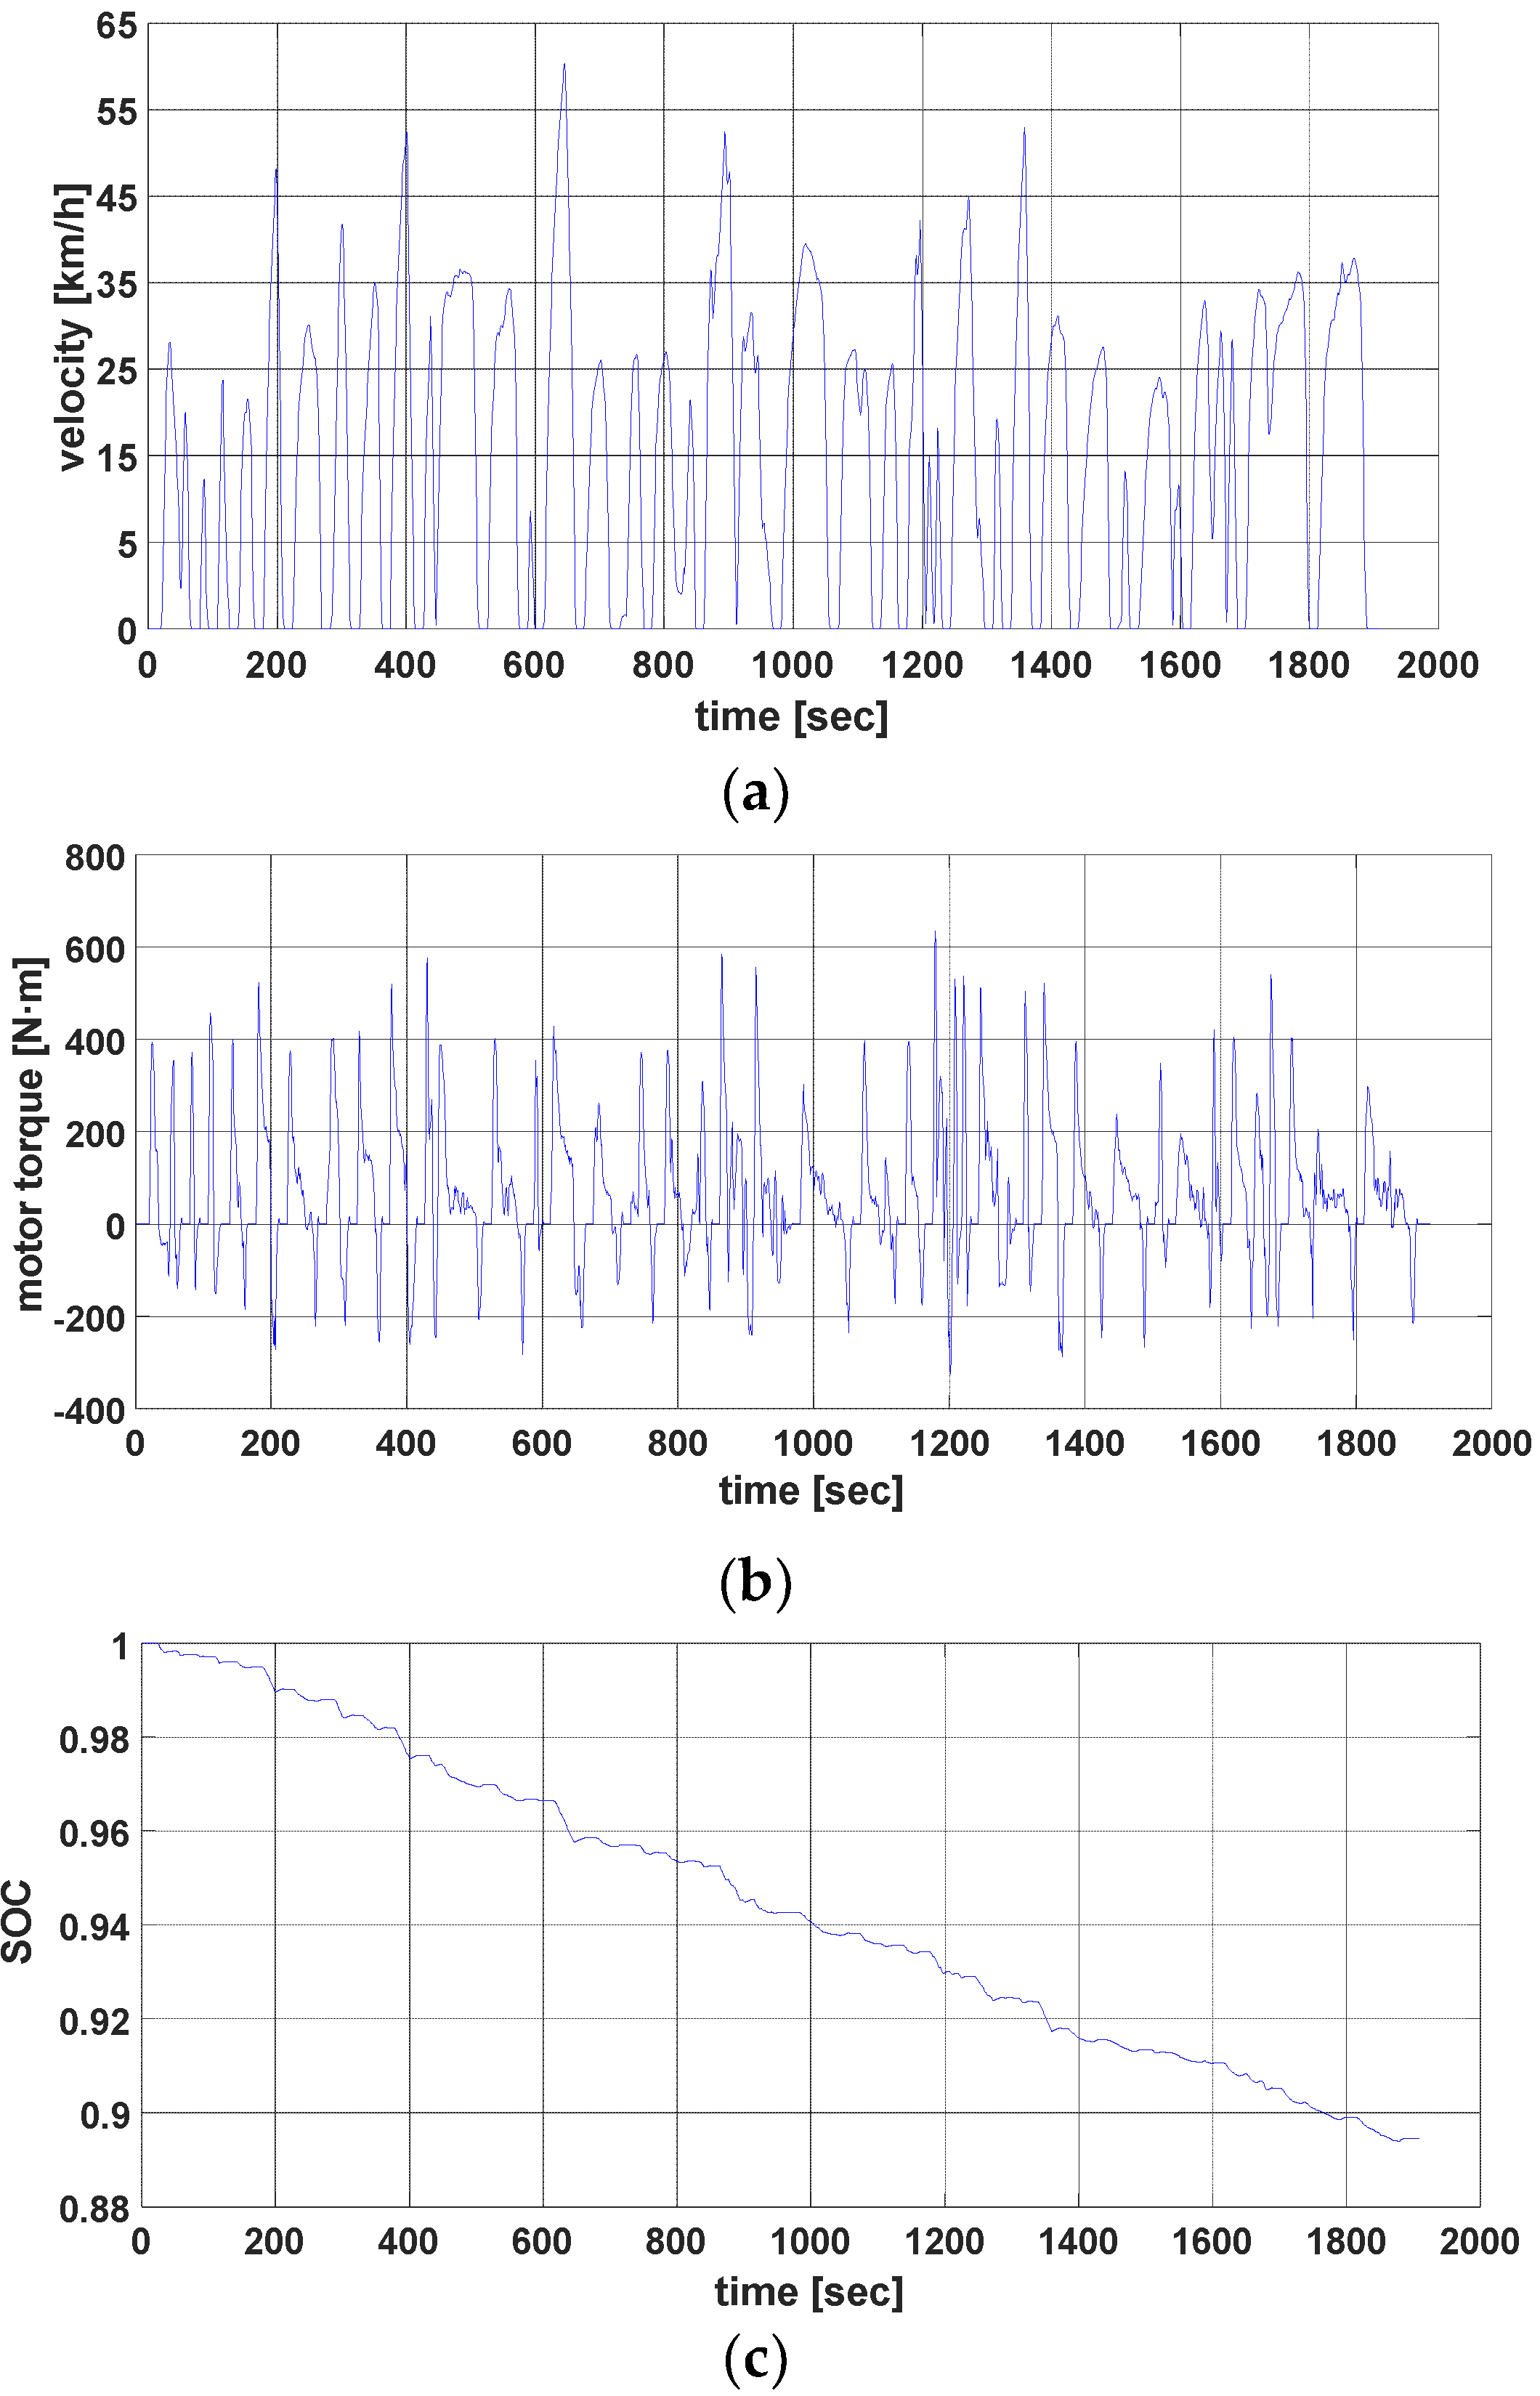
We analyzed the battery capacity according to the electric bus AER while using ADVISOR, the vehicle simulator that allows for analyzing energy consumption based on bus drive cycles and calculate the corresponding capacity of electric bus batteries [31]. Specifically, the Orange County bus cycle (OCC) test was conducted using actual bus operating data, retrieving the results shown in Figure 3 for velocity, motor torque, and SOC for a test cycle. The electric bus AER was considered to be 80 km, following the specification of the Ministry of Environment. Table 3 summarizes the battery capacity results that were obtained from ADVISOR.
4. Public Service Electric Bus Analyses
4.1. Operating Enironment
The operating environment of electric buses is the same as that of the existing compressed natural gas (CNG) buses, but the battery charging time must be considered given energy consumption during operation. To provide a similar service, additional buses are required to compensate for the battery charging time and to maintain the route headway. We estimate the charging time and number of required buses according to the battery energy consumption and operating environment.
The energy that is consumed during electric bus operation can be determined from the battery discharge:
where fuel efficiency α includes the passenger and cooling/heating ratios at time t.
The electric bus charging time is defined as the time required to restore the electrical energy consumed during operation and can be calculated based on the SOC, as
When the charging time is longer than the headway, additional electric buses are required to maintain a similar operating environment to that of CNG buses. The number of additional electric buses can be calculated as
4.2. Economic Efficiency Analysis
We employ an economic efficiency analysis to determine the feasibility of an investment project on electric buses by measuring the costs and benefits to obtain the resulting economic return. This analysis considers the benefit–cost ratio (B/C ratio), net present value (NPV), and internal rate of return (IRR). Both the NPV and IRR are similar measures to assess a project whose costs and benefits vary over time. Still, the IRR provides neither the support for decision-making nor results corresponding to various alternatives. Therefore, the NPV is regarded as a more appropriate measure in terms of project assessment. We consider the NPV to analyze the economic efficiency of electric bus operation, as follows:
where the cost is calculated as
which comprises the vehicle purchase and infrastructure construction costs as initial costs, and the maintenance and battery replacement costs as operating costs. Equations (10) and (11) show that the actual vehicle purchase considers the vehicle subsidy, and the maintenance cost can be obtained as a fraction of the infrastructure construction cost from the third year:
In addition, we assume the overhead and personnel costs to be $36 × 103 per year, and calculate the battery replacement cost while using Equation (12), which indicates the period of battery replacement to be considered in the analysis:
The total benefit is given by the sum of the energy and maintenance cost savings when compared to the CNG buses and the fare profit:
Finally, the annual profit from the electric bus fare can be expressed as
5. Case Study
5.1. Scenario and Data
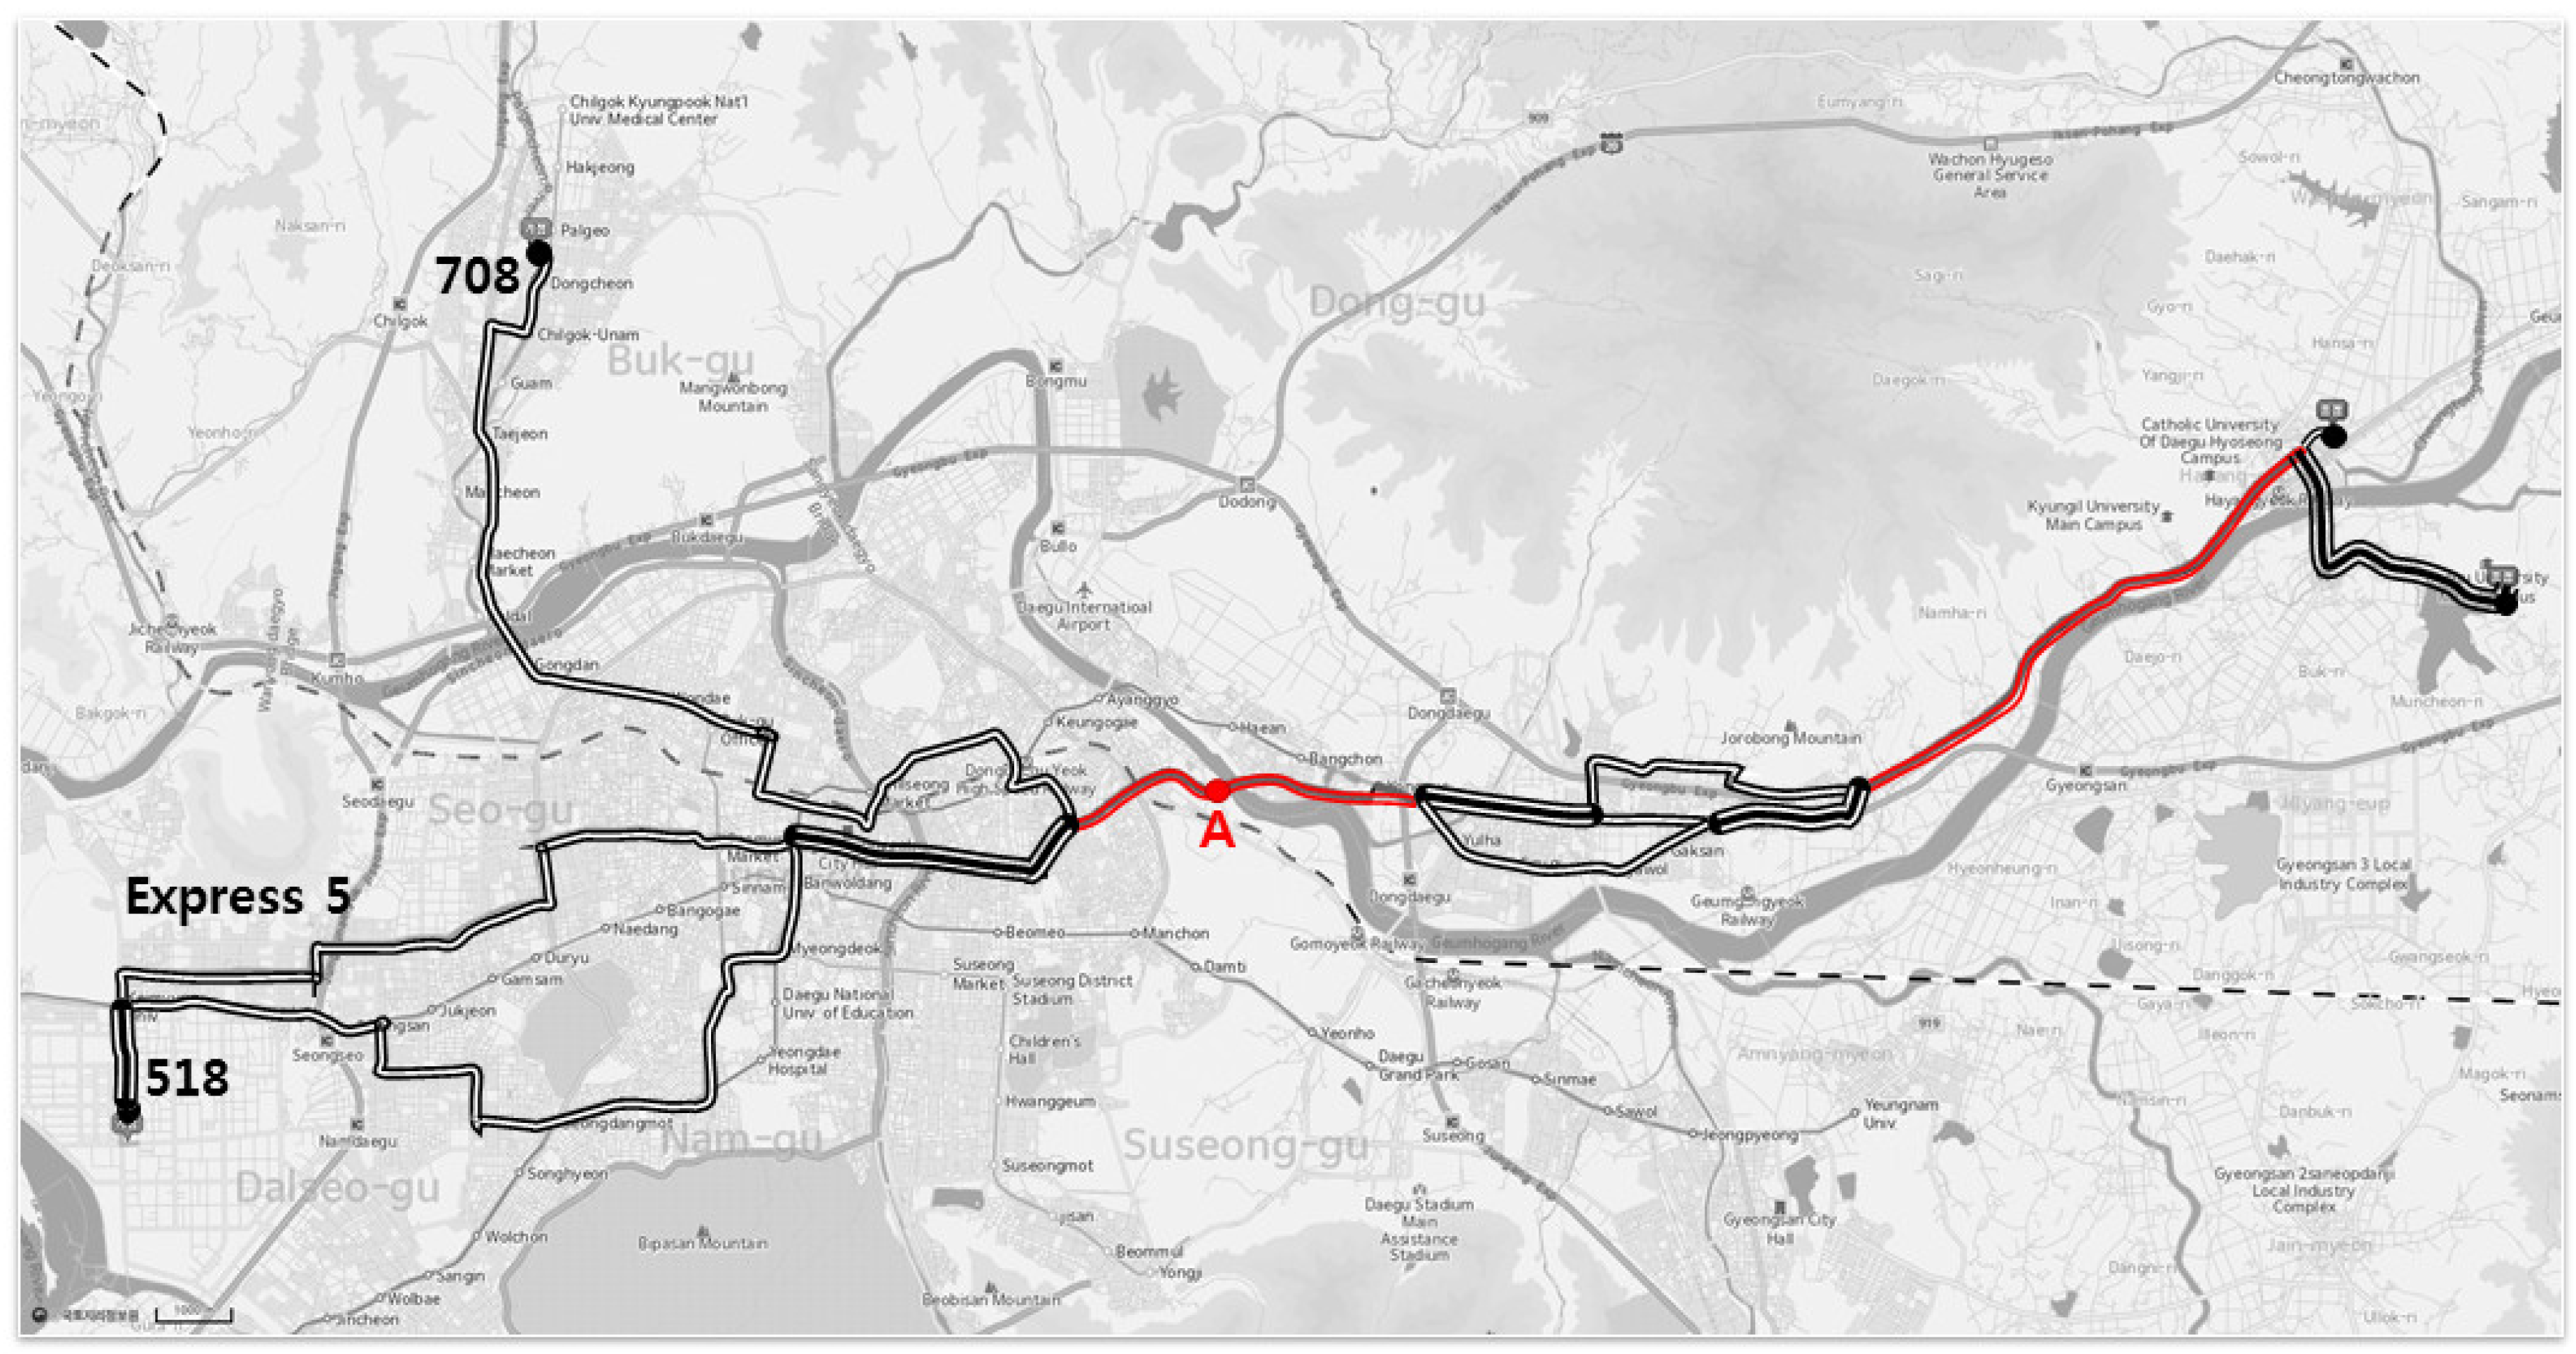
In this study, we estimated the battery capacity considering the battery DOD range and degradation cost applied to public service electric buses. In addition, we determined the number of additional electric buses that are required to preserve the headway of existing CNG buses. This estimation considered the electric bus charging time, energy consumption analysis, and operating environment. From these results, we determined the proper charging type and economic efficiency analysis for bus routes 518, 708, and Express 5 in Daegu City, South Korea, as depicted in Figure 4. We then evaluated several intersecting routes from the city.
The economic efficiency analysis was conducted on plug-in-charging, battery-swapping, and wireless-charging vehicles. We set the discount rate to 5.5% and the analysis period to 20 years and considered the battery capacity of 144 kWh and charging power of 200 kW, as detailed in Section 3. In addition, we set the velocity of the electric bus to the average for city buses of 20 km/h. Table 4 describes the daily operating environment of each route depicted in Figure 4. For this case study, we determined that routes 518 and Express 5 would require two additional electric buses per route to provide a similar service to that of the existing CNG buses.
The fuel efficiency listed in Table 5 considered the passenger and cooling/heating ratios at different times to determine the energy consumption of operating electric buses while using Equation (5).
Then, economic efficiency analyses were performed by determining the energy consumption, charging time, and number of additional electric buses that are required according to the electric bus operating distance and headway. The detailed costs are shown in Table 6. In addition, we determined the annual benefit of each bus due to the fare to be $2.88 million, and the annual energy and maintenance cost savings due to electric bus operation to be $473,000. We calculated the fare in Daegu City by reflecting the annual discount rate of 5.5% [32].
5.2. Economic Efficiency Analysis Per Route
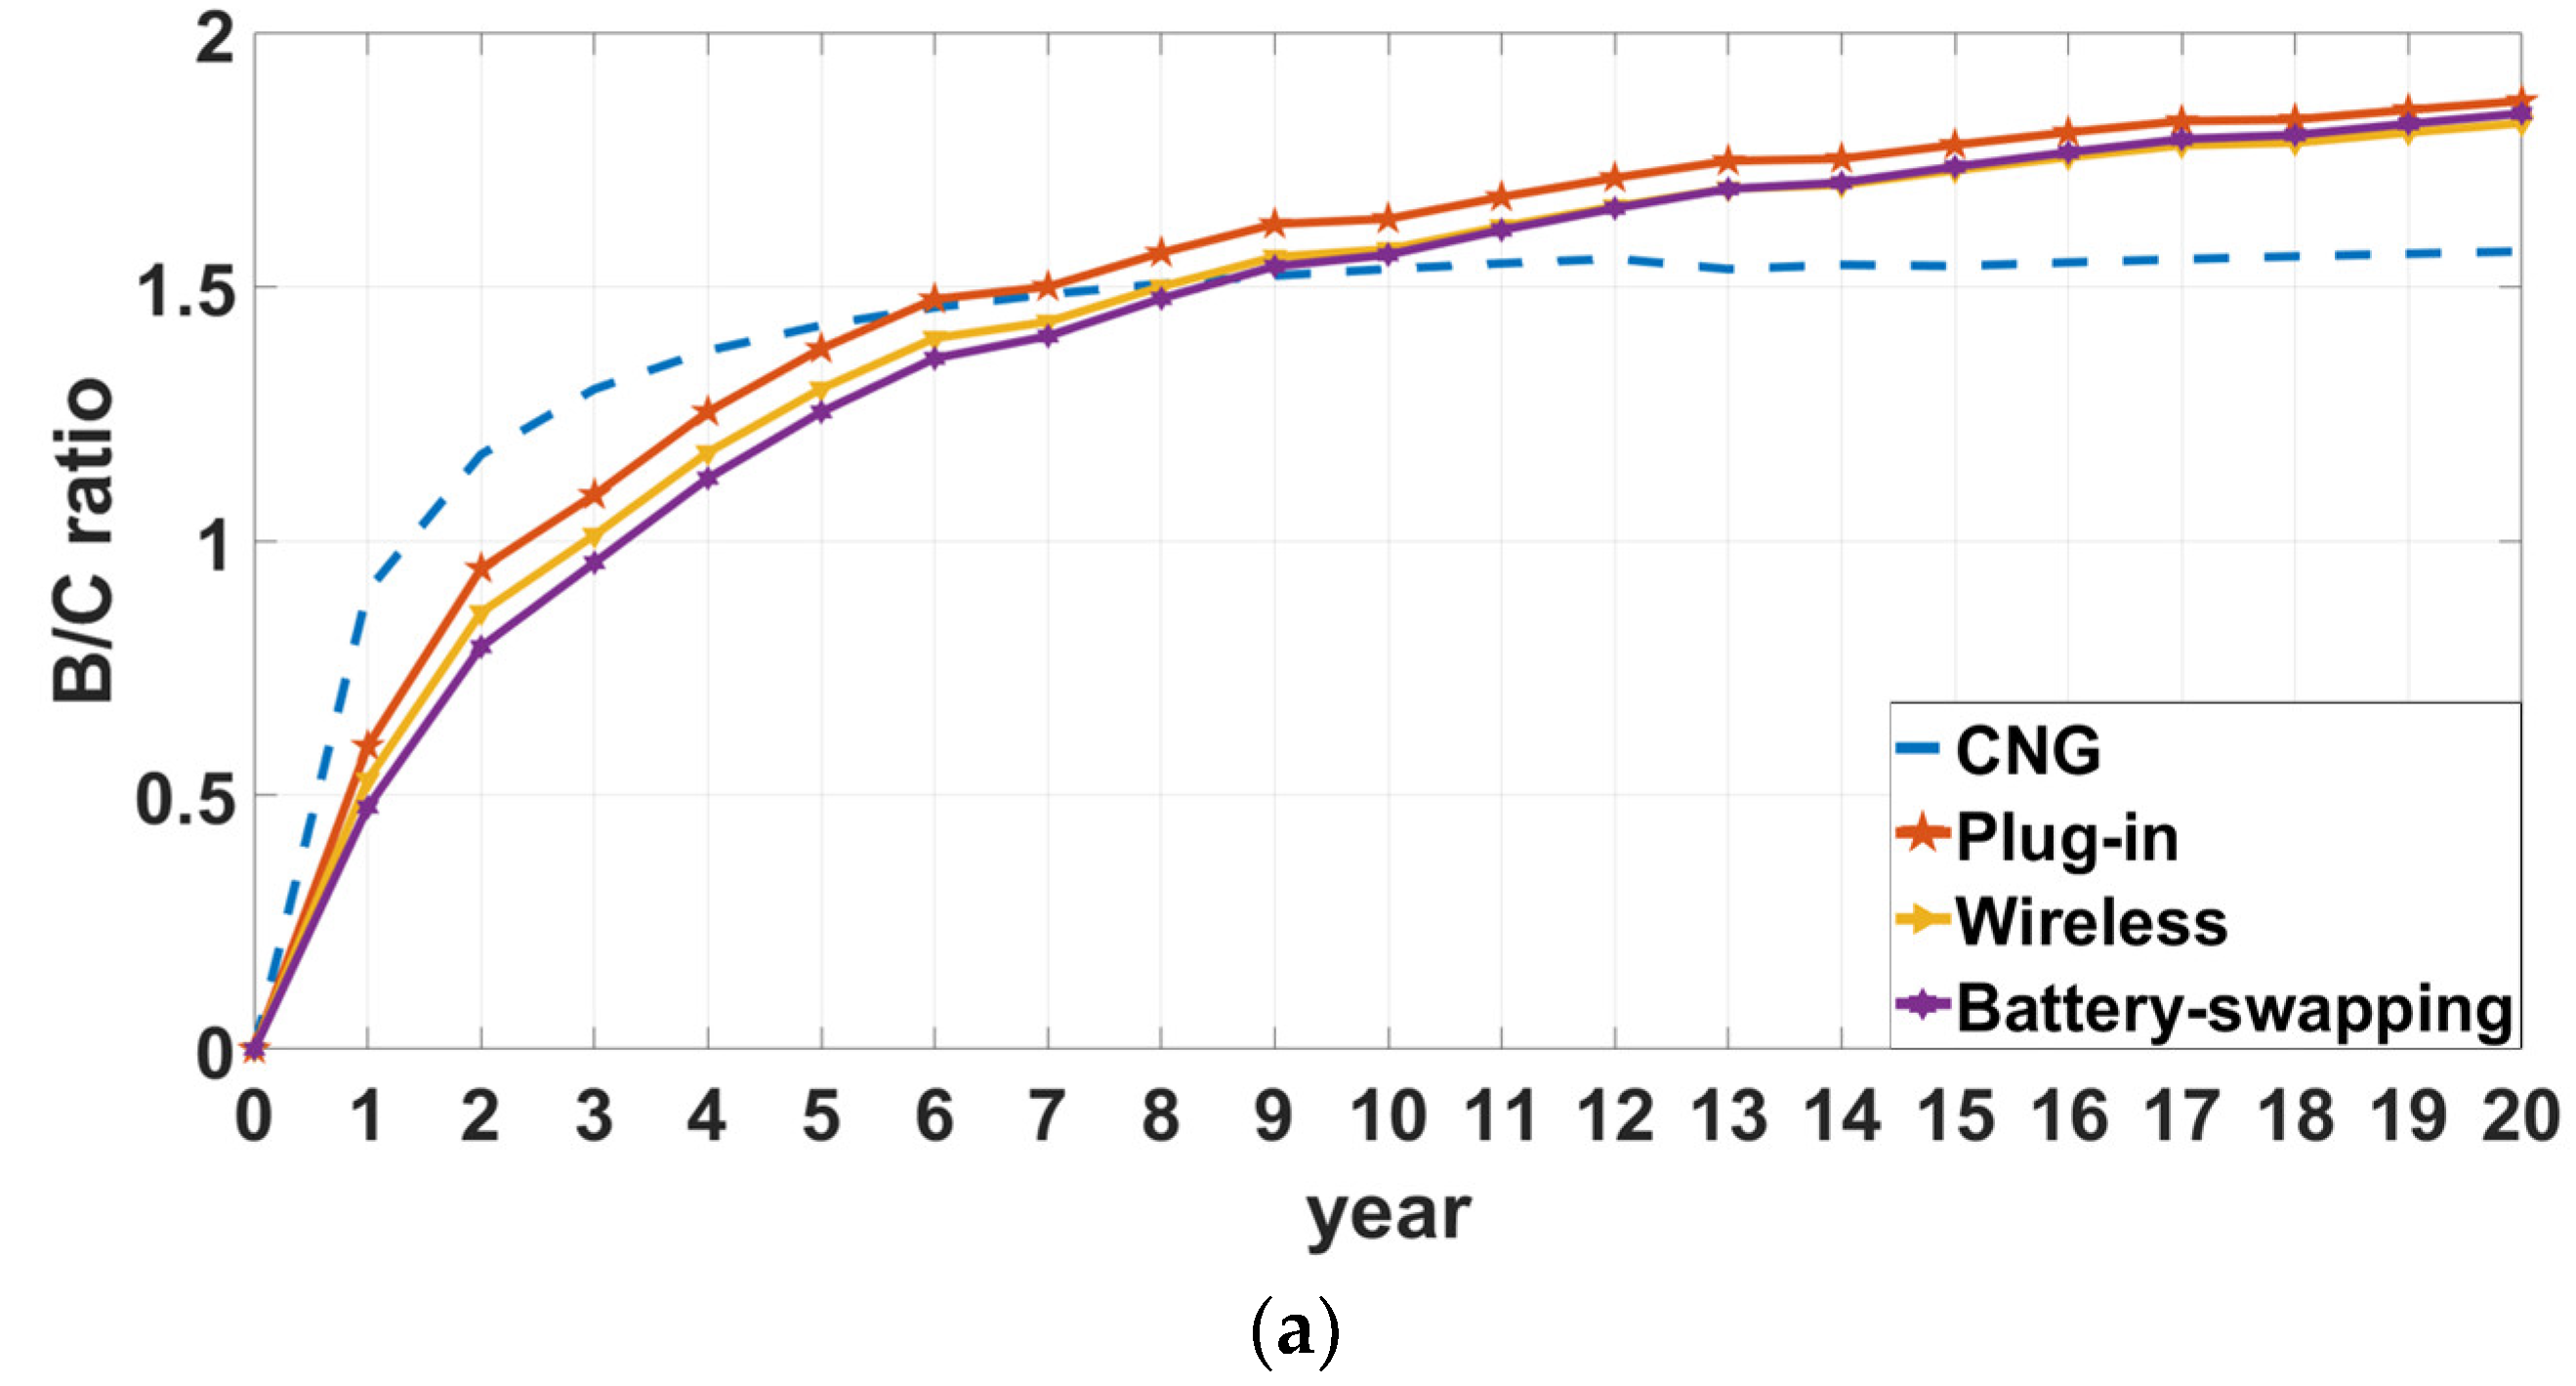
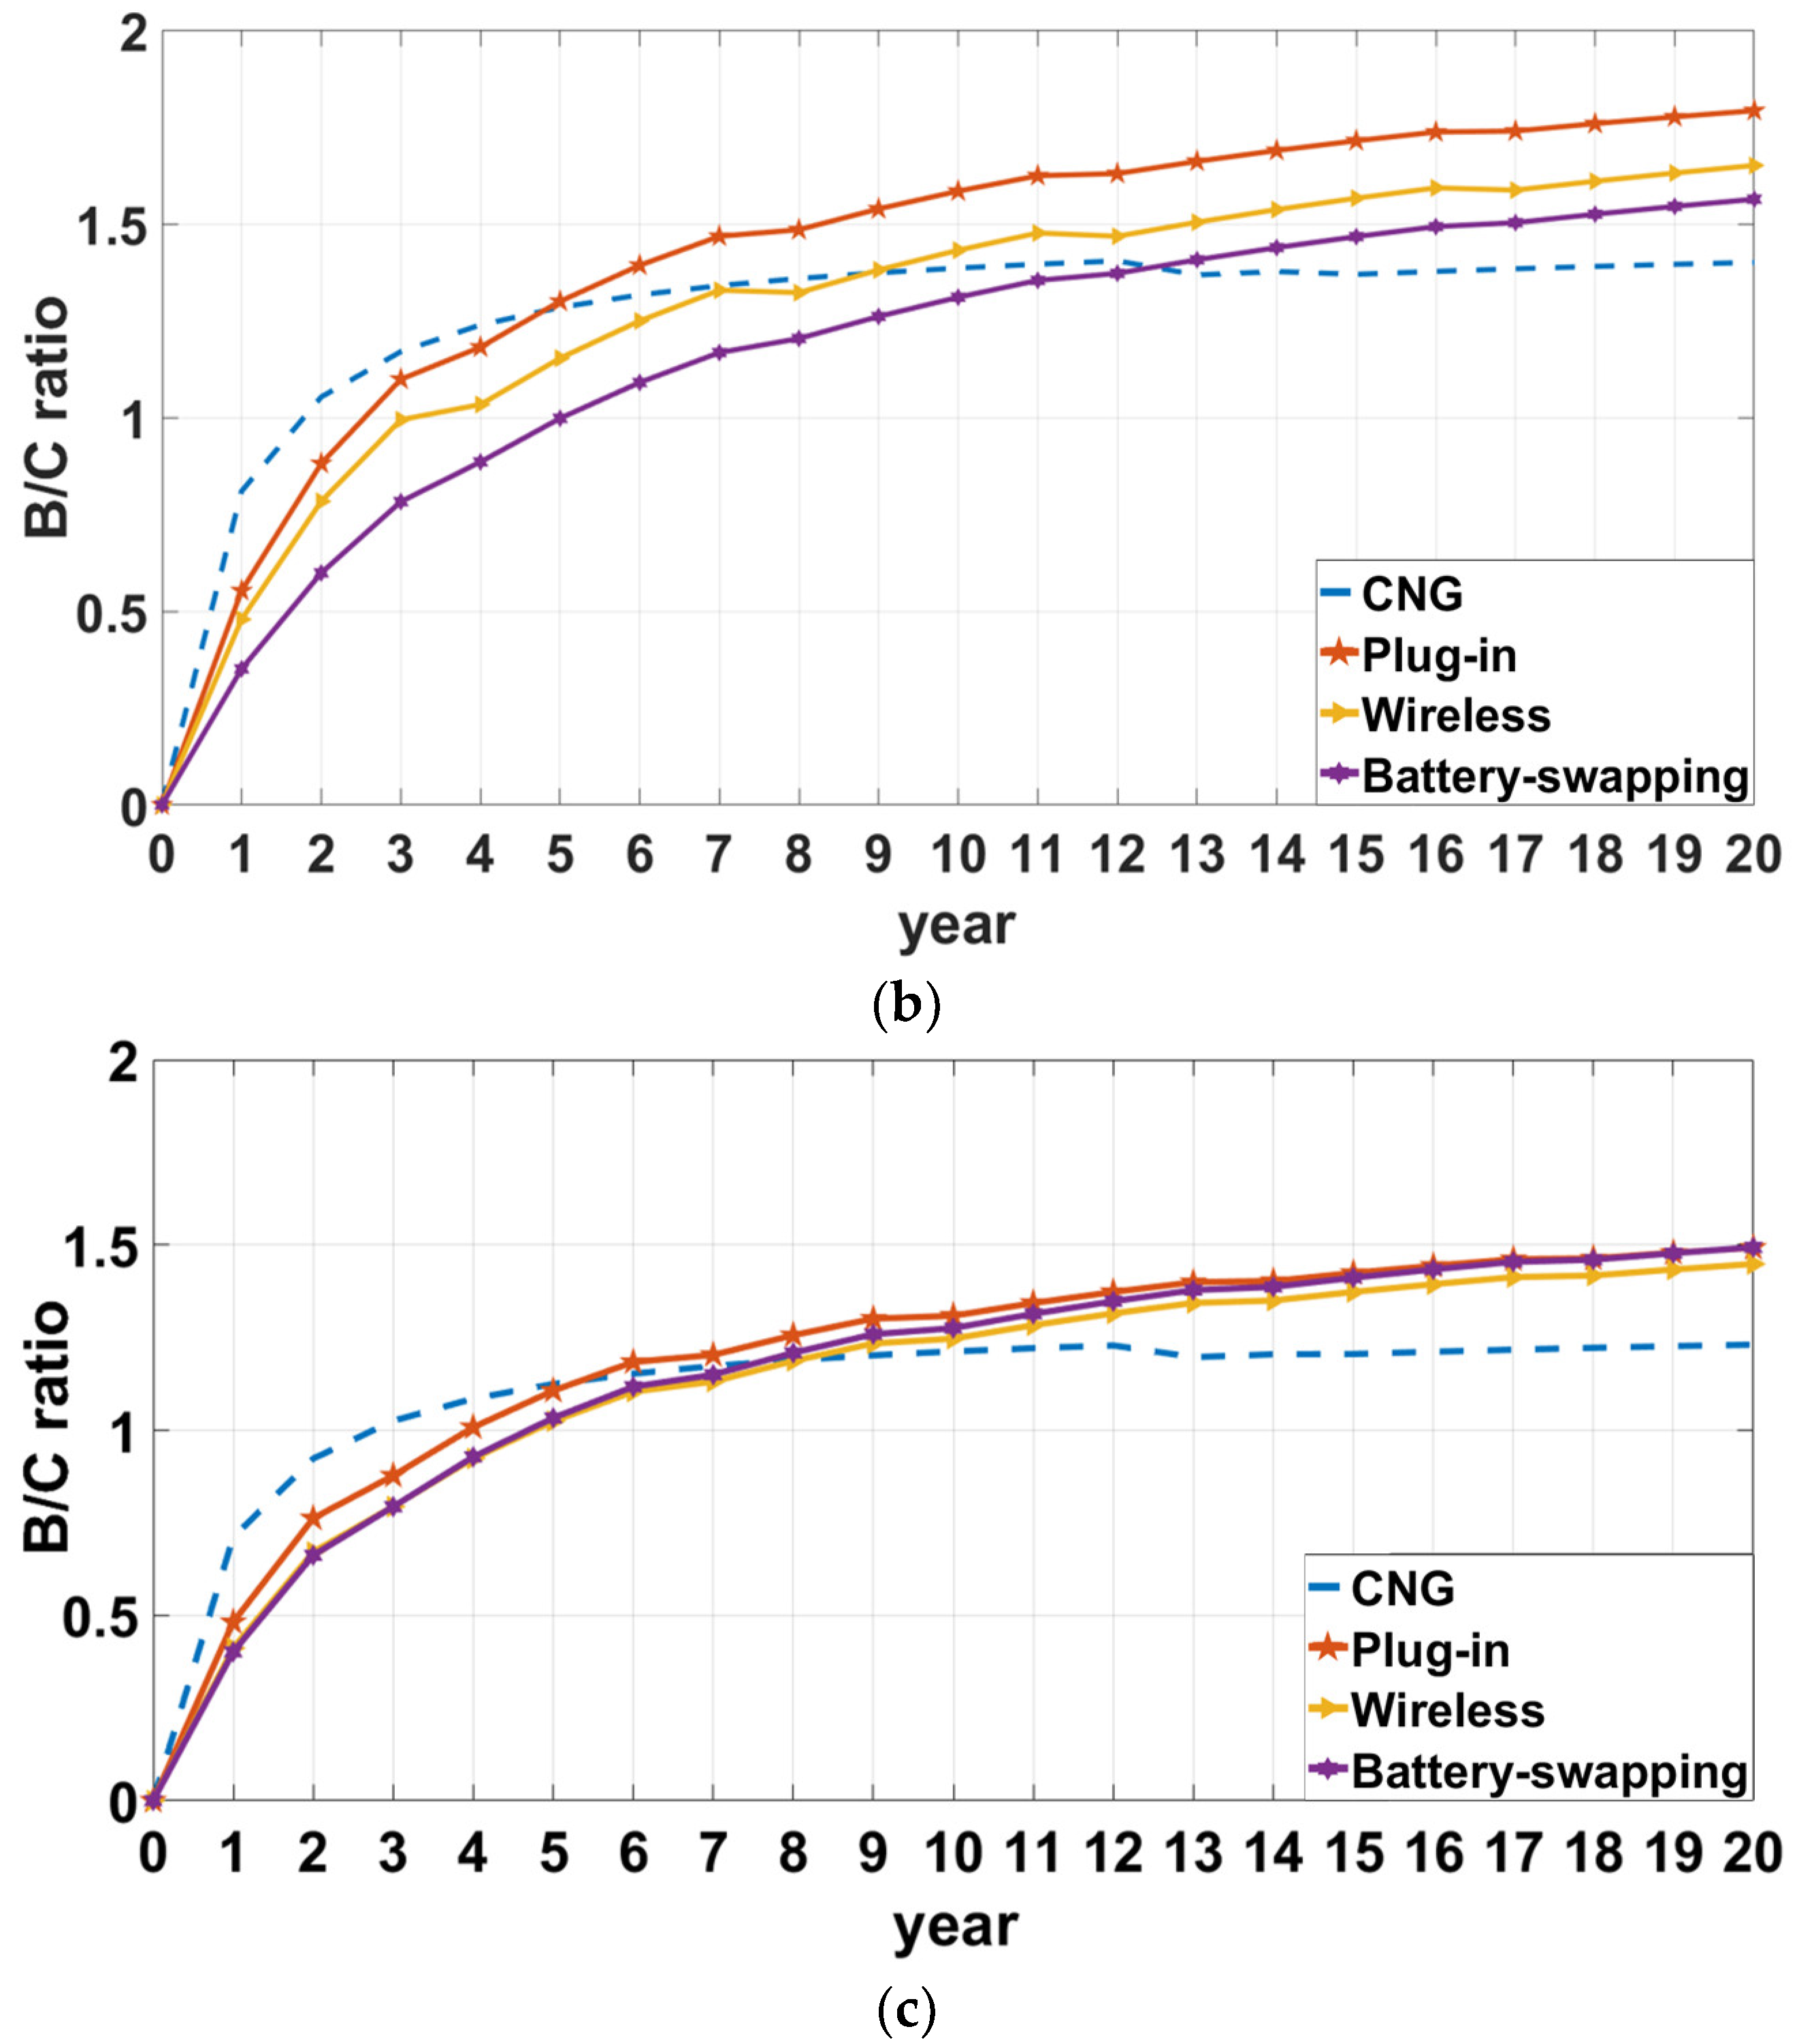
We analyzed each of the three routes in Daegu City depicted in Figure 4 to determine the economic efficiency of electric buses according to the operating distance and headway by charging type, obtaining the results that are shown in Figure 5. The CNG buses initially exhibit the highest B/C ratios because the only infrastructure costs belong to maintenance, whereas electric buses incur heavy initial construction costs. However, along the analysis period of 20 years, the economic efficiency increases for plug-in charging, followed by battery swapping and wireless charging in route 518, outperforming that of CNG buses. Similarly, the economic efficiency increases reaching the highest B/C ratio for plug-in charging, followed by wireless charging and battery swapping in route 708. Route Express 5 has more buses and shorter headways than route 708, and plug-in charging and battery swapping show the same B/C ratio, being slightly higher than that of wireless charging. Therefore, the charging type selection can vary even under the operating environment depending on various characteristics, such as the charging time, operating distance, and initial infrastructure investment.
5.3. Economic Efficiency Analysis for Intersecting Routes
We conducted a similar economic efficiency analysis on other operating routes intersecting at stop A (see Figure 4) in Daegu City. We considered the operating ratio of each route, whose characteristics are summarized in Table 7.
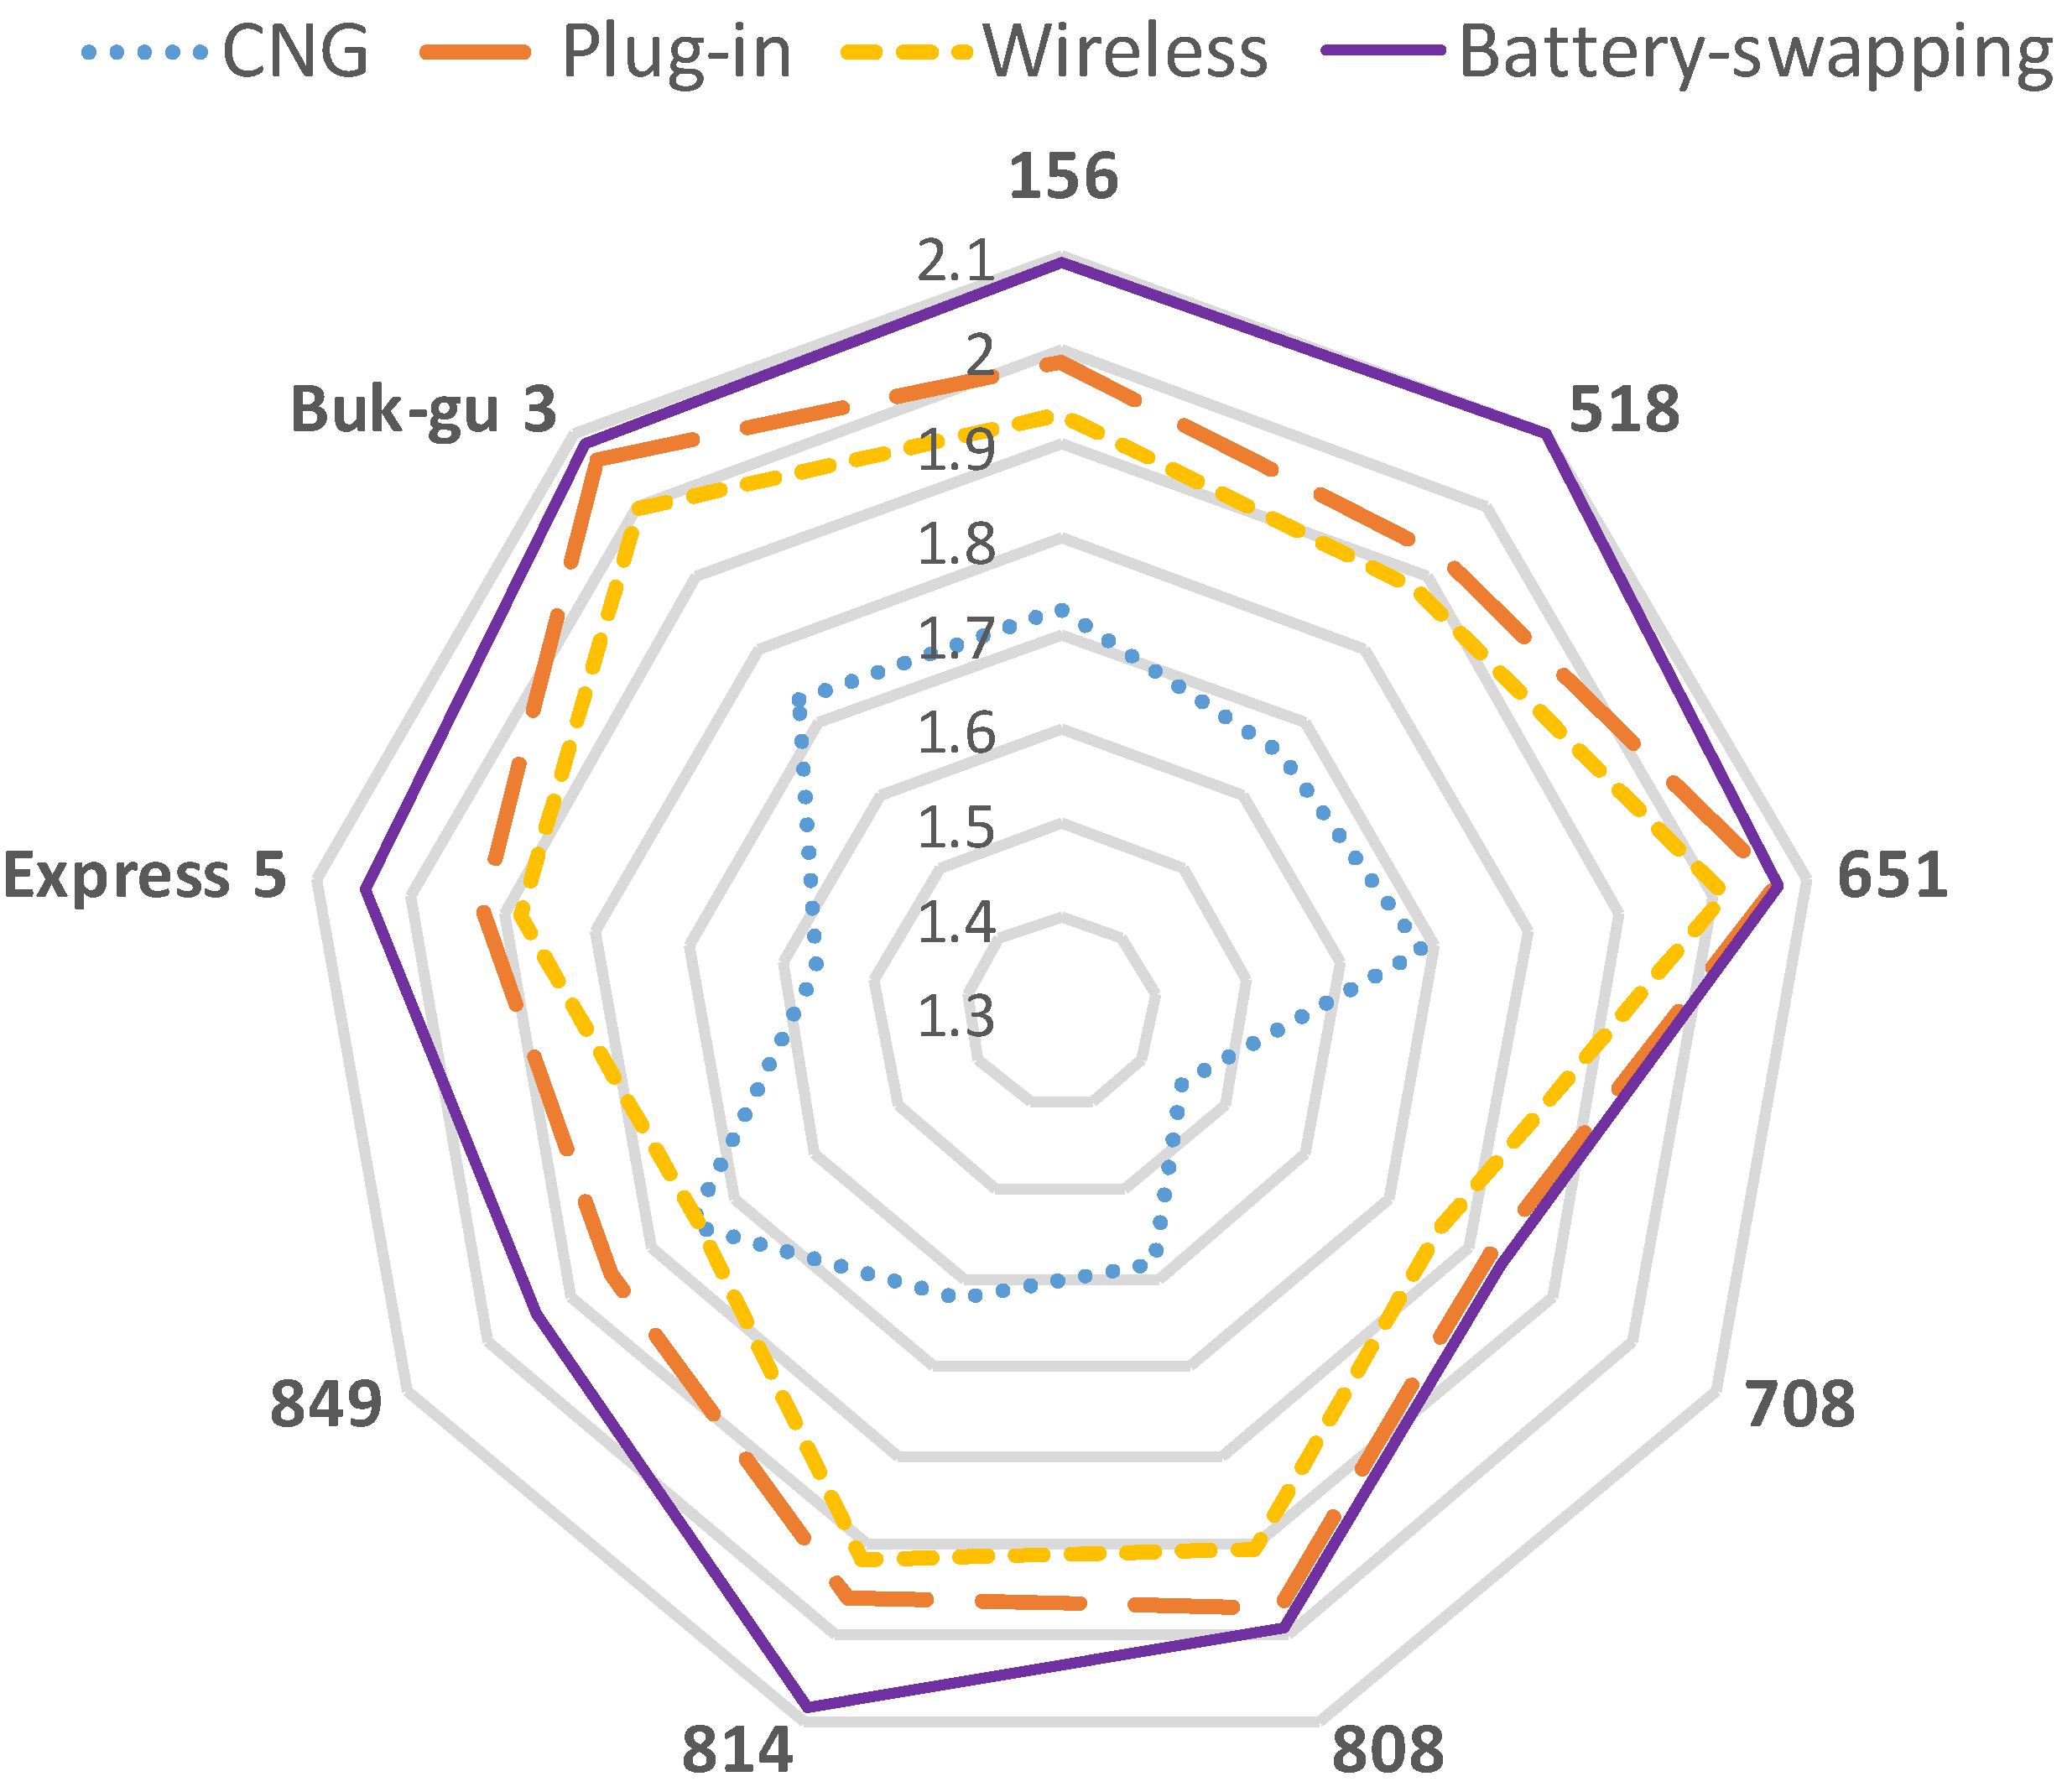
We used the data in Table 7 to determine the economic efficiency of electric buses over the analyzed period of 20 years when considering the headway by charging type. Figure 6 shows the results of the economic analysis on a composite route. Battery swapping minimizes the initial infrastructure construction cost because the necessary infrastructure can be installed at the route intersection. Therefore, we applied $32 million, which is the initial infrastructure construction cost of battery swapping, to the operating ratio of each route at stop A to conduct the economic efficiency analysis. The battery-swapping vehicles exhibit the highest economic efficiency for all of the routes intersecting at stop A. However, for routes 651, 708, 808, and Buk-gu 3, which have relatively lower operating ratios at stop A, the B/C ratios of battery swapping are similar to those of plug-in charging, as shown in Figure 6 and detailed in Table 8.
5.4. Economic Efficiency Analysis by Operating Environment
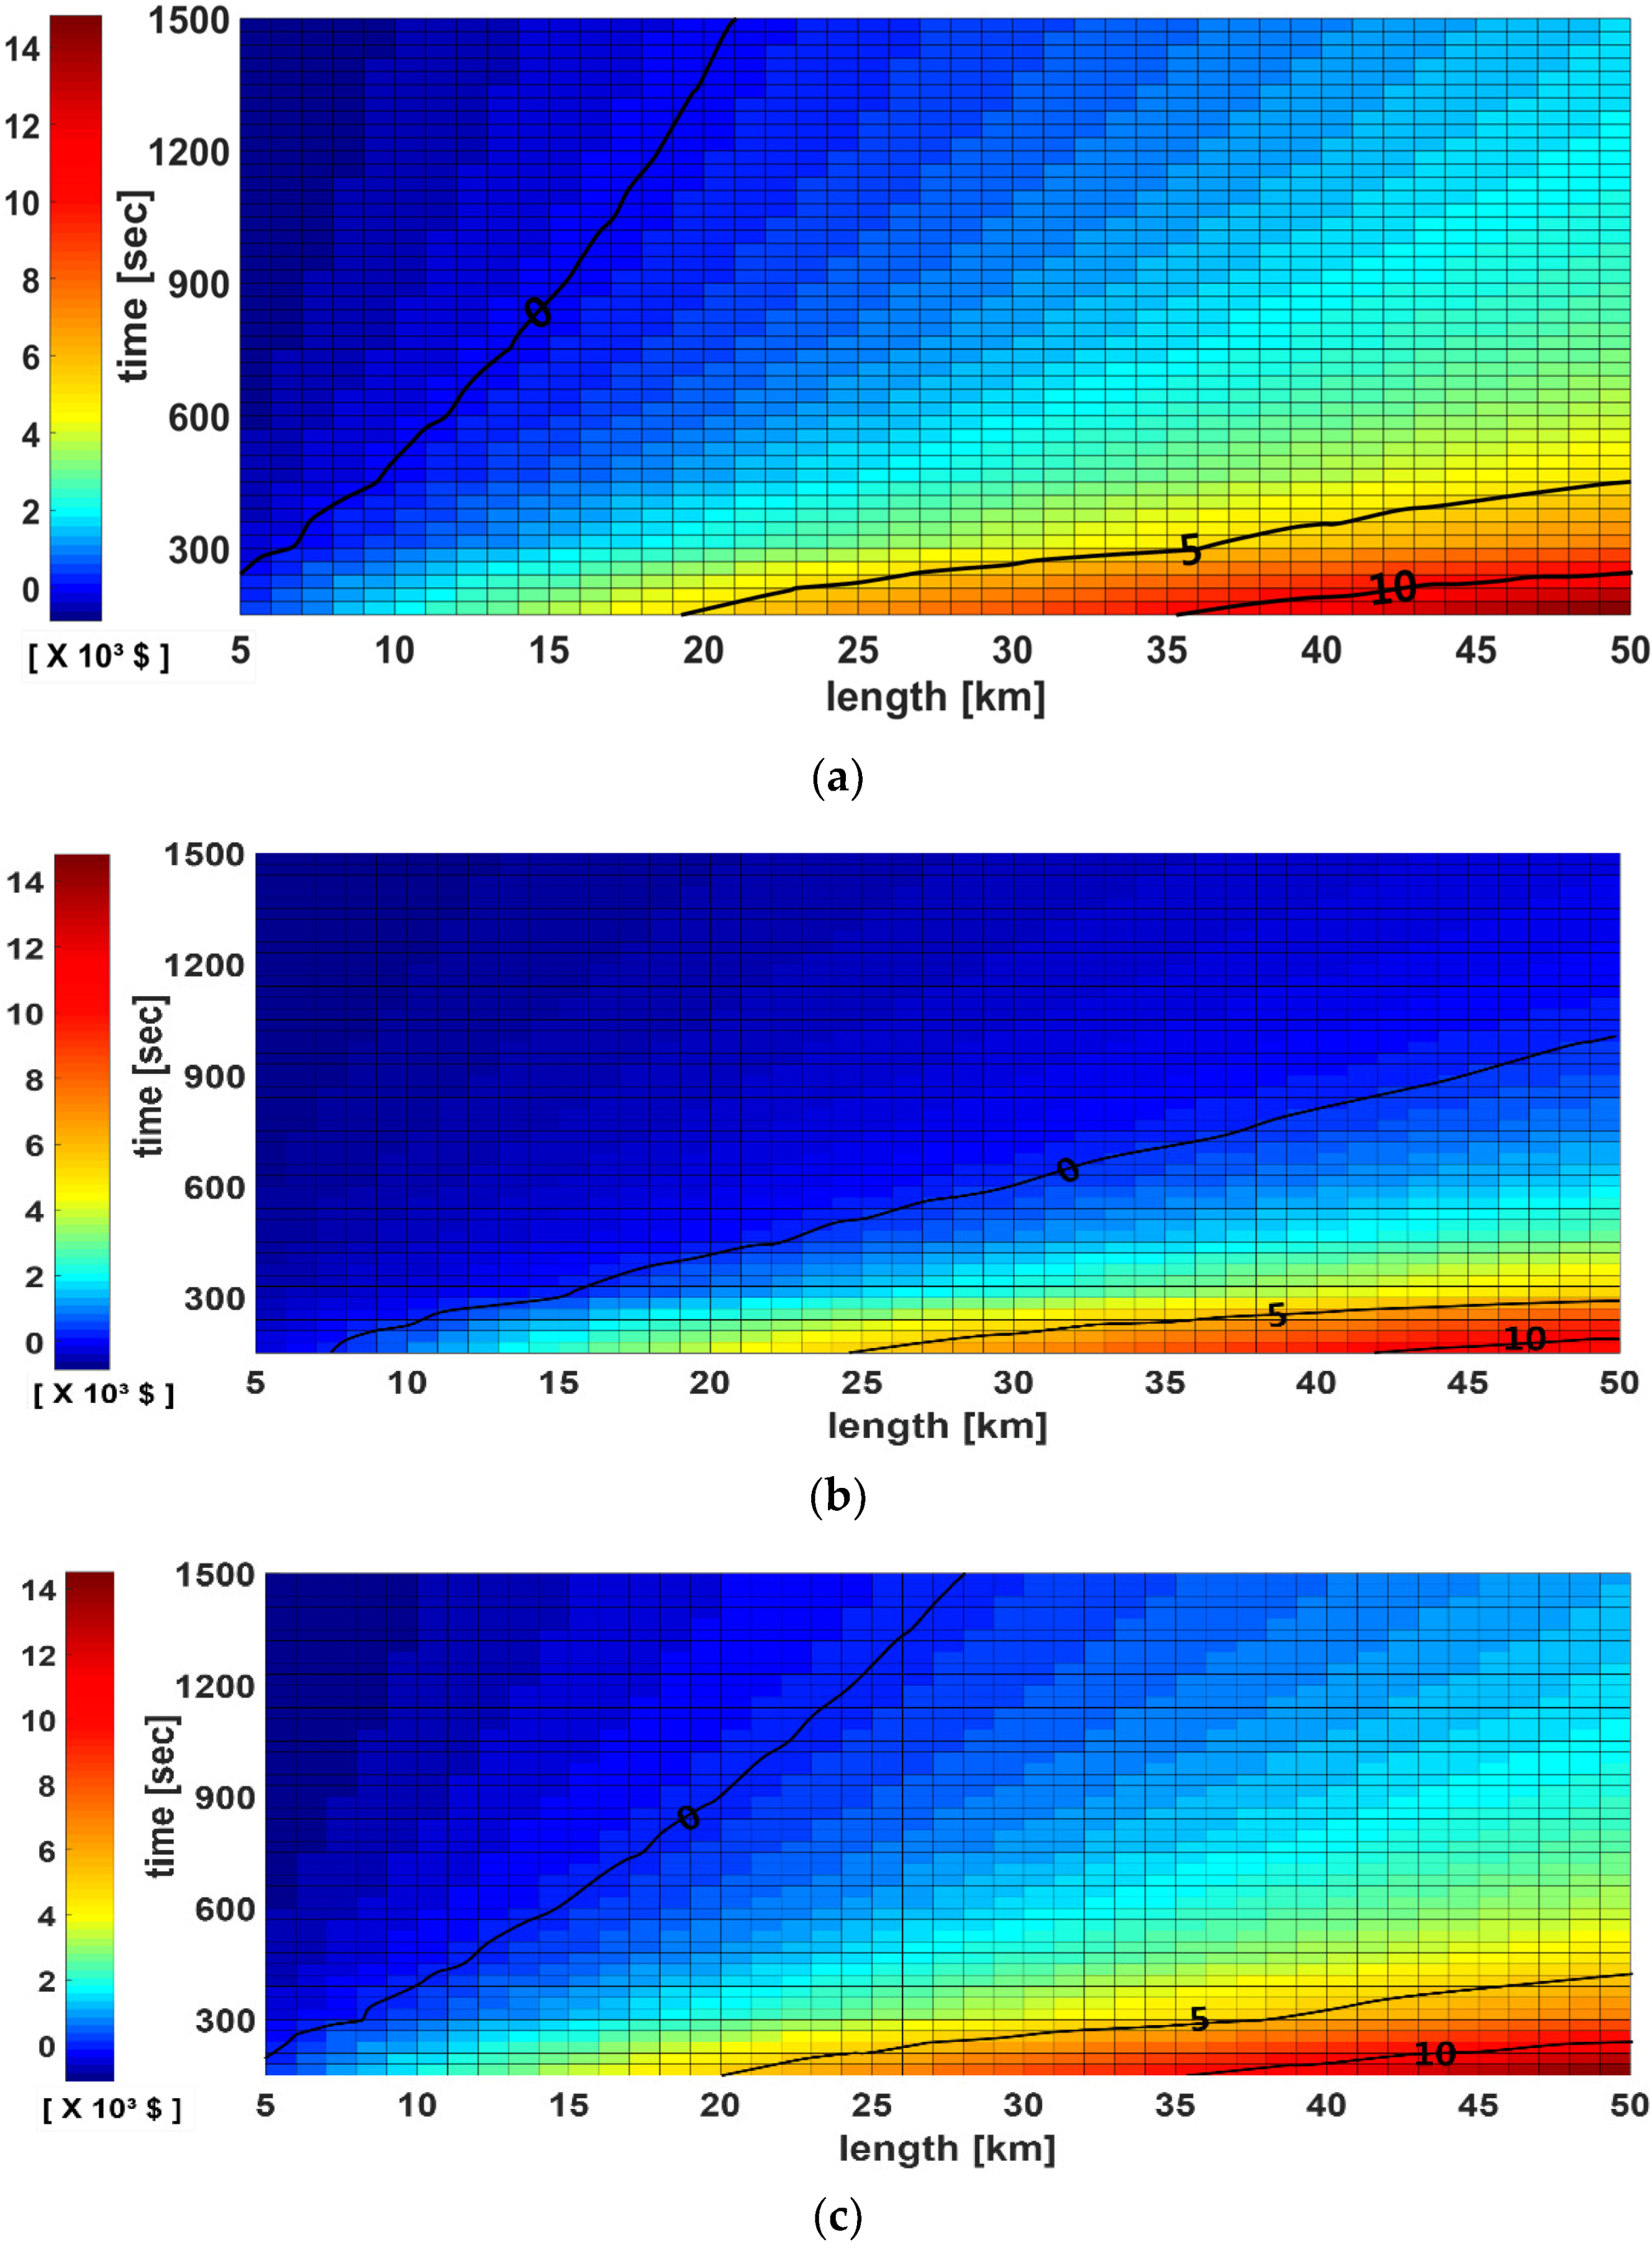
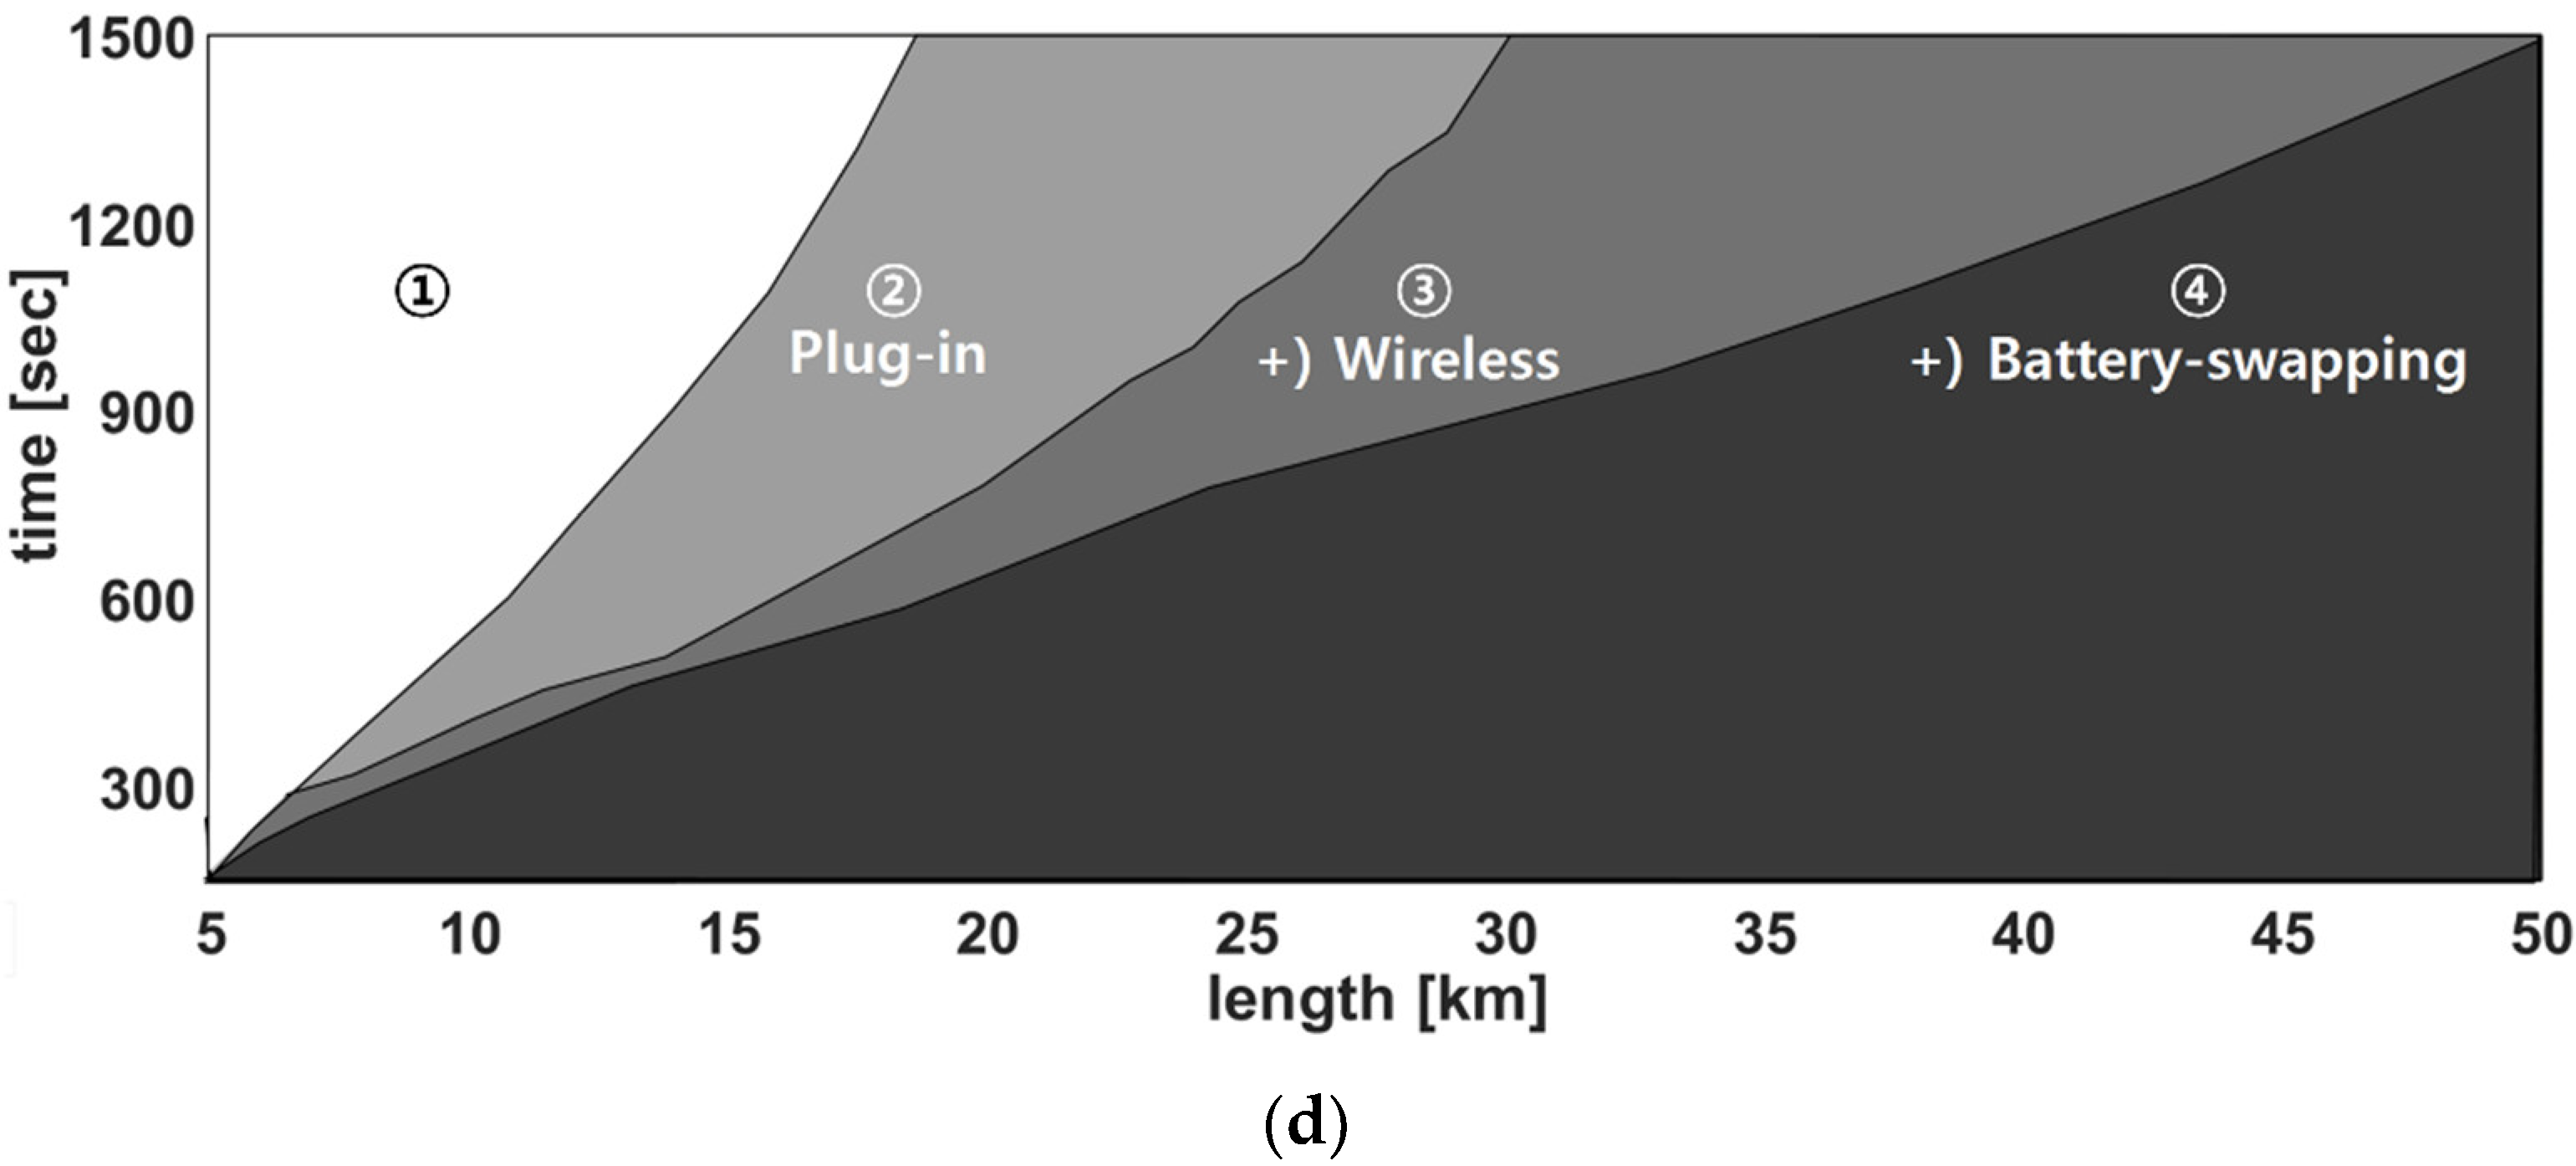
We determined the NPV according to the driving distance and headway while using the parameters in Table 4 and Table 5. The NPV results by charging type are depicted in Figure 7 considering the deployment of 100 electric buses. The color map in Figure 7a–c shows the intensity of NPV benefit. As shown in Figure 7d, each charging type retrieves different benefit. Area 1 represents no economic benefit of any charging type, as the distance is very short. Areas 2 to 4 indicate plug-in charging, wireless charging, and battery swapping as the most beneficial charging type, respectively. The data in Table 4 lay within area 4, and the economic benefit differs slightly depending on the interval and length of the route. Therefore, the proper charging type differs, even for the same electric bus operating environment depending on various characteristics, such as the usage and operating distance.
We conducted economic efficiency analyses for single and composite routes and different charging types of electric buses. For the single routes, plug-in charging with its relatively lower infrastructure construction costs provides the highest economic efficiency. However, for route Express 5, which has a high operating ratio, battery swapping vehicles yield similar B/C ratios to plug-in charging. For composite routes, battery swapping provides the highest economic efficiency over the analyzed period of 20 years, because infrastructure construction costs can be greatly reduced according to the operating ratio of each route by installing battery swapping facilities at the intersection of multiple routes. Overall, we found that the most suitable charging type depends on the operating environment of the route, confirming that it is necessary to consider the electric bus routes and characteristics when designing electric bus charging infrastructure.
6. Discussion
For the large-scale adoption of electric vehicles in the public sector, it is necessary to select proper charging types and locations and develop charging infrastructure according to the operating environment. In fact, each charging type presents different advantages and drawbacks for electric buses, and parameters, such as performance, battery capacity, and operating environment are closely related and must be considered for proper infrastructure design. Moreover, the operating environment must be analyzed to determine the proper charging type and enable the widespread introduction of electric buses. In this study, we thoroughly analyzed charging types of electric buses and obtained charging infrastructure plans according to the operating environment and related parameters of public service electric vehicles.
Our economic efficiency analyses considered a project period of 20 years and both single and composite routes. For single routes, economic efficiency increased the most for plug-in charging, followed by battery swapping and wireless charging while considering the operating environment of each route. Battery swapping was more economically efficient than plug-in charging for routes with higher operating ratios. On the other hand, for composite routes, the infrastructure construction costs could be distributed according to the operating ratio of each route by installing battery-swapping facilities at the route intersections. Consequently, battery swapping yielded the highest economic efficiency for the composite routes. Overall, we found that the proper charging type can differ even for the same electric bus operating environment, depending on a variety of characteristics, such as charging time, operating distance, and initial infrastructure investment.
The obtained selection of charging types for different operating environments of electric buses will contribute to the adoption of this eco-friendly technology and provide the most economically feasible charging method according to each route. The long-term implications of efforts, such as this study, will lead to the replacement of internal combustion engine buses with electric buses to reduce greenhouse gas emissions and achieve environmental goals.
In future research, we will conduct additional analyses of infrastructure plans according to the operating environments of public service electric vehicles. In addition, we will investigate the use of electric vehicle batteries for energy storage based on vehicle-to-grid systems. Furthermore, we will analyze the influence of different power systems and stabilization strategies to facilitate the stable operation and proliferation of general-purpose electric vehicles.
Author Contributions
S.-Y.K. reviewed the theory and developed the analytical framework. J.-S.B. had the original idea for this study. D.-B.B. drew the analysis figure and completed the literature. All authors contributed to data collection and methodology.
Funding
This research was funded by Korea Electric Power Corporation (Grant number: R17XA05-47).
Conflicts of Interest
The authors declare no conflict of interest.
Notation
| Annual electric bus energy-saving benefit compared to compressed natural gas (CNG) bus [$] | |
| Annual CNG bus energy-saving benefit [$] | |
| Annual electric bus energy-saving benefit [$] | |
| Annual maintenance cost saving benefit [$] | |
| Annual electric bus fare benefit [$] | |
| Annual electric bus total benefit [$] | |
| Battery cost [$] | |
| Battery wear cost [$] | |
| Battery replacement cost [$] | |
| Annual CNG cost [$/m3] | |
| Annual electricity cost [$/kWh] | |
| Electric bus initial infrastructure construction cost [$] | |
| Annual electric bus infrastructure maintenance cost [$] | |
| Electric bus fare [$] | |
| Electric bus subsidy [$] | |
| Annual electric bus total cost [$] | |
| Electric bus actual purchase cost [$] | |
| Electric bus initial purchase cost [$] | |
| Depth of discharge | |
| Electric bus battery capacity [kWh] | |
| Electric bus battery discharge amount [kWh] | |
| Electric bus battery capacity (before considering state of charge—SOC) [kWh] | |
| Number of electric buses | |
| Electric motor energy consumption [kW] | |
| Electric bus charging power [kW] | |
| Discount rate | |
| Maximum battery SOC | |
| Minimum battery SOC | |
| Battery SOC at time t | |
| Electric bus charging time [s] | |
| Electric bus headway [s] | |
| Electric bus average velocity [km/h] | |
| Bus travel distance [km] | |
| Bus travel distance per day [km] | |
| Analysis period [yr] | |
| CNG bus fuel efficiency [km/m3] | |
| Electric bus fuel efficiency [km/kWh] | |
| Annual number of bus passengers | |
| Charge efficiency | |
| Discharge efficiency |
References
- Marshall, B.M.; Kelly, J.C.; Lee, T.K.; Keoleian, G.A.; Filipi, Z. Environmental assessment of plug-in hybrid electric vehicles using naturalistic drive cycles and vehicle travel patterns: A Michigan case study. Energy Policy 2013, 58, 356–370. [Google Scholar] [CrossRef]
- Jayakumar, A.; Chalmers, A.; Lie, T.T. Review of prospects for adoption of fuel cell electric vehicles in New Zealand. IET Electr. Syst. Transp. 2017, 7, 259–266. [Google Scholar] [CrossRef]
- Kim, J.G.; Lee, J.Y.; Ko, S.Y. Optimization of electric transit bus recharging stations in Jeju. J. Korean Urban Geog. Soc. 2015, 18, 97–109. [Google Scholar]
- Erdogan, N.; Erden, F.; Kisacikoglu, M. A fast and efficient coordinated vehicle-to-grid discharging control scheme for peak shaving in power distribution system. J. Mod. Power Syst. Clean Energy 2018, 6, 555–566. [Google Scholar] [CrossRef] [Green Version]
- Un-Noor, F.; Padmanaban, S.; Mihet-Popa, L.; Mollah, M.N.; Hossain, E. A comprehensive study of key electric vehicle (EV) components, technologies, challenges, impacts, and future direction of development. Energies 2017, 10, 1217. [Google Scholar] [CrossRef]
- Wang, G.; Xu, Z.; Wen, F.; Wong, K.P. Traffic-constrained multiobjective planning of electric-vehicle charging stations. IEEE Trans. Power Del. 2013, 28, 2363–2372. [Google Scholar] [CrossRef]
- Hajimiragha, A.; Canizares, C.A.; Fowler, M.W.; Elkamel, A. Optimal transition to plug-in hybrid electric vehicles in Ontario, Canada, considering the electricity-grid limitations. IEEE Trans. Ind. Electron. 2010, 57, 690–701. [Google Scholar] [CrossRef]
- Lam, A.Y.; Leung, Y.W.; Chu, X. Electric vehicle charging station placement: Formulation, complexity, and solutions. IEEE Trans. Smart Grid 2014, 5, 2846–2856. [Google Scholar] [CrossRef]
- Liu, Z.; Wen, F.; Ledwich, G. Optimal planning of electric-vehicle charging stations in distribution systems. IEEE Trans. Power Deliv. 2013, 28, 102–110. [Google Scholar] [CrossRef]
- Sadeghi-Barzani, P.; Rajabi-Ghahnavieh, A.; Kazemi-Karegar, H. Optimal fast charging station placing and sizing. Appl. Energy 2014, 125, 289–299. [Google Scholar] [CrossRef]
- Dong, J.; Liu, C.; Lin, Z. Charging infrastructure planning for promoting battery electric vehicles: An activity-based approach using multiday travel data. Transp. Res. Part C Emerg. Technol. 2014, 38, 44–55. [Google Scholar] [CrossRef]
- Kontou, E.; Yin, Y.; Lin, Z.; He, F. Socially optimal replacement of conventional with electric vehicles for the US household fleet. Int. J. Sustain. Transp. 2017, 11, 749–763. [Google Scholar] [CrossRef]
- Liu, Z.; Song, Z. Robust planning of dynamic wireless charging infrastructure for battery electric buses. Transp. Res. Part C Emerg. Technol. 2017, 83, 77–103. [Google Scholar] [CrossRef]
- Chen, Z.; Yin, Y.; Song, Z. A cost-competitiveness analysis of charging infrastructure for electric bus operations. Transp. Res. Part C Emerg. Technol. 2018, 93, 351–366. [Google Scholar] [CrossRef]
- Amini, M.H.; Moghaddam, M.P.; Karabasoglu, O. Simultaneous allocation of electric vehicles’ parking lots and distributed renewable resources in smart power distribution networks. Sustain. Cities Soc. 2017, 28, 332–342. [Google Scholar] [CrossRef]
- Ministry of Trade, Industry and Energy. A Study on the Strategies to Activate the Electric Vehicle in Public Transport; Ministry of Trade, Industry and Energy: Seoul, Korea, 2016.
- Lam, A.Y.S.; Leung, Y.W.; Chu, X. Electric vehicle charging station placement. In Proceedings of the IEEE International Conference on Smart Grid Communications, Vancouver, BC, Canada, 21–24 October 2013; pp. 510–515. [Google Scholar]
- Su, C.L.; Leou, R.C.; Yang, J.C.; Lu, C.N. Optimal electric vehicle charging stations placement in distribution systems. In Proceedings of the 39th Annual Conference of the IEEE Industrial Electronics Society, Vienna, Austria, 10–13 November 2013; pp. 2121–2126. [Google Scholar]
- Baouche, F.; Billot, R.; Trigui, R.; El Faouzi, N.E. Efficient allocation of electric vehicles charging stations: Optimization model and application to a dense urban network. IEEE Intell. Transp. Syst. Mag. 2014, 6, 33–43. [Google Scholar] [CrossRef]
- Mehar, S.; Senouci, S.M. An optimization location scheme for electric charging stations. In Proceedings of the 2013 International Conference on Smart Communications in Network Technologies, Paris, France, 17–19 June 2013; pp. 17–19. [Google Scholar] [CrossRef]
- Pazouki, S.; Mohsenzadeh, A.; Haghifam, M.R.; Ardalan, S. Simultaneous allocation of charging stations and capacitors in distribution networks improving voltage and power loss. Can. J. Electr. Comput. Eng. 2015, 38, 100–105. [Google Scholar] [CrossRef]
- Iversen, E.B.; Morales, J.M.; Madsen, H. Optimal charging of an electric vehicle using a Markov decision process. Appl. Energy 2014, 123, 1–12. [Google Scholar] [CrossRef] [Green Version]
- Jaramillo, J.H.; Bhadury, J.; Batta, R. On the use of genetic algorithms to solve location problems. Comput. Oper. Res. 2002, 29, 761–779. [Google Scholar] [CrossRef]
- Chan, J.A. Feasibility Study on Introducing Electric Bus: Focused on Electric Bus in Seoul; University of Seoul Graduate School: Seoul, Korea, 2013. [Google Scholar]
- KAIST Wireless Power Transfer Group. Available online: http://www.smfir.co.kr/ (accessed on 10 September 2018).
- Ministry of Land, Infrastructure and Transport. Automatic Electric Bus Battery Swapping. Available online: http://www.molit.go.kr/USR/WPGE0201/m_35882/DTL.jsp (accessed on 10 September 2018).
- Won, I.K.; Kim, D.Y.; Ko, A.Y.; Shin, C.H.; Hwang, J.H.; Kim, Y.R.; Won, C.Y. The prediction of total revenue of V2G system considering battery wear cost. J. Korean Inst. Illum. Electr. Install. Eng. 2015, 29, 85–94. [Google Scholar]
- Han, S.; Han, S.; Aki, H. A practical battery wear model for electric vehicle charging applications. Appl. Energy 2014, 113, 1100–1108. [Google Scholar] [CrossRef]
- Han, S.; Han, S.H. Economic feasibility of V2G frequency regulation in consideration of battery wear. Energies 2013, 6, 748–765. [Google Scholar] [CrossRef]
- Ehsani, M. Modern Electric, Hybrid Electric, and Fuel Cell Vehicles Fundamentals, Theory, and Design; CRC Press: Boca Raton, FL, USA, 2005. [Google Scholar]
- Nam, J.H.; Choi, J.H.; Baek, J.Y.; Jang, D.K.; Hwang, H.S. The simulation of hybrid electric vehicle—ADVISOR (Advanced Vehicle Simulator). In Proceedings of the 21st Annual IEEE Applied Power Electronics Conference and Exposition, Dallas, TX, USA, 19–23 March 2006; pp. 225–227. [Google Scholar]
- Bak, J.S.; Kim, S.Y.; Kim, D.M. A study on the economic analysis of introducing battery-based eco bus: Case study of Daegu City, South Korea. Trans. Korean Inst. Electr. Eng. 2018, 67, 343–351. [Google Scholar]
Figure 1.
Lithium-ion battery depth of discharge (DOD)–cycle life relation.

Figure 2.
Battery degradation cost according to DOD.

Figure 3.
Orange County bus cycle (OCC) test cycle of Bus. (a) Velocity; (b) Motor torque; and, (c) state of charge (SOC).
Figure 3.
Orange County bus cycle (OCC) test cycle of Bus. (a) Velocity; (b) Motor torque; and, (c) state of charge (SOC).

Figure 4.
Scenario for this study showing a map of routes 518, 708, and Express 5 in Daegu City, South Korea.
Figure 4.
Scenario for this study showing a map of routes 518, 708, and Express 5 in Daegu City, South Korea.

Figure 5.
Benefit–cost ratio (B/C) ratio analysis for routes (a) 518, (b) 708, and (c) Express 5.


Figure 6.
B/C ratio analysis in composite route.

Figure 7.
Net present value (NPV) analysis according to operating distance and headway. (a) Plug-in charging; (b) Battery swapping; (c) Wireless charging; and, (d) Charging type depending on operating environment.
Figure 7.
Net present value (NPV) analysis according to operating distance and headway. (a) Plug-in charging; (b) Battery swapping; (c) Wireless charging; and, (d) Charging type depending on operating environment.


Table 1.
Electric bus characteristics and specifications by charging type [26].
Table 1.
Electric bus characteristics and specifications by charging type [26].
| Characteristic | Plug-in Charging | Battery Swapping | Wireless Charging |
|---|---|---|---|
| Charging power | 200 kW | 200 kW | 200 kW |
| Charging time | 20–30 min | 40 s (battery replacement) | 30–40 min |
| Charging efficiency | 0.95 | 0.95 | 0.75 |
| Installation location | Route end points | Route intersections | 5–15% of the operating route |
| Illustration |  |  |  |
Table 2.
Vehicle parameters to calculate consumption of electric motor.
| Symbol | Property | Unit | Value |
|---|---|---|---|
| Motor drive efficiency | - | 0.91 | |
| Vehicle mass | kg | 16,236 | |
| Gravity | m/s2 | 9.81 | |
| Rolling resistance coefficient | - | 0.01 | |
| Air density | kg/m3 | 1.23 | |
| Aerodynamic drag coefficient | - | 0.7 | |
| Frontal area | m2 | 7.8965 | |
| Mass factor | - | 0.04 |
Table 3.
ADVISOR simulation results for battery characteristics.
| AER [km] | Battery Capacity [kWh] | Fuel Efficiency [km/kWh] | Operating Time [s] |
|---|---|---|---|
| 80 | 108 | 0.74 | 13,744 |
Table 4.
Daily operating environment of existing compressed natural gas (CNG) buses by analyzed route.
Table 4.
Daily operating environment of existing compressed natural gas (CNG) buses by analyzed route.
| Route | No. of Buses | Operating Distance [km] | Operating Time [min] |
|---|---|---|---|
| 518 | 22 | 39.87 | 128 |
| 708 | 13 | 41.98 | 124 |
| Express 5 | 28 | 40.81 | 114 |
Table 5.
Usage rate and fuel efficiency of electric bus according to time.
| Time | Usage Rate | Fuel Efficiency [km/kWh] | Time | Usage Rate | Fuel Efficiency [km/kWh] |
|---|---|---|---|---|---|
| 05:00 | 0.009 | 0.8822 | 14:00 | 0.053 | 0.5556 |
| 06:00 | 0.028 | 0.7722 | 15:00 | 0.062 | 0.4949 |
| 07:00 | 0.065 | 0.4735 | 16:00 | 0.072 | 0.4399 |
| 08:00 | 0.079 | 0.4071 | 17:00 | 0.077 | 0.4141 |
| 09:00 | 0.060 | 0.5065 | 18:00 | 0.090 | 0.3692 |
| 10:00 | 0.050 | 0.5821 | 19:00 | 0.060 | 0.5025 |
| 11:00 | 0.050 | 0.5878 | 20:00 | 0.045 | 0.6385 |
| 12:00 | 0.055 | 0.5458 | 21:00 | 0.047 | 0.6183 |
| 13:00 | 0.056 | 0.5364 | 22:00 | 0.038 | 0.7379 |
Table 6.
Costs per electric bus by charging type.
| CNG | Plug-in | Battery Swapping | Wireless | ||
|---|---|---|---|---|---|
| Vehicle cost [$ × 103] | Vehicle cost | 220 | 450 | 450 | 480 |
| Vehicle subsidy | 120 | 200 | 200 | 200 | |
| Actual vehicle purchase cost | 100 | 250 | 250 | 280 | |
| Infrastructure construction cost [$ × 106] | 7 | 1.10 | 32 | 4 | |
| Operating costs [$/km] | Fuel cost | 0.46 | 0.13 | 0.13 | 0.13 |
| Engine oil cost | 0.01 | - | - | - | |
| Tire wear cost | 0.01 | 0.01 | 0.01 | 0.01 | |
| Maintenance cost | 0.02 | 0.01 | 0.01 | 0.01 | |
Table 7.
Daily operating environment by existing CNG buses for routes intersecting at stop A in Figure 4.
Table 7.
Daily operating environment by existing CNG buses for routes intersecting at stop A in Figure 4.
| Route | No. of Buses | Operating Distance [km] | Operating Time [min] | Operating Ratio |
|---|---|---|---|---|
| 156 | 19 | 25.58 | 96 | 0.1188 |
| 518 | 22 | 39.87 | 128 | 0.1375 |
| 651 | 19 | 32.73 | 114 | 0.1188 |
| 708 | 13 | 41.98 | 124 | 0.0813 |
| 808 | 12 | 35.73 | 106 | 0.0750 |
| 814 | 29 | 34.10 | 103 | 0.1813 |
| 849 | 5 | 13.12 | 85 | 0.0313 |
| Express 5 | 28 | 40.81 | 114 | 0.1750 |
| Buk-gu 3 | 13 | 24.13 | 90 | 0.0813 |
Table 8.
B/C ratio by composite route.
| Route | CNG | Plug-In | Wireless | Battery Swapping |
|---|---|---|---|---|
| 156 | 1.7280 | 1.9868 | 1.9336 | 2.0914 |
| 518 | 1.6606 | 1.9308 | 1.8841 | 2.0995 |
| 651 | 1.6859 | 2.0683 | 2.0122 | 2.0730 |
| 708 | 1.4487 | 1.8204 | 1.7623 | 1.8382 |
| 808 | 1.5816 | 1.9701 | 1.9043 | 1.9934 |
| 814 | 1.6212 | 1.9612 | 1.9184 | 2.0852 |
| 849 | 1.7540 | 1.8523 | 1.7432 | 1.9428 |
| Express 5 | 1.5644 | 1.9222 | 1.8802 | 2.0491 |
| Buk-gu 3 | 1.7300 | 2.0624 | 1.9946 | 2.0832 |
© 2018 by the authors. Licensee MDPI, Basel, Switzerland. This article is an open access article distributed under the terms and conditions of the Creative Commons Attribution (CC BY) license (http://creativecommons.org/licenses/by/4.0/).
Share and Cite
MDPI and ACS Style
Bak, D.-B.; Bak, J.-S.; Kim, S.-Y. Strategies for Implementing Public Service Electric Bus Lines by Charging Type in Daegu Metropolitan City, South Korea. Sustainability 2018, 10, 3386. https://doi.org/10.3390/su10103386
AMA Style
Bak D-B, Bak J-S, Kim S-Y. Strategies for Implementing Public Service Electric Bus Lines by Charging Type in Daegu Metropolitan City, South Korea. Sustainability. 2018; 10(10):3386. https://doi.org/10.3390/su10103386
Chicago/Turabian StyleBak, Dan-Bi, Jae-Seok Bak, and Sung-Yul Kim. 2018. "Strategies for Implementing Public Service Electric Bus Lines by Charging Type in Daegu Metropolitan City, South Korea" Sustainability 10, no. 10: 3386. https://doi.org/10.3390/su10103386
Note that from the first issue of 2016, this journal uses article numbers instead of page numbers. See further details here.