Innovative Energy Islands: Life-Cycle Cost-Benefit Analysis for Battery Energy Storage

1
Norwich Business School, University of East Anglia, Norwich NR4 7TJ, UK
2
Tyndall Centre for Climate Change Research, University of East Anglia, Norwich NR4 7TJ, UK
*
Author to whom correspondence should be addressed.
Sustainability 2018, 10(10), 3371; https://doi.org/10.3390/su10103371
Submission received: 30 July 2018
/
Revised: 11 September 2018
/
Accepted: 17 September 2018
/
Published: 20 September 2018
(This article belongs to the Special Issue Sustainability Indicators for Renewable Energy Transition)
Abstract
:Cities are concentrations of economic, social, and technical assets, which are fundamental to addressing climate change challenges. Renewable energy sources are growing fast in cities to mitigate greenhouse gas emissions in response to these challenges. In this transition urban decentralized energy shares technical and economic characteristics with energy islands. This is reflected in that island energy systems essentially operate off-grid which as a modus operandi can offer lessons to small-scale urban systems. With the expansion of urban areas, communities, especially small-scale ones, are sometimes further away from the main power infrastructure. Providing power supply to these communities would require significant investment to the existing power system, either to improve its grid infrastructure or power supply facilities. The energy islands have for some time now lent themselves to energy innovation including smart grid and battery storage applications. In this research we conceptualize that urban energy communities can be benefitted by knowledge transfer from energy islands in several fronts. We specifically put forward a life-cycle cost-benefit analysis model to evaluate the economics of battery storage system used in small communities from a life-cycle perspective. In this research we put forward a novel cost-benefit analysis model. Our results show that the inclusion of externalities can improve the economic value of battery systems significantly. Nevertheless, the economic performance is still largely dependent on several parameters, including capacity cost, discharging price, and charging cost. We conclude that existing electricity price structures (e.g., using household electricity price as a benchmark) struggle to guarantee sufficient economic returns except in very favorable circumstances; therefore, governmental support is deemed necessary.
1. Introduction
Cities account for 65% of global energy use and 70% of man-made greenhouse gas emissions [1]. All cities, large and small, require electricity in a consistent manner for lighting, commercial activities, industrial operations, and water supply. Traditionally, electricity supply relies on large-scale fossil fuel units are used to generate electricity in either centrally controlled or liberal systems [2,3]. The reliance on fossil fuels has contributed to significant environmental impacts without guaranteeing energy supply security [4,5]. Therefore, sustainable energy sources are needed to better preserve the environment and satisfy electricity demand. At the same time, cities are concentrations of economic, social, and technical assets, which are fundamental to addressing climate change challenges. Regardless of the national commitments on climate change mitigation, thousands of cities in the US, EU and other regions have vowed to reduce their greenhouse gas emissions. By the end of 2017, over 100 cities have had over 70% of their total electricity supply from renewable energy sources [6]. Not least focus on cities enables a renewed focus on citizens as key actors of a new energy supply and consumption paradigm [7,8].
IRENA [1] highlight three main areas that renewable energy can contribute to the energy provision in cities, including the use of renewable energy in buildings, the use of renewable energy in transportation and the creation of integrated urban energy systems. Indeed, electricity generation has become and will become more decentralized due to the growth of renewable energy generation. Contrary to centralized power generating, the output of renewable decentralized sources is time-variable. Therefore, more flexible units are needed to offset the impacts of such variations on power supply. All power systems have certain levels of flexibility that allow them to remain balanced all the time. Traditionally, flexibility is provided from the supply side with fast-responding units, such as gas and hydro, quickly adjusting their outputs to balance demand with supply. In recent years, the development of battery storage technologies has allowed the participation of battery system in the flexibility market [9]. Battery storage is a viable means to enable the transition towards renewable energy since the combination can provide consistent and reliable power supply.
Battery storage can provide several grid services at different scales. For example, in response to the gas leak at California’s Aliso Canyon gas storage facilities, utilities replaced gas peaker plants with grid-scale batteries to provide power supply during peak hours. Commercial buildings such as hotels and hospitals use battery storage to avoid high capacity cost (if they exceed certain level of usage) and maintain secure supply. At the same time, the behind-the-meter application of battery storage has become increasingly popular at residential sector. It would enable better use of self-generated renewable electricity and reduce reliance on utilities for power supply.
The main aim of this research is to evaluate the economics of battery storage system used in small communities from a life-cycle perspective. In doing so we put forward an exciting proposition; that urban renewable energy systems share intriguingly similar characteristics with island energy systems. This is reflected in that island energy systems essentially operate off-grid which as a modus operandi can offer lessons to small-scale urban systems. With the expansion of urban areas, communities, especially small-scale ones are sometimes further away from the main power infrastructure. Providing power supply to these communities would require significant investment to the existing power system, either to improve its grid infrastructure or power supply facilities. In terms of achieving broader sustainability goals they both present multi-objective problems that require fine tuning of complex parameters [10,11]. To develop our proposal further we use Tilos Island as a case study. Tilos is a small Greek island in the Aegean Sea. Total area of the island is approximately 63 km2 with over 500 local residences living on the island. The electricity needs of Tilos (approximately 3.2 GWh per year) are provided by the oil-fired power station of Kos island, through an interconnector that reaches the north side of the island. Owed to persistent faults of the undersea cable, the island often suffers from low power quality and disruption that can last even in the order of several hours. The installed capacity mix comprises of 700 kW of wind power and 500 kW of solar power. The renewable energy capacity is higher than the peak demand of 1 MW. The new power system can be used to replace the existing undersea power cable. Such micro-grid architecture is becoming increasingly popular in urban areas to provide electricity to communities. Apart from economic parameters, we also take into account life-cycle environmental indicators [12] in order to better capture the wider social-economic impacts of battery storage system to the society. The outcome of this research can be helpful for both government policy making and investment decision making.
2. Materials and Methods
2.1. Cost-Benefit Analysis
In assessing the economic values of a project, the most commonly adopted approach is cost-benefit analysis (CBA) [13]. The benefits of using a CBA are addressed in previous studies. The analytical framework and results of CBA are usually straight-forward for decision makers [14]. Therefore, national and regional authorities carry out CBA on various issues such as infrastructure projects, environmental policies, and health programs [15,16]. The outcome from these CBAs can help policy makers to balance the costs of public policies with its benefits. Companies also conduct CBA to assess and compare the costs and benefits captured in a specific project, which provide evidence for investment decision making [17].
Several studies examine the applications of battery storage system and their associated costs and benefits [18,19]. For example, Zucker et al. [20] conduct a comprehensive literature review on the value of energy storage in electricity markets. The report classifies the evaluation of the economics of battery storage into two categories. The first group is called ‘engineering studies’. These studies address the value of energy storage from the investors’ point of view. Outcomes of these studies are mainly used for investor decision making. However, only one primary service is usually considered, which underestimates the value of energy storage. The second group is called ‘system studies’. Compared to engineering studies, system studies usually address the economic benefits of adding energy storage to the entire power system. They focus on the direct and indirect impacts of energy storage on the power system through providing different services to the system. The outcomes provide information for policy makers and regulators to set rules within which the power system operates. However, given the nature of energy storage in providing multi-services to the power system, it is difficult to provide a comprehensive identification of benefits and beneficiaries of storage services. The choice of methods would depend on the targeted audience (e.g., investors, customers, policy makers).
Some studies focus on the use of battery storage in remote areas. For example, Kaldellis et al. [21] conduct a CBA of a battery storage system for remote islands in Greece. Almost all small islands have a demand profile that shows significant daily and seasonal variations. A typical daily load curve shows that demand peaks happen at around noon and late evening. For seasonal variations, summer often shows a spike, in part due to the need for electric cooling. The demand growth used to be met by local thermal power stations, which are usually expensive and less energy efficient (e.g., the use of diesel power stations is popular). Solar radiation potential, on the other hand, coincides the seasonal variations in load, which shows a significant increase in summer. Integrating with energy storage can also be used to satisfy daily load peaks in the early evening. Not only the combination solves the variations in load, it also brings benefits to the wider socio-economic system such as reduction of thermal power generation and its associated emissions [22], and energy security improvement of island grid systems [23]. The authors assess the electricity generation costs using photovoltaic system in combination with energy storage and compare the costs with the use of local thermal power stations. The optimum sizing combination of solar PV and energy storage is discussed by the authors in another study [24]. The study concludes that the combination system would yield financial gains up to €0.18/kWh or 42% lower costs than using local thermal power stations. At the same time, changes in local economy factors such as government subsidies, capital cost and solar irradiance levels can have significant impacts on the electricity generation costs of the proposed system. However, the study does not monetize the benefits from avoided emissions and improved energy independence.
Chauhan and Saini [25] conduct a feasibility study on the integrated renewable energy system (IRES) for an isolated rural area in India. As with remote islands in the EU, remote communities in India have various renewable energy sources but have difficulties in building grid infrastructure due to financial and geographical constrains. IRES becomes a feasible solution to electrify remote communities which usually have available several renewable energy sources (such as wind, solar, and hydro) and can combine them with energy storage systems (battery or pumped hydro).
Highlighting the role of remote communities as potential test-beds for new energy technologies, Hills et al. [26] focus on the energy supply of Fiji. The study brings together in the smart energy domain, the issue of developing rural communities and that of remote islands in their most extreme. Fiji Islands are remotely located in the vast Pacific Ocean and at the same time they are part of the UN acknowledged AOSIS (Alliance of Small Island States) and SIDS (Small Island Developing States) island communities with special interests both in secure energy supply and sea level rise caused by climate change. Taking the concept of energy supply for isolated communities into a different direction Malekpoor et al. [27] studied the needs of refugee camps that host people who have escaped from natural disasters and war conflict. A common thread emerges across studies looking energy for isolated communities that energy storage and renewables can provide the desired outcomes.
Given the multiple services that battery storage can provide, some studies examine its economic value at different scales. For example, de Sisternes et al. [28] assess the value of battery storage in decarbonizing the electricity sector. To achieve the emission target between 50 and 200 metric tons of CO2 per gigawatt-hour (tCO2/GWh), different combinations of power generation mix are tested (including solar, wind, nuclear and storage). The study points out that storage systems can be vital to reduce the carbon footprint of power generation, if flexible nuclear systems are precluded. This is due to the very high share of wind and solar energy in the combination, which requires significant flexible generation units. However, the cost of battery storage (Li-ion battery in this case) did not guarantee a net economic benefit. Leou [29] builds a mathematic model to determine the size of a battery storage and examines the economics of the system at distribution level in a deregulated market. In terms of cost, the author considers capital and operation and maintenance (O&M) costs. Revenues are procured from energy price arbitrage, avoided transmission access costs, and deferred equipment cost (for providing peak load). For energy efficiency, the study considers several types of losses, including transformer losses, power conversion system losses, battery DC losses, and pumping losses. Therefore, the energy efficiency is about 75% for the battery storage system.
In most cases above, batteries are used in a liberalized energy system. In another study, Lin and Wu [30] investigate the benefits of adopting large-scale battery energy storage system at distribution network in China where the electricity market is not liberalized. Market-oriented measures such as energy arbitrage is not available since electricity price is tightly regulated by the government. The authors point out that retail prices at peak hours are significantly higher than off-peak prices in importing regions. By considering these special characteristics, the authors develop an optimization model to calculate the benefits that battery storage can receive through participating in energy arbitrage. It considers the optimal size of the system and its operating mode under different load conditions. The study concludes that revenues (benefits) are dependent on battery characteristics (such as cost and lifespan) as well as those of the power system (such as the power prices at peak and off-peak period).
2.1.1. Cost Estimation
For a battery storage system, there are two main cost categories namely the initial costs and O&M costs. Initial costs include the costs of purchasing battery cells and packs, hardware costs (such as inverters), soft costs (such as industry education, licensing fees and labor costs and the engineering, procurement, and construction (EPC) costs). These expenditures usually happen at the beginning of the project. O&M costs usually happen during the whole life cycle of the project. It includes upkeep costs (inspection and maintenance, spare parts, facilities costs, insurance) and electricity purchasing (costs to charge the battery).
According to [31], initial costs ) can be expressed as a function of two coefficients, which are listed in the following equation:
where
- is the initial cost of battery storage (€);
- is the energy cost of battery storage (€/kWh);
- is the energy capacity of battery storage (kWh);
- is the power cost of battery storage (€/kW);
- is the nominal output power of battery storage (kW).
In this analysis, we focus on the energy cost of the battery storage system. This is due to the costs associated with the inverters and other equipment are already covered in the initial expenditure in the Tilos project. Therefore, we only consider the energy cost of battery storage.
As mentioned in the previous subsection, there are many factors that can affect the energy and power output of the battery system. For example, roundtrip efficiency indicates the energy losses between charge and discharge (due to heat or other inefficiency). Depth of discharge (DoD) describes the degree to which a battery discharges relative to its total capacity. Some batteries (such as lead-acid batteries) are not capable to fully discharge which can lead to significant degradation to its electrolyte. Thus, a battery system usually indicates its maximum DoD level to maintain a reasonable lifespan. These factors can affect the costs of the battery storage system. In the cost-benefit model introduced by [31], the authors explicitly address the impact of these factors to the initial costs of the energy storage system.
Given that:
- is the battery storage system energy capacity (kWh);
- is the operating time of the battery storage (hours);
- is the total energy supply from battery storage (kWh);
- is the roundtrip efficiency of the battery storage (%);
- is the maximum level of depth of discharge (%).
In fact, the equation above is used to determine the energy capacity of the battery system. For example, if the power system requires certain levels of energy provision by the battery, this equation can be useful to determine the level of its energy capacity. However, is pre-defined in our analysis. Therefore, is a multiplication of the (the energy cost of the battery storage system, in €/kWh) with (the energy capacity of the battery storage system, in kWh). Nevertheless, these technical factors are considered in assessing the benefits of the storage system, which are introduced in the following subsection.
Charging cost is the most significant O&M cost. Batteries need to be charged before they can release energy back to the grid. Therefore, energy input is necessary from other sources which can be either the grid supply or purpose build battery charging resources. Charging cost relates to the cost of purchasing electricity and is estimated as the product of the amount of energy input (in kWh) and the price the unit of energy input (in €/kWh).
where
- is the input energy cost (€);
- is the amount of energy input (kWh);
- is the unit cost of energy input (€/kWh).
Other O&M costs are usually a very small share of the total investment. This cost is incurred to maintain the functioning of the storage system. It includes labor costs, material cost, insurance cost, and others.
Apart from the costs above, we also consider the financing costs of the battery system. Financing costs relate to the cost, interest and other charges involved in the borrowing of money to purchase assets (cost of capital). It depends on the share of initial payment to the total capital investment, payback period, ownership and so on. Therefore, interests related to the loan can be significantly different. We assume payment for a loan that has constant yearly payments and a constant interest rate, therefore yearly payment (P) is calculated as follows:
where
- is the starting value of the loan;
- is the annual interest rate;
- is the total number of interest periods.
2.1.2. Benefit Estimation
Benefits are usually classified into two main categories: market-based and non-market-based. Market-based benefits dependent on the services that the battery system provides. For example, if it provides services on renewable energy time-shift, information on pricing structure of electricity supply such as peak and off-peak prices are needed. For providing ancillary services, information on the type of services it provides, time period, capacity and energy commitment of the battery system is needed.
On Tilos Island, the battery system mainly provides services of renewable energy time-shift. As mentioned in the previous section, technical features of the battery system such as roundtrip efficiency and DoD can have impacts on the energy capacity of the battery system. Given that the energy capacity of storage is pre-defined, we consider these features in benefit estimation. Namely, the battery system would deliver a lower level of energy capacity due to roundtrip efficiency and maximum level of DoD. Therefore, it has an impact on its revenue stream:
where:
- is the energy output income (€);
- is the amount of energy input (kWh);
- is the roundtrip efficiency of the battery storage system (%);
- is the maximum level of depth of discharge (%);
- is unit income of energy output (€/kWh).
For avoided costs (such as avoided new generation capacity and transmission and distribution network upgrade) are largely dependent on the future growth of the studied region (e.g., with increasing demand or simply replacement needs). We also calculate the emission costs with regards to existing fossil fuel-based electricity supply, if a specific emission cost exists (e.g., €/ton of CO2 emissions). This can be part of a process of internalizing environmental costs, that are gradually considered in the literature. CO2 emission cost is one of the most popular cost elements to be included with explicit unit costs shown in the emission trading market. Certainly, there are other benchmarks that can be used such as the carbon floor price in the UK, which is set by the UK Government.
2.2. Addressing the Life-Cycle Emissions from Battery Storage System
When assessing the economics of batteries, one element that is not usually addressed in the literature is the life-cycle emissions of the system. Indeed, the life-cycle environmental impacts of a battery system also depend on the system itself, including its manufacturing and end-of-life disposal, which are not negligible.
Life-cycle analysis is used to assess the environmental impacts of a product during its entire lifespan. Since the approach covers all stages of the product—from raw material extraction, goods production, transportation, consumption to disposal. Several studies have examined the life-cycle impacts of different kinds of batteries [32,33,34]. Sullivan and Gaines [35] conduct a review of the life-cycle energy and environmental impacts of batteries, including lead-acid, nickel-cadmium, nickel-metal hydride, sodium-sulfur and lithium-ion batteries. The authors point out that the life-cycle energy and environmental impacts of different batteries vary significantly due to different applications. Hiremath, Derendorf [36] compare the life-cycle impacts on energy consumption and greenhouse gas emissions of four battery technologies in six different stationary applications. The batteries include lithium-ion, lead-acid, sodium-sulfur and vanadium-redox-flow. The six different stationary applications are energy management, increase of self-consumption, area and frequency regulation, support of voltage regulation, transmission and distribution investment deferral, and utility energy time-shift.
Focusing on sodium nickel chloride battery, Longo et al. [37] examine the life-cycle energy and environmental impacts of a battery system provided by FIAMM. The technical characteristics of the sodium nickel chloride battery are listed below in Table 1.
The study covers a wide-range of environmental impacts, such as water resource depletion, acidification, freshwater eutrophication, and so on. Based on different operation modes, it examines the energy and environmental impacts at different stages of the battery life cycle including manufacturing, operation, and end-of-life steps. Result shows that the battery operation step contributes most to the total life-cycle energy impacts due to roundtrip efficiency less than 100%. In terms of the environmental impact, battery cells manufacturing of contributes most of the environmental impacts, since the battery system is charged by a solar PV. Therefore, environmental impacts during operation are a result of the solar PV manufacturing.
Table 2 shows the operation mode and its associated greenhouse gas emissions from the battery system (Due to data availability, we only focus on greenhouse gas emissions in this report.). Total emissions during the life cycle of the battery storage system are between 2000 and 2100 kg of carbon dioxide equivalent. Two scenarios are described that represent different operative conditions: Scenario 1 has a stand-by period each day, leading to fewer charging/discharging cycles and longer useful life. Scenario 2 represents a continuous operation mode, which means the battery is in operation all the time. However, during stand-by period, it consumes energy in its battery management interface and heater. Thus, the daily energy consumption in Scenario 1 is higher than that of Scenario 2.
Given that the life-cycle emissions of power generation technologies are usually shown as per unit of power output (e.g., grams per kilowatt hour or kilograms per megawatt hour), we calculate the emission levels per kWh for the battery system. Results are shown in Table 3. The technical characteristics of Tilos battery is similar to the battery used in the study. In addition, both batteries are produced by FIAMM. Therefore, we incorporate the results from [37] in our analysis.
2.3. Output Indicators
Several output indicators are used to compare cost with benefit, such as net present value, benefit-cost ratio, payback period, and others. The choice of indicators depends on the targeted audience. For example, private investors may be more interested in the net present value or payback period of the project. For customers, the cost of electricity may be of more interest (whether the use of battery storage system would help them reduce their cost). In this section, we introduce four indicators that are most relevant to this report, including net present value, benefit-cost ratio, internal rate of return, and payback period.
• Net present value (NPV)
NPV represents a summary of net benefits (differences between benefits and costs) in each specific period (monthly; quarterly; yearly). It is usually estimated as follows:
where:
- is the initial investment;
- is the net cash flow in period 1;
- is the net cash flow in period 2;
- is the net cash flow in period t;
- is the discount rate (the rate used to discount future cash flows to the present value).
Summarizing the equation above, we have:
• Benefit-cost ratio (BCR)
BCR summarizes the overall value of a project. It is calculated as the NPV of benefits divided by the NPV of total costs. If the BCR value is greater than 1, then the project can derive a positive benefit.
• Internal rate of return (IRR)
IRR is used to determine the discount rate that can result in an NPV equal to zero. It shares the calculation method of NPV. If IRR is greater than a required rate of return (RRR) (the minimum annual percentage earned by an investment), the project is likely to be deemed profitable.
• Payback period
Payback period is used to illustrate the time required for total benefits to outweigh total costs. If there is only one option, the calculated payback period can be compared with expected payback period to determine if the project is within the expectation in terms of return. With multi-choices, the shorter the payback period, the more profitable the project is.
2.4. Data
Data presented in this section is Tilos specific, unless specified otherwise. The first list of parameters covers the basic battery characteristics. It describes the technical features of the storage system, including energy storage capacity, charge and discharge duration, roundtrip efficiency, and so on (See Table 4 for details).
The second list of parameters covers the cost elements including both initial costs (such as capacity cost (Capacity cost is the average cost per unit of storage capacity. For example, if a battery with 25 kWh capacity costs €10,000, its capacity cost is €10,000 divided by 25 kWh (€400 per kWh).) and installation cost) and O&M cost elements (such as maintenance cost and insurance cost). Charging cost (Batteries need to be charged before it can release energy. Charging cost is the price paid to charge the battery. It is represented as euros per kWh.) is also introduced here, which is set at €0.15/kWh from the starting year with an annual escalation of 1%. Since it is assumed that the battery is only charged by renewable energy sources available on-site, we use the global weighted average levelized costs of electricity from wind and solar PV as benchmarks to determine the cost of charging [38]. The global weighted average levelized cost of electricity (LCOE) of solar PV is $0.1 per kWh, with a range between $0.07 and $0.31 per kWh (or €0.06 and €0.26 per kWh) (We use the currency conversion of $1 = €0.85 to convert US dollars to euros.). For wind power, the global average LCOE of wind is $0.06 per kWh, with a range between $0.03 and $0.1 per kWh (or €0.03 and €0.09 per kWh). Tilos Island has both wind and solar power generation; therefore, we use the range between €0.03 and €0.26 per kWh. We use the mid-point as a reference to represent the possible charging costs at €0.15 per kWh. For end-of-life cost, we assume the battery owner needs to pay €10,000 per unit for disposal. All data are listed in Table 5.
Other than the cost elements above, we also consider associated financial parameters. These parameters are helpful to decide the financial costs of the project, including own capital, loan amount, loan period, interest rate and so on. We use this information to estimate the interest payment each year. Assumptions are made as following with regards to Tilos project. Table 6 lists the financial parameters.
The storage system benefits from providing services to local residents (either commercial or residential consumers). However, the average household electricity price in Greece was €0.16 per kWh in the second half of 2017 [39]. If there is no subsidy related to the discharging price (Discharging price is the derived income during discharge. Depending on the services provided to the power system, discharging price is usually represented as euros per kWh.), the project would see a negative NPV with charging price at €0.15 per kWh. Thus, we test a range of discharging prices that can make the NPV close to zero when the charging price remains at €0.15 per kWh. The discharge price is set at €0.68 per kWh at the starting year with an annual escalation of 1% during its lifespan. (At the price of €0.68 per kWh, the NPV is positive. However, we only test the price of 0.15 (which reflects the household retail electricity price). Furthermore, this does not reflect the utility cost, which for the Greek (and other European) islands is often state subsidized.). It means that the government will need to consider a payment of approximately €0.5 for each kWh of discharge from the storage system. We also include a subsidy for each unit at €30,000. Table 7 lists the benefit parameters.
To address the life-cycle impacts in our CBA, we include emissions of the battery system at different stages during its life-cycle, including emissions from manufacturing, operation and after the end of the lifespan. These data are used to determine the environmental externalities of the battery system and the associated benefits compared to the existing conventional energy-based power system during its operation. We use the data from [37] to represent the life-cycle CO2 emissions from the battery system which is summarized as following. For one of the operation modes of Tilos project, the battery system is used to replace existing diesel power generation during hours that renewable energy generation cannot satisfy demand. We assume that a small-scale diesel generator (capacity <50 MW) is used on the island. The average CO2 emission is 1000 grams per kWh. Therefore, the battery storage system can save 983.4 grams of CO2 emissions per kWh of electricity discharge. With a carbon price at €20 per ton, the potential monetary benefits of using battery system due to lower environmental impacts can reach €11,675 in the first year of operation. For clarity it is mentioned that Tilos has interconnections with four of its neighboring small islands in a localized micro-grid. However, the discussed energy system on Tilos is not licensed to return energy into that micro-grid but rather to take Tilos off-grid at certain times.
Furthermore, there are potential benefits of avoided damages to electric appliances on the island. Tilos Island used to suffer from frequent power outages due to faults with the undersea cable that connect Tilos with the main Kos. The battery system can help improve electricity supply security, therefore reducing the frequency of power outages. We assume damages to the following items can be avoided. Table 8 lists the environmental externalities of storage system and avoided damages.
3. Results
In this study, we assume the daily operation of the battery system remains the same throughout its whole life cycle. Daily and seasonal variations are not considered, though their existing variations can have impacts on the storage operation (and its revenue stream). It is beyond the scope of this report to address such variations. In addition, information with regards to the different grid services and corresponding benefits are not available, therefore energy arbitrage is considered the only grid service that the storage system can provide for this exercise.
3.1. Key Output Indicators
We compare several key output indicators based on the assumptions above. We interpret our results under two scenarios: the first scenario does not consider environmental externalities; the second scenario includes all externalities, such as the avoided emissions from conventional power generation and the avoided damages due to power outages. This can help examine the additional benefits that the battery system can derive when considering externalities.
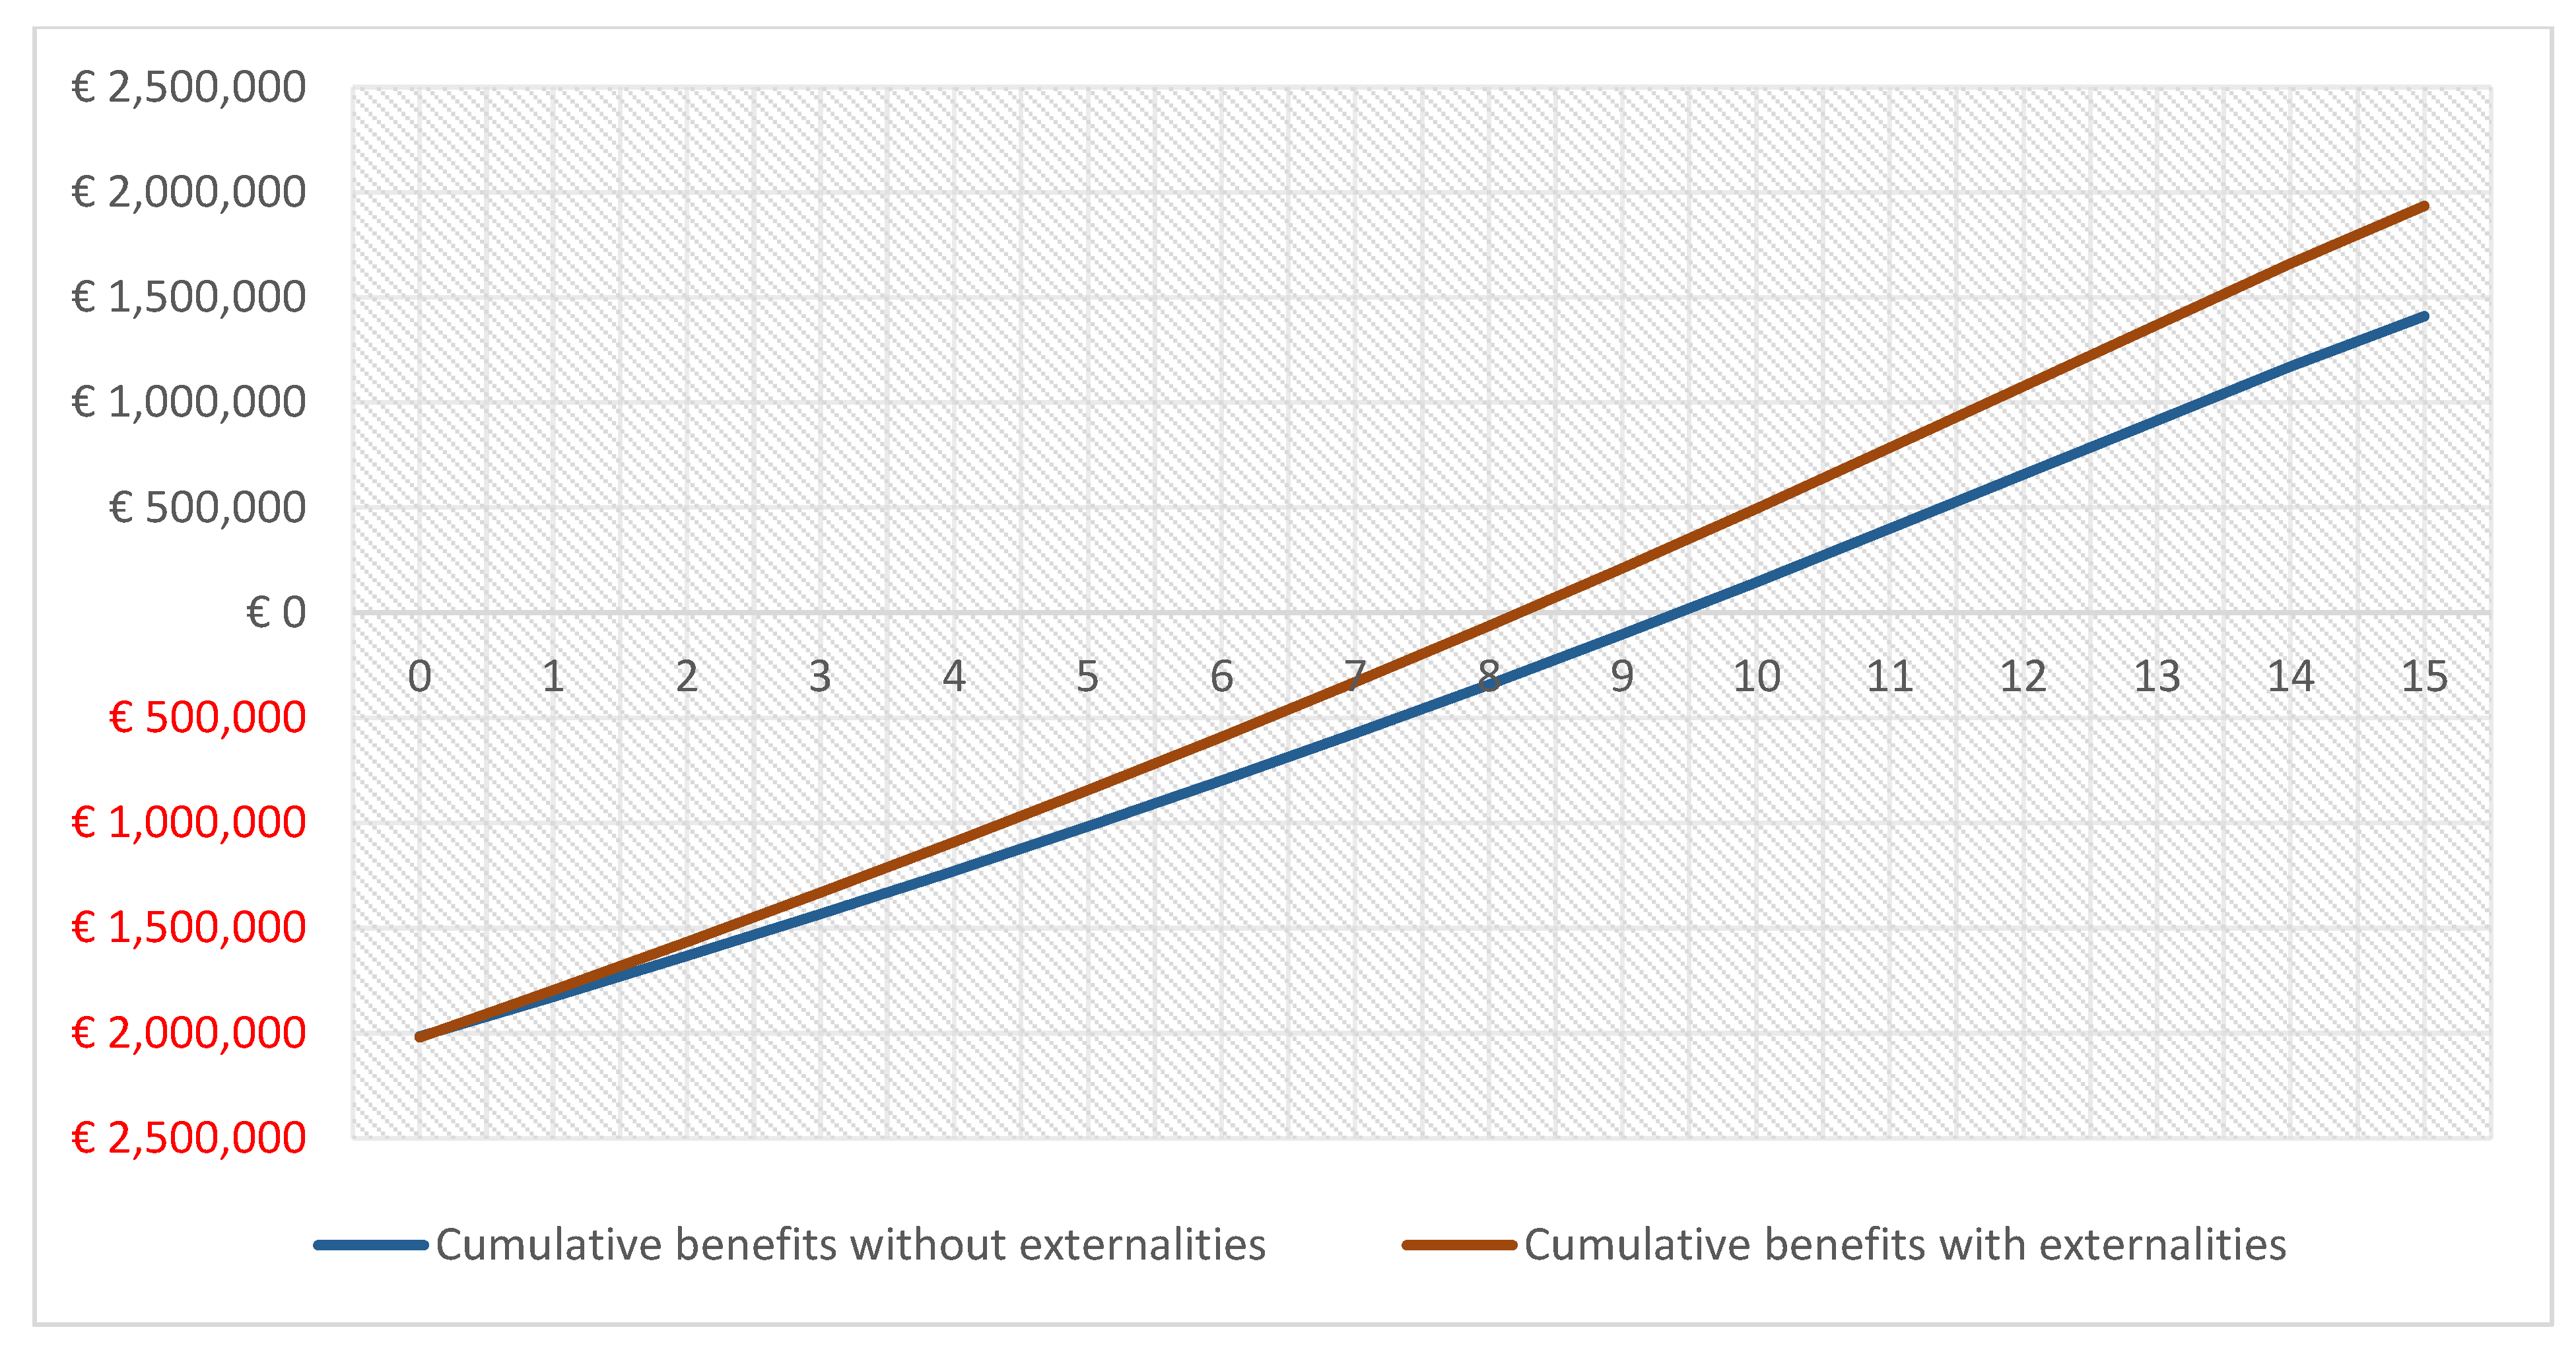
All key output indicators are improving with the inclusion of externalities (see Table 9). For example, the NPV of the project increases from €4533 to €301,014; the BCR increases from almost equal to 1.08; internal rate of return grows from 7.0% to 9.3%. Figure 1 shows the changes in cumulative benefits under two scenarios. The discounted payback period improves from 9.4 years to 8.2 years, which means the project becomes breakeven more than one year earlier if externalities are taken into account.
3.2. Changes in Net Present Value Associated with Changes in Different Parameters without Externalities
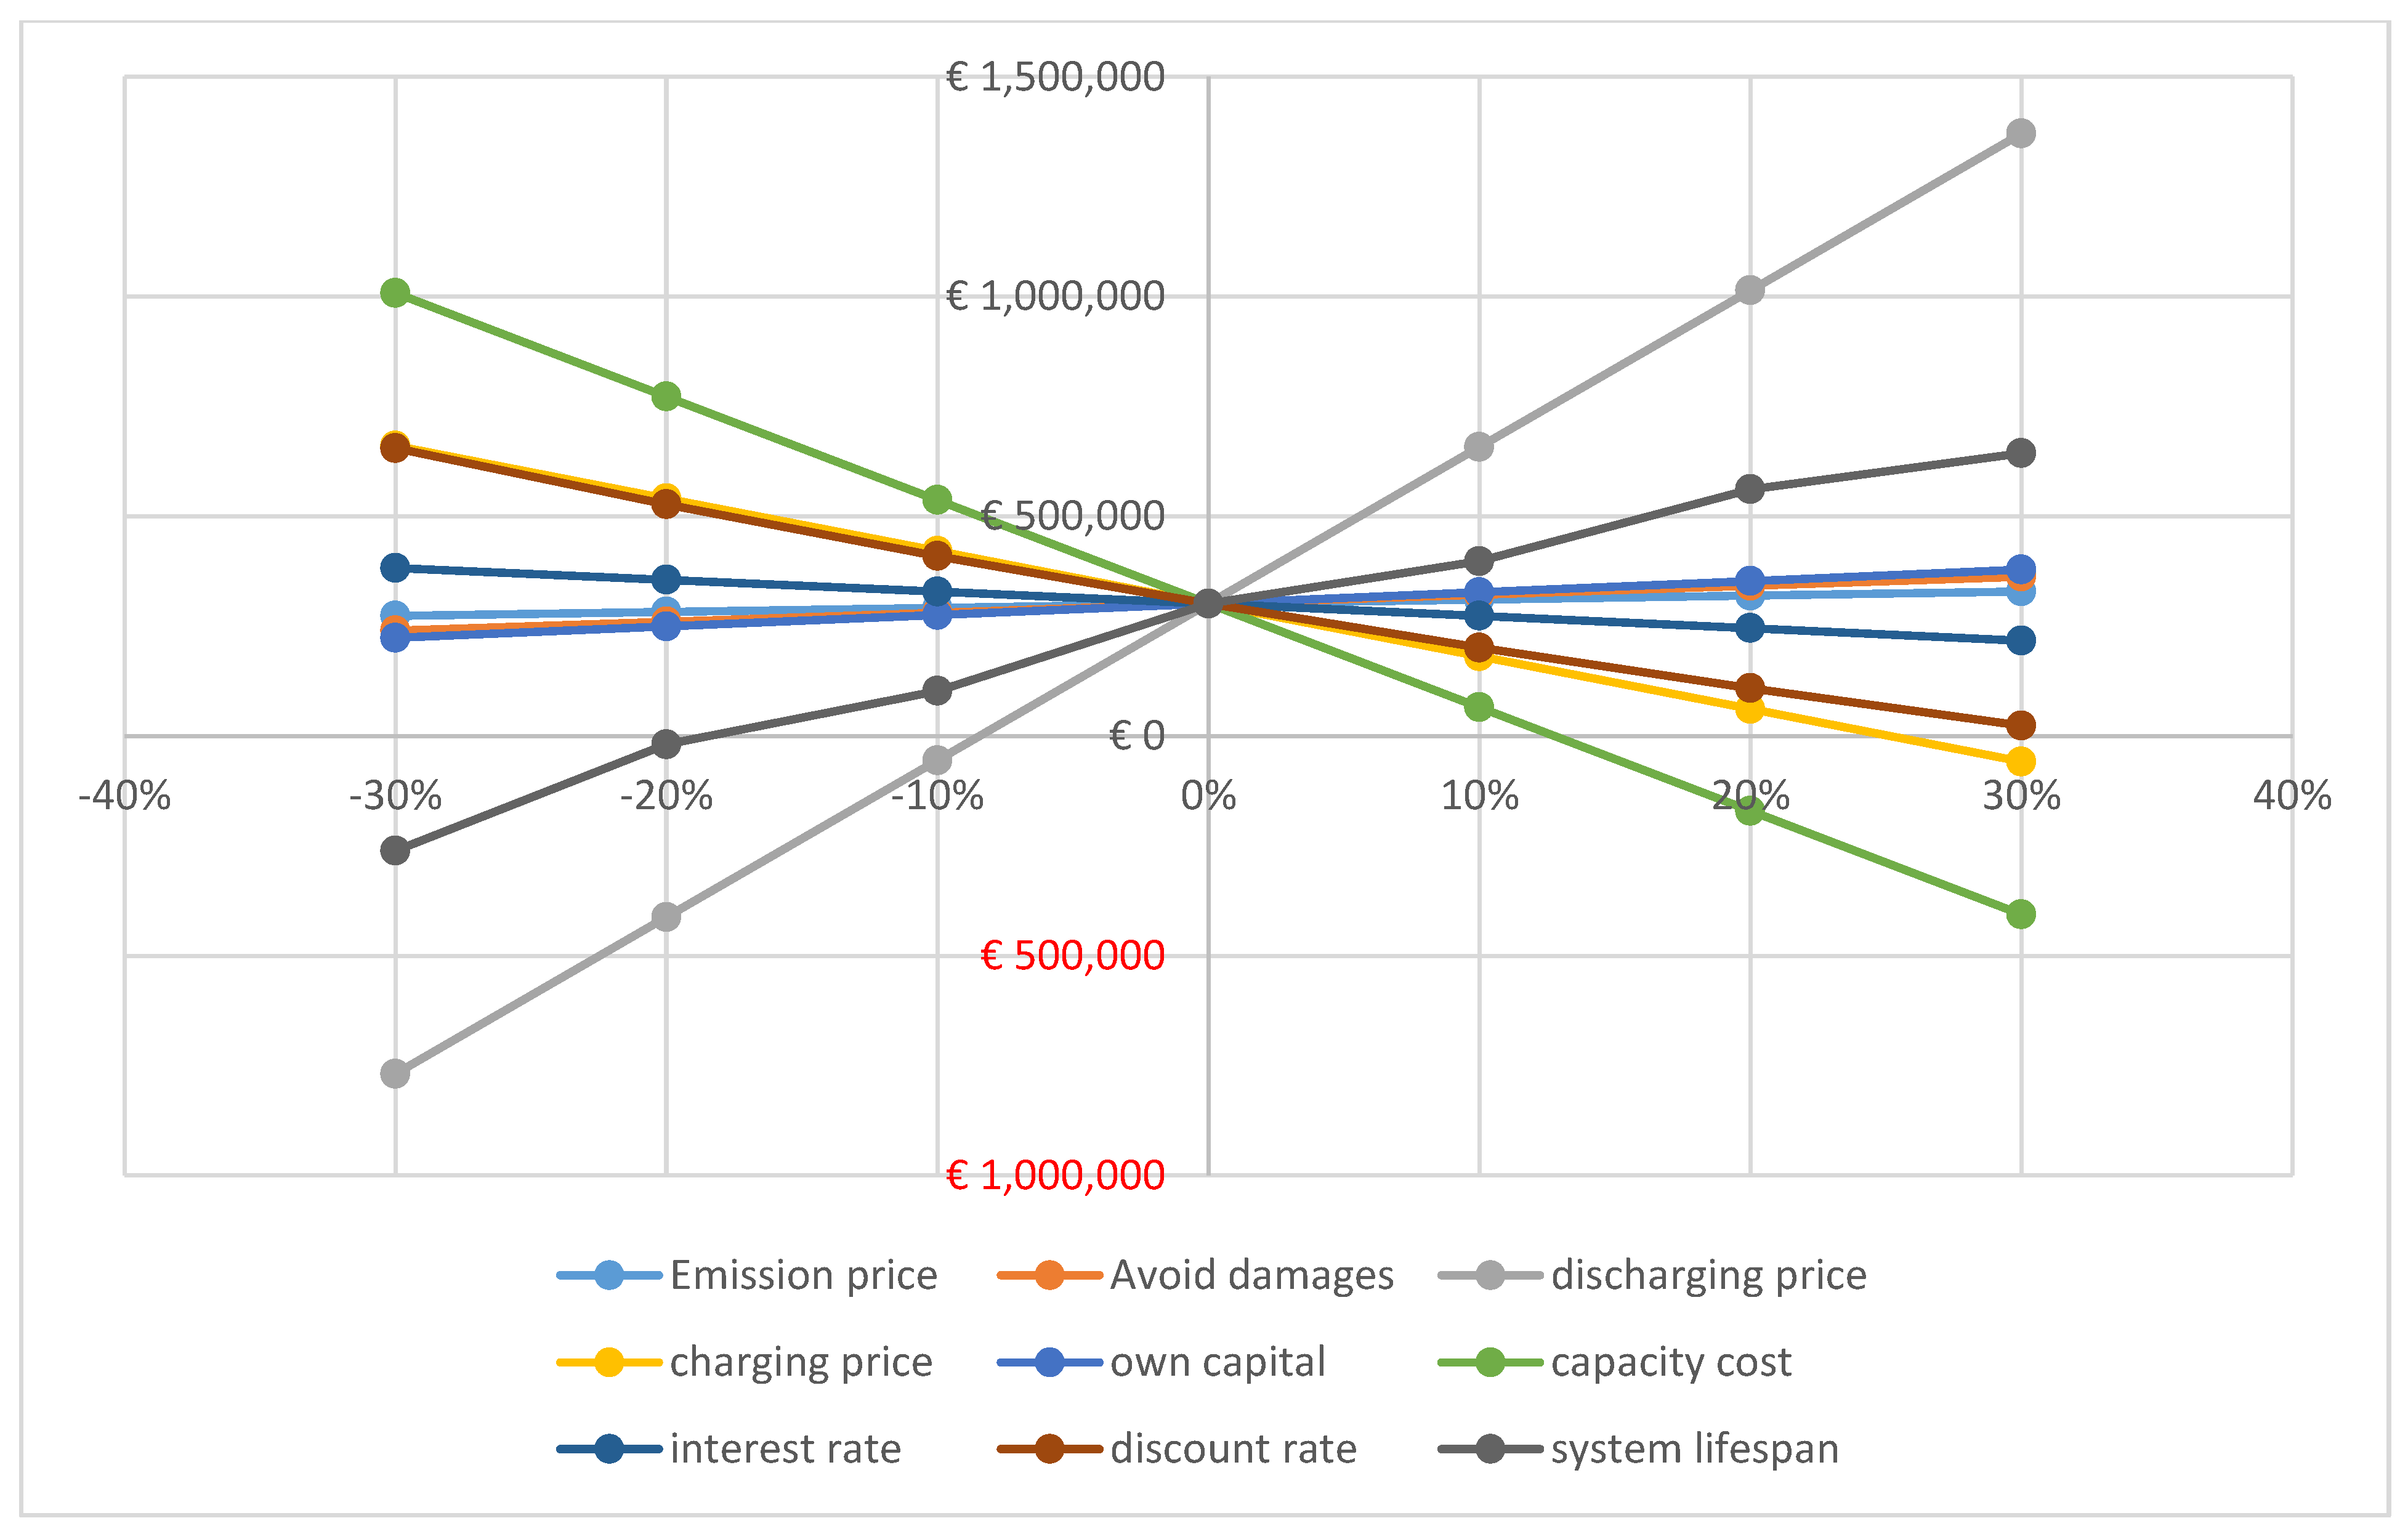
We first conduct a sensitivity analysis of the changes in NPV associated with changes in different parameters. We examine the changes in NPVs at different scales (±10%, ±20% and ±30%). Figure 2 shows that changes in discharging price can lead to the most significant changes in NPVs. Besides, changes in capacity cost, charging price and system lifespan can also have significant implications to the NPV of the project. By contrast, own capital, interest rate and discount rate make minor contribution to NPV changes.
We then examine the most influential factors that determine the NPV. Figure 3 shows the changes in NPVs with different capacity costs and discharging prices. In the base case, the capacity cost is €700 per kWh. The project becomes financially attractive when discharging price is €0.68 per kWh. If the capacity cost declines to €500 per kWh, the project can have a close to zero NPV when charging price drops to €0.55 per kWh. Nevertheless, with a low charging price, the NPV will stay negative even if capacity price drops to €400 per kWh. This implies the necessity of financial subsidies in all cases apart from the lowest costs applicable in large-scale projects.
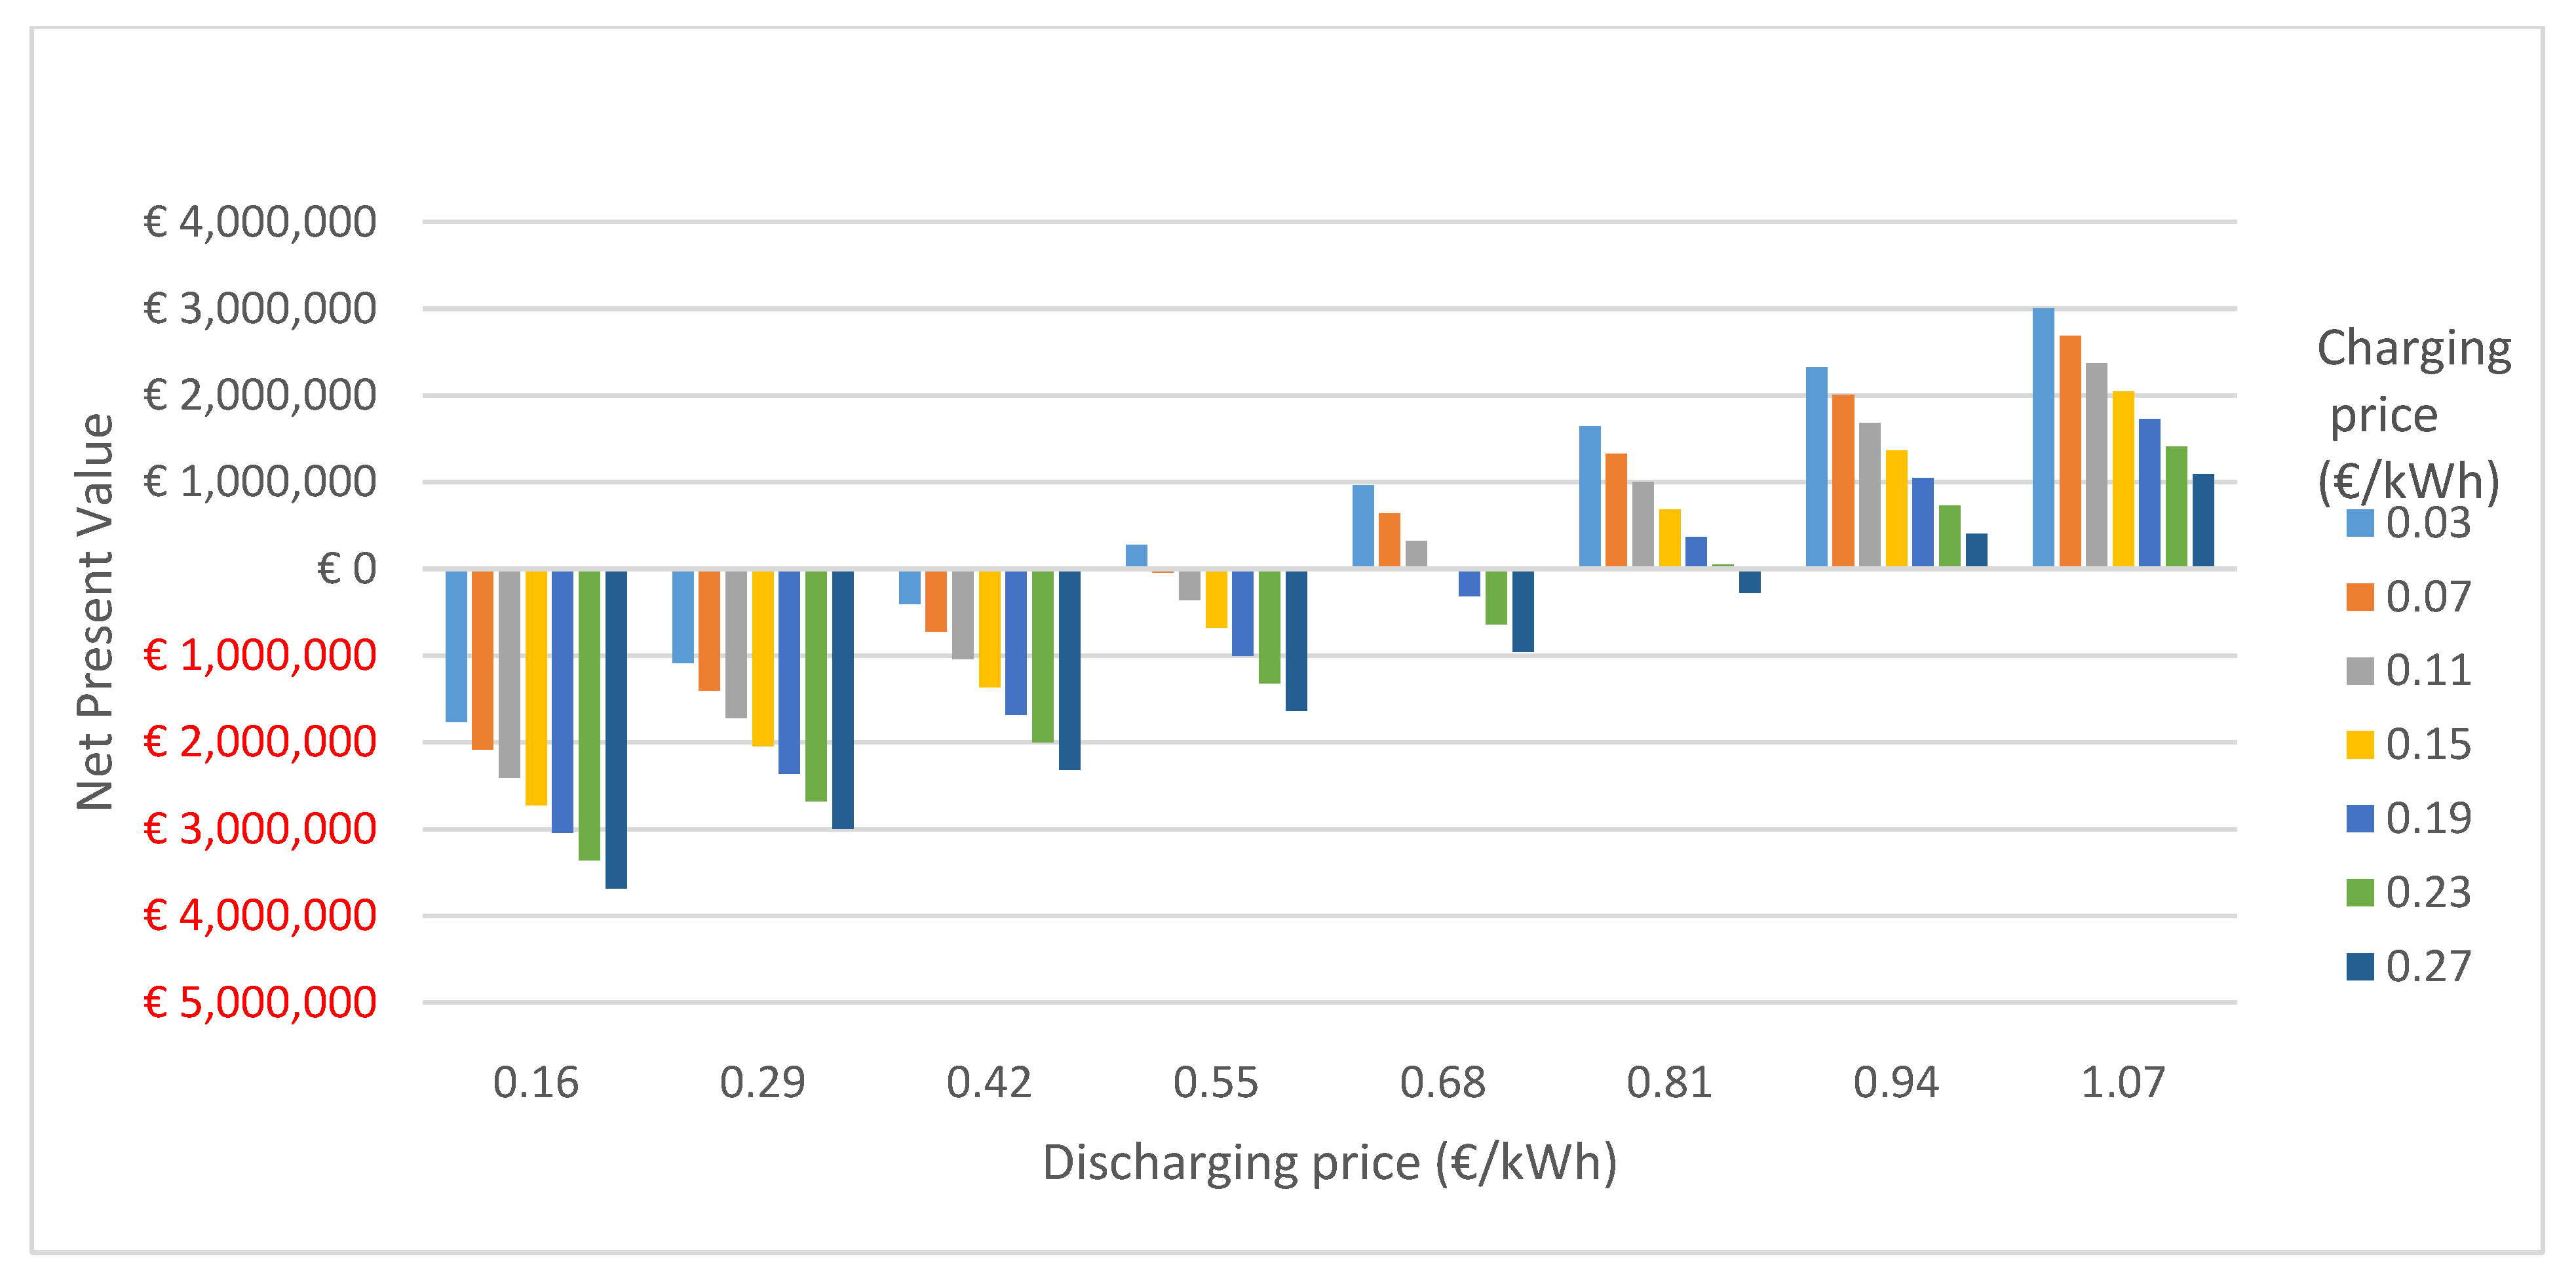
The NPV of the project can improve significantly with lower charging price and higher discharging price (see Figure 4). As above, if no financial subsidy becomes available (when discharging price is equivalent to average household electricity price at €0.16 per kWh), the NPVs stay negative regardless the level of charging price. Even if the charging price is at its lower end (e.g., €0.03 per kWh which is the lower end of global average wind power generation cost), the NPV can only become positive if discharging price reaches €0.55 per kWh. It is reminded that power generation for the Greek islands is subsidized by consumer bills in mainland Greece and while all Greek households enjoy the same retail price, they do not cost the same to electrify. Therefore, the specific relatively high discharging prices should not be in any way alienating as they are nearer the real cost of dispatching for Greek islands. Specific costs depend significantly on each island’s circumstances and the price of oil.
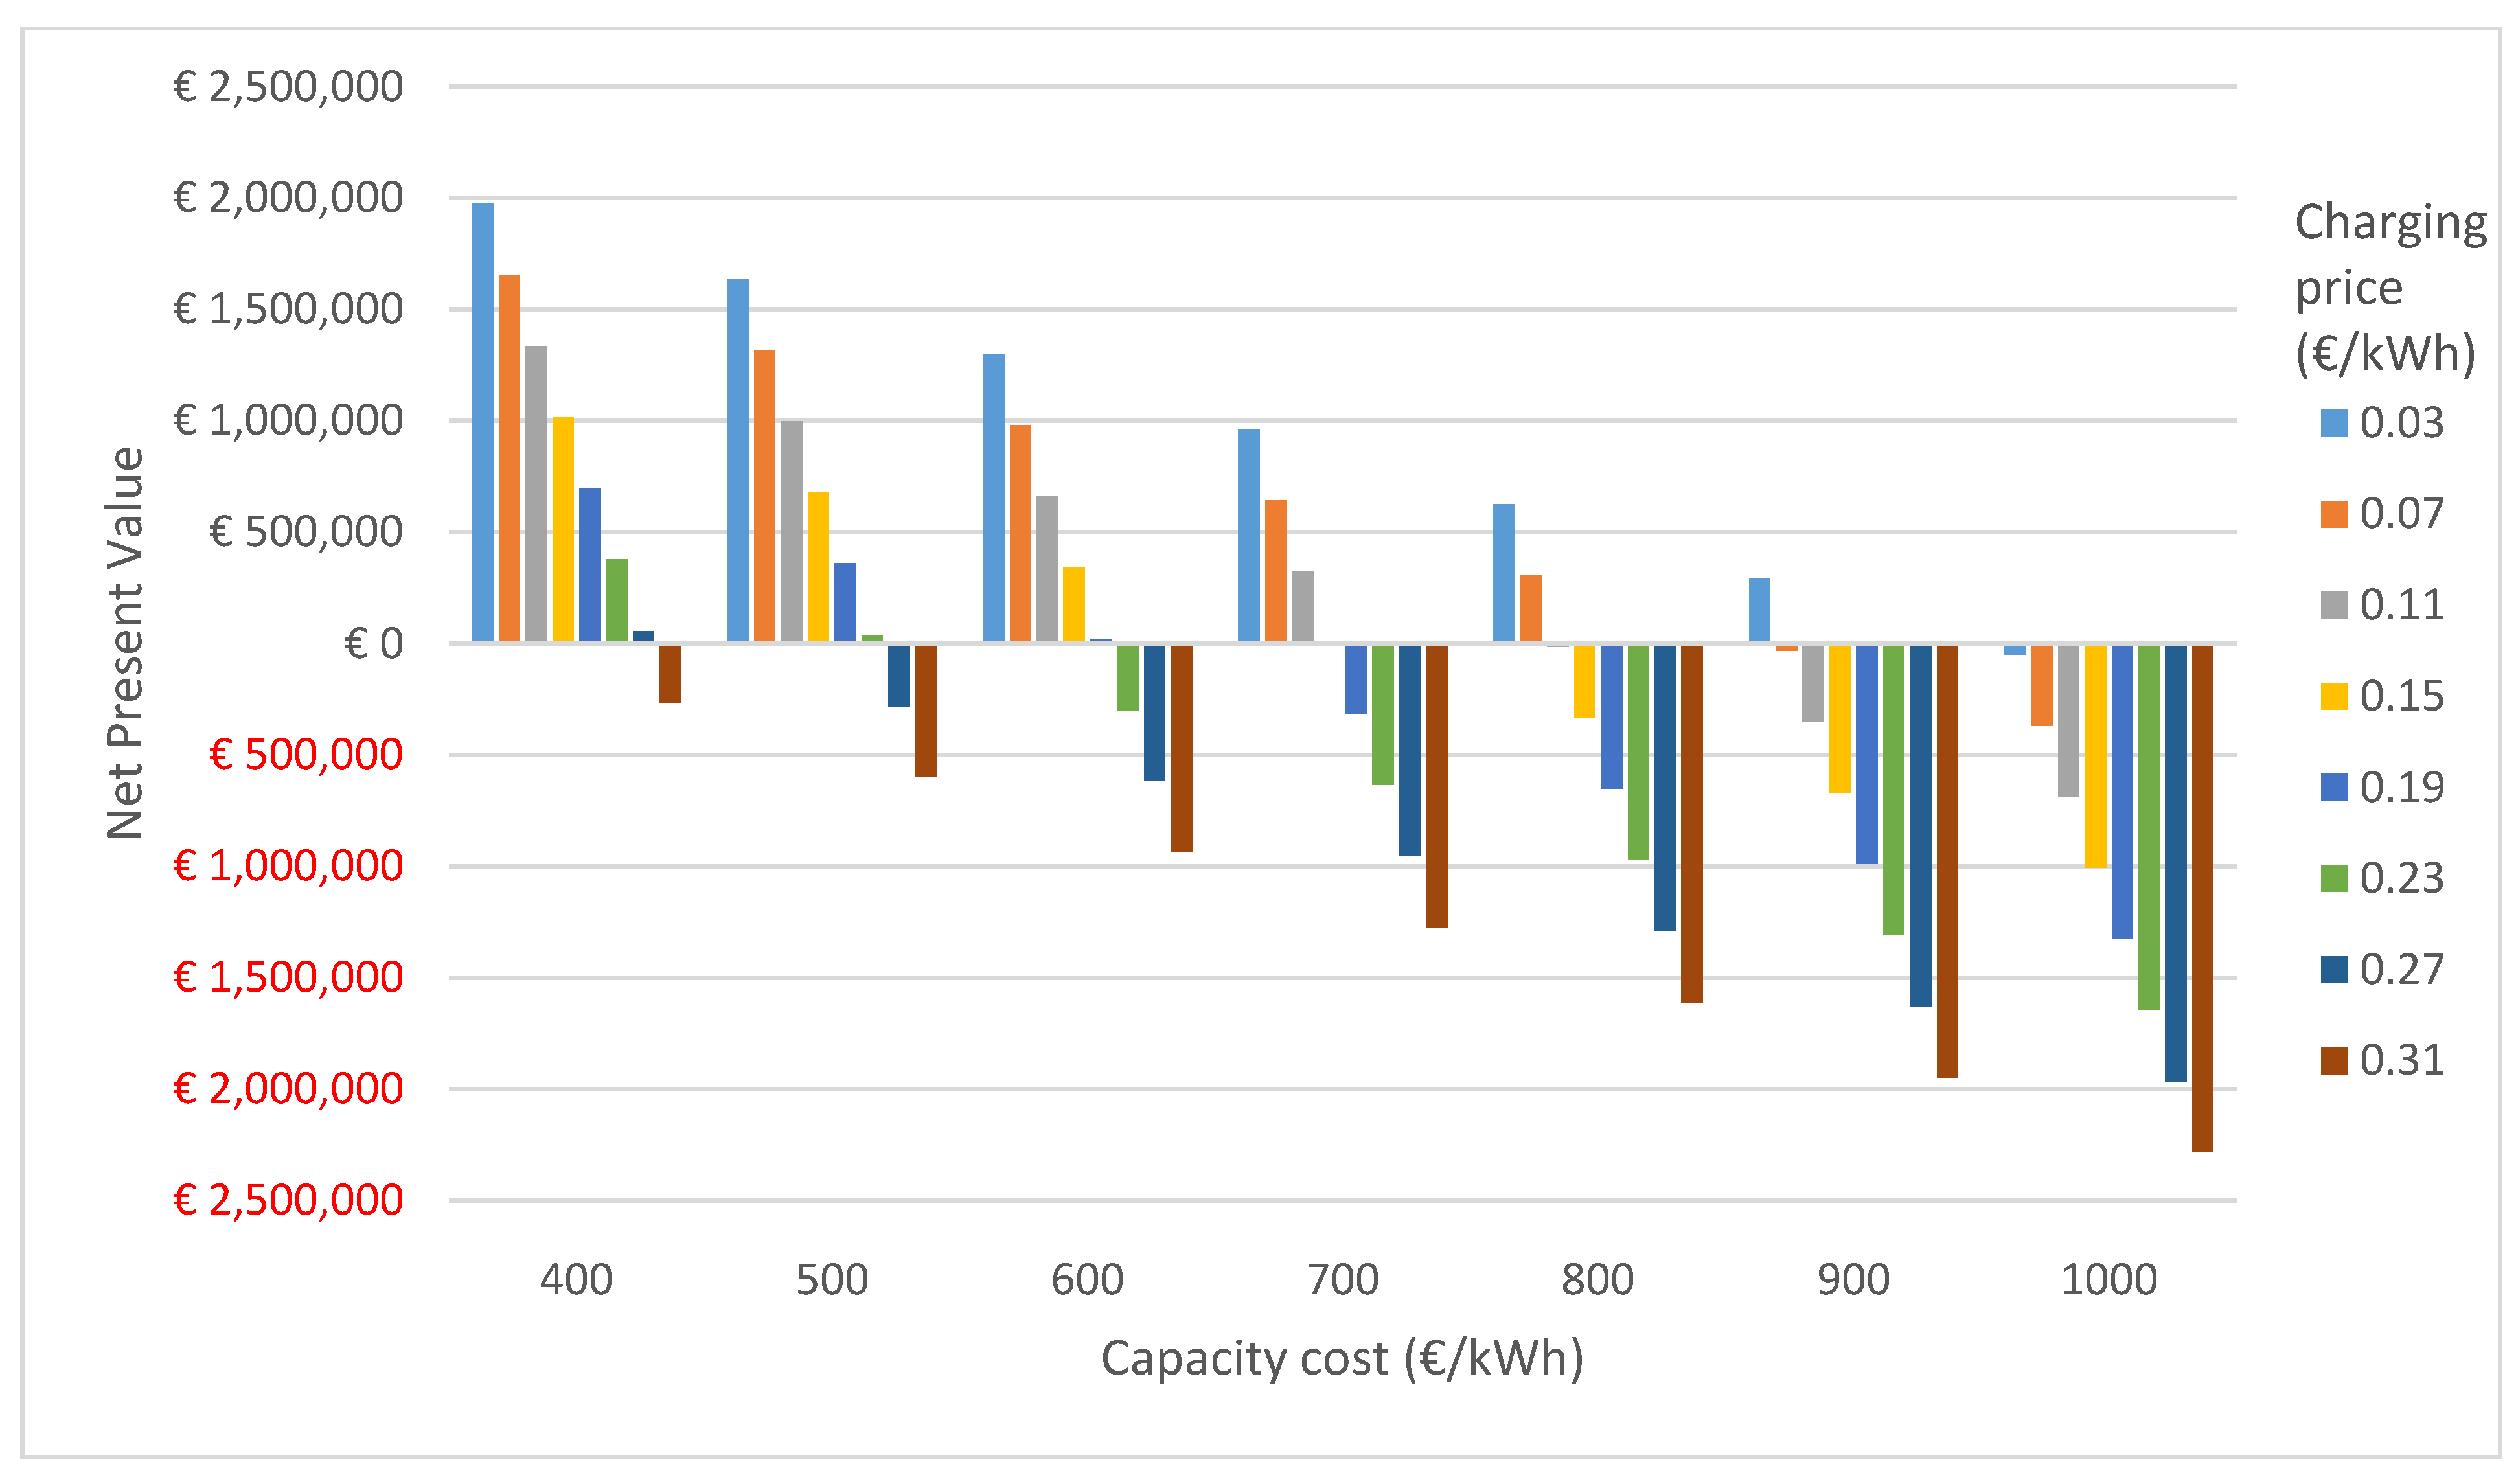
We also test the changes in NPVs with regards to different capacity costs and charging prices (see Figure 5). It shows that the project has negative NPVs if charging price is at the high end (e.g., €0.31 per kWh or above), even if the capacity cost declines to €400 per kWh. By comparison, the NPV of the project stays positive with a low charging price (e.g., €0.3 per kWh), unless capacity price increases to €1000 per kWh.
3.3. Changes in Net Present Value Associated with Changes in Different Parameters with Externalities
Figure 6 shows the changes in NPV associated with changes in different parameters. Compared to Figure 2 above, we include environmental externalities such as emission price and avoided damages. Nevertheless, changes in emission price and avoided damages do not have significant impacts on the NPVs. Given the small size of the battery storage system at Tilos Island, the economic value of avoided emissions, despite significant for the scale of the project, is minor at a large-scale (around €11,000 each year). It also applies to the avoided damages since the island power system only serve several hundred local residents, therefore the economic value of avoided damage is not significant either (€24,000 each year).
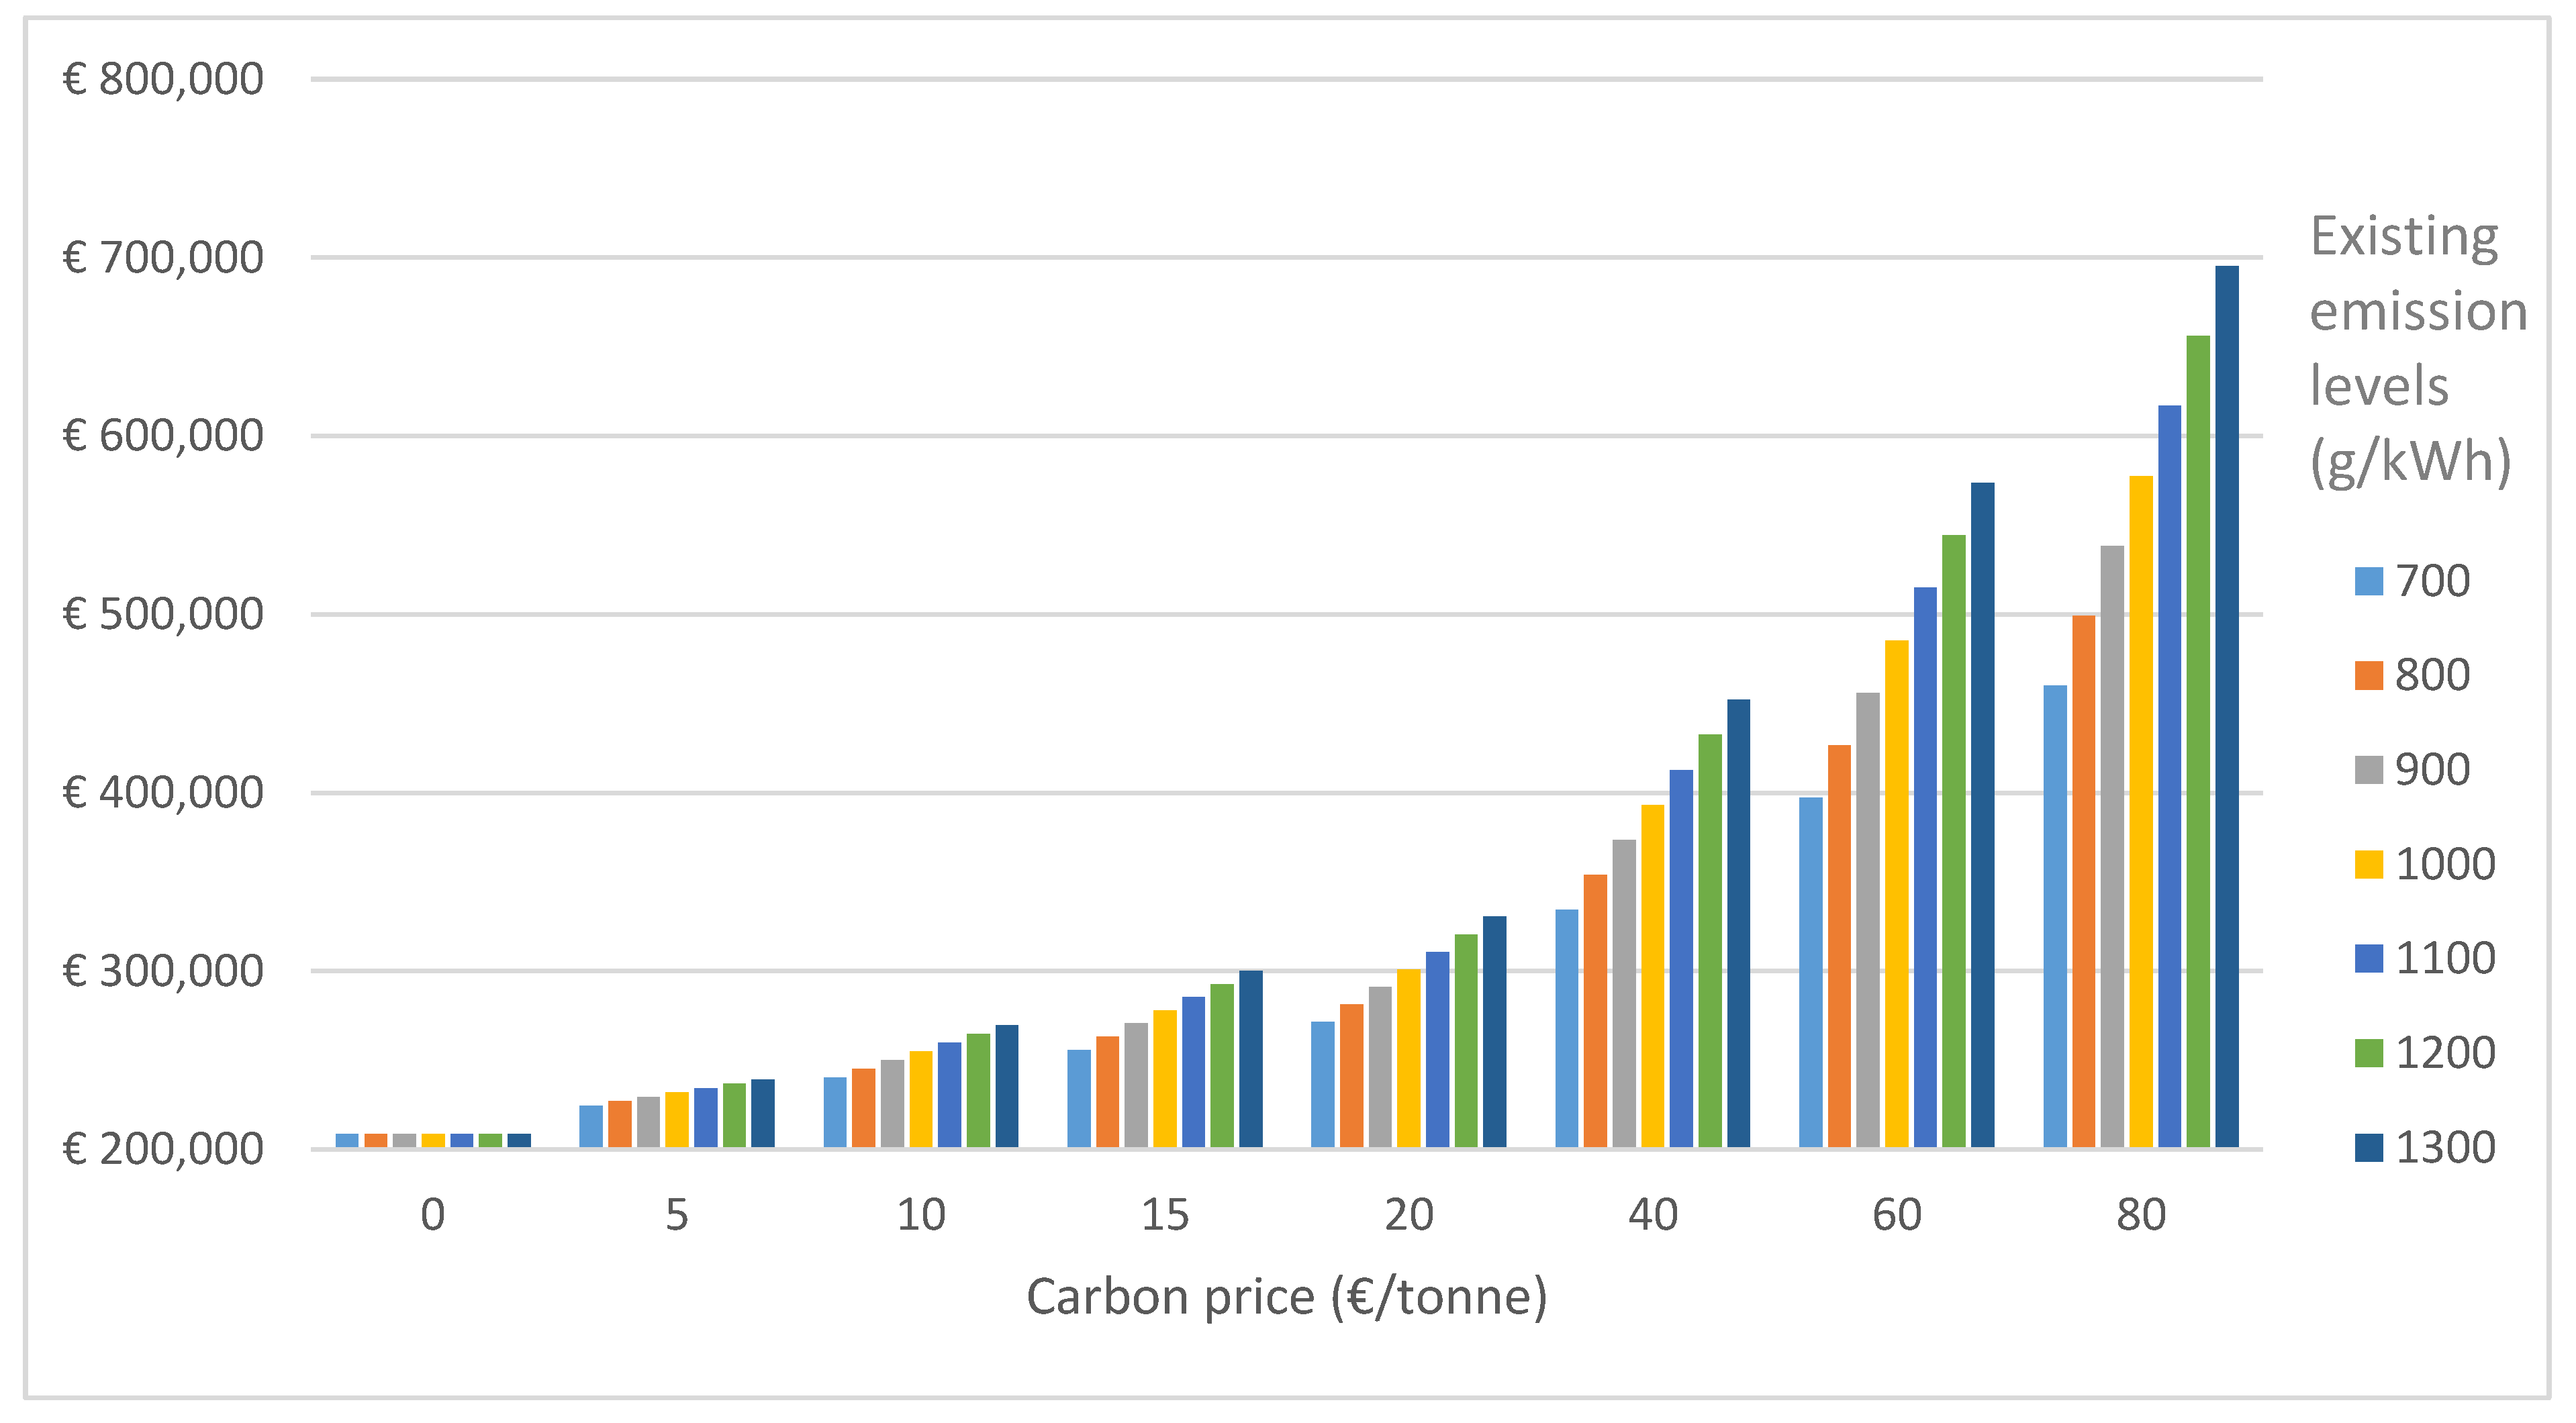
Since the economic value of avoided emissions is largely associated with the level of existing emission levels and the carbon price, we examine the changes in both parameters and their impacts on NPV. Figure 7 shows that the changes of NPV are not significant with different emission levels, when carbon price remains at low level. However, if carbon price reaches €80 per ton, the NPV can be significantly improved with higher existing emission levels (NPV equals €459,926 at 700 g/kWh for existing emission levels; NPV equals €695,255 at 1300 g/kWh existing emission levels). The sensitivity to this emission factor is useful since this is not the same for every island system. Even in Greek that has dozens of inhabited islands (several of which have an interest in adopting the described system) their emission factors differ significantly.
4. Discussion
In this study, we conduct a CBA for a battery storage system applicable both at geographical and real island settings. We argue that although energy islands are pioneers in energy innovation, technological, methodological and policy learning will enable their lessons to be useful for urban energy communities. Early adoption of energy innovations, including renewable energy and battery storage, has been a natural step for islands not least because it provides solutions to their struggle to secure energy supply and reduce production costs. In this context, new technologies have been able to offer significant improvements in comparison to typical off-grid energy production on islands. Urban energy communities present a greater challenge in that new energy technologies compete with grid-power that delivers scale efficiency. Technological and operational transferability between islands and urban settings requires a detailed understanding of the intricacies of the specific case studies in question. However, the purpose of this manuscript is to maintain an island focus and open the dialogue over transferability which we argue might be valuable. While our work focuses on the CBA of battery energy systems, we offer the following observations:
Firstly, the inclusion of externalities in the CBA of battery storage can improve the economic value of the system significantly. All output indicators, namely NPV, BCR, internal rate of return and discounted payback period, have been improved when externalities were considered. Nevertheless, some of these benefits are not related to the project investment but to wider social benefits (such as avoided damages to home appliances). If the project owner is a private entity, investors may not consider these benefits as significant components in their project appraisal (unless forced by regulation or corporate commitments). In that case, battery storage policy should consider creating more certainty in revenues and expenditures of the storage project. Apart from avoided CO2 emissions and avoided damages to home appliances, we do not consider other potential benefits from the use of battery storage system. These benefits include avoided grid extension, avoided additional capacity costs. This is due to assumptions for relatively stable electricity demand; therefore, the integrated system is used to replace the existing system, which does not need upgrade in size. If the integrated system is used to provide electricity access to newly established areas or an existing establishment requires update, it means additional demand is required from the existing power system. Thus, the existing power system would require additional grid and generation capacity to satisfy the growing demand. Associated cost can be significant if existing power system is close to its limit in supply and that scenario might be mostly relevant for cases of extensive electrification of transport and domestic heating.
Secondly, although the economics of battery storage can be improved by including externalities such as avoided emissions and costs, the NPV is still largely dependent on several parameters, including capacity cost, discharging price, and charging cost. Capacity cost remains at high level compared to other energy infrastructure equipment. Given storage projects are highly capital intensive, this means that capacity cost is a crucial element in every investment decision. Although battery storage in general is not cost competitive now, we have seen significant declines in capacity costs for various types of batteries. For example, lithium-ion battery capacity cost has dropped to $273 per kWh in 2016 from $1000 per kWh in 2010. The price is expected to reach $74 per kWh by 2030 [40]. In another study, Newbery and Strbac [41] estimate that capacity cost of various battery packs would range between $275 and $375 per kWh by 2020 and between $210 and $290 per kWh by 2030, which are substantially lower than the capacity cost in our study. Nevertheless, policy support is necessary to make battery storage project attractive. One option is to subsidize capacity cost through government funding [42].
Apart from capacity cost, charging cost and discharging price are also significant in determining the economic viability of the battery storage system. These parameters can have a significant impact on the revenue streams of the project. For charging prices, recent decline in renewable energy price is helpful to encourage the growth of batteries in combination with renewable energy. For example, IRENA [38] highlights that the cost of wind and solar is equivalent to, in some cases lower than, the cost of fossil fuel-based power generation. Battery storage can benefit from such decline which is helpful to lower the charging price. At the same time, we only consider energy arbitrage as the main and only service to power system operation, though battery storage can provide multiple services to the power grid. We show that battery system cannot procure enough economic return if only energy arbitrage is considered. Literature also suggest that battery storage is not economically viable if only primary services are considered. For example, Kintner-Meyer and colleagues [43] conclude that battery storage (using sodium sulfur and Li-ion batteries) for arbitrage in the US at national level cannot recover costs. The authors argue that other revenue streams such as capacity payments are needed to make battery storage economically viable. Given that battery storage can play multiple roles to the grid [44,45], it is essential to understand the secondary services that the battery storage can contribute to the grid operation.
Therefore, at the initial stage of battery storage application, the system will require financial support. Types of financial support can include initial incentives to compensate the high capacity cost or subsidies to compensate discharging prices. Existing electricity pricing structure (e.g., using household electricity price as a benchmark) cannot guarantee enough economic returns regardless of charging price or capacity cost.
In this study, we address the economics of battery storage system at Tilos Island. Certainly, it is not directly linked to the power system operation at city level. However, the growing trend of decentralized generation has made the Tilos case similar to micro-grid architecture that is developing fast in cities. Battery storage system is usually of modest size and likely to be connected to distribution networks [46]. It can be a cost-effective option to manage constraints and defer investments on grid infrastructure.
Author Contributions
X.L. and K.J.C. conceived and designed the research; X.L. and K.J.C. analyzed the data; X.L. contributed reagents/materials/analysis tools; X.L., K.J.C. and P.S. wrote the paper.
Funding
This research was funded under the project TILOS (Horizon 2020 Low Carbon Energy Local/small-scale storage LCE-08-2014) by the European Union & Horizon 2020 research and innovation programme under grant number 646529.
Conflicts of Interest
The authors declare no conflict of interest.
References
- IRENA. Renewable Energy in Cities; International Renewable Energy Agency: Abu Dhabi, UAE, 2016. [Google Scholar]
- Chalvatzis, K.J. Electricity generation development of eastern europe: A carbon technology management case study for poland. Renew. Sustain. Energy Rev. 2009, 13, 1606–1612. [Google Scholar] [CrossRef] [Green Version]
- Kaldellis, J.K.; Spyropoulos, G.; Chalvatzis, K. The impact of greek electricity generation sector on the national air pollution problem. Fresenius Environ. Bull. 2004, 13, 647–656. [Google Scholar]
- Chalvatzis, K.J.; Ioannidis, A. Energy supply security in the eu: Benchmarking diversity and dependence of primary energy. Appl. Energy 2017, 207, 465–476. [Google Scholar] [CrossRef]
- Chalvatzis, K.J.; Ioannidis, A. Energy supply security in southern europe and ireland. Energy Proced. 2017, 105, 2916–2922. [Google Scholar] [CrossRef]
- CDP. Cities Are Harnessing the Power of Renewable Energy: Here’s How. Available online: https://www.cdp.net/en/articles/cities/cities-are-harnessing-the-power-of-renewable-energy (accessed on 19 September 2018).
- Eizenberg, E.; Jabareen, Y. Social sustainability: A new conceptual framework. Sustainability 2017, 9, 68. [Google Scholar] [CrossRef]
- Pothitou, M.; Hanna, R.F.; Chalvatzis, K.J. Ict entertainment appliances’ impact on domestic electricity consumption. Renew. Sustain. Energy Rev. 2017, 69, 843–853. [Google Scholar] [CrossRef]
- Zafirakis, D.; Chalvatzis, K.J. Wind energy and natural gas-based energy storage to promote energy security and lower emissions in island regions. Fuel 2014, 115, 203–219. [Google Scholar] [CrossRef]
- Chalvatzis, K.J.; Malekpoor, H.; Mishra, N.; Lettice, F.; Choudhary, S. Sustainable resource allocation for power generation: The role of big data in enabling interindustry architectural innovation. Technol. Forecast. Soc. Chang. 2018. [Google Scholar] [CrossRef]
- Malekpoor, H.; Chalvatzis, K.; Mishra, N.; Mehlawat, M.K.; Zafirakis, D.; Song, M. Integrated grey relational analysis and multi objective grey linear programming for sustainable electricity generation planning. Ann. Oper. Res. 2018, 269, 475–703. [Google Scholar] [CrossRef]
- Li, X.; Chalvatzis, K.J.; Pappas, D. Life cycle greenhouse gas emissions from power generation in china’s provinces in 2020. Appl. Energy 2018, 223, 93–102. [Google Scholar] [CrossRef]
- Sartori, D.; Catalano, G.; Genco, M.; Pancotti, C.; Sirtori, E.; Vignetti, S.; Del Bo, C. Guide to Cost-Benefit Analysis of Investment Projects–Economic Appraisal Tool for Cohesion Policy 2014–2020; European Commission: Brussels, Belgium, 2014. [Google Scholar]
- Strantzali, E.; Aravossis, K. Decision making in renewable energy investments: A review. Renew. Sustain. Energy Rev. 2016, 55, 885–898. [Google Scholar] [CrossRef]
- Feuillette, S.; Levrel, H.; Boeuf, B.; Blanquart, S.; Gorin, O.; Monaco, G.; Penisson, B.; Robichon, S. The use of cost–benefit analysis in environmental policies: Some issues raised by the water framework directive implementation in france. Environ. Sci. Policy 2016, 57, 79–85. [Google Scholar] [CrossRef]
- OECD. Cost-Benefit Analysis and the Environment; OECD publishing: Paris, France, 2018. [Google Scholar]
- Maresova, P.; Sobeslav, V.; Krejcar, O. Cost–benefit analysis–evaluation model of cloud computing deployment for use in companies. Appl. Econ. 2017, 49, 521–533. [Google Scholar] [CrossRef]
- Mateo, C.; Reneses, J.; Rodriguez-Calvo, A.; Frías, P.; Álvaro, S. Cost-benefit analysis of battery storage in medium-voltage distribution networks. IET Gener. Transm. Distrib. 2016, 10, 815–821. [Google Scholar] [CrossRef]
- Liu, W.; Niu, S.; Xu, H. Optimal planning of battery energy storage considering reliability benefit and operation strategy in active distribution system. J. Mod. Power Syst. Clean Energy 2017, 5, 177–186. [Google Scholar] [CrossRef]
- Zucker, A.; Hinchliffe, T.; Spisto, A. Assessing Storage Value in Electricity Markets; European Commission: Brussels, Belgium, 2013. [Google Scholar]
- Kaldellis, J.K.; Zafirakis, D.; Kaldelli, E.L.; Kavadias, K. Cost benefit analysis of a photovoltaic-energy storage electrification solution for remote islands. Renew. Energy 2009, 34, 1299–1311. [Google Scholar] [CrossRef]
- Spyropoulos, G.; Chalvatzis, K.; Paliatsos, A.; Kaldellis, J.K. Sulphur dioxide emissions due to electricity generation in the aegean islands: Real threat or overestimated danger? In Proceedings of the 9th International Conference on Environmental Science and Technology, Rhodes Island, Greece, 3–6 September 2005. [Google Scholar]
- Ioannidis, A.; Chalvatzis, K.J. Energy supply sustainability for island nations: A study on 8 global islands. Energy Proced. 2017, 142, 3028–3034. [Google Scholar] [CrossRef]
- Kaldellis, J.K.; Zafirakis, D.; Kondili, E. Optimum sizing of photovoltaic-energy storage systems for autonomous small islands. Int. J. Electr. Power Energy Syst. 2010, 32, 24–36. [Google Scholar] [CrossRef]
- Chauhan, A.; Saini, R.P. Techno-economic feasibility study on integrated renewable energy system for an isolated community of india. Renew. Sustain. Energy Rev. 2016, 59, 388–405. [Google Scholar] [CrossRef]
- Hills, J.M.; Μichalena, E.; Chalvatzis, K.J. Innovative technology in the pacific: Building resilience for vulnerable communities. Technol. Forecast. Soc. Chang. 2018, 129, 16–26. [Google Scholar] [CrossRef]
- Malekpoor, H.; Chalvatzis, K.; Mishra, N.; Ramudhin, A. A hybrid approach of vikor and bi-objective integer linear programming for electrification planning in a disaster relief camp. Ann. Oper. Res. 2018, 269, 1–27. [Google Scholar] [CrossRef]
- De Sisternes, F.J.; Jenkins, J.D.; Botterud, A. The value of energy storage in decarbonizing the electricity sector. Appl. Energy 2016, 175, 368–379. [Google Scholar] [CrossRef] [Green Version]
- Leou, R.-C. An economic analysis model for the energy storage system applied to a distribution substation. Int. J. Electr. Power Energy Syst. 2012, 34, 132–137. [Google Scholar] [CrossRef]
- Lin, B.; Wu, W. Economic viability of battery energy storage and grid strategy: A special case of china electricity market. Energy 2017, 124, 423–434. [Google Scholar] [CrossRef]
- Kaldellis, J.K.; Zafirakis, D.; Kavadias, K. Techno-economic comparison of energy storage systems for island autonomous electrical networks. Renew. Sustain. Energy Rev. 2009, 13, 378–392. [Google Scholar] [CrossRef]
- Sullivan, J.L.; Gaines, L. Status of life cycle inventories for batteries. Energy Convers. Manag. 2012, 58, 134–148. [Google Scholar] [CrossRef]
- Denholm, P.; Kulcinski, G.L. Life cycle energy requirements and greenhouse gas emissions from large scale energy storage systems. Energy Convers. Manag. 2004, 45, 2153–2172. [Google Scholar] [CrossRef]
- Van den Bossche, P.; Vergels, F.; Van Mierlo, J.; Matheys, J.; Van Autenboer, W. Subat: An assessment of sustainable battery technology. J. Power Sources 2006, 162, 913–919. [Google Scholar] [CrossRef]
- Sullivan, J.L.; Gaines, L. A Review of Battery Life-Cycle Analysis: State of Knowledge and Critical Needs; Argonne National Laboratory–Energy Systems Division: Oak Ridge, TN, USA, 2010. [Google Scholar]
- Hiremath, M.; Derendorf, K.; Vogt, T. Comparative life cycle assessment of battery storage systems for stationary applications. Environ. Sci. Technol. 2015, 49, 4825–4833. [Google Scholar] [CrossRef] [PubMed]
- Longo, S.; Antonucci, V.; Cellura, M.; Ferraro, M. Life cycle assessment of storage systems: The case study of a sodium/nickel chloride battery. J. Clean. Prod. 2014, 85, 337–346. [Google Scholar] [CrossRef]
- IRENA. Renewable Power Generation Costs in 2017; International Renewable Energy Agency: Abudabi, UAE, 2018. [Google Scholar]
- Eurostat. Electricity Prices for Household Consumers (Taxes included), Second Half 2017 (Eur Per kwh). Available online: http://ec.europa.eu/eurostat/statistics-explained/index.php/Electricity_price_statistics (accessed on 26 July 2018).
- BNEF. Lithium-Ion Battery Costs and Market–Squeezed Margins Seek Technology Improvements & New Business Models; Bloomberg New Energy Finance: New York, NY, USA, 2017. [Google Scholar]
- Newbery, D.; Strbac, G. What is needed for battery electric vehicles to become socially cost competitive? Econ. Transp. 2016, 5, 1–11. [Google Scholar] [CrossRef] [Green Version]
- Zafirakis, D.; Chalvatzis, K.J.; Baiocchi, G.; Daskalakis, G. Modeling of financial incentives for investments in energy storage systems that promote the large-scale integration of wind energy. Appl. Energy 2013, 105, 138–154. [Google Scholar] [CrossRef]
- Kintner-Meyer, M.; Balducci, P.; Colella, W.; Elizondo, M.; Jin, C.; Nguyen, T.; Viswannathan, V.; Zhang, Y. National Assessment of Energy Storage for Grid Balancing and Arbitrage: Phase 1 WECC; Pacific Northwest National Laboratory: Oak Ridge, TN, USA, 2012. [Google Scholar]
- Eyer, J.; Corey, G. Energy Storage for the Electricity Grid: Benefits and Market Potential Assessment Guide; Sandia National Laboratories: California, CA, USA, 2010. [Google Scholar]
- Fitzgerald, G.; Mandel, J.; Morris, J.; Touati, H. The Economics of Battery Energy Storage: How Multi-Use, Customer-Sited Batteries Deliver the Most Services and Value to Customers and the Grid; Rocky Mountain Institute: New York, NY, USA, 2015. [Google Scholar]
- Newbery, D. A Simple Introduction to the Economics of Storage: Shifting Demand and Supply over Time and Space; University of Cambridge: Cambridge, UK, 2016. [Google Scholar]
Figure 1.
Discounted payback period based on two scenarios.

Figure 2.
Changes in net present value associated with changes in parameters without externalities.

Figure 3.
Changes in net present value with different capacity costs and discharging prices, other parameters remain constant.
Figure 3.
Changes in net present value with different capacity costs and discharging prices, other parameters remain constant.

Figure 4.
Changes in net present value with different charging and discharging prices, other parameters remain constant.
Figure 4.
Changes in net present value with different charging and discharging prices, other parameters remain constant.

Figure 5.
Changes in net present value with different capacity costs and charging prices, other parameters remain constant.
Figure 5.
Changes in net present value with different capacity costs and charging prices, other parameters remain constant.

Figure 6.
Changes in net present value associated with changes in parameters with externalities.

Figure 7.
Changes in net present value with different carbon prices and emission levels, other parameters remain constant.
Figure 7.
Changes in net present value with different carbon prices and emission levels, other parameters remain constant.


Table 1.
Technical characteristics of the sodium nickel chloride battery.
| Type of Battery | FIAMM SONICK 48TL 200 |
|---|---|
| Nominal Voltage | 48 V |
| Nominal capacity | 200 Ah |
| Nominal Energy | 9600 Wh |
Table 2.
Technical characteristics and associated GHGs emissions from the battery system (Note: The data is for each cell. At Tilos Island, the nominal energy for each unit is 1440 kWh, which is equivalent to 150 cells of the FIAMM SONICK 48TL 200 battery).
Table 2.
Technical characteristics and associated GHGs emissions from the battery system (Note: The data is for each cell. At Tilos Island, the nominal energy for each unit is 1440 kWh, which is equivalent to 150 cells of the FIAMM SONICK 48TL 200 battery).
| Scenario 1 | Scenario 2 | |
|---|---|---|
| Total cycles during lifetime | 3000 | 2500 |
| Useful life | 1500 | 2187 |
| Roundtrip efficiency (%) | 90 | 90 |
| Depth of discharge (%) | 95 | 95 |
| Global Warming Potential (kg CO2-eq) of which: Manufacturing (%) Operation (%) End-of-life (%) | 2000 75.5% (or 1510) 20.4% (or 408) 4.1% (or 82) | 2100 70.4% (or 1478) 25.8% (or 542) 3.8% (or 80) |
Source: [37].
Table 3.
Operation mode and associated greenhouse gas emissions from the battery system.
| Scenario 1 | Scenario 2 | |
|---|---|---|
| Total power output (kWh) 1 | 24,624 | 28,728 |
| Total emissions (kg) | 2000 | 2100 |
| Emissions per kWh (g CO2-e per kWh) of which: Manufacturing Operation End-of-life | 81.2 61.3 16.6 3.3 | 73.1 51.5 18.9 2.8 |
1 Own calculation. Based on nominal capacity, roundtrip efficiency, depth of discharge and life time cycles.
Table 4.
Battery Characteristics.
| Number of units | 2 |
| Energy storage capacity per unit (kWh) | 1440 |
| Maximum charge duration (h) | 3 |
| Maximum discharge duration (h) | 3 |
| Roundtrip efficiency (%) | 85 |
| Depth of discharge (%) | 80 |
| Rate of storage performance declines (%/yr) | 0.5 |
Table 5.
Cost parameters.
| Capacity cost of energy storage (€/kWh) | 700 |
| Insurance rate (%) | 0.25% |
| Maintenance cost (€/yr) | 10,000 |
| Installation cost (€/unit) | 30,000 |
| Labor cost (€/yr) | 10,000 |
| Charging cost (€/kWh) | 0.15 |
| Charging cost escalator (%/yr) | 1% |
| Cost of recycling (unit) | 10,000 |
Table 6.
Financial parameters.
| Own capital ratio (%) | 50% |
| Own capital (€) | 1,008,000 |
| Loan amount (€) | 1,008,000 |
| Loan period (yrs) | 10 |
| Loan interest rate (%) | 6.0% |
| Discount rate (%) | 7% |
| System lifespan (yrs) | 15 |
Table 7.
Benefit parameters.
| Discharge income (€/kWh) | 0.75 |
| Discharge income escalator (%/yr) | 1% |
| Subsidies (€/unit) | 30,000 |
Table 8.
Other benefits.
| Environmental Externalities of Storage System | |
| Emissions from manufacturing (CO2-e ton/unit) | 226.5 |
| Emissions from operation (CO2-e g/kWh) | 16.6 |
| Emissions after lifespan (CO2-e ton/unit) | 12.3 |
| Environmental Externalities of Existing Power System | |
| CO2 emissions (g/kWh) | 1000 |
| Pollution Fee | |
| Unit cost of CO2 emissions (€/ton) | 20 |
| Other benefits 1 | |
| TV (€400/unit) | 8000 |
| Fridge (€300/unit) | 8000 |
| Air conditioner (€500/unit) | 6000 |
1 Based on 20 units per item per year.
Table 9.
A comparison of output indicators.
| Output Indicators | Value without Externalities | Value with Externalities |
|---|---|---|
| Net Present Value | €4533 | €301,014 |
| Benefit-Cost Ratio | 1.00 | 1.08 |
| Internal rate of return | 7.0% | 9.3% |
| Discounted payback period | 9.4 | 8.2 |
© 2018 by the authors. Licensee MDPI, Basel, Switzerland. This article is an open access article distributed under the terms and conditions of the Creative Commons Attribution (CC BY) license (http://creativecommons.org/licenses/by/4.0/).
Share and Cite
MDPI and ACS Style
Li, X.; Chalvatzis, K.J.; Stephanides, P. Innovative Energy Islands: Life-Cycle Cost-Benefit Analysis for Battery Energy Storage. Sustainability 2018, 10, 3371. https://doi.org/10.3390/su10103371
AMA Style
Li X, Chalvatzis KJ, Stephanides P. Innovative Energy Islands: Life-Cycle Cost-Benefit Analysis for Battery Energy Storage. Sustainability. 2018; 10(10):3371. https://doi.org/10.3390/su10103371
Chicago/Turabian StyleLi, Xin, Konstantinos J. Chalvatzis, and Phedeas Stephanides. 2018. "Innovative Energy Islands: Life-Cycle Cost-Benefit Analysis for Battery Energy Storage" Sustainability 10, no. 10: 3371. https://doi.org/10.3390/su10103371
Note that from the first issue of 2016, this journal uses article numbers instead of page numbers. See further details here.